Embed Size (px)
Citation preview

DAFTAR PUSTAKA
ACI 233R-95 (1995) : Ground Granulated Blast Furnace Slag as a Cementitious in Concrete, Michigan, Detrorit.
ACI Committee 211.4R-95 (1995) : Guide for Selecting Proportional for High-Strength Concrete with Portland Cement and Fly Ash (ACI-211), ACI Journal, Detroit, Michigan, 1993.
ACI Committee 211.4R-93 (1996) : Guide for Selecting Proportional for High-Strength Concrete with Portland Cement and Fly Ash, Michigan, Detroit.
ACI Committee 363R (1996) : State-of-the-Art Report on High-Strength Concrete, Michigan, Detroit.
ACI Committee 225R-99 (1999) : Guide to the Selection and Use of Hydraulic Cements, Michigan, Detroit.
ACI Education Bulletin E3-01 (2001) : Cementitous Materials For Concrete, Michigan, Detroit, E3-21 pp.
ACI Education Bulletin E3-01 (2001) : Cementitous Materials For Concrete, Michigan, Detroit, E3-21 pp.
ACI Committee 318-02 (2002) : Building Code Requirements for Structural Concrete and Commentary, American Concrete Institute, Michigan, Detroit.
ACI Committee 233R-03 (2003) : Slag Cement in Concrete and Mortar, Michigan, Detroit.
ASTM, 1993, “Cement; Lime; Gypsum”, Vol. 04.01, Easton, MID, U.S.A.
ASTM, 1993, “Concrete and Aggregates”, Vol. 04.02, Easton, MID, U.S.A.
Ashad, H., (1998) : Kontribusi Nickel Slag-Cement Terhadap Kekuatan dan Durabilitas Beton Kinerja Tinggi, Tesis Magister, Program Pascasarjana, Institut Teknologi Bandung.
Ashad, H., Nasution, A., Imran, I., Soegiri, S., (2006) : Degradasi Kekuatan Beton Akibat Intrusi Mikroorganisme, Jurnal Teknik Sipil, Institut Teknologi Bandung, Volume 13, No. 3, Juli, 151-158.
Belie, N.D., Debruyckere, M., Nieuwenburg, D.V., and Blaere, B.D., (1997) : Concrete Attack by Feed Acid : Accelerated Test to Compare Different Concrete Composition and Technologies, ACI Materials Journal, No. 94-M62, November-December, pp. 546-554.
Besari, M.S., Munaf, D.R., and Hanafiah (1992) : The Effect of Fly Ash and Strength of Coarse Aggregate to the Mechanical Properties of High
274

Strength Concrete, 17th Conference on Our Word in Concrete & Structures, 25-27 August., Singapore, 25-32.
Bhanja, S. (2001) : Influence of Microsilica on the Characteristics of High Strength Concrete at Different Water-Cementitious Material Ratios and on Different Types of Samples, PhD Dissertation, Jadavpur University, Kolkata, India.
Bhanja, S. and Sengupta, B. (2003) : Optimum Silica Fume Content and Its Mode of Action on Concrete, ACI Materials Journal, No. 100-M46, Sept-Oct., pp. 407-412.
Bijen, J. (1996) : Blast Furnace Slag Cement, Cip Royal Library Den Haag, Netherlands.
Bilgrami, K.S. and Verma, R.N. (1994) : Physiology of Fungi, 2nd ed., Vikas Publishing House PVT Ltd., Delhi, pp. 507.
Brandt, A.M. (1995) : Cement-Based Composites : Materials, Mechanical Properties and Performance, E & FN Spon, London.
Buchea, L., Khatri, R.P., and Sirivivatnanon, V. (2004) : Performance Based Specification For Sulphate Resisting Concrete, The First International Conference of Asian Concrete Federation (AFC), 28-29 October, Chiang May, Thailand.
Bye, G.C. (1983) : Portland Cement : Composition, Production and Properties, The Institute of Ceramic, Pergamon Press, New York.
Carlile, M.J. and Watkinson, S.C. (1994) : The Fungi, Academic Press, London, pp. 482.
Cramer, S., and Sippel, C. (2005) : Effects of Ground Granulated Blast Furnace Slag in Portland Cement Concrete, Wisconsin Highway Research Program, Department of Civil and Environmental Engineering, University of Wisconsin-Madison, Final Report, WHRP 05-04, #0092-02-14a..
Desai, C.S., and Siriwardane, H.J. (1984) : Constitutive Laws For Engineering Materials With Emphasis on Geologic Materials, Prentice-Hall, Inc, Englewood Cliffs, New Jersey.
Freeman, R.B., and Carrasquillo, R.L. (1995) : Production of Sulfate Resistant Concrete Containing High Calcium Fly Ash and Sodium Sulfate Admixture, Proc., 5th International Conference on Fly Ash, Silica Fume, Slag and Natural Pozzolans in Concrete, Wisconsin, pp. 154-176.
Gandjar, I., Syamsuridzal, W., dan Oetari, A. (2006) : Mikologi Dasar dan Terapan, Yayasan Obor Indonesia, Jakarta.
275

George, C. M., (1997) : Durability of Calcium Aluminate Cement Concrete : Understanding the Evidence, Mechanism of Chemical Degradation of Cement-Based Systems, edited by Scrivener, K.L and Young, J.F, E & FN Spon, London, pp. 254-263.
Ghosh, S.N., Sarkar, S.L., and Harsh, S. (1993) : Mineral Admixtures in Cement and Concrete, Volume-4, Akademia Books International, New Delhi.
Ginting, P. (2007) : Sistem Pengelolaan Lingkungan dan Limbah Industri, Yrama Widya, Bandung.
Hall, G.R. (1989) : Control of Microbiologically Induced Corrosion of Concrete in Waste-Water Collection and Treatment Systems, Materials Performance, Vol. 28, No. 10, pp. 45-49.
Howsam, P. (1990) : Microbiology in Civil Engineering, E. & F.N. Spon, Melbourne, Australia.
Imran, I., Budiono, B., Munaf, D.R., and Moestopo, M. (1999) : On the Mechanical Behaviour of Concrete Structures and Materials (Experimental and Analytical Studies), Final Report, Urge Project, Chapter 2.
Kearns, J.R., and Little, B.J. (1994) : Microbiologically Influenced Corrosion Testing, ASTM, PCN. 04-012320-27, STP. 1232, Philadelphia, U.S.A.
Khedr, S.A. and Abou-Zeid, M.N. (1994) : Characteristics of Silica-Fume Concrete, Journal of Materials in Civil Engineering, ASCE, V.6, No. 3, pp. 357-375.
Khosama, L. K., (1997) : Penggunaan Terak nikel Sebagai Agregat Pada Beton Mutu Tinggi, ”, Tesis Magister, Program Pascasarjana, Institut Teknologi Bandung.
Khunthongkeaw, J. dan Tangtermsirikul, S. (2004) : Model for Simulating Carbonation of Fly Ash Concrete, The First International Conference of Asian Concrete Federation (AFC), 28-29 October, Chiang May, Thailand.
Kulpa, C. F. and Baker, C. J. (1990) : Involvement of Sulfur-Oxidizing Bacteria in Concrete Deterioration, Proceedings, Paul Klieger, Symposium on Performance of Concrete, ed. D. Whiting, ACI SP-122, pp.313-322.
Lane, D.A., and Ozyildirim, C. (1999), Combination of Pozzolans and Ground Granulated Blast Furnace Slag for Durable Hydraulic Cement Concrete, Final Report, Virginia Transportation Research Council (A Cooperative Organization Sponsored Jointly by the Virginia Department of Transportation and the University of Virginia), VTRC 00-R1.
Louis, (2003) : Penggunaan Terak Nikel Sebagai Agregat Beton Pemberat Pipa Gas Lepas Pantai, Tesis Magister, Program Pascasarjana, Institut Teknologi Bandung.
276
Madigan, M.T., Martinko, J.M., and Parker, J. (2002) : Brock Biology of Microorganisms, 10th ed., Prentice Hall International Inc., Englewood Cliff.
Malhorta, V.M, 1986, “Fly Ash, Silica Fume, Slag, and Natural Pozzolans in Concrete”, Proceedings Second International Conference, Madrid, Spain.
Maso, J.C. (1996) : Interfacial Transition Zone in Concrete, Rilem Report 11, E & FN Spon, London.
Mehta, P.K. (1986) : Concrete Structure, Properties, and Materials, Prentice-Hall, New Jesdey.
Mehta, P.K. (1991) : Concrete in the Marine Environment, Elsevier Science Publisher Ltd, England.
Mehta, P.K. and Monteiro, P.J.M. (2001) : Concrete Microstructure, Properties and Materials. ”, Prentice-Hall, New Jesdey
Meklin, T. (2002) : Microbial Exposure and Health in Schools Effects of Moisture Damage and Renovation, Dissertation, Department of Environmental Sciences, University of Kuopio, Finland. 13-18.
Mindess, S., and Young, J. F. (1981) : Concrete, Prentice-Hall, Inc., Englewood Cliffs, N.J. 07632, New Jersey.
Munaf, D.R. (1992) : Pembuatan dan Penyelidikan Perilaku Beton Mutu Tinggi Serta Bahan Pembentuknya, Laporan Penelitian, Institut Teknologi Bandung.
Nagai, K., K. Suzuki, G. Okada (1998) : Studies on the Distribution of Alkalophilic and Alkali-Tolerant Soil Fungi II : Fungal Flora in Two Limestone Caves in Japan, Mycoscience 39 : 293-298.
Naik, T.R., Ramme, B.W., Kraus, R.N., and Siddique, R. (2003) : Long-Term Performance of High-Volume Fly Ash Concrete Pavements, ACI Materials Journal, Vol.100, No.2, March-April, pp.150-155.
Neville, A.M., 1996, “Properties of Concrete”, John Wiley and Sons Inc., New York.
Oluokun, F.A. (1994) : Fly Ash Concrete Mix Design and the Water-Cement Ratio Law, ACI Materials Journal, V. 91, No. 4, July-Aug., pp. 362-371.
Pedersen, K. (2001) : Microbial Features, Event and Processes in the Swedish Final Repository for Low-and Intermediate-Level Radiactive Waste, SKB Rapport R-01-05, Göteborg University, Sweden.
Rapindrarajah, R.S., Pathmasiri, M., and Khan, A.S. (2004) : Binder Type on High-Strength Concrete Properties, The First International Conference of Asian Concrete Federation (AFC), 28-29 October, Chiang May, Thailand.
277
Robson, T.D., (1992) : High Alumina Cement and Concrete, Contractor’s Record Limited, Wiley, New York, pp. 145-159.
Said, I. (1996) : Mechanical Properties of High Performance Concrete, ACI Materials Journal, Vol. 93, No. 5, pp. 416-425.
Scrivener, K.L., Cabiron, J.L., and Letourneux, R. (1999) : High Performance Concretes from Calcium Aluminat Cement, Cement and Concrete Research, Vol. 29, No. 8, pp. 1215-1223.
Siddique, R. (2000) : Special Structural Concretes, Galgotia Publications Pvt. Ltd., New Delhi.
Soegiri, S., Munaf, D.R., and Khosama, L.L. (1997) : Mechanical Properties of High Performance Nickel Slag Conrete, 22nd Conference on Our Word Concrete and Structures, 25-27 August, Singapore.
Soegiri, S. (2000) : Durability of High Performance Nickel Slag Concrete, Second Asia/Pacific Conference on Durability of Building System, Harmonized Standards and Evaluation, 10-12 July, Bandung, Indonesia.
Suhud, R., Imran, I., Darmawan, S., dan Tanujaya, H. (1999) : Perilaku Mekanik Beton Kinerja Tinggi dengan Gradasi Butiran Bercelah (Gap Grading Concrete), Laporan Penelitian Hibah Bersaing VI Perguruan Tinggi, Depdikbud.
Taylor, H.F.W. (1997) : Cement Chemistry, 2nd Edition, Thomas Telford, London.
Tazawa, E.I., Morinaga, T., and Kawai, K., (1998) : Deterioration of Concrete Derived from Metabolites of Microorganisms, Proceedings, Paul Klieger, Symposium on Performance of Concrete, ed. D. Whiting, ACI SP145-59, pp.1087-1097.
Tikalsky, P.J., and Carrasquillo, R.L. (1993) : Fly Ash Evaluation and Selection for Use in Sulfate Resistant Concrete, ACI Materials Journal, 90(6), pp. 545-551.
Tremper, B., (1989) : The Effect of Acid Waters on Concrete, Journal of American Concrete Institute- Proceedings, pp. 1-32.
Uchikawa, H., and Okamura, T. (1993) : Binary and Ternary Components Blended Cement, Progerss in Cement and Concrete, Vol. 4, pp. 1-83, Akademia Books International, New Delhi, India.
Videla, C., Covarrubias, J.P., and Masana, C. (2004) : Updating Concrete Drying-Shrinkage Prediction Models for Local Materials, ACI Material Materials Journal, No. 101-M21, May-June, pp. 187-198.
Videla, C., and Gaedicke, C. (2004) : Modeling Portland Blast-Furnace Slag Cement High-Performance Concrete, ACI Material Materials Journal, No. 101-M41, Sept.-Oct., pp. 365-375.
278

Voet, D., and Voet, J. (1995) : Biochemistry, 2nd ed., John Wiley & Sons. Inc., New York, pp. 1361.
Waluyo, L. (2005) : Mikrobiologi Umum, UMM Press, Malang, 95-120.
Yogendran, V., Langan, B.W., and Ward, M.A. (1991) : Hydration of Cement and Silica Fume Paste, Cement and Concrete Research, V. 21, No. 5, pp. 691-708.
Pustaka dari situs :
ACPA Update (2003) : Slag Cement and Concrete Pavements, Concrete Pavement Research and Technology, American Concrete Pavement Association, No. 4.03, March, http://www.pavement.com., download pada tanggal 24 Agustus 2006.
Anderson, M. dan Dover, M. D. (2004) : Bonded Fly Ash : A Low-Energy Replacement for Portland Cement Concrete to Improve Resistance to Chem-Bio Intrusion, http://www.natick.army.mil/soldier/ jocotas/ ColPro_ Papers/Anderson.pdf., download pada tanggal 26 Agustus 2006.
Aviam, O., Bar_Nes, G., Zeiri, Y., dan Sivan, A. (2004) : Accelerated Biodegradation of Cement by Sulfur-Oxidizing Bacteria as a Bioassay for Evaluating Immobilization of Low-Level Radiactive Waste, Journal of Applied and Environmental Microbioligy, V.70(10), Oct., 6031-6036, http://www.nrc.gov/reading-rm/doc-collections/nuregs/contract/cr6927/cr-6927.pdf., download pada tanggal 12 September 2006.
Berndt, M.L. (2001) : Protection of Concrete in Cooling Towers From Microbilogically Influenced Corrosion, Geothermal Resources Council Transactions, Vol. 25, 3-7, Sandiego, http://www.gov/est/files/pdf/ micgrc01.pdf., download pada tanggal 07 Juli 2006.
Bertolini, L., Elsener, B., Pedeferri, P., dan Polder, R. P. (2004) : Properties of Cementitious Materials, WILEY VCH Verlag GmbH & Co. KgaA, Weinheim, http://doi.wiley.com/10.1002/3527603379.ch19., download pada tanggal 07 Desember 2006.
Bullard, J.W. (2003) : The Virtual Cementand Concrete Testing Laboratory Consortium, Annual Report 2002, NISTIR 6962, National Institute of Standards and Technology, http://www.fire.rust.gov/bfrlpubs/build03/PDF/ b03004.pfd., download pada tanggal 15 Oktober 2006.
Fontes, C.M.A., Barbosa, M.C., Toledo Filho, R.D., dan Goncalves, J.P (2004) : Potentiality of Seage Sludge Ash as Mineral Additive in Cement Mortar and High Performance Concrete, http://congress.cimne.upc.cs/rilem04/ admin/filePaper/p343.pdf., download pada tanggal 10 September 2006.
279

Hamada, H., Yamaji, T., Mohammed, T.U., dan Torii, K. (2005) : Unexpected Expansion of Concrete Made With Laumontite Containing Aggregates Under Seawater Condition, Asean Journal of Civil Engineering (Building and Housing), Vol. 6, No. 5, pp. 361-372, http://www.icic.gov.ir/ Publication/AJCE/PDF/vol6-No5/Hamada-1.pdf., download pada tanggal 26 Januari 2007.
Hendrik, G. van Oss (2001) : Cement-2000, Cement in the 20th Century, http://mineralsusgs.gov/minerals/pubs/commodity/cement/170400.pdf., download pada tanggal 07 Oktober 2006.
Hernandez, M., Marchand, E.A., Roberts, D., dan Peccia, J. (2002) : In Situ Assessment of Active Thiobacillus Species in Corroding Concrete Sewers Using Fluorescent RNA Probes, International Biodeterioration & Biodegradation, 49, 271-276, http://www.elsevier.com/locate/ibiod., download pada tanggal 10 Juni 2006.
Hooton, R.D., Pun, P., Kujondic, T., dan Fidjestol, P. (2005) : Influence of Silica Fume on Chloride Resistance of Concrete, http://www.silicafume.org/pdf/ reprints-hooton97.pdf., download pada tanggal 23 September 2006.
Jian-xiong, C., Han-bin, C., Pei, X., dan Lan-fang, Z. (2002) : A Study Complex Alkali-Slag Environmental Concrete, Internationl Workshop on Sustainable Development and Concrete Technology, pp. 299-307, http://www. cptechcenter.org/publications/sustainable/chenslag.pdf., download pada tanggal 03 Januari 2007.
Jooss, M. (2001) : Leaching of Concrete Under Thermal Influence, Otto-Graf Journal, Vol. 12, http://www.mpa.uni-stutgart.de/publikationen/otto_graf_ journal/ogj_2001/beitrag_jooss.pdf., download pada tanggal 27 April 2005.
Kim, A.G. (1999) : Environmental Remediation With Products of Fluidized Bed Combustion, Proceedings of the 15thInternational Conference on Fluidized Bed Combustion, Paper No. FBC99-0030, Savannah, Georgia, http://www.mcrcc.osmre.gov/PDF/Forum/CCB2/P2.pdf., download pada tanggal 15 Nopember 2005.
Lange, D.A., Jennis, H.M., dan Shah, S.P. (1994) : Image Analysis Techniques For Characterization of Pore Structure of Cement-Based Materials, Cement and Concrete Research, Vol. 24, No. 5, pp. 841-853, http://cee.uiuc.edu/ research/dlange/Publications/journal.html., download pada tanggal 28 April 2005.
Li, Z., Ding, Z., dan Zang, Y. (2004) : Development of Sustainable Cementitous Materials, International Workshop on Sustainable Development and Concrete Technology, pp. 55-76, http://www.cptechcenter.org/publications/ sustainable/lisustainable.pdf., download pada tanggal 09 Januari 2007.
280

Ling, W., Pei, T., dan Yan, Y. (2004) : Application of Ground Granulated Blast Furnace Slag in High Performance Concrete in China, International Workshop on Sustainable Development and Concrete Technology, pp. 309-317, http://www.ctre.iastate.edu/pubs/sustainable/wangslag.pdf., download pada tanggal 19 Maret 2006.
Livingston, R.A. dan Bumrongjaroen, W. (2005) : Optimization of Silica Fume, Fly Ash and Cement Mixes for High Preformance Concrete, http://www. flyash.info/2005/79liv.pdf., download pada tanggal 13 Pebruari 2007.
Meschke, G. dan Grasberger, S. (2003) : Numerical Modeling of Coupled Hygromechanical Degradation of Cementitious Materials, Journal of Engineering Mechanics, ASCE, Vol. 129, No. 4, April, 1-10, http://link. aip.org/link/?QEM/129/383/Mesche., download pada tanggal 26 Mei 2006.
Mobasher, B., Devaguptapu, R. dan Arino, A.M. (1996) : Effect of Copper Slag on the Hydration of Blended Cementitous Mixtures, Proceedings, ASCE, Materials Engineering Conference, Materials for the New Millenium, ed. K. Chong, pp. 677-1686, http://enpub.fulton.asu.edu/cement/papers/asce6.pdf., download pada tanggal 22 Juni 2005.
Morton, G. (2003) : Things That Go Rot in The Night a Review of Biodeterioration, Microbiology Today, Vol. 30, Aug., pp. 103-106, http:// www.uclan.ac.uk/facs/science/forensic/research/morton.htm. download pada tanggal 04 Juli 2006.
Nemati, K.M. (2005) : Strength of Concrete, CM 425, Concrete Technology, University of Washington, http://www.nemati.com/pub.htm., download pada tanggal 19 April 2006.
Neuwald, A.D. (2004) : Supplementary Cementitious Materials, http://www. Precast.org/publications/mc/2004_sepoct/cementitious_materials.htm., download pada tanggal 25 Maret 2006.
Nixon, R. (2003) : Evaluating Concrete Deterioration, Root Cause, M & M Engineering, Austin, Texas, www.mmengineering.com., download pada tanggal 17 Juli 2006.
Sanchez, N.M., Cutright, T.J., dan Qiao, P. (2003) : Simultaneous Evaluation Composite Biodeterioration and Changes in the Physicochemical and Biological Water Characteristics, International Biodeterioration & Biodegradation, No. 52, pp.187-196, http://www.eng.auburn.edu/users/ mendenc/Paper%201.pdf., download pada tanggal 18 September 2006.
Sand, W. (2004) : Microbial Life in Geothermal Waters, http://mainlymartian. blogs.com/semijournal/2004/03/methane_and_thu.html., download pada tanggal 22 Oktober 2006.
281
Shirakawa, M.A., Tapper, R., Cincotto, M.A., Beech, I. dan Gambale, W. (2004) : Fungal Growth Measurement by ESEM in Four Different Mortars and Proposal of a Biodeterioration Mechanism, http://www.sci.port.ac.uk/ec/ SHIRAKAW.PDF., download pada tanggal 14 Maret 2006.
Slag Cement Associaton (2002) : Reducing Permeability, SCA, No. 16, http://www.slagcement.org., download pada tanggal 16 April 2006.
Slag Cement Associaton (2005) : Effect of Slag Cement on Shrinkage in Concrete, SCA, No. 27, http://www.slagcement.org., download pada tanggal 09 Maret 2006.
Schmidt, R., dan Feldmann, T. (2003) : Accurate Quantitative Phase Analysis of Sulphates and Calcite in Portland cement, Bruker Advanced X-Ray Solutions, Germany, www.bruker.axs.de., download pada tanggal 05 Mei 2006.
Sutter, L.L., dan Dam, T.V. (2003) : Preliminary Investigation of the Role of Bacteria in Concrete Degradation, http://www.tech.mtu.edu/~llsutter/pdf/ BUGSsum.pdf., download pada tanggal 18 Mei 2006.
Thomas, M.D.A., Hopkins, D.S., Girn, R., Munro, R., dan Muhl, E. (2004) : The Use of High Volume Fly Ash in Concrete, http://www.hvfacprojectindia.com/ resources/other-documents/CBRIFINAL.pdf., download pada tanggal 02 Januari 2007.
Wang, G., dan Emery, J. (2004) : Technology of Slag Utilization in Highway Constrcution, John Emery Geotechnical Engineering Limited, Toronto, Ontairo, Canada, http://www.worldbank.org/servlet/WDSContentServer/ WDSP/IB/1999/09/14/000009265_3970716150148., download pada tanggal 10 April 2006.
Zayed, A. (2003) : Cement Composition and Structural Durability in Florida, Final Report, Florida Department of Transportation, State Project Number BC353-29, Department of Civil and Environmental Engineering, University of South Florida, http://www.dot.state.fl.us/research-center/Completed_ Proj/Summary_SMO/FDOT_BC353_29_rpt.pdf., download pada tanggal 16 Juni 2006.
282
LAMPIRAN A
KARAKTERISTIK MATERIAL DAN KOMPOSISI CAMPURAN BETON
283
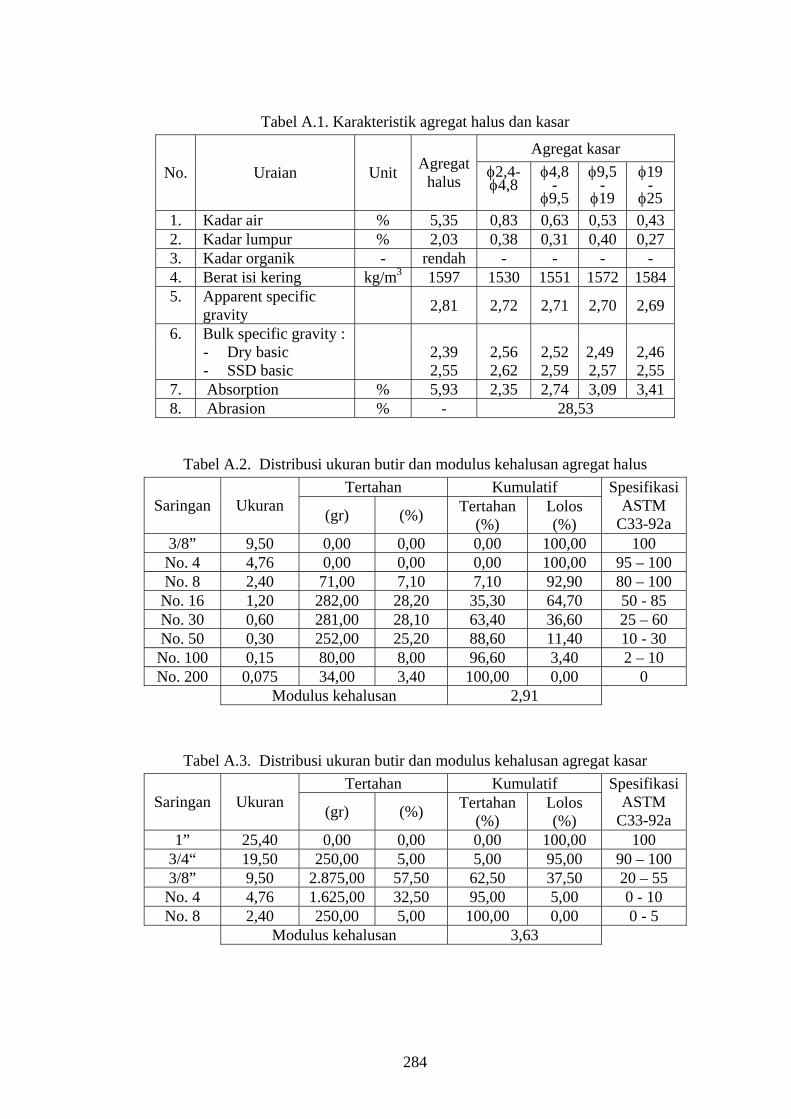
Tabel A.1. Karakteristik agregat halus dan kasar
Agregat kasar No. Uraian Unit Agregat
halus φ2,4- φ4,8
φ4,8 -
φ9,5
φ9,5-
φ19
φ19 -
φ25 1. Kadar air % 5,35 0,83 0,63 0,53 0,43 2. Kadar lumpur % 2,03 0,38 0,31 0,40 0,27 3. Kadar organik - rendah - - - - 4. Berat isi kering kg/m3 1597 1530 1551 1572 15845. Apparent specific
gravity 2,81 2,72 2,71 2,70 2,69
6. Bulk specific gravity : - Dry basic
- SSD basic
2,39 2,55
2,56 2,62
2,52 2,59
2,49 2,57
2,46 2,55
7. Absorption % 5,93 2,35 2,74 3,09 3,41 8. Abrasion % - 28,53
Tabel A.2. Distribusi ukuran butir dan modulus kehalusan agregat halus Tertahan Kumulatif
Saringan Ukuran (gr) (%) Tertahan (%)
Lolos (%)
Spesifikasi ASTM
C33-92a 3/8” 9,50 0,00 0,00 0,00 100,00 100 No. 4 4,76 0,00 0,00 0,00 100,00 95 – 100 No. 8 2,40 71,00 7,10 7,10 92,90 80 – 100 No. 16 1,20 282,00 28,20 35,30 64,70 50 - 85 No. 30 0,60 281,00 28,10 63,40 36,60 25 – 60 No. 50 0,30 252,00 25,20 88,60 11,40 10 - 30 No. 100 0,15 80,00 8,00 96,60 3,40 2 – 10 No. 200 0,075 34,00 3,40 100,00 0,00 0
Modulus kehalusan 2,91
Tabel A.3. Distribusi ukuran butir dan modulus kehalusan agregat kasar Tertahan Kumulatif
Saringan Ukuran (gr) (%) Tertahan (%)
Lolos (%)
Spesifikasi ASTM
C33-92a 1” 25,40 0,00 0,00 0,00 100,00 100
3/4“ 19,50 250,00 5,00 5,00 95,00 90 – 100 3/8” 9,50 2.875,00 57,50 62,50 37,50 20 – 55 No. 4 4,76 1.625,00 32,50 95,00 5,00 0 - 10 No. 8 2,40 250,00 5,00 100,00 0,00 0 - 5
Modulus kehalusan 3,63
284

Tabel A.4. Sifat-sifat fisis dan komposisi kimia semen type I
No. Uraian Unit Nilai
1. Specific gravity - 3,15 2. Berat isi kg/m3 1380 3. Specific surface m2/kg 291 4. Initial setting time menit 138 5. Final setting time menit 279 6. SiO2 % 21,20 7. CaO % 64,90 8. Al2O3 % 6,96 9. Fe2O3 % 3,10 10. MgO % 1,20 11. Na2O % 0,00 12. K2O % 0,00 13. Loss of Ignition (LoI) % 0,90
Tabel A.5. Sifat-sifat fisis dan komposisi kimia bubuk slag nikel
No. Uraian Unit Nilai
1. Specific gravity - 3,36 2. Berat isi kg/m3 1775 3. Specific surface m2/kg 306 4. SiO2 % 42,57 5. CaO % 6,46 6. Al2O3 % 3,67 7. Fe2O3 % 25,71 8. MgO % 16,82 .9. Na2O % 2,29 10. K2O % 0,06 11. NiO % 4,42 12. SO3 % 0,29 13. S % 0,12 14. Loss of Ignition (LoI) % 5,36
285
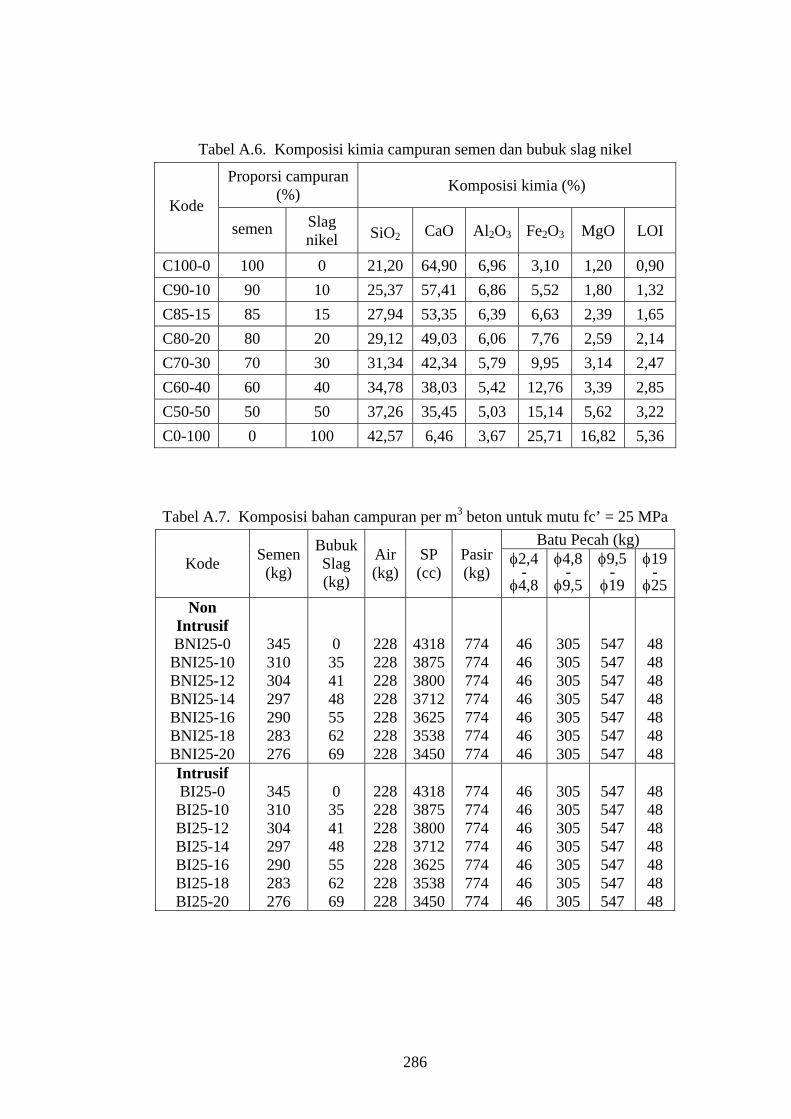
Tabel A.6. Komposisi kimia campuran semen dan bubuk slag nikel
Proporsi campuran (%) Komposisi kimia (%)
Kode semen Slag
nikel SiO2 CaO Al2O3 Fe2O3 MgO LOI
C100-0 100 0 21,20 64,90 6,96 3,10 1,20 0,90 C90-10 90 10 25,37 57,41 6,86 5,52 1,80 1,32 C85-15 85 15 27,94 53,35 6,39 6,63 2,39 1,65 C80-20 80 20 29,12 49,03 6,06 7,76 2,59 2,14 C70-30 70 30 31,34 42,34 5,79 9,95 3,14 2,47 C60-40 60 40 34,78 38,03 5,42 12,76 3,39 2,85 C50-50 50 50 37,26 35,45 5,03 15,14 5,62 3,22 C0-100 0 100 42,57 6,46 3,67 25,71 16,82 5,36
Tabel A.7. Komposisi bahan campuran per m3 beton untuk mutu fc’ = 25 MPa Batu Pecah (kg)
Kode Semen (kg)
Bubuk Slag (kg)
Air (kg)
SP (cc)
Pasir (kg)
φ2,4 -
φ4,8
φ4,8 -
φ9,5
φ9,5 -
φ19
φ19 -
φ25Non
Intrusif BNI25-0 BNI25-10 BNI25-12 BNI25-14 BNI25-16 BNI25-18 BNI25-20
345 310 304 297 290 283 276
0 35 41 48 55 62 69
228 228 228 228 228 228 228
4318387538003712362535383450
774 774 774 774 774 774 774
46 46 46 46 46 46 46
305 305 305 305 305 305 305
547 547 547 547 547 547 547
48 48 48 48 48 48 48
Intrusif BI25-0 BI25-10 BI25-12 BI25-14 BI25-16 BI25-18 BI25-20
345 310 304 297 290 283 276
0 35 41 48 55 62 69
228 228 228 228 228 228 228
4318387538003712362535383450
774 774 774 774 774 774 774
46 46 46 46 46 46 46
305 305 305 305 305 305 305
547 547 547 547 547 547 547
48 48 48 48 48 48 48
286

Tabel A.8. Komposisi bahan campuran per m3 beton untuk mutu fc’ = 40 MPa Batu Pecah (kg)
Kode Semen (kg)
Bubuk Slag (kg)
Air (kg)
SP (cc)
Pasir (kg)
φ2,4 -
φ4,8
φ4,8 -
φ9,5
φ9,5 -
φ19
φ19 -
φ25Non
Intrusif BNI40-0 BNI40-10 BNI40-12 BNI40-14 BNI40-16 BNI40-18 BNI40-20
493 444 434 424 414 404 394
0 49 59 69 79 89 99
226 226 226 226 226 226 226
6167555054255300517550504925
661 661 661 661 661 661 661
46 46 46 46 46 46 46
305 305 305 305 305 305 305
547 547 547 547 547 547 547
48 48 48 48 48 48 48
Intrusif BI40-0 BI40-10 BI40-12 BI40-14 BI40-16 BI40-18 BI40-20
493 444 434 424 414 404 394
0 49 59 69 79 89 99
226 226 226 226 226 226 226
6167555054255300517550504925
661 661 661 661 661 661 661
46 46 46 46 46 46 46
305 305 305 305 305 305 305
547 547 547 547 547 547 547
48 48 48 48 48 48 48
Tabel A.9. Komposisi bahan campuran per m3 beton untuk mutu fc’ = 60 MPa Batu Pecah (kg)
Kode Semen (kg)
Bubuk Slag (kg)
Air (kg)
SP (cc)
Pasir (kg)
φ2,4 -
φ4,8
φ4,8 -
φ9,5
φ9,5 -
φ19
φ19 -
φ25Non
Intrusif BNI60-0 BNI60-10 BNI60-12 BNI60-14 BNI60-16 BNI60-18 BNI60-20
565 508 497 486 474 463 452
0 57 68 79 91 102 113
201 201 201 201 201 201 201
7060635062126075592557875650
426 426 426 426 426 426 426
55 55 55 55 55 55 55
356 356 356 356 356 356 356
630 630 630 630 630 630 630
55 55 55 55 55 55 55
Intrusif BI60-0 BI60-10 BI60-12 BI60-14 BI60-16 BI60-18 BI60-20
565 492 481 470 460 449 438
0 57 68 79 91 102 113
201 201 201 201 201 201 201
7060635062126075592557875650
426 426 426 426 426 426 426
55 55 55 55 55 55 55
356 356 356 356 356 356 356
630 630 630 630 630 630 630
55 55 55 55 55 55 55
287
LAMPIRAN B
DATA SIFAT-SIFAT FISIS DAN MEKANIS BETON NONINTRUSI DAN TERINTRUSI
MIKROORGANISME
288

5
10
15
20
25
0 30 60 90 120 150 180 210 240 270 300 330
Umur (Hari)
Poro
sita
s (%
)
BNI25-0 BNI25-10 BNI25-12BNI25-14 BNI25-16 BNI25-18BNI25-20
(a). Beton dengan w/c = 0,57
5
10
15
20
0 30 60 90 120 150 180 210 240 270 300 330
Umur (Hari)
Poro
sita
s (%
)
BNI40-0 BNI40-10 BNI40-12BNI40-14 BNI40-16 BNI40-18BNI40-20
(b). Beton dengan w/c = 0,40
5
10
15
20
0 30 60 90 120 150 180 210 240 270 300 330
Umur (Hari)
Poro
sita
s (%
)
BNI60-0 BNI60-10 BNI60-12BNI60-14 BNI60-16 BNI60-18BNI60-20
(c). Beton dengan w/c = 0,30
Gambar B.1. Grafik hubungan porositas versus umur beton nonintrusi
mikroorganisme
289
5
10
15
20
25
30
0 30 60 90 120 150 180 210 240 270 300 330
Lama intrusi (Hari)
Poro
sita
s (%
)BI25-0 BI25-10 BI25-12BI25-14 BI25-16 BI25-18BI25-20
(a). Beton dengan w/c = 0,57
5
10
15
20
25
0 30 60 90 120 150 180 210 240 270 300 330
Lama intrusi (Hari)
Poro
sita
s (%
)
BI40-0 BI40-10 BI40-12BI40-14 BI40-16 BI40-18BI40-20
(b). Beton dengan w/c = 0,40
5
10
15
20
0 30 60 90 120 150 180 210 240 270 300 330
Lama intrusi (Hari)
Poro
sita
s (%
)
BI60-0 BI60-10 BI60-12BI60-14 BI60-16 BI60-18BI60-20
(c). Beton dengan w/c = 0,30
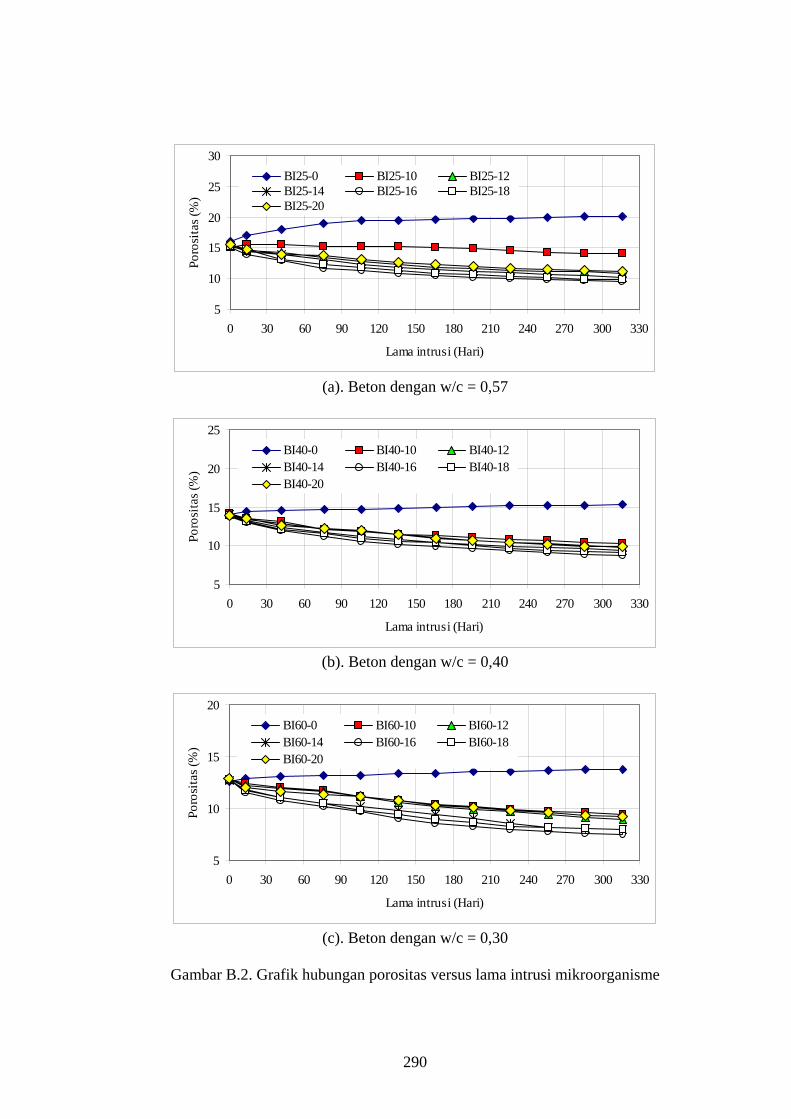
Gambar B.2. Grafik hubungan porositas versus lama intrusi mikroorganisme
290
5
10
15
20
25
0 30 60 90 120 150 180 210 240 270 300 330Umur/Lama intrusi (Hari)
Poro
sita
s (%
)
BNI25-0 BI25-0
0,0683,011 t.e −= e 0,0552,693 t.e e=
(a). Beton dengan w/c = 0,57
5
10
15
20
25
0 30 60 90 120 150 180 210 240 270 300 330Umur/Lama intrusi (Hari)
Poro
sita
s (%
)
BNI40-0 BI40-0
0,0942,925 t.e −= e 0,0202,607 t.e e=
(b). Beton dengan w/c = 0,40
5
10
15
20
0 30 60 90 120 150 180 210 240 270 300 330Umur/Lama intrusi (Hari)
Poro
sita
s (%
)
BNI60-0 BI60-0 0,0812,780 t.e −= e
0,0212,494 t.e e=
(c). Beton dengan w/c = 0,30
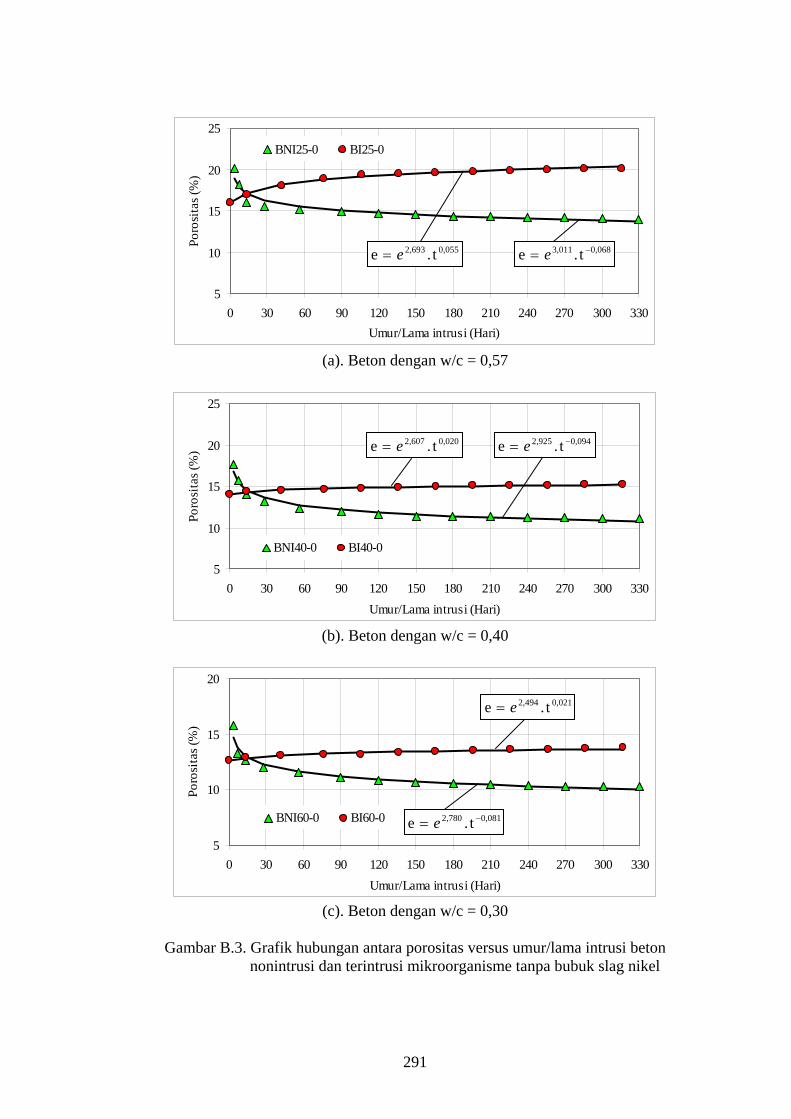
Gambar B.3. Grafik hubungan antara porositas versus umur/lama intrusi beton nonintrusi dan terintrusi mikroorganisme tanpa bubuk slag nikel
291
0
10
20
30
40
0 30 60 90 120 150 180 210 240 270 300 330Umur/Lama intrusi (Hari)
Poro
sita
s (%
)
BNI25-16 BI25-16
0,1993,265 t.e −= e -0,1262,996 t.e e=
(a). Beton dengan w/c = 0,57
5
10
15
20
25
0 30 60 90 120 150 180 210 240 270 300 330Umur/Lama intrusi (Hari)
Poro
sita
s (%
)
BNI40-16 BI40-16
0,1853,126 t.e −= e -0,1312,951 t.e e=
(b). Beton dengan w/c = 0,40
5
10
15
20
0 30 60 90 120 150 180 210 240 270 300 330Umur/Lama intrusi (Hari)
Poro
sita
s (%
)
BNI60-16 BI60-16
0,1903,032 t.e −= e -0,1502,909 t.e e=
(c). Beton dengan w/c = 0,30
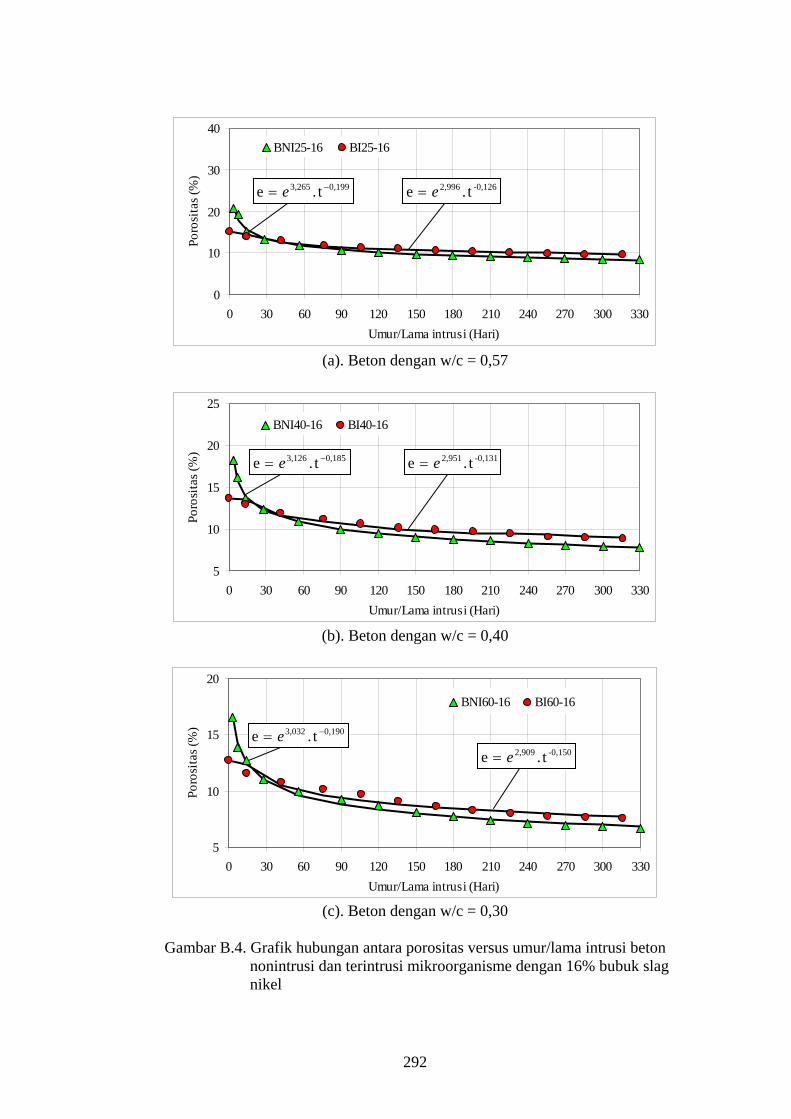
Gambar B.4. Grafik hubungan antara porositas versus umur/lama intrusi beton nonintrusi dan terintrusi mikroorganisme dengan 16% bubuk slag nikel
292

4.0E-11
6.0E-11
8.0E-11
1.0E-10
0 30 60 90 120 150 180 210 240 270 300 330Umur (Hari)
Koe
f. pe
rmea
bilit
as (m
/dtk
) BNI25-0 BNI25-10 BNI25-12BNI25-14 BNI25-16 BNI25-18BNI25-20
(a). Beton dengan w/c = 0,57
1.0E-11
3.0E-11
5.0E-11
7.0E-11
9.0E-11
0 30 60 90 120 150 180 210 240 270 300 330Umur (Hari)
Koe
f. pe
rmea
bilit
as (m
/dtk
) BNI40-0 BNI40-10 BNI40-12BNI40-14 BNI40-16 BNI40-18BNI40-20
(b). Beton dengan w/c = 0,40
6.0E-12
1.6E-11
2.6E-11
3.6E-11
4.6E-11
0 30 60 90 120 150 180 210 240 270 300 330Umur (Hari)
Koe
f. pe
rmea
bilit
as (m
/dtk
) BNI60-0 BNI60-10 BNI60-12BNI60-14 BNI60-16 BNI60-18BNI60-20
(c). Beton dengan w/c = 0,30
Gambar B.5. Grafik hubungan antara koefisien permeabilitas versus umur beton
nonintrusi mikroorganisme
293
4.0E-11
6.0E-11
8.0E-11
1.0E-10
1.2E-10
0 30 60 90 120 150 180 210 240 270 300 330
Lama intrusi (Hari)
Koe
f. pe
rmea
bilit
as (m
/dtk
) BI25-0 BI25-10 BI25-12 BI25-14BI25-16 BI25-18 BI25-20
(a). Beton dengan w/c = 0,57
1.0E-11
3.0E-11
5.0E-11
7.0E-11
9.0E-11
1.1E-10
0 30 60 90 120 150 180 210 240 270 300 330
Lama intrusi (Hari)
Koe
f. pe
rmea
bilit
as (m
/dtk
) BI40-0 BI40-10 BI40-12 BI40-14BI40-16 BI40-18 BI40-20
(b). Beton dengan w/c = 0,40
5.0E-12
1.5E-11
2.5E-11
3.5E-11
4.5E-11
0 30 60 90 120 150 180 210 240 270 300 330
Lama intrusi (Hari)
Koe
f. pe
rmea
bilit
as (m
/dtk
) BI60-0 BI60-10 BI60-12 BI60-14BI60-16 BI60-18 BI60-20
(c). Beton dengan w/c = 0,30
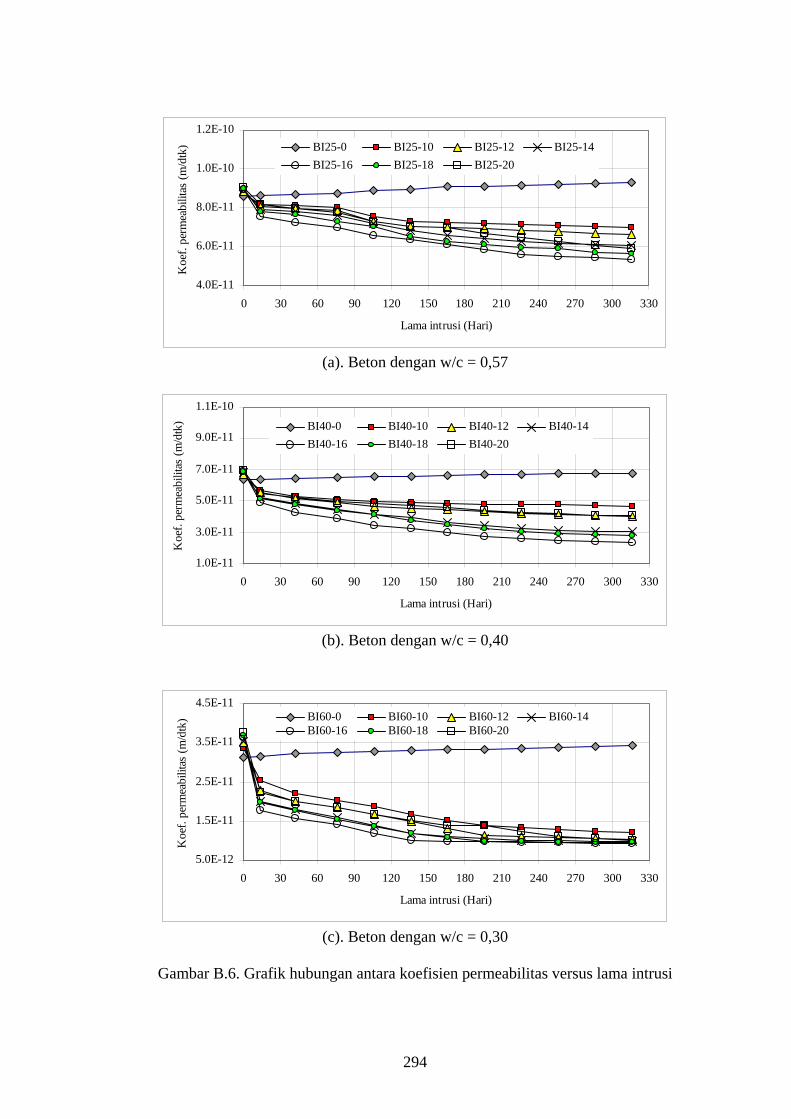
Gambar B.6. Grafik hubungan antara koefisien permeabilitas versus lama intrusi
294
4.0E-11
6.0E-11
8.0E-11
1.0E-10
1.2E-10
0 30 60 90 120 150 180 210 240 270 300 330
Umur/Lama intrusi (Hari)
Koe
f. pe
rmea
bilit
as (m
/dtk
) BNI25-0
BI25-0
0.09222,949 tk −−= e
0.02623,258 tk −= e
(a). Beton dengan w/c = 0,57
1.0E-11
3.0E-11
5.0E-11
7.0E-11
9.0E-11
0 30 60 90 120 150 180 210 240 270 300 330
Umu/Lama intrusir (Hari)
Koe
f. pe
rmea
bilit
as (m
/dtk
)
BNI40-0
BI4-0 0.07623,309 tk −−= e
0.02123,547 tk −= e
(b). Beton dengan w/c = 0,40
6.0E-12
1.6E-11
2.6E-11
3.6E-11
4.6E-11
0 30 60 90 120 150 180 210 240 270 300 330
Umur/Lama intrusi (Hari)
Koe
f. pe
rmea
bilit
as (m
/dtk
)
BNI60-0
BI6-0 0.06524,020 tk −−= e0.02424,248 tk −= e
(c). Beton dengan w/c = 0,30
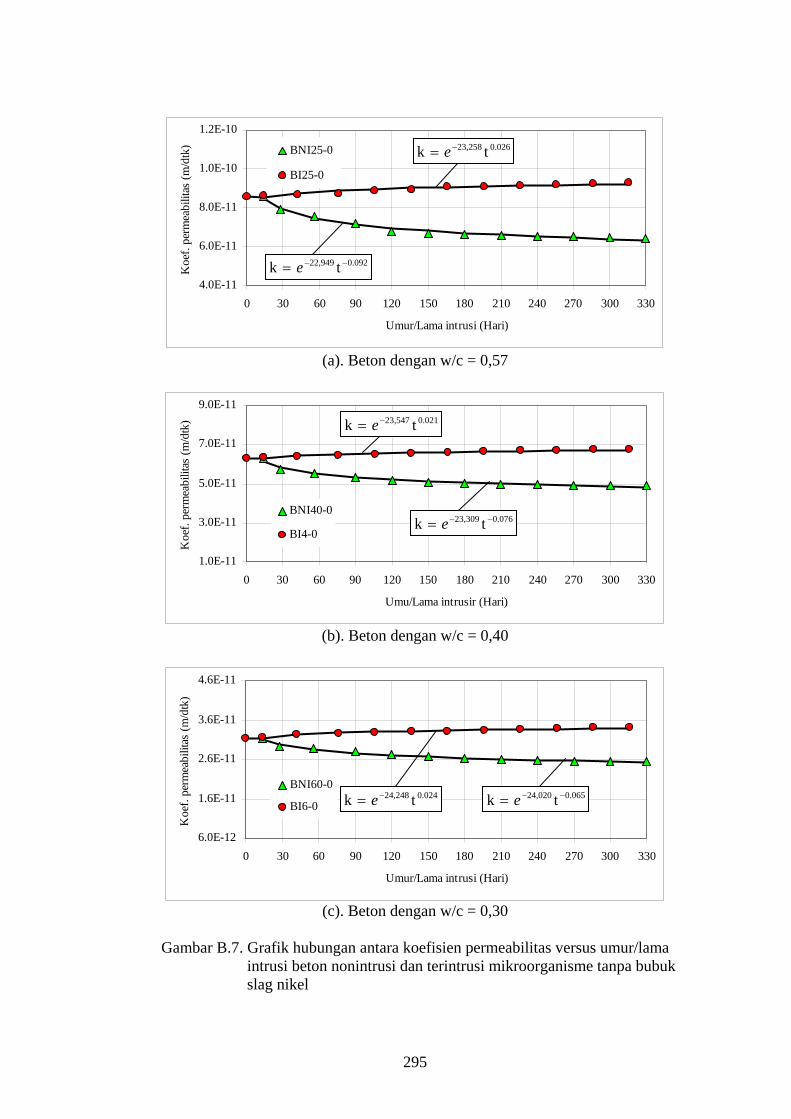
Gambar B.7. Grafik hubungan antara koefisien permeabilitas versus umur/lama intrusi beton nonintrusi dan terintrusi mikroorganisme tanpa bubuk slag nikel
295
4.0E-11
6.0E-11
8.0E-11
1.0E-10
0 30 60 90 120 150 180 210 240 270 300 330
Umur/Lama intrusi (Hari)
Koe
f. pe
rmea
bilit
as (m
/dtk
) BNI25-16
BI25-16
0.19422,656 tk −−= e
0.12222,918 tk −= e
(a). Beton dengan w/c = 0,57
1.0E-11
3.0E-11
5.0E-11
7.0E-11
9.0E-11
0 30 60 90 120 150 180 210 240 270 300 330
Umur/Lama intrusi (Hari)
Koe
f. pe
rmea
bilit
as (m
/dtk
) BNI40-16
BI40-16 0.35422,520 tk −−= e
0.25122,985 tk −= e
(b). Beton dengan w/c = 0,40
6.0E-12
1.6E-11
2.6E-11
3.6E-11
4.6E-11
0 30 60 90 120 150 180 210 240 270 300 330
Umur/Lama intrusi (Hari)
Koe
f. pe
rmea
bilit
as (m
/dtk
)
BNI60-16
BI6-16 0.41823,194 tk −−= e
0.23724,071 tk −= e
(c). Beton dengan w/c = 0,30
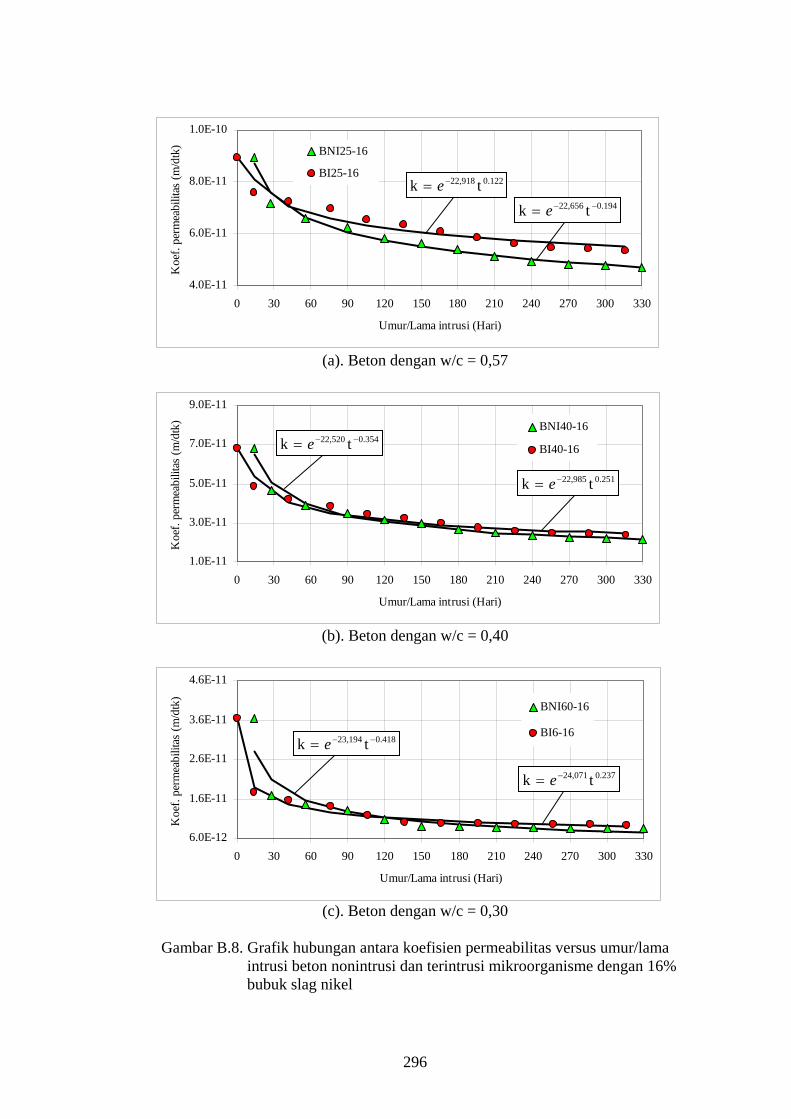
Gambar B.8. Grafik hubungan antara koefisien permeabilitas versus umur/lama intrusi beton nonintrusi dan terintrusi mikroorganisme dengan 16% bubuk slag nikel
296

0
10
20
30
40
0 30 60 90 120 150 180 210 240 270 300 330 360
Umur (Hari)
Kua
t tek
an (M
Pa)
BNI25-0 BNI25-10BNI25-12 BNI25-14BNI25-16 BNI25-18BNI25-20
(a). Beton dengan w/c = 0,57
0
10
20
30
40
50
60
0 30 60 90 120 150 180 210 240 270 300 330 360
Umur (Hari)
Kua
t tek
an (M
Pa)
BNI40-0 BNI40-10BNI40-12 BNI40-14BNI40-16 BNI40-18BNI40-20
(b). Beton dengan w/c = 0,40
01020304050607080
0 30 60 90 120 150 180 210 240 270 300 330 360
Umur (Hari)
Kua
t tek
an (M
Pa)
BNI60-0 BNI60-10BNI60-12 BNI60-14BNI60-16 BNI60-18BNI60-20
(c). Beton dengan w/c = 0,30
Gambar B.9. Grafik hubungan antara kuat tekan dan umur beton nonintrusi
mikroorganisme
297
10
15
20
25
30
0 30 60 90 120 150 180 210 240 270 300 330 360
Lama intrusi (Hari)
Kua
t tek
an (M
Pa)
BI25-0 BI25-10BI25-12 BI25-14BI25-16 BI25-18BI25-20
(a). Beton dengan w/c = 0,57
25
30
35
40
45
0 30 60 90 120 150 180 210 240 270 300 330 360
Lama intrusi (Hari)
Kua
t tek
an (M
Pa)
BI40-0 BI40-10BI40-12 BI40-14BI40-16 BI40-18BI40-20
(b). Beton dengan w/c = 0,40
40
45
50
55
60
65
0 30 60 90 120 150 180 210 240 270 300 330 360
Lama intrusi (Hari)
Kua
t tek
an (M
Pa)
BI60-0 BI60-10BI60-12 BI60-14BI60-16 BI60-18BI60-20
(c). Beton dengan w/c = 0,30
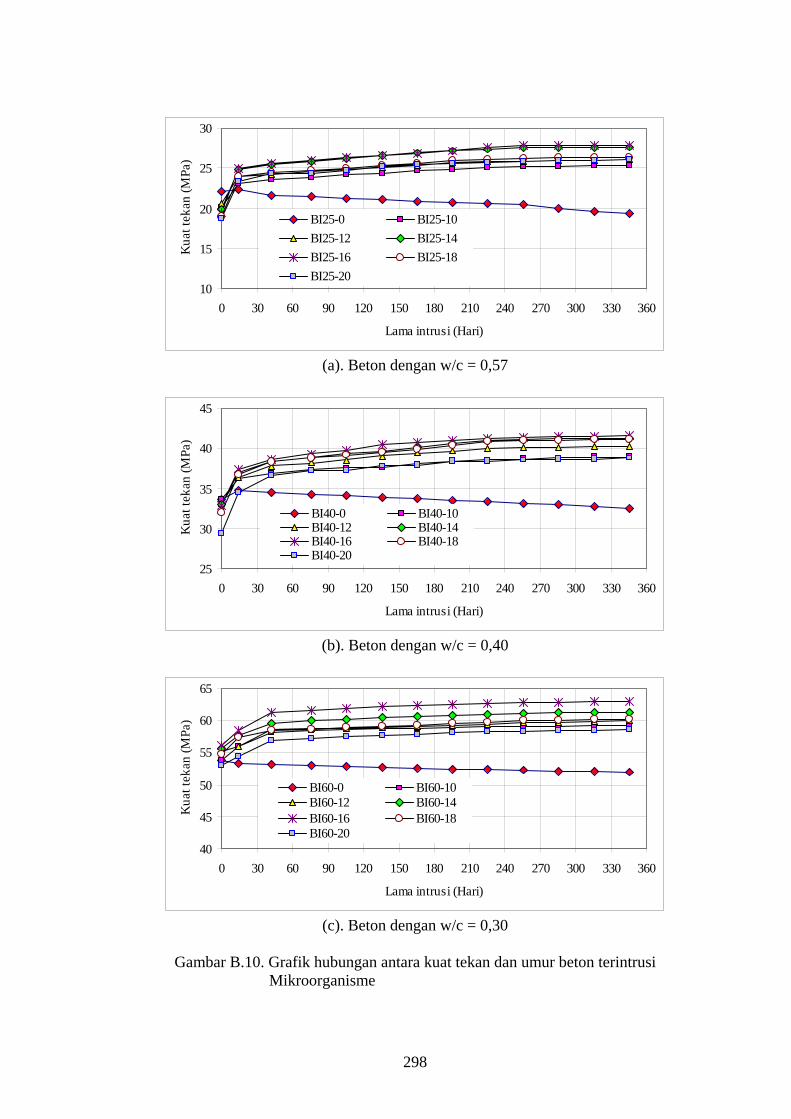
Gambar B.10. Grafik hubungan antara kuat tekan dan umur beton terintrusi
Mikroorganisme
298
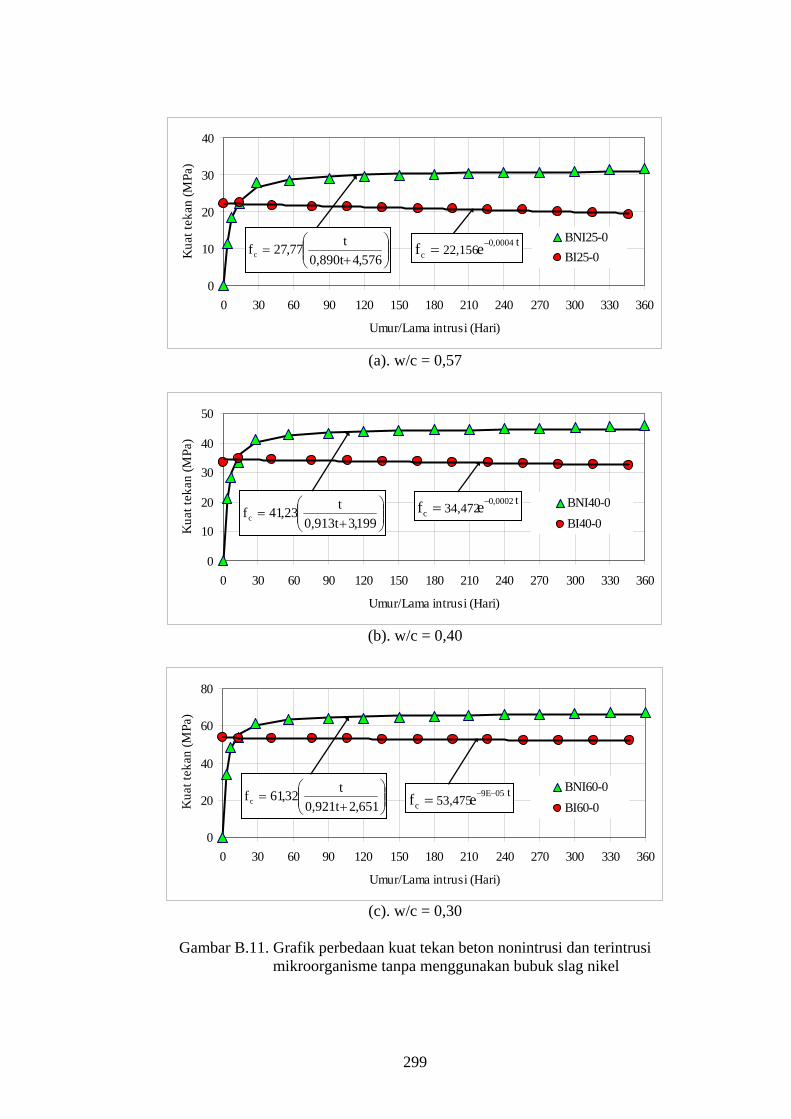
0
10
20
30
40
0 30 60 90 120 150 180 210 240 270 300 330 360
Umur/Lama intrusi (Hari)
Kua
t tek
an (M
Pa)
BNI25-0BI25-0
⎟⎟⎠
⎞⎜⎜⎝
⎛+
=576,40,890t
t77,27fct0004,0
c ef 22,156−=
(a). w/c = 0,57
0
10
20
30
40
50
0 30 60 90 120 150 180 210 240 270 300 330 360
Umur/Lama intrusi (Hari)
Kua
t tek
an (M
Pa)
BNI40-0BI40-0
⎟⎟⎠
⎞⎜⎜⎝
⎛+
=199,30,913t
t23,41fc
t0002,0c e34,472 −=f
(b). w/c = 0,40
0
20
40
60
80
0 30 60 90 120 150 180 210 240 270 300 330 360
Umur/Lama intrusi (Hari)
Kua
t tek
an (M
Pa)
BNI60-0BI60-0
⎟⎟⎠
⎞⎜⎜⎝
⎛+
=651,20,921t
t32,61fct059E
c ef 53,475−−=
(c). w/c = 0,30
Gambar B.11. Grafik perbedaan kuat tekan beton nonintrusi dan terintrusi mikroorganisme tanpa menggunakan bubuk slag nikel
299

05
10152025303540
0 30 60 90 120 150 180 210 240 270 300 330 360
Umur/Lama intrusi (hari)
Kua
t tek
an (M
Pa)
BNI25-10 BI25-10
(a). w/c = 0,57
0
10
20
30
40
50
60
0 30 60 90 120 150 180 210 240 270 300 330 360
Umur/Lama intrusi (hari)
Kua
t tek
an (M
Pa)
BNI40-10 BI40-10
(b). w/c = 0,40
01020304050607080
0 30 60 90 120 150 180 210 240 270 300 330 360
Umur/Lama intrusi (hari)
Kua
t tek
an (M
Pa)
BNI60-10 BI60-10
(c). w/c = 0,30
Gambar B.12. Grafik perbedaan kuat tekan beton nonintrusi dan terintrusi
mikroorganisme untuk 10% bubuk slag nikel
300

05
10152025303540
0 30 60 90 120 150 180 210 240 270 300 330 360
Umur/Lama intrusi (hari)
Kua
t tek
an (M
Pa)
BNI25-12 BI25-12
(a). W/c = 0,57
0
10
20
30
40
50
60
0 30 60 90 120 150 180 210 240 270 300 330 360
Umur/Lama intrusi (hari)
Kua
t tek
an (M
Pa)
BNI40-12 BI40-12
(b). w/c = 0,40
01020304050607080
0 30 60 90 120 150 180 210 240 270 300 330 360
Umur/Lama intrusi (hari)
Kua
t tek
an (M
Pa)
BNI60-12 BI60-12
(c). w/c = 0,30
Gambar B.13. Grafik perbedaan kuat tekan beton nonintrusi dan terintrusi
mikroorganisme untuk 12% bubuk slag nikel
301

05
10152025303540
0 30 60 90 120 150 180 210 240 270 300 330 360
Umur/Lama intrusi (hari)
Kua
t tek
an (M
Pa)
BNI25-14 BI25-14
(a). w/c = 0,57
0
10
20
30
40
50
60
0 30 60 90 120 150 180 210 240 270 300 330 360
Umur/Lama intrusi (hari)
Kua
t tek
an (M
Pa)
BNI40-14 BI40-14
(b). w/c = 0,40
01020304050607080
0 30 60 90 120 150 180 210 240 270 300 330 360
Umur/Lama intrusi (hari)
Kua
t tek
an (M
Pa)
BNI60-14 BI60-14
(c). w/c = 0,30
Gambar B.14. Grafik perbedaan kuat tekan beton nonintrusi dan terintrusi
mikroorganisme untuk 14% bubuk slag nikel
302

0
10
20
30
40
0 30 60 90 120 150 180 210 240 270 300 330 360
Umur/Lama intrusi (Hari)
Kua
t tek
an (M
Pa)
BNI25-16
BI25-16⎟⎟⎠
⎞⎜⎜⎝
⎛+
=527,70,843t
t75,28f c
⎟⎟⎠
⎞⎜⎜⎝
⎛+
=151,10,713t
t49,19fc
(a). w/c = 0,57
0
10
20
30
40
50
60
0 30 60 90 120 150 180 210 240 270 300 330 360
Umur/Lama intrusi (Hari)
Kua
t tek
an (M
Pa)
BNI40-16
BI40-16
⎟⎟⎠
⎞⎜⎜⎝
⎛+
=032,60,848t
t17,42fc
⎟⎟⎠
⎞⎜⎜⎝
⎛+
=298,10,796t
t78,32fc
(b). w/c = 0,40
0
20
40
60
80
0 30 60 90 120 150 180 210 240 270 300 330 360
Umur/Lama intrusi (Hari)
Kua
t tek
an (M
Pa)
BNI60-16
BI60-16
⎟⎟⎠
⎞⎜⎜⎝
⎛+
=999,20,907t
t21,62fc ⎟⎟⎠
⎞⎜⎜⎝
⎛+
=957,00,892t
t09,56fc
(c). w/c = 0,30
Gambar B.15. Grafik perbedaan kuat tekan beton nonintrusi dan terintrusi mikroorganisme untuk 16% bubuk slag nikel
303
0
5
10
1520
25
30
35
0 30 60 90 120 150 180 210 240 270 300 330 360
Umur/Lama intrusi (hari)
Kua
t tek
an (M
Pa)
BNI25-18 BI25-18
(a). w/c = 0,57
0
10
20
30
40
50
60
0 30 60 90 120 150 180 210 240 270 300 330 360
Umur/Lama intrusi (hari)
Kua
t tek
an (M
Pa)
BNI40-18 BI40-18
(b). w/c = 0,40
01020304050607080
0 30 60 90 120 150 180 210 240 270 300 330 360
Umur/Lama intrusi (hari)
Kua
t tek
an (M
Pa)
BNI60-18 BI60-18
(c). w/c = 0,30
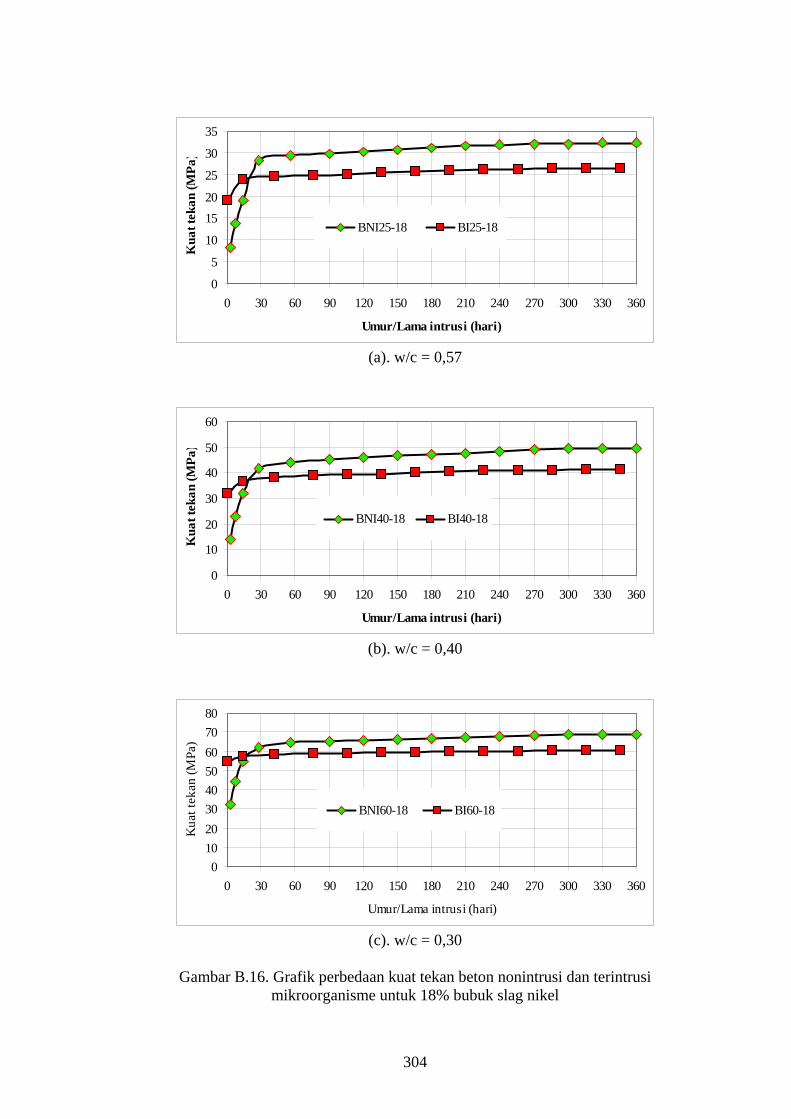
Gambar B.16. Grafik perbedaan kuat tekan beton nonintrusi dan terintrusi
mikroorganisme untuk 18% bubuk slag nikel
304
0
5
10
1520
25
30
35
0 30 60 90 120 150 180 210 240 270 300 330 360
Umur/Lama intrusi (hari)
Kua
t tek
an (M
Pa)
BNI25-20 BI25-20
(a). w/c = 0,57
0
10
20
30
40
50
60
0 30 60 90 120 150 180 210 240 270 300 330 360
Umur/Lama intrusi (hari)
Kua
t tek
an (M
Pa)
BNI40-20 BI40-20
(a). w/c = 0,40
01020304050607080
0 30 60 90 120 150 180 210 240 270 300 330 360
Umur/Lama intrusi (hari)
Kua
t tek
an (M
Pa)
BNI60-20 BI60-20
(c). w/c = 0,30
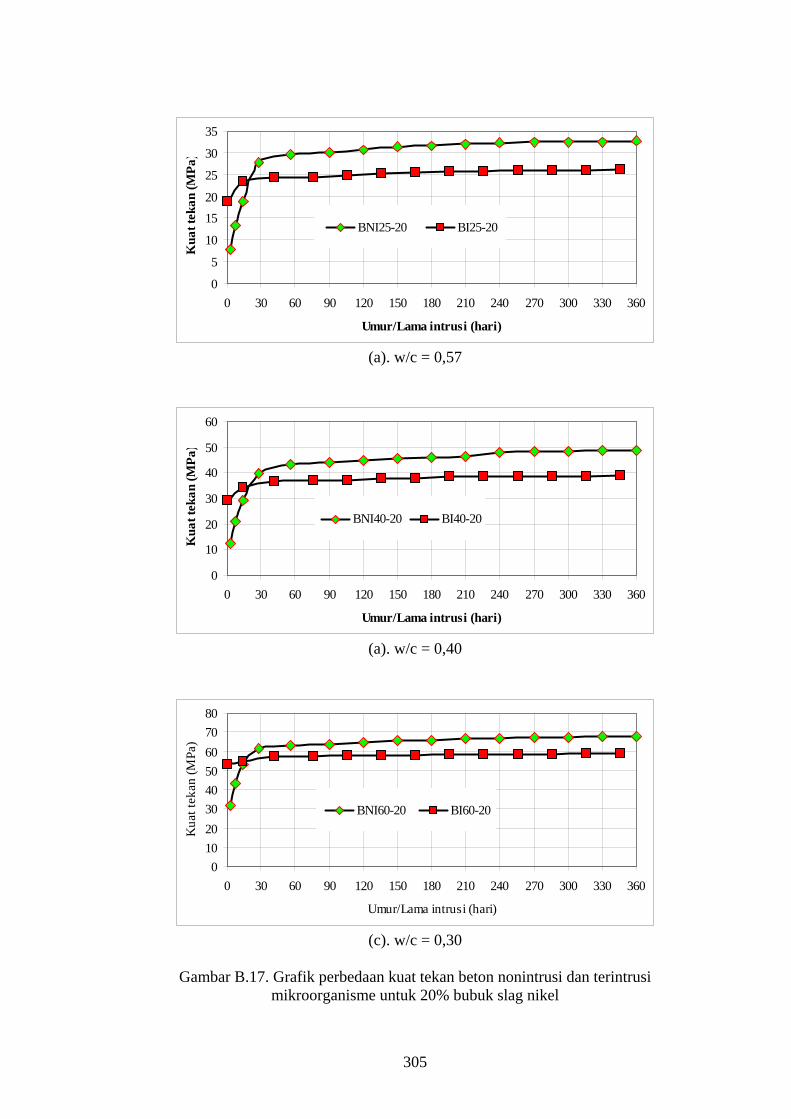
Gambar B.17. Grafik perbedaan kuat tekan beton nonintrusi dan terintrusi
mikroorganisme untuk 20% bubuk slag nikel
305
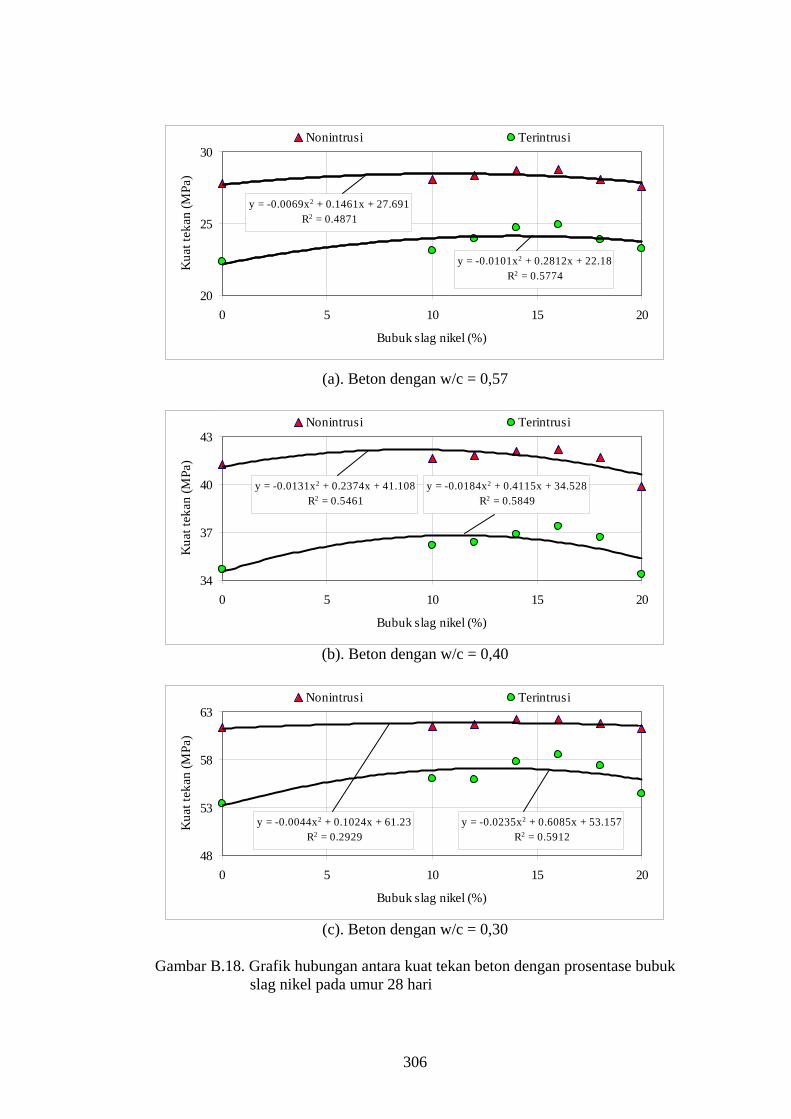
y = -0.0101x2 + 0.2812x + 22.18R2 = 0.5774
y = -0.0069x2 + 0.1461x + 27.691R2 = 0.4871
20
25
30
0 5 10 15 20
Bubuk slag nikel (%)
Kua
t tek
an (M
Pa)
Nonintrusi Terintrusi
(a). Beton dengan w/c = 0,57
y = -0.0131x2 + 0.2374x + 41.108R2 = 0.5461
y = -0.0184x2 + 0.4115x + 34.528R2 = 0.5849
34
37
40
43
0 5 10 15 20
Bubuk slag nikel (%)
Kua
t tek
an (M
Pa)
Nonintrusi Terintrusi
(b). Beton dengan w/c = 0,40
y = -0.0044x2 + 0.1024x + 61.23R2 = 0.2929
y = -0.0235x2 + 0.6085x + 53.157R2 = 0.5912
48
53
58
63
0 5 10 15 20
Bubuk slag nikel (%)
Kua
t tek
an (M
Pa)
Nonintrusi Terintrusi
(c). Beton dengan w/c = 0,30
Gambar B.18. Grafik hubungan antara kuat tekan beton dengan prosentase bubuk slag nikel pada umur 28 hari
306
y = -0.0066x2 + 0.1889x + 28.414R2 = 0.6517
y = -0.0125x2 + 0.4063x + 21.441R2 = 0.8201
20
25
30
35
0 5 10 15 20
Bubuk slag nikel (%)
Kua
t tek
an (M
Pa)
Nonintrusi Terintrusi
(a). Beton dengan w/c = 0,57
y = -0.0059x2 + 0.1511x + 42.911R2 = 0.433
y = -0.0182x2 + 0.5173x + 34.322R2 = 0.8223
32
36
40
44
48
0 5 10 15 20
Bubuk slag nikel (%)
Kua
t tek
an (M
Pa)
Nonintrusi Terintrusi
(b). Beton dengan w/c = 0,40
y = -0.016x2 + 0.3425x + 62.989R2 = 0.7238
y = -0.0356x2 + 0.9522x + 53R2 = 0.8253
52
56
60
64
68
0 5 10 15 20
Bubuk slag nikel (%)
Kua
t tek
an (M
Pa)
Nonintrusi Terintrusi
(c). Beton dengan w/c = 0,30
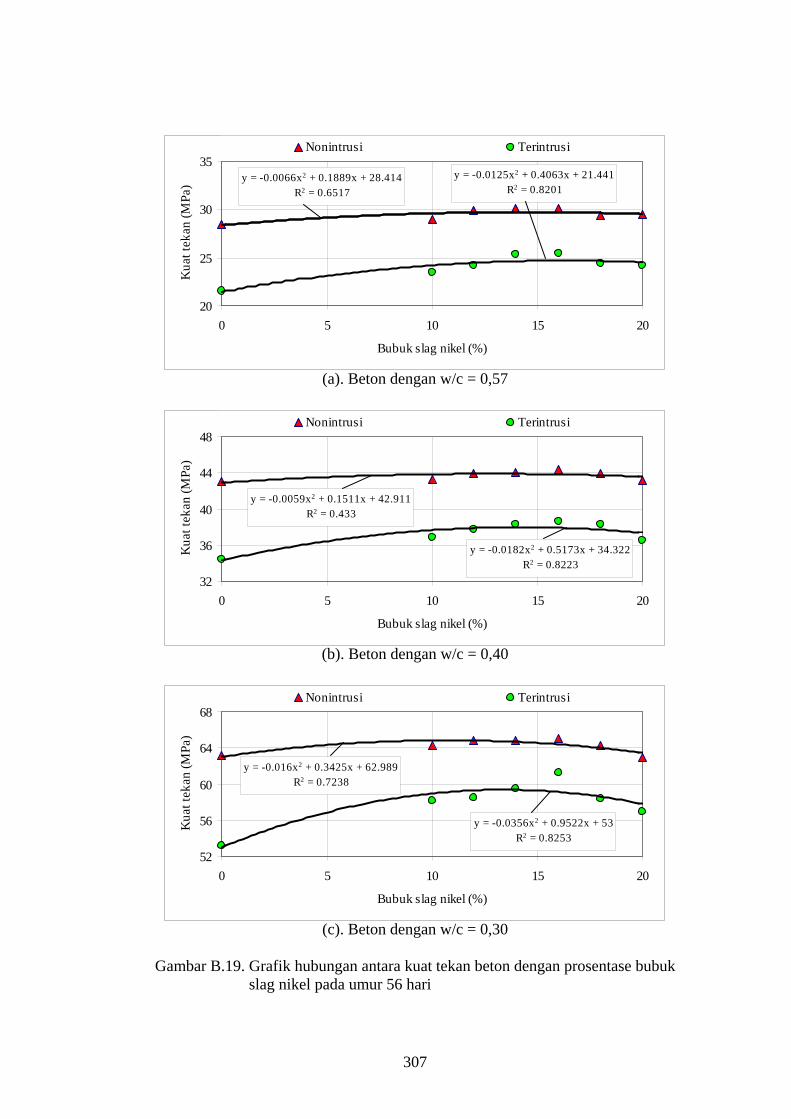
Gambar B.19. Grafik hubungan antara kuat tekan beton dengan prosentase bubuk slag nikel pada umur 56 hari
307

(a). Beton dengan w/c = 0,57
y = -0.0099x2 + 0.259x + 28.772R2 = 0.7735
y = -0.0162x2 + 0.4976x + 21.254R2 = 0.8262
20
25
30
35
0 5 10 15 20
Bubuk slag nikel (%)
Kua
t tek
an (M
Pa)
Nonintrusi Terintrusi
(b). Beton dengan w/c = 0,40
y = -0.0065x2 + 0.2137x + 43.039R2 = 0.694
y = -0.0201x2 + 0.5977x + 34.066R2 = 0.8708
32
36
40
44
48
0 5 10 15 20
Bubuk slag nikel (%)
Kua
t tek
an (M
Pa)
Nonintrusi Terintrusi
(c). Beton dengan w/c = 0,30
y = -0.0138x2 + 0.3038x + 63.559R2 = 0.7369
y = -0.0377x2 + 1.0156x + 52.82R2 = 0.835
52
56
60
64
68
0 5 10 15 20
Bubuk slag nikel (%)
Kua
t tek
an (M
Pa)
Nonintrusi Terintrusi
Gambar B.20. Grafik hubungan antara kuat tekan beton dengan prosentase bubuk
slag nikel pada umur 90 hari
308
(a). Beton dengan w/c = 0,57
y = -0.0093x2 + 0.2505x + 29.283R2 = 0.7336
y = -0.018x2 + 0.5576x + 21.086R2 = 0.8535
20
25
30
35
0 5 10 15 20
Bubuk slag nikel (%)
Kua
t tek
an (M
Pa)
Nonintrusi Terintrusi
(b). Beton dengan w/c = 0,40
y = -0.0036x2 + 0.1603x + 43.786R2 = 0.6197
y = -0.0243x2 + 0.7005x + 33.864R2 = 0.8577
32
36
40
44
48
0 5 10 15 20
Bubuk slag nikel (%)
Kua
t tek
an (M
Pa)
Nonintrusi Terintrusi
(c). Beton dengan w/c = 0,30
y = -0.0112x2 + 0.27x + 64.056R2 = 0.8253
y = -0.0377x2 + 1.0395x + 52.69R2 = 0.8382
52
56
60
64
68
0 5 10 15 20
Bubuk slag nikel (%)
Kua
t tek
an (M
Pa)
Nonintrusi Terintrusi
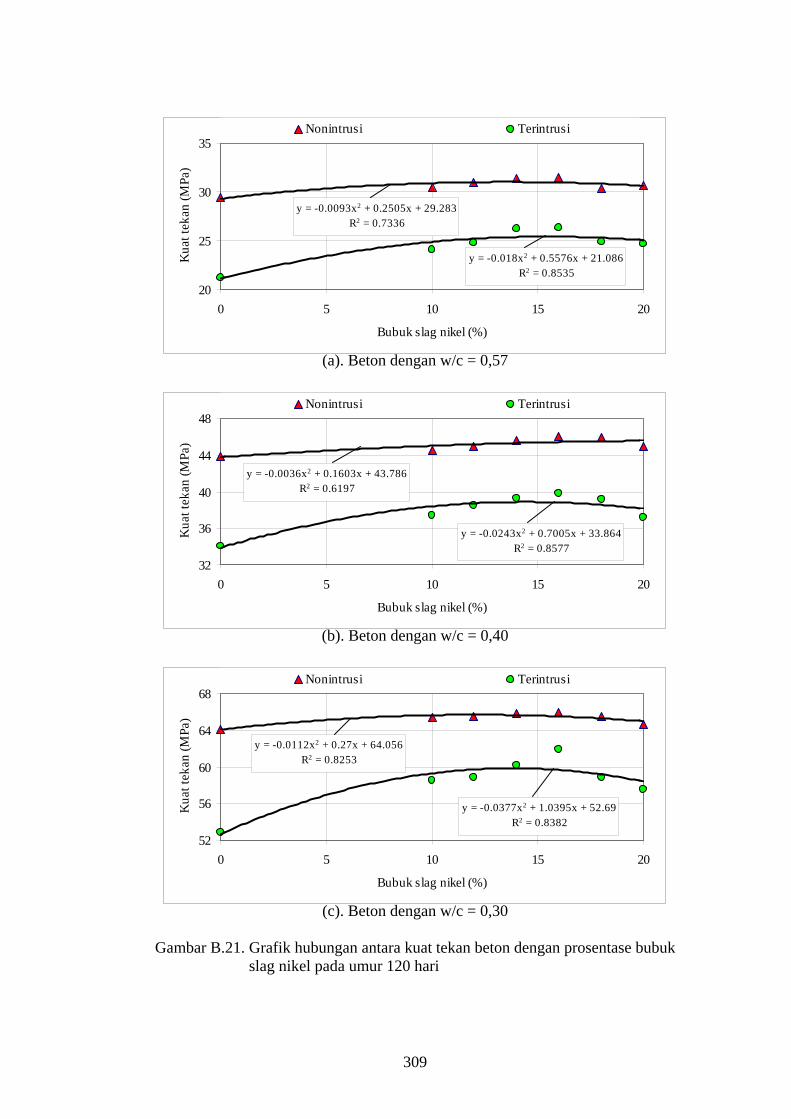
Gambar B.21. Grafik hubungan antara kuat tekan beton dengan prosentase bubuk
slag nikel pada umur 120 hari
309

(a). Beton dengan w/c = 0,57
y = -0.0103x2 + 0.2789x + 29.605R2 = 0.808
y = -0.0186x2 + 0.5961x + 20.964R2 = 0.8852
20
25
30
35
0 5
Nonintrusi Terintrusi
10 15 20
Bubuk slag nikel (%)
Kua
t tek
an (M
Pa)
y = -0.0045x2 + 0.1887x + 44.259R2 = 0.6895
y = -0.0123x2 + 0.5745x + 33.765R2 = 0.9578
32
36
40
44
48
0 5
Nonintrusi Terintrusi
10 15 20
Bubuk slag nikel (%)
Kua
t tek
an (M
Pa)
(b). Beton dengan w/c = 0,40
y = -0.0098x2 + 0.2332x + 64.658R2 = 0.9359
y = -0.039x2 + 1.083x + 52.564R2 = 0.8468
52
56
60
64
68
0 5
Nonintrusi Terintrusi
10 15 20
Bubuk slag nikel (%)
Kua
t tek
an (M
Pa)
(c). Beton dengan w/c = 0,30
Gambar B.22. Grafik hubungan antara kuat tekan beton dengan prosentase bubuk slag nikel pada umur 150 hari
310
y = -0.0113x2 + 0.3x + 29.954R2 = 0.8007
y = -0.0214x2 + 0.6734x + 20.723R2 = 0.9125
20
25
30
35
0 5 10 15 20
Bubuk slag nikel (%)
Kua
t tek
an (M
Pa)
Nonintrusi Terintrusi
(a). Beton dengan w/c = 0,57
y = -0.0073x2 + 0.2606x + 44.44R2 = 0.78
y = -0.0291x2 + 0.856x + 33.469R2 = 0.8944
32
36
40
44
48
0 5 10 15 20
Bubuk slag nikel (%)
Kua
t tek
an (M
Pa)
Nonintrusi Terintrusi
(b). Beton dengan w/c = 0,40
y = -0.0102x2 + 0.2358x + 65.167R2 = 0.7914
y = -0.0394x2 + 1.1095x + 52.392R2 = 0.8574
52
56
60
64
68
0 5 10 15 20
Bubuk slag nikel (%)
Kua
t tek
an (M
Pa)
Nonintrusi Terintrusi Poly. (Nonintrusi) Poly. (Terintrusi)
(c). Beton dengan w/c = 0,30
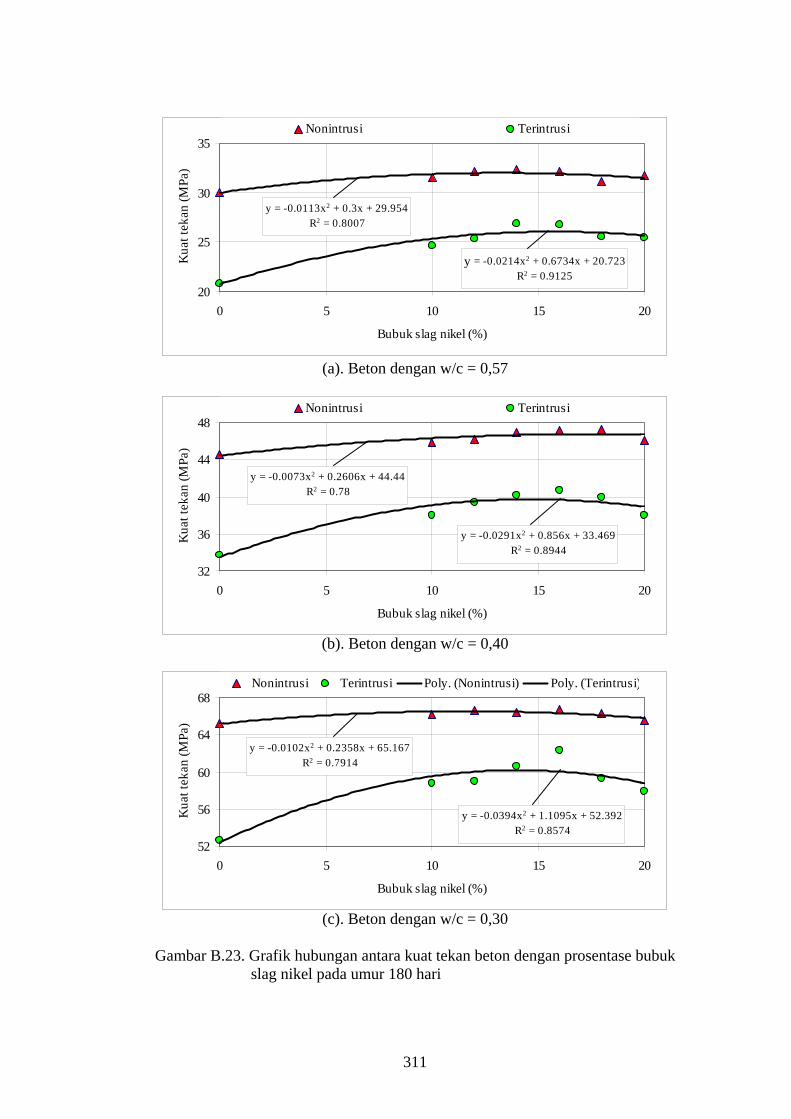
Gambar B.23. Grafik hubungan antara kuat tekan beton dengan prosentase bubuk slag nikel pada umur 180 hari
311
y = -0.0129x2 + 0.3388x + 30.199R2 = 0.833
y = -0.0235x2 + 0.7363x + 20.574R2 = 0.9118
20
25
30
35
0 5 10 15 20
Bubuk slag nikel (%)
Kua
t tek
an (M
Pa)
Nonintrusi Terintrusi
(a). Beton dengan w/c = 0,57
y = -0.0115x2 + 0.3445x + 44.67R2 = 0.8722
y = -0.0308x2 + 0.9168x + 33.308R2 = 0.917
32
36
40
44
48
52
0 5 10 15 20
Bubuk slag nikel (%)
Kua
t tek
an (M
Pa)
Nonintrusi Terintrusi
(a). Beton dengan w/c = 0,40
y = -0.0093x2 + 0.2468x + 65.341R2 = 0.8887
y = -0.0407x2 + 1.1517x + 52.265R2 = 0.8694
52
56
60
64
68
72
0 5 10 15 20
Bubuk slag nikel (%)
Kua
t tek
an (M
Pa)
Nonintrusi Terintrusi
(a). Beton dengan w/c = 0,30
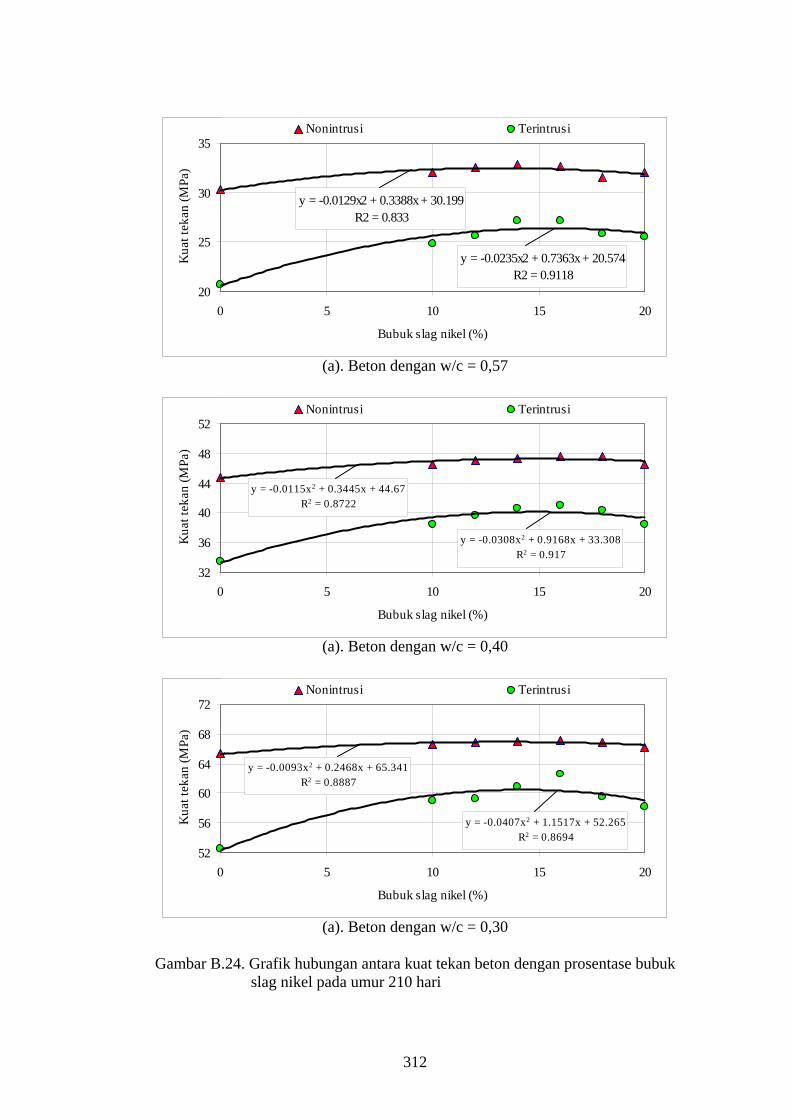
Gambar B.24. Grafik hubungan antara kuat tekan beton dengan prosentase bubuk slag nikel pada umur 210 hari
312
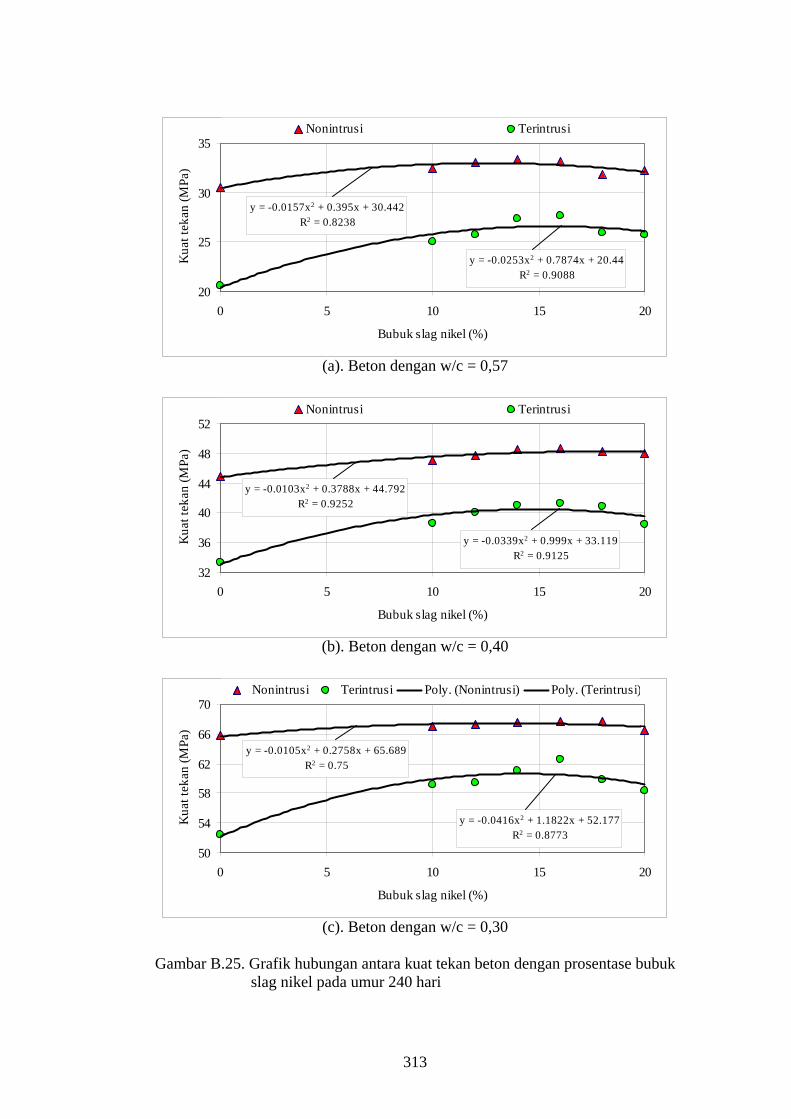
y = -0.0157x2 + 0.395x + 30.442R2 = 0.8238
y = -0.0253x2 + 0.7874x + 20.44R2 = 0.9088
20
25
30
35
0 5 10 15 20
Bubuk slag nikel (%)
Kua
t tek
an (M
Pa)
Nonintrusi Terintrusi
(a). Beton dengan w/c = 0,57 e
y = -0.0103x2 + 0.3788x + 44.792R2 = 0.9252
y = -0.0339x2 + 0.999x + 33.119R2 = 0.9125
32
36
40
44
48
52
0 5 10 15 20
Bubuk slag nikel (%)
Kua
t tek
an (M
Pa)
Nonintrusi Terintrusi
(b). Beton dengan w/c = 0,40
y = -0.0105x2 + 0.2758x + 65.689R2 = 0.75
y = -0.0416x2 + 1.1822x + 52.177R2 = 0.8773
50
54
58
62
66
70
0 5 10 15 20
Bubuk slag nikel (%)
Kua
t tek
an (M
Pa)
Nonintrusi Terintrusi Poly. (Nonintrusi) Poly. (Terintrusi)
(c). Beton dengan w/c = 0,30 Gambar B.25. Grafik hubungan antara kuat tekan beton dengan prosentase bubuk
slag nikel pada umur 240 hari
313

y = -0.0175x2 + 0.429x + 30.611R2 = 0.8336
y = -0.0262x2 + 0.8209x + 20.273R2 = 0.9176
15
20
25
30
35
40
0 5 10 15 20
Bubuk slag nikel (%)
Kua
t tek
an (M
Pa)
Nonintrusi Terintrusi
(a). Beton dengan w/c = 0,57
y = -0.009x2 + 0.3651x + 44.998R2 = 0.9241
y = -0.0355x2 + 1.047x + 32.905R2 = 0.9184
30
34
38
42
46
50
0 5 10 15 20
Bubuk slag nikel (%)
Kua
t tek
an (M
Pa)
Nonintrusi Terintrusi
(b). Beton dengan w/c = 0,40
y = -0.0082x2 + 0.2342x + 66.145R2 = 0.6866
y = -0.0429x2 + 1.2219x + 52.043R2 = 0.8896
50
54
58
62
66
70
0 5 10 15 20
Bubuk slag nikel (%)
Kua
t tek
an (M
Pa)
Nonintrusi Terintrusi
(c). Beton dengan w/c = 0,30 Gambar B.26. Grafik hubungan antara kuat tekan beton dengan prosentase bubuk
slag nikel pada umur 270 hari
314

y = -0.0211x2 + 0.4906x + 30.858R2 = 0.8195
y = -0.0282x2 + 0.8835x + 19.853R2 = 0.932
15
20
25
30
35
40
0 5 10 15 20
Bubuk slag nikel (%)
Kua
t tek
an (M
Pa)
Nonintrusi Terintrusi
(a). Beton dengan w/c = 0,57
y = -0.0107x2 + 0.4015x + 45.183R2 = 0.9373
y = -0.0365x2 + 1.0817x + 32.7R2 = 0.9285
30
34
38
42
46
50
0 5 10 15 20
Bubuk slag nikel (%)
Kua
t tek
an (M
Pa)
Nonintrusi Terintrusi
(b). Beton dengan w/c = 0,40
y = -0.0106x2 + 0.2888x + 66.33R2 = 0.6791
y = -0.0437x2 + 1.2461x + 51.954R2 = 0.8919
50
54
58
62
66
70
0 5 10 15 20
Bubuk slag nikel (%)
Kua
t tek
an (M
Pa)
Nonintrusi Terintrusi
(c). Beton dengan w/c = 0,30
Gambar B.27. Grafik hubungan antara kuat tekan beton dengan prosentase bubuk slag nikel pada umur 300 hari
315
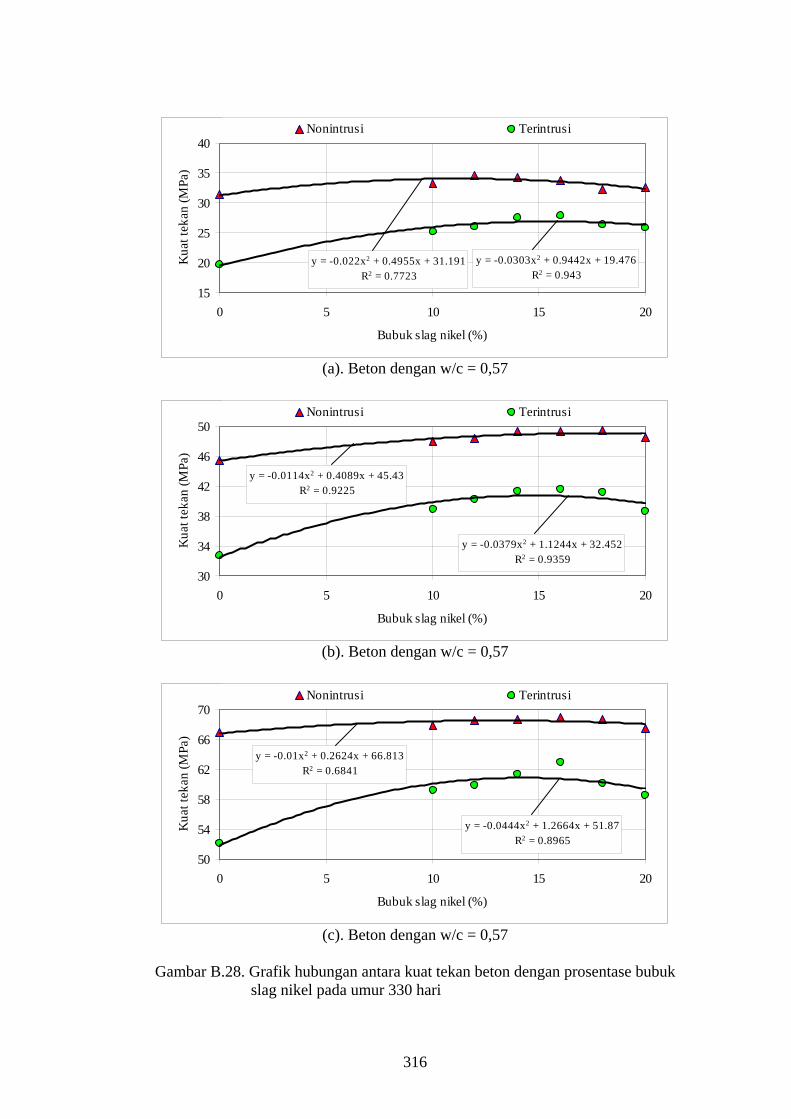
y = -0.022x2 + 0.4955x + 31.191R2 = 0.7723
y = -0.0303x2 + 0.9442x + 19.476R2 = 0.943
15
20
25
30
35
40
0 5 10 15 20
Bubuk slag nikel (%)
Kua
t tek
an (M
Pa)
Nonintrusi Terintrusi
(a). Beton dengan w/c = 0,57
y = -0.0114x2 + 0.4089x + 45.43R2 = 0.9225
y = -0.0379x2 + 1.1244x + 32.452R2 = 0.9359
30
34
38
42
46
50
0 5 10 15 20
Bubuk slag nikel (%)
Kua
t tek
an (M
Pa)
Nonintrusi Terintrusi
(b). Beton dengan w/c = 0,57
y = -0.01x2 + 0.2624x + 66.813R2 = 0.6841
y = -0.0444x2 + 1.2664x + 51.87R2 = 0.8965
50
54
58
62
66
70
0 5 10 15 20
Bubuk slag nikel (%)
Kua
t tek
an (M
Pa)
Nonintrusi Terintrusi
(c). Beton dengan w/c = 0,57
Gambar B.28. Grafik hubungan antara kuat tekan beton dengan prosentase bubuk slag nikel pada umur 330 hari
316

y = -0.0221x2 + 0.4872x + 31.485R2 = 0.7517
y = -0.0315x2 + 0.9871x + 19.185R2 = 0.9502
15
20
25
30
35
40
0 5 10 15 20
Bubuk slag nikel (%)
Kua
t tek
an (M
Pa)
Nonintrusi Terintrusi
(a). Beton dengan w/c = 0,57
y = -0.0129x2 + 0.4264x + 45.752R2 = 0.9494
y = -0.0389x2 + 1.1532x + 32.284R2 = 0.9403
30
34
38
42
46
50
54
0 5 10 15 20
Bubuk slag nikel (%)
Kua
t tek
an (M
Pa)
Nonintrusi Terintrusi
(b). Beton dengan w/c = 0,40
y = -0.0107x2 + 0.2757x + 66.915R2 = 0.7632
y = -0.0453x2 + 1.2951x + 51.705R2 = 0.9041
50
54
58
62
66
70
0 5 10 15 20
Bubuk slag nikel (%)
Kua
t tek
an (M
Pa)
Nonintrusi Terintrusi
(c). Beton dengan w/c = 0,30 Gambar B.29. Grafik hubungan antara kuat tekan beton dengan prosentase bubuk
slag nikel pada umur 360 hari
317
1.E+00
1.E+02
1.E+04
1.E+06
14 42 70 98 126 154 182 210 238 266 294 322 350Lama intrusi (hari)
C/b
inde
r (cf
u/gr
)
D = 0 - 25 mm D = 25 - 50 mm D = 50 - 75 mm
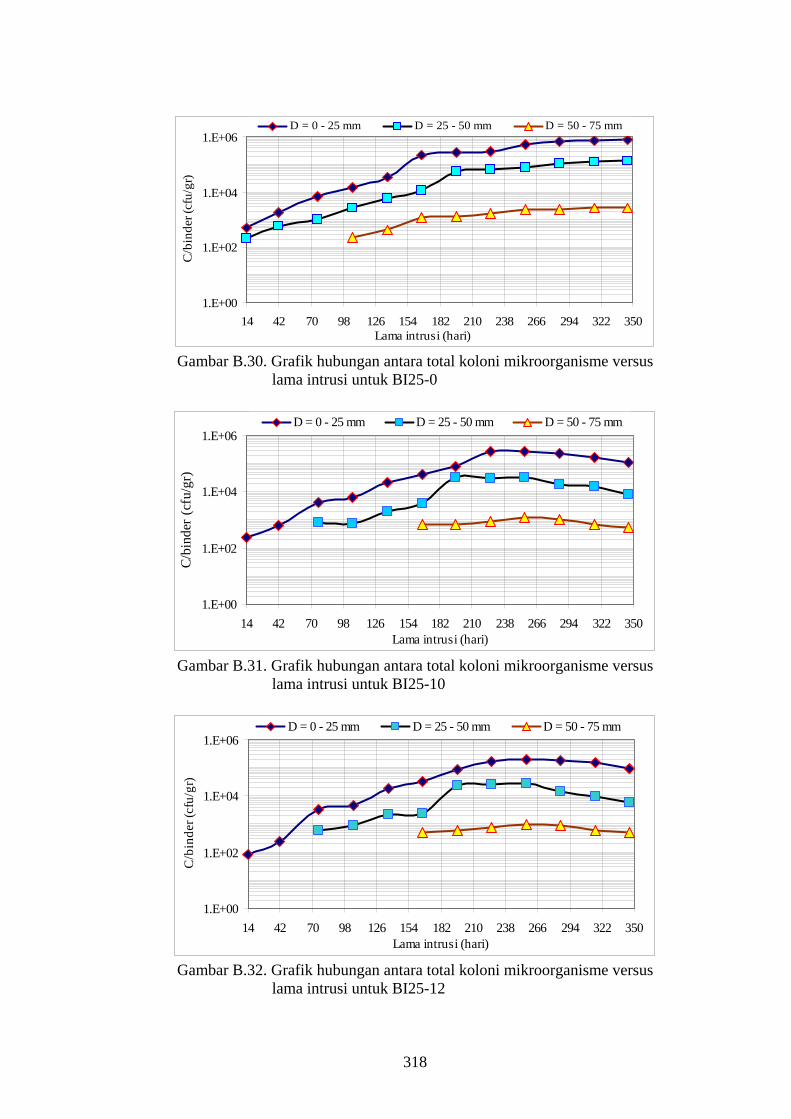
Gambar B.30. Grafik hubungan antara total koloni mikroorganisme versus
lama intrusi untuk BI25-0
1.E+00
1.E+02
1.E+04
1.E+06
14 42 70 98 126 154 182 210 238 266 294 322 350Lama intrusi (hari)
C/bi
nder
(cfu
/gr)
D = 0 - 25 mm D = 25 - 50 mm D = 50 - 75 mm
Gambar B.31. Grafik hubungan antara total koloni mikroorganisme versus
lama intrusi untuk BI25-10
1.E+00
1.E+02
1.E+04
1.E+06
14 42 70 98 126 154 182 210 238 266 294 322 350Lama intrusi (hari)
C/b
inde
r (cf
u/gr
)
D = 0 - 25 mm D = 25 - 50 mm D = 50 - 75 mm
Gambar B.32. Grafik hubungan antara total koloni mikroorganisme versus
lama intrusi untuk BI25-12
318

1.E+00
1.E+02
1.E+04
1.E+06
14 42 70 98 126 154 182 210 238 266 294 322 350Lama intrusi (hari)
C/b
inde
r (cf
u/gr
)
D = 0 - 25 mm D = 25 - 50 mm D = 50 - 75 mm
Gambar B.33. Grafik hubungan antara total koloni mikroorganisme versus
lama intrusi untuk BI25-14
1.E+00
1.E+02
1.E+04
1.E+06
14 42 70 98 126 154 182 210 238 266 294 322 350Lama intrusi (hari)
C/b
inde
r (cf
u/gr
)
D = 0 - 25 mm D = 25 - 50 mm D = 50 - 75 mm
Gambar B.34. Grafik hubungan antara total koloni mikroorganisme versus
lama intrusi untuk BI25-16
1.E+00
1.E+02
1.E+04
1.E+06
14 42 70 98 126 154 182 210 238 266 294 322 350Lama intrusi (hari)
C/b
inde
r (cf
u/gr
)
D = 0 - 25 mm D = 25 - 50 mm D = 50 - 75 mm
Gambar B.35. Grafik hubungan antara total koloni mikroorganisme versus
lama intrusi untuk BI25-18
319

1.E+00
1.E+02
1.E+04
1.E+06
14 42 70 98 126 154 182 210 238 266 294 322 350Lama intrusi (hari)
C/b
inde
r (cf
u/gr
)
D = 0 - 25 mm D = 25 - 50 mm D = 50 - 75 mm
Gambar B.36. Grafik hubungan antara total koloni mikroorganisme versus
lama intrusi untuk BI25-20
1.E+00
1.E+02
1.E+04
1.E+06
14 42 70 98 126 154 182 210 238 266 294 322 350Lama intrusi (hari)
C/b
inde
r (cf
u/gr
)
D = 0 - 25 mm D = 25 - 50 mm D = 50 - 75 mm
Gambar B.37. Grafik hubungan antara total koloni mikroorganisme versus
lama intrusi untuk BI40-0
1.E+00
1.E+02
1.E+04
1.E+06
14 42 70 98 126 154 182 210 238 266 294 322 350Lama intrusi (hari)
C/b
inde
r (cf
u/gr
)
D = 0 - 25 mm D = 25 - 50 mm D = 50 - 75 mm
Gambar B.38. Grafik hubungan antara total koloni mikroorganisme versus
lama intrusi untuk BI40-10
320
1.0E+00
1.0E+02
1.0E+04
1.0E+06
14 42 70 98 126 154 182 210 238 266 294 322 350Lama intrusi (hari)
C/b
inde
r (cf
u/gr
)
D = 0 - 25 mm D = 25 - 50 mm D = 50 - 75 mm
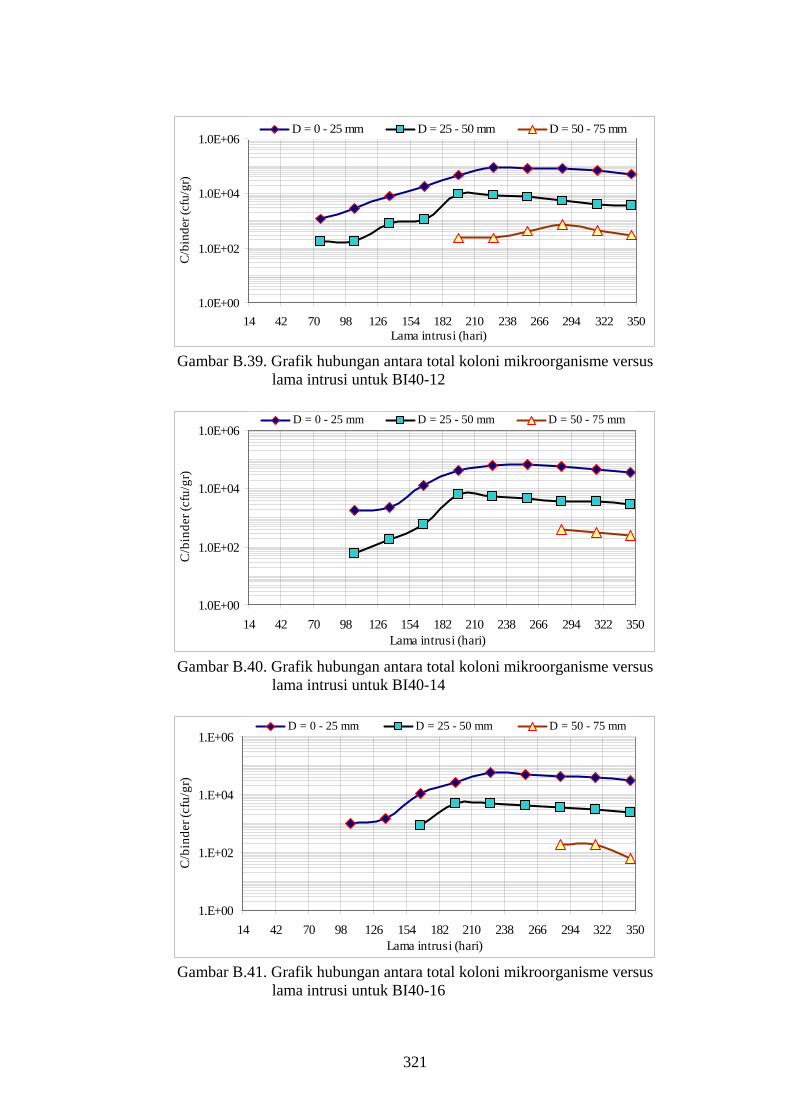
Gambar B.39. Grafik hubungan antara total koloni mikroorganisme versus
lama intrusi untuk BI40-12
1.0E+00
1.0E+02
1.0E+04
1.0E+06
14 42 70 98 126 154 182 210 238 266 294 322 350Lama intrusi (hari)
C/b
inde
r (cf
u/gr
)
D = 0 - 25 mm D = 25 - 50 mm D = 50 - 75 mm
Gambar B.40. Grafik hubungan antara total koloni mikroorganisme versus
lama intrusi untuk BI40-14
1.E+00
1.E+02
1.E+04
1.E+06
14 42 70 98 126 154 182 210 238 266 294 322 350Lama intrusi (hari)
C/b
inde
r (cf
u/gr
)
D = 0 - 25 mm D = 25 - 50 mm D = 50 - 75 mm
Gambar B.41. Grafik hubungan antara total koloni mikroorganisme versus
lama intrusi untuk BI40-16
321
1.E+00
1.E+02
1.E+04
1.E+06
14 42 70 98 126 154 182 210 238 266 294 322 350Lama intrusi (hari)
C/b
inde
r (cf
u/gr
)
D = 0 - 25 mm D = 25 - 50 mm D = 50 - 75 mm
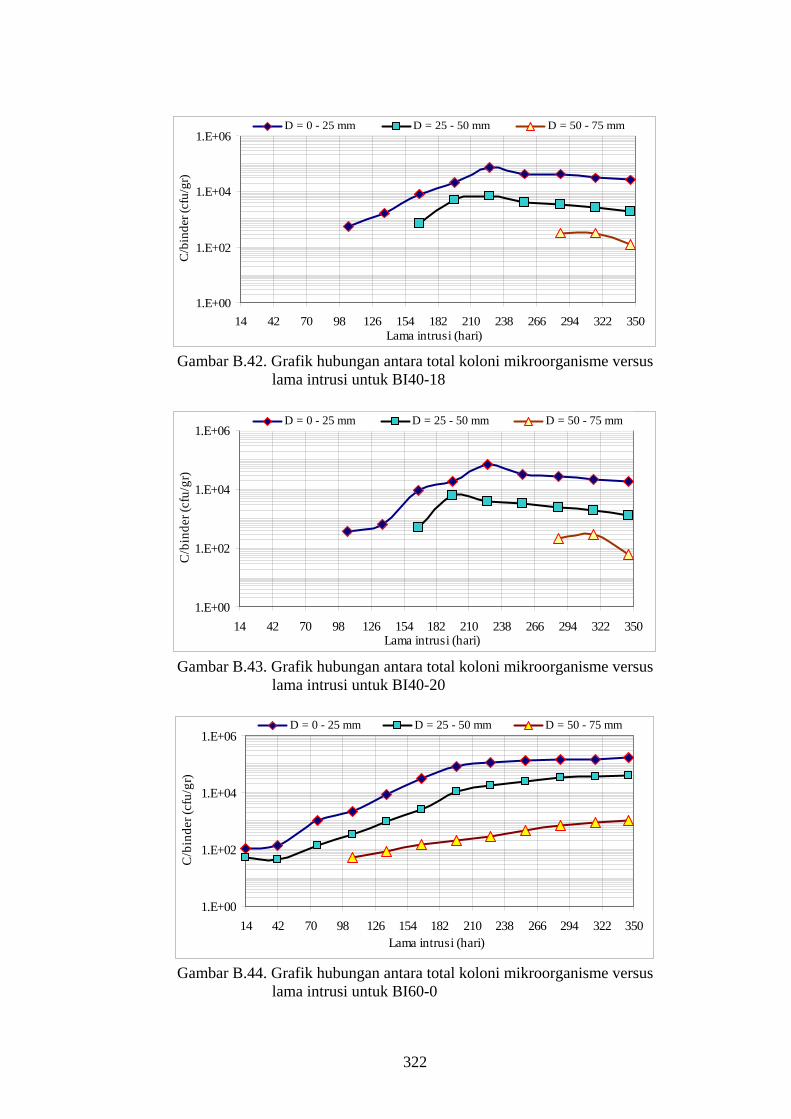
Gambar B.42. Grafik hubungan antara total koloni mikroorganisme versus
lama intrusi untuk BI40-18
1.E+00
1.E+02
1.E+04
1.E+06
14 42 70 98 126 154 182 210 238 266 294 322 350Lama intrusi (hari)
C/b
inde
r (cf
u/gr
)
D = 0 - 25 mm D = 25 - 50 mm D = 50 - 75 mm
Gambar B.43. Grafik hubungan antara total koloni mikroorganisme versus
lama intrusi untuk BI40-20
1.E+00
1.E+02
1.E+04
1.E+06
14 42 70 98 126 154 182 210 238 266 294 322 350Lama intrusi (hari)
C/b
inde
r (cf
u/gr
)
D = 0 - 25 mm D = 25 - 50 mm D = 50 - 75 mm
Gambar B.44. Grafik hubungan antara total koloni mikroorganisme versus
lama intrusi untuk BI60-0
322
1.E+00
1.E+02
1.E+04
1.E+06
14 42 70 98 126 154 182 210 238 266 294 322 350Lama intrusi (hari)
C/b
inde
r (cf
u/gr
)
D = 0 - 25 mm D = 25 - 50 mm D = 50 - 75 mm
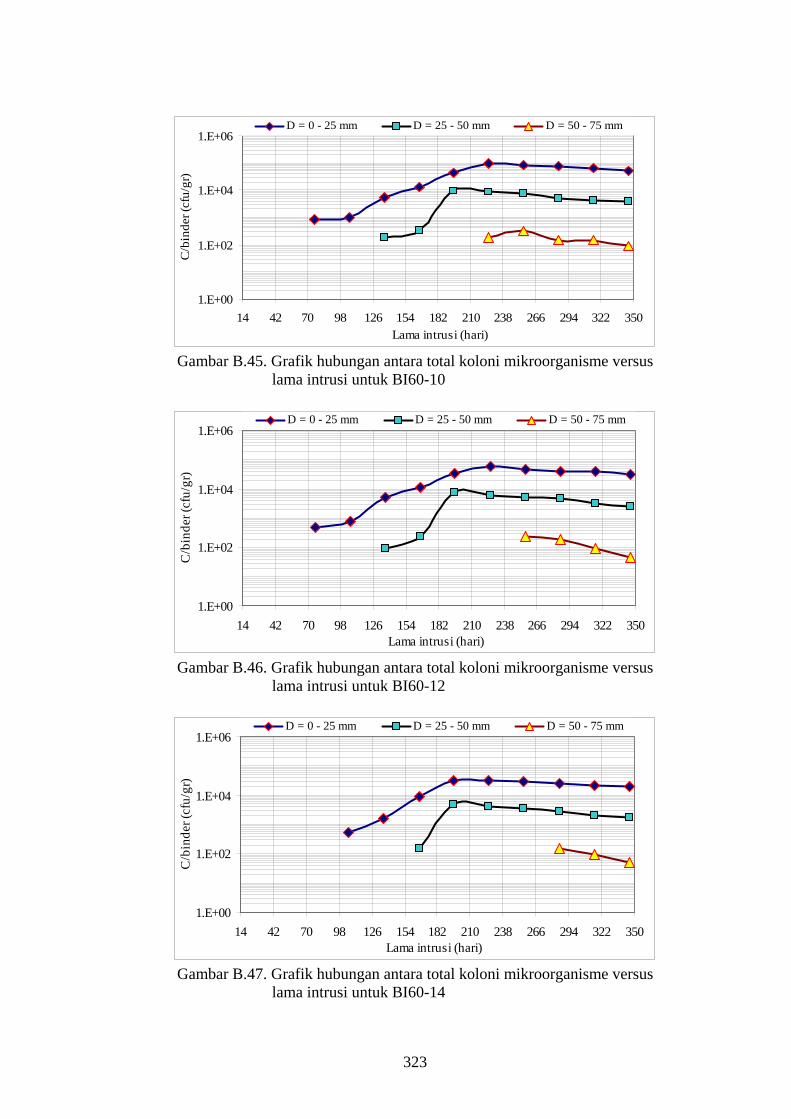
Gambar B.45. Grafik hubungan antara total koloni mikroorganisme versus
lama intrusi untuk BI60-10
1.E+00
1.E+02
1.E+04
1.E+06
14 42 70 98 126 154 182 210 238 266 294 322 350Lama intrusi (hari)
C/b
inde
r (cf
u/gr
)
D = 0 - 25 mm D = 25 - 50 mm D = 50 - 75 mm
Gambar B.46. Grafik hubungan antara total koloni mikroorganisme versus
lama intrusi untuk BI60-12
1.E+00
1.E+02
1.E+04
1.E+06
14 42 70 98 126 154 182 210 238 266 294 322 350Lama intrusi (hari)
C/b
inde
r (cf
u/gr
)
D = 0 - 25 mm D = 25 - 50 mm D = 50 - 75 mm
Gambar B.47. Grafik hubungan antara total koloni mikroorganisme versus
lama intrusi untuk BI60-14
323
1.E+00
1.E+02
1.E+04
1.E+06
14 42 70 98 126 154 182 210 238 266 294 322 350Lama intrusi (hari)
C/b
inde
r (cf
u/gr
)
D = 0 - 25 mm D = 25 - 50 mm D = 50 - 75 mm
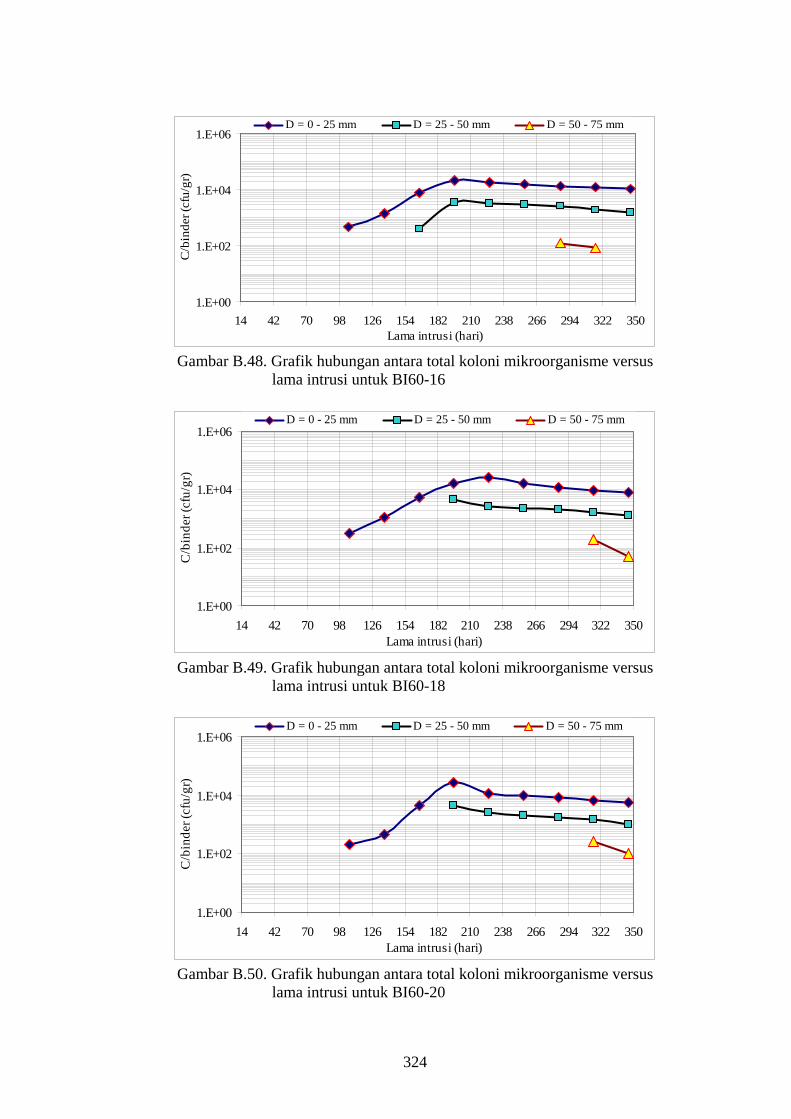
Gambar B.48. Grafik hubungan antara total koloni mikroorganisme versus
lama intrusi untuk BI60-16
1.E+00
1.E+02
1.E+04
1.E+06
14 42 70 98 126 154 182 210 238 266 294 322 350Lama intrusi (hari)
C/b
inde
r (cf
u/gr
)
D = 0 - 25 mm D = 25 - 50 mm D = 50 - 75 mm
Gambar B.49. Grafik hubungan antara total koloni mikroorganisme versus
lama intrusi untuk BI60-18
1.E+00
1.E+02
1.E+04
1.E+06
14 42 70 98 126 154 182 210 238 266 294 322 350Lama intrusi (hari)
C/b
inde
r (cf
u/gr
)
D = 0 - 25 mm D = 25 - 50 mm D = 50 - 75 mm
Gambar B.50. Grafik hubungan antara total koloni mikroorganisme versus
lama intrusi untuk BI60-20
324
9
10
11
12
13
14
14 42 70 98 126 154 182 210 238 266 294 322 350
Waktu (hari)
pH b
eton
BI25-0 BI25-10 BI25-12 BI25-14BI25-16 BI25-18 BI25-20
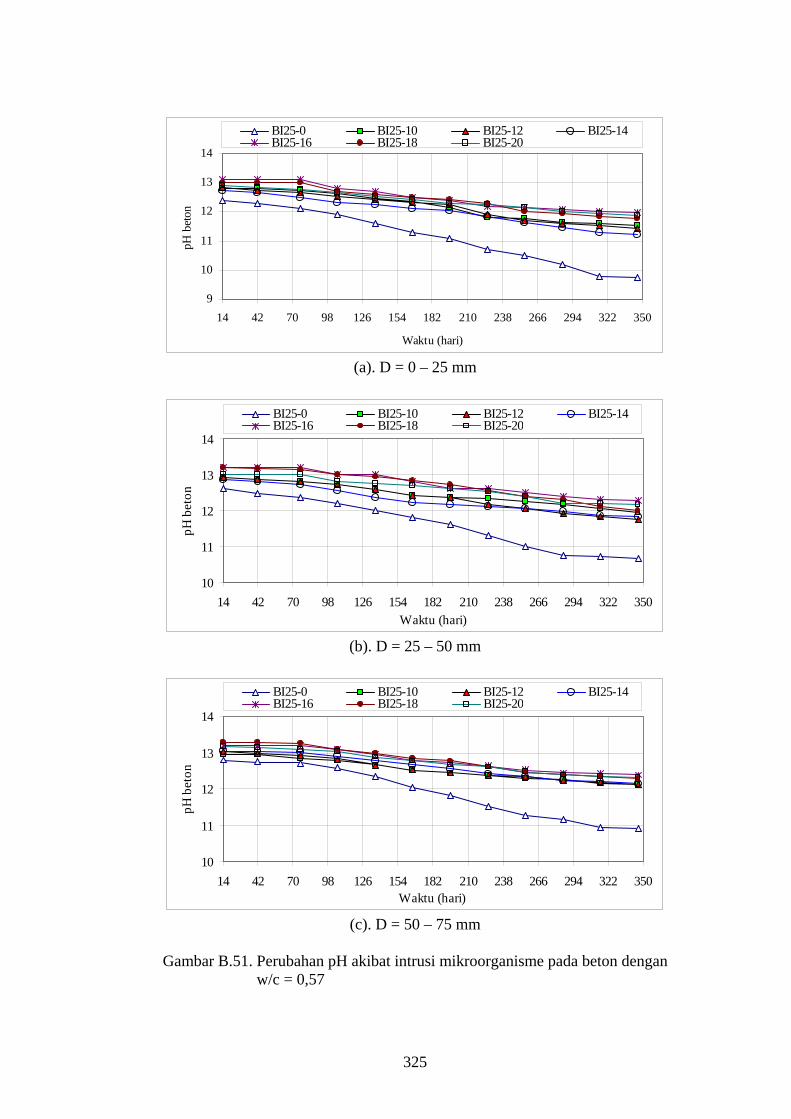
(a). D = 0 – 25 mm
10
11
12
13
14
14 42 70 98 126 154 182 210 238 266 294 322 350Waktu (hari)
pH b
eton
BI25-0 BI25-10 BI25-12 BI25-14BI25-16 BI25-18 BI25-20
(b). D = 25 – 50 mm
10
11
12
13
14
14 42 70 98 126 154 182 210 238 266 294 322 350Waktu (hari)
pH b
eton
BI25-0 BI25-10 BI25-12 BI25-14BI25-16 BI25-18 BI25-20
(c). D = 50 – 75 mm
Gambar B.51. Perubahan pH akibat intrusi mikroorganisme pada beton dengan
w/c = 0,57
325
10
11
12
13
14
14 42 70 98 126 154 182 210 238 266 294 322 350Waktu (hari)
pH b
eton
BI40-0 BI40-10 BI40-12 BI40-14BI40-16 BI40-18 BI40-20
(a). D = 0 – 25 mm
11
12
13
14
14 42 70 98 126 154 182 210 238 266 294 322 350Waktu (hari)
pH b
eton
BI40-0 BI40-10 BI40-12 BI40-14BI40-16 BI40-18 BI40-20
(b). D = 25 – 50 mm
11
12
13
14
14 42 70 98 126 154 182 210 238 266 294 322 350Waktu (hari)
pH b
eton
BI40-0 BI40-10 BI40-12 BI40-14BI40-16 BI40-18 BI40-20
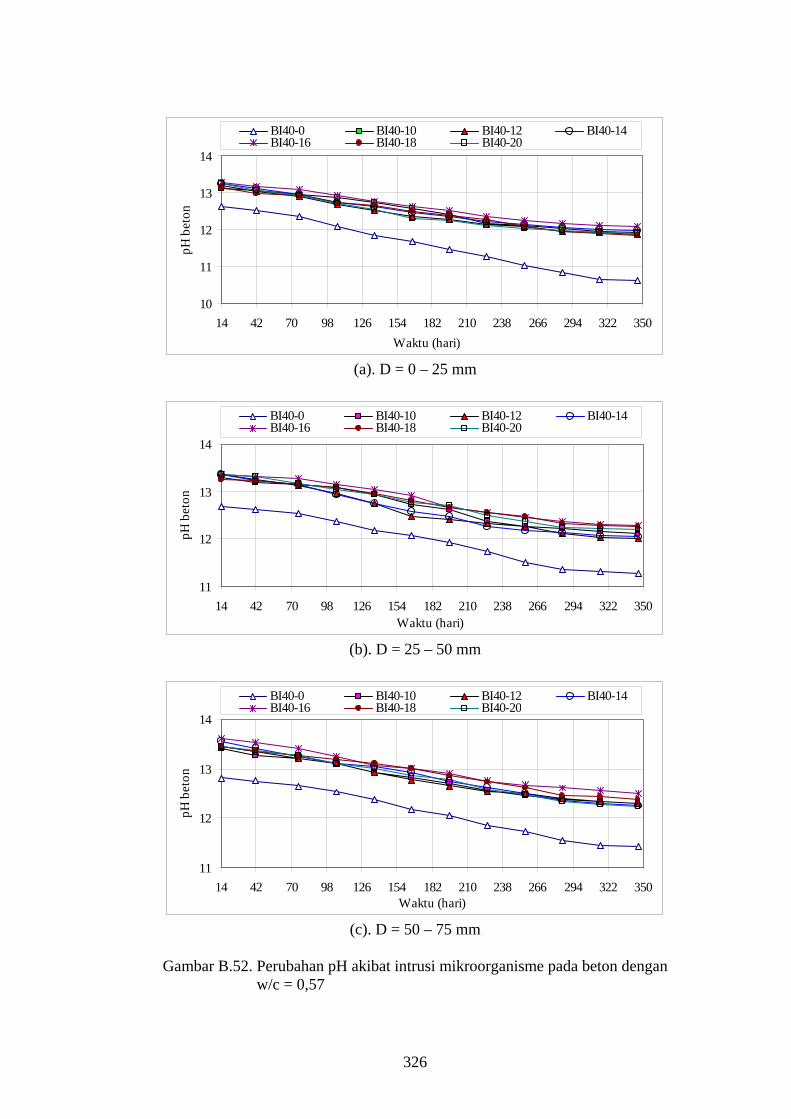
(c). D = 50 – 75 mm
Gambar B.52. Perubahan pH akibat intrusi mikroorganisme pada beton dengan
w/c = 0,57
326

11
12
13
14
14 42 70 98 126 154 182 210 238 266 294 322 350Waktu (hari)
pH b
eton
BI60-0 BI60-10 BI60-12 BI60-14BI60-16 BI25-18 BI60-20
(a). D = 0 – 25 mm
11
12
13
14
14 42 70 98 126 154 182 210 238 266 294 322 350Waktu (hari)
pH b
eton
BI60-0 BI60-10 BI60-12 BI60-14BI60-16 BI60-18 BI60-20
(b). D = 25 – 50 mm
11
12
13
14
14 42 70 98 126 154 182 210 238 266 294 322 350Waktu (hari)
pH b
eton
BI60-0 BI60-10 BI60-12 BI60-14BI60-16 BI60-18 BI60-20
(c). D = 50 – 75 mm
Gambar B.53. Perubahan pH akibat intrusi mikroorganisme pada beton dengan
w/c = 0,57
327

2.0
3.0
4.0
5.0
6.0
0 2 4 6 8 10 12 14 16 18 20
Bubuk slag nikel (%)
Kua
t tar
ik b
elah
, T (M
Pa) w/c = 0,57 w/c = 0,40 w/c = 0,30
(a). Beton nonintrusi mikroorganisme
2.0
3.0
4.0
5.0
6.0
0 2 4 6 8 10 12 14 16 18 20
Bubuk slag nikel (%)
Kua
t tar
ik b
elah
, T (M
Pa) w/c = 0,57 w/c = 0,40 w/c = 0,30
(b). Beton terintrusi mikroorganisme
Gambar B.54. Grafik hubungan kuat tarik belah versus prosentase bubuk slag
nikel pada umur 28 hari
328
2.0
2.5
3.0
3.5
0 2 4 6 8 10 12 14 16 18 20Bubuk slag nikel (%)
Kua
t tar
ik b
elah
, T (M
Pa) Nonintrusif Intrusif
(a). Beton dengan w/c = 0,57
3.0
3.5
4.0
4.5
0 2 4 6 8 10 12 14 16 18 2Bubuk slag nikel (%)
Kua
t tar
ik b
elah
, T (M
Pa
0
) Nonintrusif Intrusif
(b). Beton dengan w/c = 0,40
4.0
4.5
5.0
5.5
0 2 4 6 8 10 12 14 16 18 20Bubuk slag nikel (%)
Kua
t tar
ik b
elah
, T (M
Pa) Nonintrusif Intrusif
(c). Beton dengan w/c = 0,30
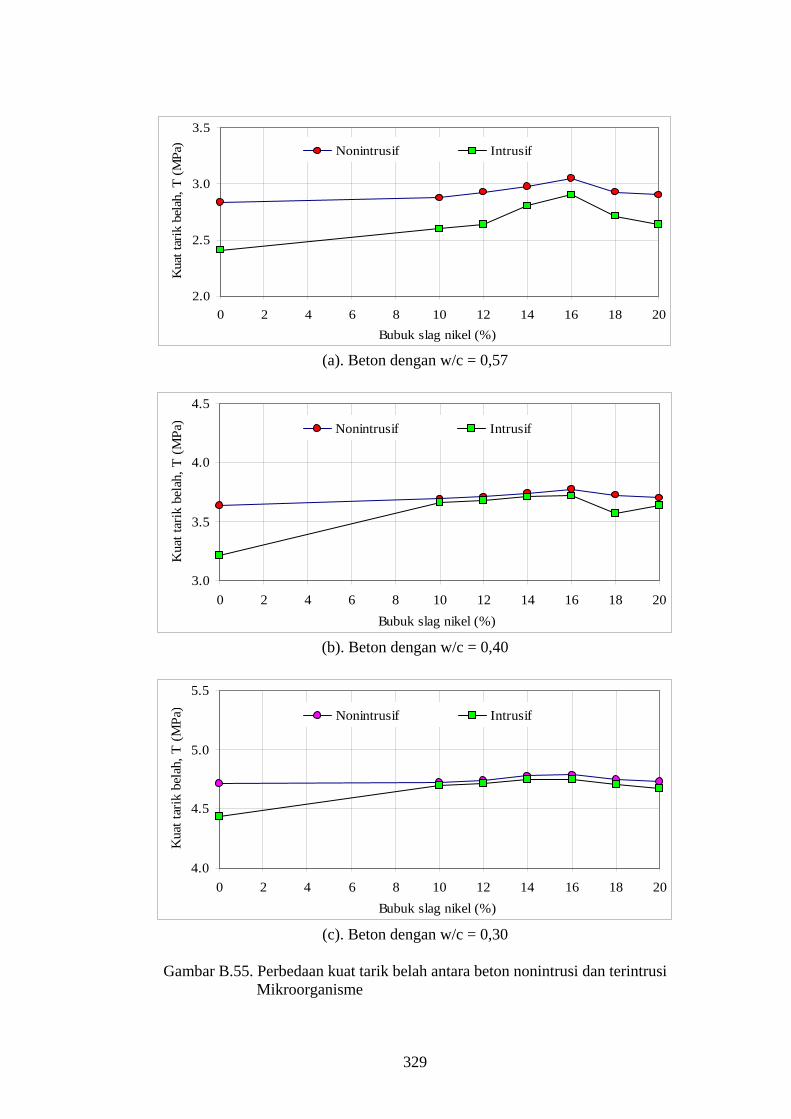
Gambar B.55. Perbedaan kuat tarik belah antara beton nonintrusi dan terintrusi
Mikroorganisme
329
3.0
4.0
5.0
6.0
7.0
8.0
0 2 4 6 8 10 12 14 16 18 20Bubuk slag nikel (%)
Kua
t tar
ik le
ntur
, R (M
Pa) w/c = 0,57 w/c = 0,40 w/c = 0,30
(a). Beton nonintrusi mikroorganisme
2.0
3.0
4.0
5.0
6.0
7.0
8.0
0 2 4 6 8 10 12 14 16 18 20Bubuk slag nikel (%)
Kua
t tar
ik le
ntur
, R (M
Pa) w/c = 0,57 w/c = 0,40 w/c = 0,30
(b). Beton terintrusi mikroorganisme
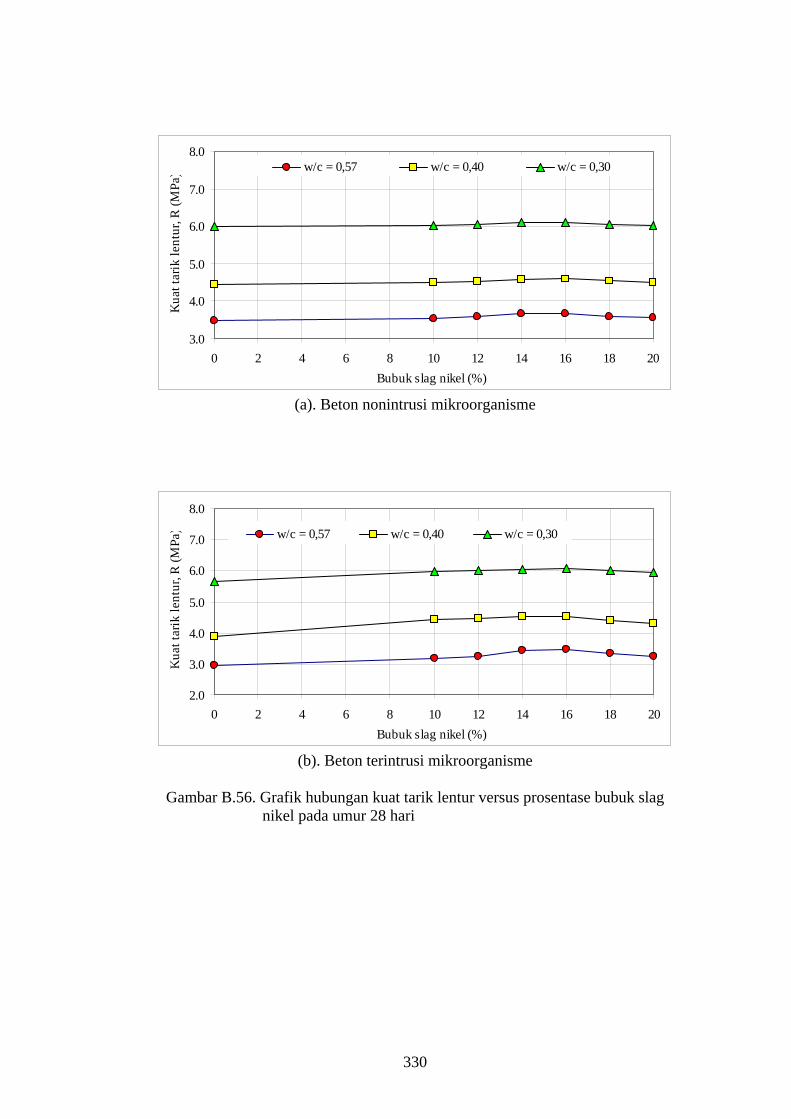
Gambar B.56. Grafik hubungan kuat tarik lentur versus prosentase bubuk slag
nikel pada umur 28 hari
330

2.0
2.5
3.0
3.5
4.0
4.5
0 2 4 6 8 10 12 14 16 18 2Bubuk slag nikel (%)
Kua
t tar
ik le
ntur
, R (M
Pa
0
)Nonintrusif Intrusif
(a). Beton dengan w/c = 0,57
3.0
3.5
4.0
4.5
5.0
5.5
0 2 4 6 8 10 12 14 16 18 20Bubuk slag nikel (%)
Kua
t tar
ik le
ntur
, R (M
Pa)
Nonintrusif Intrusif
(b). Beton dengan w/c = 0,40
5.0
5.5
6.0
6.5
7.0
0 2 4 6 8 10 12 14 16 18 20Bubuk slag nikel (%)
Kua
t tar
ik le
ntr,
R (M
Pa) Nonintrusif Intrusif
(c). Beton dengan w/c = 0,30
Gambar B.57. Perbedaan kuat tarik lentur antara beton nonintrusi dan terintrusi
mikroorganisme
331
0
5
10
15
20
25
30
0.000 0.001 0.002 0.003 0.004 0.005 0.006 0.007Regangan (mm/mm)
Tega
ngan
(M
Pa)
BNI25-0
BNI25-16
(a). Beton dengan w/c = 0,57
05
101520253035404550
0.000 0.001 0.002 0.003 0.004 0.005 0.006 0.007Regangan (mm/mm)
Tega
ngan
(M
Pa)
BNI40-0
BNI40-16
(b). Beton dengan w/c = 0,40
0
10
20
30
40
50
60
70
0.000 0.001 0.002 0.003 0.004 0.005 0.006Regangan (mm/mm)
Tega
ngan
(M
Pa)
BNI60-0
BNI60-16
(c). Beton dengan w/c = 0,30
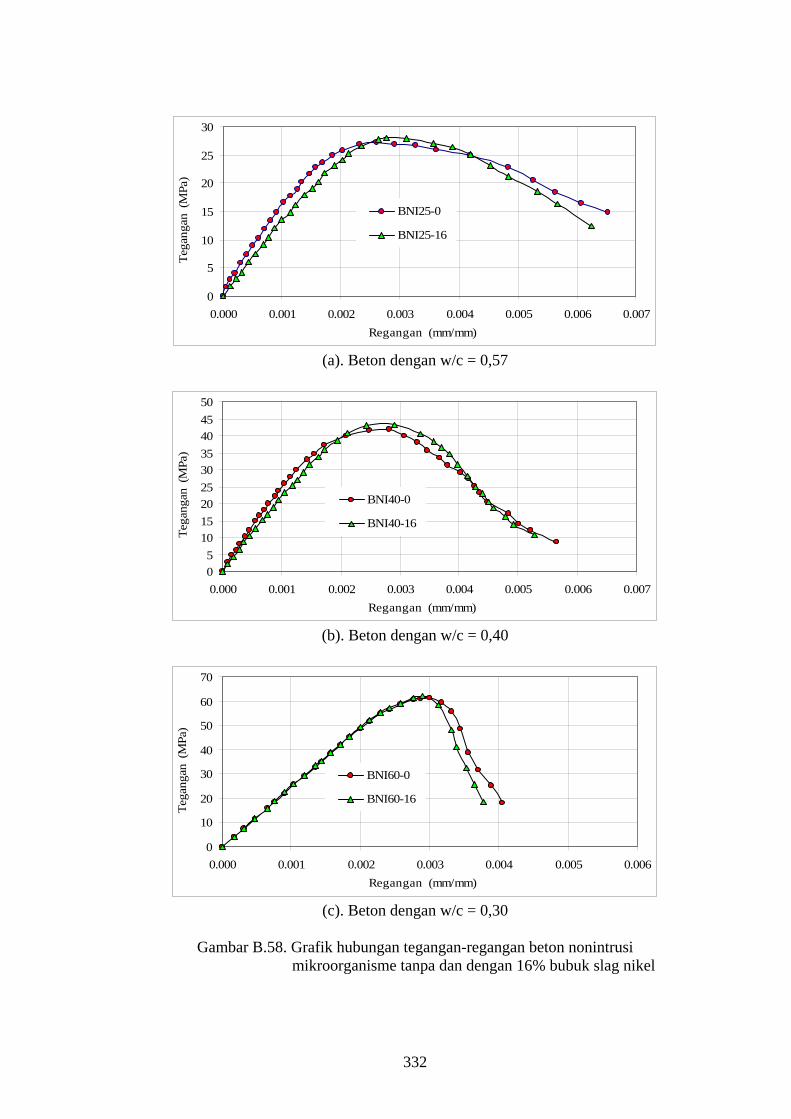
Gambar B.58. Grafik hubungan tegangan-regangan beton nonintrusi
mikroorganisme tanpa dan dengan 16% bubuk slag nikel
332
0
5
10
15
20
25
30
0.000 0.001 0.002 0.003 0.004 0.005 0.006 0.007Regangan (mm/mm)
Tega
ngan
(M
Pa)
BI25-0
BI25-16
(a). Beton dengan w/c = 0,57
05
1015202530354045
0.000 0.001 0.002 0.003 0.004 0.005 0.006 0.007Regangan (mm/mm)
Tega
ngan
(M
Pa)
BI40-0
BI40-16
(b). Beton dengan w/c = 0,40
0
10
20
30
40
50
60
70
0.000 0.001 0.002 0.003 0.004 0.005 0.006Regangan (mm/mm)
Tega
ngan
(M
Pa)
BI60-0
BI60-16
(c). Beton dengan w/c = 0,30
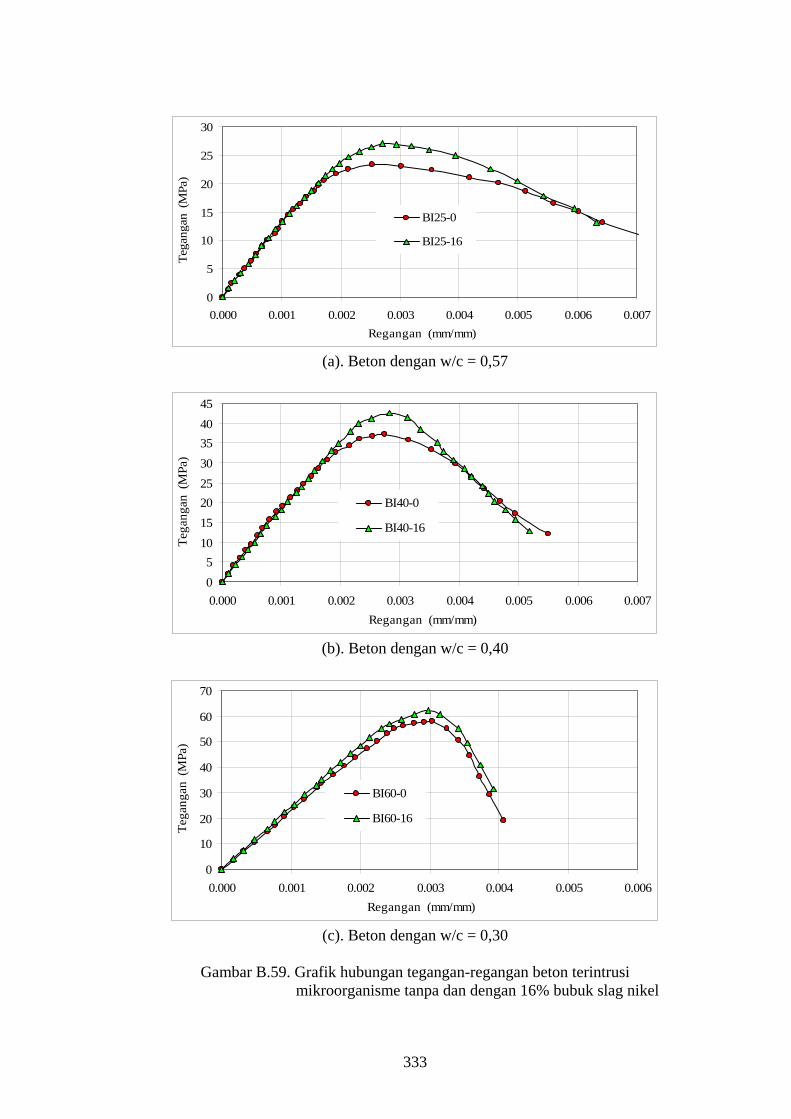
Gambar B.59. Grafik hubungan tegangan-regangan beton terintrusi
mikroorganisme tanpa dan dengan 16% bubuk slag nikel
333
0
5
10
15
20
25
30
0.000 0.001 0.002 0.003 0.004 0.005 0.006 0.007 0.008
Regangan (mm/mm)
Tega
ngan
(M
Pa)
DataThorenfeldtModifikasiHognestad
(a). Beton dengan w/c = 0,57 (BNI25-0)
05
1015202530354045
0.000 0.001 0.002 0.003 0.004 0.005 0.006Regangan (mm/mm)
Tega
ngan
(M
Pa)
DataThorenfeldtModifikasiHognestad
(b). Beton dengan w/c = 0,40 (BNI40-0)
0
10
20
30
40
50
60
70
0.000 0.001 0.002 0.003 0.004 0.005
Regangan (mm/mm)
Tega
ngan
(M
Pa)
DataThorenfeldtModifikasiHognestad
(c). Beton dengan w/c = 0,30 (BNI60-0)
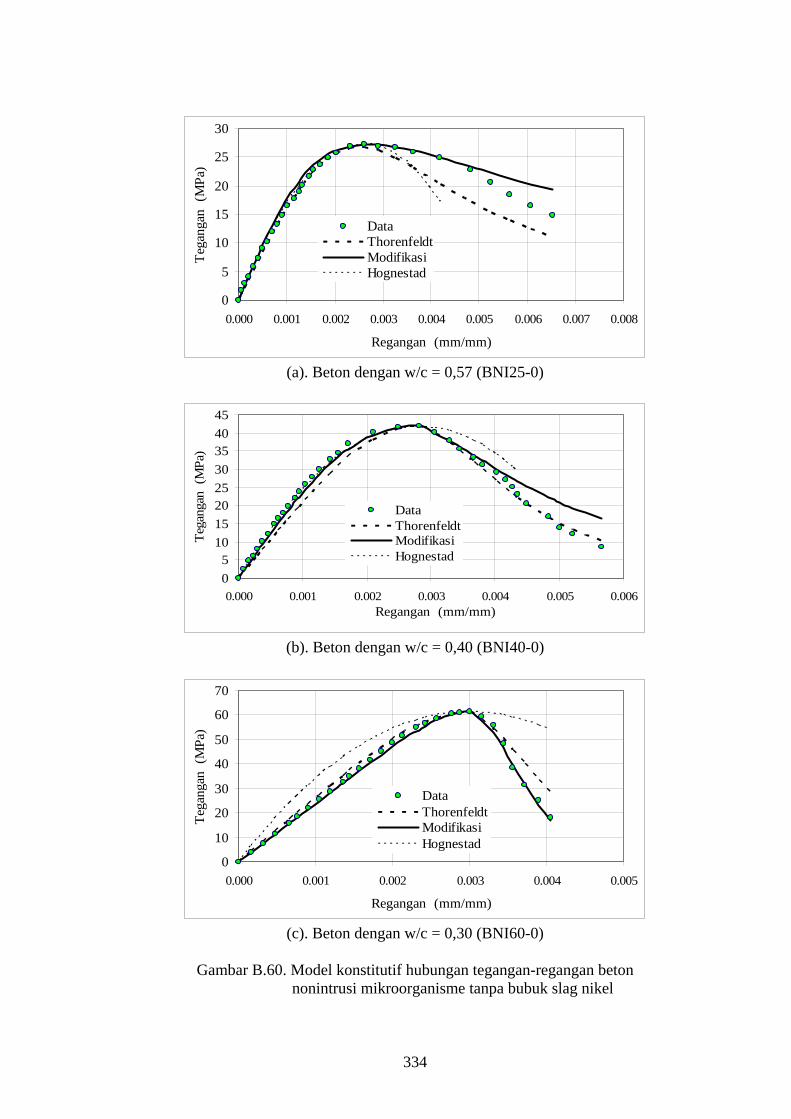
Gambar B.60. Model konstitutif hubungan tegangan-regangan beton
nonintrusi mikroorganisme tanpa bubuk slag nikel
334
0
5
10
15
20
25
30
0.000 0.001 0.002 0.003 0.004 0.005 0.006 0.007
Regangan (mm/mm)
Tega
ngan
(M
Pa)
DataThorenfeldtModifikasiHognestad
(a). Beton dengan w/c = 0,57 (BNI25-16)
05
101520253035404550
0.000 0.001 0.002 0.003 0.004 0.005 0.006 0.007
Regangan (mm/mm)
Tega
ngan
(M
Pa)
DataThorenfeldtModifikasiHognestad
(b). Beton dengan w/c = 0,40 (BNI40-16)
0
10
20
30
40
50
60
70
0.000 0.001 0.002 0.003 0.004 0.005
Regangan (mm/mm)
Tega
ngan
(M
Pa)
DataThorenfeldtModifikasiHognestad
(c). Beton dengan w/c = 0,30 (BNI60-16)
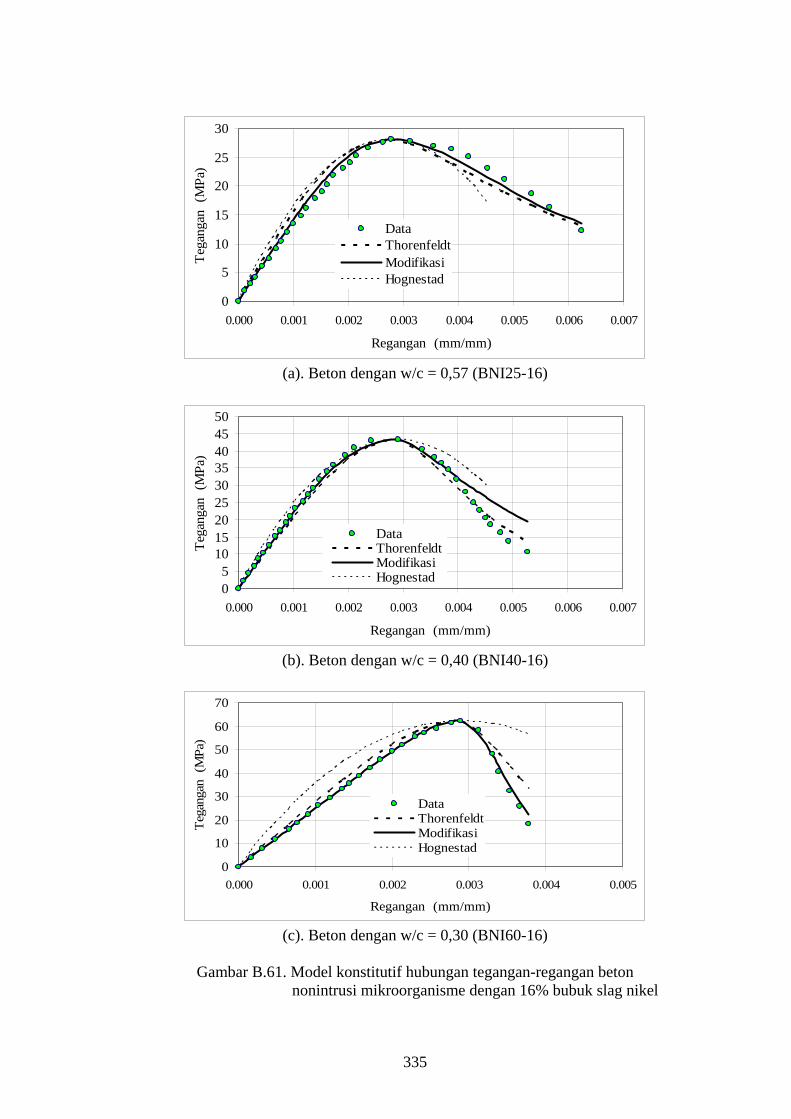
Gambar B.61. Model konstitutif hubungan tegangan-regangan beton
nonintrusi mikroorganisme dengan 16% bubuk slag nikel
335

0
5
10
15
20
25
0.000 0.001 0.002 0.003 0.004 0.005 0.006 0.007 0.008
Regangan (mm/mm)
Tega
ngan
(M
Pa)
DataThorenfeldtModifikasiHognestad
(a). Beton dengan w/c = 0,57 (BI25-0)
05
1015202530
3540
0.000 0.001 0.002 0.003 0.004 0.005 0.006
Regangan (mm/mm)
Tega
ngan
(M
Pa)
DataThorenfeldtModifikasiHognestad
(b). Beton dengan w/c = 0,40 (BI40-0)
0
10
20
30
40
50
60
70
0.000 0.001 0.002 0.003 0.004 0.005
Regangan (mm/mm)
Tega
ngan
(M
Pa)
DataThorenfeldtModifikasiHognestad
(c). Beton dengan w/c = 0,30 (BI60-0)
Gambar B.62. Model konstitutif hubungan tegangan-regangan beton
terintrusi mikroorganisme tanpa bubuk slag nikel
336
0
5
10
15
20
25
30
0.000 0.001 0.002 0.003 0.004 0.005 0.006 0.007
Regangan (mm/mm)
Tega
ngan
(M
Pa)
DataThorenfeldtModifikasiHognestad
(a). Beton dengan w/c = 0,57 (BI25-0)
05
101520253035404550
0.000 0.001 0.002 0.003 0.004 0.005 0.006
Regangan (mm/mm)
Tega
ngan
(M
Pa)
DataThorenfeldtModifikasiHognestad
(b). Beton dengan w/c = 0,40 (BI40-0)
0
10
20
30
40
50
60
70
0.000 0.001 0.002 0.003 0.004 0.005
Regangan (mm/mm)
Tega
ngan
(M
Pa)
DataThorenfeldtModifikasiHognestad
(c). Beton dengan w/c = 0,30 (BI60-0)
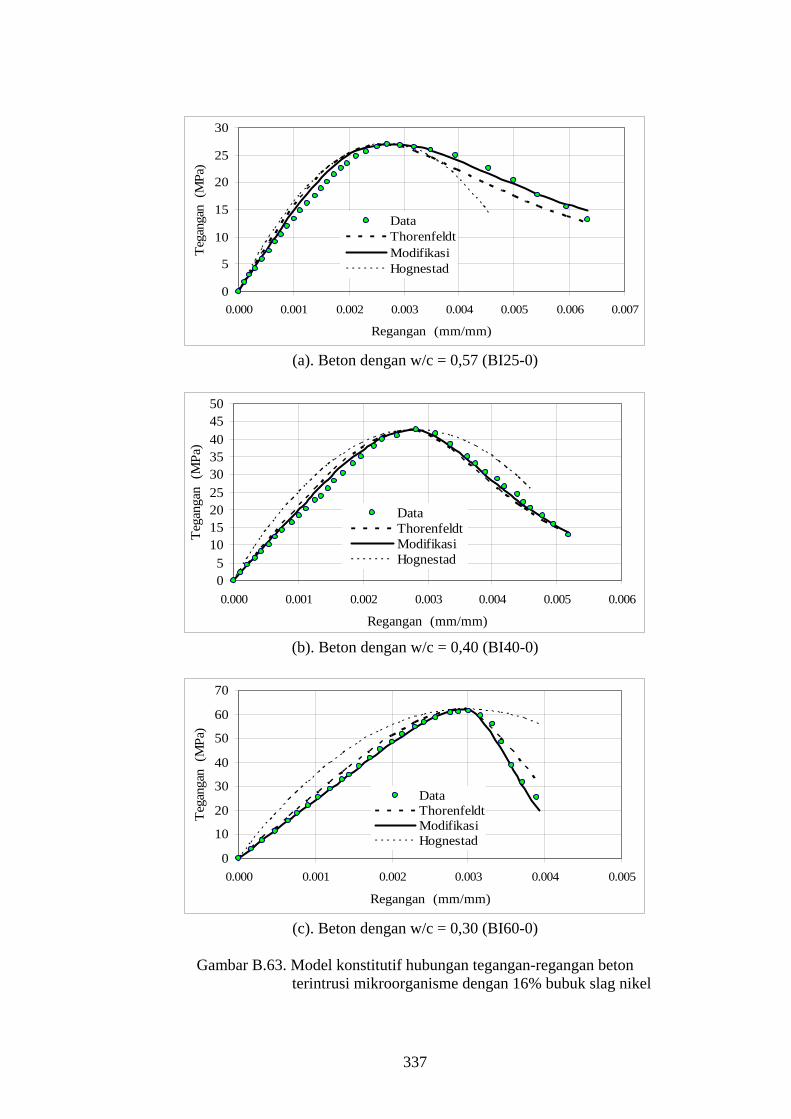
Gambar B.63. Model konstitutif hubungan tegangan-regangan beton
terintrusi mikroorganisme dengan 16% bubuk slag nikel
337

5.0E+03
1.5E+04
2.5E+04
3.5E+04
4.5E+04
0 5 10 15 20Bubuk slag nikel (%)
Mod
ulus
ela
stisit
as, E
c (M
Pa) w/c=0,57 w/c=0,40 w/c=0,30
(a). Beton nonintrusi mikroorganisme
5.0E+03
1.5E+04
2.5E+04
3.5E+04
4.5E+04
0 5 10 15 20Bubuk slag nikel (%)
Mod
ulus
ela
stisit
as, E
c (M
Pa)
w/c=0,57 w/c=0,40 w/c=0,30
(b). Beton terintrusi mikroorganisme
Gambar B.64. Grafik hubungan antara modulus elastisitas beton dengan
prosentase bubuk slag nikel
19.2117.21
11.129.85
4.015.41
0
5
10
15
20
25
w/c=0,66 w/c=0,46 w/c=0,35Rasio air semen (w/c)
Penu
runa
n m
odul
us e
lasti
sitas
(%)
Tanpa bubuk slag nikel 16% bubuk slag nikel
Gambar B.65. Grafik penurunan modulus elastisitas akibat intrusi
mikroorganisme
338

LAMPIRAN C
DATA PENGUJIAN X-RAY DIFFARCTION
339

35
45
55
65
75
14 42 70 98 126 154 182
Umur (hari)
CSH
(%)
BNI25-0 BNI25-10BNI25-16 BNI25-18
(a). D = 0 – 25 mm
30
40
50
60
70
80
14 42 70 98 126 154 182
Umur (hari)
CSH
(%)
BNI25-0 BNI25-10BNI25-16 BNI25-18
(b). D = 25 – 50 mm
30
40
50
60
70
80
14 42 70 98 126 154 182
Umur (hari)
CSH
(%)
BNI25-0 BNI25-10BNI25-16 BNI25-18
(c). D = 50 – 75 mm
Gambar C.1. Grafik hubungan CSH versus umur beton nonintrusi
mikroorganisme untuk w/c = 0,57
340

30
40
50
60
70
80
0 28 56 84 112 140 168
Lama intrusi (hari)
CSH
(%)
BI25-0 BI25-10BI25-16 BI25-18
(a). D = 0 – 25 mm
30
40
50
60
70
80
0 28 56 84 112 140 168
Lama intrusi (hari)
CSH
(%)
BI25-0 BI25-10BI25-16 BI25-18
(b). D = 25 – 50 mm
30
40
50
60
70
80
0 28 56 84 112 140
Lama intrusi (hari)
CSH
(%)
168
BI25-0 BI25-10BI25-16 BI25-18
(c). D = 50 – 75 mm
Gambar C.2. Grafik hubungan CSH versus lama intrusi untuk beton
w/c = 0,57
341
30
40
50
60
70
80
14 42 70 98 126 154 182
Umur (hari)
CSH
(%)
BNI40-0 BNI40-10BNI40-16 BNI40-18
(a). D = 0 – 25 mm
30
40
50
60
70
80
14 42 70 98 126 154 182
Umur (hari)
CSH
(%)
BNI40-0 BNI40-10BNI40-16 BNI40-18
(b). D = 25 – 50 mm
40
50
60
70
80
14 42 70 98 126 154 182
Umur (hari)
CSH
(%)
BNI40-0 BNI40-10BNI40-16 BNI40-18
(c). d = 50 – 75 mm
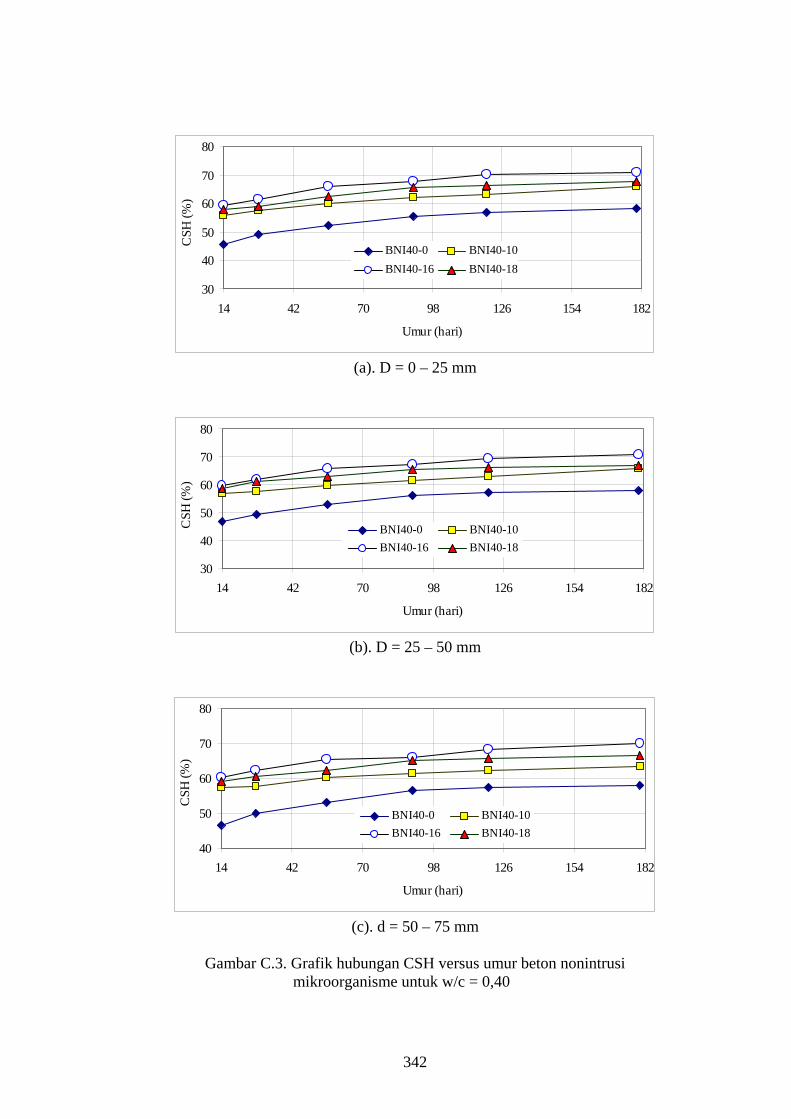
Gambar C.3. Grafik hubungan CSH versus umur beton nonintrusi
mikroorganisme untuk w/c = 0,40
342

35
45
55
65
75
0 28 56 84 112 140 168
Lama intrusi (hari)
CSH
(%)
BI40-0 BI40-10
BI40-16 BI40-18
(a). D = 0 – 25 mm
30
40
50
60
70
80
0 28 56 84 112 140 168
Lama intrusi (hari)
CSH
(%)
BI40-0 BI40-10BI40-16 BI40-18
(b). D = 25 – 50 mm
40
50
60
70
80
0 28 56 84 112 140 168
Lama intrusi (hari)
CSH
(%)
BI40-0 BI40-10BI40-16 BI40-18
(c). D = 50 – 75 mm
Gambar C.4. Grafik hubungan CSH versus lama intrusi untuk beton
w/c = 0,40
343

40
50
60
70
80
14 42 70 98 126 154 182
Umur (hari)
CSH
(%)
BNI60-0 BNI60-10BNI60-16 BNI60-18
(a). D = 0 – 25 mm
40
50
60
70
80
14 42 70 98 126 154 182
Umur (hari)
CSH
(%)
BNI60-0 BNI60-10BNI60-16 BNI60-18
(b). D = 25 – 50 mm
35
45
55
65
75
14 42 70 98 126 154 182
Umur (hari)
CSH
(%)
BNI60-0 BNI60-10BNI60-16 BNI60-18
(c). D = 50 – 75 mm
Gambar C.5. Grafik hubungan CSH versus umur beton nonintrusi
mikroorganisme untuk w/c = 0,30
344

40
50
60
70
80
0 28 56 84 112 140 168
Lama intrusi (hari)
CSH
(%)
BI60-0 BI60-10BI60-16 BI60-18
(a). D = 0 – 25 mm
40
50
60
70
80
0 28 56 84 112 140 168
Lama intruis (hari)
CSH
(%)
BI60-0 BI60-10BI60-16 BI60-18
(b). D = 25 – 50 mm
40
50
60
70
80
0 28 56 84 112 140 168
Lama intrusi (hari)
CSH
(%)
BI60-0 BI60-10BI60-16 BI60-18
(c). D = 50 – 75 mm
Gambar C.6. Grafik hubungan CSH versus lama intrusi untuk beton
w/c = 0,30
345

10
20
30
40
14 42 70 98 126 154 182
Umur (hari)
CH
(%)
BNI25-0 BNI25-10BNI25-16 BNI25-18
(a). D = 0 – 25 mm
10
20
30
40
14 42 70 98 126 154 182
Umur (hari)
CH
(%)
BNI25-0 BNI25-10BNI25-16 BNI25-18
(b). D = 25 – 50 mm
10
20
30
40
14 42 70 98 126 154 182
Umur (hari)
CH
(%)
BNI25-0 BNI25-10BNI25-16 BNI25-18
(c). D = 50 – 75 mm
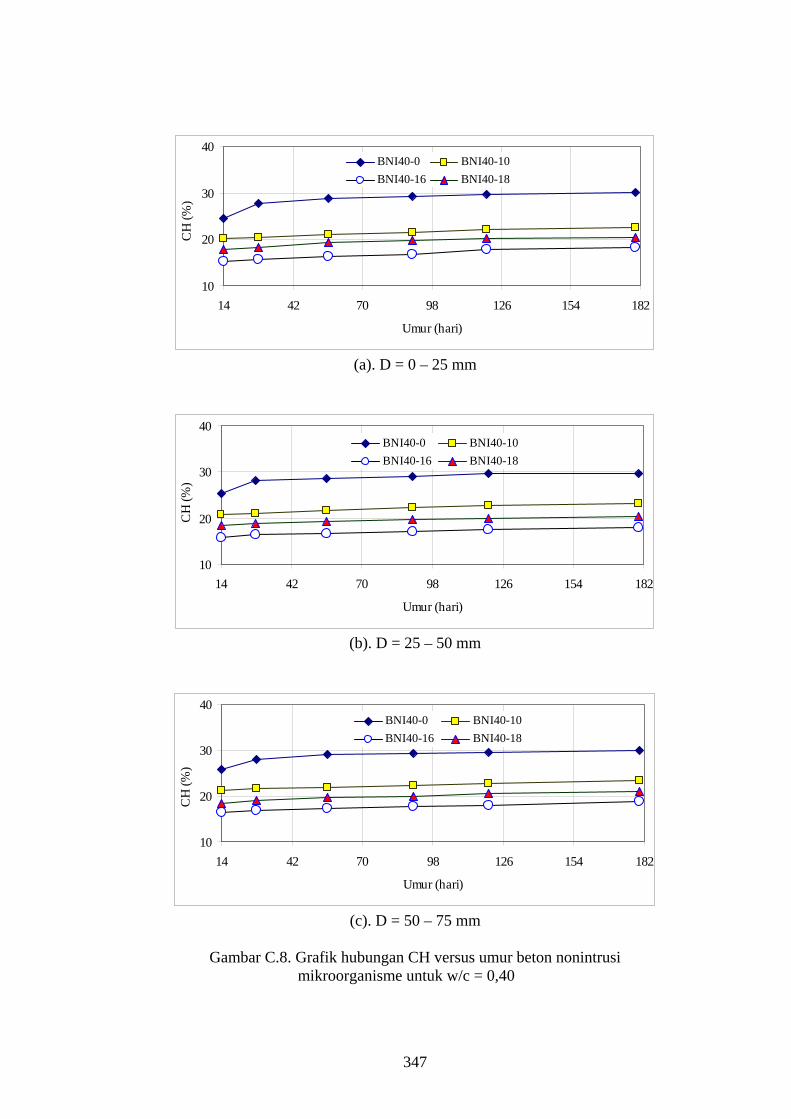
Gambar C.7. Grafik hubungan CH versus umur beton nonintrusi
mikroorganisme untuk w/c = 0,57
346
10
20
30
40
14 42 70 98 126 154 182
Umur (hari)
CH
(%)
BNI40-0 BNI40-10BNI40-16 BNI40-18
(a). D = 0 – 25 mm
10
20
30
40
14 42 70 98 126 154 182
Umur (hari)
CH
(%)
BNI40-0 BNI40-10BNI40-16 BNI40-18
(b). D = 25 – 50 mm
10
20
30
40
14 42 70 98 126 154 182
Umur (hari)
CH
(%)
BNI40-0 BNI40-10BNI40-16 BNI40-18
(c). D = 50 – 75 mm
Gambar C.8. Grafik hubungan CH versus umur beton nonintrusi
mikroorganisme untuk w/c = 0,40
347
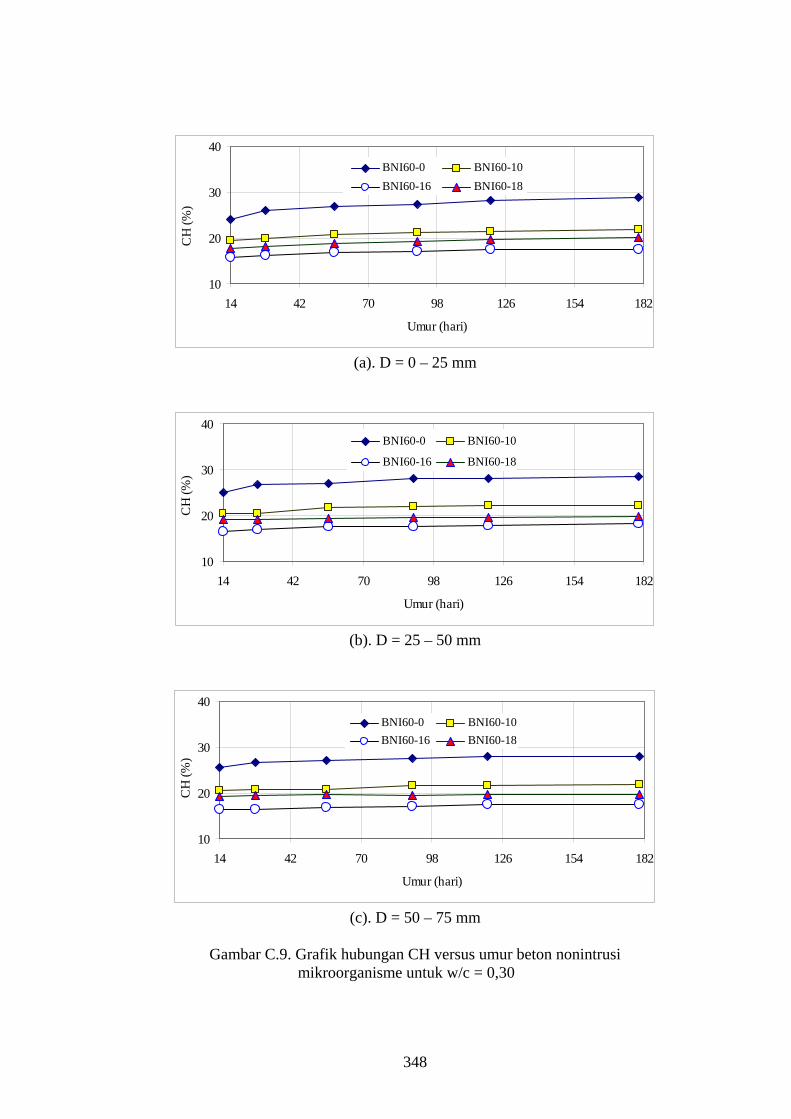
10
20
30
40
14 42 70 98 126 154 182
Umur (hari)
CH
(%)
BNI60-0 BNI60-10BNI60-16 BNI60-18
(a). D = 0 – 25 mm
10
20
30
40
14 42 70 98 126 154 182
Umur (hari)
CH
(%)
BNI60-0 BNI60-10
BNI60-16 BNI60-18
(b). D = 25 – 50 mm
10
20
30
40
14 42 70 98 126 154 182
Umur (hari)
CH
(%)
BNI60-0 BNI60-10BNI60-16 BNI60-18
(c). D = 50 – 75 mm
Gambar C.9. Grafik hubungan CH versus umur beton nonintrusi
mikroorganisme untuk w/c = 0,30
348

0
10
20
30
0 28 56 84 112 140 168
Lama intrusi (hari)
CH
(%)
BI25-0 BI25-10BI25-16 BI25-18
(a). D = 0 – 25 mm
0
10
20
30
40
0 28 56 84 112 140 168
Lama intrusi (hari)
CH
(%)
BI25-0 BI25-10BI25-16 BI25-18
(b). D = 25 – 50 mm
0
10
20
30
40
0 28 56 84 112 140 168
Lama intrusi (hari)
CH
(%)
BI25-0 BI25-10BI25-16 BI25-18
(c). D = 50 – 75 mm
Gambar C.10. Grafik hubungan CH versus lama intrusi mikroorganisme
untuk beton w/c = 0,57
349

0
10
20
30
0 28 56 84 112 140 168
Lama intrusi (hari)
CH
(%)
BI40-0 BI40-10BI40-16 BI40-18
(a). D = 0 – 25 mm
0
10
20
30
40
0 28 56 84 112 140 168
Lama intrusi (hari)
CH
(%)
BI40-0 BI40-10BI40-16 BI40-18
(b). D = 25 – 50 mm
0
10
20
30
0 28 56 84 112 140 168
Lama intrusi (hari)
CH
(%)
BI40-0 BI40-10BI40-16 BI40-18
(c). D = 50 – 75 mm
Gambar C.11. Grafik hubungan CH versus lama intrusi mikroorganisme
untuk beton w/c = 0,40
350

0
10
20
30
0 28 56 84 112 140 168
Lama intrusi (hari)
CH
(%)
BI60-0 BI60-10BI60-16 BI60-18
(a). D = 0 – 25 mm
0
10
20
30
0 28 56 84 112 140 168
Lama intrusi (hari)
CH
(%)
BI60-0 BI60-10BI60-16 BI60-18
(b). D = 25 – 50 mm
0
10
20
30
0 28 56 84 112 140 168
Lama intrusi (hari)
CH
(%)
BI60-0 BI60-10BI6-16 BI60-18
(c). D = 50 – 75 mm
Gambar C.12. Grafik hubungan CH versus lama intrusi mikroorganisme
untuk beton w/c = 0,30
351
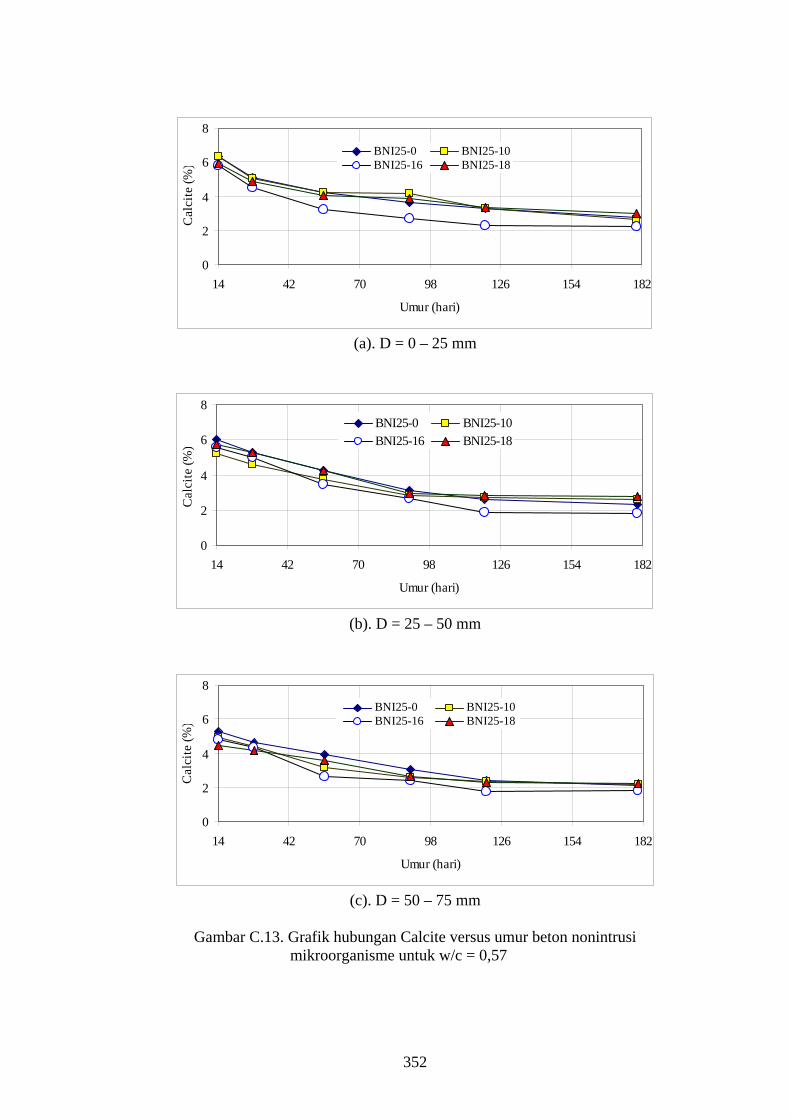
0
2
4
6
8
14 42 70 98 126 154 182
Umur (hari)
Cal
cite
(%)
BNI25-0 BNI25-10BNI25-16 BNI25-18
(a). D = 0 – 25 mm
0
2
4
6
8
14 42 70 98 126 154 182
Umur (hari)
Cal
cite
(%)
BNI25-0 BNI25-10BNI25-16 BNI25-18
(b). D = 25 – 50 mm
0
2
4
6
8
14 42 70 98 126 154 182
Umur (hari)
Cal
cite
(%)
BNI25-0 BNI25-10BNI25-16 BNI25-18
(c). D = 50 – 75 mm
Gambar C.13. Grafik hubungan Calcite versus umur beton nonintrusi
mikroorganisme untuk w/c = 0,57
352

0
2
4
6
8
14 42 70 98 126 154 182
Umur (hari)
Cal
cite
(%)
BNI40-0 BNI40-10BNI40-16 BNI40-18
(a). D = 0 – 25 mm
0
2
4
6
8
14 42 70 98 126 154 182
Umur (hari)
Cal
cite
(%)
BNI40-0 BNI40-10BNI40-16 BNI40-18
(b). D = 25 – 50 mm
0
2
4
6
14 42 70 98 126 154 182
Umur (hari)
Cal
cite
(%)
BNI40-0 BNI40-10BNI40-16 BNI40-18
(c). D = 50 – 75 mm
Gambar C.14. Grafik hubungan Calcite versus umur beton nonintrusi
mikroorganisme untuk w/c = 0,40
353

0
2
4
6
8
14 42 70 98 126 154 182
Umur (hari)
Cal
cite
(%)
BNI60-0 BNI60-10BNI60-16 BNI60-18
(a). D = 0 – 25 mm
0
2
4
6
8
14 42 70 98 126 154 182
Umur (hari)
Cal
cite
(%)
BNI60-0 BNI60-10BNI60-16 BNI60-18
(b). D = 25 – 50 mm
0
2
4
6
8
14 42 70 98 126 154 182
Umur (hari)
Cal
cite
(%)
BNI60-0 BNI60-10BNI60-16 BNI60-18
(c). D = 50 – 75 mm
Gambar C.15. Grafik hubungan Calcite versus umur beton nonintrusi
mikroorganisme untuk w/c = 0,30
354
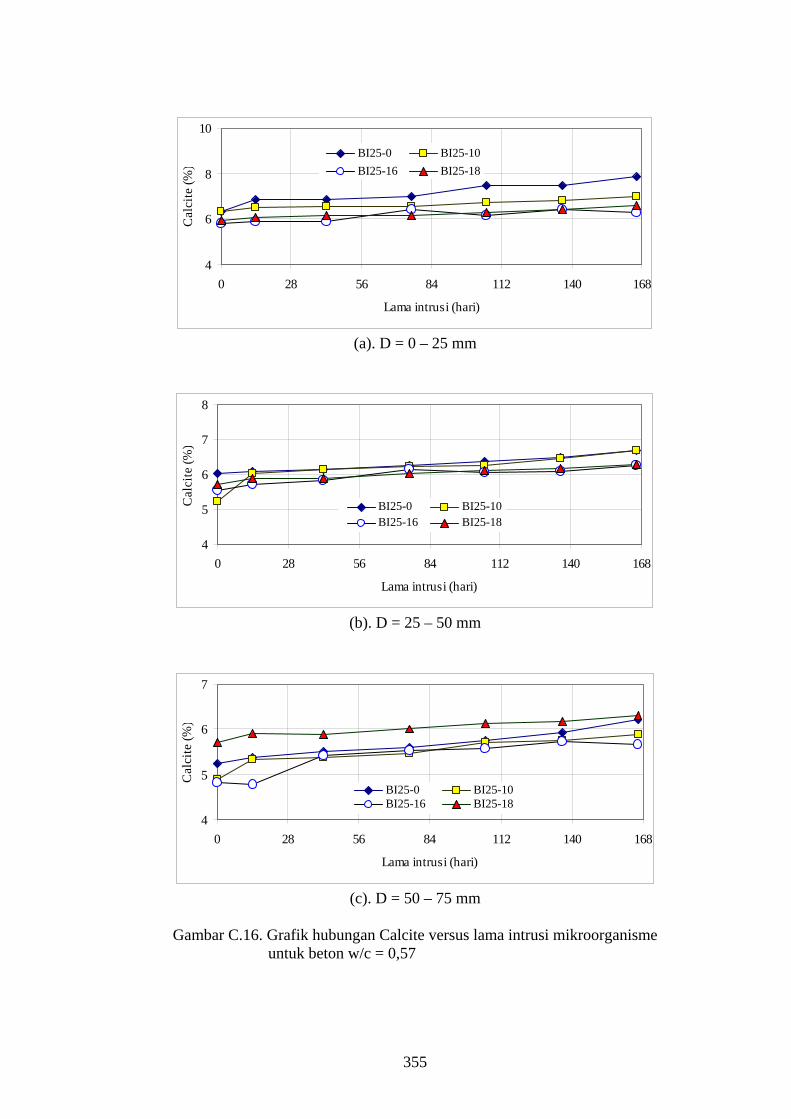
4
6
8
10
0 28 56 84 112 140 168
Lama intrusi (hari)
Cal
cite
(%)
BI25-0 BI25-10BI25-16 BI25-18
(a). D = 0 – 25 mm
4
5
6
7
8
0 28 56 84 112 140 168
Lama intrusi (hari)
Cal
cite
(%)
BI25-0 BI25-10BI25-16 BI25-18
(b). D = 25 – 50 mm
4
5
6
7
0 28 56 84 112 140 168
Lama intrusi (hari)
Cal
cite
(%)
BI25-0 BI25-10BI25-16 BI25-18
(c). D = 50 – 75 mm
Gambar C.16. Grafik hubungan Calcite versus lama intrusi mikroorganisme
untuk beton w/c = 0,57
355

4
5
6
7
8
0 28 56 84 112 140 168
Lama intrusi (hari)
Cal
cite
(%)
BI40-0 BI40-10BI40-16 BI40-18
(a). D = 0 – 25 mm
4
5
6
7
8
0 28 56 84 112 140 168
Lama intrusi (hari)
Cal
cite
(%)
BI40-0 BI40-10BI40-16 BI40-18
(b). D = 25 – 50 mm
3
4
5
6
7
0 28 56 84 112 140 168
Lama intrusi (hari)
Cal
cite
(%)
BI40-0 BI40-10BI40-16 BI40-18
(c). D = 50 – 75 mm
Gambar C.17. Grafik hubungan Calcite versus lama intrusi mikroorganisme
untuk beton w/c = 0,40
356
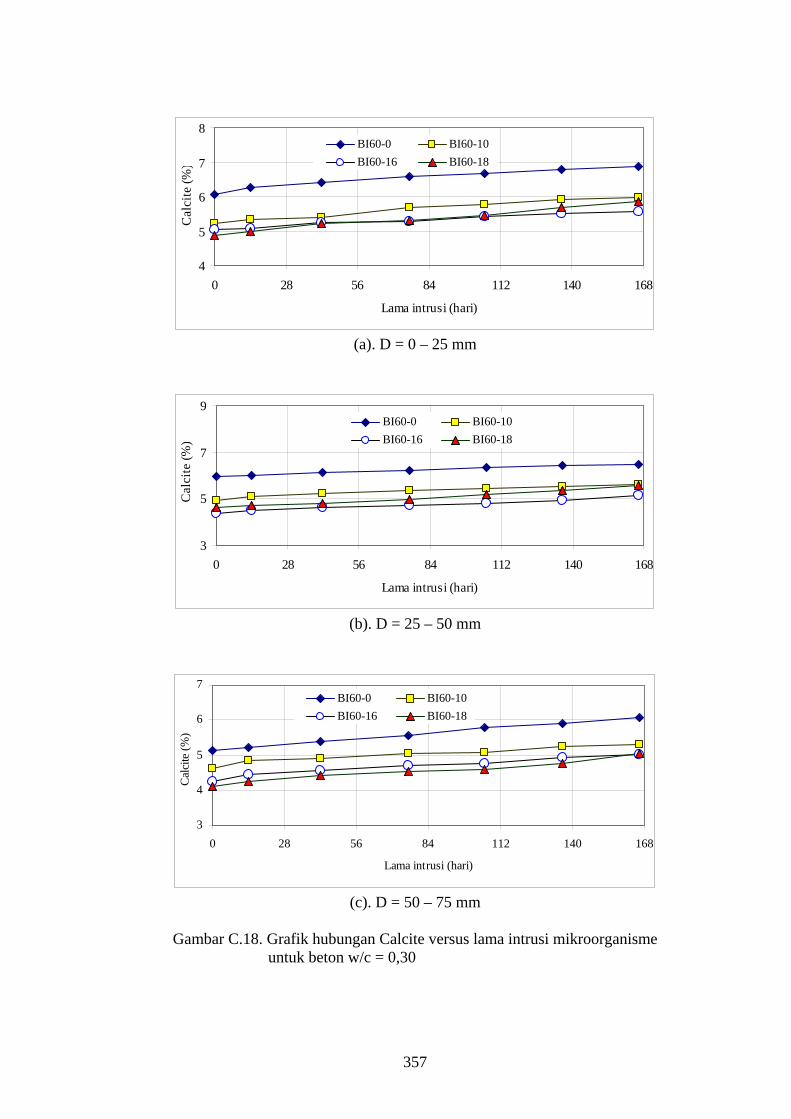
4
5
6
7
8
0 28 56 84 112 140 168
Lama intrusi (hari)
Cal
cite
(%)
BI60-0 BI60-10BI60-16 BI60-18
(a). D = 0 – 25 mm
3
5
7
9
0 28 56 84 112 140 168
Lama intrusi (hari)
Cal
cite
(%)
BI60-0 BI60-10BI60-16 BI60-18
(b). D = 25 – 50 mm
3
4
5
6
7
0 28 56 84 112 140 168
Lama intrusi (hari)
Cal
cite
(%)
BI60-0 BI60-10BI60-16 BI60-18
(c). D = 50 – 75 mm
Gambar C.18. Grafik hubungan Calcite versus lama intrusi mikroorganisme
untuk beton w/c = 0,30
357
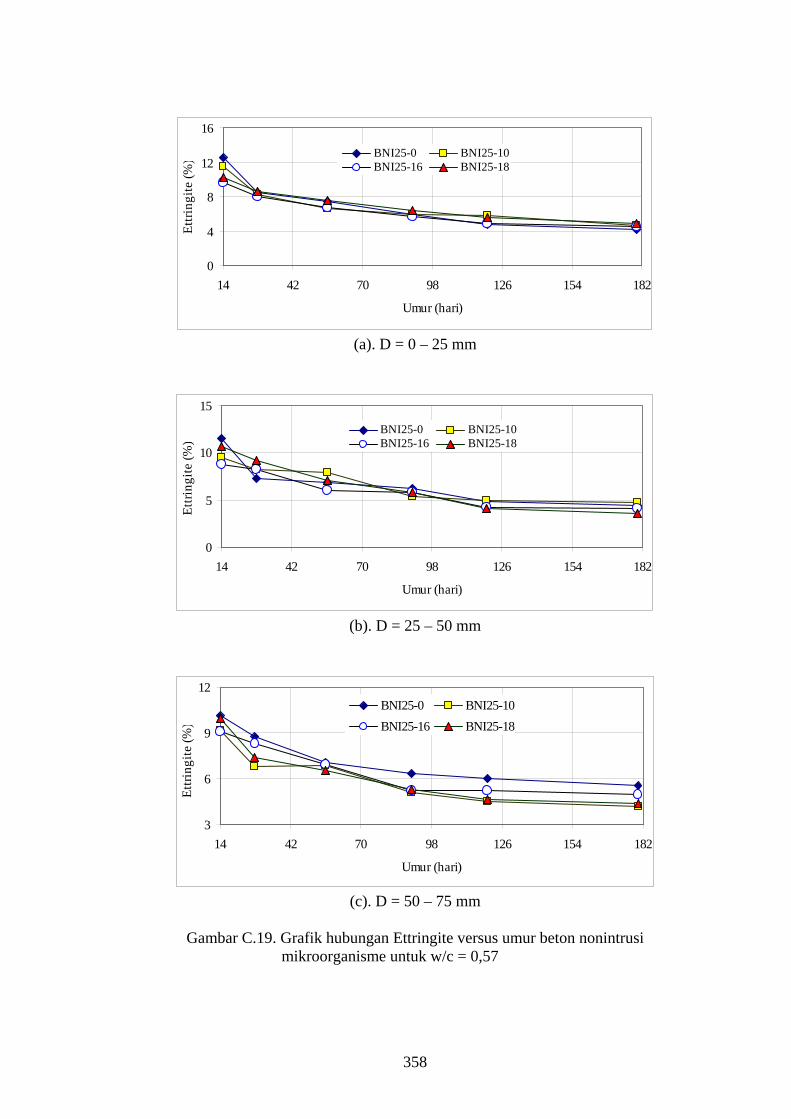
0
4
8
12
16
14 42 70 98 126 154 182
Umur (hari)
Ettri
ngite
(%) BNI25-0 BNI25-10
BNI25-16 BNI25-18
(a). D = 0 – 25 mm
0
5
10
15
14 42 70 98 126 154 182
Umur (hari)
Ettri
ngite
(%)
BNI25-0 BNI25-10BNI25-16 BNI25-18
(b). D = 25 – 50 mm
3
6
9
12
14 42 70 98 126 154 182
Umur (hari)
Ettri
ngite
(%)
BNI25-0 BNI25-10BNI25-16 BNI25-18
(c). D = 50 – 75 mm
Gambar C.19. Grafik hubungan Ettringite versus umur beton nonintrusi
mikroorganisme untuk w/c = 0,57
358
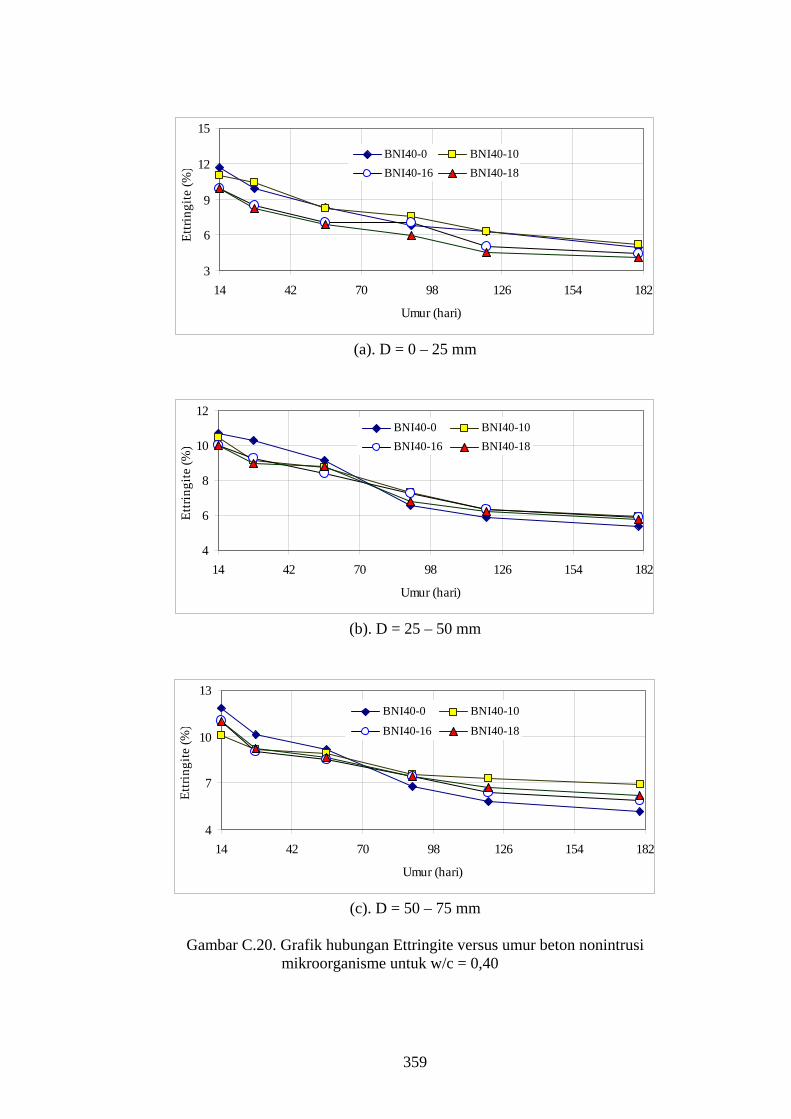
3
6
9
12
15
14 42 70 98 126 154 182
Umur (hari)
Ettri
ngite
(%)
BNI40-0 BNI40-10BNI40-16 BNI40-18
(a). D = 0 – 25 mm
4
6
8
10
12
14 42 70 98 126 154 182
Umur (hari)
Ettri
ngite
(%)
BNI40-0 BNI40-10BNI40-16 BNI40-18
(b). D = 25 – 50 mm
4
7
10
13
14 42 70 98 126 154 182
Umur (hari)
Ettri
ngite
(%)
BNI40-0 BNI40-10
BNI40-16 BNI40-18
(c). D = 50 – 75 mm
Gambar C.20. Grafik hubungan Ettringite versus umur beton nonintrusi
mikroorganisme untuk w/c = 0,40
359
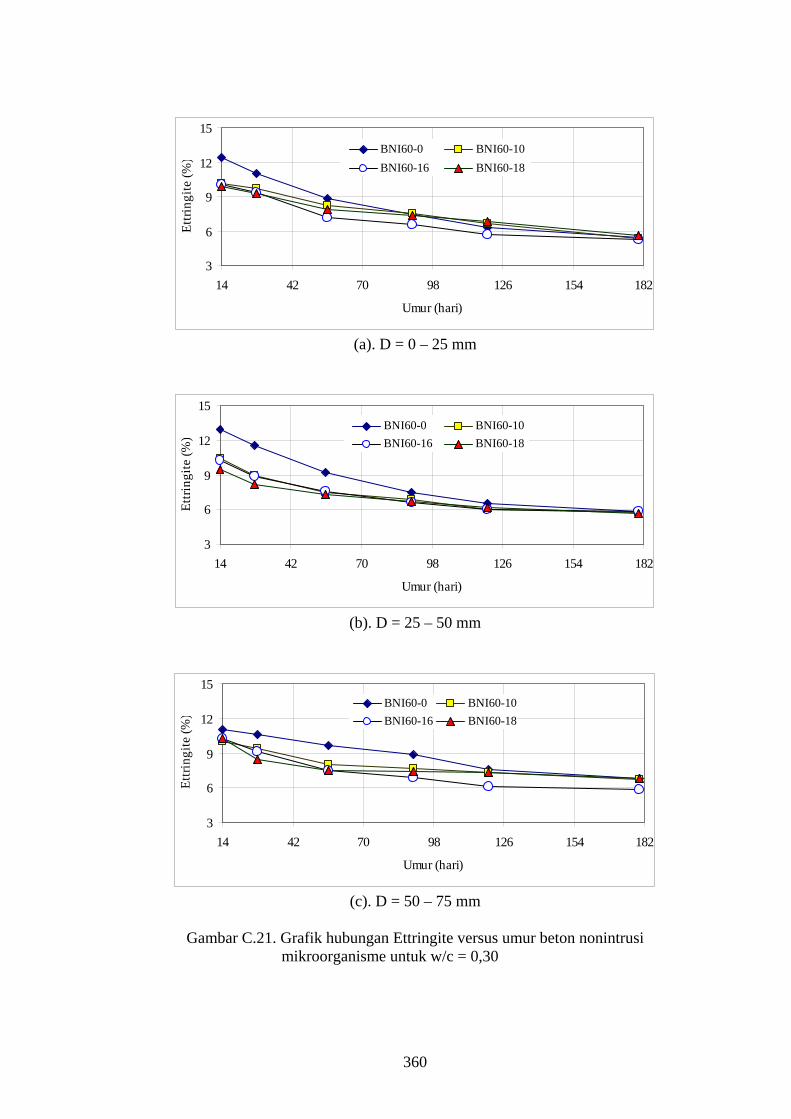
3
6
9
12
15
14 42 70 98 126 154 182
Umur (hari)
Ettri
ngite
(%)
BNI60-0 BNI60-10BNI60-16 BNI60-18
(a). D = 0 – 25 mm
3
6
9
12
15
14 42 70 98 126 154 182
Umur (hari)
Ettri
ngite
(%)
BNI60-0 BNI60-10BNI60-16 BNI60-18
(b). D = 25 – 50 mm
3
6
9
12
15
14 42 70 98 126 154 182
Umur (hari)
Ettri
ngite
(%)
BNI60-0 BNI60-10BNI60-16 BNI60-18
(c). D = 50 – 75 mm
Gambar C.21. Grafik hubungan Ettringite versus umur beton nonintrusi
mikroorganisme untuk w/c = 0,30
360

5
10
15
20
0 28 56 84 112 140 168
Lama intrusi (hari)
Ettri
ngite
(%)
BI25-0 BI25-10BI25-16 BI25-18
(a). D = 0 – 25 mm
0
5
10
15
20
0 28 56 84 112 140 168
Lama intrusi (hari)
Ettri
ngite
(%)
BI25-0 BI25-10BI25-16 BI25-18
(b). D = 25 – 50 mm
6
8
10
12
14
0 28 56 84 112 140 168
Lama intrusi (hari)
Ettri
ngite
(%)
BI25-0 BI25-10BI25-16 BI25-18
(c). D = 50 – 75 mm
Gambar C.22. Grafik hubungan Ettringite versus lama intrusi mikroorganisme
untuk beton w/c = 0,57
361
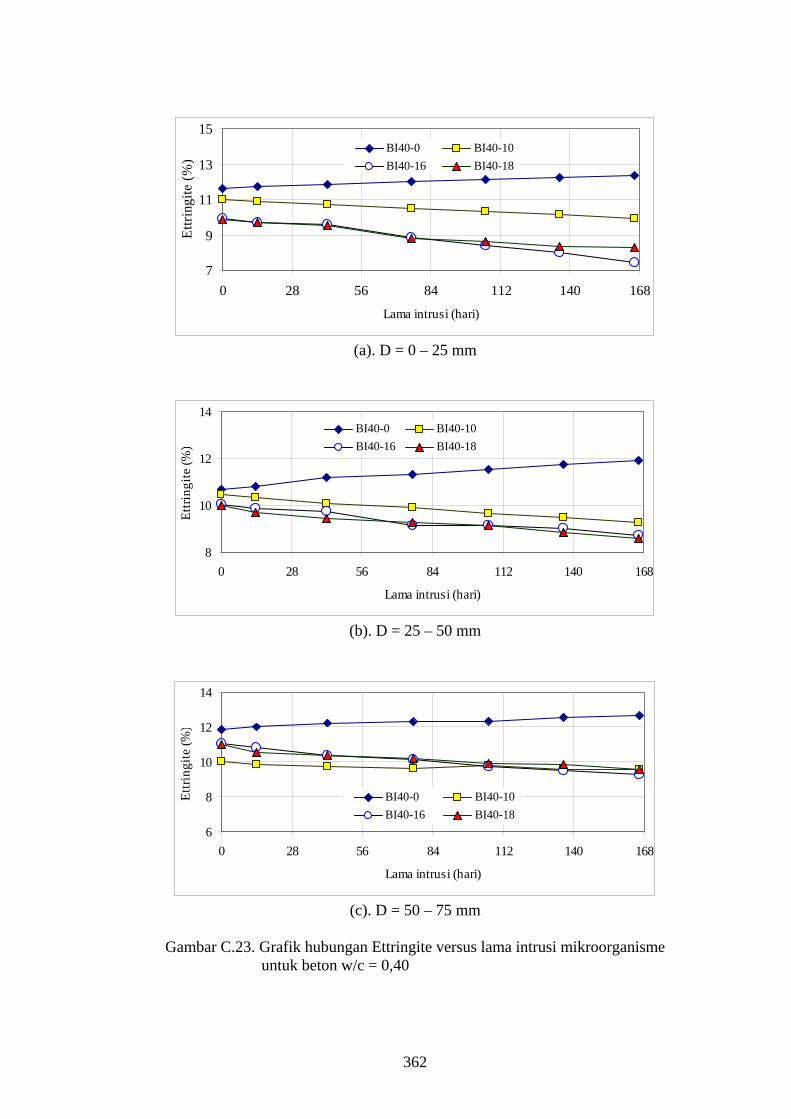
7
9
11
13
15
0 28 56 84 112 140 168
Lama intrusi (hari)
Ettri
ngite
(%)
BI40-0 BI40-10BI40-16 BI40-18
(a). D = 0 – 25 mm
8
10
12
14
0 28 56 84 112 140 168
Lama intrusi (hari)
Ettri
ngite
(%)
BI40-0 BI40-10BI40-16 BI40-18
(b). D = 25 – 50 mm
6
8
10
12
14
0 28 56 84 112 140 168
Lama intrusi (hari)
Ettri
ngite
(%)
BI40-0 BI40-10BI40-16 BI40-18
(c). D = 50 – 75 mm
Gambar C.23. Grafik hubungan Ettringite versus lama intrusi mikroorganisme
untuk beton w/c = 0,40
362

8
10
12
14
16
0 28 56 84 112 140 168
Lama intrusi (hari)
Ettri
ngite
(%)
BI60-0 BI60-10
BI60-16 BI60-18
(a). D = 0 – 25 mm
4
7
10
13
16
0 28 56 84 112 140 168
Lama intrusi (hari)
Ettri
ngite
(%)
BI60-0 BI60-10BI60-16 BI60-18
(b). D = 25 – 50 mm
8
10
12
14
0 28 56 84 112 140 168
Lama intrusi (hari)
Ettri
ngite
(%)
BI60-0 BI60-10BI60-16 BI60-18
(c). D = 50 – 75 mm
Gambar C.24. Grafik hubungan Ettringite versus lama intrusi mikroorganisme
untuk beton w/c = 0,30
363

Tabel C.1.a. Hasil identifikasi dan analisis senyawa kimia X-Ray Diffraction untuk beton nonintrusi mikroorganisme tanpa bubuk slag nikel (BNI25-0) pada kedalaman 0–25 mm
Kuat
tekan CH CSH Calc CMA E SiO2 Q A T R H(hari (MPa) (%) (%) (%) (%) (%) (%) (%) (%) (%) (%) (%)
1 14 18.30 26.0 44.2 6.3 7.4 12.5 0.0 0.0 0.0 3.6 0.0 0.02 28 22.08 28.2 48.8 5.1 7.2 8.5 0.0 0.0 0.0 2.2 0.0 0.03 56 27.77 29.1 52.1 4.2 5.2 7.4 0.0 0.0 0.0 1.9 0.0 0.04 90 28.49 30.1 55.0 3.6 3.8 5.9 0.0 0.0 0.0 1.6 0.0 0.05 120 28.83 31.0 56.6 3.3 2.9 4.8 0.0 0.0 0.0 1.4 0.0 0.06 180 29.98 31.4 57.9 2.8 2.5 4.2 0.0 0.0 0.0 1.2 0.0 0.0
UmurNoIdentifikasi X-Ray Diffraction
Tabel C.1.b. Hasil identifikasi dan analisis senyawa kimia X-Ray Diffraction untuk beton nonintrusi mikroorganisme tanpa bubuk slag nikel (BNI25-0) pada kedalaman 25–50 mm
Kuattekan CH CSH Calc CMA E SiO2 Q A T R H
(hari (MPa) (%) (%) (%) (%) (%) (%) (%) (%) (%) (%) (%)1 14 18.30 26.2 44.7 6.0 7.7 11.5 0.0 0.0 0.0 3.8 0.0 0.02 28 22.08 27.8 48.7 5.3 7.2 7.3 0.0 1.4 0.0 2.3 0.0 0.03 56 27.77 28.8 52.8 4.2 5.6 6.9 0.0 0.0 0.0 1.7 0.0 0.04 90 28.49 29.5 55.4 3.1 4.6 6.2 0.0 0.0 0.0 1.2 0.0 0.05 120 28.83 30.7 56.9 2.6 3.7 4.9 0.0 0.0 0.0 1.2 0.0 0.06 180 29.98 31.1 57.7 2.3 3.3 4.5 0.0 0.0 0.0 1.1 0.0 0.0
No UmurIdentifikasi X-Ray Diffraction
Tabel C.1.c. Hasil identifikasi dan analisis senyawa kimia X-Ray Diffraction untuk beton nonintrusi mikroorganisme tanpa bubuk slag nikel (BNI25-0) pada kedalaman 50–75 mm
Kuattekan CH CSH Calc CMA E SiO2 Q A T R H
(hari (MPa) (%) (%) (%) (%) (%) (%) (%) (%) (%) (%) (%)1 14 18.30 27.0 45.1 5.2 8.1 10.1 0.0 0.0 0.0 2.5 0.0 0.02 28 22.08 27.7 49.1 4.6 6.5 8.7 0.0 1.2 0.0 2.2 0.0 0.03 56 27.77 29.1 53.0 3.9 5.4 7.0 0.0 0.0 0.0 1.5 0.0 0.04 90 28.49 29.2 56.0 3.0 4.2 6.4 0.0 0.0 0.0 1.2 0.0 0.05 120 28.83 30.4 56.7 2.4 3.3 6.0 0.0 0.0 0.0 1.2 0.0 0.06 180 29.98 31.3 57.2 2.1 2.7 5.5 0.0 0.0 0.0 1.1 0.0 0.0
No UmurIdentifikasi X-Ray Diffraction
Tabel C.2.a. Hasil identifikasi dan analisis senyawa kimia X-Ray Diffraction untuk beton nonintrusi mikroorganisme dengan 16% bubuk slag nikel (BNI25-16) pada kedalaman 0–25 mm
Kuat
tekan CH CSH Calc CMA E SiO2 Q A T R H(hari (MPa) (%) (%) (%) (%) (%) (%) (%) (%) (%) (%) (%)
1 14 14.27 14.9 58.6 5.8 5.8 9.7 0.0 2.1 1.7 0.0 1.4 0.02 28 19.49 15.9 60.6 4.5 5.5 8.0 0.0 2.6 1.5 0.0 0.0 1.53 56 28.75 16.3 64.4 3.2 4.8 6.8 0.0 3.1 0.0 0.0 0.0 1.44 90 30.11 16.9 67.2 2.7 3.4 5.7 0.0 2.9 0.0 0.0 0.0 1.25 120 30.79 17.5 68.9 2.3 3.2 4.9 0.0 2.3 0.0 0.0 0.0 0.96 180 32.06 17.8 69.8 2.2 2.6 4.5 0.0 2.1 0.0 0.0 0.0 1.0
No UmurIdentifikasi X-Ray Diffraction
364
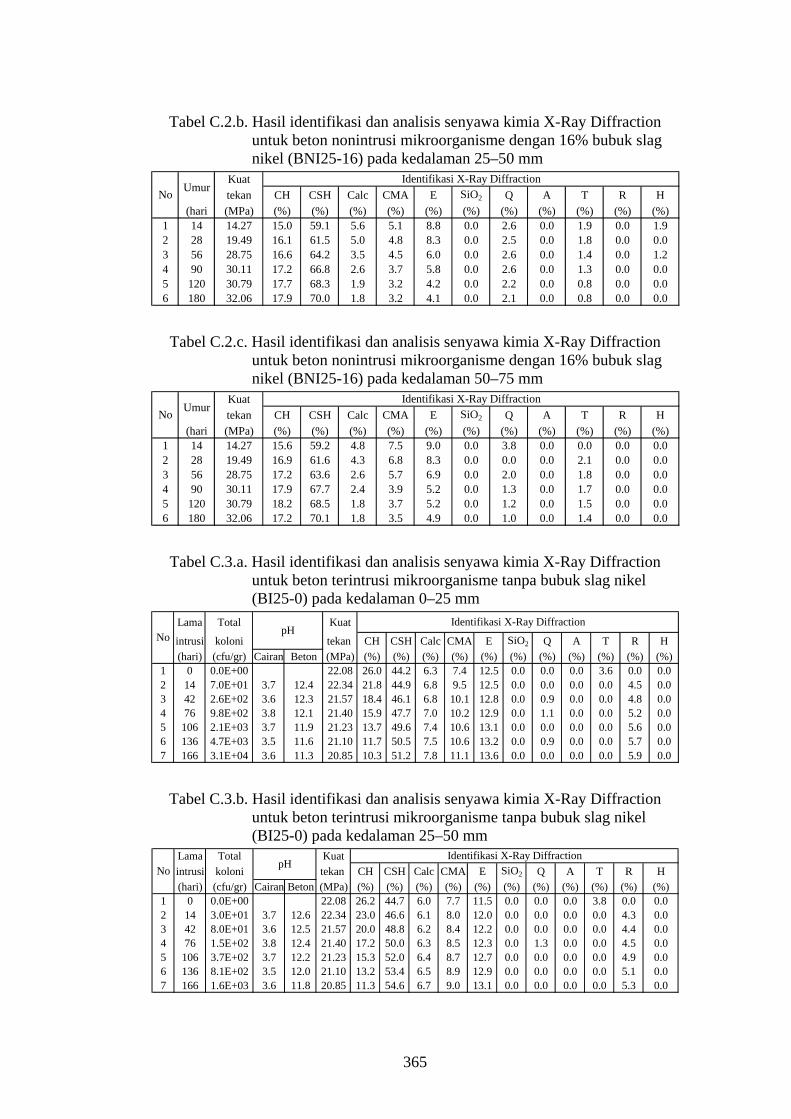
Tabel C.2.b. Hasil identifikasi dan analisis senyawa kimia X-Ray Diffraction untuk beton nonintrusi mikroorganisme dengan 16% bubuk slag nikel (BNI25-16) pada kedalaman 25–50 mm
Kuattekan CH CSH Calc CMA E SiO2 Q A T R H
(hari (MPa) (%) (%) (%) (%) (%) (%) (%) (%) (%) (%) (%)1 14 14.27 15.0 59.1 5.6 5.1 8.8 0.0 2.6 0.0 1.9 0.0 1.92 28 19.49 16.1 61.5 5.0 4.8 8.3 0.0 2.5 0.0 1.8 0.0 0.03 56 28.75 16.6 64.2 3.5 4.5 6.0 0.0 2.6 0.0 1.4 0.0 1.24 90 30.11 17.2 66.8 2.6 3.7 5.8 0.0 2.6 0.0 1.3 0.0 0.05 120 30.79 17.7 68.3 1.9 3.2 4.2 0.0 2.2 0.0 0.8 0.0 0.06 180 32.06 17.9 70.0 1.8 3.2 4.1 0.0 2.1 0.0 0.8 0.0 0.0
No UmurIdentifikasi X-Ray Diffraction
Tabel C.2.c. Hasil identifikasi dan analisis senyawa kimia X-Ray Diffraction untuk beton nonintrusi mikroorganisme dengan 16% bubuk slag nikel (BNI25-16) pada kedalaman 50–75 mm
Kuattekan CH CSH Calc CMA E SiO2 Q A T R H
(hari (MPa) (%) (%) (%) (%) (%) (%) (%) (%) (%) (%) (%)1 14 14.27 15.6 59.2 4.8 7.5 9.0 0.0 3.8 0.0 0.0 0.0 0.02 28 19.49 16.9 61.6 4.3 6.8 8.3 0.0 0.0 0.0 2.1 0.0 0.03 56 28.75 17.2 63.6 2.6 5.7 6.9 0.0 2.0 0.0 1.8 0.0 0.04 90 30.11 17.9 67.7 2.4 3.9 5.2 0.0 1.3 0.0 1.7 0.0 0.05 120 30.79 18.2 68.5 1.8 3.7 5.2 0.0 1.2 0.0 1.5 0.0 0.06 180 32.06 17.2 70.1 1.8 3.5 4.9 0.0 1.0 0.0 1.4 0.0 0.0
No UmurIdentifikasi X-Ray Diffraction
Tabel C.3.a. Hasil identifikasi dan analisis senyawa kimia X-Ray Diffraction untuk beton terintrusi mikroorganisme tanpa bubuk slag nikel (BI25-0) pada kedalaman 0–25 mm
Lama Total Kuat
intrusi koloni tekan CH CSH Calc CMA E SiO2 Q A T R H(hari) (cfu/gr) Cairan Beton (MPa) (%) (%) (%) (%) (%) (%) (%) (%) (%) (%) (%)
1 0 0.0E+00 22.08 26.0 44.2 6.3 7.4 12.5 0.0 0.0 0.0 3.6 0.0 0.02 14 7.0E+01 3.7 12.4 22.34 21.8 44.9 6.8 9.5 12.5 0.0 0.0 0.0 0.0 4.5 0.03 42 2.6E+02 3.6 12.3 21.57 18.4 46.1 6.8 10.1 12.8 0.0 0.9 0.0 0.0 4.8 0.04 76 9.8E+02 3.8 12.1 21.40 15.9 47.7 7.0 10.2 12.9 0.0 1.1 0.0 0.0 5.2 0.05 106 2.1E+03 3.7 11.9 21.23 13.7 49.6 7.4 10.6 13.1 0.0 0.0 0.0 0.0 5.6 0.06 136 4.7E+03 3.5 11.6 21.10 11.7 50.5 7.5 10.6 13.2 0.0 0.9 0.0 0.0 5.7 0.07 166 3.1E+04 3.6 11.3 20.85 10.3 51.2 7.8 11.1 13.6 0.0 0.0 0.0 0.0 5.9 0.0
Identifikasi X-Ray DiffractionNo pH
Tabel C.3.b. Hasil identifikasi dan analisis senyawa kimia X-Ray Diffraction untuk beton terintrusi mikroorganisme tanpa bubuk slag nikel (BI25-0) pada kedalaman 25–50 mm
Lama Total Kuatintrusi koloni tekan CH CSH Calc CMA E SiO2 Q A T R H(hari) (cfu/gr) Cairan Beton (MPa) (%) (%) (%) (%) (%) (%) (%) (%) (%) (%) (%)
1 0 0.0E+00 22.08 26.2 44.7 6.0 7.7 11.5 0.0 0.0 0.0 3.8 0.0 0.02 14 3.0E+01 3.7 12.6 22.34 23.0 46.6 6.1 8.0 12.0 0.0 0.0 0.0 0.0 4.3 0.03 42 8.0E+01 3.6 12.5 21.57 20.0 48.8 6.2 8.4 12.2 0.0 0.0 0.0 0.0 4.4 0.04 76 1.5E+02 3.8 12.4 21.40 17.2 50.0 6.3 8.5 12.3 0.0 1.3 0.0 0.0 4.5 0.05 106 3.7E+02 3.7 12.2 21.23 15.3 52.0 6.4 8.7 12.7 0.0 0.0 0.0 0.0 4.9 0.06 136 8.1E+02 3.5 12.0 21.10 13.2 53.4 6.5 8.9 12.9 0.0 0.0 0.0 0.0 5.1 0.07 166 1.6E+03 3.6 11.8 20.85 11.3 54.6 6.7 9.0 13.1 0.0 0.0 0.0 0.0 5.3 0.0
No pHIdentifikasi X-Ray Diffraction
365
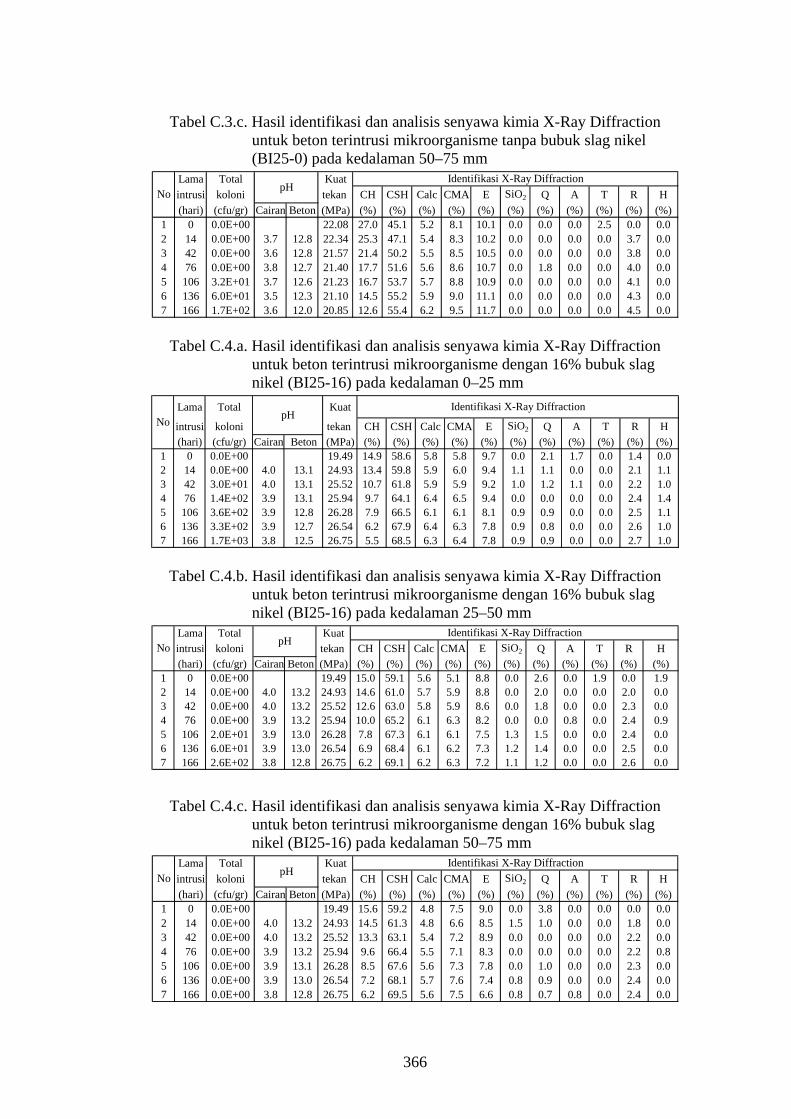
Tabel C.3.c. Hasil identifikasi dan analisis senyawa kimia X-Ray Diffraction untuk beton terintrusi mikroorganisme tanpa bubuk slag nikel (BI25-0) pada kedalaman 50–75 mm
Lama Total Kuatintrusi koloni tekan CH CSH Calc CMA E SiO2 Q A T R H(hari) (cfu/gr) Cairan Beton (MPa) (%) (%) (%) (%) (%) (%) (%) (%) (%) (%) (%)
1 0 0.0E+00 22.08 27.0 45.1 5.2 8.1 10.1 0.0 0.0 0.0 2.5 0.0 0.02 14 0.0E+00 3.7 12.8 22.34 25.3 47.1 5.4 8.3 10.2 0.0 0.0 0.0 0.0 3.7 0.03 42 0.0E+00 3.6 12.8 21.57 21.4 50.2 5.5 8.5 10.5 0.0 0.0 0.0 0.0 3.8 0.04 76 0.0E+00 3.8 12.7 21.40 17.7 51.6 5.6 8.6 10.7 0.0 1.8 0.0 0.0 4.0 0.05 106 3.2E+01 3.7 12.6 21.23 16.7 53.7 5.7 8.8 10.9 0.0 0.0 0.0 0.0 4.1 0.06 136 6.0E+01 3.5 12.3 21.10 14.5 55.2 5.9 9.0 11.1 0.0 0.0 0.0 0.0 4.3 0.07 166 1.7E+02 3.6 12.0 20.85 12.6 55.4 6.2 9.5 11.7 0.0 0.0 0.0 0.0 4.5 0.0
No pHIdentifikasi X-Ray Diffraction
Tabel C.4.a. Hasil identifikasi dan analisis senyawa kimia X-Ray Diffraction untuk beton terintrusi mikroorganisme dengan 16% bubuk slag nikel (BI25-16) pada kedalaman 0–25 mm
Lama Total Kuat
intrusi koloni tekan CH CSH Calc CMA E SiO2 Q A T R H(hari) (cfu/gr) Cairan Beton (MPa) (%) (%) (%) (%) (%) (%) (%) (%) (%) (%) (%)
1 0 0.0E+00 19.49 14.9 58.6 5.8 5.8 9.7 0.0 2.1 1.7 0.0 1.4 0.02 14 0.0E+00 4.0 13.1 24.93 13.4 59.8 5.9 6.0 9.4 1.1 1.1 0.0 0.0 2.1 1.13 42 3.0E+01 4.0 13.1 25.52 10.7 61.8 5.9 5.9 9.2 1.0 1.2 1.1 0.0 2.2 1.04 76 1.4E+02 3.9 13.1 25.94 9.7 64.1 6.4 6.5 9.4 0.0 0.0 0.0 0.0 2.4 1.45 106 3.6E+02 3.9 12.8 26.28 7.9 66.5 6.1 6.1 8.1 0.9 0.9 0.0 0.0 2.5 1.16 136 3.3E+02 3.9 12.7 26.54 6.2 67.9 6.4 6.3 7.8 0.9 0.8 0.0 0.0 2.6 1.07 166 1.7E+03 3.8 12.5 26.75 5.5 68.5 6.3 6.4 7.8 0.9 0.9 0.0 0.0 2.7 1.0
pHIdentifikasi X-Ray Diffraction
No
Tabel C.4.b. Hasil identifikasi dan analisis senyawa kimia X-Ray Diffraction untuk beton terintrusi mikroorganisme dengan 16% bubuk slag nikel (BI25-16) pada kedalaman 25–50 mm
Lama Total Kuatintrusi koloni tekan CH CSH Calc CMA E SiO2 Q A T R H(hari) (cfu/gr) Cairan Beton (MPa) (%) (%) (%) (%) (%) (%) (%) (%) (%) (%) (%)
1 0 0.0E+00 19.49 15.0 59.1 5.6 5.1 8.8 0.0 2.6 0.0 1.9 0.0 1.92 14 0.0E+00 4.0 13.2 24.93 14.6 61.0 5.7 5.9 8.8 0.0 2.0 0.0 0.0 2.0 0.03 42 0.0E+00 4.0 13.2 25.52 12.6 63.0 5.8 5.9 8.6 0.0 1.8 0.0 0.0 2.3 0.04 76 0.0E+00 3.9 13.2 25.94 10.0 65.2 6.1 6.3 8.2 0.0 0.0 0.8 0.0 2.4 0.95 106 2.0E+01 3.9 13.0 26.28 7.8 67.3 6.1 6.1 7.5 1.3 1.5 0.0 0.0 2.4 0.06 136 6.0E+01 3.9 13.0 26.54 6.9 68.4 6.1 6.2 7.3 1.2 1.4 0.0 0.0 2.5 0.07 166 2.6E+02 3.8 12.8 26.75 6.2 69.1 6.2 6.3 7.2 1.1 1.2 0.0 0.0 2.6 0.0
No pHIdentifikasi X-Ray Diffraction
Tabel C.4.c. Hasil identifikasi dan analisis senyawa kimia X-Ray Diffraction untuk beton terintrusi mikroorganisme dengan 16% bubuk slag nikel (BI25-16) pada kedalaman 50–75 mm
Lama Total Kuatintrusi koloni tekan CH CSH Calc CMA E SiO2 Q A T R H(hari) (cfu/gr) Cairan Beton (MPa) (%) (%) (%) (%) (%) (%) (%) (%) (%) (%) (%)
1 0 0.0E+00 19.49 15.6 59.2 4.8 7.5 9.0 0.0 3.8 0.0 0.0 0.0 0.02 14 0.0E+00 4.0 13.2 24.93 14.5 61.3 4.8 6.6 8.5 1.5 1.0 0.0 0.0 1.8 0.03 42 0.0E+00 4.0 13.2 25.52 13.3 63.1 5.4 7.2 8.9 0.0 0.0 0.0 0.0 2.2 0.04 76 0.0E+00 3.9 13.2 25.94 9.6 66.4 5.5 7.1 8.3 0.0 0.0 0.0 0.0 2.2 0.85 106 0.0E+00 3.9 13.1 26.28 8.5 67.6 5.6 7.3 7.8 0.0 1.0 0.0 0.0 2.3 0.06 136 0.0E+00 3.9 13.0 26.54 7.2 68.1 5.7 7.6 7.4 0.8 0.9 0.0 0.0 2.4 0.07 166 0.0E+00 3.8 12.8 26.75 6.2 69.5 5.6 7.5 6.6 0.8 0.7 0.8 0.0 2.4 0.0
No pHIdentifikasi X-Ray Diffraction
366

Tabel C.5.a. Hasil identifikasi dan analisis senyawa kimia X-Ray Diffraction untuk beton nonintrusi mikroorganisme tanpa bubuk slag nikel (BNI40-0) pada kedalaman 0–25 mm
Kuattekan CH CSH Calc CMA E SiO2 Q A T R H
(hari (MPa) (%) (%) (%) (%) (%) (%) (%) (%) (%) (%) (%)1 14 28.41 24.5 45.7 6.0 6.9 11.6 0.0 5.2 0.0 0.0 0.0 0.02 28 33.59 27.7 49.3 4.6 5.1 9.9 0.0 3.5 0.0 0.0 0.0 0.03 56 41.23 28.8 52.4 3.7 4.5 8.3 0.0 2.4 0.0 0.0 0.0 0.04 90 43.01 29.2 55.5 2.8 3.7 6.8 0.0 1.9 0.0 0.0 0.0 0.05 120 43.14 29.8 56.8 2.5 3.3 6.3 0.0 1.4 0.0 0.0 0.0 0.06 180 44.54 30.2 58.3 2.2 3.1 5.0 0.0 1.2 0.0 0.0 0.0 0.0
UmurIdentifikasi X-Ray Diffraction
No
Tabel C.5.b. Hasil identifikasi dan analisis senyawa kimia X-Ray Diffraction untuk beton nonintrusi mikroorganisme tanpa bubuk slag nikel (BNI40-0) pada kedalaman 25–50 mm
Kuattekan CH CSH Calc CMA E SiO2 Q A T R H
(hari (MPa) (%) (%) (%) (%) (%) (%) (%) (%) (%) (%) (%)1 14 28.41 25.2 46.9 5.5 6.6 10.7 0.0 5.1 0.0 0.0 0.0 0.02 28 33.59 28.2 49.4 4.0 6.1 10.3 0.0 1.9 0.0 0.0 0.0 0.03 56 41.23 28.6 52.7 3.1 4.7 9.2 0.0 1.6 0.0 0.0 0.0 0.04 90 43.01 29.0 56.2 2.3 3.8 6.6 0.0 1.0 0.0 0.0 1.1 0.05 120 43.14 29.5 57.0 2.0 3.5 5.9 0.0 0.9 0.0 0.0 1.1 0.06 180 44.54 29.7 57.8 1.9 3.3 5.4 0.0 0.8 0.0 0.0 1.1 0.0
UmurIdentifikasi X-Ray Diffraction
No
Tabel C.5.c. Hasil identifikasi dan analisis senyawa kimia X-Ray Diffraction untuk beton nonintrusi mikroorganisme tanpa bubuk slag nikel (BNI40-0) pada kedalaman 50–75 mm
Kuattekan CH CSH Calc CMA E SiO2 Q A T R H
(hari (MPa) (%) (%) (%) (%) (%) (%) (%) (%) (%) (%) (%)1 14 28.41 25.9 46.7 5.2 8.6 11.8 0.0 1.8 0.0 0.0 0.0 0.02 28 33.59 28.0 50.1 3.8 5.8 10.1 0.0 1.1 0.0 0.0 1.1 0.03 56 41.23 29.1 53.3 2.9 5.6 9.1 0.0 0.0 0.0 0.0 0.0 0.04 90 43.01 29.2 56.7 2.0 3.8 6.8 0.0 0.7 0.0 0.0 0.7 0.05 120 43.14 29.7 57.6 1.9 3.7 5.8 0.0 0.7 0.0 0.0 0.7 0.06 180 44.54 30.0 58.0 1.8 3.5 5.2 0.0 0.7 0.0 0.0 0.7 0.0
No UmurIdentifikasi X-Ray Diffraction
Tabel C.6.a. Hasil identifikasi dan analisis senyawa kimia X-Ray Diffraction untuk beton nonintrusi mikroorganisme dengan 16% bubuk slag nikel (BNI40-16) pada kedalaman 0–25 mm
Kuattekan CH CSH Calc CMA E SiO2 Q A T R H
(hari (MPa) (%) (%) (%) (%) (%) (%) (%) (%) (%) (%) (%)1 14 23.82 15.3 59.4 5.2 8.5 9.9 0.0 0.0 1.9 0.0 0.0 0.02 28 32.78 15.7 61.3 4.1 7.4 8.4 1.7 1.3 0.0 0.0 0.0 0.03 56 42.17 16.4 66.1 3.2 5.7 7.1 1.6 0.0 0.0 0.0 0.0 0.04 90 44.37 17.0 67.9 2.9 3.9 7.0 1.4 0.0 0.0 0.0 0.0 0.05 120 45.39 17.9 70.3 2.4 3.2 5.0 1.2 0.0 0.0 0.0 0.0 0.06 180 47.18 18.4 71.0 2.2 2.9 4.4 1.1 0.0 0.0 0.0 0.0 0.0
No UmurIdentifikasi X-Ray Diffraction
367

Tabel C.6.b. Hasil identifikasi dan analisis senyawa kimia X-Ray Diffraction untuk beton nonintrusi mikroorganisme dengan 16% bubuk slag nikel (BNI40-16) pada kedalaman 25–50 mm
Kuattekan CH CSH Calc CMA E SiO2 Q A T R H
(hari (MPa) (%) (%) (%) (%) (%) (%) (%) (%) (%) (%) (%)1 14 23.82 15.9 59.8 4.7 7.7 10.0 0.0 0.0 1.9 0.0 0.0 0.02 28 32.78 16.4 61.8 3.8 7.3 9.3 1.5 0.0 0.0 0.0 0.0 0.03 56 42.17 16.7 65.5 3.0 6.3 8.4 0.0 0.0 0.0 0.0 0.0 0.04 90 44.37 17.1 67.3 2.9 4.3 7.3 1.2 0.0 0.0 0.0 0.0 0.05 120 45.39 17.5 69.2 2.3 3.5 6.4 1.0 0.0 0.0 0.0 0.0 0.06 180 47.18 18.0 70.7 2.2 3.2 5.9 0.0 0.0 0.0 0.0 0.0 0.0
UmurIdentifikasi X-Ray Diffraction
No
Tabel C.6.c. Hasil identifikasi dan analisis senyawa kimia X-Ray Diffraction untuk beton nonintrusi mikroorganisme dengan 16% bubuk slag nikel (BNI40-16) pada kedalaman 50–75 mm
Kuattekan CH CSH Calc CMA E SiO2 Q A T R H
(hari (MPa) (%) (%) (%) (%) (%) (%) (%) (%) (%) (%) (%)1 14 23.82 16.4 60.3 4.2 8.0 11.0 0.0 0.0 0.0 0.0 0.0 0.02 28 32.78 16.9 62.2 3.5 6.8 9.0 1.6 0.0 0.0 0.0 0.0 0.03 56 42.17 17.3 65.5 2.9 5.8 8.5 0.0 0.0 0.0 0.0 0.0 0.04 90 44.37 17.8 66.1 2.6 5.0 7.4 1.0 0.0 0.0 0.0 0.0 0.05 120 45.39 18.0 68.2 2.0 4.3 6.4 1.0 0.0 0.0 0.0 0.0 0.06 180 47.18 18.8 70.1 2.0 3.3 5.9 0.0 0.0 0.0 0.0 0.0 0.0
No UmurIdentifikasi X-Ray Diffraction
Tabel C.7.a. Hasil identifikasi dan analisis senyawa kimia X-Ray Diffraction untuk beton terintrusi mikroorganisme tanpa bubuk slag nikel (BI40-0) pada kedalaman 0–25 mm
Lama Total Kuatintrusi koloni tekan CH CSH Calc CMA E SiO2 Q A T R H(hari) (cfu) Cairan Beton (MPa) (%) (%) (%) (%) (%) (%) (%) (%) (%) (%) (%)
1 0 0.0E+00 33.59 24.5 45.7 6.0 6.9 11.6 0.0 5.2 0.0 0.0 0.0 0.02 14 5.2E+01 3.8 12.63 34.69 20.8 47.6 6.3 7.9 11.7 0.0 1.9 0.0 0.0 3.8 0.03 42 1.1E+02 3.8 12.52 34.48 16.9 50.6 6.5 8.0 11.9 0.0 2.2 0.0 0.0 3.9 0.04 76 4.0E+02 3.7 12.34 34.23 15.7 53.7 6.6 8.1 12.0 0.0 0.0 0.0 0.0 3.9 0.05 106 9.0E+02 3.7 12.08 34.06 12.6 54.2 6.7 8.3 12.1 0.0 2.1 0.0 0.0 3.9 0.06 136 4.5E+03 3.6 11.85 33.84 10.3 55.5 6.8 8.4 12.2 0.0 2.0 0.8 0.0 4.0 0.07 166 1.0E+04 3.5 11.68 33.67 9.4 56.2 6.9 8.5 12.3 0.0 1.1 0.8 0.0 4.1 0.6
No pHIdentifikasi X-Ray Diffraction
Tabel C.7.b. Hasil identifikasi dan analisis senyawa kimia X-Ray Diffraction untuk beton terintrusi mikroorganisme tanpa bubuk slag nikel (BI40-0) pada kedalaman 25–50 mm
Lama Total Kuatintrusi koloni tekan CH CSH Calc CMA E SiO2 Q A T R H(hari) (cfu) Cairan Beton (MPa) (%) (%) (%) (%) (%) (%) (%) (%) (%) (%) (%)
1 0 0.0E+00 33.59 25.2 46.9 5.5 6.6 10.7 0.0 5.1 0.0 0.0 0.0 0.02 14 1.8E+01 3.8 12.7 34.69 22.3 48.4 5.7 6.7 10.8 0.0 2.7 0.0 0.0 3.4 0.03 42 2.5E+01 3.8 12.6 34.48 19.1 51.0 6.0 7.0 11.2 0.0 2.3 0.0 0.0 3.5 0.04 76 7.0E+01 3.7 12.5 34.23 17.5 54.4 6.1 7.2 11.3 0.0 0.0 0.0 0.0 3.6 0.05 106 1.6E+02 3.7 12.4 34.06 14.4 54.9 6.2 7.4 11.5 0.0 1.9 0.0 0.0 3.7 0.06 136 4.5E+02 3.6 12.2 33.84 12.4 56.1 6.4 7.7 11.8 0.0 1.9 0.0 0.0 3.8 0.07 166 1.0E+03 3.5 12.1 33.67 10.3 56.9 6.5 7.7 11.9 0.0 1.7 0.0 0.0 3.9 1.2
No pHIdentifikasi X-Ray Diffraction
368
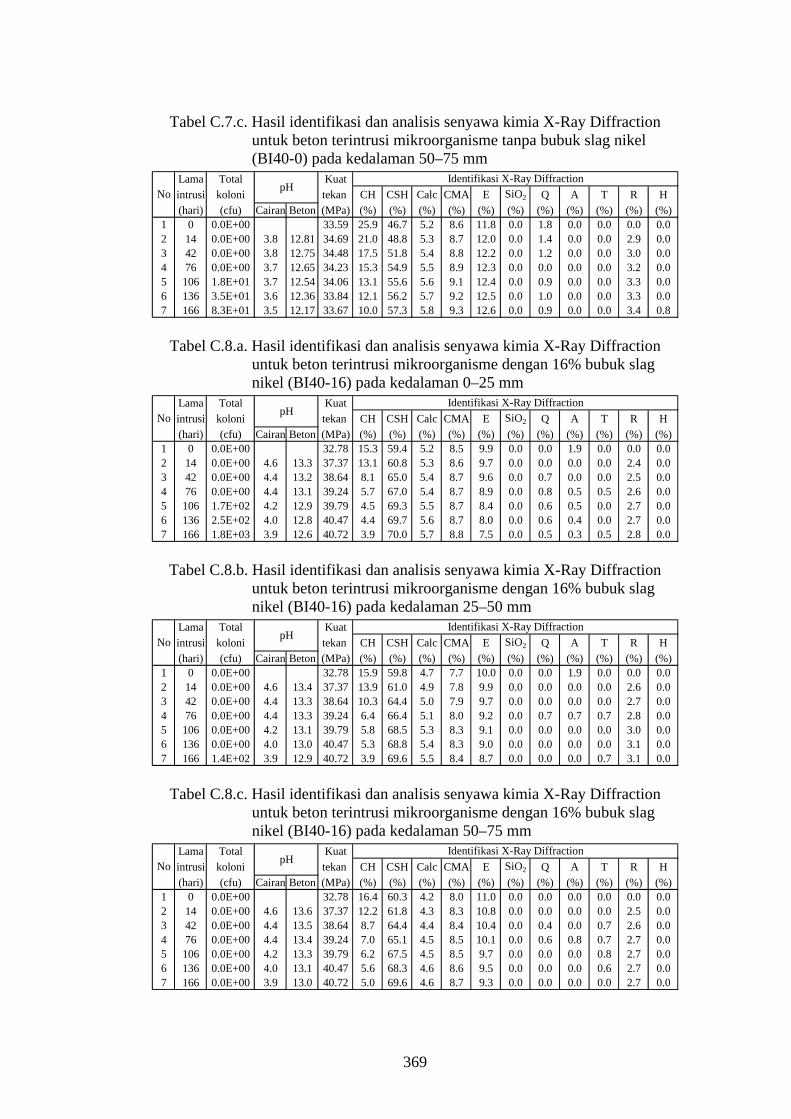
Tabel C.7.c. Hasil identifikasi dan analisis senyawa kimia X-Ray Diffraction untuk beton terintrusi mikroorganisme tanpa bubuk slag nikel (BI40-0) pada kedalaman 50–75 mm
Lama Total Kuatintrusi koloni tekan CH CSH Calc CMA E SiO2 Q A T R H(hari) (cfu) Cairan Beton (MPa) (%) (%) (%) (%) (%) (%) (%) (%) (%) (%) (%)
1 0 0.0E+00 33.59 25.9 46.7 5.2 8.6 11.8 0.0 1.8 0.0 0.0 0.0 0.02 14 0.0E+00 3.8 12.81 34.69 21.0 48.8 5.3 8.7 12.0 0.0 1.4 0.0 0.0 2.9 0.03 42 0.0E+00 3.8 12.75 34.48 17.5 51.8 5.4 8.8 12.2 0.0 1.2 0.0 0.0 3.0 0.04 76 0.0E+00 3.7 12.65 34.23 15.3 54.9 5.5 8.9 12.3 0.0 0.0 0.0 0.0 3.2 0.05 106 1.8E+01 3.7 12.54 34.06 13.1 55.6 5.6 9.1 12.4 0.0 0.9 0.0 0.0 3.3 0.06 136 3.5E+01 3.6 12.36 33.84 12.1 56.2 5.7 9.2 12.5 0.0 1.0 0.0 0.0 3.3 0.07 166 8.3E+01 3.5 12.17 33.67 10.0 57.3 5.8 9.3 12.6 0.0 0.9 0.0 0.0 3.4 0.8
No pHIdentifikasi X-Ray Diffraction
Tabel C.8.a. Hasil identifikasi dan analisis senyawa kimia X-Ray Diffraction untuk beton terintrusi mikroorganisme dengan 16% bubuk slag nikel (BI40-16) pada kedalaman 0–25 mm
Lama Total Kuatintrusi koloni tekan CH CSH Calc CMA E SiO2 Q A T R H(hari) (cfu) Cairan Beton (MPa) (%) (%) (%) (%) (%) (%) (%) (%) (%) (%) (%)
1 0 0.0E+00 32.78 15.3 59.4 5.2 8.5 9.9 0.0 0.0 1.9 0.0 0.0 0.02 14 0.0E+00 4.6 13.3 37.37 13.1 60.8 5.3 8.6 9.7 0.0 0.0 0.0 0.0 2.4 0.03 42 0.0E+00 4.4 13.2 38.64 8.1 65.0 5.4 8.7 9.6 0.0 0.7 0.0 0.0 2.5 0.04 76 0.0E+00 4.4 13.1 39.24 5.7 67.0 5.4 8.7 8.9 0.0 0.8 0.5 0.5 2.6 0.05 106 1.7E+02 4.2 12.9 39.79 4.5 69.3 5.5 8.7 8.4 0.0 0.6 0.5 0.0 2.7 0.06 136 2.5E+02 4.0 12.8 40.47 4.4 69.7 5.6 8.7 8.0 0.0 0.6 0.4 0.0 2.7 0.07 166 1.8E+03 3.9 12.6 40.72 3.9 70.0 5.7 8.8 7.5 0.0 0.5 0.3 0.5 2.8 0.0
No pHIdentifikasi X-Ray Diffraction
Tabel C.8.b. Hasil identifikasi dan analisis senyawa kimia X-Ray Diffraction untuk beton terintrusi mikroorganisme dengan 16% bubuk slag nikel (BI40-16) pada kedalaman 25–50 mm
Lama Total Kuatintrusi koloni tekan CH CSH Calc CMA E SiO2 Q A T R H(hari) (cfu) Cairan Beton (MPa) (%) (%) (%) (%) (%) (%) (%) (%) (%) (%) (%)
1 0 0.0E+00 32.78 15.9 59.8 4.7 7.7 10.0 0.0 0.0 1.9 0.0 0.0 0.02 14 0.0E+00 4.6 13.4 37.37 13.9 61.0 4.9 7.8 9.9 0.0 0.0 0.0 0.0 2.6 0.03 42 0.0E+00 4.4 13.3 38.64 10.3 64.4 5.0 7.9 9.7 0.0 0.0 0.0 0.0 2.7 0.04 76 0.0E+00 4.4 13.3 39.24 6.4 66.4 5.1 8.0 9.2 0.0 0.7 0.7 0.7 2.8 0.05 106 0.0E+00 4.2 13.1 39.79 5.8 68.5 5.3 8.3 9.1 0.0 0.0 0.0 0.0 3.0 0.06 136 0.0E+00 4.0 13.0 40.47 5.3 68.8 5.4 8.3 9.0 0.0 0.0 0.0 0.0 3.1 0.07 166 1.4E+02 3.9 12.9 40.72 3.9 69.6 5.5 8.4 8.7 0.0 0.0 0.0 0.7 3.1 0.0
No pHIdentifikasi X-Ray Diffraction
Tabel C.8.c. Hasil identifikasi dan analisis senyawa kimia X-Ray Diffraction untuk beton terintrusi mikroorganisme dengan 16% bubuk slag nikel (BI40-16) pada kedalaman 50–75 mm
Lama Total Kuatintrusi koloni tekan CH CSH Calc CMA E SiO2 Q A T R H(hari) (cfu) Cairan Beton (MPa) (%) (%) (%) (%) (%) (%) (%) (%) (%) (%) (%)
1 0 0.0E+00 32.78 16.4 60.3 4.2 8.0 11.0 0.0 0.0 0.0 0.0 0.0 0.02 14 0.0E+00 4.6 13.6 37.37 12.2 61.8 4.3 8.3 10.8 0.0 0.0 0.0 0.0 2.5 0.03 42 0.0E+00 4.4 13.5 38.64 8.7 64.4 4.4 8.4 10.4 0.0 0.4 0.0 0.7 2.6 0.04 76 0.0E+00 4.4 13.4 39.24 7.0 65.1 4.5 8.5 10.1 0.0 0.6 0.8 0.7 2.7 0.05 106 0.0E+00 4.2 13.3 39.79 6.2 67.5 4.5 8.5 9.7 0.0 0.0 0.0 0.8 2.7 0.06 136 0.0E+00 4.0 13.1 40.47 5.6 68.3 4.6 8.6 9.5 0.0 0.0 0.0 0.6 2.7 0.07 166 0.0E+00 3.9 13.0 40.72 5.0 69.6 4.6 8.7 9.3 0.0 0.0 0.0 0.0 2.7 0.0
No pHIdentifikasi X-Ray Diffraction
369
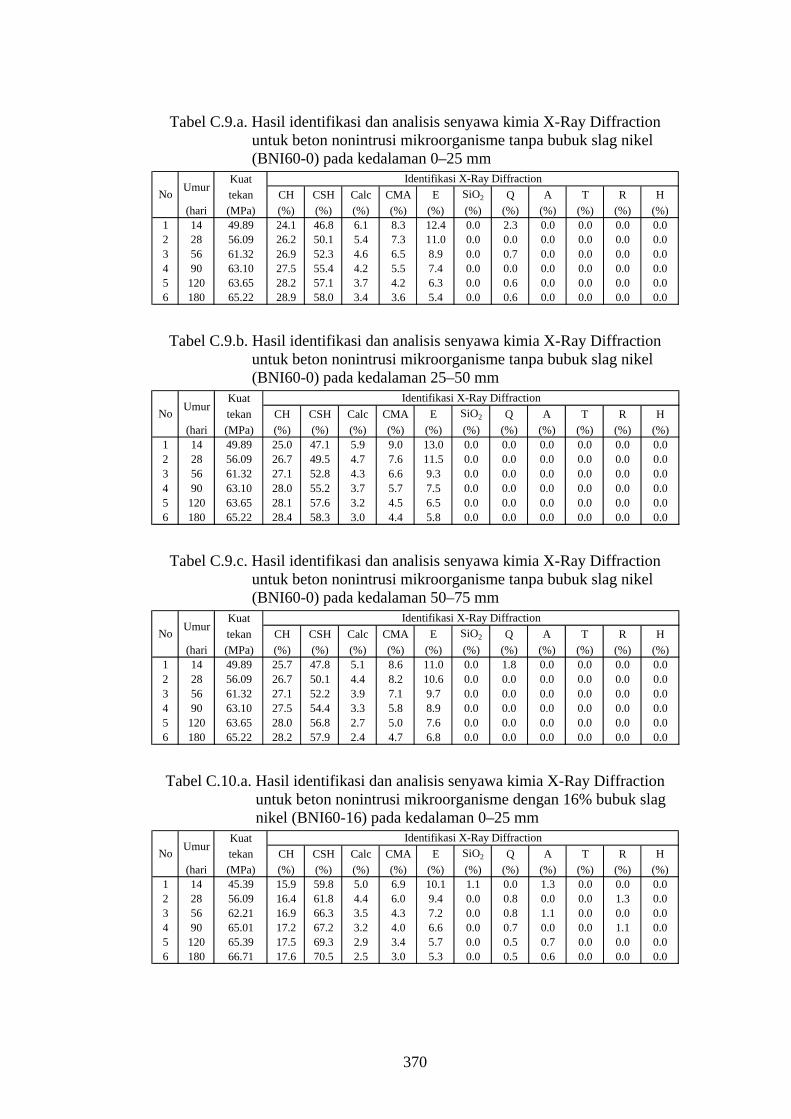
Tabel C.9.a. Hasil identifikasi dan analisis senyawa kimia X-Ray Diffraction untuk beton nonintrusi mikroorganisme tanpa bubuk slag nikel (BNI60-0) pada kedalaman 0–25 mm
Kuattekan CH CSH Calc CMA E SiO2 Q A T R H
(hari (MPa) (%) (%) (%) (%) (%) (%) (%) (%) (%) (%) (%)1 14 49.89 24.1 46.8 6.1 8.3 12.4 0.0 2.3 0.0 0.0 0.0 0.02 28 56.09 26.2 50.1 5.4 7.3 11.0 0.0 0.0 0.0 0.0 0.0 0.03 56 61.32 26.9 52.3 4.6 6.5 8.9 0.0 0.7 0.0 0.0 0.0 0.04 90 63.10 27.5 55.4 4.2 5.5 7.4 0.0 0.0 0.0 0.0 0.0 0.05 120 63.65 28.2 57.1 3.7 4.2 6.3 0.0 0.6 0.0 0.0 0.0 0.06 180 65.22 28.9 58.0 3.4 3.6 5.4 0.0 0.6 0.0 0.0 0.0 0.0
No UmurIdentifikasi X-Ray Diffraction
Tabel C.9.b. Hasil identifikasi dan analisis senyawa kimia X-Ray Diffraction untuk beton nonintrusi mikroorganisme tanpa bubuk slag nikel (BNI60-0) pada kedalaman 25–50 mm
Kuattekan CH CSH Calc CMA E SiO2 Q A T R H
(hari (MPa) (%) (%) (%) (%) (%) (%) (%) (%) (%) (%) (%)1 14 49.89 25.0 47.1 5.9 9.0 13.0 0.0 0.0 0.0 0.0 0.0 0.02 28 56.09 26.7 49.5 4.7 7.6 11.5 0.0 0.0 0.0 0.0 0.0 0.03 56 61.32 27.1 52.8 4.3 6.6 9.3 0.0 0.0 0.0 0.0 0.0 0.04 90 63.10 28.0 55.2 3.7 5.7 7.5 0.0 0.0 0.0 0.0 0.0 0.05 120 63.65 28.1 57.6 3.2 4.5 6.5 0.0 0.0 0.0 0.0 0.0 0.06 180 65.22 28.4 58.3 3.0 4.4 5.8 0.0 0.0 0.0 0.0 0.0 0.0
No UmurIdentifikasi X-Ray Diffraction
Tabel C.9.c. Hasil identifikasi dan analisis senyawa kimia X-Ray Diffraction untuk beton nonintrusi mikroorganisme tanpa bubuk slag nikel (BNI60-0) pada kedalaman 50–75 mm
Kuattekan CH CSH Calc CMA E SiO2 Q A T R H
(hari (MPa) (%) (%) (%) (%) (%) (%) (%) (%) (%) (%) (%)1 14 49.89 25.7 47.8 5.1 8.6 11.0 0.0 1.8 0.0 0.0 0.0 0.02 28 56.09 26.7 50.1 4.4 8.2 10.6 0.0 0.0 0.0 0.0 0.0 0.03 56 61.32 27.1 52.2 3.9 7.1 9.7 0.0 0.0 0.0 0.0 0.0 0.04 90 63.10 27.5 54.4 3.3 5.8 8.9 0.0 0.0 0.0 0.0 0.0 0.05 120 63.65 28.0 56.8 2.7 5.0 7.6 0.0 0.0 0.0 0.0 0.0 0.06 180 65.22 28.2 57.9 2.4 4.7 6.8 0.0 0.0 0.0 0.0 0.0 0.0
No UmurIdentifikasi X-Ray Diffraction
Tabel C.10.a. Hasil identifikasi dan analisis senyawa kimia X-Ray Diffraction untuk beton nonintrusi mikroorganisme dengan 16% bubuk slag nikel (BNI60-16) pada kedalaman 0–25 mm
Kuattekan CH CSH Calc CMA E SiO2 Q A T R H
(hari (MPa) (%) (%) (%) (%) (%) (%) (%) (%) (%) (%) (%)1 14 45.39 15.9 59.8 5.0 6.9 10.1 1.1 0.0 1.3 0.0 0.0 0.02 28 56.09 16.4 61.8 4.4 6.0 9.4 0.0 0.8 0.0 0.0 1.3 0.03 56 62.21 16.9 66.3 3.5 4.3 7.2 0.0 0.8 1.1 0.0 0.0 0.04 90 65.01 17.2 67.2 3.2 4.0 6.6 0.0 0.7 0.0 0.0 1.1 0.05 120 65.39 17.5 69.3 2.9 3.4 5.7 0.0 0.5 0.7 0.0 0.0 0.06 180 66.71 17.6 70.5 2.5 3.0 5.3 0.0 0.5 0.6 0.0 0.0 0.0
No UmurIdentifikasi X-Ray Diffraction
370
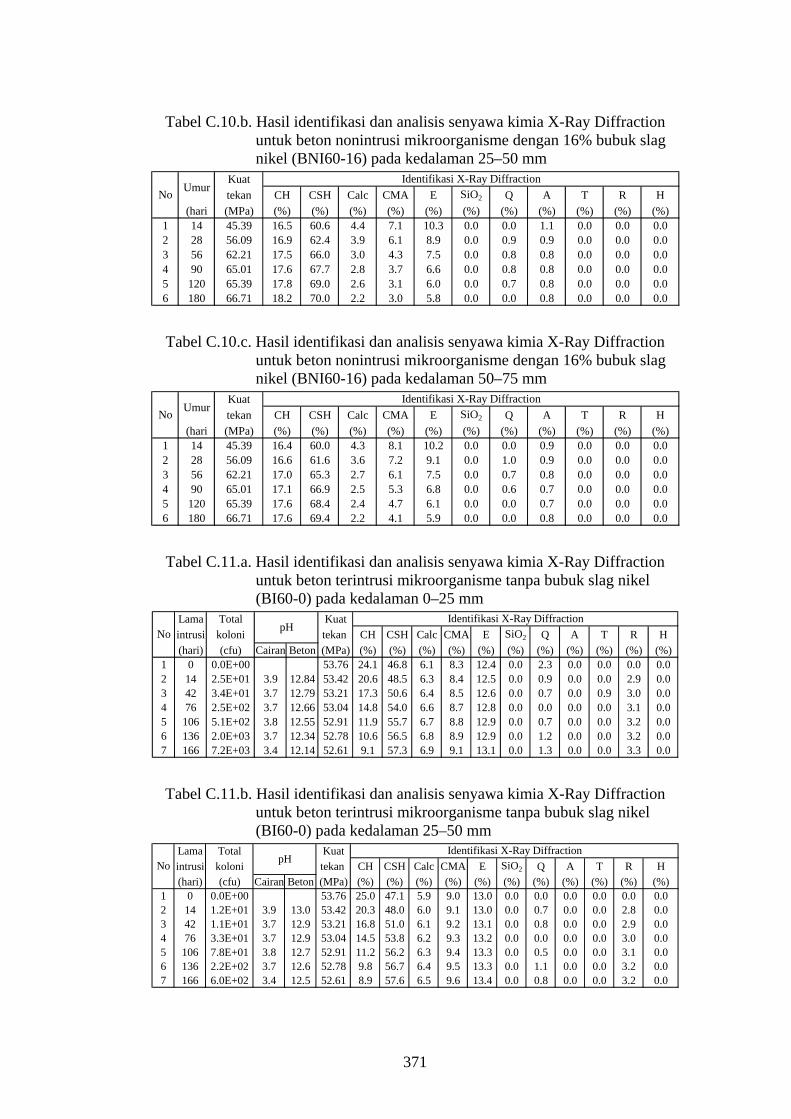
Tabel C.10.b. Hasil identifikasi dan analisis senyawa kimia X-Ray Diffraction untuk beton nonintrusi mikroorganisme dengan 16% bubuk slag nikel (BNI60-16) pada kedalaman 25–50 mm
Kuattekan CH CSH Calc CMA E SiO2 Q A T R H
(hari (MPa) (%) (%) (%) (%) (%) (%) (%) (%) (%) (%) (%)1 14 45.39 16.5 60.6 4.4 7.1 10.3 0.0 0.0 1.1 0.0 0.0 0.02 28 56.09 16.9 62.4 3.9 6.1 8.9 0.0 0.9 0.9 0.0 0.0 0.03 56 62.21 17.5 66.0 3.0 4.3 7.5 0.0 0.8 0.8 0.0 0.0 0.04 90 65.01 17.6 67.7 2.8 3.7 6.6 0.0 0.8 0.8 0.0 0.0 0.05 120 65.39 17.8 69.0 2.6 3.1 6.0 0.0 0.7 0.8 0.0 0.0 0.06 180 66.71 18.2 70.0 2.2 3.0 5.8 0.0 0.0 0.8 0.0 0.0 0.0
No UmurIdentifikasi X-Ray Diffraction
Tabel C.10.c. Hasil identifikasi dan analisis senyawa kimia X-Ray Diffraction untuk beton nonintrusi mikroorganisme dengan 16% bubuk slag nikel (BNI60-16) pada kedalaman 50–75 mm
Kuattekan CH CSH Calc CMA E SiO2 Q A T R H
(hari (MPa) (%) (%) (%) (%) (%) (%) (%) (%) (%) (%) (%)1 14 45.39 16.4 60.0 4.3 8.1 10.2 0.0 0.0 0.9 0.0 0.0 0.02 28 56.09 16.6 61.6 3.6 7.2 9.1 0.0 1.0 0.9 0.0 0.0 0.03 56 62.21 17.0 65.3 2.7 6.1 7.5 0.0 0.7 0.8 0.0 0.0 0.04 90 65.01 17.1 66.9 2.5 5.3 6.8 0.0 0.6 0.7 0.0 0.0 0.05 120 65.39 17.6 68.4 2.4 4.7 6.1 0.0 0.0 0.7 0.0 0.0 0.06 180 66.71 17.6 69.4 2.2 4.1 5.9 0.0 0.0 0.8 0.0 0.0 0.0
No UmurIdentifikasi X-Ray Diffraction
Tabel C.11.a. Hasil identifikasi dan analisis senyawa kimia X-Ray Diffraction untuk beton terintrusi mikroorganisme tanpa bubuk slag nikel (BI60-0) pada kedalaman 0–25 mm
Lama Total Kuatintrusi koloni tekan CH CSH Calc CMA E SiO2 Q A T R H(hari) (cfu) Cairan Beton (MPa) (%) (%) (%) (%) (%) (%) (%) (%) (%) (%) (%)
1 0 0.0E+00 53.76 24.1 46.8 6.1 8.3 12.4 0.0 2.3 0.0 0.0 0.0 0.02 14 2.5E+01 3.9 12.84 53.42 20.6 48.5 6.3 8.4 12.5 0.0 0.9 0.0 0.0 2.9 0.03 42 3.4E+01 3.7 12.79 53.21 17.3 50.6 6.4 8.5 12.6 0.0 0.7 0.0 0.9 3.0 0.04 76 2.5E+02 3.7 12.66 53.04 14.8 54.0 6.6 8.7 12.8 0.0 0.0 0.0 0.0 3.1 0.05 106 5.1E+02 3.8 12.55 52.91 11.9 55.7 6.7 8.8 12.9 0.0 0.7 0.0 0.0 3.2 0.06 136 2.0E+03 3.7 12.34 52.78 10.6 56.5 6.8 8.9 12.9 0.0 1.2 0.0 0.0 3.2 0.07 166 7.2E+03 3.4 12.14 52.61 9.1 57.3 6.9 9.1 13.1 0.0 1.3 0.0 0.0 3.3 0.0
No pHIdentifikasi X-Ray Diffraction
Tabel C.11.b. Hasil identifikasi dan analisis senyawa kimia X-Ray Diffraction untuk beton terintrusi mikroorganisme tanpa bubuk slag nikel (BI60-0) pada kedalaman 25–50 mm
Lama Total Kuatintrusi koloni tekan CH CSH Calc CMA E SiO2 Q A T R H(hari) (cfu) Cairan Beton (MPa) (%) (%) (%) (%) (%) (%) (%) (%) (%) (%) (%)
1 0 0.0E+00 53.76 25.0 47.1 5.9 9.0 13.0 0.0 0.0 0.0 0.0 0.0 0.02 14 1.2E+01 3.9 13.0 53.42 20.3 48.0 6.0 9.1 13.0 0.0 0.7 0.0 0.0 2.8 0.03 42 1.1E+01 3.7 12.9 53.21 16.8 51.0 6.1 9.2 13.1 0.0 0.8 0.0 0.0 2.9 0.04 76 3.3E+01 3.7 12.9 53.04 14.5 53.8 6.2 9.3 13.2 0.0 0.0 0.0 0.0 3.0 0.05 106 7.8E+01 3.8 12.7 52.91 11.2 56.2 6.3 9.4 13.3 0.0 0.5 0.0 0.0 3.1 0.06 136 2.2E+02 3.7 12.6 52.78 9.8 56.7 6.4 9.5 13.3 0.0 1.1 0.0 0.0 3.2 0.07 166 6.0E+02 3.4 12.5 52.61 8.9 57.6 6.5 9.6 13.4 0.0 0.8 0.0 0.0 3.2 0.0
No pHIdentifikasi X-Ray Diffraction
371
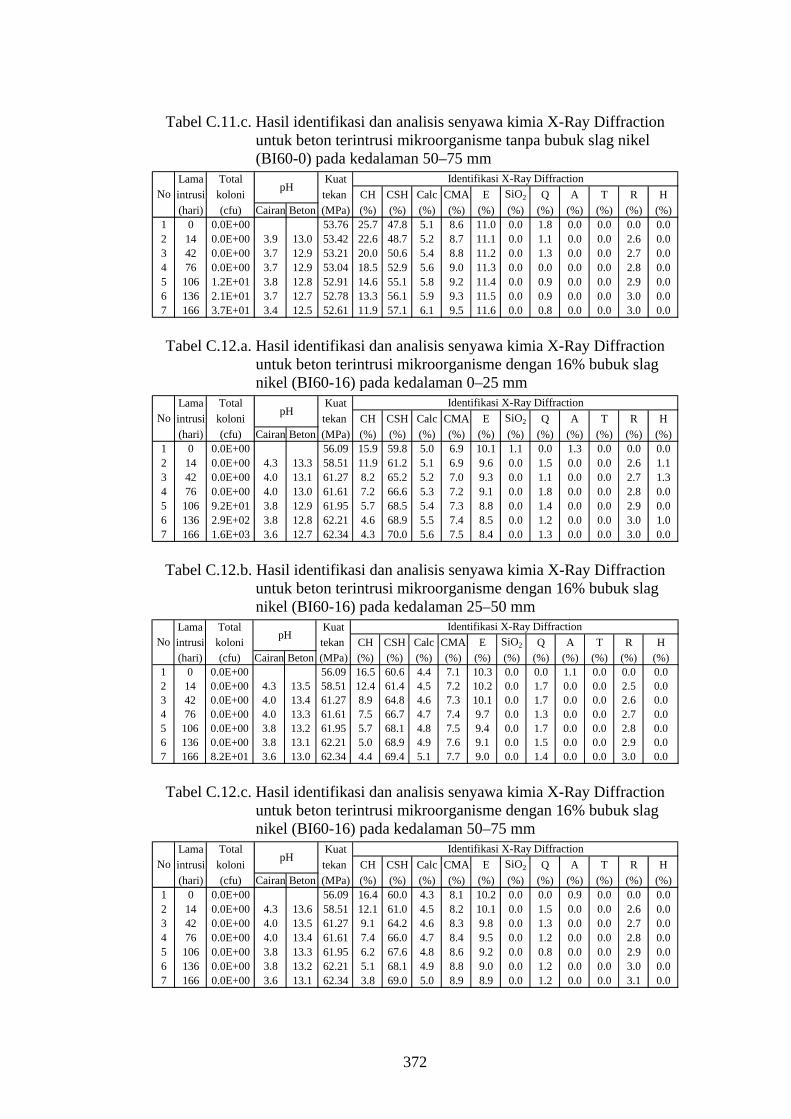
Tabel C.11.c. Hasil identifikasi dan analisis senyawa kimia X-Ray Diffraction untuk beton terintrusi mikroorganisme tanpa bubuk slag nikel (BI60-0) pada kedalaman 50–75 mm
Lama Total Kuatintrusi koloni tekan CH CSH Calc CMA E SiO2 Q A T R H(hari) (cfu) Cairan Beton (MPa) (%) (%) (%) (%) (%) (%) (%) (%) (%) (%) (%)
1 0 0.0E+00 53.76 25.7 47.8 5.1 8.6 11.0 0.0 1.8 0.0 0.0 0.0 0.02 14 0.0E+00 3.9 13.0 53.42 22.6 48.7 5.2 8.7 11.1 0.0 1.1 0.0 0.0 2.6 0.03 42 0.0E+00 3.7 12.9 53.21 20.0 50.6 5.4 8.8 11.2 0.0 1.3 0.0 0.0 2.7 0.04 76 0.0E+00 3.7 12.9 53.04 18.5 52.9 5.6 9.0 11.3 0.0 0.0 0.0 0.0 2.8 0.05 106 1.2E+01 3.8 12.8 52.91 14.6 55.1 5.8 9.2 11.4 0.0 0.9 0.0 0.0 2.9 0.06 136 2.1E+01 3.7 12.7 52.78 13.3 56.1 5.9 9.3 11.5 0.0 0.9 0.0 0.0 3.0 0.07 166 3.7E+01 3.4 12.5 52.61 11.9 57.1 6.1 9.5 11.6 0.0 0.8 0.0 0.0 3.0 0.0
No pHIdentifikasi X-Ray Diffraction
Tabel C.12.a. Hasil identifikasi dan analisis senyawa kimia X-Ray Diffraction untuk beton terintrusi mikroorganisme dengan 16% bubuk slag nikel (BI60-16) pada kedalaman 0–25 mm
Lama Total Kuatintrusi koloni tekan CH CSH Calc CMA E SiO2 Q A T R H(hari) (cfu) Cairan Beton (MPa) (%) (%) (%) (%) (%) (%) (%) (%) (%) (%) (%)
1 0 0.0E+00 56.09 15.9 59.8 5.0 6.9 10.1 1.1 0.0 1.3 0.0 0.0 0.02 14 0.0E+00 4.3 13.3 58.51 11.9 61.2 5.1 6.9 9.6 0.0 1.5 0.0 0.0 2.6 1.13 42 0.0E+00 4.0 13.1 61.27 8.2 65.2 5.2 7.0 9.3 0.0 1.1 0.0 0.0 2.7 1.34 76 0.0E+00 4.0 13.0 61.61 7.2 66.6 5.3 7.2 9.1 0.0 1.8 0.0 0.0 2.8 0.05 106 9.2E+01 3.8 12.9 61.95 5.7 68.5 5.4 7.3 8.8 0.0 1.4 0.0 0.0 2.9 0.06 136 2.9E+02 3.8 12.8 62.21 4.6 68.9 5.5 7.4 8.5 0.0 1.2 0.0 0.0 3.0 1.07 166 1.6E+03 3.6 12.7 62.34 4.3 70.0 5.6 7.5 8.4 0.0 1.3 0.0 0.0 3.0 0.0
No pHIdentifikasi X-Ray Diffraction
Tabel C.12.b. Hasil identifikasi dan analisis senyawa kimia X-Ray Diffraction untuk beton terintrusi mikroorganisme dengan 16% bubuk slag nikel (BI60-16) pada kedalaman 25–50 mm
Lama Total Kuatintrusi koloni tekan CH CSH Calc CMA E SiO2 Q A T R H(hari) (cfu) Cairan Beton (MPa) (%) (%) (%) (%) (%) (%) (%) (%) (%) (%) (%)
1 0 0.0E+00 56.09 16.5 60.6 4.4 7.1 10.3 0.0 0.0 1.1 0.0 0.0 0.02 14 0.0E+00 4.3 13.5 58.51 12.4 61.4 4.5 7.2 10.2 0.0 1.7 0.0 0.0 2.5 0.03 42 0.0E+00 4.0 13.4 61.27 8.9 64.8 4.6 7.3 10.1 0.0 1.7 0.0 0.0 2.6 0.04 76 0.0E+00 4.0 13.3 61.61 7.5 66.7 4.7 7.4 9.7 0.0 1.3 0.0 0.0 2.7 0.05 106 0.0E+00 3.8 13.2 61.95 5.7 68.1 4.8 7.5 9.4 0.0 1.7 0.0 0.0 2.8 0.06 136 0.0E+00 3.8 13.1 62.21 5.0 68.9 4.9 7.6 9.1 0.0 1.5 0.0 0.0 2.9 0.07 166 8.2E+01 3.6 13.0 62.34 4.4 69.4 5.1 7.7 9.0 0.0 1.4 0.0 0.0 3.0 0.0
No pHIdentifikasi X-Ray Diffraction
Tabel C.12.c. Hasil identifikasi dan analisis senyawa kimia X-Ray Diffraction untuk beton terintrusi mikroorganisme dengan 16% bubuk slag nikel (BI60-16) pada kedalaman 50–75 mm
Lama Total Kuatintrusi koloni tekan CH CSH Calc CMA E SiO2 Q A T R H(hari) (cfu) Cairan Beton (MPa) (%) (%) (%) (%) (%) (%) (%) (%) (%) (%) (%)
1 0 0.0E+00 56.09 16.4 60.0 4.3 8.1 10.2 0.0 0.0 0.9 0.0 0.0 0.02 14 0.0E+00 4.3 13.6 58.51 12.1 61.0 4.5 8.2 10.1 0.0 1.5 0.0 0.0 2.6 0.03 42 0.0E+00 4.0 13.5 61.27 9.1 64.2 4.6 8.3 9.8 0.0 1.3 0.0 0.0 2.7 0.04 76 0.0E+00 4.0 13.4 61.61 7.4 66.0 4.7 8.4 9.5 0.0 1.2 0.0 0.0 2.8 0.05 106 0.0E+00 3.8 13.3 61.95 6.2 67.6 4.8 8.6 9.2 0.0 0.8 0.0 0.0 2.9 0.06 136 0.0E+00 3.8 13.2 62.21 5.1 68.1 4.9 8.8 9.0 0.0 1.2 0.0 0.0 3.0 0.07 166 0.0E+00 3.6 13.1 62.34 3.8 69.0 5.0 8.9 8.9 0.0 1.2 0.0 0.0 3.1 0.0
No pHIdentifikasi X-Ray Diffraction
372