Embed Size (px)
Citation preview
DAFM Laboratories
Quarterly
Surveillance Report
Quarter 1 2017

DAFM surveillance reports available at http://www.agriculture.gov.ie/rvlreport/
Introduction The laboratories operated by the Department of Agriculture, Food and Marine (DAFM) provide
data on the patterns and frequency of occurrence of non-regulated diseases in farmed animal
populations in Ireland. This disease surveillance role is fulfilled through routine diagnostic, post-
mortem and targeted surveillance activities. Data from these activities is published collectively on a
monthly, quarterly and annual basis. This quarterly report and other surveillance reports can be
accessed at: http://www.agriculture.gov.ie/rvlreport/.
The surveillance role of the laboratories compliments the broader remit of DAFM in surveillance
and control of diseases of animals. In addition to annual reports, periodical reports are published to
ensure the timely feedback of accurate data to the relevant industry stakeholders to inform
husbandry practices and disease control measures.
The quarterly surveillance reports are designed to provide a brief overview of disease trends in a
given quarter. Further, and more detailed, commentary on individual cases or individual outbreaks
can be accessed through monthly reports published in the Veterinary Ireland Journal and also
available at: http://www.agriculture.gov.ie/rvlreport/.
This Quarter The data presented in this report refers to the first quarter of 2017 (January to March), a period
when a larger proportion of our submissions are neonatal animals or foetuses than at other times
of the year, as would be expected.
January was drier than normal this year which, when combined with a marginally warmer average
temperature, made for favourable conditions on ‘out-wintered’ livestock. Overall carcase
submission rates were lower (11.6%) than Q1 2016 which was primarily attributable to a decrease
in sheep carcase submissions. Among bovine submissions alimentary tract conditions were most
frequently diagnosed in all ages with the exception of animals aged between 3 and 12 months
among which respiratory disease was most frequently recorded. Cases of intestinal atresia
continue to be recorded with relative frequency. As this is a condition recognised at, or shortly
after birth, the peak occurrence is typically recorded during this quarter.
Results of ZST analyses from the RVLs continue to show an encouraging trend of improved
colostrum management on Irish farms. In this quarter, 62% (55% in Q1 2016) of animals tested
were found to have evidence of adequate colostral transfer of maternal immunity (ZST score >20
units). As poor colostrum management has been frequently idenitifed as a contributor to neonatal
disease and mortality, this evidence of improved management is to be welcomed.
Mastitis culture results in this quarter revealed a higher relative frequency of Streptococcus uberis
isolations compared to Staphylococcus aureus. This is an interesting development considering that
Strep. uberis has become the leading cause of clinical and subclinical mastitis in New Zealand dairy
herds over the last 20 years. While these results represent only three months of data, it is notable
that increasing frequency of detection of this environmental pathogen in other countries among
clinical cases has been associated with higher stocking rates and widespread use of calving and
feed pads; higher yielding cows and those fed concentrate-based transition diets are also believed
to be at increased risk. It is possible that this finding is reflective of some of the current changes in
the Irish dairy sector.
DAFM surveillance reports available at http://www.agriculture.gov.ie/rvlreport/
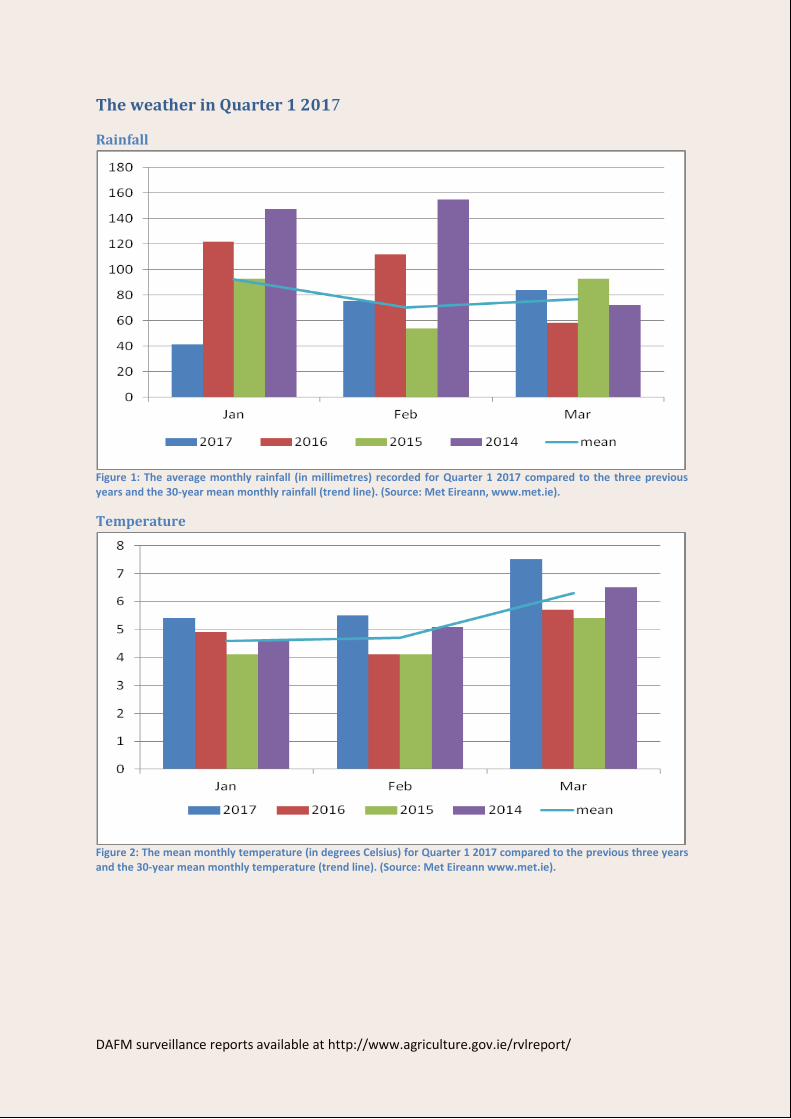
The weather in Quarter 1 2017
Rainfall
Figure 1: The average monthly rainfall (in millimetres) recorded for Quarter 1 2017 compared to the three previous years and the 30-year mean monthly rainfall (trend line). (Source: Met Eireann, www.met.ie).
Temperature
Figure 2: The mean monthly temperature (in degrees Celsius) for Quarter 1 2017 compared to the previous three years and the 30-year mean monthly temperature (trend line). (Source: Met Eireann www.met.ie).
DAFM surveillance reports available at http://www.agriculture.gov.ie/rvlreport/
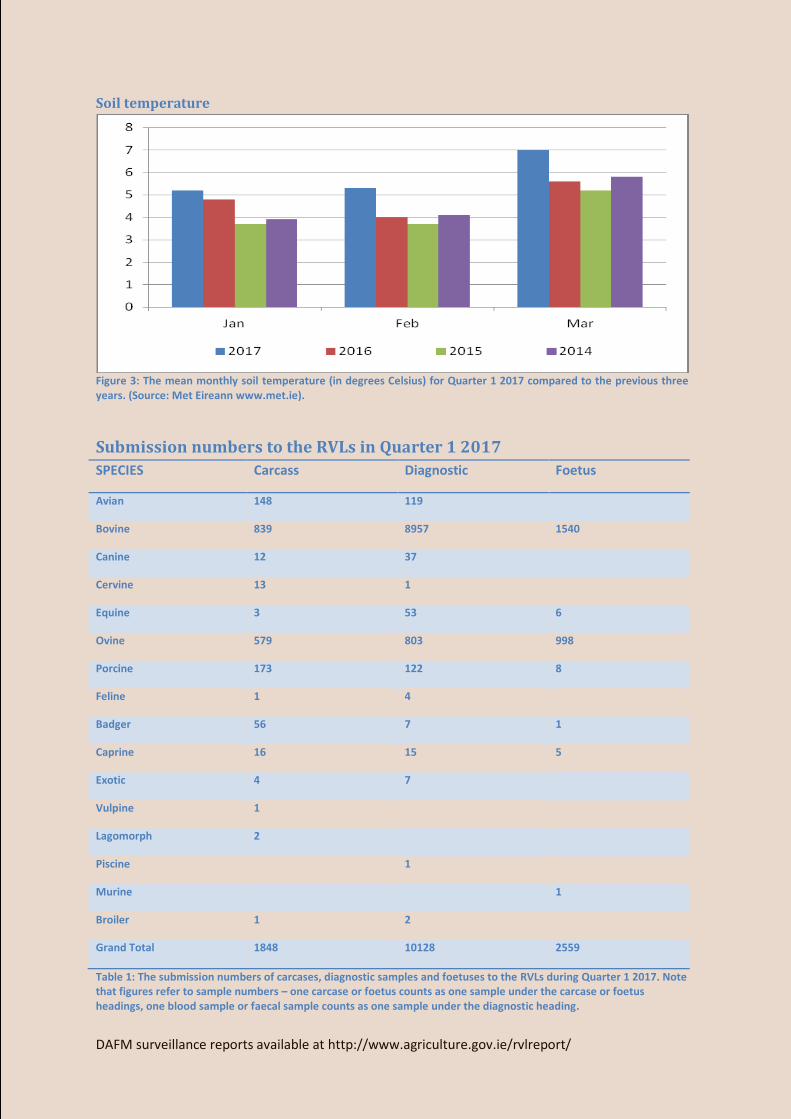
Soil temperature
Figure 3: The mean monthly soil temperature (in degrees Celsius) for Quarter 1 2017 compared to the previous three years. (Source: Met Eireann www.met.ie).
Submission numbers to the RVLs in Quarter 1 2017
SPECIES Carcass Diagnostic Foetus
Avian 148 119
Bovine 839 8957 1540
Canine 12 37
Cervine 13 1
Equine 3 53 6
Ovine 579 803 998
Porcine 173 122 8
Feline 1 4
Badger 56 7 1
Caprine 16 15 5
Exotic 4 7
Vulpine 1
Lagomorph 2
Piscine 1
Murine 1
Broiler 1 2
Grand Total 1848 10128 2559
Table 1: The submission numbers of carcases, diagnostic samples and foetuses to the RVLs during Quarter 1 2017. Note that figures refer to sample numbers – one carcase or foetus counts as one sample under the carcase or foetus headings, one blood sample or faecal sample counts as one sample under the diagnostic heading.

DAFM surveillance reports available at http://www.agriculture.gov.ie/rvlreport/
Bovine disease surveillance
The causes of bovine mortality (all ages)
Figure 4: The causes of bovine mortality recorded on post-mortem examination in cattle of all ages by the RVLs, categorised by system or cause, during Quarter 1 2017 (n=664).
Figure 5: The ten most common individual diagnosed causes of death in cattle of all ages, recorded on post-mortem examination by the RVLs during Quarter 1 2017 (n=664).

DAFM surveillance reports available at http://www.agriculture.gov.ie/rvlreport/
Figure 6: The relative frequency of the most common individual bovine respiratory disease diagnoses, in cattle of all ages, recorded on post-mortem examination by the RVLs during Quarter 1 2017 (n=125).
Figure 7: The relative frequency of the most common individual bovine alimentary tract disease diagnoses, in cattle of all ages, recorded on post-mortem examination by the RVLs during Quarter 1 2017 (n=261).
Figure 8: The relative frequency of bovine clostridial disease diagnoses, in cattle of all ages, recorded on post-mortem examination by the RVLs during Quarter 1 2017 (n=6).

DAFM surveillance reports available at http://www.agriculture.gov.ie/rvlreport/
The causes of bovine mortality (age-specific)
Figure 9: The causes of bovine mortality in neonatal calves (calves aged less than one month) recorded on post-mortem examination by the RVLs, categorised by system or cause, during Quarter 1 2017 (n=364).
Figure 10: The causes of bovine mortality in calves (calves aged greater than one month but less than three months) recorded on post-mortem examination by the RVLs, categorised by system or cause, during Quarter 1 2017 (n=91).

DAFM surveillance reports available at http://www.agriculture.gov.ie/rvlreport/
Figure 11: : The causes of bovine mortality in weanlings (bovine animals aged greater than three months but less than twelve months) recorded on post-mortem examination by the RVLs, categorised by system or cause, during Quarter 1 2017 (n=74).
Figure 12: The causes of bovine mortality in adults (bovine animals aged greater than or equal to twelve months) recorded on post-mortem examination by the RVLs, categorised by system or cause, during Quarter 1 2017 (n=118).

DAFM surveillance reports available at http://www.agriculture.gov.ie/rvlreport/
The relative frequency of pathogens identified in specific post-mortem examination
diagnostic categories
Figure 13: The relative frequency of specific respiratory pathogens identified in bovine carcases examined on post-mortem examination by the RVLs, in which a diagnosis of respiratory disease was made during Quarter 1 2017 (n=125).
Figure 14: The relative frequency of specific alimentary tract disease pathogens identified in bovine carcases examined on post-mortem examination by the RVLs, in which a diagnosis of ‘enteritis’ or ‘gastro-enteritis’ was made during Quarter 1 2017 (n=156).

DAFM surveillance reports available at http://www.agriculture.gov.ie/rvlreport/
Figure 15: The frequency of identification of Clostridium species on post-mortem examination of bovine animal carcases of all ages by the RVLs during Quarter 1 2017.
The frequency of detection of enteric pathogens in neonatal bovine enteritis cases Enteric pathogen Negative Positive %Positive
E.coli K99 683 8 1.2%
Coronavirus 1035 5 0.5%
Salmonella culture 1042 5 0.5%
Cryptosporidium parvum 791 179 18.5%
Rotavirus 654 387 37.2%
Table 2: The relative frequency of detection of enteric pathogens in the faecal samples of neonatal calves (aged less than one month of age) harvested during Quarter 1 2017 from both clinically ill animals by veterinary practitioners in the field and from bovine carcases during post-mortem examination by the RVLs.

DAFM surveillance reports available at http://www.agriculture.gov.ie/rvlreport/
Results of the zinc sulphate turbidity (ZST) test in neonatal calves
Figure 16: The results of the ZST tests performed on both clinically ill animals and on carcases submitted for post-mortem examination by the RVLs during Quarter 1 2017 (n=844). The ZST test is used to determine the immunoglobulin status of the calf which can reflect the extent to which maternal colostral immunity has been transferred to the calf via the colostrum. A value of greater than or equal to 20 units is considered indicative of adequate immunoglobulin levels in the calf.
Results of milk samples submitted for mastitis culture
Figure 17: The relative frequency of isolation of specific mastitis pathogens in milk sample submissions (n=479) for bacteriological culture by the RVLs during Quarter 1 2017.

DAFM surveillance reports available at http://www.agriculture.gov.ie/rvlreport/
Bovine abortion and perinatal death
Foetal diagnosis Number Percentage
Abortion 793 65.0%
Anoxia/Hypoxia 39 3.2%
Hereditary and developmental anomalies 51 4.2%
Mummification 1 0.1%
Stillbirth 0 0.0%
Perinatal mortality 10 0.8%
Placentitis 2 0.2%
Goitre 6 0.5%
Dystocia 39 3.2%
Bacteraemia/Septicaemia 8 0.7%
Weak calf syndrome 0 0.0%
Aspiration pneumonia 7 0.6%
Haemorrhage 5 0.4%
Miscellaneous causes 118 9.7%
No Diagnosis 141 11.6%
Table 3: The causes of foetal (calves in utero up to 260 days gestation) or perinatal (calves from 260 days gestation to 48 hours post-delivery) death diagnosed on post-mortem examination (n=1220) by the RVLs during Quarter 1 2017.
Figure 18: The relative frequency of detection of infectious agents in foetuses submitted to the RVLs for post-mortem examination during Quarter 1 2017 in which abortion, stillbirth or placentitis was diagnosed (n=795).

DAFM surveillance reports available at http://www.agriculture.gov.ie/rvlreport/
Ovine disease surveillance
Causes of ovine mortality
Figure 19: The causes of mortality in sheep carcases recorded on post-mortem examination by the RVLs during Quarter 1 2017, categorised by the system affected or by cause (n=488).
Figure 20: The ten most common individual diagnoses recorded in sheep carcases on post-mortem examination by the RVLs during Quarter 1 2017.
DAFM surveillance reports available at http://www.agriculture.gov.ie/rvlreport/
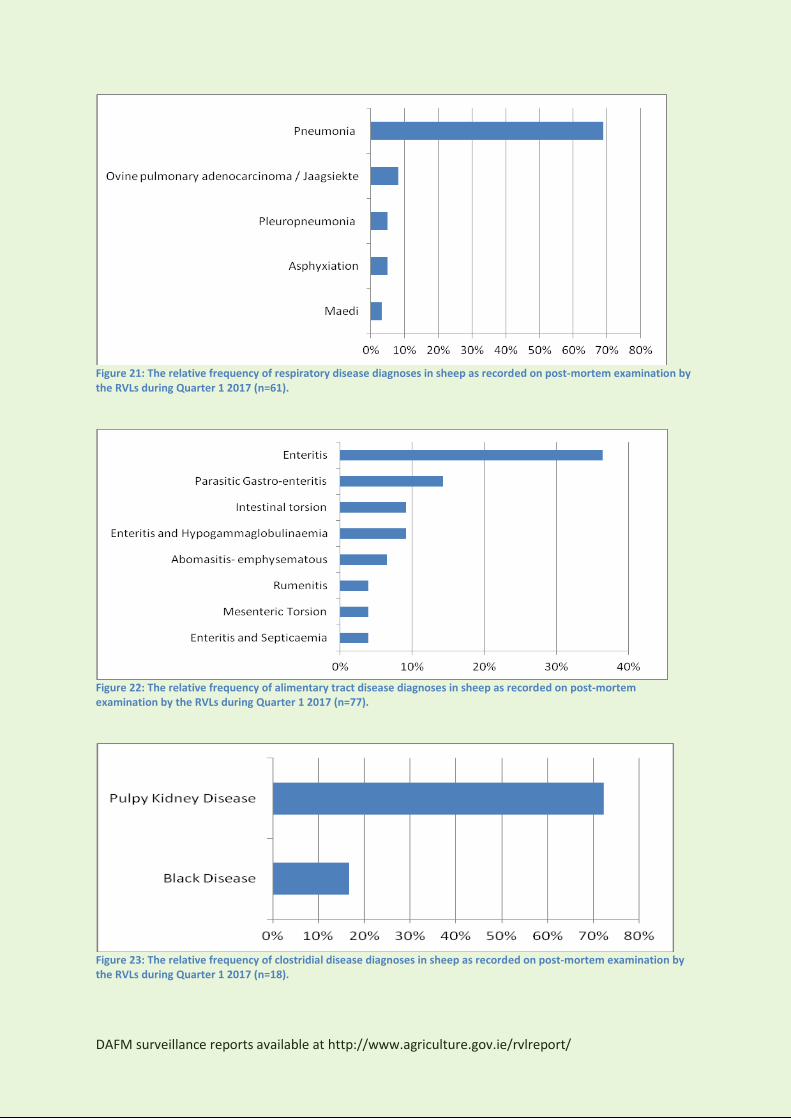
Figure 21: The relative frequency of respiratory disease diagnoses in sheep as recorded on post-mortem examination by the RVLs during Quarter 1 2017 (n=61).
Figure 22: The relative frequency of alimentary tract disease diagnoses in sheep as recorded on post-mortem examination by the RVLs during Quarter 1 2017 (n=77).
Figure 23: The relative frequency of clostridial disease diagnoses in sheep as recorded on post-mortem examination by the RVLs during Quarter 1 2017 (n=18).

DAFM surveillance reports available at http://www.agriculture.gov.ie/rvlreport/
Ovine abortion
Diagnosed cause of foetal death Number Percentage
Abortion 559 74.5%
Miscellaneous causes 91 12.1%
Dystocia 24 3.2%
Hereditary and developmental anomalies 24 3.2%
Perinatal mortality 16 2.1%
No Diagnosis 12 1.6%
Anoxia/Hypoxia 12 1.6%
Bacteraemia/Septicaemia 11 1.5%
Placentitis 1 0.1%
Goitre 0 0.0%
Mummification 0 0.0%
Table 4: The relative frequency of the diagnosed causes of death in ovine foetuses recorded on post-mortem examination by the RVLs during Quarter 1 2017 (n=750).
Figure 24: The relative frequency of abortion agents identified in ovine abortion diagnoses (n=750) recorded on post-mortem examination by the RVLs during Quarter 1 2017.


![All-Ireland Pollinator Plan 2015-2020 Creating an Ireland ... · Rural Development Programme 2014-2020 (draft - DAFM) ... [Infographic] Pollination occurs when pollen is moved within](https://img.pdfslide.us/doc/110x75/5fbb26f07252ce2f40448edb/all-ireland-pollinator-plan-2015-2020-creating-an-ireland-rural-development.jpg)