Embed Size (px)
DESCRIPTION
Skopje - 22.3.2002. DAC PROJECT Capacity Building in Balcan Countries for the Abatement of Greenhouse Gases. Setting priorities for GHG emissions’ reduction. George Mavrotas NATIONAL TECHNICAL UNIVERSITY OF ATHENS. STRUCTURE OF THE PRESENTATION. - PowerPoint PPT Presentation
Citation preview

DAC PROJECTCapacity Building in Balcan Countriesfor the Abatement of Greenhouse Gases
Setting priorities for GHG emissions’ reduction
George MavrotasNATIONAL TECHNICAL UNIVERSITY OF ATHENS
Skopje - 22.3.2002

DAC Project / Skopje, 22.3.2002
STRUCTURE OF THE PRESENTATION
Analysis of the current situation – Recognize priorities
Indicative measures and policies
Evaluation of the measures
Priorities according to local experts
Concluding remarks

DAC Project / Skopje, 22.3.2002
Contribution of Greenhouse Gases in the EU
0
500
1000
1500
2000
2500
3000
3500
4000
4500
90 91 92 93 94 95 96
Year
MtCO2 equiv.
0
1000
2000
3000
4000
5000
6000
7000 GDP
N2O CH4 CO2 GDP EU Kyoto target
DAC Project / Skopje, 22.3.2002
Distribution of CO2 emissions
Energysector77%
Industrial processes
7%
Agriculture7%
Waste9%
CO2– eq emisionsfor 2000 (estimates)
14036 kt CO2
Electricity production
74%
Transport11%Heat
production15%
Energy sector
10787 kt CO2
First priority: Measures that affect electricity production

DAC Project / Skopje, 22.3.2002
Power generation
Electric efficiency: 40%CO2 emission factor:0.98 tCO2/MWh
Power generation 20006441 GWh
Solid75%
Oil7%
Hydro18%
Solid54%Oil
23%
Natural gas13%
Hydro10%
GREECEPower generation 2000
52200 GWh
Electric efficiency: 35%CO2 emission factor:0.95 tCO2/MWh

DAC Project / Skopje, 22.3.2002
Measures and Policies for Electricity Generation
High Priority:Reduce solids - increase renewables (hydro,
wind) and natural gas in power generation mixImprove efficiency“Clean” technologies (hydro, NG) for base loadMinimize transmission losses
The goal is to improve energy efficiency of the existing infrastructure and to gradually upgrade the whole sector by adding cleaner and more efficient technologies.

DAC Project / Skopje, 22.3.2002
Measures and Policies for the Demand Sectors
The aim should be 3-fold:To increase energy efficiency through
minimisation of energy losses
To upgrade existing infrastructure with new appliances/equipment
To introduce cleaner fuels and renewables

DAC Project / Skopje, 22.3.2002
Measures and Policies for the Residential & Tertiary Sector
Improved maintenance of central heating systems Reduction of thermal losses in existing buildings
(insulation + double glazing) Updating building specifications for new buildings Buildings shading Use of low energy lamps Use of efficient domestic appliances Automatisation in lighting Solar water heating systems Further penetration of natural gas District heating with biomass CHP in large buildings (hotels, hospitals, etc)

DAC Project / Skopje, 22.3.2002
Measures and Policies for the Industrial Sector
Improved maintenance of energy equipment
Energy conservation (reduction of losses)
Substitution of solids and oil with natural gas
Cogeneration with natural gas
Exploitation of biomass (agricultural residues)

DAC Project / Skopje, 22.3.2002
Measures and Policies for the Transport Sector
Improved maintenance of private cars, trucks
and buses
Improvement of road network
Improvement in traffic lighting
Promotion of public transport
Increased natural gas in public transport

DAC Project / Skopje, 22.3.2002
Evaluation of measures
Cost estimationCost per ton of CO2 saved (specific cost)
Contribution to CO2 emissions’ abatement
Marginal abatement cost curve Additional criteria
Ease of implementation (missing infrastructures, administrative-legislative barriers)
Environmental synergiesImpact on employment and regional
development

DAC Project / Skopje, 22.3.2002
Cost per ton of CO2 saved
Comparison with the relative baseline scenario option Specify the reference unit (e.g. 1 household) and the
reference time period (e.g. 1year)
Cost and CO2 emissions estimation for the baseline scenario option (without the measure)
Cost and CO2 emissions estimation with the measure implementation
Cost of measure per ton of CO2 saved:
measurebaseline
baselinemeasure
COCO
CostCostCostSpecific
22

DAC Project / Skopje, 22.3.2002
CO2 abatement estimation
Specify the target year
Assume a penetration rate of the measure at target year
Estimate the CO2 abatement at target year: CO2ab=(CO2b-CO2m)ref_unit unitstarg_year penetration_rate

DAC Project / Skopje, 22.3.2002
Greek case: ranking according to the specific cost
of measures
-80
-60
-40
-20
0
20
40
60
80
100
120
NG
in T
PP
of
Aliv
eri
Ce
ilin
g f
an
s/n
igh
t v
en
til.
Ec
on
om
y la
mp
s
CH
P in
ind
us
try
CH
P in
te
rtia
ry
NG
fir
ed
TP
P in
ba
se
loa
d
So
lar
en
erg
y -
ho
t w
ate
r
Win
d e
ne
rgy
NG
in T
PP
of
Pto
lem
aid
a
Ins
ula
tio
n in
te
rtia
ry
Sm
all
hy
dro
Pu
blic
tra
ns
po
rta
tio
n
Ma
int.
ce
ntr
al h
ea
tin
g
Flu
id.b
ed
in T
PP
(lig
n.)
NG
fo
r A
/C in
te
rtia
ryeu
ro/t
CO
2
"No regret" measures

DAC Project / Skopje, 22.3.2002
Greek case: ranking according to the CO2
abatement in 2010
2785
2353
1397 1367 1345 1300
866
425 410200 159 104 79 50
3063
0
500
1000
1500
2000
2500
3000
3500
Ce
ilin
g f
an
s/n
igh
t v
en
til.
NG
in
TP
P o
f P
tole
ma
ida
NG
fir
ed
TP
P in
ba
se
lo
ad
Ec
on
om
y la
mp
s
NG
in
TP
P o
f A
liv
eri
So
lar
en
erg
y -
ho
t w
ate
r
Sm
all h
yd
ro
Win
d e
ne
rgy
Pu
blic
tra
ns
po
rta
tio
n
CH
P in
in
du
str
y
Ma
int.
ce
ntr
al h
ea
tin
g
NG
fo
r A
/C in
te
rtia
ry
Ins
ula
tio
n in
te
rtia
ry
Flu
id.b
ed
in
TP
P (
lig
n.)
CH
P in
te
rtia
ry
kt
CO
2
CO2 reduction in 2010

DAC Project / Skopje, 22.3.2002
Greek case: Marginal abatement cost curve for
2010
-100
-80
-60
-40
-20
0
20
40
60
80
100
0 2000 4000 6000 8000 10000 12000 14000 16000 18000
CO2 reduction (kt)
co
st
(eu
ro/ tC
O2
)

DAC Project / Skopje, 22.3.2002
Example: Economy lamps
Baseline scenario: Incandescent lamps Base of calculations: 1 typical household (100 m2) Reference time period: 1 year
Incandescent lamps
Economy lamps
Lighting power 420 W 105 W
Annual consumption 294 kWh 73 kWh
Price of 1 lamp (60W15W)
0.88 € 14.67 €
Lifetime ~ 1 year ~ 8 years

DAC Project / Skopje, 22.3.2002
Example: Economy lamps (2)
Annualized cost per lamp: Incandescent: 0.88 €Economy lamp: CRF(4%, 8 years)14.67 =0.149 14.67 = 2.19 €
Annualized cost per household: Incandescent: 7.1 lamps/household 0.88 €/lamp = 6.22 €Economy lamps: 7.1 lamps/household 2.19 €/lamp = 15.40 €
Annual electricity cost (~ 0.062 €/kWh): Incandescent: 0.062 €/kWh 294 kWh = 18.11 €Economy lamps: 0.062 €/kWh 73 kWh = 4.53 €

DAC Project / Skopje, 22.3.2002
Example: Economy lamps (3)
Total annual cost per household: Incandescent: 6.22 € + 18.11 € = 24.33 €Economy lamps: 15.40 € + 4.53 € = 19.93 €
Power generation data Transmission losses: 10%Average emission factor (2010): 0.987 kg CO2/kWh
Power generation CO2 emissions per household Incandescent: 0.987 294/(1- 0.1) = 322 kg CO2
Economy lamps: 0.987 73/(1- 0.1) = 81 kg CO2
DAC Project / Skopje, 22.3.2002
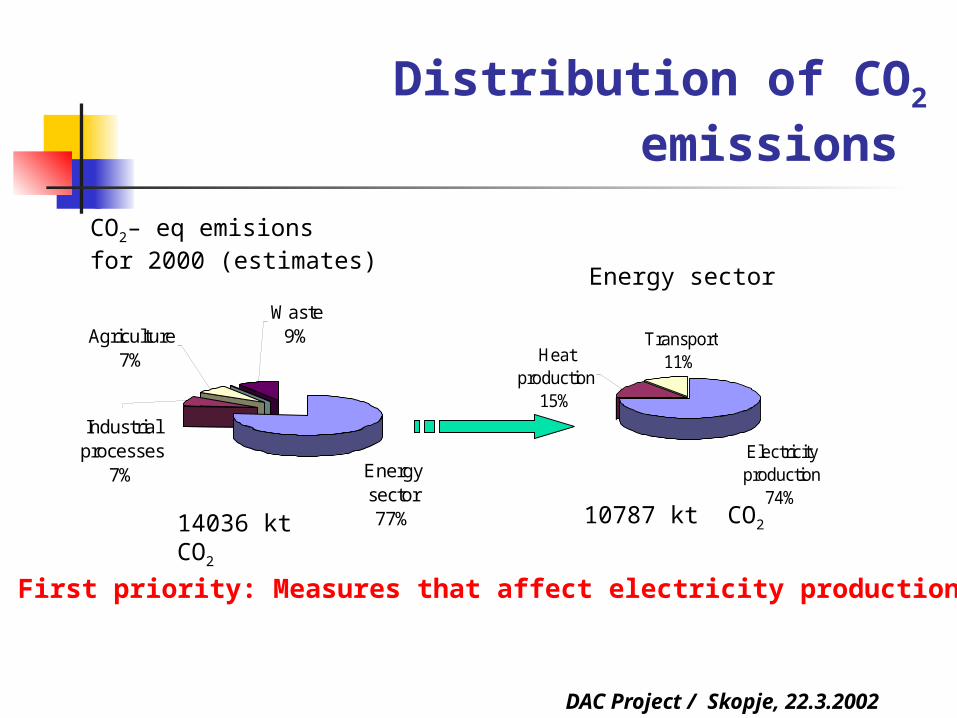
Example: Economy lamps (4)
Abatement cost: (19.93€ – 24.33€) / (322 kgCO2 – 81 kgCO2) = -18.22 €/ tCO2
Number of households in 2010: ~ 600.000 Penetration of the measure until 2010: ~ 50% CO2 abatement in 2010:
600.000 (322 kgCO2 – 81 kgCO2) 0.5 = 72.3 kt CO2

DAC Project / Skopje, 22.3.2002
Priorities according to local experts (Oct. 2001)
ELECTRICITY PRODUCTION
low medium high
New hydro plants
Other renewables (wind)
Modification in unit commitment
Advanced combustion technologies
INDUSTRY
low medium high
Substitution of coal and oil with NG
Cogeneration of Heat and Power (CHP)
Energy conservation

DAC Project / Skopje, 22.3.2002
Questionnaire results (2)
RESIDENTIAL & TERTIARY SECTOR
low medium high
Thermal insulation improvements
Penetration of NG
District Heating
DSM measures
Economy lamps
Solar collectors for hot water
Maintenance of central heating boilers
CHP in tertiary (hospitals, hotels etc)

DAC Project / Skopje, 22.3.2002
Questionnaire results (3)
TRANSPORT
low medium high
Road network improvements
Promotion of Public transport means
Intervention in the fuels (NG, LPG, bio-diesel)
Traffic lights tuning
NG in public transport buses
AGRICULTURAL
low medium high
Geothermal energy in greenhouses
Energy crops (for biofuels)

DAC Project / Skopje, 22.3.2002
Questionnaire results (4)
LAND USE CHANGE & FORESTRY
low medium high
Effective forest-fire control
Rational use of forests - Reafforestation
WASTE MANAGEMENT
low medium high
Recycling (paper, glass, aluminium)
Bio-gas from landfills

DAC Project / Skopje, 22.3.2002
Concluding remarks
First priority: Power generation sector Criteria for the evaluation of measures
Cost per ton of CO2 saved
CO2 abatement for target year
Applicability, synergies, employment
Current phase in Task 3 of DAC project: quantification of the measures