Embed Size (px)
Citation preview
DIPLOMARBEIT
Titel der Diplomarbeit
The molecular effects of fatty acid synthase inhibition on major gene
regulatory pathways and their relationship to ovarian cancer growth control
angestrebter akademischer Grad
Magister/Magistra der Naturwissenschaften (Mag. rer.nat.)
Verfasserin / Verfasser: Katharina Tomek
Matrikel-Nummer: 0203909
Studienrichtung /Studienzweig
(lt. Studienblatt):
Molekularbiologie (A-490)
Betreuerin / Betreuer: O. Univ.-Prof. DI. Dr. Wolfgang J. Schneider
Wien, im Juli 2009

ii
iii
Danksagung
Ich danke O. Univ.-Prof. DI. Dr. Wolfgang J. Schneider, der mir die Durchführung
meiner Diplomarbeit an der Medizinischen Universität ermöglicht hat.
Mein ganz besonderer Dank gilt Hr. AO Univ.-Prof. Mag. Dr. Thomas W. Grunt
nicht nur für seine hervorragende Betreuung, für die Themenstellung und
Finanzierung, sondern auch für die zahlreichen und spannenden fachlichen
Diskussionen.
Weiters danke ich Univ.-Prof. Dr. Heidrun Karlic und Dr. Franz Varga für ihre
Unterstützung und ihre interessanten Anregungen.
Meiner Kollegin Renate Wagner danke ich herzlich für ihre Hilfe, Geduld und
Unterstützung bei der Durchführung der Experimente und für das angenehme
Arbeitsklima.
Außerdem möchte ich meinen Studienkolleginnen Caroline Brünner-Kubath und
Victoria Saferding für ihre freundschaftliche Unterstützung während meiner
Diplomarbeit danken.
Meinem Freund Michael danke ich für seine liebevolle Unterstützung während
meiner gesamten Ausbildung.
Mein größter Dank gilt meinen Eltern, die mich immer dabei unterstützt haben,
mir mein Studium zu ermöglichen.
Darüber hinaus danke ich all jenen, die mich nach meiner Ausbildung zur
Biomedizinischen Analytikerin motiviert haben, das Studium der
Molekularbiologie zu betreiben.

iv
v
Abstract
Epithelial ovarian cancer is the fourth leading cause of cancer-related death in
women and accounts for the highest mortality rate of all gynecological
malignancies. In fact, the cure rates have remained unchanged over the last 20
years though radical surgery, radiation therapy, chemotherapy and targeted
therapy have improved survival times. Thus, additional treatment options in
ovarian cancer therapy are urgently needed. It is documented that fatty acid
synthase (FASN) is overexpressed in more than 80% of ovarian carcinomas,
whereas in normal cells FASN is mostly absent. Therefore, FASN represents a
very promising molecular anticancer target. FASN has been identified as an
independent prognostic factor for clinical outcome in ovarian cancer and
increased expression of FASN in ovarian neoplasms predicts shorter survival.
Natural and synthetic compounds have been described that inhibit FASN activity
very efficiently. Moreover, inhibition of FASN causes growth arrest in breast
cancer and delays disease progression of ovarian carcinomas in xenograft
models. Up to date, a conclusive molecular explanation of the anti-proliferative
and death-promoting effect of FASN inhibitors is still missing. This work is the
first report about epigenetically modulating activity of FASN inhibition. Using the
FASN inhibitor C75, we could show a demethylation of the hypermethylated
death associated protein (DAP) kinase promoter region followed by enhanced
DAP kinase mRNA transcription in the ovarian cancer cell line A2780. The
expression of epigenetically active enzymes was also found to be modulated by
the FASN blocking drug C75. We further pointed out several effects of FASN
inhibition including enhanced ubiquitin-dependent protein degradation and
downregulation of PI3K signaling molecules. Moreover, we could confirm anti-
proliferative and apoptosis-inducing actions induced by FASN inhibition in
Affimetrix microarray mRNA expression analyses.
vi
Zusammenfassung
Epitheliales Ovarialkarzinom ist die vierthäufigste Todesursache bei Frauen
aufgrund von Krebs und hat die höchste Mortalitätsrate von allen
gynäkologischen Erkrankungen. In den letzten 20 Jahren blieb die Heilungsrate
von Ovarialkarzinomen weitläufig unverändert, allerdings konnte der
Überlebenszeitraum durch chirurgische Operation, Strahlentherapie,
Chemotherapie und gezielter molekularen Therapie verlängert werden. Deshalb
werden zusätzliche Behandlungsmethoden in der Ovarialkarzinom-Therapie
dringend gebraucht. Das Enzym Fettsäuresynthase (FASN) wird in über 80% der
Ovarialkarzinome über-exprimiert, wohingegen dieses Enzym in normalen Zellen
meist gar nicht exprimiert wird. Aufgrund dieser Tatsache repräsentiert FASN ein
vielversprechendes molekulares Ziel für eine Therapie gegen Krebs. FASN ist
außerdem ein unabhängiger prognostischer Faktor für den klinischen Ausgang
bei Ovarialkarzinomen und sagt einen kürzeren Überlebenszeitraum bei
ovarialer Neoplasie voraus. Es wurden bereits einige natürliche und synthetische
Substanzen beschrieben, die die FASN-Aktivität sehr effizient inhibieren.
Darüber hinaus konnte gezeigt werden, dass die Inhibierung von FASN zu einem
Wachstumsarrest von Mammakarzinomen führt und das Fortschreiten von
Ovarialkarzinomen in Xenograft Modellen verzögert wird. Bis jetzt konnte man
noch keine schlüssige molekulare Erklärung für die anti-proliferativen und
Apoptose-induzierenden Effekte von FASN-Blockern finden. Diese Arbeit
berichtet erstmalig über die epigenetisch modulierenden Aktivitäten der FASN-
Inhibierung. Unter Verwendung des FASN-Inhibitors C75 konnte eine
Demethylierung der hypermethylierten „death associated protein“ (DAPK)
Promotor Region und eine anschließende vermehrte DAPK mRNA Transkription
in der ovarialen Karziomzelllinie A2780 gezeigt werden. Darüber hinaus wurde in
dieser Arbeit auch eine Modulierung der Expression von epigenetisch aktiven
Enzymen durch FASN-Inhibierung beschrieben. Zudem wurden mehrere
zusätzliche Effekte der FASN-Blockade herausgearbeitet, die unter anderem

vii
Ubiquitin-abhängige Protein Degradation und Aktivitätshemmung der PI3K/AKT
Signal Moleküle beinhalten. Abschließend konnten die anti-proliferativen und
Apoptose-induzierenden Effekte der FASN-Inhibierung durch Affimetrix
Microarray mRNA Expressionsanalyse bestätigt werden.

viii
ix
Table of contents
DANKSAGUNG .................................................................................................. III
ABSTRACT ......................................................................................................... V
ZUSAMMENFASSUNG ...................................................................................... VI
TABLE OF CONTENTS ..................................................................................... IX
INDEX OF FIGURES ......................................................................................... XII
INDEX OF TABLES .......................................................................................... XIV
1 INTRODUCTION .......................................................................................... 1
1.1 DEFINITIONS ............................................................................................ 1
1.2 INCIDENCE AND MORTALITY RATE OF OVARIAN CANCER ............................. 2
1.3 EPIDEMIOLOGY AND HIGH-RISK POPULATION OF OVARIAN CANCER ............. 2
1.4 STAGING ................................................................................................. 3
1.5 TREATMENT OPTIONS IN OVARIAN CANCER ................................................ 5 1.5.1 Surgery .......................................................................................................... 5
1.5.2 First-line Therapy .......................................................................................... 6
1.5.3 Second-line Therapy ..................................................................................... 6
1.5.4 Radiation Therapy ......................................................................................... 6
1.5.5 Targeted Therapies ....................................................................................... 7
1.6 FREQUENT MOLECULAR ABERRATIONS IN OVARIAN CANCER ....................... 8 1.6.1 Receptor Tyrosine Kinases ........................................................................... 8
1.6.2 Phosphatidylinositol 3-kinase (PI3K)/AKT/mTOR/p70S6K ........................... 9
1.6.3 Fatty Acid Synthase (FASN) ....................................................................... 11
1.6.4 Cell cycle control at G1/S checkpoint .......................................................... 20
1.6.5 Epigenetic gene silencing in cancer ............................................................ 22
1.7 THE UBIQUITIN/PROTEASOME PATHWAY .................................................. 24
2 MATERIALS AND METHODS ................................................................... 27
2.1 CELL CULTURE AND CELL LINE ................................................................ 27
x
2.1.1 Maintenance of Cells .................................................................................. 27
2.1.2 Storage of Cells .......................................................................................... 28
2.1.3 Used drugs ................................................................................................. 29
2.2 GENE EXPRESSION ANALYSIS ON MRNA LEVEL ......................................... 30 2.2.1 Treatment of Cells ...................................................................................... 30
2.2.2 RNA Isolation .............................................................................................. 31
2.2.3 RNA-Measurement ..................................................................................... 32
2.2.4 cDNA Synthesis .......................................................................................... 35
2.2.5 Real Time RT-Polymerase Chain Reaction (PCR) ..................................... 35
2.3 METHYLATION SPECIFIC REAL TIME RT-PCR ........................................... 41 2.3.1 Treatment of Cells ...................................................................................... 41
2.3.2 DNA Isolation .............................................................................................. 42
2.3.3 Sodium Bisulfide Conversion ...................................................................... 44
2.3.4 Nested PCR – 1st Step ................................................................................ 46
2.3.5 Real Time PCR using SYBR Green – 2nd step of nested PCR ................... 49
2.4 WESTERN BLOTTING – PROTEIN ANALYSIS ................................................ 55 2.4.1 Treatment of the Cells ................................................................................ 55
2.4.2 RIPA Lysis .................................................................................................. 56
2.4.3 Protein Quantification ................................................................................. 57
2.4.4 SDS- Polyacryl Amide Gel Electrophoresis (PAGE) ................................... 58
2.4.5 Electrotransfer ............................................................................................ 60
2.4.6 Immunostaining of the Blot Membranes ..................................................... 61
2.4.7 Stripping of Membranes .............................................................................. 65
2.4.8 Densitometry of the Protein Bands ............................................................. 65
2.5 MRNA GENE EXPRESSION ARRAY ........................................................... 66 2.5.1 Treatment of Cells ...................................................................................... 68
3 RESULTS .................................................................................................... 69
3.1 CHANGES IN MRNA LEVELS RESULTING FROM FASN-INHIBITION BY C75 OR
FROM PI3K-INHIBITION BY LY294002 IN A2780 CELLS ......................................... 69 3.1.1 Changes in mRNA expression of tumor suppressor genes resulting from
FASN-inhibition by C75 or PI3K-inhibition by LY294002 in A2780 cells ................ 69
xi
3.1.2 Changes in mRNA expression level of apoptosis associated genes resulting
from FASN-inhibition by C75 or PI3K-inhibition by LY294002 in A2780 cells ......... 75
3.1.3 Changes in mRNA expression level of epigenetically active enzymes
resulting from FASN-inhibition by C75 or PI3K-inhibition by LY294002 in A2780
cells .................................................................................................................... 77
3.2 CHANGES IN METHYLATION STATUS OF TUMOR SUPPRESSOR GENES
RESULTING FROM FASN-INHIBITION BY C75 OR PI3K-INHIBITION BY LY294002 IN
A2780 CELLS ................................................................................................... 82 3.2.1 The promoter of the p15INK4b tumor suppressor gene is not hypermethylated
in A2780 cells .......................................................................................................... 83
3.2.2 C75-mediated upregulation of DAPK mRNA correlates with demethylation
of the hypermethylated gene promoter ................................................................... 84
3.3 THE FASN TARGETING DRUG C75 AFFECTS PROTEIN EXPRESSION AND
ACTIVITY (PHOSPHORYLATION) OF PI3K/AKT EFFECTOR MOLECULES ................... 86 3.3.1 Reduction of protein expression and phosphorylation of PI3K/AKT signaling
molecules by the FASN inhibitor C75 ..................................................................... 86
3.3.2 Reduction of protein expression levels caused by FASN inhibition appears
not to be due to translation inhibition by dephosphorylated 4eBP1 ........................ 92
3.3.3 Reduction of protein expression caused by FASN inhibition appears to be
due to enhanced protein degradation ..................................................................... 93
3.3.4 Reduction of protein expression caused by FASN inhibition appears to be
due to enhanced proteasomal protein degradation ................................................. 95
3.4 CHANGES IN GENE EXPRESSION RESULTING FROM INHIBITION OF FASN ..... 96
4 DISCUSSION ........................................................................................... 105
REFERENCES ................................................................................................ 117
CURRICULUM VITAE ..................................................................................... 133
xii
Index of figures
Figure 1: Scheme of PI3K/AKT/mTOR/p70S6K signaling cascade ............................... 11
Figure 2: Warburg effect connected with fatty acid biosynthesis in cancer cells ............ 13
Figure 3: Crosstalk between EGFR family members and FASN .................................... 16
Figure 4: Blocking sites of FASN inhibitors .................................................................... 18
Figure 5: Several molecular mechanisms of the tumoricidal Effects of FASN Inhibition 20
Figure 6: Mechanism of cyclin dependent kinase inhibitors ........................................... 22
Figure 7: The Ubiquitin/Proteasome pathway ................................................................ 25
Figure 8: Chemical Structure of C75 .............................................................................. 29
Figure 9: Chemical structure of LY294002 ..................................................................... 30
Figure 10: Chemical Structure of Cycloheximide ........................................................... 30
Figure 11: Example for Qualitative Control of Isolated Total RNA by 1% Agarose Gel . 34
Figure 12: Schemata of Real Time RT-PCR using Gene Expression Assay. ................ 38
Figure 13: Example of First Step PCR Product of p15INK4b Extern Primers .................... 49
Figure 14: Basic Steps of Quantitative Real Time PCR Based on SYBR Green
Intercalation .................................................................................................................... 51
Figure 15: Example of a Melting Curve after SYBR Green Real Time PCR Amplification
....................................................................................................................................... 54
Figure 16: Example of CT-Detection Curve Performing SYBR Green Real Time PCR
Amplification ................................................................................................................... 55
Figure 17: Assembly of Transfer Apparatus ................................................................... 61
Figure 18: Detection of Proteins by Chemoluminescence ............................................. 62
Figure 19: Inhibition of FASN or PI3K increases mRNA expression of cyclin-dependent
kinase inhibitor p15INK4b. ................................................................................................. 71
Figure 20: Inhibition of FASN or PI3K decreases mRNA expression of cyclin-dependent
kinase inhibitor p16INK4b. ................................................................................................. 72
Figure 21: Inhibition of FASN or PI3K increases mRNA expression of the tumor
suppressor gene CDH1. ................................................................................................. 73
Figure 22: Inhibition of FASN or PI3K increases mRNA expression of the tumor
suppressor gene DAPK. ................................................................................................. 74
xiii
Figure 23: FASN inhibitor increases mRNA expression of death associated FAS more
significantly than PI3K inhibitor. ...................................................................................... 76
Figure 24: FASN inhibition increases mRNA expression of MnSOD2 more significantly
than PI3K inhibition. ........................................................................................................ 77
Figure 25: Inhibition of FASN or PI3K decreases DNMT1 mRNA expression level after
24 hours of treatment. ..................................................................................................... 79
Figure 26: Inhibition of FASN or PI3K increases DNMT3a mRNA expression. .............. 80
Figure 27: Inhibition of FASN or PI3K decreases DNMT3b mRNA expression level. .... 81
Figure 28: Inhibition of FASN or PI3K increases mRNA expression of HDAC2. ............ 82
Figure 29: Analysis of the methylation status of the p15INK4b promoter region. ............... 84
Figure 30: Analysis of the methylation status of the DAPK promoter region using
quantitative methylation-specific PCR (Q-MSP). ............................................................ 85
Figure 31: FASN inhibition reduces phosphorylation and expression of p15INK4b, ERK1/2
and PI3K downstream signaling proteins. ....................................................................... 88
Figure 32: PI3K inhibition by LY294002 is more effective in blocking the PI3K pathway
than FASN inhibition. ...................................................................................................... 91
Figure 33: FASN inhibition enhances protein degradation. ............................................ 94
Figure 34: Fatty acid synthase and proteasome pathways crosstalk with each other. ... 96
xiv
Index of tables
Table 1: Mastermix for cDNA sythesis ........................................................................... 35
Table 2: TaqMan Gene Expression Assay Probes used for Real Time RT-PCR .......... 39
Table 3: PCR Mix for Real Time RT-PCR Containing TaqMan Gene Expression Assay
Probes ............................................................................................................................ 39
Table 4: Cycling Conditions for Real Time RT-PCR using predeveloped TaqMan Gene
Expression Assay Probes .............................................................................................. 40
Table 5: Conditions for Sodium Bisulfite Conversion ..................................................... 45
Table 6: Nucleotide Sequences of Extern Primers of p15INK4b ....................................... 46
Table 7: Components for First Step PCR of p15-e ......................................................... 47
Table 8: Cyling Conditions for First Step PCR in MSP for Amplification of p15 external
gene region .................................................................................................................... 48
Table 9: Primer Sequences for SYBR Green Real Time RT-PCR ................................. 52
Table 10: Components for SYBR Green Real Time PCR Mix ....................................... 53
Table 11: Cyling Conditions for SYBR Green Real Time PCR Amplification of p15INK4b
methylated, p15INK4b unmethylated ................................................................................. 53
Table 12: Cyling Conditions for SYBR Green Real Time PCR Amplification of DAP
kinase methylated, and DAP kinase unmethylated ........................................................ 53
Table 13: Ingredients for RIPA Lysis Buffer ................................................................... 56
Table 14: RIPA+ Lysis Buffer ......................................................................................... 57
Table 15: Ingredients for 4 x Sample Buffer ................................................................... 58
Table 16: Preparation of 30% Acrylamide/Bis Solution .................................................. 59
Table 17: Separating Gel. Preparation of 7,5% Polyacryl amide gel ............................. 59
Table 18: Stacking Gel. Preparation of 4% Polyacryl amide gel .................................... 60
Table 19: First Antibodies ............................................................................................... 64
Table 20: Secondary Antibodies .................................................................................... 65
Table 21: Specifications of Affymetrix Human GeneChip Gene 1.0 ST Array ............... 68
Table 22: mRNA gene expression array ...................................................................... 104
1
1 Introduction
1.1 Definitions
The ovaries contain three kinds of tissue. First, epithelial cells which cover the
ovary, second, germ cells which produce the oocyte inside the ovary, and third,
stromal cells which produce most of the female hormones such as estrogen and
progesterone. The tumors in the ovary are named for the kinds of cells the tumor
started from. Therefore, there are three main types of ovarian tumors. The
epithelial ovarian tumor is the most common type of ovarian tumors and can be
divided into three sub-groups describing the malignancy of the tumor. The
benign epithelial tumor does not spread whereas the epithelial ovarian tumors of
low malignant potential (LMP tumors) only spreads slowly. This kind of epithelial
ovarian tumor is also known as borderline tumor, which cells do not have
cancerous morphology and mostly affects women at a younger age.
Approximately nine out of ten ovarian carcinomas are epithelial ovarian cancers
and the cell line A2780 that is used for several experiments in this work was also
isolated from this kind of ovarian cancer. For the sake of completeness, it should
be mentioned that also germ cell tumors such as teratoma, dysgerminoma,
endodermal sinus tumor or choriocarcinoma can occur. Most of the germ line
tumors are not cancerous. Stromal tumors can be either benign such as
thecomas and fibromas or cancerous such as granulose cell tumor, granulose-
theka tumors or sertoli-leydig cell tumors. More than fifty percent of the women
suffering from stromal tumors are over fifty year old. Furthermore, some rare
cancers show similar symptoms to epithelial ovarian cancer. These are the
primary peritoneal carcinoma, which starts outside the ovaries and grows from
the cells that line the pelvis and the abdomen and second the fallopian tube
cancer which starts from the tube that carries the oocyte from the ovary to the
Introduction
2
uterus. Moreover, ovarian cysts also show similar symptoms to epithelial ovarian
cancer. Ovarian cysts collect fluid inside an ovary, which is often absorbed
without any treatment (American Cancer Society, 2009).
1.2 Incidence and Mortality Rate of Ovarian Cancer
Epithelial ovarian cancer is the fourth leading cause of cancer-related death in
women and accounts for the highest mortality rate of all gynecological
malignancies (Brewer et al., 2003). Undisturbed growth of the tumor in the
peritoneal cavity where the ovaries are localized without any symptoms often
gives reasons for poor prognosis of epithelial ovarian carcinoma. Moreover, the
detection of ovarian cancer at an early and curable state is very difficult due to
the asymptomatic appearance of this disease (Cannistra et al., 2004). The
overall prognosis of the 5-year survival is less than 30%, whereas 70% of these
tumors are diagnosed with metastases. 90% of stage IA tumors and 70% of
stage II tumors can be cured by current treatment actions, but the cure rate
decreases below 30% for tumor stage III and IV (Brewer et al., 2003). In fact the
cure rates have remained unchanged the last 20 years though radical surgery,
radiation therapy, chemotherapy and targeted therapy have improved survival
times (Brewer et al., 2003).
1.3 Epidemiology and High-Risk Population of Ovarian Cancer
Ovarian surface epithelial cells are normally quiescent but proliferate after
ovulation to repair the epithelial wound caused by the release of an oocyte from
a mature follicle. Growth factors and high estrogen may provide stimuli for
proliferation and wound healing (Brewer et al., 2003). Thus, larger number of
Introduction
3
ovulatory cycles caused by fertility drugs or early age at menarche and late age
at menopause increase the risk of ovarian cancer. On the contrary, suppressed
ovulation caused by pregnancy, breast feeding and birth control pill is associated
with decreased risk of developing epithelial ovarian cancer. Moreover, BRCA1
mutation is linked to an approximately 40-60% risk of developing ovarian cancer
and an 85% risk of developing breast cancer. Advanced age is another risk
factor for developing epithelial ovarian cancer (Brewer et al., 2003).
1.4 Staging
Staging is the process of finding out how far the cancer has spread and
influences the treatment. The TNM system is used to describe the cancer in
terms of the extent of the tumor (T), whether or not it has spread to the nearby
lymph nodes (N), and whether it has metastasized to organs farther away (M).
When the TNM groups have been described, the information is combined and
assigned to a number from 1 to 4 (American Cancer Society, 2009).
Tumors
Primary tumors (T) are classified according to the following categories:
T1: The tumor is limited to one or both ovaries.
T1a: The tumor is limited to one ovary. The capsule of the tumor is intact, there
is no tumor on the ovarian surface, and there are no ovarian cancer cells in
ascites or peritoneal lavage.
T1b: The tumor is limited to both ovaries. The capsule is intact, there is no tumor
on the ovarian surface, and there are no ovarian cancer cells in ascites or
peritoneal lavage.
T1c: The tumor is limited to one or both ovaries with any of the following:
ruptured capsule, tumor on ovarian surface, or cancer cells in the ascites or
peritoneal lavage.
Introduction
4
T2: The tumor involves one or both ovaries and has spread into the pelvis.
T2a: The tumor has spread and/or attaches to the uterus and/or fallopian tubes.
There are no ovarian cancer cells in ascites or peritoneal lavage.
T2b: The tumor has spread to other pelvic tissues. There are no cancer cells in
ascites or peritoneal lavage.
T2c: The tumor has spread to pelvic tissues, with ovarian cancer cells in ascites
or peritoneal lavage.
T3: The tumor involves one or both ovaries, with microscopically confirmed
peritoneal metastasis outside the pelvis and/or metastasis to regional lymph
node(s).
T3a: Microscopic peritoneal metastasis beyond the pelvis.
T3b: Macroscopic peritoneal metastasis beyond the pelvis, 2 cm or less in
greatest dimension.
T3c: Peritoneal metastasis beyond the pelvis, more than 2 cm in greatest
dimension.
Nodes
The regional lymph nodes (N) are classified according to the following
categories:
N0: The regional lymph nodes contain no metastases.
N1: There is evidence of lymph node metastasis.
Metastasis
The state of metastasis (M) is classified according to the following categories:
M0: There are no distant metastases found.
M1: Distant metastases are present.
Stage Grouping
The four basic stage groupings within the TNM system:
Stage I: The cancer is contained within the ovaries
Introduction
5
Stage Ia: T1a, N0, M0
Stage Ib: T1b, N0, M0
Stage Ic: T1c, N0, M0
Stage II: The cancer is in one or both ovaries and has spread to other organs in
the pelvis such as the bladder, colon, rectum, or uterus
Stage IIa: T2a, N0, M0
Stage IIb: T2b, N0, M0
Stage IIc: T2c, N0, M0
Stage III: The cancer is in one or both ovaries and has spread to one or both of
the following: the lining of the abdomen or the lymph nodes.
Stage IIIa: T3a, N0, M0
Stage IIIb: T3b, N0, M0
Stage IIIc: T3c, N0, M0, or T(any), N1, M0
Stage IV: This is the most advanced stage. The cancer has spread from one or
both ovaries to distant organs, such as the liver or lungs, or there may be ovarian
cancer cells in the fluid around the lungs.
Stage IV: T(any), N(any), M1
(American Cancer Society, 2009; Oncologychannel, 2009)
1.5 Treatment Options in Ovarian Cancer
1.5.1 Surgery
Surgery is usually performed to remove as much of the tumor tissue as possible.
The tumor, lymph nodes in the abdomen, lymph nodes in the pelvis, abdominal
fluids, uterus, both ovaries, both fallopian tubes and the omentum are also
analyzed by a gynecologic oncologist to stage the cancer. Depending on the
stage of the tumor the appropriate treatment is chosen (American Cancer
Society, 2009).
Introduction
6
1.5.2 First-line Therapy
Most patients suffering from advanced ovarian cancer are not curable by surgery
alone. Therefore, chemotherapy represents an essential method of treatment.
Ovarian cancers in general are seen as chemotherapy-sensitive tumors because
approximately 75% of the patients response to an initial treatment with platinum-
containing drugs cisplatin and carboplatin either used alone or in combination
with the taxane-containing drug paclitaxel. The treatment with platin-
combinations provides longer survival rates than without platin or platin
monotherapy. However, in 80-85% of the patients the tumors become resistant.
If the duration of remission is longer than 6 months the tumor is considered as
platinum-sensitive and the same drugs are used in second-line therapy as in
first-line therapy. 25% of these patients show response to this kind of second-line
therapy. Patients who have a shorter duration of remission than 6 months after
first-line therapy have very poor prognosis (Kelland et al., 2005).
1.5.3 Second-line Therapy
As many tumors become resistant to the drugs of the first-line therapy,
doxorubicin, topotecan, hexamethylmelamine, gemcitabine or docetaxel several
other drugs are used for the second-line therapy (Kelland et al., 2005).
1.5.4 Radiation Therapy
Radiation therapy used high energy x-rays to reduce ovarian cancer cells and to
shrink the tumor in its size. This kind of treatment may be executed additionally
and is only rarely used as the main treatment for ovarian cancer (American
Cancer Society, 2009).
Introduction
7
1.5.5 Targeted Therapies
Because of the resistance of many tumors to cytotoxic agents used in
chemotherapy additional treatment options in ovarian cancer therapy are
urgently needed.
1.5.5.1 Monoclonal Antibodies
There are several drugs that selectively recognize proteins or receptors of the
ovarian tumor cells. For example, intraperitoneal administration of cisplatin- or
radio-labelled monoclonal antibodies are currently exploited in clinical trials. The
advantage of (radio-) immunotherapy is the possibility of regional administration
and thereby limiting systemic side-effects. Furthermore, monoclonal antibodies
targeting the ovarian carcinoma biomarker CA-125 are already tested (Kelland et
al., 2005). Monoclonal antibodies binding to EGFR (cetuximab) or to the ErbB2
(trastuzumab, pertuzumab) are reported to improve ovarian cancer treatment
only in combination with standard cytotoxic agents (docetaxel) and may be
considered for clinical trials (Bijman et al., 2009).
1.5.5.2 Small Molecules
Several small molecules have been designed to inhibit cancer specific pathways.
Therefore, agents targeting drug resistance mechanisms or drugs that disrupt
the cancerous angiogenesis are being developed. Furthermore, tumor specific
enhanced cell proliferation and survival pathways can be blocked by small
molecules inhibiting phosphorylation and activation of responsible kinases.
Concerning this strategy, agents targeting EGFR family members, K-Ras
inhibitors and PI3K/Akt/mTOR inhibitors are already at clinical level (Kelland et
al., 2005).
Introduction
8
1.6 Frequent Molecular Aberrations in Ovarian Cancer
Proto-oncogenes and tumor suppressor genes play a critical role in regulation of
proliferation and tumorigenesis. Activating mutations of proto-oncogenes
promote transformation of normal cells into malignant ones. Furthermore,
inactivated tumor suppressor genes, which normally inhibit cell division and
promote cell death, cause loss of the negative control of the cell (Nielson et al.,
2004).
1.6.1 Receptor Tyrosine Kinases
The epidermal growth factor receptor (EGFR) family consisting of EGFR, ErbB2,
ErbB3 and ErbB4 is responsible for growth regulation and differentiation in
response to ligand binding and heterodimer formation among EGFR family
members. The receptors are located in the cell membrane and show high
structural homology. Neuregulins 1-4 serve as ligands for ErbB3 and ErbB4,
while epiregulin and ß-cellulin activate ErbB1 and ErbB4. While ErbB2 is lacking
a known ligand, ErbB3 lacks a functional kinase domain. Ligand binding induces
ErbB (hetero-) dimer formation, whereas one ErbB kinase domain activates its
dimer-partner. This leads to autophosphorylation or transphosphorylation of
tyrosine residues that causes interaction between the activated receptor and
SH2 or adapter proteins, which promote further downstream signaling (Citri et
al., 2006). Several ovarian carcinomas show abnormal expression and abnormal
signaling through EGFR pathways that confer negative prognosis in malignancy
(Graeff et al., 2008). EGFR is reported to be overexpressed in more than 55% of
ovarian cancers (Lassus et al., 2006) and more than 35% harbour molecular
aberrations in ErbB2 (Lassus et al., 2004). However, several clinical studies
document that monotherapies with EGFR or ErbB2 inhibitors or antibodies are
largely inefficient against ovarian cancer (Reibenwein et al., 2008).
Introduction
9
1.6.2 Phosphatidylinositol 3-kinase (PI3K)/AKT/mTOR/p70S6K
It is reported that a proportion of ovarian carcinomas harbor molecular
aberrations of PI3K and/or PTEN. Receptor tyrosine kinases activate PI3K that is
involved in many cellular functions such as proliferation, differentiation,
tumorigenesis, angiogenesis and anti-apoptosis. Amplification of PI3K is
observed in approximately 40% of ovarian carcinoma cell lines and patient tumor
samples (Shayesteh et al., 1999; Meng et al., 2006). PI3K can be activated by
the ErbB receptor tyrosine kinase family or via insulin-like growth factor-I
receptor, which can interact with ErbB receptors to integrate signals across
distinct signaling pathways (Olayioye et al., 2000). The tumor suppressor gene
Phosphatase and Tensin homolog (PTEN) is mutated especially in advanced
ovarian carcinomas and decreased PTEN expression is associated with
enhanced progression of the tumor. PTEN is a lipid phosphatase that
counteracts PI3K by removing phosphate from the D3 position of the inositol ring
of PIP3 (Datta et al., 1999). The best known downstream target of PI3K is the
serine-threonine kinase AKT, which has three isoforms that share high structural
homology. AKT is recruited to the plasma membrane and binds to PIP3 via the
pleckstrin homology domain, becomes phosphorylated by PDK1 at Thr308 and
finally by PDK2 at Ser473 (Stephens et al., 1998). AKT1 kinase activity is
frequently enhanced in a proportion of ovarian carcinomas and several studies
have established that AKT activation promotes tumor cell survival, cancer cell
growth and invasiveness (Datta et al., 1999). Phosphorylation of AKT at Ser473
can also be driven by mammalian target of rapamycin (mTOR) associated with
rapamycin-insensitive companion of mTOR (rictor) which is also named
mTORC2 (Sarbassov et al., 2006). AKT directly phosphorylates tuberous
sclerosis complex 2 (TSC2, tuberin) on multiple sites that abrogates the
inhibitory effects of the TSC1-TSC2 complex on Rheb and mTOR (Huang et al.,
2009). AKT can phosphorylate mTOR directly too (Manning et al., 2002). The
mTOR signaling is also observed to be constitutively activated in several cancers
Introduction
10
(Gao et al., 2004). The mTOR is phosphorylated by PI3K/AKT at Ser 2448.
(Nave et al., 1999). In response to low energy levels or under hypoxic conditions
the function of mTOR is blocked by tuberous sclerosis complex proteins TSC1
and TSC2 (Easton et al., 2006). The mTOR is a serine-threonine kinase that by
substrate phosphorylation transmits activation from AKT to p70S6K and
inactivates eukaryotic initiation factor 4E (eIF4E) inhibitor binding protein 1
(4eBP1) that normally blocks cap-dependent translation. Phosphorylation of
4eBP1 at Ser65 by mTOR results in release of eIF4E and activation of cap-
dependent mRNA translation. The downstream effector protein p70S6K is a
serine-threonine kinase. In total, two isoforms of S6K with 2 splice variants each
have been identified: The cytoplasmatic p70S6K1 and p54S6K2 and the nuclear
p85S6K1 and p60S6K2. Phosphorylation of p70S6K at Thr389 is closely related
to its kinase activity (Pullen et al., 1997). The p70S6K1 is an important cascade
molecule downstream of PI3K and AKT in tumor cell progression and
proliferation (Meng et al., 2006; Gao et al., 2004) and ubiquitination-dependent
degradation of p70S6K1 has recently been associated to the regulation of its
steady-state level (Wang et al., 2008). Moreover, S6K1 is reported to be
overexpressed or constitutively active in early stages of transformation in ovarian
epithelium with BRCA1 mutations (Easton et al., 2006). The p70S6K
phosphorylates the S6 protein of the 40S ribosomal subunit and is involved in
translation control.
Introduction
11
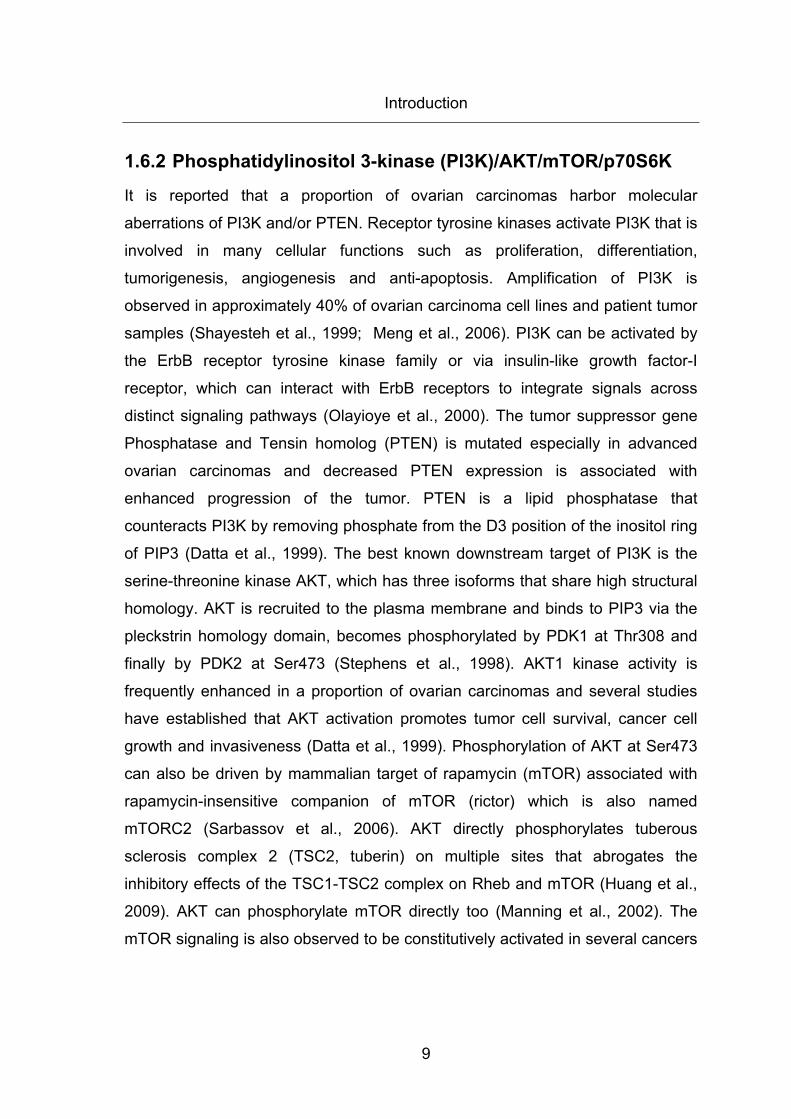
Figure 1: Scheme of PI3K/AKT/mTOR/p70S6K signaling cascade Source: “Cell Signaling Technology Inc. , 2007-2008, Catalog and Technical Reference, p.125, mTOR” – with modifications
1.6.3 Fatty Acid Synthase (FASN)
It is documented that FASN protein is overexpressed in more than 80% of
ovarian carcinomas (Alo et al., 2000). Furthermore, FASN has been identified as
an independent prognostic factor for clinical outcome in ovarian cancer and
increased expression of FASN in ovarian neoplasms predicts shorter survival
(Graeff et al., 2008; Reibenwein et al., 2008; Gansler et al., 1997). Moreover,
inhibition of FASN causes growth arrest in breast cancer and delays disease
progression of ovarian carcinomas in xenograft models (Gansler et al., 1997;
Pizer et al., 1996). Cancers usually reveal increased de novo lipogenesis as fatty
acids are essential for all biological membranes and important for energy
Introduction
12
metabolism. Normal cells usually prefer exogenously-derived fatty acids for the
synthesis of new lipids. The biosynthesis of endogenously-synthesized fatty
acids is catalyzed by the multifunctional, homodimeric enzyme fatty acid
synthase (FASN) that is 250-270 kDa in size (Wakil et al., 2004). In normal
conditions FASN converts excess carbohydrate into fatty acids that are then
converted into triacylglycerols which can provide energy through ß-oxidation if
needed. During ß-oxidation acyl-coenzymeA (CoA) is broken down to acetyl-CoA
in the mitochondria of the cell. Acetyl-CoA is then the entry molecule for the citric
acid cycle. The main product of FASN is a 16-carbon fatty acid, palmitate that is
synthesized by using acetyl-CoA and malonyl-CoA as carbon donor and NADPH
as reducing agent. Besides the exacerbated de novo biogenesis of fatty acids in
cancer cells, high levels of carbon flux through aerobic glycolysis are hallmarks
of tumors and provide them growth advantages. This rapid consume of glucose
under aerobic conditions in tumor cells is named Warburg effect. In cancer cells
there are many enzymes involved in metabolism of glucose to fatty acids (Figure
2).
1.6.3.1 Biosynthesis of endogenously-synthesized fatty acids
First, glucose is taken up via glucose transporters and converted to glucose-6-
phosphate by hexokinase. Most of the glucose-6-phosphate is used for ATP
generation by the glycolytic pathway. Therefore, pyruvate is converted to acetyl-
CoA that enters the mitochondrian citric acid circle to generate ATP. Requisite
citrate, which could not be fully oxidized is converted back into acetyl-CoA by
ATP citrate lyase (ACLY). The rate limiting enzyme acetyl-CoA carboxylase
(ACACA) carboxylates a proportion of acetyl-CoA into malonyl-CoA. FASN
condensates acetyl-CoA and malonyl-CoA to the 16 carbon saturated fatty acid
palmitate and is dependent on NADPH, which is used as the reducing agent in
this reaction. NADPH can be acquired through the pentose phosphate pathway.
Palmitate and other saturated long-chain fatty acids can be converted into more
complex fatty acids that are then used for synthesis of phospholipids,
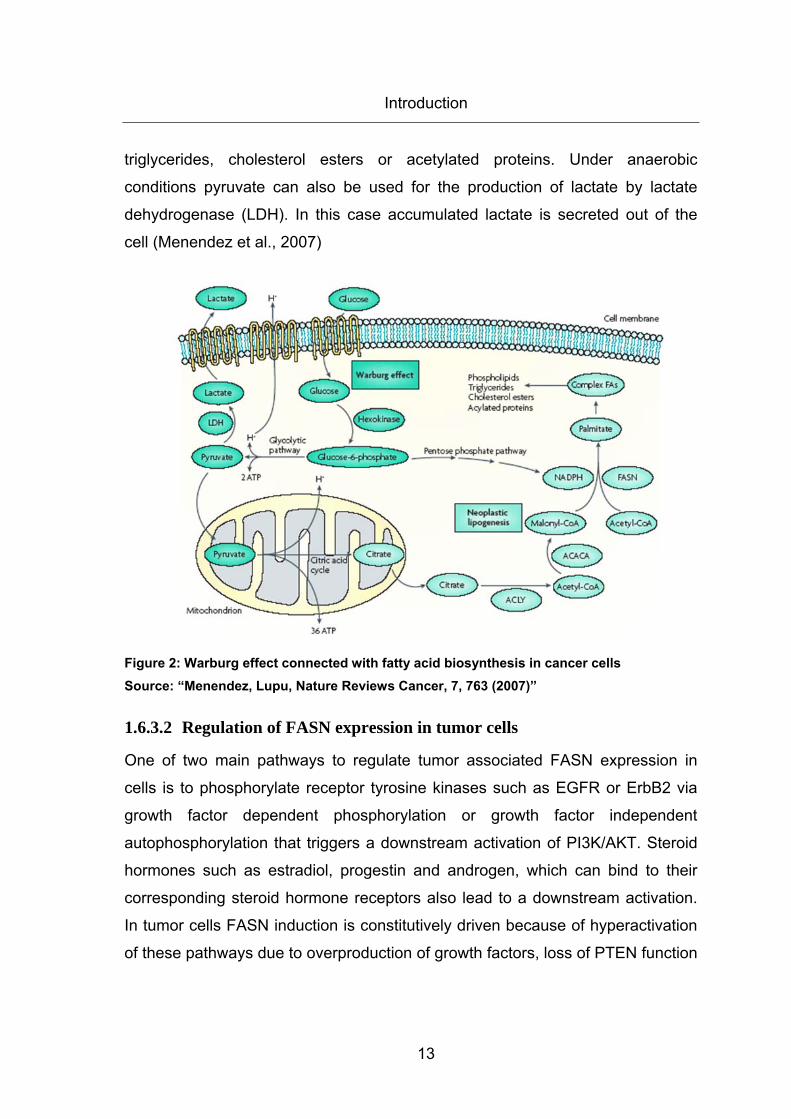
Introduction
13
triglycerides, cholesterol esters or acetylated proteins. Under anaerobic
conditions pyruvate can also be used for the production of lactate by lactate
dehydrogenase (LDH). In this case accumulated lactate is secreted out of the
cell (Menendez et al., 2007)
Figure 2: Warburg effect connected with fatty acid biosynthesis in cancer cells Source: “Menendez, Lupu, Nature Reviews Cancer, 7, 763 (2007)”
1.6.3.2 Regulation of FASN expression in tumor cells
One of two main pathways to regulate tumor associated FASN expression in
cells is to phosphorylate receptor tyrosine kinases such as EGFR or ErbB2 via
growth factor dependent phosphorylation or growth factor independent
autophosphorylation that triggers a downstream activation of PI3K/AKT. Steroid
hormones such as estradiol, progestin and androgen, which can bind to their
corresponding steroid hormone receptors also lead to a downstream activation.
In tumor cells FASN induction is constitutively driven because of hyperactivation
of these pathways due to overproduction of growth factors, loss of PTEN function
Introduction
14
and amplification of PI3K. However, in normal adipocytes and hepatocytes FASN
expression is regulated by carbohydrates, fatty acids and fasting. The expression
of FASN is directly modulated by the helix-loop-helix leucine zipper transcription
factor sterol regulatory element-binding protein 1c (SREBP1c) that binds to the
promoter region of FASN. Inactive SREBP1c precursor protein (pSREBP1c) is
anchored in the membrane of the endoplasmatic reticulum (ER) and can be
released by its activating protein SCAP. When enough activating signals have
entered the cell, the SCAP-pSREBP1c complex moves from the ER membrane
to the Golgi apparatus membrane where pSREBP1c is then cleaved by
proteases releasing the cytoplasmatic domain, which translocates into the
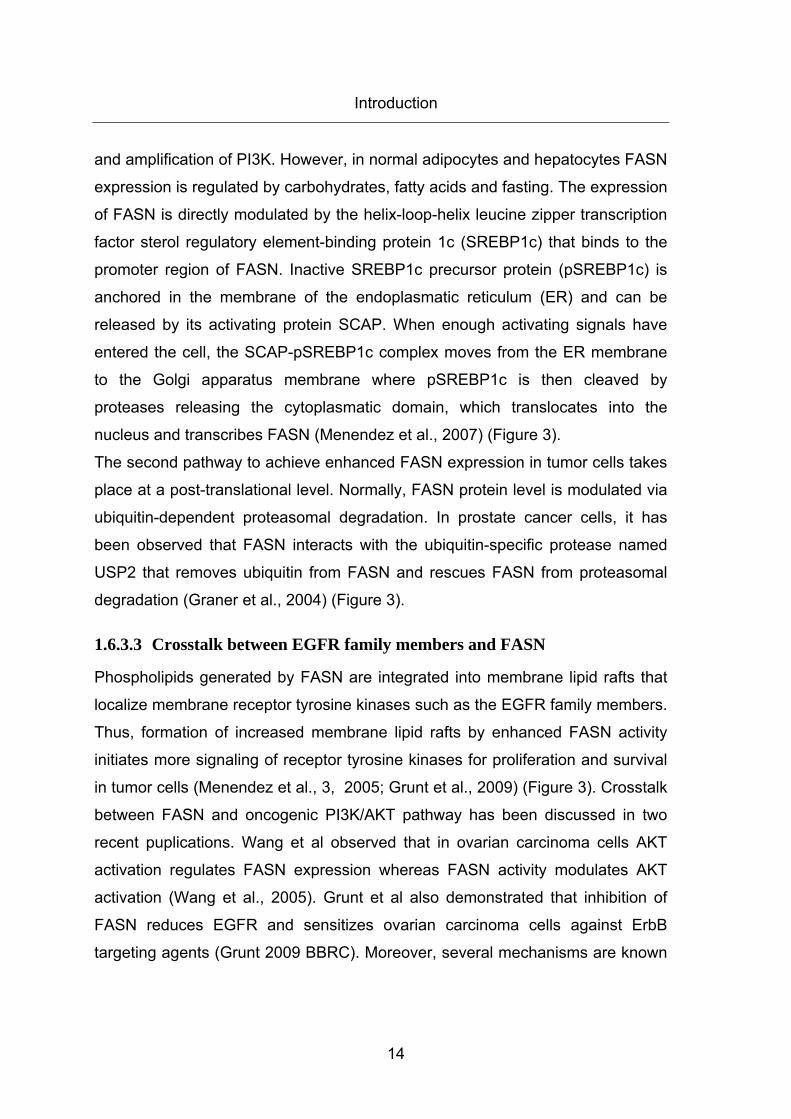
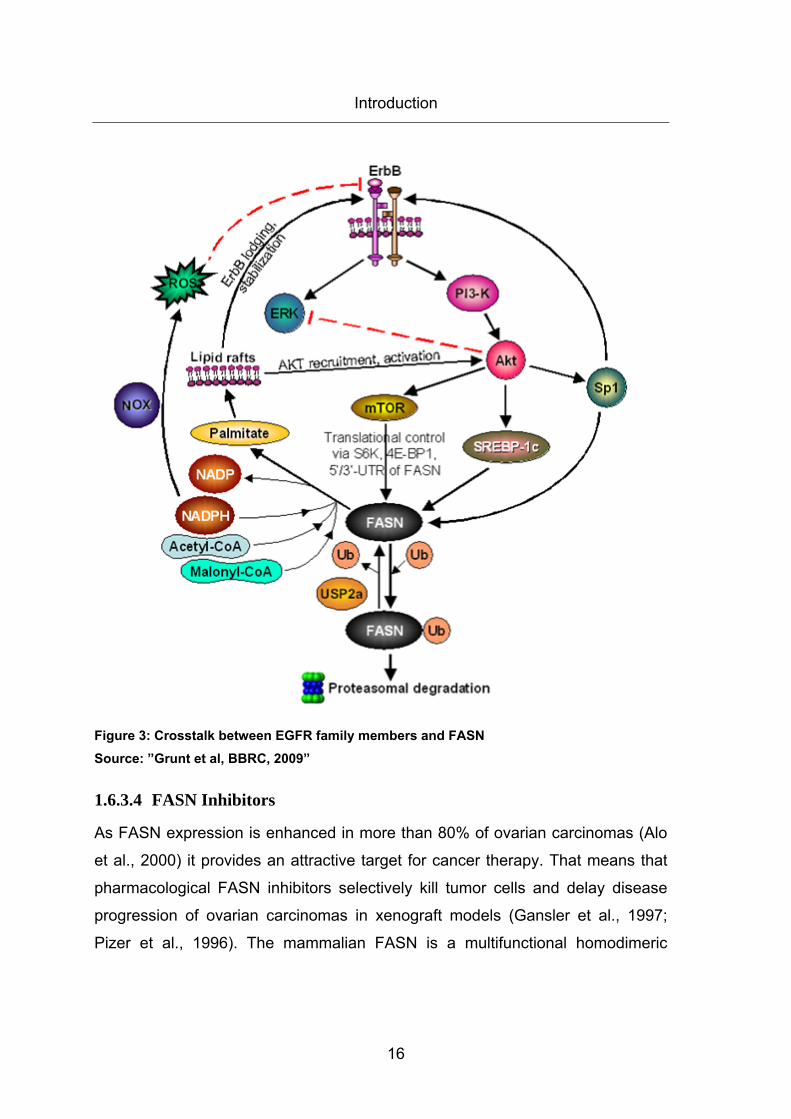
nucleus and transcribes FASN (Menendez et al., 2007) (Figure 3).
The second pathway to achieve enhanced FASN expression in tumor cells takes
place at a post-translational level. Normally, FASN protein level is modulated via
ubiquitin-dependent proteasomal degradation. In prostate cancer cells, it has
been observed that FASN interacts with the ubiquitin-specific protease named
USP2 that removes ubiquitin from FASN and rescues FASN from proteasomal
degradation (Graner et al., 2004) (Figure 3).
1.6.3.3 Crosstalk between EGFR family members and FASN
Phospholipids generated by FASN are integrated into membrane lipid rafts that
localize membrane receptor tyrosine kinases such as the EGFR family members.
Thus, formation of increased membrane lipid rafts by enhanced FASN activity
initiates more signaling of receptor tyrosine kinases for proliferation and survival
in tumor cells (Menendez et al., 3, 2005; Grunt et al., 2009) (Figure 3). Crosstalk
between FASN and oncogenic PI3K/AKT pathway has been discussed in two
recent puplications. Wang et al observed that in ovarian carcinoma cells AKT
activation regulates FASN expression whereas FASN activity modulates AKT
activation (Wang et al., 2005). Grunt et al also demonstrated that inhibition of
FASN reduces EGFR and sensitizes ovarian carcinoma cells against ErbB
targeting agents (Grunt 2009 BBRC). Moreover, several mechanisms are known
Introduction
15
that regulate ErbB2 signaling by FASN. First, blocking of FASN leads to
accumulation of its substrate malonyl-CoA, which enhances nuclear PEA3 that
represses ErbB2 transcription (Menendez et al., 5, 2004). Second, FASN
inhibition leads to an accumulation of NADPH. NADPH activates NADPH
oxidase (NOX) that generates reactive oxygen species (ROS), which disables
ErbB2 expression (Menendez et al., 2007) (Figure 3). Third, FASN blocking
reduces synthesis of phospholipids integrated into the membrane lipid rafts.
Therefore, ErbB2 receptors cannot be accommodated into the lipid raft
aggregates and are recycled by endocytosis and lysosomal degradation (Nagy et
al., 2002) (Figure 3). Fourth, activation of PI3K/AKT by FASN is reported to
upregulate the transcription factor Sp1 (Jin et al., 2007). The protein Sp1
stimulates EGFR transcription via binding to the EGFR promoter which contains
Sp1 motif (Liu et al., 1, 2005). Interestingly, FASN promoter also contains some
Sp1 transcription factor binding sites (Roder et al., 1999). Thus, maybe FASN
activates an autostimulatory loop by AKT that may increase both FASN and
EGFR transcription (Figure 3). Fifth, a recent report indicates that hypoxia
induces phosphorylation of AKT at Ser 473 which in turn activates SREBP1c to
enhance FASN transcription (Furuta et al., 2008)
Introduction
16
Figure 3: Crosstalk between EGFR family members and FASN Source: ”Grunt et al, BBRC, 2009”
1.6.3.4 FASN Inhibitors
As FASN expression is enhanced in more than 80% of ovarian carcinomas (Alo
et al., 2000) it provides an attractive target for cancer therapy. That means that
pharmacological FASN inhibitors selectively kill tumor cells and delay disease
progression of ovarian carcinomas in xenograft models (Gansler et al., 1997;
Pizer et al., 1996). The mammalian FASN is a multifunctional homodimeric
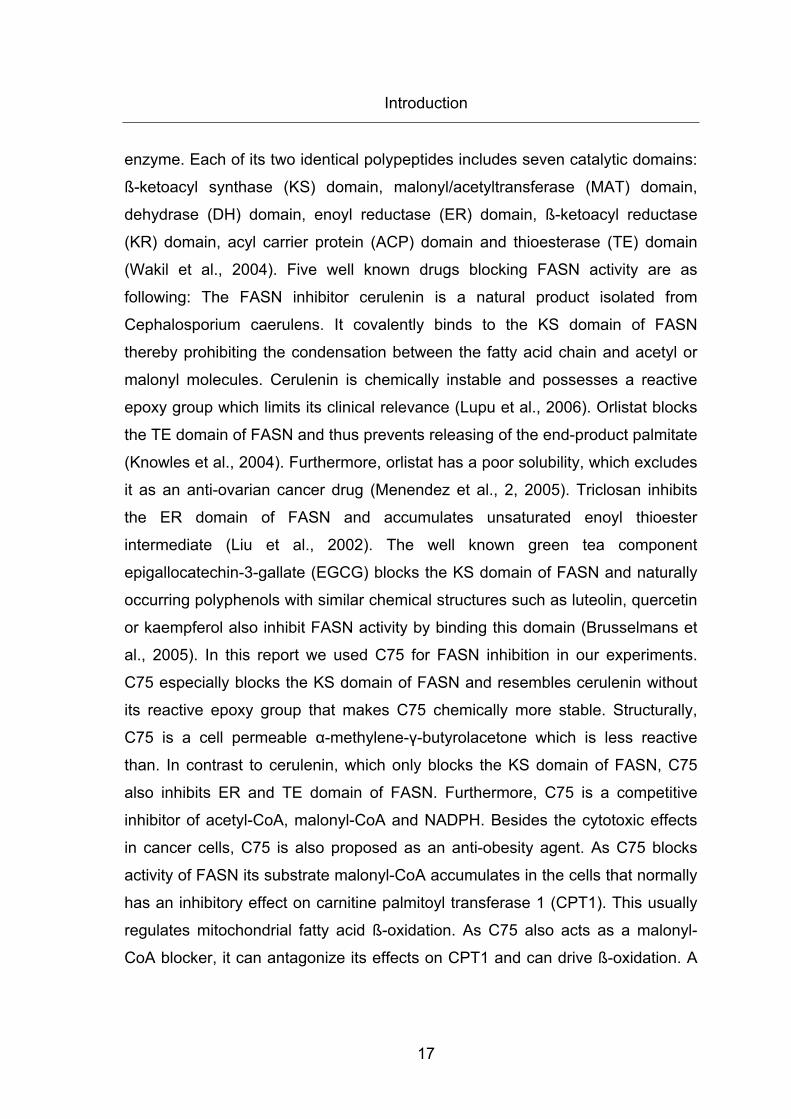
Introduction
17
enzyme. Each of its two identical polypeptides includes seven catalytic domains:
ß-ketoacyl synthase (KS) domain, malonyl/acetyltransferase (MAT) domain,
dehydrase (DH) domain, enoyl reductase (ER) domain, ß-ketoacyl reductase
(KR) domain, acyl carrier protein (ACP) domain and thioesterase (TE) domain
(Wakil et al., 2004). Five well known drugs blocking FASN activity are as
following: The FASN inhibitor cerulenin is a natural product isolated from
Cephalosporium caerulens. It covalently binds to the KS domain of FASN
thereby prohibiting the condensation between the fatty acid chain and acetyl or
malonyl molecules. Cerulenin is chemically instable and possesses a reactive
epoxy group which limits its clinical relevance (Lupu et al., 2006). Orlistat blocks
the TE domain of FASN and thus prevents releasing of the end-product palmitate
(Knowles et al., 2004). Furthermore, orlistat has a poor solubility, which excludes
it as an anti-ovarian cancer drug (Menendez et al., 2, 2005). Triclosan inhibits
the ER domain of FASN and accumulates unsaturated enoyl thioester
intermediate (Liu et al., 2002). The well known green tea component
epigallocatechin-3-gallate (EGCG) blocks the KS domain of FASN and naturally
occurring polyphenols with similar chemical structures such as luteolin, quercetin
or kaempferol also inhibit FASN activity by binding this domain (Brusselmans et
al., 2005). In this report we used C75 for FASN inhibition in our experiments.
C75 especially blocks the KS domain of FASN and resembles cerulenin without
its reactive epoxy group that makes C75 chemically more stable. Structurally,
C75 is a cell permeable α-methylene-γ-butyrolacetone which is less reactive
than. In contrast to cerulenin, which only blocks the KS domain of FASN, C75
also inhibits ER and TE domain of FASN. Furthermore, C75 is a competitive
inhibitor of acetyl-CoA, malonyl-CoA and NADPH. Besides the cytotoxic effects
in cancer cells, C75 is also proposed as an anti-obesity agent. As C75 blocks
activity of FASN its substrate malonyl-CoA accumulates in the cells that normally
has an inhibitory effect on carnitine palmitoyl transferase 1 (CPT1). This usually
regulates mitochondrial fatty acid ß-oxidation. As C75 also acts as a malonyl-
CoA blocker, it can antagonize its effects on CPT1 and can drive ß-oxidation. A
Introduction
18
second anti-obesity effect of C75 is the modulation of the metabolism in the
hypothalamus, where it mediates appetite suppression via malonyl-CoA
accumulation (Bentebibel et al., 2006). Patients suffering from cancer should not
loose weight and adipose mass. Thus, novel designs of C75 have been
synthesized, but explicit results concerning effects on CPT1 expression are still
missing (Wang et al., 2009).
Figure 4: Blocking sites of FASN inhibitors Source: “Menendez, Lupu, Nature Reviews Cancer, 7, 763 (2007)”
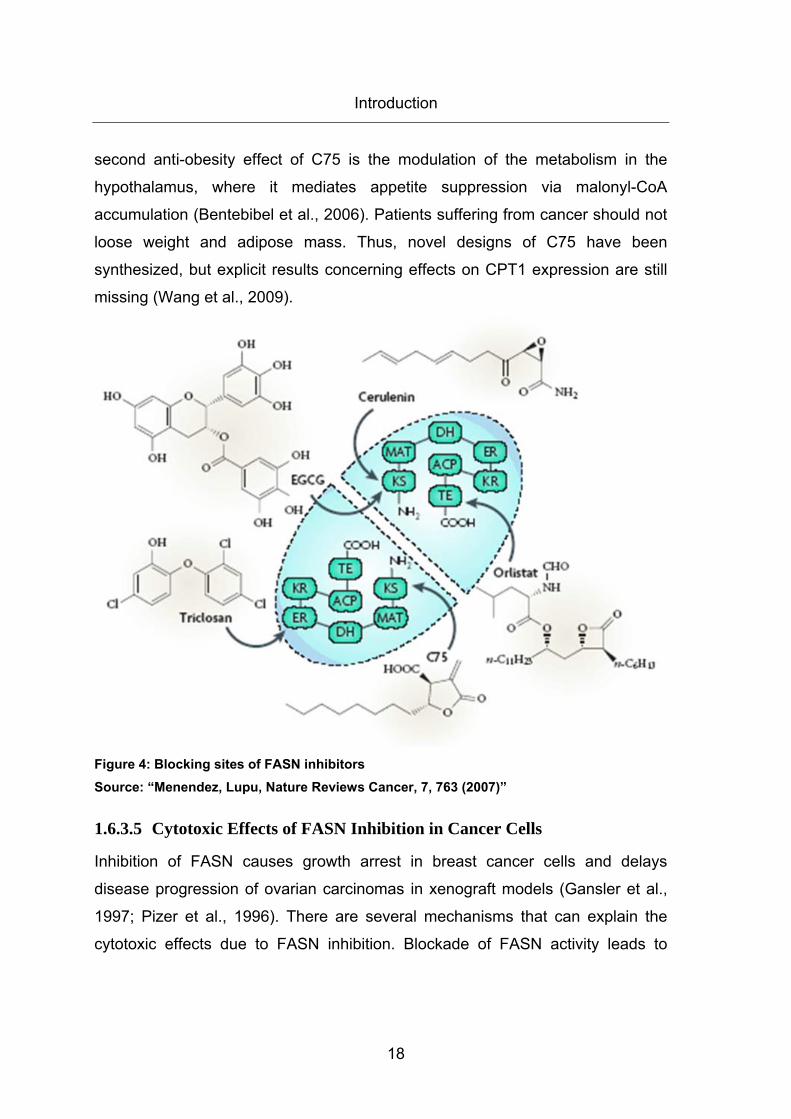
1.6.3.5 Cytotoxic Effects of FASN Inhibition in Cancer Cells
Inhibition of FASN causes growth arrest in breast cancer cells and delays
disease progression of ovarian carcinomas in xenograft models (Gansler et al.,
1997; Pizer et al., 1996). There are several mechanisms that can explain the
cytotoxic effects due to FASN inhibition. Blockade of FASN activity leads to
Introduction
19
accumulation of its substrate, malonyl-CoA, which is an inhibitor of CPT1
regulated ß-oxidation. Decreased ß-oxidation accretes ceramides that induce
transcription of apoptotic genes such as DAP kinase, BNIP3 and TRAIL
(Bandyopadhyay et al., 2006). FASN inhibition induces apoptosis in tumor cells
lacking p53 rather than in cells with intact p53. Whereas blocking of FASN leads
to growth arrest in cancer cells containing a functional p53 tumor suppressor
gene, FASN inhibition leads to a genotoxic stress and apoptosis in p53 deficient
cells (Menendez et al., 1, 2005). As FASN is responsible for synthesis of
membrane phospholipids, an end product starvation in highly proliferating tumor
cells induces apoptosis selectively in these cells (Rodriguez-Gonzalez et al.,
2005). Furthermore, FASN inhibition modulates lipid raft formation and
decreases correct localization and function of tyrosine kinase receptors in the
membranes (Nagy et al., 2002). Moreover, it has been observed that
downregulation of FASN leads to decreased AKT activity and to decreased anti-
apoptotic signaling of this pathway (Wang et al., 2005). It is well known that
FASN inhibition leads to cell cycle arrest in G1 by several mechanisms. During
G1 and S phase the phospholipid biosynthesis is normally greatest to prepare
the cell for following division. The blocking of the cell cycle by FASN inhibition is
reported to be caused by cyclin-dependent kinase inhibitors such as p21 or p27,
BRCA1, SKP2 and nuclear factor κB (NF κB) (Knowles et al., 2004;
Bandyopadhyay et al., 2006; Menendez et al., 4, 2004). Furthermore, it is
documented that transcription of cyclin-dependent kinase inhibitor p15INK4b
mRNA is upregulated after mTOR and p70S6K inhibition (Heinonen et al., 2007).
As mTOR and p70S6K are downstream of AKT, which is decreased after FASN
blocking, we hypothesize that p15 transcription could be upregulated that way.
The enhanced mRNA transcription of cyclin-dependent kinase inhibitor p15INK4b
could also be due to increased activity of forkhead box O (FOXO) transcription
factors. FOXOs are negatively regulated by AKT phosphorylation (Katayama et
al., 2008) which is decreased by FASN inhibition. Thus, FASN inhibition may
Introduction
20
lead to decreased AKT activity that could induce FOXO-dependent p15INK4b
transcription, which may finally enhance G1 cell cycle arrest.
Figure 5: Several molecular mechanisms of the tumoricidal Effects of FASN Inhibition Source: “Menendez, Lupu, Nature Reviews Cancer, 7, 763 (2007)”
1.6.4 Cell cycle control at G1/S checkpoint
Enhanced unscheduled proliferation in tumor cells frequently is caused by
hyperactivation of cell-cycle cyclin-dependent kinases (Cdks) through
amplification, mutation or overexpression of cyclins and frequent inactivation of
Cdk inhibitors (Malumbres et al., 2001). In fact, alteration of Cdk inhibitors is a
frequent event in several tumor types. The tumor suppressor proteins p15INK4b
and p16INK4a are inhibitors of Cdks that prevent the cell from going through the
G1-S phase transition.
Inactivation of p15INK4b and p16INK4a genes, which are lokalized on the band p21
of chromosome 9 has been detected in various human tumors and is thought to
Introduction
21
be an important step in cancer development (Herman et al., 1996). Via
polymerase chain reaction (PCR)-based analysis homozygous deletions of
p16INK4a were detected in 7% ovarian carcinomas, while homozygous deletions
of p15INK4b were detected in 33% ovarian carcinomas (Wong et al., 1997).
Furthermore, it is well documented that more than 33% of ovarian carcinomas
harbor p15INK4b methylation and more than 19% show p16INK4a methylation that is
associated with transcriptional silencing of these tumor suppressor genes (Liu et
al., 2, 2005; Rojas et al., 2009; Katsaros et al., 2004; Tam et al., 2007). The most
common tumor suppressor gene p53 encodes a 53 kDa nuclear protein. 53% of
patients suffering from ovarian cancer are reported to overexpress mutant p53
protein (Nielsen et al., 2004). The tumor suppressor p53 induces G1 cell cycle
arrest following DNA damage. Besides, it regulates transcription, differentiation,
senescence, genomic instability, apoptosis and survival as well as glucose
metabolism, oxidative stress and angiogenesis. Normally the protein level of p53
is low due to its short half-life. Mutations in p53 lead to a more stable, but
inactive protein that is resistant to degradation that results in accumulation of p53
in the nucleus. Currently, p53 alterations are the most common defects, which
are identified in epithelial ovarian cancers (Darcy et al., 2008) and are also
associated with poor prognosis (Nielsen et al., 2004). Ovarian cancers that
show inhanced expression of p53 protein contain mutations in conserved regions
of the p53 gene. These mutations are predominantly transitions, which suggests
that they arise spontaneously rather than being caused by carcinogen exposure
(Berchuck et al., 1994).
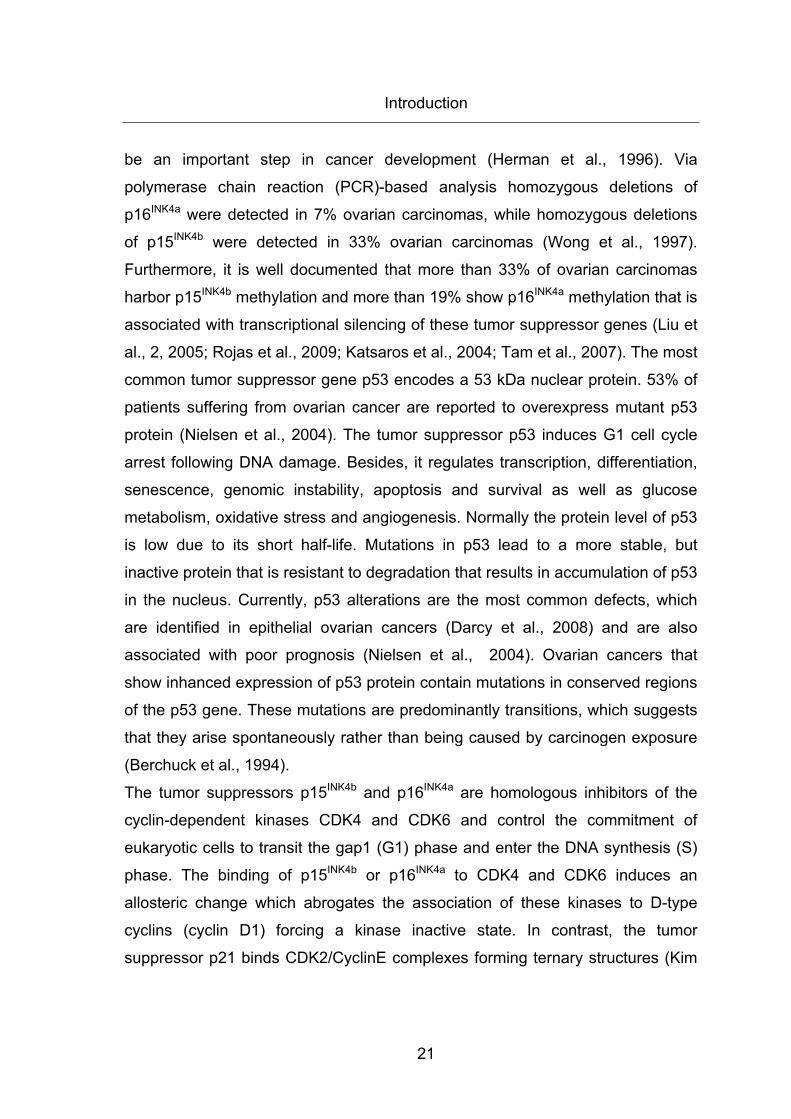
The tumor suppressors p15INK4b and p16INK4a are homologous inhibitors of the
cyclin-dependent kinases CDK4 and CDK6 and control the commitment of
eukaryotic cells to transit the gap1 (G1) phase and enter the DNA synthesis (S)
phase. The binding of p15INK4b or p16INK4a to CDK4 and CDK6 induces an
allosteric change which abrogates the association of these kinases to D-type
cyclins (cyclin D1) forcing a kinase inactive state. In contrast, the tumor
suppressor p21 binds CDK2/CyclinE complexes forming ternary structures (Kim
Introduction
22
et al., 2006). It has been shown that p21 plays a major role in inducing p53-
dependent G1 cell cycle arrest following DNA damage (Malumbres et al., 2003).
Thus, phosphorylation of retinoblastoma (Rb) proteins is inhibited (Kim et al.,
2006). Phosphorylation of Rb by CDK4/6 or CDK2 dissociates the repressor Rb
from E2F transcription factor permitting transcription of S-phase promoting
genes. Accordingly, p15INK4b, p16INK4a or p21CIP1 maintains Rb in a
hypophosphorylated state that promotes binding to E2F, which prevents G1 – S
phase transition (Harbour et al., 2000).
Figure 6: Mechanism of cyclin dependent kinase inhibitors Source: ”Cancer Control, 2004, Lee Motfitt ,Cancer Center and Research Institute, Inc.” (http://www.medscape.com) – with modifications.
1.6.5 Epigenetic gene silencing in cancer
DNA methylation is a naturally occurring event in organisms in order to protect
host DNA from digestion by restriction endonucleases, which are designed to
eliminate foreign DNA. In higher eukaryotes DNA methylation is implicated in
gene expression control during genetic imprinting, embryonic development, X-
chromosomal silencing and cell cycle regulation (Costello et al., 2001).
Introduction
23
Furthermore, it is well known that DNA hypermethylation is involved in cancer
development (Stirzaker et al., 1997). During DNA methylation a methyl group is
added to the fifth carbon position of the cytosine pyrimidine ring by DNA
methyltransferase enzymes (DNMTs). Most DNA methylation modifications occur
in 5´-CpG-3´dinucleotides. About 80 percent of all 5´-CpG-3´dinucleotides in
human genomes are methylated. The remaining twenty percent unmethylated
are located within promoter regions or in the first exons of genes (Adams et al.,
1995). Many tumor suppressor genes are reported to be promoter
hypermethylated. Aberrant methylation of CpG islands in promoter regions of
p15INK4b (Herman et al., 1996) and p16INK4a (Katsaros et al., 2004) as well as
gene methylation of DAP Kinase (Collins et al., 2006) and CDH1 (Rathi et al.,
2002; Makerla et al., 2005) has been observed. Several types of tumors,
including ovarian cancer, are known to have a hypermethylation phenotype
(Esteller et al., 2001; Strathdee et al., 2001). It is shown that in a proportion of
ovarian carcinomas aberrant promoter methylation of CDH1 gene (≤42%) is
detected and that methylation status of CDH1 is closely associated with the
decrease of E-Cadherin protein expression (Yuecheng et al., 2006). Especially,
DAP kinase methylation is observed in 67% of patients with malignant ovarian
carcinomas (Collins et al., 2006). Moreover, it is well documented that more than
33% of ovarian carcinomas harbor p15INK4b methylation and more than 19%
show p16INK4a methylation.
As DNMT1 is reported to preference hemi-methylated substrates to maintain the
methylation patterns following DNA replication, it accounts for basic methylation
(Esteller et al., 2007). For example, DNMT1 methylates and silences multiple
genes on the inactivated X chromosome of females (Collins et al., 2006).
DNMT3a and DNMT3b are known to be responsible for de novo methylation.
However, novel studies indicate that DNMT1, DNMT3a and DNMT3b posses all
de novo and maintenance functions (Esteller et al., 2007). The conserved amino-
terminal domains of the four core histones (H2A, H2B, H3 and H4) contain
lysines that are acetylated by histone acetyltransferases (HATs) and
Introduction
24
deacetylated by histone deacatylases (HDACs). Removal of acetyl groups from
histone lysine tails by HDAC increases the ionic interactions between the
positively charged histones and the negatively charged DNA resulting in a
compact transcriptionally repressive chromatin state. Histone hypoacetylation is
not always explained by HDAC hyperactivation but also can be due to decreased
HAT activity caused by mutations or chromosomal translocations (Espada et al.,
2004). Methyl-CpG binding proteins (MBDs) are associated to methylated DNA
and HDAC-containing complexes to establish a transcriptionally inactive
chromatin environment. Thus, hypermethylated CpG islands of silenced tumor-
suppressor genes are characterized overall by histone methylation and histone
hypoacetylation (Esteller et al., 2007).
1.7 The Ubiquitin/Proteasome pathway
The ubiquitin/proteasome pathway leads to specific degradation of several
proteins with a low half-life period and is conserved from yeast to mammals in all
eukaryotic cells. Proteins, which have not been properly fold, or cell cycle
proteins, which have to be eliminated for purposes of regulation, but also for
quantity control are targeted to be reduced by proteasomal degradation.
Ubiquitin modification of proteins is ATP-dependent and occurs through
sequential steps catalyzed by three classes of enzymes. The ubiquitin activating
enzyme (E1) forms a thio-ester bond with ubiquitin. Therefore, the ubiquitin
conjugating enzyme (E2) can join ubiquitin, a 76 amino acid polypeptide, at its
carboxy-terminus to the lysine of target proteins through an isopeptide bond.
Then, several ubiquitin ligase enzymes (E3) pass the ubiquitin to the substrate
and provide specificity in modifying target proteins. To target a protein for
proteasomal degradation multiple ubiquitination cycles are needed that result in
a polyubiquitination chain. Monoubiquitination acts as a signal for intracellular
trafficking, while polyubiquitination of proteins results in recruitment of the 26S
Introduction
25
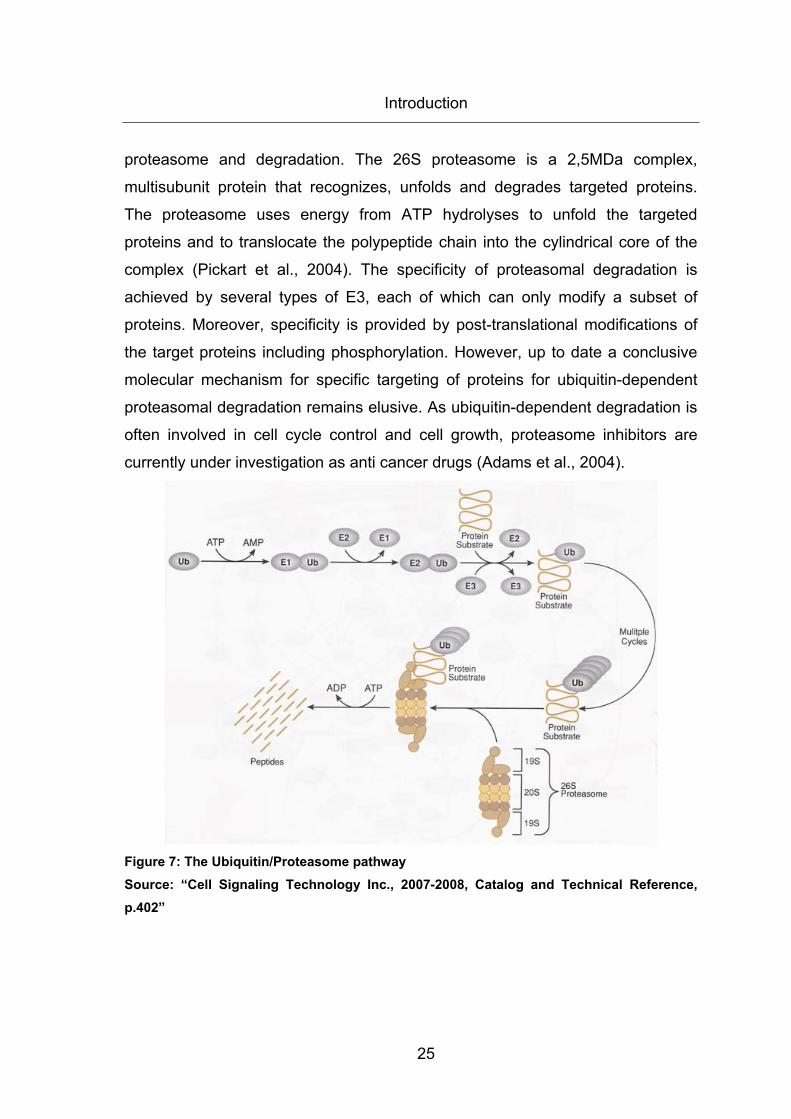
proteasome and degradation. The 26S proteasome is a 2,5MDa complex,
multisubunit protein that recognizes, unfolds and degrades targeted proteins.
The proteasome uses energy from ATP hydrolyses to unfold the targeted
proteins and to translocate the polypeptide chain into the cylindrical core of the
complex (Pickart et al., 2004). The specificity of proteasomal degradation is
achieved by several types of E3, each of which can only modify a subset of
proteins. Moreover, specificity is provided by post-translational modifications of
the target proteins including phosphorylation. However, up to date a conclusive
molecular mechanism for specific targeting of proteins for ubiquitin-dependent
proteasomal degradation remains elusive. As ubiquitin-dependent degradation is
often involved in cell cycle control and cell growth, proteasome inhibitors are
currently under investigation as anti cancer drugs (Adams et al., 2004).
Figure 7: The Ubiquitin/Proteasome pathway Source: “Cell Signaling Technology Inc., 2007-2008, Catalog and Technical Reference, p.402”

Introduction
26
This work is the first report about the epigenetically modulating activity of FASN
inhibition. We further pointed out several effects of FASN blocking including
enhanced ubiquitin-dependent protein degradation and downregulation of PI3K
signaling. Moreover, we could confirm anti-proliferative and apoptosis-inducing
actions induced by FASN inhibition.

27
2 Materials and Methods
2.1 Cell culture and Cell line
In our experiments we used the human ovarian carcinoma cell line A2780, which
was isolated from an untreated patient. The A2780 cell line was obtained from M.
Krainer, Medical University of Vienna, in early passages. This epithelial cell line
grows adherently and forms a monolayer. It is cultivated in RPMI1640 medium
(Gibco, 32404-014) supplemented with 10% heat inactivated fetal calf serum
(FCS) (Gibco, 10270-106), 100 U/ml Penicilline and 100mg/ml Streptomycine
(PenStrep) (Gibco, 15140-148) and 2mM L-Glutamine (Gibco, 25030-032). After
preparation of the culture medium, the medium always was sterile filtered by
sterile bottle filter system with 0,2µm diameter. Moreover, all preparations with
living cells were performed under sterile conditions in laminar air flow hood
(HERAsafe).
2.1.1 Maintenance of Cells
The cell line A2780 was maintained at 37°C in a 5% carbon dioxide atmosphere
with 95% relative humidity. The cell line was cultivated on 25cm2 tissue culture
flasks (Falcon, 353009) in 7ml of the medium containing 10% FCS, 100U/ml
Penicilline, 100µg/ml Streptomycine and 2mM L-Glutamine. At a confluence of
approximately 90%, cells were passaged. After removal of the culture medium
the cells were washed with PBS Dulbecco´s (Gibco, 14190-094) and incubated
with Trypsin/EDTA (Gibco, 25300-054) for 5 minutes at 37°C to detach them.
Then the cells were resuspended in the RPMI1640 culture medium to obtain a
single cell suspension and passaged at ratios from 1:15 to 1:20 corresponding to
a density of about 1x10⁶ cells in 7ml fresh culture medium. The fast growing
Materials and Methods
28
A2780 cells were passaged twice a week. Confluence, morphology and
treatment effects were checked under light microscope.
2.1.2 Storage of Cells
To avoid long-term-effects, such as mutations, we used the cells for experiments
only until passage 30. Therefore, we expanded the A2780 cells at a low passage
and stored them at a density of 2x10⁶ cells/ml in liquid nitrogen. For freezing, the
cells were washed with PBS Dulbecco´s and incubated with Trypsin/EDTA for 5
minutes at 37°C to detach them. Then the cells were resuspended in 5ml
RPMI1640 culture medium, centrifuged at 1000rpm for 5minutes and again
resuspended in only 3 ml culture medium to obtain a concentrated single cell
suspension for counting. To select the intact cells, 20µl single cell suspension
was incubated with 180µl 0,4% Trypanblue Solution (Sigma, T8154), whereas
only the trypanblue solution excluding cells were counted in a counting chamber
under the light microscope. The remaining 3ml cell suspension is then adjusted
to 4x10⁶ cells/ml in culture medium before it is diluted 1:2 with culture medium
supplemented with 20% dimethyl-sulfoxide (DMSO)(Sigma, D2650) to a final
DMSO concentration of 10% and 2x10⁶ cells/ml. Before 1ml of the adjusted cell
suspension was transferred into liquid nitrogen, the cells were slowly frozen in
cryotubes (NUNC, 368632) in an isolating Styrofoam box at -80°C for 48 hours.
In the end, the cells were stored in liquid nitrogen for years. For experiments, we
quickly thawed the cells. For this purpose, we transferred the cryotube from
liquid nitrogen directly into a beaker filled with ice before the vial was then
thawed in a beaker containing warm water. Afterwards, the 1ml cell suspension
was transferred into a 50ml falcon tube containing precooled 10ml culture
medium and centrifuged at 1000rpm for 5minutes at 4°C. The cell pellet
containing 2x10⁶ cells was resuspended with 1ml culture medium and sowed into
a tissue culture flask. The cells were at least cultured 2 weeks to recover before
they were used for experiments.
Materials and Methods
29
2.1.3 Used drugs
Cells were treated for the indicated times and drug concentrations.
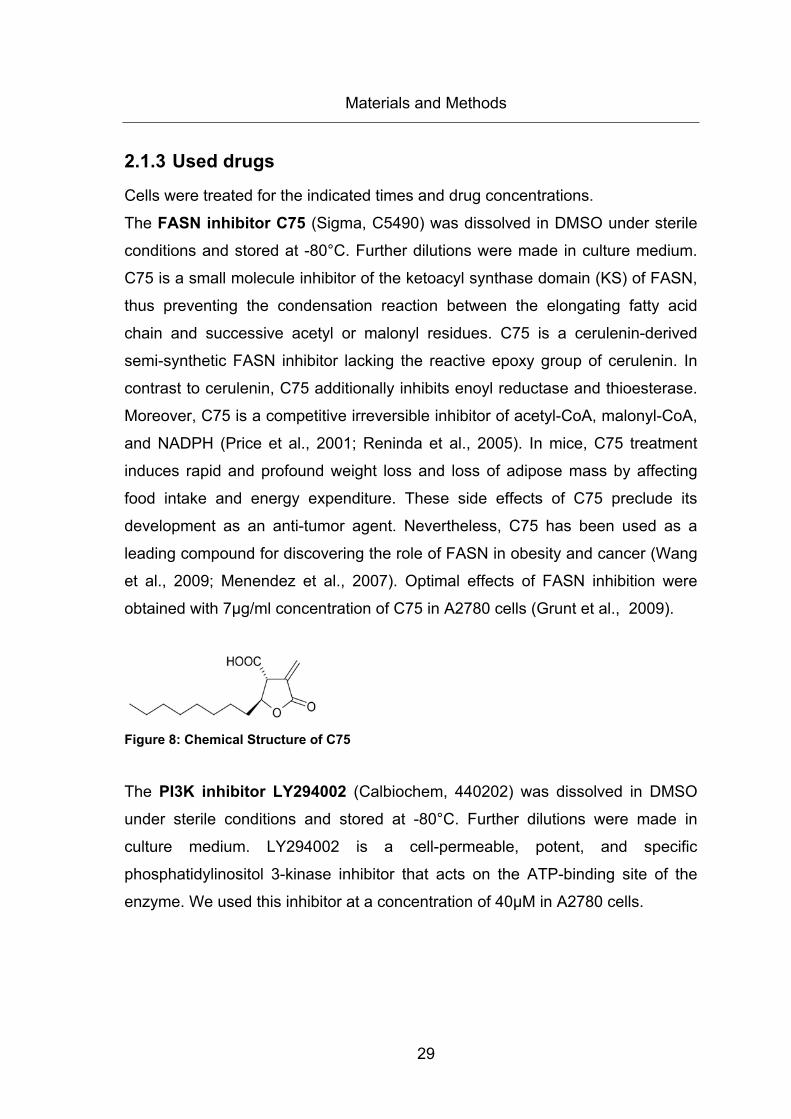
The FASN inhibitor C75 (Sigma, C5490) was dissolved in DMSO under sterile
conditions and stored at -80°C. Further dilutions were made in culture medium.
C75 is a small molecule inhibitor of the ketoacyl synthase domain (KS) of FASN,
thus preventing the condensation reaction between the elongating fatty acid
chain and successive acetyl or malonyl residues. C75 is a cerulenin-derived
semi-synthetic FASN inhibitor lacking the reactive epoxy group of cerulenin. In
contrast to cerulenin, C75 additionally inhibits enoyl reductase and thioesterase.
Moreover, C75 is a competitive irreversible inhibitor of acetyl-CoA, malonyl-CoA,
and NADPH (Price et al., 2001; Reninda et al., 2005). In mice, C75 treatment
induces rapid and profound weight loss and loss of adipose mass by affecting
food intake and energy expenditure. These side effects of C75 preclude its
development as an anti-tumor agent. Nevertheless, C75 has been used as a
leading compound for discovering the role of FASN in obesity and cancer (Wang
et al., 2009; Menendez et al., 2007). Optimal effects of FASN inhibition were
obtained with 7µg/ml concentration of C75 in A2780 cells (Grunt et al., 2009).
Figure 8: Chemical Structure of C75
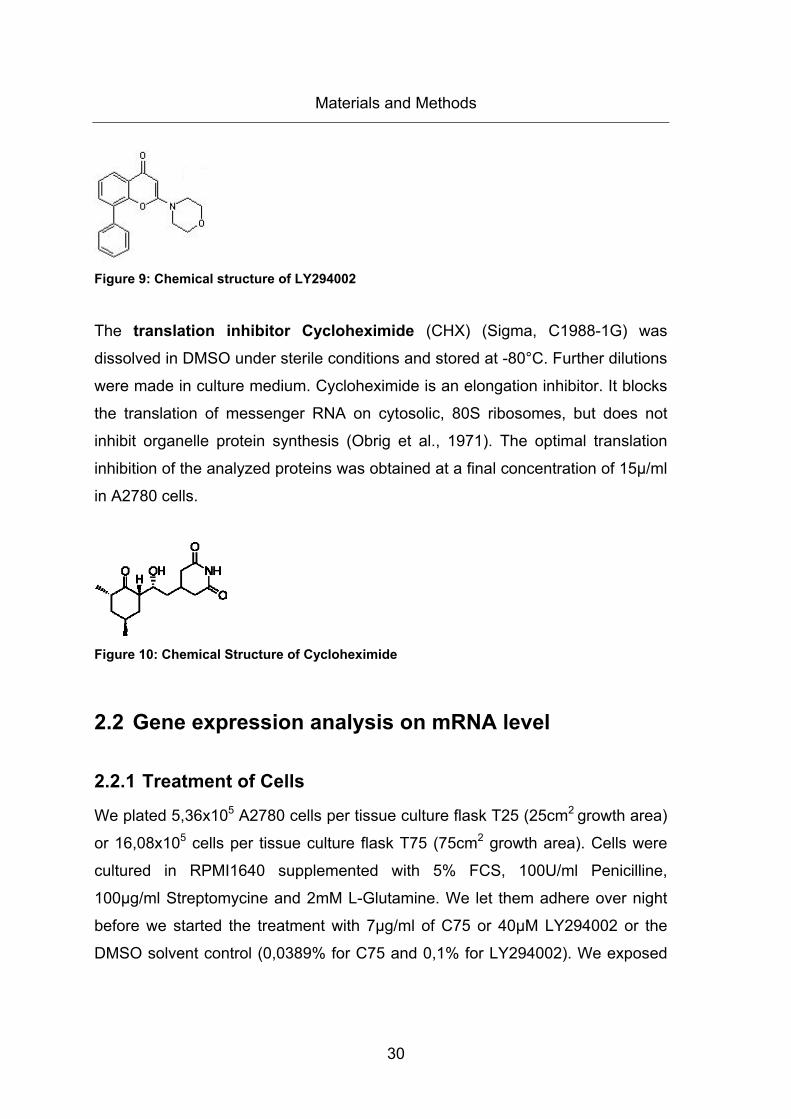
The PI3K inhibitor LY294002 (Calbiochem, 440202) was dissolved in DMSO
under sterile conditions and stored at -80°C. Further dilutions were made in
culture medium. LY294002 is a cell-permeable, potent, and specific
phosphatidylinositol 3-kinase inhibitor that acts on the ATP-binding site of the
enzyme. We used this inhibitor at a concentration of 40µM in A2780 cells.
Materials and Methods
30
Figure 9: Chemical structure of LY294002
The translation inhibitor Cycloheximide (CHX) (Sigma, C1988-1G) was
dissolved in DMSO under sterile conditions and stored at -80°C. Further dilutions
were made in culture medium. Cycloheximide is an elongation inhibitor. It blocks
the translation of messenger RNA on cytosolic, 80S ribosomes, but does not
inhibit organelle protein synthesis (Obrig et al., 1971). The optimal translation
inhibition of the analyzed proteins was obtained at a final concentration of 15µ/ml
in A2780 cells.
Figure 10: Chemical Structure of Cycloheximide
2.2 Gene expression analysis on mRNA level
2.2.1 Treatment of Cells
We plated 5,36x10⁵ A2780 cells per tissue culture flask T25 (25cm2 growth area)
or 16,08x10⁵ cells per tissue culture flask T75 (75cm2 growth area). Cells were
cultured in RPMI1640 supplemented with 5% FCS, 100U/ml Penicilline,
100µg/ml Streptomycine and 2mM L-Glutamine. We let them adhere over night
before we started the treatment with 7µg/ml of C75 or 40µM LY294002 or the
DMSO solvent control (0,0389% for C75 and 0,1% for LY294002). We exposed
Materials and Methods
31
the cells to the agents for indicated times at 37°C protected from light. Exactly
20minutes before homogenization we stimulated the cells with 100ng/ml
epidermal growth factor (EGF) (Sigma, E9644). Then we checked the cell
monolayer under the light microscope and noted confluence, morphology and
apoptosis of the cells.
2.2.2 RNA Isolation
Homogenization For following procedures we used autoclaved material and wore sterile gloves in
order to avoid degradation of RNA by RNAses which are very stable.
Furthermore, we worked in laminar air flow hood because of the toxicity of some
used reagents. We poured off the media and carefully removed any residual
amounts of media with a blue Gilson pipet tip. Afterwards, 3ml cold TRI Reagent
(Molec. Res. Ctr., TR118) per T25 or T75 were added to the cells. The culture
flask was stored horizontally for at least 5min at room temperature before the cell
lysate was passed through a pipette for several times. The homogenate was
then distributed into two 2ml Eppendorf tubes (Eppendorf, 0030.120.094).
RNA-Extraction For RNA extraction of the homogenised cells cold 0.15ml BCP (1-bromo-3-
chloropropane) (Molec. Res. Ctr., BP151) per sample containing 1.5ml TRI
Reagent was added. Then each sample was vortexed for 15seconds and stored
for 15min at room temperature before the probes were centrifuged at 12.500rpm
for 15min at 4°C.
RNA-Precipitation After centrifugation the sample was separated into two phases. The lower red
organic phase and the white interphase contained DNA and proteins, whereas
the upper colourless aqueous phase contained RNA. We carefully removed the
Materials and Methods
32
upper phase with a blue pipette tip avoiding the white interphase and transferred
this volume to new 1,5ml Eppendorf tubes (0030120.086). 2ml Eppendorf tubes
containing the interphase and lower phase were stored at -80°C for subsequent
isolation of DNA for bisulfite conversion and following methylation specific PCR.
For precipitation of RNA 1ml isopropanol (Sigma) was added to each sample,
vortexed for 15seconds and stored on ice for further 30minutes. Then the probes
were centrifuged at 12500rpm for 15minutes at 4°C to pellet the precipitated
RNA of cells.
RNA-Wash To gain pure RNA we carefully aspirated the supernatant with a self-drawn
Pasteur pipette connected to a water-jet vacuum pump and added 1.5ml 75%
EtOH per sample (Merck). After vortexing the pellet became visible and
depending on the size of the pellet we could later adjust solubilization volume.
RNA-Solubilization We carefully aspirated the EtOH supernatant with a self-drawn Pasteur pipette
connected to a water-jet vacuum pump and air-dried the RNA pellets at room
temperature until the white pellets became translucent. According to the pellet
size RNA was dissolved in sterile Aqua bidest by passing the solution several
times through a yellow pipette tip. As we obtained 2 Eppendorf tubes per
experimental sample we pooled the adequate samples and stored them on ice
for further analysis or for long term storage at -80°C.
2.2.3 RNA-Measurement
Qualitative RNA control We checked the quality of the isolated RNA by 1% agarose-gel electrophoresis
(‘check gel’). Therefore, we used a small electrophoresis unit with 15-slot comb
and prepared 250ml running buffer containing 1xTAE (Sigma, T9650). For 1%
Materials and Methods
33
agarose gel we added 0,3g Saekem Agarose (Sigma) to 30ml 1xTAE, boiled the
solution in a microwave until it became translucent, added 3µl 10 000 x GelRed
nucleic acid gel staining solution (Biotium, BIB 41003) and poured the agarose
gel containing 1xGelRed into the electrophoresis chamber. We then removed
comb and restraining bars from the chamber after gel had polymerized after
30minutes. 250ml of previously prepared 1xTAE running buffer was spilled into
the electrophoresis chamber unit. Before RNA samples were loaded into the
slots, each 0,5µl RNA sample was supplemented with 12µl Aqua Bidest and 3µl
of 5xgel loading buffer (Sigma, G2526).
The gel ran at constantly 70V for 40min. The isolated RNA could be detected by
intercalated GelRed which was seen as bands at a different size. The gel was
photographed with the Herolab Easy Gel Documentation System using adequate
settings. When RNA quality was high there could be seen two predominant
bands of small 18S rRNA (~2kb) and large 28S rRNA (~5kb). Sometimes
additionally bulk mRNA (1 – 2kb), smear mRNA (2 – 7kb) and discrete bands of
high molecular weight RNA (7-15kb) could be seen (Figure 11). When RNA was
degraded during isolation a smear band containing spliced RNAs of all sizes
could be observed instead of two predominand bands.
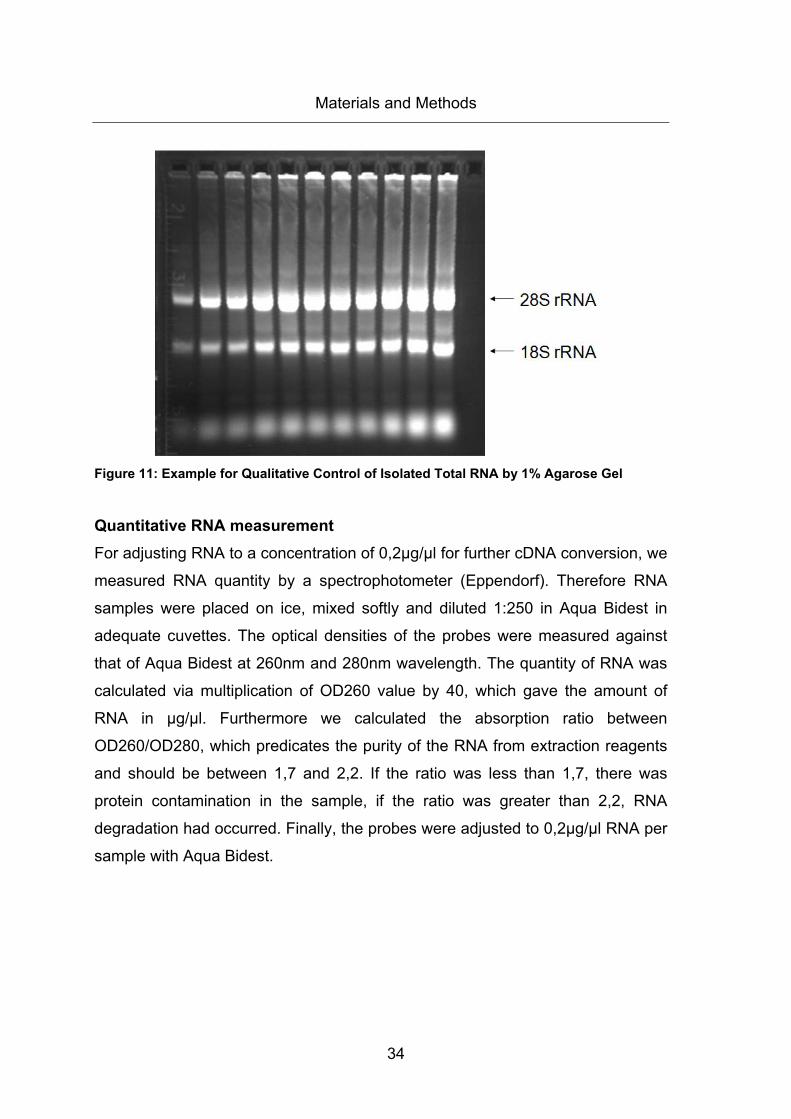
Materials and Methods
34
Figure 11: Example for Qualitative Control of Isolated Total RNA by 1% Agarose Gel
Quantitative RNA measurement For adjusting RNA to a concentration of 0,2µg/µl for further cDNA conversion, we
measured RNA quantity by a spectrophotometer (Eppendorf). Therefore RNA
samples were placed on ice, mixed softly and diluted 1:250 in Aqua Bidest in
adequate cuvettes. The optical densities of the probes were measured against
that of Aqua Bidest at 260nm and 280nm wavelength. The quantity of RNA was
calculated via multiplication of OD260 value by 40, which gave the amount of
RNA in µg/µl. Furthermore we calculated the absorption ratio between
OD260/OD280, which predicates the purity of the RNA from extraction reagents
and should be between 1,7 and 2,2. If the ratio was less than 1,7, there was
protein contamination in the sample, if the ratio was greater than 2,2, RNA
degradation had occurred. Finally, the probes were adjusted to 0,2µg/µl RNA per
sample with Aqua Bidest.
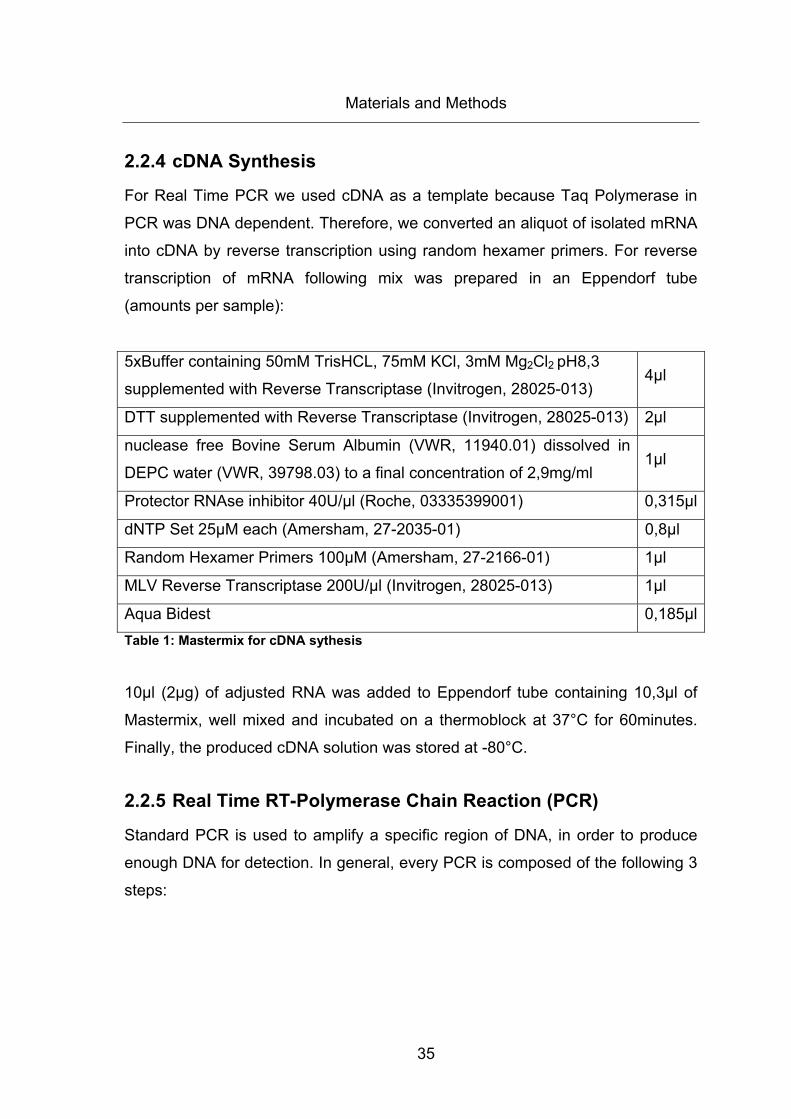
Materials and Methods
35
2.2.4 cDNA Synthesis
For Real Time PCR we used cDNA as a template because Taq Polymerase in
PCR was DNA dependent. Therefore, we converted an aliquot of isolated mRNA
into cDNA by reverse transcription using random hexamer primers. For reverse
transcription of mRNA following mix was prepared in an Eppendorf tube
(amounts per sample):
5xBuffer containing 50mM TrisHCL, 75mM KCl, 3mM Mg2Cl2 pH8,3
supplemented with Reverse Transcriptase (Invitrogen, 28025-013) 4µl
DTT supplemented with Reverse Transcriptase (Invitrogen, 28025-013) 2µl
nuclease free Bovine Serum Albumin (VWR, 11940.01) dissolved in
DEPC water (VWR, 39798.03) to a final concentration of 2,9mg/ml 1µl
Protector RNAse inhibitor 40U/µl (Roche, 03335399001) 0,315µl
dNTP Set 25µM each (Amersham, 27-2035-01) 0,8µl
Random Hexamer Primers 100µM (Amersham, 27-2166-01) 1µl
MLV Reverse Transcriptase 200U/µl (Invitrogen, 28025-013) 1µl
Aqua Bidest 0,185µlTable 1: Mastermix for cDNA sythesis
10µl (2µg) of adjusted RNA was added to Eppendorf tube containing 10,3µl of
Mastermix, well mixed and incubated on a thermoblock at 37°C for 60minutes.
Finally, the produced cDNA solution was stored at -80°C.
2.2.5 Real Time RT-Polymerase Chain Reaction (PCR)
Standard PCR is used to amplify a specific region of DNA, in order to produce
enough DNA for detection. In general, every PCR is composed of the following 3
steps:
Materials and Methods
36
1. Denaturation: the DNA double strands are melted through heat (95°C).
2. Annealing: primers attach to the complementary sequences of the DNA
template.
3. Synthesis and Elongation: primers are extended by DNA polymerase and
the complimentary strand is synthesized starting at the 3´end of the
annealed primers.
Standard PCR only gives qualitative information about a certain gene. That was
the reason why we used quantitative Real Time RT-PCR for gene expression
analysis.
Real Time RT-PCR using Gene Specific Probes and Primers All PCRs were set up in laminar air flow hood whereas the UV-light in laminar air
flow hood was turned on 20min before starting to avoid contamination.
Furthermore, gloves, racks and Aqua Bidest were also exposed to UV-light
before use. We performed Real Time RT-PCR using reagents of Applied
Biosystems (ABI).
In this system Real Time RT-PCR is based on the concept of 5´nuclease activity
of the DNA Polymerase (AmpliTaq DNA Polymerase), which cleaves the probe
containing covalently linked reporter dye at its 5´end and a quencher dye at the
3´end oligonucleotide. The basic steps are presented in Figure 12:
1. When the probe is intact, the proximity of the reporter to the quencher
results in suppression of the reporter fluorescence, primarily by Förster
energy transfer.
2. After denaturation primers and probe hybridize to the complementary
sequence of single stranded cDNA only if the gene if interest is present.
3. The probe which consists of an oligonucleotide with a 5´ reporter dye and
a 3´quencher dye specifically targets the region between the forward and
the reverse primer.
Materials and Methods
37
4. The 5´ to 3´ nuclease activity of the DNA polymerase cleaves the probe
between reporter and quencher dye.
5. Cleavage of the probe separates the reporter dye from the quencher dye
which results in increased fluorescence of the reporter. Probe fragments
are displaced from the target and polymerization of the strand continues.
Accumulation of PCR products is detected directly by monitoring the
increase in fluorescence of the reporter dye.
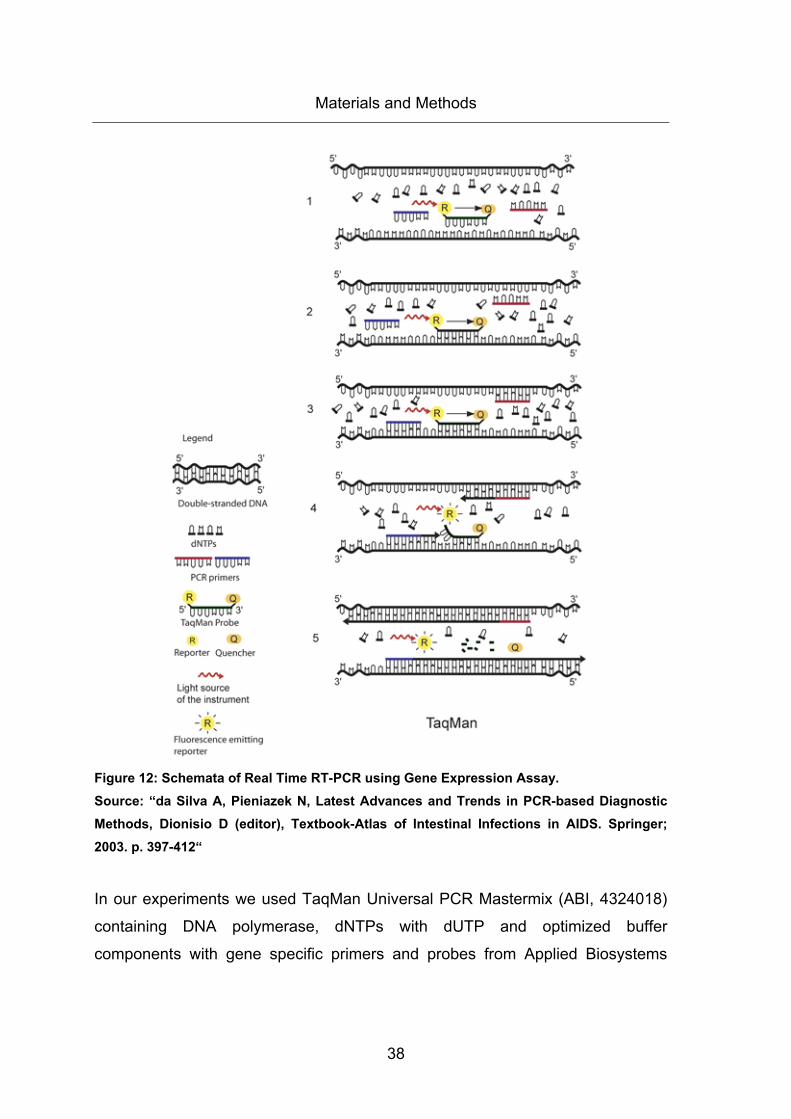
Materials and Methods
38
Figure 12: Schemata of Real Time RT-PCR using Gene Expression Assay. Source: “da Silva A, Pieniazek N, Latest Advances and Trends in PCR-based Diagnostic Methods, Dionisio D (editor), Textbook-Atlas of Intestinal Infections in AIDS. Springer; 2003. p. 397-412“
In our experiments we used TaqMan Universal PCR Mastermix (ABI, 4324018)
containing DNA polymerase, dNTPs with dUTP and optimized buffer
components with gene specific primers and probes from Applied Biosystems
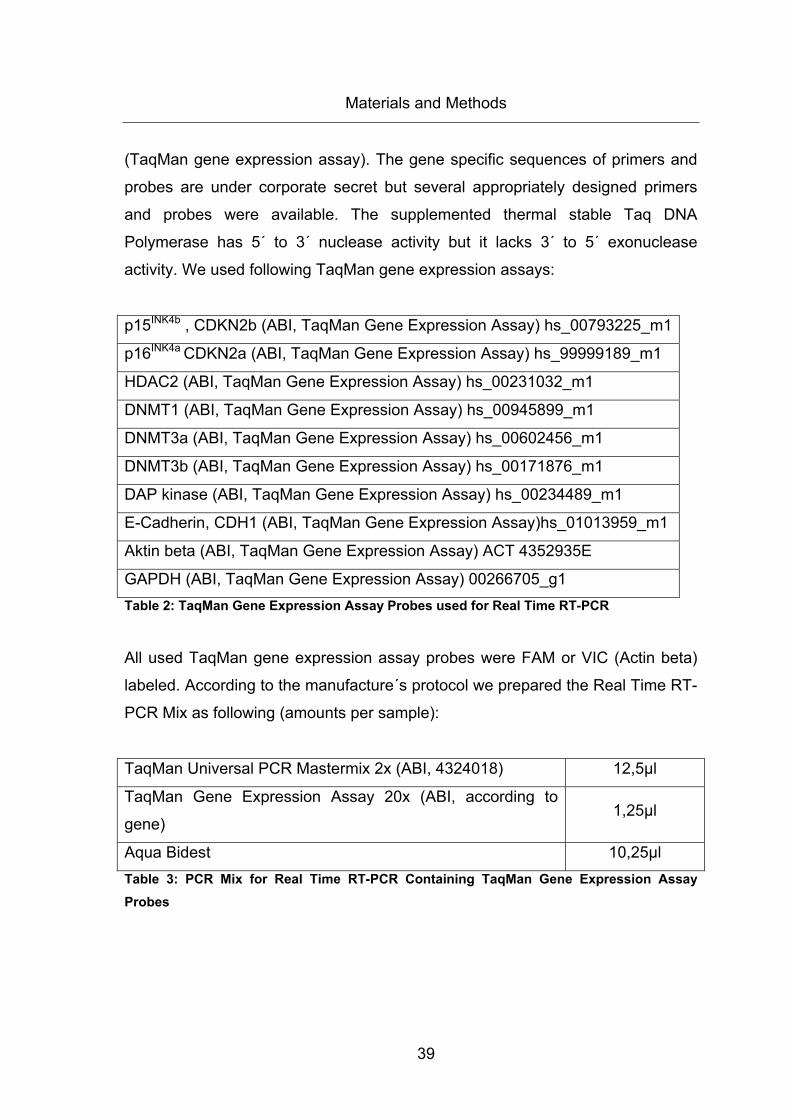
Materials and Methods
39
(TaqMan gene expression assay). The gene specific sequences of primers and
probes are under corporate secret but several appropriately designed primers
and probes were available. The supplemented thermal stable Taq DNA
Polymerase has 5´ to 3´ nuclease activity but it lacks 3´ to 5´ exonuclease
activity. We used following TaqMan gene expression assays:
p15INK4b , CDKN2b (ABI, TaqMan Gene Expression Assay) hs_00793225_m1
p16INK4a CDKN2a (ABI, TaqMan Gene Expression Assay) hs_99999189_m1
HDAC2 (ABI, TaqMan Gene Expression Assay) hs_00231032_m1
DNMT1 (ABI, TaqMan Gene Expression Assay) hs_00945899_m1
DNMT3a (ABI, TaqMan Gene Expression Assay) hs_00602456_m1
DNMT3b (ABI, TaqMan Gene Expression Assay) hs_00171876_m1
DAP kinase (ABI, TaqMan Gene Expression Assay) hs_00234489_m1
E-Cadherin, CDH1 (ABI, TaqMan Gene Expression Assay)hs_01013959_m1
Aktin beta (ABI, TaqMan Gene Expression Assay) ACT 4352935E
GAPDH (ABI, TaqMan Gene Expression Assay) 00266705_g1 Table 2: TaqMan Gene Expression Assay Probes used for Real Time RT-PCR
All used TaqMan gene expression assay probes were FAM or VIC (Actin beta)
labeled. According to the manufacture´s protocol we prepared the Real Time RT-
PCR Mix as following (amounts per sample):
TaqMan Universal PCR Mastermix 2x (ABI, 4324018) 12,5µl
TaqMan Gene Expression Assay 20x (ABI, according to
gene) 1,25µl
Aqua Bidest 10,25µl Table 3: PCR Mix for Real Time RT-PCR Containing TaqMan Gene Expression Assay Probes
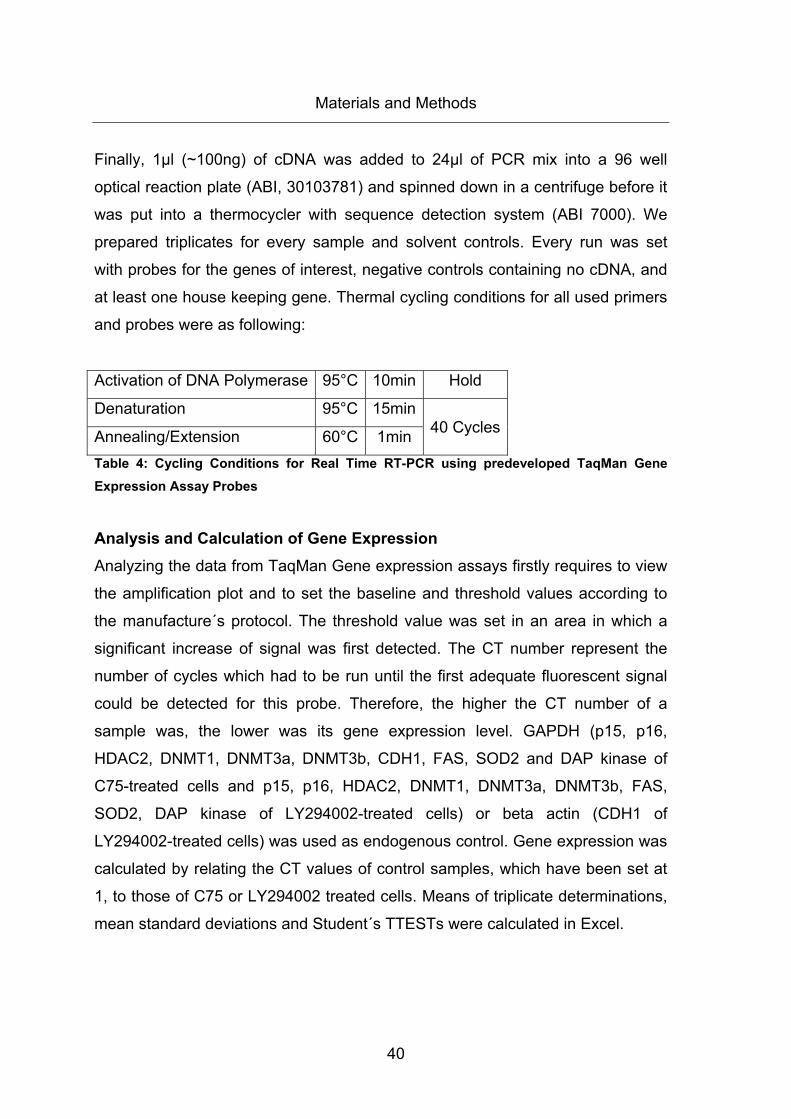
Materials and Methods
40
Finally, 1µl (~100ng) of cDNA was added to 24µl of PCR mix into a 96 well
optical reaction plate (ABI, 30103781) and spinned down in a centrifuge before it
was put into a thermocycler with sequence detection system (ABI 7000). We
prepared triplicates for every sample and solvent controls. Every run was set
with probes for the genes of interest, negative controls containing no cDNA, and
at least one house keeping gene. Thermal cycling conditions for all used primers
and probes were as following:
Activation of DNA Polymerase 95°C 10min Hold
Denaturation 95°C 15min40 CyclesAnnealing/Extension 60°C 1min
Table 4: Cycling Conditions for Real Time RT-PCR using predeveloped TaqMan Gene Expression Assay Probes
Analysis and Calculation of Gene Expression Analyzing the data from TaqMan Gene expression assays firstly requires to view
the amplification plot and to set the baseline and threshold values according to
the manufacture´s protocol. The threshold value was set in an area in which a
significant increase of signal was first detected. The CT number represent the
number of cycles which had to be run until the first adequate fluorescent signal
could be detected for this probe. Therefore, the higher the CT number of a
sample was, the lower was its gene expression level. GAPDH (p15, p16,
HDAC2, DNMT1, DNMT3a, DNMT3b, CDH1, FAS, SOD2 and DAP kinase of
C75-treated cells and p15, p16, HDAC2, DNMT1, DNMT3a, DNMT3b, FAS,
SOD2, DAP kinase of LY294002-treated cells) or beta actin (CDH1 of
LY294002-treated cells) was used as endogenous control. Gene expression was
calculated by relating the CT values of control samples, which have been set at
1, to those of C75 or LY294002 treated cells. Means of triplicate determinations,
mean standard deviations and Student´s TTESTs were calculated in Excel.
Materials and Methods
41
2.3 Methylation Specific Real Time RT-PCR
The most common technique to detect methylated DNA is to convert
unmethylated cytosines into uracils whereas methylated cytosines remain
unchanged during sodium bisulfite conversion. Therefore, sodium bisulfite is
used to convert unmethylated cytosines to uracils, which are recognized as
thymine by Taq polymerase, while 5´-methylcytosines remain unaltered. The
converted DNA is then amplified by appropriate primers for methylated and
unmethylated converted DNA sequences. So the individual steps in methylation
specific PCR are as following:
1. DNA isolation of cells
2. Sodium bisulfite conversion of DNA
3. PCR using primers for methylated DNA or unmethylated, converted DNA
4. Detection of PCR products
In our experiments we performed a quantitative Real Time PCR for detection of
the bisulfite-converted DNA using SYBR Green dye molecules which intercalate
into double stranded DNA.
2.3.1 Treatment of Cells
We plated 5,36x10⁵ A2780 cells per tissue culture flask T25 (25cm2 growth area)
or 16,08x10⁵ cells per tissue culture flask T75 (75cm2 growth area). Cells were
cultured in RPMI1640 supplemented with 5% FCS, 100U/ml Penicilline,
100µg/ml Streptomycine and 2mM L-Glutamine. We let them adhere over night
before we started the treatment with 7µg/ml of C75 or 40µM LY294002 or the
DMSO solvent control (0,0389% for C75 and 0,1% for LY294002). We exposed
the cells to the agents for indicated times at 37°C protected from light. Exactly
20minutes before homogenization we stimulated the cells with 100ng/ml
Materials and Methods
42
epidermal growth factor (EGF) (Sigma, E9644). Then we checked the cell
monolayer under the light microscope and noted confluence, morphology and
apoptosis of the cells.
2.3.2 DNA Isolation
Homogenization For following procedures we used autoclaved material and wore sterile gloves in
order to avoid degradation of DNA by DNAses which are very stable.
Furthermore, we worked in laminar air flow hood because of the toxicity of some
used reagents. We poured off the media and carefully removed any residual
amounts of media with a blue Gilson pipet tip. Afterwards, 3ml cold TRI Reagent
(Molec. Res. Ctr., TR118) per T25 or T75 were added to the cells. The flask was
stored horizontally for at least 5min at room temperature before the cell lysate
was passed through a pipette for several times. The homogenate was then
distributed into two 2ml Eppendorf tubes (Eppendorf, 0030.120.094).
DNA-Extraction For DNA extraction of the homogenised cells cold 0.15ml BCP (1-bromo-3-
chloropropane) (Molec. Res. Ctr., BP151) per sample containing 1.5ml TRI
Reagent was added. Then each sample was vortexed for 15seconds and stored
for 15min at room temperature before the probes were spun down at 12.500rpm
for 15min at 4°C.
DNA-Precipitation After centrifugation the sample was separated into two phases. The lower red
organic phase and the white interphase contained DNA and proteins, whereas
the upper colourless aqueous phase contained RNA. We carefully removed the
upper phase containing RNA with a blue pipette tip avoiding the white
interphase, transferred this volume to new 1,5ml Eppendorf tubes (0030120.086)
Materials and Methods
43
and stored them at -80°C for subsequent cDNA sythesis. Any residual aqueous
phase was carefully removed which is important for the quality of the isolated
DNA. Then 450µl pure ethanol was added to each 2ml Eppendorf tube
containing DNA in the interphase and lower phase. Tubes were mixed via
inversion and stored for 3 minutes at room temperature. Afterwards, the samples
were centrifuged at 2000rpm for 5min at 4°C.
DNA Wash The phenol-ethanol supernatant was carefully aspirated with a self-drawn
Pasteur pipette connected to a water-jet vacuum pump. For the first wash, 1,5ml
of 0,1M Soduim Citrate (Natriumcitrat tribasisch Dihydrat, Sigma-Aldrich, S4641-
25G) in 10% ethanol was added to the DNA pellet of each sample and inverted
for several times during storage for 30 minutes at room temperature. After the
first wash the samples were spun down at 2000rpm for 5 minutes at room
temperature. Then the supernatant was carefully aspirated with a self-drawn
Pasteur pipette connected to a water-jet vacuum pump. For the second wash,
again 1,5ml of 0.1M Sodium Citrate in 10% ethanol was added per sample, the
tubes were stored for 30 minutes at room temperature, mixed periodically,
centrifuged, and finally the supernatant was aspirated. Very large pellets
(>200ug) were washed a third time with 0,1M Sodium Citrate in 10% ethanol.
After washing the DNA pellet with Sodium Citrate, the pellet was washed with
2ml of 75% ethanol and stored at room temperature for 10 minutes. During this
time the tubes were mixed and inverted for several times. Afterwards, the tubes
were spun down at 2000rpm for 5 minutes at room temperature and the DNA
pellets became visibly white.
DNA Solubilization For DNA solubilization, we first aspirated the ethanol supernatant with a self-
drawn Pasteur pipette connected to a water-jet vacuum pump and air dried the
DNA pellet for 3 minutes at room temperature. Then, the DNA pellet was
Materials and Methods
44
dissolved in ~20µl TE buffer solution (810mM TrisHCl; 1mM Disodium EDTA;
pH8; Sigma, 93283-100ML) by slowly passing the solution through a pipette tip.
The high molecular weight DNA increases the viscosity of the DNA solution and
made it difficult to pool the two corresponding samples to a final volume of ~40µl.
DNA-Measurement The quantity of DNA was measured by spectrophotometry (wave length
260/280nm) on an Eppendorf photometer. The DNA samples were diluted and
mixed 1:500 in Aqua Bidest and the photometer automatically calculated
concentration and purity (260/280 ratio) of the DNA samples related to the Aqua
bidest. Finally, the DNA samples were diluted in TE buffer up to a concentration
of 20ng/µl and could be stored at -80°C.
2.3.3 Sodium Bisulfide Conversion
The most common technique to detect methylated DNA is to convert
unmethylated cytosines into uracils whereas methylated cytosines remain
unchanged during sodium bisulfite conversion. In our experiments we used the
EZ DNA Methylation-Direct Kit (Zymo Research, D5020) in which DNA
denaturation and bisulfite conversion processes were combined into a single
step and desulfonation reaction and DNA clean-up was included. For every
experiment we included a universal unmethylated human genomic DNA
(Chemicon, S7822) as negative control and performed bisulfite conversion
following the manufacture´s instructions:
Sodium Bisulfite Conversion At the beginning, the light sensitive conversion reagent solution was freshly
prepared by adding 790µl solubilization buffer and 300µl dilution buffer to the
conversion reagent. This freshly prepared conversion reagent solution was
mixed for 10 minutes before 160µl of reaction buffer was added and mixed for
Materials and Methods
45
one additional minute. Then, 400ng of sample or control DNA was added to
130µl of conversion reagent solution to a final volume of 150µl into an Eppendorf
0,2ml PCR-tube that was mixed and spin down. The PCR tubes (Applied
Biosystems, N801-0540) were placed into the thermal iCycler (Biorad) to be
converted at following temperatures:
98°C 8min
64°C 210min
4°C hold Table 5: Conditions for Sodium Bisulfite Conversion
After conversion of the DNA samples, the samples were load into a column in
which 600µl of binding buffer had been added. The columns were placed into a
collection tube, inverted and spun down at full speed for 30 seconds. The flow
through was discarded while the column containing the stacked DNA was
washed with 100µl wash buffer that was prepared by adding 24ml pure ethanol
to 6ml wash buffer concentrate. The column was centrifuged again at high speed
for 30 seconds.
Desulfonation After washing, the converted DNA was desulfonated by adding 200µl
desulfonation buffer to each column, incubation for 20minutes at room
temperature and centrifugation at high speed for 30 seconds. Then, each column
containing DNA was washed twice with 200µl wash buffer and spun down at high
speed for 30 seconds.
Elution For elution of the DNA, the columns were placed into fresh 1,5ml Eppendorf
tubes, eluted by 12µl elution buffer and centrifuged at high speed for 30 seconds.
Materials and Methods
46
It was very important to proceeding immediate with further PCR to make the
modified DNA stable for long term storage.
2.3.4 Nested PCR – 1st Step
The methylation status of the promoter region for p15INK4b tumor suppressor
gene was determined by the method of MSP further modified as a nested two-
step approach in order to increase the sensitivity. For determining the
methylation status of DAP kinase promoter region, MSP was performed without
first step PCR amplification. The first step of nested PCR for p15INK4b was carried
out with primer sets (forward and reverse) which were flanking the CpG-rich
promoter regions of the p15INK4b gene. These extern primers (“p15-e”) did not
discriminate between methylated and unmethylated nucleotides following sodium
bisulfide conversion.
P15-e-fw: 5´-GAYGTYGGTTTTTTGGTTTAGTTGA-3´ (VBC Genomics, HPLC-
purified)
P15-e-rev: 5´-AACRCAACCRAACTCAAAACC-3´ (VBC Genomics, HPLC-
purified) Table 6: Nucleotide Sequences of Extern Primers of p15INK4b
The first step PCR for p15INK4b was performed using 3µl (~100ng) of sodium
bisulfite converted DNA and PCR Core Kit (Roche, 11578553001) containing
10x buffer (100mM TrisHCl, 500mM KCl, pH8,3) , MgCl (25mM), dNTPs (10mM
each), and Taq DNA Polymerase (250U; 5U/µl). The first step PCR Master Mix
was prepared according to the manufacture´s protocol:
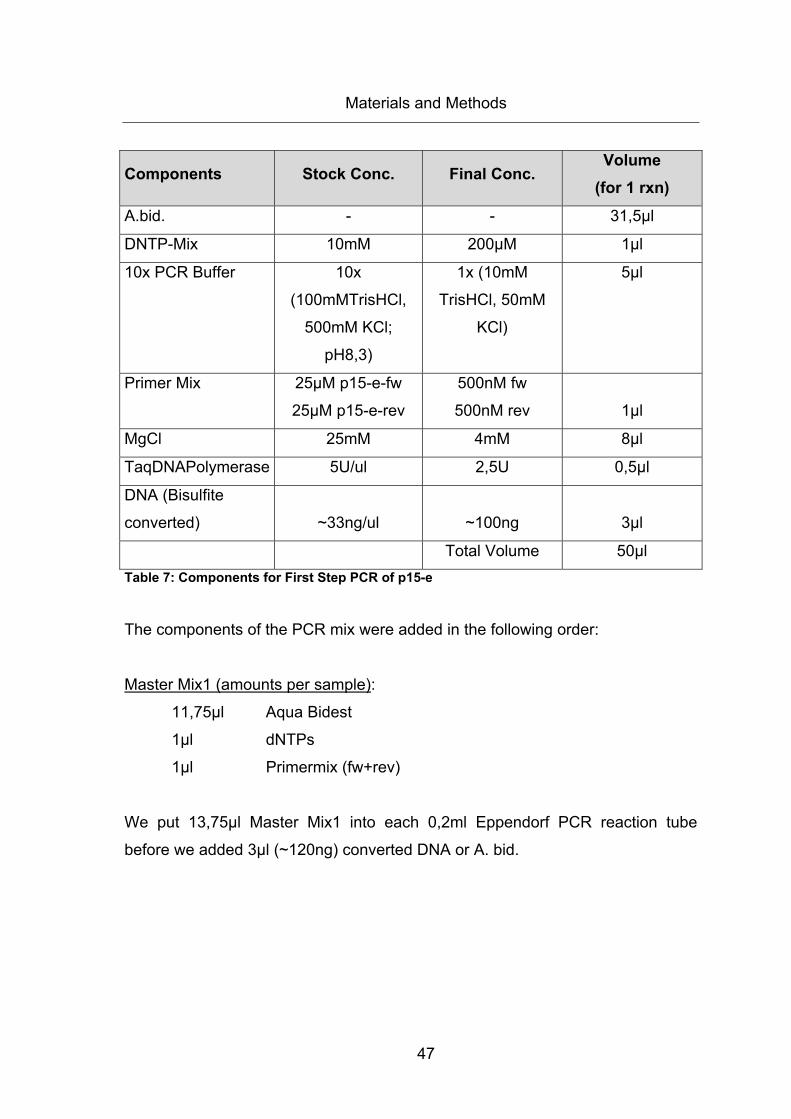
Materials and Methods
47
Components Stock Conc. Final Conc. Volume
(for 1 rxn)
A.bid. - - 31,5µl
DNTP-Mix 10mM 200µM 1µl
10x PCR Buffer 10x
(100mMTrisHCl,
500mM KCl;
pH8,3)
1x (10mM
TrisHCl, 50mM
KCl)
5µl
Primer Mix 25µM p15-e-fw
25µM p15-e-rev
500nM fw
500nM rev
1µl
MgCl 25mM 4mM 8µl
TaqDNAPolymerase 5U/ul 2,5U 0,5µl
DNA (Bisulfite
converted)
~33ng/ul
~100ng
3µl
Total Volume 50µl Table 7: Components for First Step PCR of p15-e
The components of the PCR mix were added in the following order:
Master Mix1 (amounts per sample):
11,75µl Aqua Bidest
1µl dNTPs
1µl Primermix (fw+rev)
We put 13,75µl Master Mix1 into each 0,2ml Eppendorf PCR reaction tube
before we added 3µl (~120ng) converted DNA or A. bid.
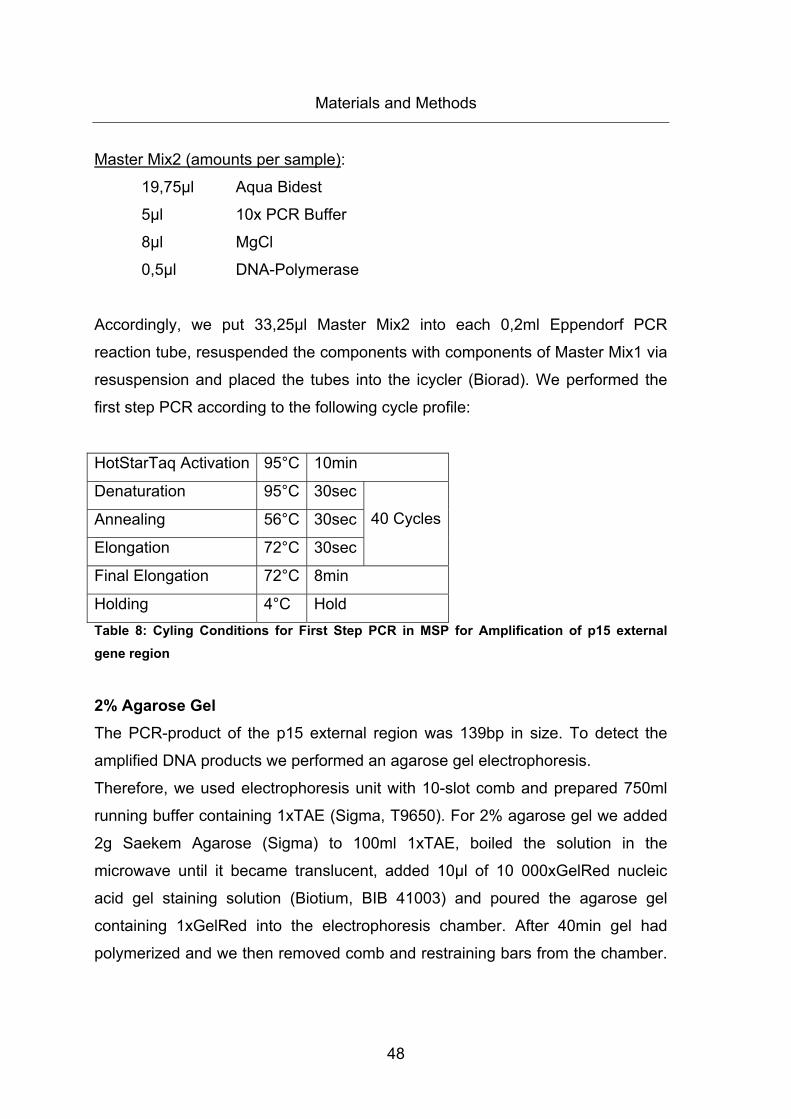
Materials and Methods
48
Master Mix2 (amounts per sample):
19,75µl Aqua Bidest
5µl 10x PCR Buffer
8µl MgCl
0,5µl DNA-Polymerase
Accordingly, we put 33,25µl Master Mix2 into each 0,2ml Eppendorf PCR
reaction tube, resuspended the components with components of Master Mix1 via
resuspension and placed the tubes into the icycler (Biorad). We performed the
first step PCR according to the following cycle profile:
HotStarTaq Activation 95°C 10min
Denaturation 95°C 30sec
40 CyclesAnnealing 56°C 30sec
Elongation 72°C 30sec
Final Elongation 72°C 8min
Holding 4°C Hold Table 8: Cyling Conditions for First Step PCR in MSP for Amplification of p15 external gene region
2% Agarose Gel The PCR-product of the p15 external region was 139bp in size. To detect the
amplified DNA products we performed an agarose gel electrophoresis.
Therefore, we used electrophoresis unit with 10-slot comb and prepared 750ml
running buffer containing 1xTAE (Sigma, T9650). For 2% agarose gel we added
2g Saekem Agarose (Sigma) to 100ml 1xTAE, boiled the solution in the
microwave until it became translucent, added 10µl of 10 000xGelRed nucleic
acid gel staining solution (Biotium, BIB 41003) and poured the agarose gel
containing 1xGelRed into the electrophoresis chamber. After 40min gel had
polymerized and we then removed comb and restraining bars from the chamber.
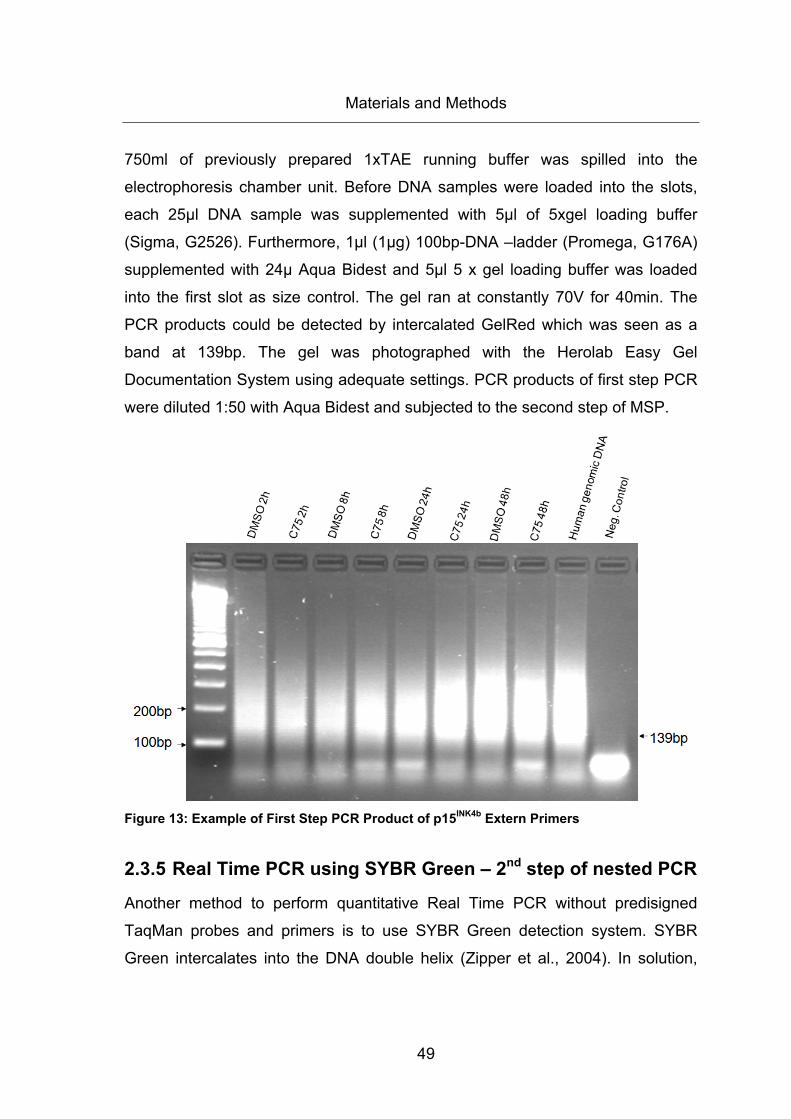
Materials and Methods
49
750ml of previously prepared 1xTAE running buffer was spilled into the
electrophoresis chamber unit. Before DNA samples were loaded into the slots,
each 25µl DNA sample was supplemented with 5µl of 5xgel loading buffer
(Sigma, G2526). Furthermore, 1µl (1µg) 100bp-DNA –ladder (Promega, G176A)
supplemented with 24µ Aqua Bidest and 5µl 5 x gel loading buffer was loaded
into the first slot as size control. The gel ran at constantly 70V for 40min. The
PCR products could be detected by intercalated GelRed which was seen as a
band at 139bp. The gel was photographed with the Herolab Easy Gel
Documentation System using adequate settings. PCR products of first step PCR
were diluted 1:50 with Aqua Bidest and subjected to the second step of MSP.
Figure 13: Example of First Step PCR Product of p15INK4b Extern Primers
2.3.5 Real Time PCR using SYBR Green – 2nd step of nested PCR
Another method to perform quantitative Real Time PCR without predisigned
TaqMan probes and primers is to use SYBR Green detection system. SYBR
Green intercalates into the DNA double helix (Zipper et al., 2004). In solution,
Materials and Methods
50
unbound SYBR Green exhibits very little fluorescence which is greatly enhanced
upon DNA-binding. Thus, during PCR cycles, the increase in SYBR Green
fluorescence at 530nm wavelength is directly proportional to the amount of
generated double-strand-DNA. The basic steps are presented in Figure 14:
1. The reaction mix contains optimized buffer, DNA, nucleotides, SYBR
Green dye, and the primers complementary to the gene of interest. The
unbound dye molecules weakly fluoresce and produce a minimal
background fluorescence signal which is subtracted during computer
analysis.
2. At 95°C the double-stranded DNA denaturize into two single-stranded
DNA strands
3. When annealing temperature is achieved primers hybridize to the
complementary sequences of the single stranded DNA only if the gene of
interest is present. After annealing of the primers, a few SYBR Green
molecules can intercalate to the double-stranded DNA.
4. Emission of fluorescence is increased during elongation.
5. More and more SYBR Green dye molecules can bind to the newly
synthesized DNA. The fluorescence is increasing continuously. The
measurement of the fluorescence is performed at the end of the
elongation step of every PCR cycle to monitor the increasing amount of
amplified DNA.
6. During the following denaturation step of the next PCR cycle the SYBR
Green molecules are released and the fluorescence signal of the dye falls.
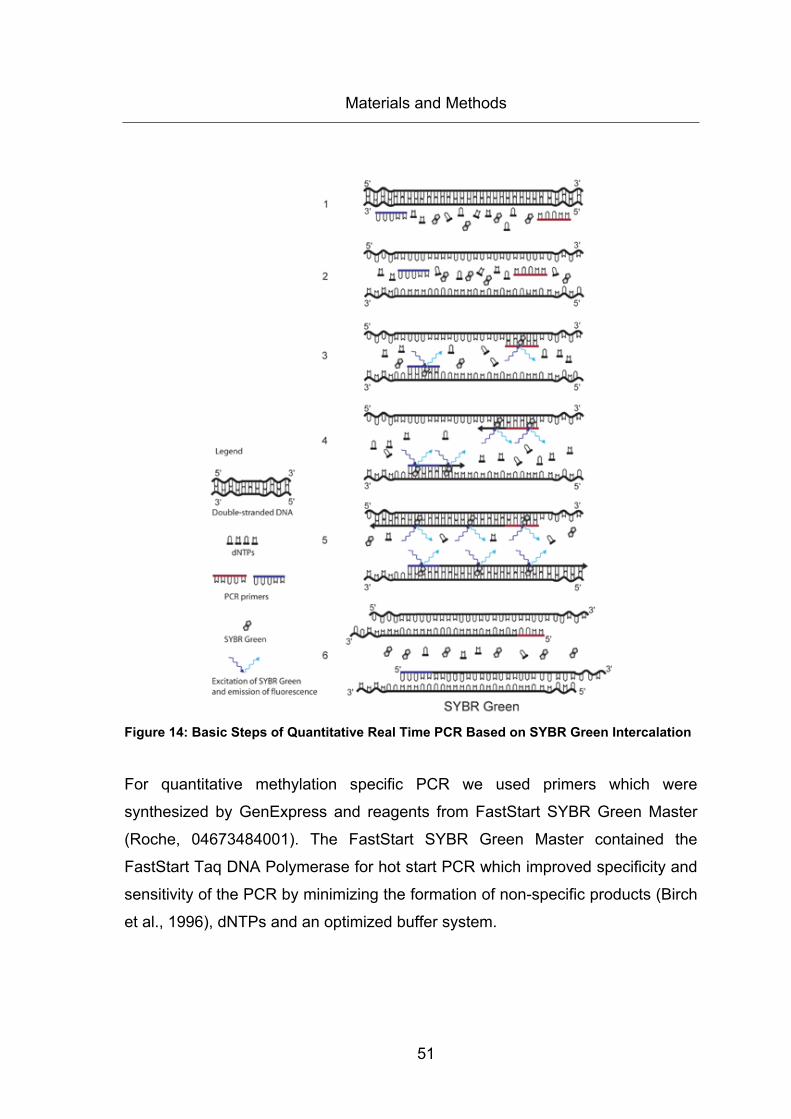
Materials and Methods
51
Figure 14: Basic Steps of Quantitative Real Time PCR Based on SYBR Green Intercalation
For quantitative methylation specific PCR we used primers which were
synthesized by GenExpress and reagents from FastStart SYBR Green Master
(Roche, 04673484001). The FastStart SYBR Green Master contained the
FastStart Taq DNA Polymerase for hot start PCR which improved specificity and
sensitivity of the PCR by minimizing the formation of non-specific products (Birch
et al., 1996), dNTPs and an optimized buffer system.
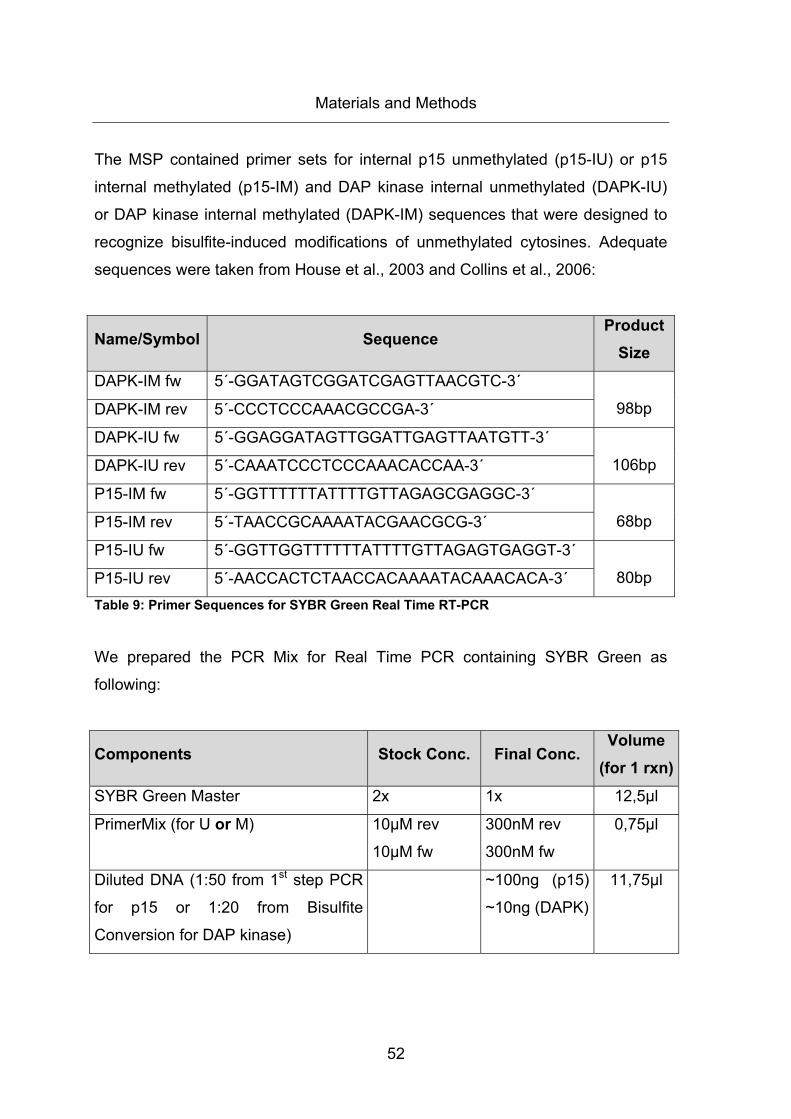
Materials and Methods
52
The MSP contained primer sets for internal p15 unmethylated (p15-IU) or p15
internal methylated (p15-IM) and DAP kinase internal unmethylated (DAPK-IU)
or DAP kinase internal methylated (DAPK-IM) sequences that were designed to
recognize bisulfite-induced modifications of unmethylated cytosines. Adequate
sequences were taken from House et al., 2003 and Collins et al., 2006:
Name/Symbol Sequence Product
Size
DAPK-IM fw 5´-GGATAGTCGGATCGAGTTAACGTC-3´
98bp DAPK-IM rev 5´-CCCTCCCAAACGCCGA-3´
DAPK-IU fw 5´-GGAGGATAGTTGGATTGAGTTAATGTT-3´
106bp DAPK-IU rev 5´-CAAATCCCTCCCAAACACCAA-3´
P15-IM fw 5´-GGTTTTTTATTTTGTTAGAGCGAGGC-3´
68bp P15-IM rev 5´-TAACCGCAAAATACGAACGCG-3´
P15-IU fw 5´-GGTTGGTTTTTTATTTTGTTAGAGTGAGGT-3´
80bp P15-IU rev 5´-AACCACTCTAACCACAAAATACAAACACA-3´ Table 9: Primer Sequences for SYBR Green Real Time RT-PCR
We prepared the PCR Mix for Real Time PCR containing SYBR Green as
following:
Components Stock Conc. Final Conc. Volume
(for 1 rxn)
SYBR Green Master 2x 1x 12,5µl
PrimerMix (for U or M) 10µM rev
10µM fw
300nM rev
300nM fw
0,75µl
Diluted DNA (1:50 from 1st step PCR
for p15 or 1:20 from Bisulfite
Conversion for DAP kinase)
~100ng (p15)
~10ng (DAPK)
11,75µl
Materials and Methods
53
Total Volume 25µl Table 10: Components for SYBR Green Real Time PCR Mix
Finally, 11,75µl (~100ng for p15 or ~10ng for DAP kinase) of DNA template was
added to 13,75µl of PCR mix into Eppendorf PCR reaction tubes and put into a
thermocycler with sequence detection system (Corbett RotorGene Real Time
Thermoanalyzer). We prepared triplicates for every sample and for controls.
Every run was performed with primer sets complementary to methylated and
conversed sequences of p15 or DAP kinase, negative controls containing no
template to detect potential primer duplexes, and unmethylated human genomic
DNA control. Thermal cycling conditions for all used primers and probes were as
following:
Activation of Hot StartTaq DNA Polymerase 95°C 10min Hold
Denaturation 95°C 30sec
50 Cycles Annealing 58°C 30sec
Elongation 72°C 30sec
Final Elongation 72°C 5min Hold Table 11: Cyling Conditions for SYBR Green Real Time PCR Amplification of p15INK4b methylated, p15INK4b unmethylated
Activation of Hot StartTaq DNA Polymerase 95°C 10min Hold
Denaturation 95°C 30sec
50 Cycles Annealing 60°C 60sec
Elongation 72°C 60sec
Final Elongation 72°C 5min Hold Table 12: Cyling Conditions for SYBR Green Real Time PCR Amplification of DAP kinase methylated, and DAP kinase unmethylated
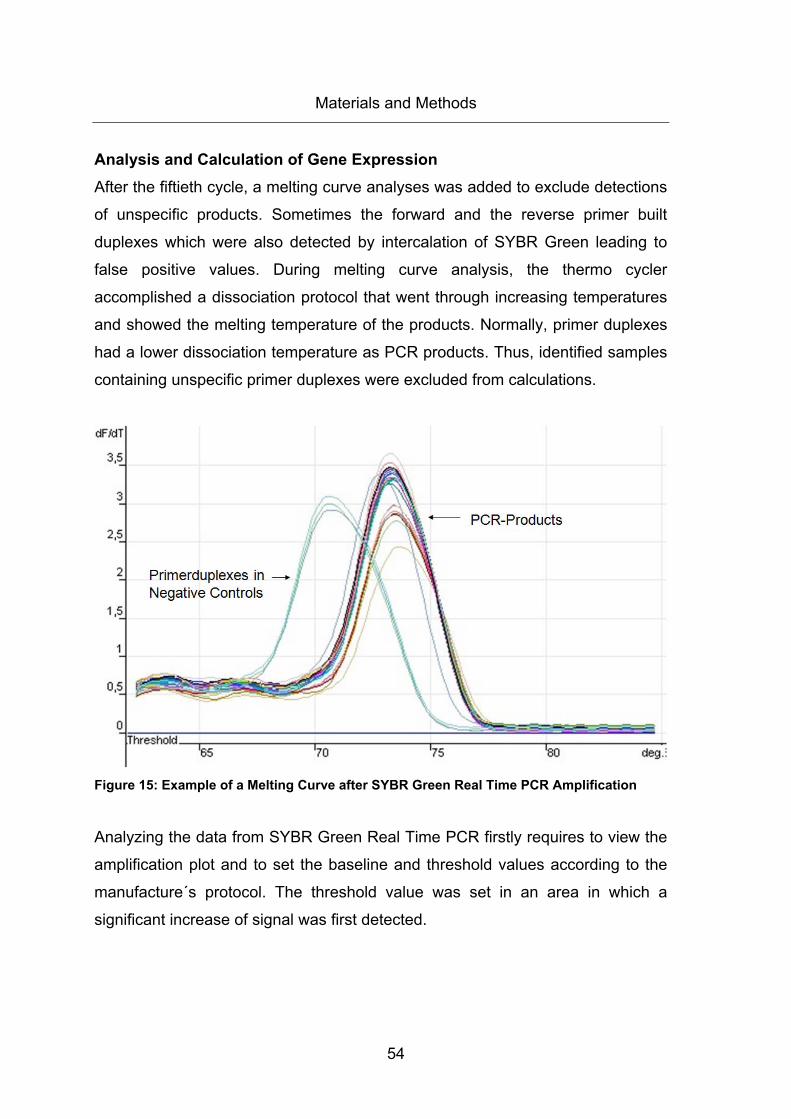
Materials and Methods
54
Analysis and Calculation of Gene Expression After the fiftieth cycle, a melting curve analyses was added to exclude detections
of unspecific products. Sometimes the forward and the reverse primer built
duplexes which were also detected by intercalation of SYBR Green leading to
false positive values. During melting curve analysis, the thermo cycler
accomplished a dissociation protocol that went through increasing temperatures
and showed the melting temperature of the products. Normally, primer duplexes
had a lower dissociation temperature as PCR products. Thus, identified samples
containing unspecific primer duplexes were excluded from calculations.
Figure 15: Example of a Melting Curve after SYBR Green Real Time PCR Amplification
Analyzing the data from SYBR Green Real Time PCR firstly requires to view the
amplification plot and to set the baseline and threshold values according to the
manufacture´s protocol. The threshold value was set in an area in which a
significant increase of signal was first detected.
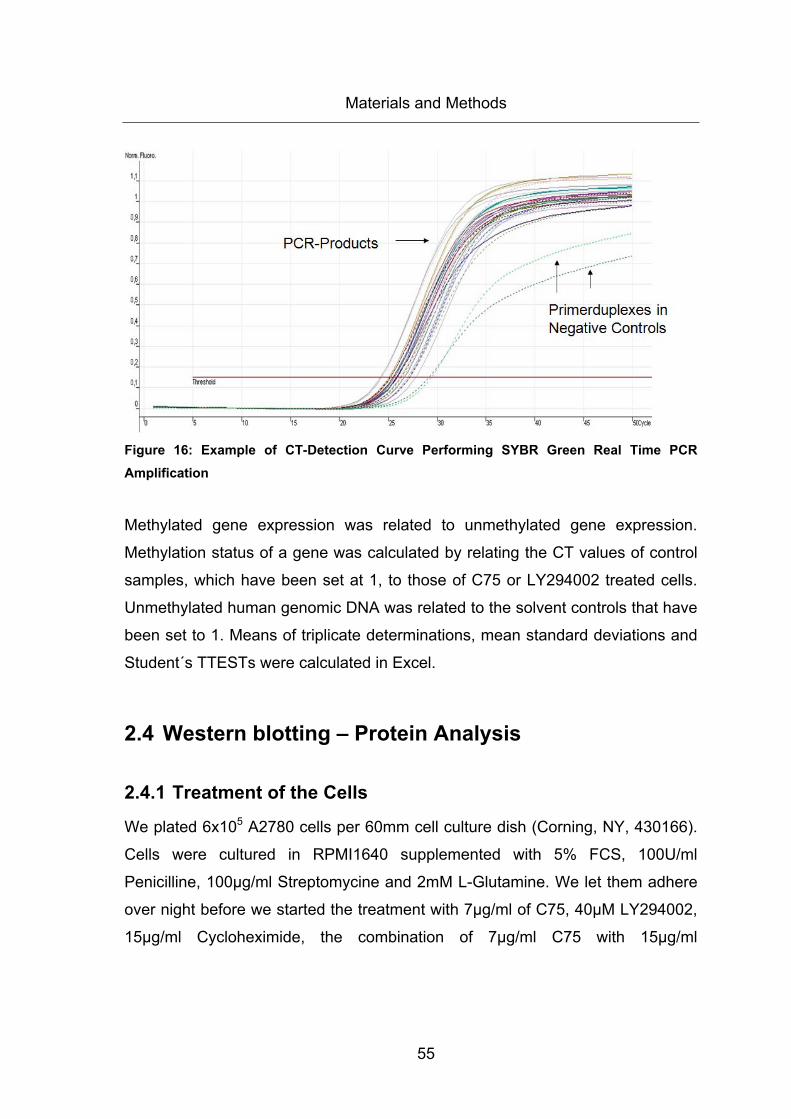
Materials and Methods
55
Figure 16: Example of CT-Detection Curve Performing SYBR Green Real Time PCR Amplification
Methylated gene expression was related to unmethylated gene expression.
Methylation status of a gene was calculated by relating the CT values of control
samples, which have been set at 1, to those of C75 or LY294002 treated cells.
Unmethylated human genomic DNA was related to the solvent controls that have
been set to 1. Means of triplicate determinations, mean standard deviations and
Student´s TTESTs were calculated in Excel.
2.4 Western blotting – Protein Analysis
2.4.1 Treatment of the Cells
We plated 6x10⁵ A2780 cells per 60mm cell culture dish (Corning, NY, 430166).
Cells were cultured in RPMI1640 supplemented with 5% FCS, 100U/ml
Penicilline, 100µg/ml Streptomycine and 2mM L-Glutamine. We let them adhere
over night before we started the treatment with 7µg/ml of C75, 40µM LY294002,
15µg/ml Cycloheximide, the combination of 7µg/ml C75 with 15µg/ml
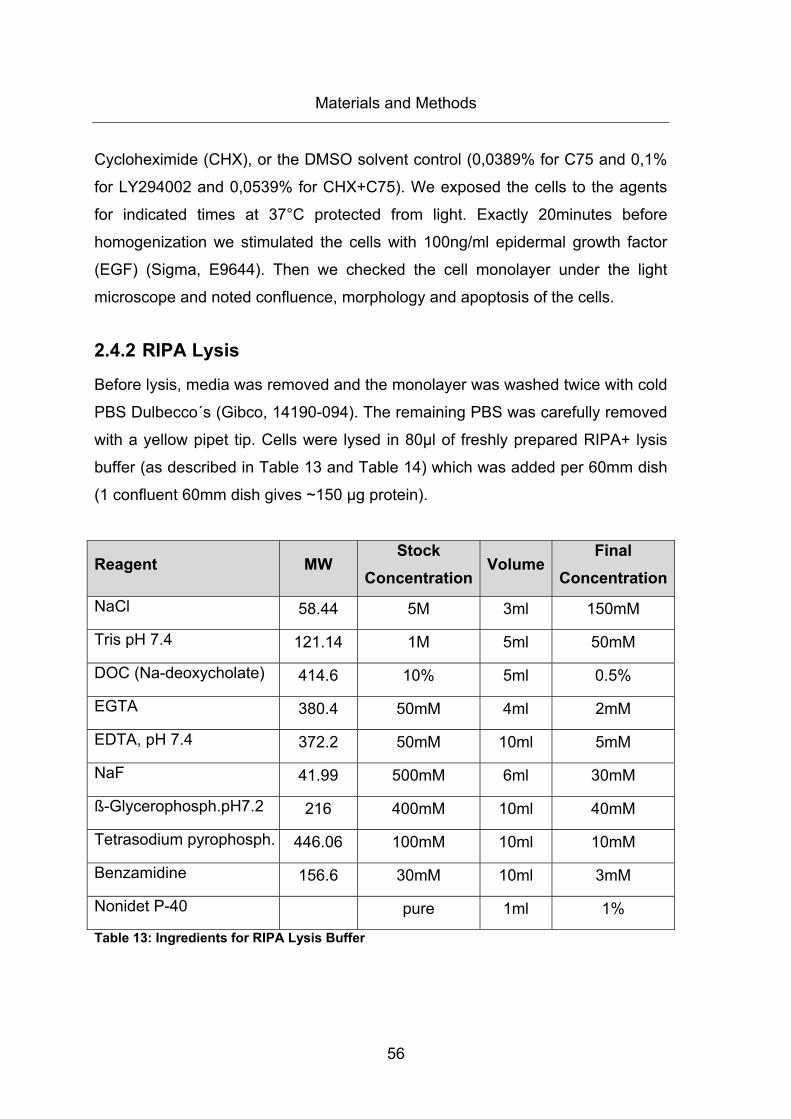
Materials and Methods
56
Cycloheximide (CHX), or the DMSO solvent control (0,0389% for C75 and 0,1%
for LY294002 and 0,0539% for CHX+C75). We exposed the cells to the agents
for indicated times at 37°C protected from light. Exactly 20minutes before
homogenization we stimulated the cells with 100ng/ml epidermal growth factor
(EGF) (Sigma, E9644). Then we checked the cell monolayer under the light
microscope and noted confluence, morphology and apoptosis of the cells.
2.4.2 RIPA Lysis
Before lysis, media was removed and the monolayer was washed twice with cold
PBS Dulbecco´s (Gibco, 14190-094). The remaining PBS was carefully removed
with a yellow pipet tip. Cells were lysed in 80µl of freshly prepared RIPA+ lysis
buffer (as described in Table 13 and Table 14) which was added per 60mm dish
(1 confluent 60mm dish gives ~150 µg protein).
Reagent MW Stock
ConcentrationVolume
Final Concentration
NaCl 58.44 5M 3ml 150mM
Tris pH 7.4 121.14 1M 5ml 50mM
DOC (Na-deoxycholate) 414.6 10% 5ml 0.5%
EGTA 380.4 50mM 4ml 2mM
EDTA, pH 7.4 372.2 50mM 10ml 5mM
NaF 41.99 500mM 6ml 30mM
ß-Glycerophosph.pH7.2 216 400mM 10ml 40mM
Tetrasodium pyrophosph. 446.06 100mM 10ml 10mM
Benzamidine 156.6 30mM 10ml 3mM
Nonidet P-40 pure 1ml 1%
Table 13: Ingredients for RIPA Lysis Buffer
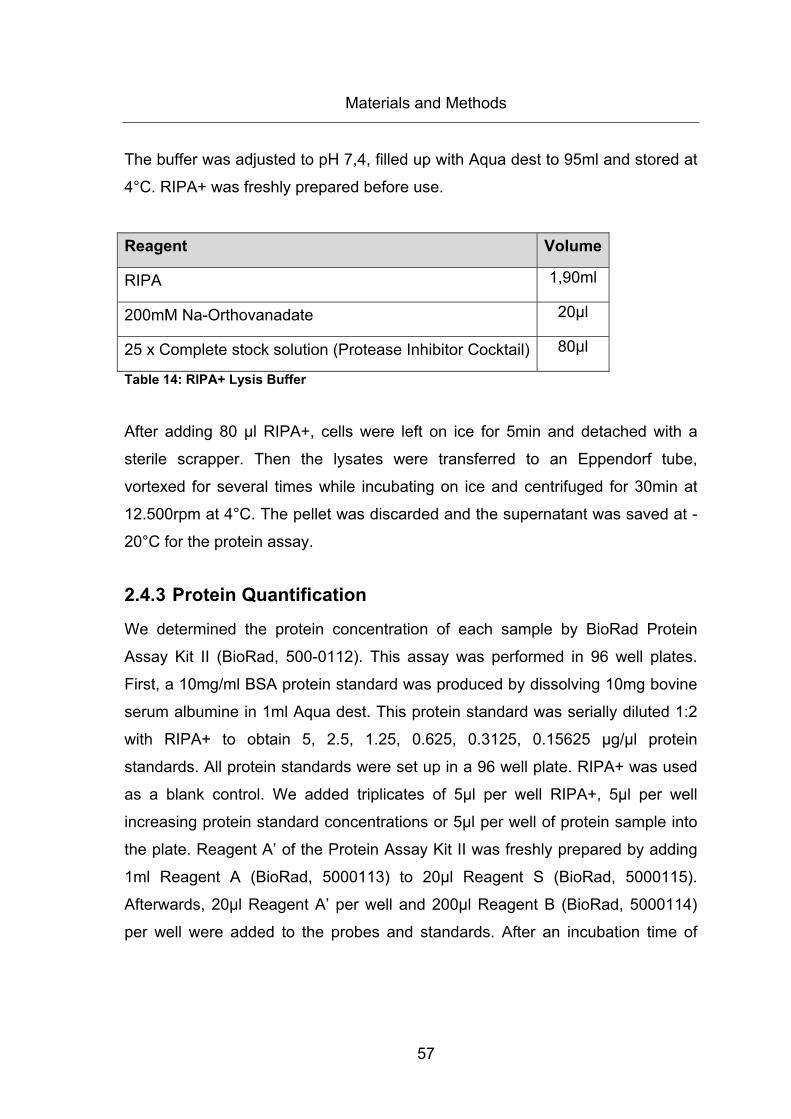
Materials and Methods
57
The buffer was adjusted to pH 7,4, filled up with Aqua dest to 95ml and stored at
4°C. RIPA+ was freshly prepared before use.
Reagent Volume
RIPA 1,90ml
200mM Na-Orthovanadate 20µl
25 x Complete stock solution (Protease Inhibitor Cocktail) 80µl
Table 14: RIPA+ Lysis Buffer
After adding 80 µl RIPA+, cells were left on ice for 5min and detached with a
sterile scrapper. Then the lysates were transferred to an Eppendorf tube,
vortexed for several times while incubating on ice and centrifuged for 30min at
12.500rpm at 4°C. The pellet was discarded and the supernatant was saved at -
20°C for the protein assay.
2.4.3 Protein Quantification
We determined the protein concentration of each sample by BioRad Protein
Assay Kit II (BioRad, 500-0112). This assay was performed in 96 well plates.
First, a 10mg/ml BSA protein standard was produced by dissolving 10mg bovine
serum albumine in 1ml Aqua dest. This protein standard was serially diluted 1:2
with RIPA+ to obtain 5, 2.5, 1.25, 0.625, 0.3125, 0.15625 µg/µl protein
standards. All protein standards were set up in a 96 well plate. RIPA+ was used
as a blank control. We added triplicates of 5µl per well RIPA+, 5µl per well
increasing protein standard concentrations or 5µl per well of protein sample into
the plate. Reagent A’ of the Protein Assay Kit II was freshly prepared by adding
1ml Reagent A (BioRad, 5000113) to 20µl Reagent S (BioRad, 5000115).
Afterwards, 20µl Reagent A’ per well and 200µl Reagent B (BioRad, 5000114)
per well were added to the probes and standards. After an incubation time of
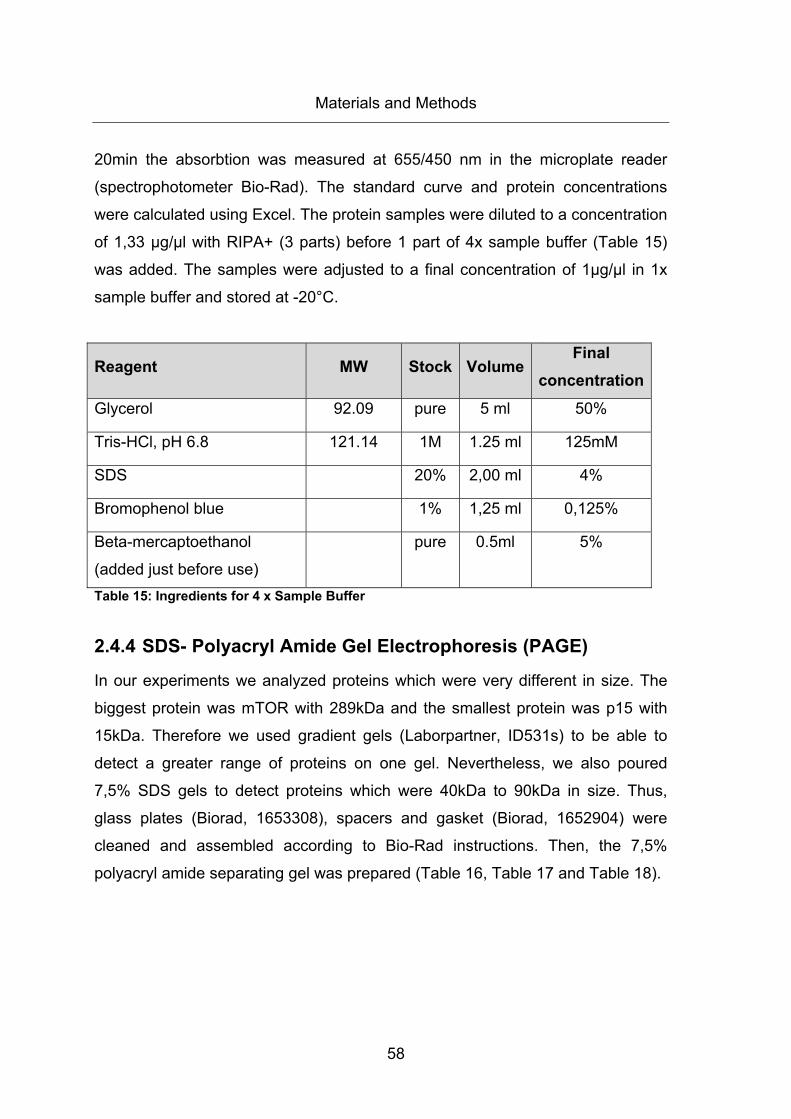
Materials and Methods
58
20min the absorbtion was measured at 655/450 nm in the microplate reader
(spectrophotometer Bio-Rad). The standard curve and protein concentrations
were calculated using Excel. The protein samples were diluted to a concentration
of 1,33 µg/µl with RIPA+ (3 parts) before 1 part of 4x sample buffer (Table 15)
was added. The samples were adjusted to a final concentration of 1µg/µl in 1x
sample buffer and stored at -20°C.
Reagent MW Stock VolumeFinal
concentration
Glycerol 92.09 pure 5 ml 50%
Tris-HCl, pH 6.8 121.14 1M 1.25 ml 125mM
SDS 20% 2,00 ml 4%
Bromophenol blue 1% 1,25 ml 0,125%
Beta-mercaptoethanol
(added just before use)
pure 0.5ml 5%
Table 15: Ingredients for 4 x Sample Buffer
2.4.4 SDS- Polyacryl Amide Gel Electrophoresis (PAGE)
In our experiments we analyzed proteins which were very different in size. The
biggest protein was mTOR with 289kDa and the smallest protein was p15 with
15kDa. Therefore we used gradient gels (Laborpartner, ID531s) to be able to
detect a greater range of proteins on one gel. Nevertheless, we also poured
7,5% SDS gels to detect proteins which were 40kDa to 90kDa in size. Thus,
glass plates (Biorad, 1653308), spacers and gasket (Biorad, 1652904) were
cleaned and assembled according to Bio-Rad instructions. Then, the 7,5%
polyacryl amide separating gel was prepared (Table 16, Table 17 and Table 18).
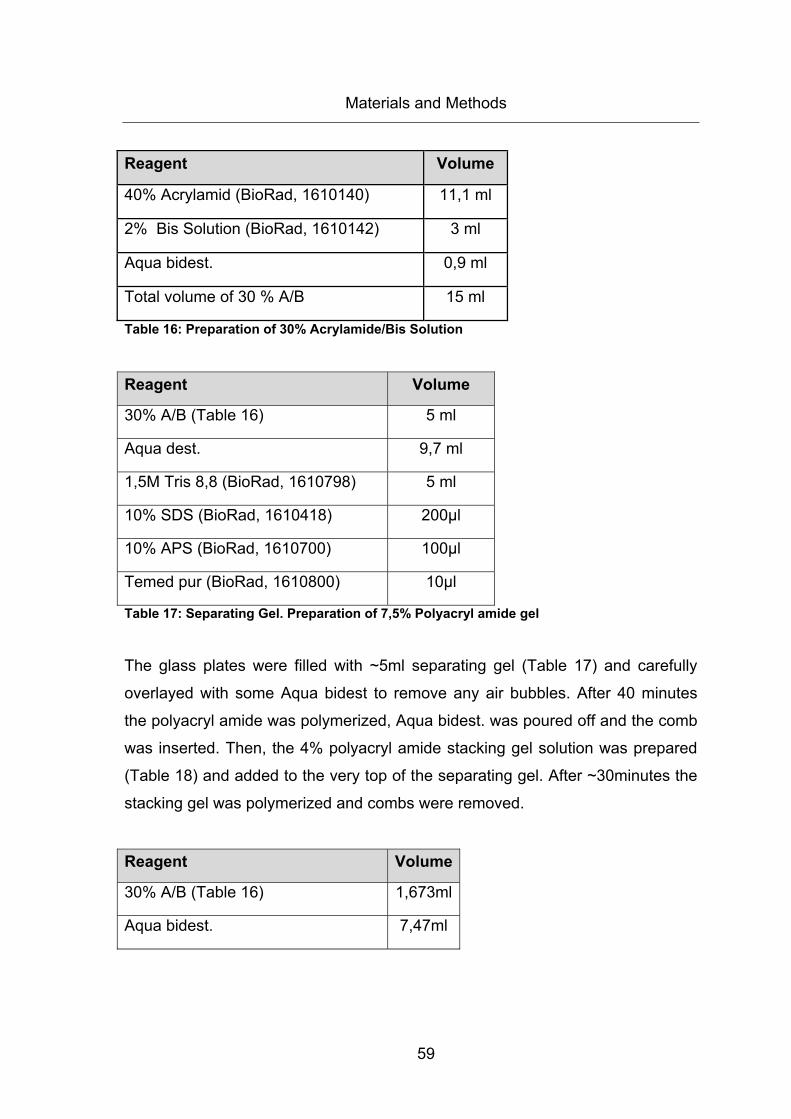
Materials and Methods
59
Reagent Volume
40% Acrylamid (BioRad, 1610140) 11,1 ml
2% Bis Solution (BioRad, 1610142) 3 ml
Aqua bidest. 0,9 ml
Total volume of 30 % A/B 15 ml
Table 16: Preparation of 30% Acrylamide/Bis Solution
Reagent Volume
30% A/B (Table 16) 5 ml
Aqua dest. 9,7 ml
1,5M Tris 8,8 (BioRad, 1610798) 5 ml
10% SDS (BioRad, 1610418) 200µl
10% APS (BioRad, 1610700) 100µl
Temed pur (BioRad, 1610800) 10µl
Table 17: Separating Gel. Preparation of 7,5% Polyacryl amide gel
The glass plates were filled with ~5ml separating gel (Table 17) and carefully
overlayed with some Aqua bidest to remove any air bubbles. After 40 minutes
the polyacryl amide was polymerized, Aqua bidest. was poured off and the comb
was inserted. Then, the 4% polyacryl amide stacking gel solution was prepared
(Table 18) and added to the very top of the separating gel. After ~30minutes the
stacking gel was polymerized and combs were removed.
Reagent Volume
30% A/B (Table 16) 1,673ml
Aqua bidest. 7,47ml
Materials and Methods
60
0,5M Tris 6,8 (BoiRad, 1610799) 3,15 ml
10% SDS (BioRad, 1610418) 125µl
10% APS (BioRad, 1610700) 125µl
Temed pur (BioRad, 1610800) 12,5µl
Table 18: Stacking Gel. Preparation of 4% Polyacryl amide gel
The purchased plates including the gels or the self poured gels were inserted in
the gel holder cassette (BioRad, 1703931) and the electrophoresis apparatus
before 1x running buffer containing 25mM Tris, 192mM Glycine, and 0,1% SDS
in Aqua bidest was added. First, the inner reservoir was filled with running buffer
and checked for leak tightness before the outer reservoir was also filled with 1 x
running buffer. Protein samples were boiled for 10 min at 95°C for denaturation.
Then 20µg protein per sample was loaded into each slot. 1,5 µl of the molecular
weight marker (Magic Mark XP from Invitrogen, LC5602) was loaded into the first
lane of each gel without being boiled. The gel was run constantly at 100 Volt for
~2 hours. After electrophoresis, the gel was subjected to Western blotting.
2.4.5 Electrotransfer
The separated proteins were transferred from the polyacryl amid gel onto a
polyvinylidenedifluoride (PVDF) membrane (NEF, 153196). The precooled
transfer buffer containing 150mM Glycine, 50mM Tris pH8,3, 0,05% sodium
dodecylsulfate (SDS), and 20% Methanol was pured into the transfer chamber
and a stirring rod was put inside to prevent heating during transfer. The
membrane which was marked with a pen was shortly soaked in pure methanol
before the blotting sandwich was assembled as shown in Figure 17. Scotch
brites and filter papers were also soaked in transfer buffer. Air bubbles were
removed by rolling a pipet fragment over the blotting sandwich. The
electrotransfer was performed at constant 290mA overnight at 4°C in a cold
room.
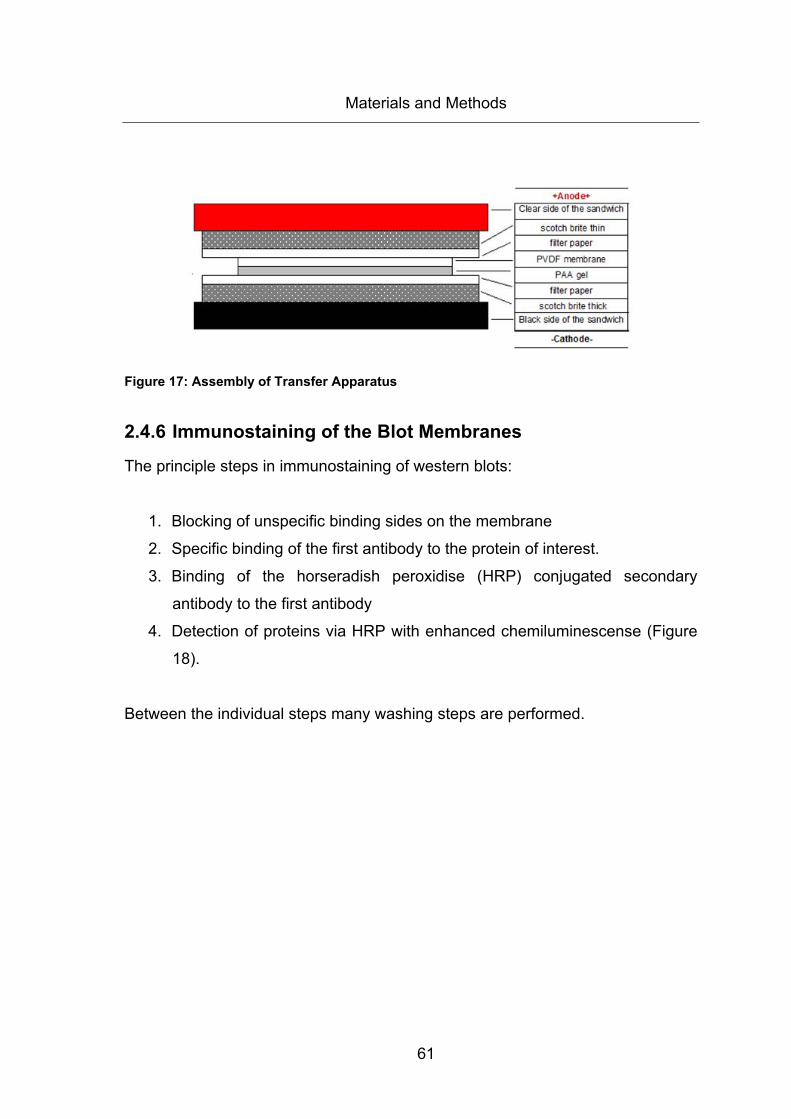
Materials and Methods
61
Figure 17: Assembly of Transfer Apparatus
2.4.6 Immunostaining of the Blot Membranes
The principle steps in immunostaining of western blots:
1. Blocking of unspecific binding sides on the membrane
2. Specific binding of the first antibody to the protein of interest.
3. Binding of the horseradish peroxidise (HRP) conjugated secondary
antibody to the first antibody
4. Detection of proteins via HRP with enhanced chemiluminescense (Figure
18).
Between the individual steps many washing steps are performed.
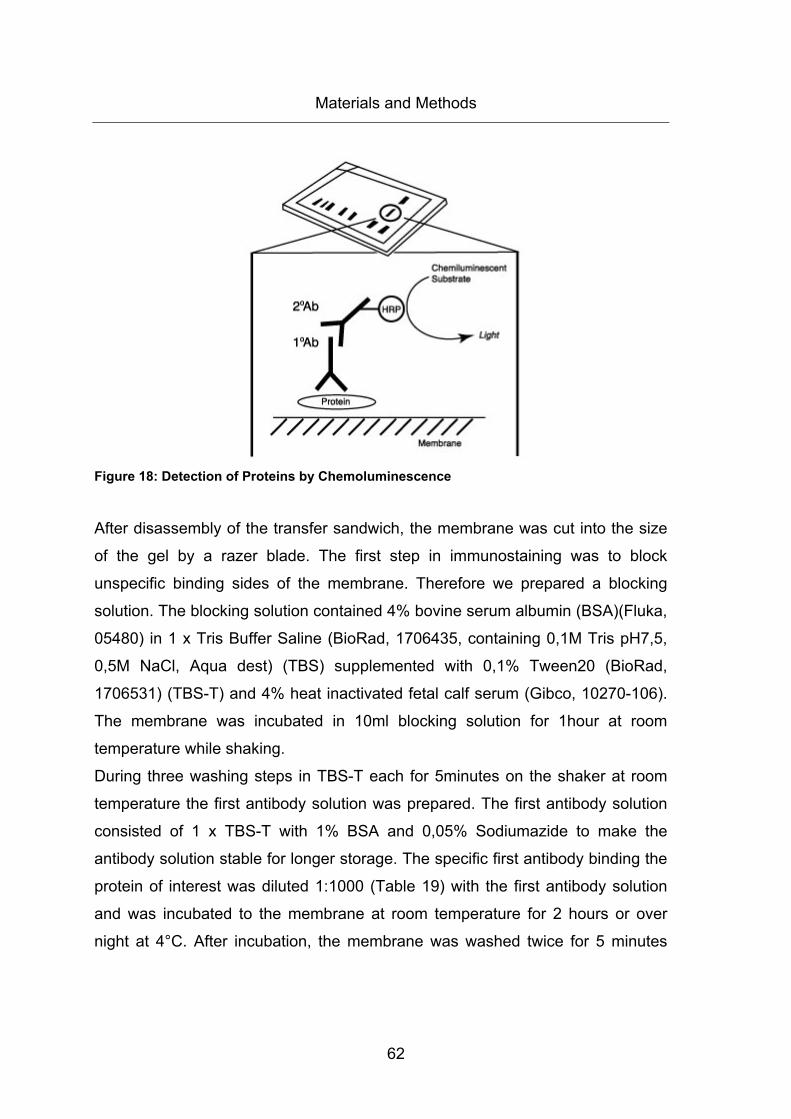
Materials and Methods
62
Figure 18: Detection of Proteins by Chemoluminescence
After disassembly of the transfer sandwich, the membrane was cut into the size
of the gel by a razer blade. The first step in immunostaining was to block
unspecific binding sides of the membrane. Therefore we prepared a blocking
solution. The blocking solution contained 4% bovine serum albumin (BSA)(Fluka,
05480) in 1 x Tris Buffer Saline (BioRad, 1706435, containing 0,1M Tris pH7,5,
0,5M NaCl, Aqua dest) (TBS) supplemented with 0,1% Tween20 (BioRad,
1706531) (TBS-T) and 4% heat inactivated fetal calf serum (Gibco, 10270-106).
The membrane was incubated in 10ml blocking solution for 1hour at room
temperature while shaking.
During three washing steps in TBS-T each for 5minutes on the shaker at room
temperature the first antibody solution was prepared. The first antibody solution
consisted of 1 x TBS-T with 1% BSA and 0,05% Sodiumazide to make the
antibody solution stable for longer storage. The specific first antibody binding the
protein of interest was diluted 1:1000 (Table 19) with the first antibody solution
and was incubated to the membrane at room temperature for 2 hours or over
night at 4°C. After incubation, the membrane was washed twice for 5 minutes
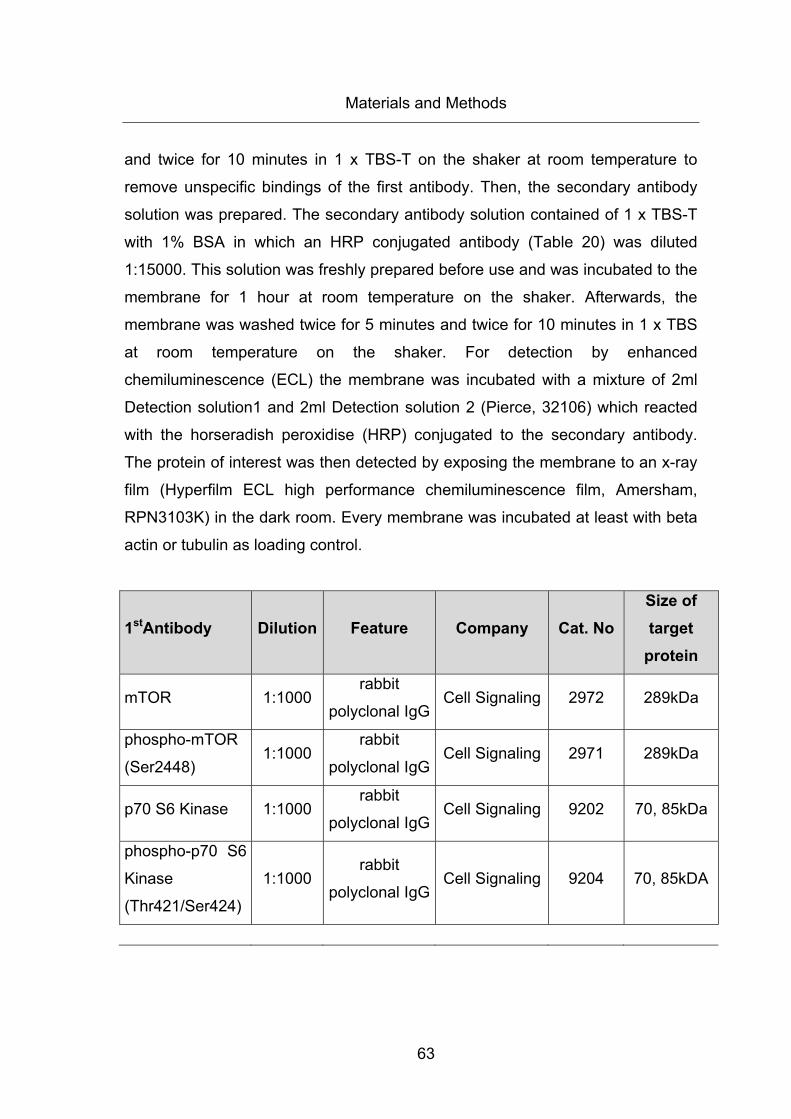
Materials and Methods
63
and twice for 10 minutes in 1 x TBS-T on the shaker at room temperature to
remove unspecific bindings of the first antibody. Then, the secondary antibody
solution was prepared. The secondary antibody solution contained of 1 x TBS-T
with 1% BSA in which an HRP conjugated antibody (Table 20) was diluted
1:15000. This solution was freshly prepared before use and was incubated to the
membrane for 1 hour at room temperature on the shaker. Afterwards, the
membrane was washed twice for 5 minutes and twice for 10 minutes in 1 x TBS
at room temperature on the shaker. For detection by enhanced
chemiluminescence (ECL) the membrane was incubated with a mixture of 2ml
Detection solution1 and 2ml Detection solution 2 (Pierce, 32106) which reacted
with the horseradish peroxidise (HRP) conjugated to the secondary antibody.
The protein of interest was then detected by exposing the membrane to an x-ray
film (Hyperfilm ECL high performance chemiluminescence film, Amersham,
RPN3103K) in the dark room. Every membrane was incubated at least with beta
actin or tubulin as loading control.
1stAntibody Dilution Feature Company Cat. No Size of target
protein
mTOR 1:1000 rabbit
polyclonal IgGCell Signaling 2972 289kDa
phospho-mTOR
(Ser2448) 1:1000
rabbit
polyclonal IgGCell Signaling 2971 289kDa
p70 S6 Kinase 1:1000 rabbit
polyclonal IgGCell Signaling 9202 70, 85kDa
phospho-p70 S6
Kinase
(Thr421/Ser424)
1:1000 rabbit
polyclonal IgGCell Signaling 9204 70, 85kDA
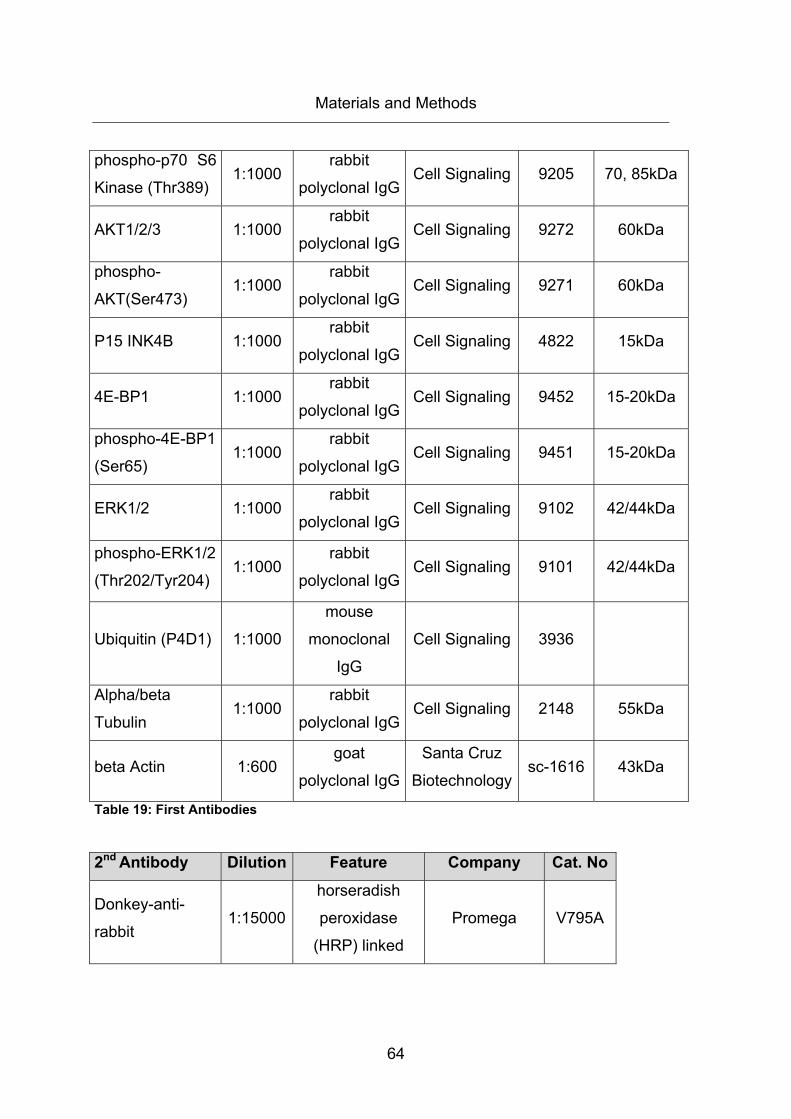
Materials and Methods
64
phospho-p70 S6
Kinase (Thr389) 1:1000
rabbit
polyclonal IgGCell Signaling 9205 70, 85kDa
AKT1/2/3 1:1000 rabbit
polyclonal IgGCell Signaling 9272 60kDa
phospho-
AKT(Ser473) 1:1000
rabbit
polyclonal IgGCell Signaling 9271 60kDa
P15 INK4B 1:1000 rabbit
polyclonal IgGCell Signaling 4822 15kDa
4E-BP1 1:1000 rabbit
polyclonal IgGCell Signaling 9452 15-20kDa
phospho-4E-BP1
(Ser65) 1:1000
rabbit
polyclonal IgGCell Signaling 9451 15-20kDa
ERK1/2 1:1000 rabbit
polyclonal IgGCell Signaling 9102 42/44kDa
phospho-ERK1/2
(Thr202/Tyr204) 1:1000
rabbit
polyclonal IgGCell Signaling 9101 42/44kDa
Ubiquitin (P4D1) 1:1000
mouse
monoclonal
IgG
Cell Signaling 3936
Alpha/beta
Tubulin 1:1000
rabbit
polyclonal IgGCell Signaling 2148 55kDa
beta Actin 1:600 goat
polyclonal IgG
Santa Cruz
Biotechnologysc-1616 43kDa
Table 19: First Antibodies
2nd Antibody Dilution Feature Company Cat. No
Donkey-anti-
rabbit 1:15000
horseradish
peroxidase
(HRP) linked
Promega V795A

Materials and Methods
65
Donkey-anti goat 1:15000
horseradish
peroxidase
(HRP) linked
Santa Cruz
Biotechnology sc2020
Chicken-anti-
mouse 1:15000
horseradish
peroxidase
(HRP) linked
Santa Cruz
Biotechnology sc2954
Table 20: Secondary Antibodies
2.4.7 Stripping of Membranes
After detection of a protein of interest it is possible to detach all antibodies from
the protein and to incubate the blot with another antibody. Therefore we
prepared a 1 x stripping solution containing 62,5mM Tris pH6,7 and 2%SDS and
added 200µl ß-mercaptoethanol to 20ml of stripping solution. The blot was
stripped for 20min at 50°C in a water-bath with frequent shaking. After stripping
the membrane, the blot was washed 5 times for 5 minutes in TBS-T at room
temperature on the shaker and blocked in blocking solution containing 4% FBS
for 1 hour.
2.4.8 Densitometry of the Protein Bands
For quantification of the protein expression levels we performed densitometry
using HeroLab software. Protein levels were estimated by relating the band of
the specific antibody to that of beta actin. The antibody/actin ratios of treated
samples were compared to those of vehicle-treated controls which have been set
at 1 and the results were expressed in fold changes.
Materials and Methods
66
2.5 mRNA Gene Expression Array
For gene expression profiling we used Affymetrix Human GeneChip Gene 1.0 ST
Array System. This array interrogates the most up-to-date content of well-
annotated 28.869 genes with 764.885 distinct probes and was performed at
Kompetenzzentrum für Fluoreszente Bioanalytik (KFB) in Heidelberg. They offer
a complete solution for gene expression analysis that includes whole transcript
sense target labeling, control reagents fluidics, scanning instrumentation and
analysis. The Human Gene 1.0 ST Array uses a perfect match-only design with
probes that hybridize to sense targets. The gene expression level of multiple
probes on different exons is summarized into an expression value representing
all transcripts from the same gene. Background is estimated using a set of
~17.000 generic background probes and several standard poly-A controls and
hybridization controls are represented on the array to allow troubleshooting.
In fact, array analysis became a powerful approach for comparing RNA
populations of treated and untreated cell cultures. The main steps performing an
expression array involve:
1. Isolation of RNA from the cells to be compared (performed by ourselves)
2. Conversion of RNA to biotin-labeled cDNA by Reverse Transcription
3. Hybridization of each labeled cDNA sample to a separate Chip
4. Removal of unhybridized cDNA
5. Staining of hybridized cDNA with a streptavidin-phycoerythrin conjugate
6. Visualization with an array scanner and comparing the quantitative data
from various samples
The typical Affimetrix is a glass slide array that is produced using special
methods which allow the nucleotides to be synthesized directly on the Chip
substrate. For validation we additionally performed Real Time RT-PCR of several
genes of interest.
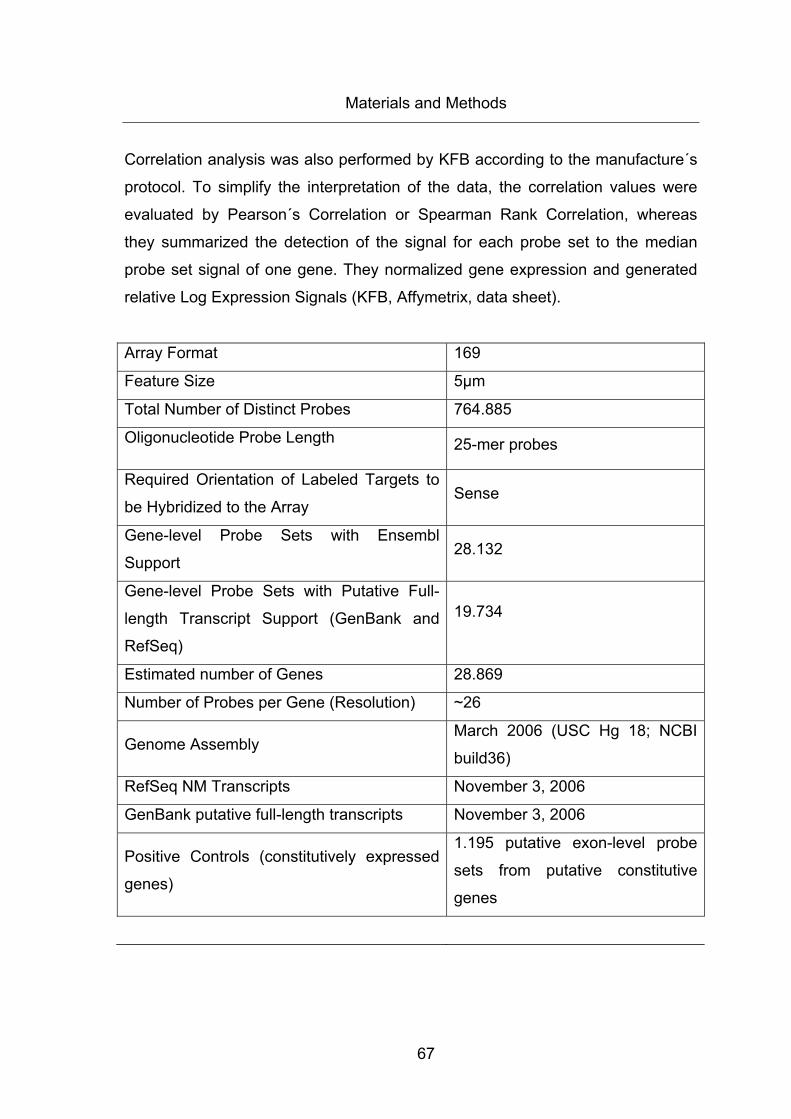
Materials and Methods
67
Correlation analysis was also performed by KFB according to the manufacture´s
protocol. To simplify the interpretation of the data, the correlation values were
evaluated by Pearson´s Correlation or Spearman Rank Correlation, whereas
they summarized the detection of the signal for each probe set to the median
probe set signal of one gene. They normalized gene expression and generated
relative Log Expression Signals (KFB, Affymetrix, data sheet).
Array Format 169
Feature Size 5µm
Total Number of Distinct Probes 764.885
Oligonucleotide Probe Length 25-mer probes
Required Orientation of Labeled Targets to
be Hybridized to the Array Sense
Gene-level Probe Sets with Ensembl
Support 28.132
Gene-level Probe Sets with Putative Full-
length Transcript Support (GenBank and
RefSeq)
19.734
Estimated number of Genes 28.869
Number of Probes per Gene (Resolution) ~26
Genome Assembly March 2006 (USC Hg 18; NCBI
build36)
RefSeq NM Transcripts November 3, 2006
GenBank putative full-length transcripts November 3, 2006
Positive Controls (constitutively expressed
genes)
1.195 putative exon-level probe
sets from putative constitutive
genes
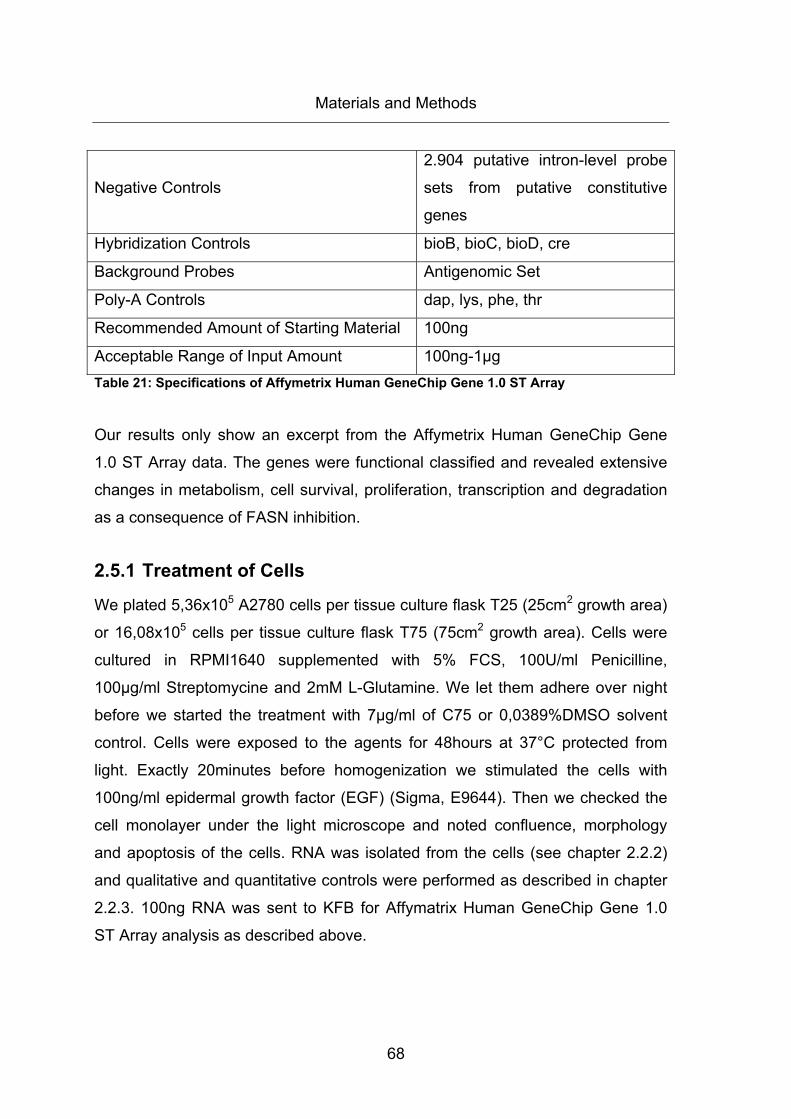
Materials and Methods
68
Negative Controls
2.904 putative intron-level probe
sets from putative constitutive
genes
Hybridization Controls bioB, bioC, bioD, cre
Background Probes Antigenomic Set
Poly-A Controls dap, lys, phe, thr
Recommended Amount of Starting Material 100ng
Acceptable Range of Input Amount 100ng-1µg Table 21: Specifications of Affymetrix Human GeneChip Gene 1.0 ST Array
Our results only show an excerpt from the Affymetrix Human GeneChip Gene
1.0 ST Array data. The genes were functional classified and revealed extensive
changes in metabolism, cell survival, proliferation, transcription and degradation
as a consequence of FASN inhibition.
2.5.1 Treatment of Cells
We plated 5,36x10⁵ A2780 cells per tissue culture flask T25 (25cm2 growth area)
or 16,08x10⁵ cells per tissue culture flask T75 (75cm2 growth area). Cells were
cultured in RPMI1640 supplemented with 5% FCS, 100U/ml Penicilline,
100µg/ml Streptomycine and 2mM L-Glutamine. We let them adhere over night
before we started the treatment with 7µg/ml of C75 or 0,0389%DMSO solvent
control. Cells were exposed to the agents for 48hours at 37°C protected from
light. Exactly 20minutes before homogenization we stimulated the cells with
100ng/ml epidermal growth factor (EGF) (Sigma, E9644). Then we checked the
cell monolayer under the light microscope and noted confluence, morphology
and apoptosis of the cells. RNA was isolated from the cells (see chapter 2.2.2)
and qualitative and quantitative controls were performed as described in chapter
2.2.3. 100ng RNA was sent to KFB for Affymatrix Human GeneChip Gene 1.0
ST Array analysis as described above.
69
3 Results
3.1 Changes in mRNA levels resulting from FASN-inhibition by C75 or from PI3K-inhibition by LY294002 in A2780 cells
Up to date, a conclusive molecular explanation of the anti-proliferative and death
promoting effects of FASN-inhibitors is still missing. In particular, the relationship
between the FASN biochemical pathway and the epigenetic regulation of tumor
suppressor genes is completely unexplored. First of all, we examined the mRNA
expression levels of several tumor suppressor genes, apoptosis-related genes
and epigenetically active enzymes in the ovarian cancer cell line A2780, which
has been treated with the specific FASN-inhibitor C75 (7µg/ml) or the specific
PI3K inhibitor LY294002 (40µM). Several types of tumors, including ovarian
cancer, are known to have a hypermethylation phenotype (Esteller et al., 2001;
Strathdee et al., 2001). Therefore, we examined the gene expression status of
some tumor suppressor genes, which have already been reported to be
promoter hypermethylated.
3.1.1 Changes in mRNA expression of tumor suppressor genes resulting from FASN-inhibition by C75 or PI3K-inhibition by LY294002 in A2780 cells
The ovarian cancer cell line A2780 expresses high levels of FASN and its cell
growth is sensitive to inhibition of FASN by C75. Growth data by Grunt et al.
showed that best inhibition by C75 was achieved when A2780 had been treated
with a concentration of 7µg/ml C75 (Grunt et al., 2009).Treatment times of 2,8
(data not shown), 24, 48,72 hours were chosen to capture early and late gene
Results
70
changes associated with the block of cell cycle progression and the advent of
apoptosis occurring in response to inhibition of FASN by C75. Results were
examined in three biological experiments. The mRNA expression was
normalized to ß-actin or glyceraldehyde-3-phosphate dehydrogenase (GAPDH)
and compared to the solvent control of C75 for every time point.
Correspondingly, cells were exposed to 40µM LY294002 for the same time
periods and mRNA expression was analyzed as described for C75.
3.1.1.1 C75 and LY294002 increase p15INK4b mRNA expression level in
A2780 cells
In A2780, C75 significantly enhances mRNA expression level of p15INK4b in
three replicates. Inactivation of FASN elevates the transcript level of p15INK4b 5,6-
fold after 24 hours of exposure to 7µg/ml C75, 6,8-fold after 48 hours of
exposure and 7,9-fold after 72 hours of exposure. This indicates that treatment of
A2780 cells with 7µg/ml C75 induces a time-dependent elevation of the gene
expression level of this inhibitor of cyclin-dependent kinases that prevents the
cell from going through the G1-S phase transition (Figure 19). However, our data
suggest that this effect is more pronounced on the mRNA than on the protein
level and actually cannot have further implication on the cell cycle as the protein
level of p15 is even reduced in C75-treated A2780 (Figure 31, later time points).
Since FASN-inhibition has been reported to block the PI3K/AKT pathway (Grunt
et al., 2009) we also used LY294002 in a concentration of 40µM as a PI3K
inhibitor in A2780 to compare the changes on several tumor suppressor genes.
LY294002 exerts similar effects on p15INK4b mRNA expression in A2780 as
compared to C75. Both compounds augment the gene expression level of this
cyclin-dependent kinases inhibitor while C75 seems to be more effective in
promoting p15INK4b mRNA expression. C75-treated cells show a maximum of 7,9-
fold stimulation in p15INK4b mRNA expression after 72 hours of treatment and
LY294002-treated cells reveal a maximal 5.5-fold increase in p15INK4b transcript
level after 72 hours of exposure (Figure 19). As already seen in C75-treated
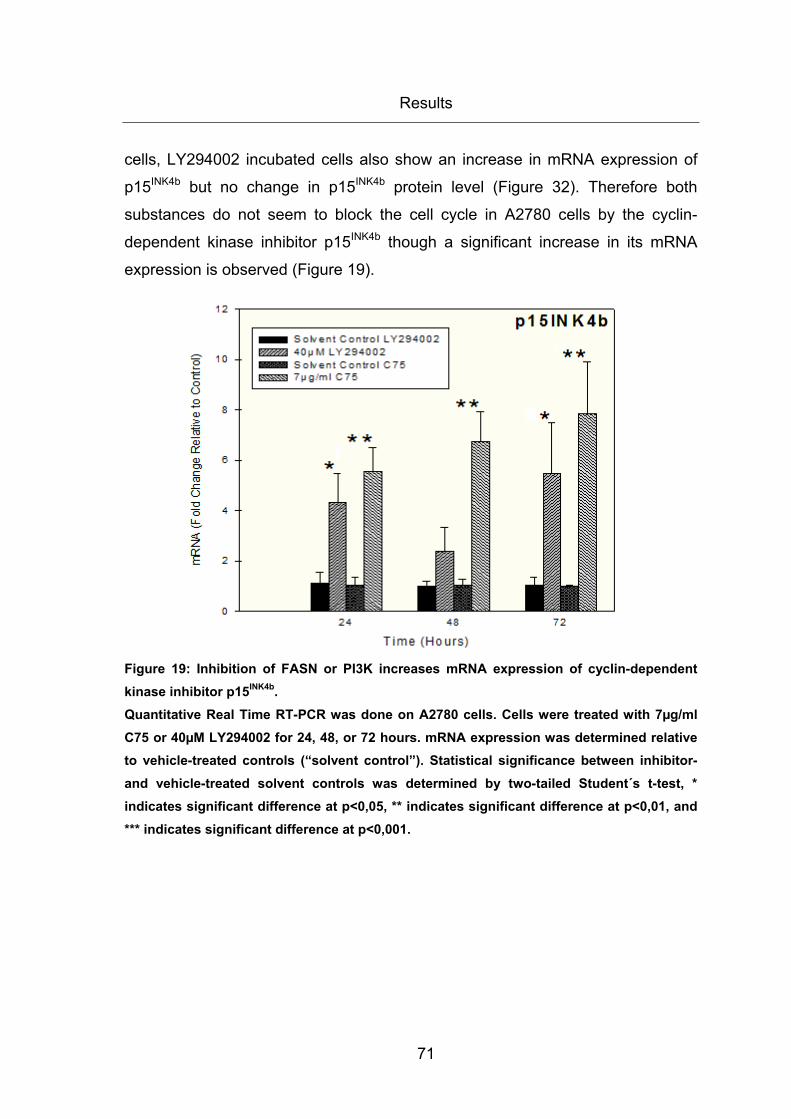
Results
71
cells, LY294002 incubated cells also show an increase in mRNA expression of
p15INK4b but no change in p15INK4b protein level (Figure 32). Therefore both
substances do not seem to block the cell cycle in A2780 cells by the cyclin-
dependent kinase inhibitor p15INK4b though a significant increase in its mRNA
expression is observed (Figure 19).
Figure 19: Inhibition of FASN or PI3K increases mRNA expression of cyclin-dependent kinase inhibitor p15INK4b. Quantitative Real Time RT-PCR was done on A2780 cells. Cells were treated with 7µg/ml C75 or 40µM LY294002 for 24, 48, or 72 hours. mRNA expression was determined relative to vehicle-treated controls (“solvent control”). Statistical significance between inhibitor- and vehicle-treated solvent controls was determined by two-tailed Student´s t-test, * indicates significant difference at p<0,05, ** indicates significant difference at p<0,01, and *** indicates significant difference at p<0,001.
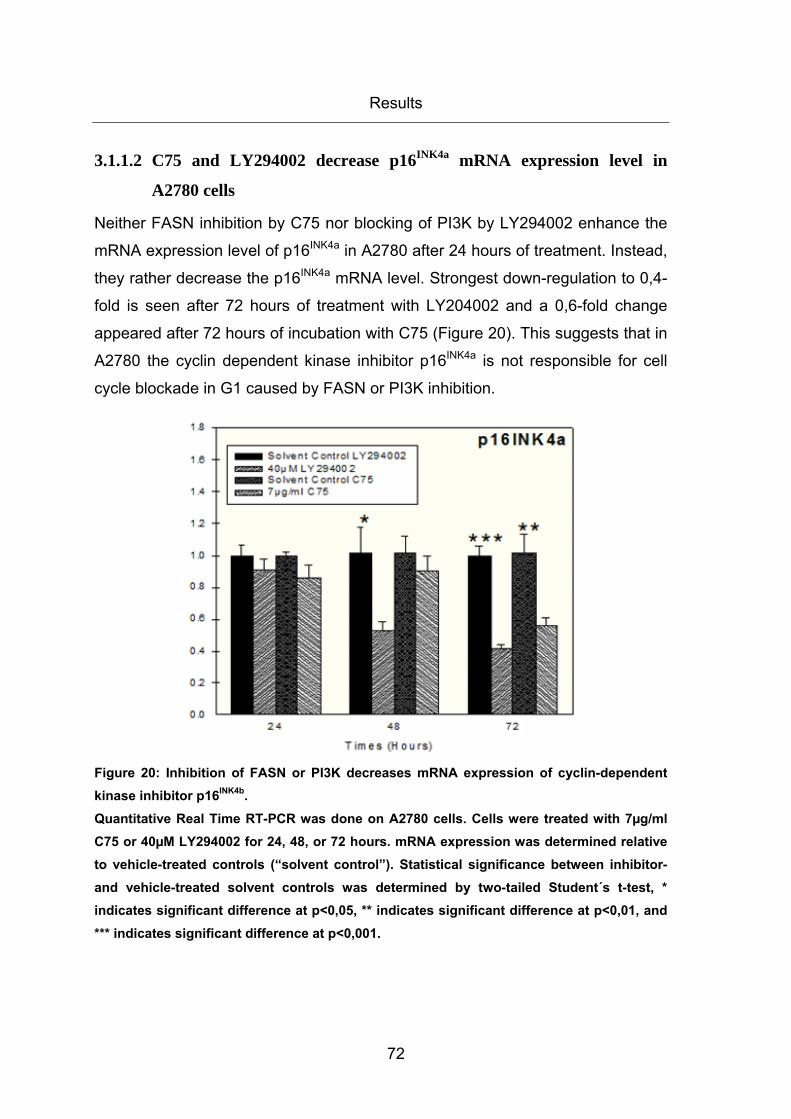
Results
72
3.1.1.2 C75 and LY294002 decrease p16INK4a mRNA expression level in
A2780 cells
Neither FASN inhibition by C75 nor blocking of PI3K by LY294002 enhance the
mRNA expression level of p16INK4a in A2780 after 24 hours of treatment. Instead,
they rather decrease the p16INK4a mRNA level. Strongest down-regulation to 0,4-
fold is seen after 72 hours of treatment with LY204002 and a 0,6-fold change
appeared after 72 hours of incubation with C75 (Figure 20). This suggests that in
A2780 the cyclin dependent kinase inhibitor p16INK4a is not responsible for cell
cycle blockade in G1 caused by FASN or PI3K inhibition.
Figure 20: Inhibition of FASN or PI3K decreases mRNA expression of cyclin-dependent kinase inhibitor p16INK4b. Quantitative Real Time RT-PCR was done on A2780 cells. Cells were treated with 7µg/ml C75 or 40µM LY294002 for 24, 48, or 72 hours. mRNA expression was determined relative to vehicle-treated controls (“solvent control”). Statistical significance between inhibitor- and vehicle-treated solvent controls was determined by two-tailed Student´s t-test, * indicates significant difference at p<0,05, ** indicates significant difference at p<0,01, and *** indicates significant difference at p<0,001.
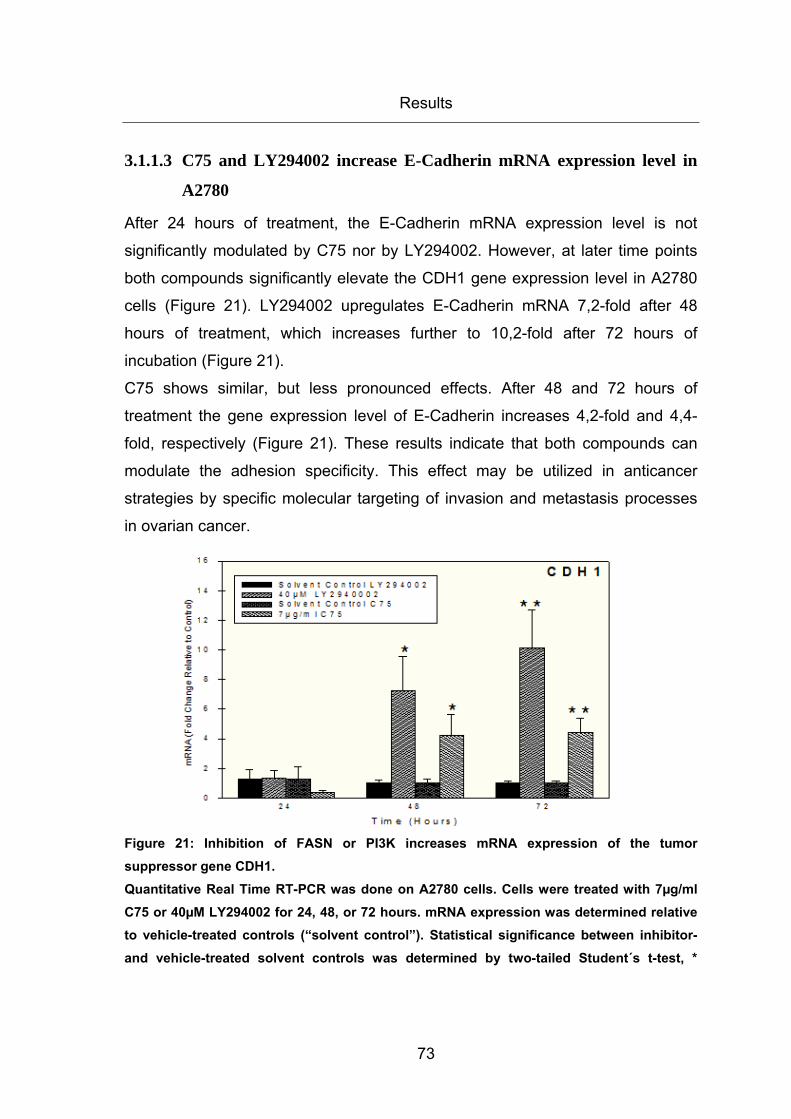
Results
73
3.1.1.3 C75 and LY294002 increase E-Cadherin mRNA expression level in
A2780
After 24 hours of treatment, the E-Cadherin mRNA expression level is not
significantly modulated by C75 nor by LY294002. However, at later time points
both compounds significantly elevate the CDH1 gene expression level in A2780
cells (Figure 21). LY294002 upregulates E-Cadherin mRNA 7,2-fold after 48
hours of treatment, which increases further to 10,2-fold after 72 hours of
incubation (Figure 21).
C75 shows similar, but less pronounced effects. After 48 and 72 hours of
treatment the gene expression level of E-Cadherin increases 4,2-fold and 4,4-
fold, respectively (Figure 21). These results indicate that both compounds can
modulate the adhesion specificity. This effect may be utilized in anticancer
strategies by specific molecular targeting of invasion and metastasis processes
in ovarian cancer.
Figure 21: Inhibition of FASN or PI3K increases mRNA expression of the tumor suppressor gene CDH1. Quantitative Real Time RT-PCR was done on A2780 cells. Cells were treated with 7µg/ml C75 or 40µM LY294002 for 24, 48, or 72 hours. mRNA expression was determined relative to vehicle-treated controls (“solvent control”). Statistical significance between inhibitor- and vehicle-treated solvent controls was determined by two-tailed Student´s t-test, *
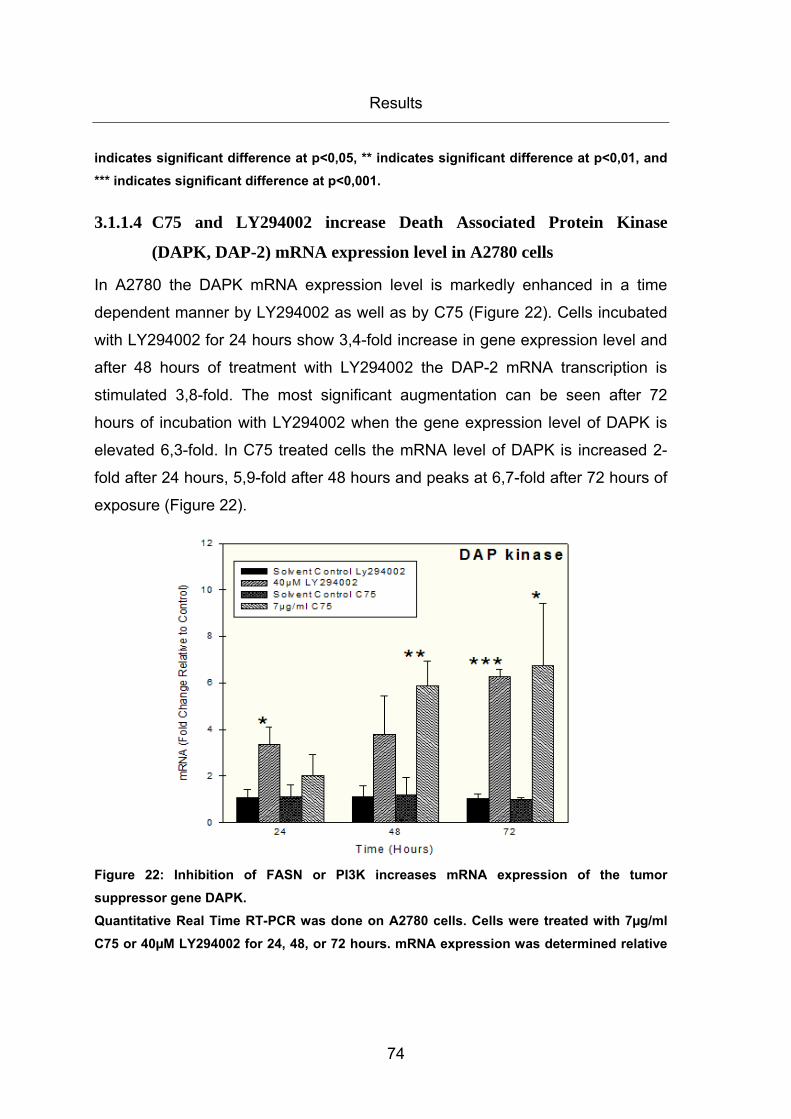
Results
74
indicates significant difference at p<0,05, ** indicates significant difference at p<0,01, and *** indicates significant difference at p<0,001.
3.1.1.4 C75 and LY294002 increase Death Associated Protein Kinase
(DAPK, DAP-2) mRNA expression level in A2780 cells
In A2780 the DAPK mRNA expression level is markedly enhanced in a time
dependent manner by LY294002 as well as by C75 (Figure 22). Cells incubated
with LY294002 for 24 hours show 3,4-fold increase in gene expression level and
after 48 hours of treatment with LY294002 the DAP-2 mRNA transcription is
stimulated 3,8-fold. The most significant augmentation can be seen after 72
hours of incubation with LY294002 when the gene expression level of DAPK is
elevated 6,3-fold. In C75 treated cells the mRNA level of DAPK is increased 2-
fold after 24 hours, 5,9-fold after 48 hours and peaks at 6,7-fold after 72 hours of
exposure (Figure 22).
Figure 22: Inhibition of FASN or PI3K increases mRNA expression of the tumor suppressor gene DAPK. Quantitative Real Time RT-PCR was done on A2780 cells. Cells were treated with 7µg/ml C75 or 40µM LY294002 for 24, 48, or 72 hours. mRNA expression was determined relative
Results
75
to vehicle-treated controls (“solvent control”). Statistical significance between inhibitor- and vehicle-treated solvent controls was determined by two-tailed Student´s t-test, * indicates significant difference at p<0,05, ** indicates significant difference at p<0,01, and *** indicates significant difference at p<0,001.
3.1.2 Changes in mRNA expression level of apoptosis associated genes resulting from FASN-inhibition by C75 or PI3K-inhibition by LY294002 in A2780 cells
3.1.2.1 C75 and LY294002 increase FAS mRNA expression level in A2780
cells
While LY294002 upregulates FAS mRNA in A2780 only moderately to a
maximum of 2,3-fold normalized to LY294002 solvent control after 72 hours of
treatment, C75 significantly enhances FAS mRNA expression in a time
dependent manner up to 97,9-fold after 72 hours of treatment. Even at earlier
time points of C75 treatment the FAS gene expression is strongly augmented,
7,9-fold after 24 hours and 12,5-fold after 48 hours of C75 incubation (Figure 23).
This suggests that FASN blockade stimulates not only stress associated
apoptosis (Knowles et al., 2008) and mitochondrial associated apoptosis (Kawai
et al., 1999), but, in contrast to LY294002, it foremost triggers TNF-α-dependent
apoptosis process.
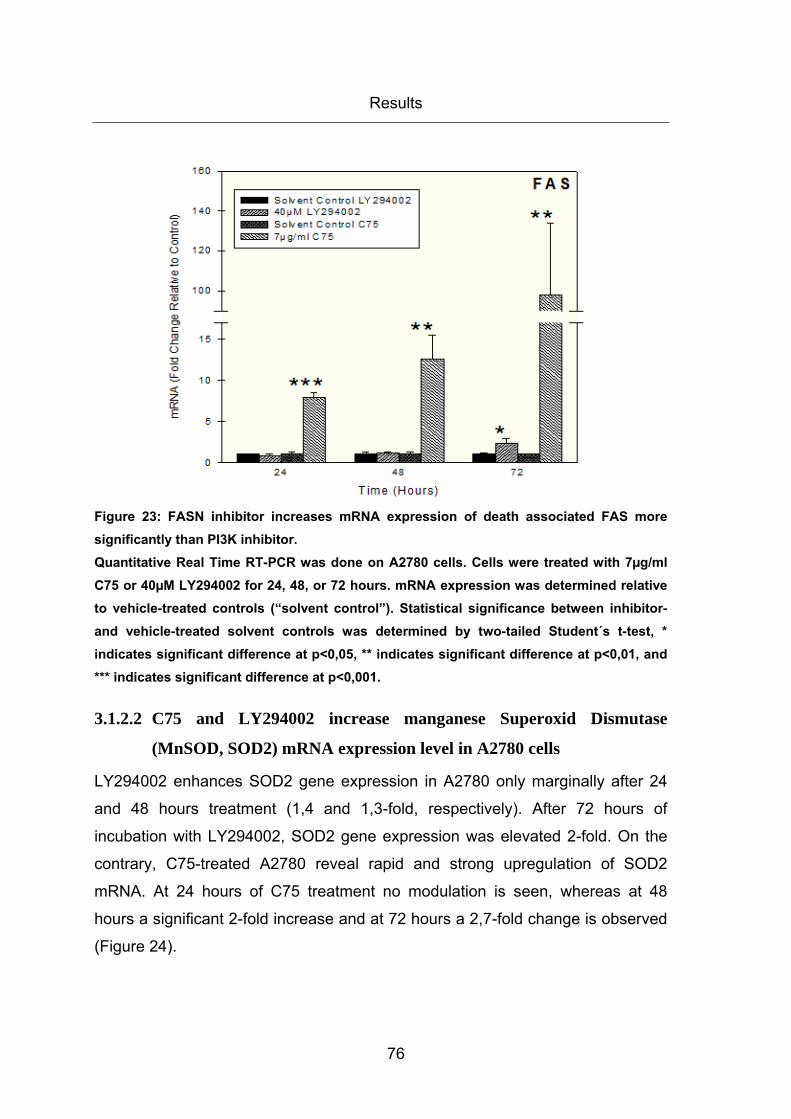
Results
76
Figure 23: FASN inhibitor increases mRNA expression of death associated FAS more significantly than PI3K inhibitor. Quantitative Real Time RT-PCR was done on A2780 cells. Cells were treated with 7µg/ml C75 or 40µM LY294002 for 24, 48, or 72 hours. mRNA expression was determined relative to vehicle-treated controls (“solvent control”). Statistical significance between inhibitor- and vehicle-treated solvent controls was determined by two-tailed Student´s t-test, * indicates significant difference at p<0,05, ** indicates significant difference at p<0,01, and *** indicates significant difference at p<0,001.
3.1.2.2 C75 and LY294002 increase manganese Superoxid Dismutase
(MnSOD, SOD2) mRNA expression level in A2780 cells
LY294002 enhances SOD2 gene expression in A2780 only marginally after 24
and 48 hours treatment (1,4 and 1,3-fold, respectively). After 72 hours of
incubation with LY294002, SOD2 gene expression was elevated 2-fold. On the
contrary, C75-treated A2780 reveal rapid and strong upregulation of SOD2
mRNA. At 24 hours of C75 treatment no modulation is seen, whereas at 48
hours a significant 2-fold increase and at 72 hours a 2,7-fold change is observed
(Figure 24).
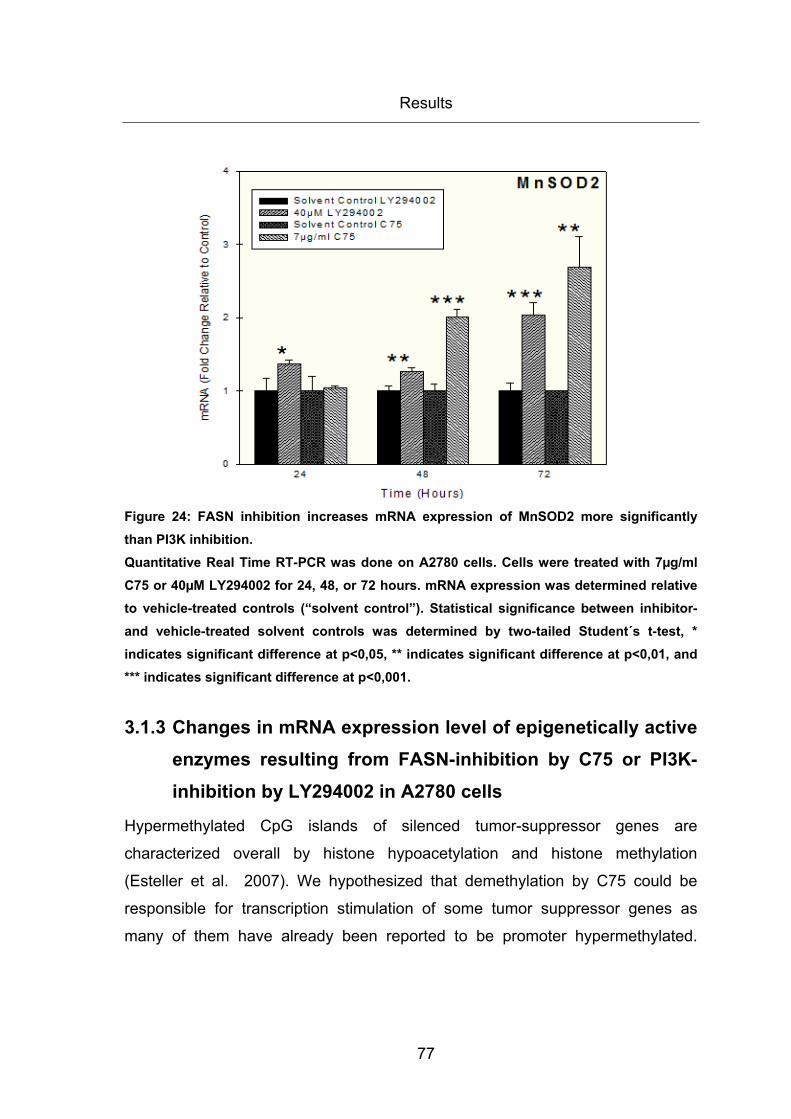
Results
77
Figure 24: FASN inhibition increases mRNA expression of MnSOD2 more significantly than PI3K inhibition. Quantitative Real Time RT-PCR was done on A2780 cells. Cells were treated with 7µg/ml C75 or 40µM LY294002 for 24, 48, or 72 hours. mRNA expression was determined relative to vehicle-treated controls (“solvent control”). Statistical significance between inhibitor- and vehicle-treated solvent controls was determined by two-tailed Student´s t-test, * indicates significant difference at p<0,05, ** indicates significant difference at p<0,01, and *** indicates significant difference at p<0,001.
3.1.3 Changes in mRNA expression level of epigenetically active enzymes resulting from FASN-inhibition by C75 or PI3K-inhibition by LY294002 in A2780 cells
Hypermethylated CpG islands of silenced tumor-suppressor genes are
characterized overall by histone hypoacetylation and histone methylation
(Esteller et al. 2007). We hypothesized that demethylation by C75 could be
responsible for transcription stimulation of some tumor suppressor genes as
many of them have already been reported to be promoter hypermethylated.

Results
78
Aberrant methylation of CpG islands in promoter regions of p15INK4b (Herman et
al., 1996) and p16INK4a (Katsaros et al., 2004) as well as gene methylation of
DAPK (Collins et al., 2006) and CDH1 (Rathi et al., 2002; Makerla et al., 2005)
have been observed. After having demonstrated that FASN inhibition
upregulates the transcript levels of p15, E-Cadherin, DAPK, SOD2 and FAS in
the ovarian carcinoma cell line A2780 we examined the effects of FASN
targeting on the expression of epigenetically active enzymes and found some
inhibitor-dependent regulations of these enzymes arguing for a possible
epigenetic mechanism of action of this FASN blocking drug. Modulation of
epigenetically active enzymes is expected to occur before transcriptional
changes of affected tumor suppressor genes become evident. Therefore,
examination of C75-effects on mRNA expression of epigenetically active
enzymes was focused on earlier time points of C75 treatment.
3.1.3.1 C75 and LY294002 decrease DNA-methyltransferase 1 (DNMT1)
mRNA expression level after 24 hours of treatment
At 24 hours, C75 inhibits DNMT1 mRNA expression 0,4-fold, whereas LY294002
exerts a weaker effect repressing DNMT1 mRNA 0,7-fold relative to solvent
control. At later time points, C75 fails to down-regulate DNMT1, whereas
LY294002 even enhances DNMT1 mRNA (Figure 25). Although DNMT1 is
known as a basic DNMT it has been reported to be also involved in de novo
methylation (Esteller et al., 2007). Our data thus indicate that FASN inhibition by
C75 reduces transcription of this potent methylating enzyme hours before mRNA
expression of some of the potentially hypermethylated tumor suppressor genes
such as E-Cadherin and DAPK is increased.
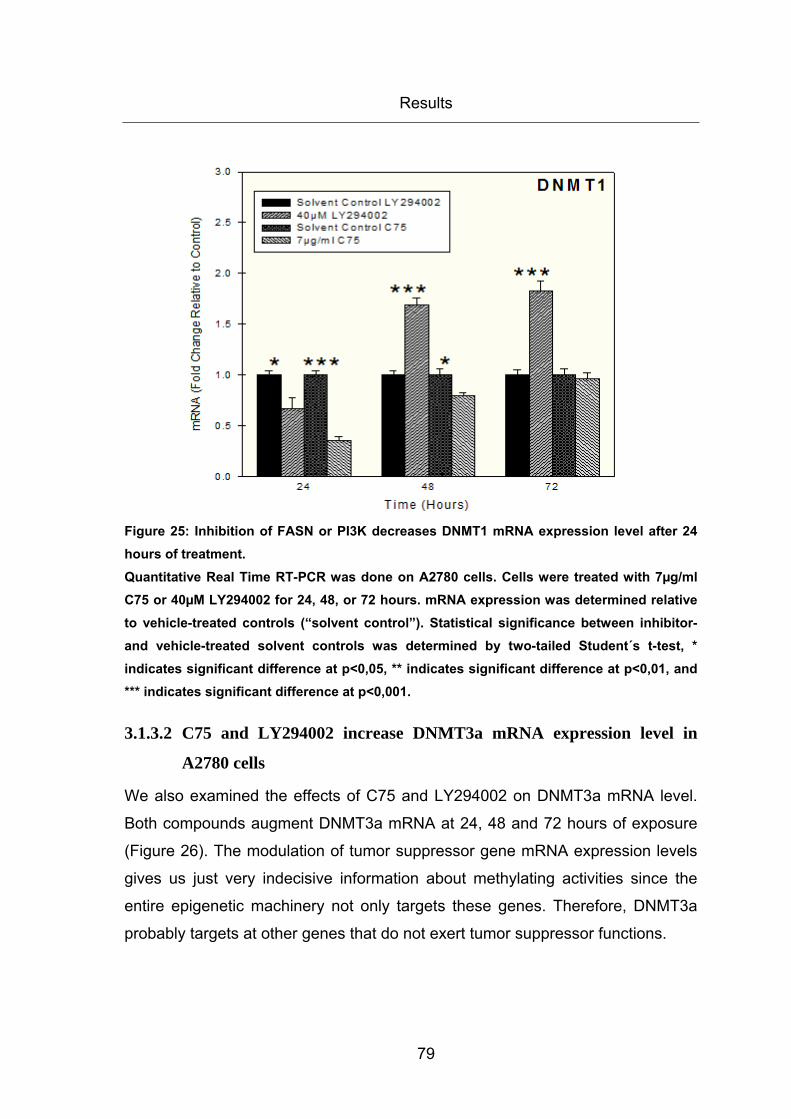
Results
79
Figure 25: Inhibition of FASN or PI3K decreases DNMT1 mRNA expression level after 24 hours of treatment. Quantitative Real Time RT-PCR was done on A2780 cells. Cells were treated with 7µg/ml C75 or 40µM LY294002 for 24, 48, or 72 hours. mRNA expression was determined relative to vehicle-treated controls (“solvent control”). Statistical significance between inhibitor- and vehicle-treated solvent controls was determined by two-tailed Student´s t-test, * indicates significant difference at p<0,05, ** indicates significant difference at p<0,01, and *** indicates significant difference at p<0,001.
3.1.3.2 C75 and LY294002 increase DNMT3a mRNA expression level in
A2780 cells
We also examined the effects of C75 and LY294002 on DNMT3a mRNA level.
Both compounds augment DNMT3a mRNA at 24, 48 and 72 hours of exposure
(Figure 26). The modulation of tumor suppressor gene mRNA expression levels
gives us just very indecisive information about methylating activities since the
entire epigenetic machinery not only targets these genes. Therefore, DNMT3a
probably targets at other genes that do not exert tumor suppressor functions.
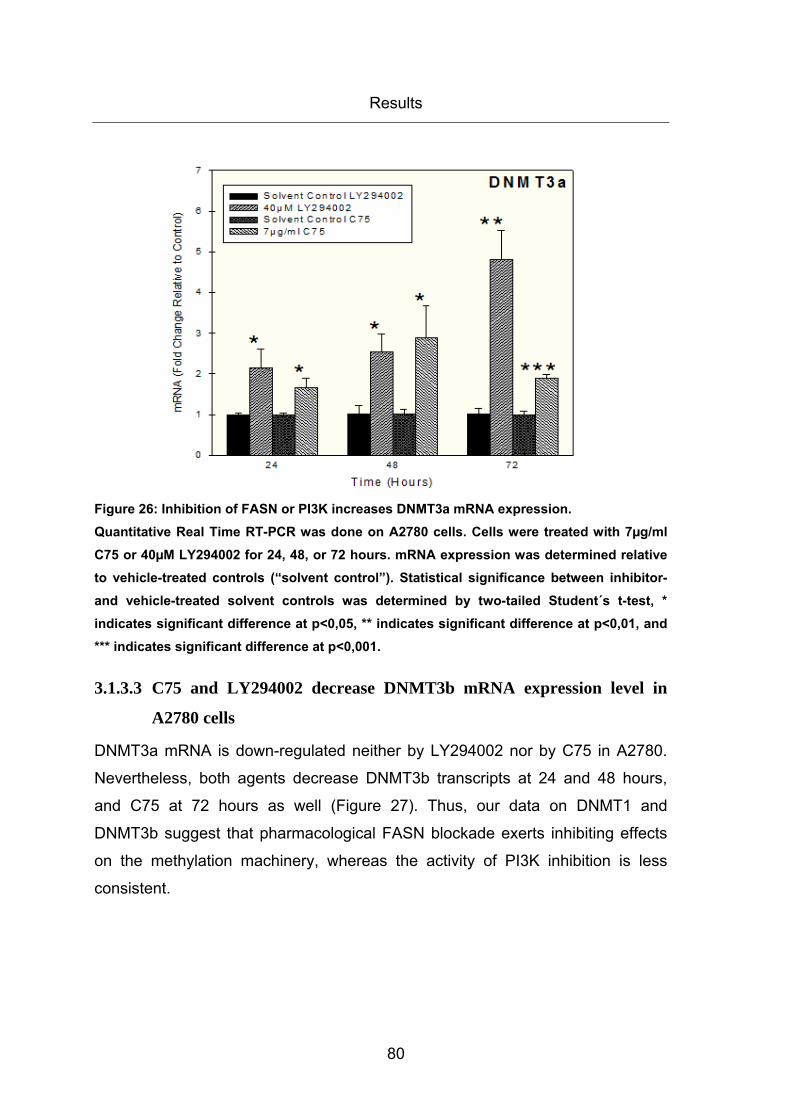
Results
80
Figure 26: Inhibition of FASN or PI3K increases DNMT3a mRNA expression. Quantitative Real Time RT-PCR was done on A2780 cells. Cells were treated with 7µg/ml C75 or 40µM LY294002 for 24, 48, or 72 hours. mRNA expression was determined relative to vehicle-treated controls (“solvent control”). Statistical significance between inhibitor- and vehicle-treated solvent controls was determined by two-tailed Student´s t-test, * indicates significant difference at p<0,05, ** indicates significant difference at p<0,01, and *** indicates significant difference at p<0,001.
3.1.3.3 C75 and LY294002 decrease DNMT3b mRNA expression level in
A2780 cells
DNMT3a mRNA is down-regulated neither by LY294002 nor by C75 in A2780.
Nevertheless, both agents decrease DNMT3b transcripts at 24 and 48 hours,
and C75 at 72 hours as well (Figure 27). Thus, our data on DNMT1 and
DNMT3b suggest that pharmacological FASN blockade exerts inhibiting effects
on the methylation machinery, whereas the activity of PI3K inhibition is less
consistent.
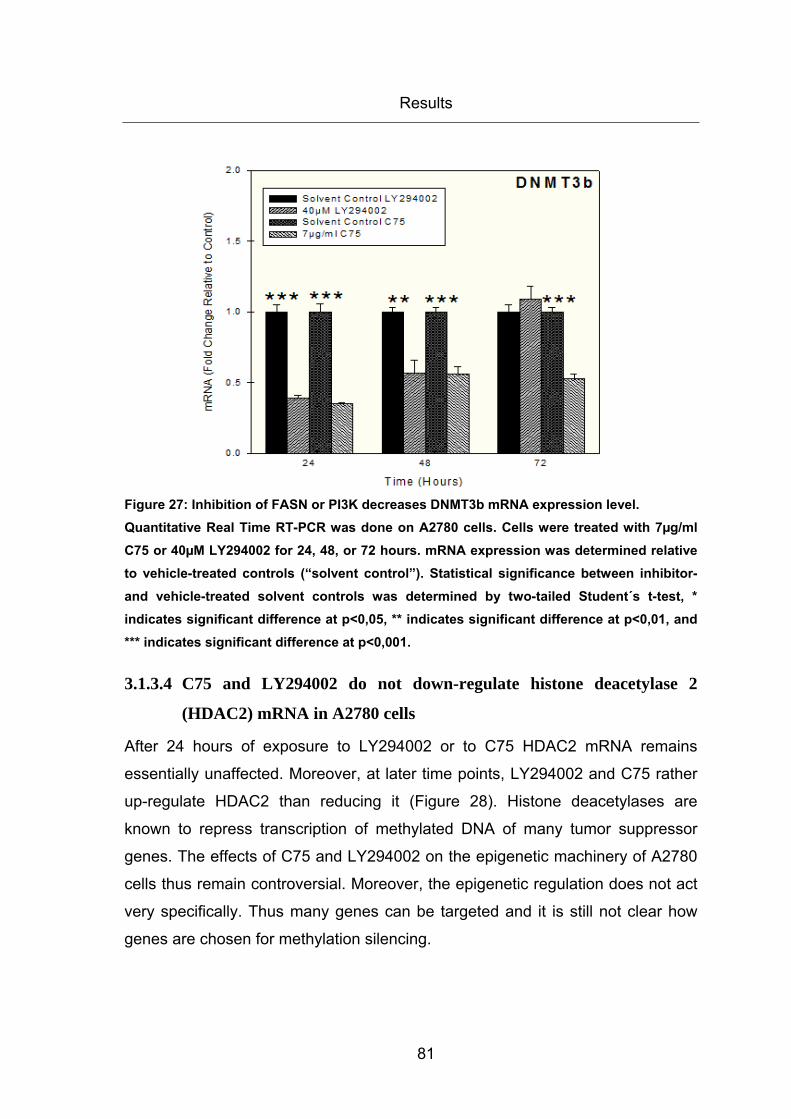
Results
81
Figure 27: Inhibition of FASN or PI3K decreases DNMT3b mRNA expression level. Quantitative Real Time RT-PCR was done on A2780 cells. Cells were treated with 7µg/ml C75 or 40µM LY294002 for 24, 48, or 72 hours. mRNA expression was determined relative to vehicle-treated controls (“solvent control”). Statistical significance between inhibitor- and vehicle-treated solvent controls was determined by two-tailed Student´s t-test, * indicates significant difference at p<0,05, ** indicates significant difference at p<0,01, and *** indicates significant difference at p<0,001.
3.1.3.4 C75 and LY294002 do not down-regulate histone deacetylase 2
(HDAC2) mRNA in A2780 cells
After 24 hours of exposure to LY294002 or to C75 HDAC2 mRNA remains
essentially unaffected. Moreover, at later time points, LY294002 and C75 rather
up-regulate HDAC2 than reducing it (Figure 28). Histone deacetylases are
known to repress transcription of methylated DNA of many tumor suppressor
genes. The effects of C75 and LY294002 on the epigenetic machinery of A2780
cells thus remain controversial. Moreover, the epigenetic regulation does not act
very specifically. Thus many genes can be targeted and it is still not clear how
genes are chosen for methylation silencing.
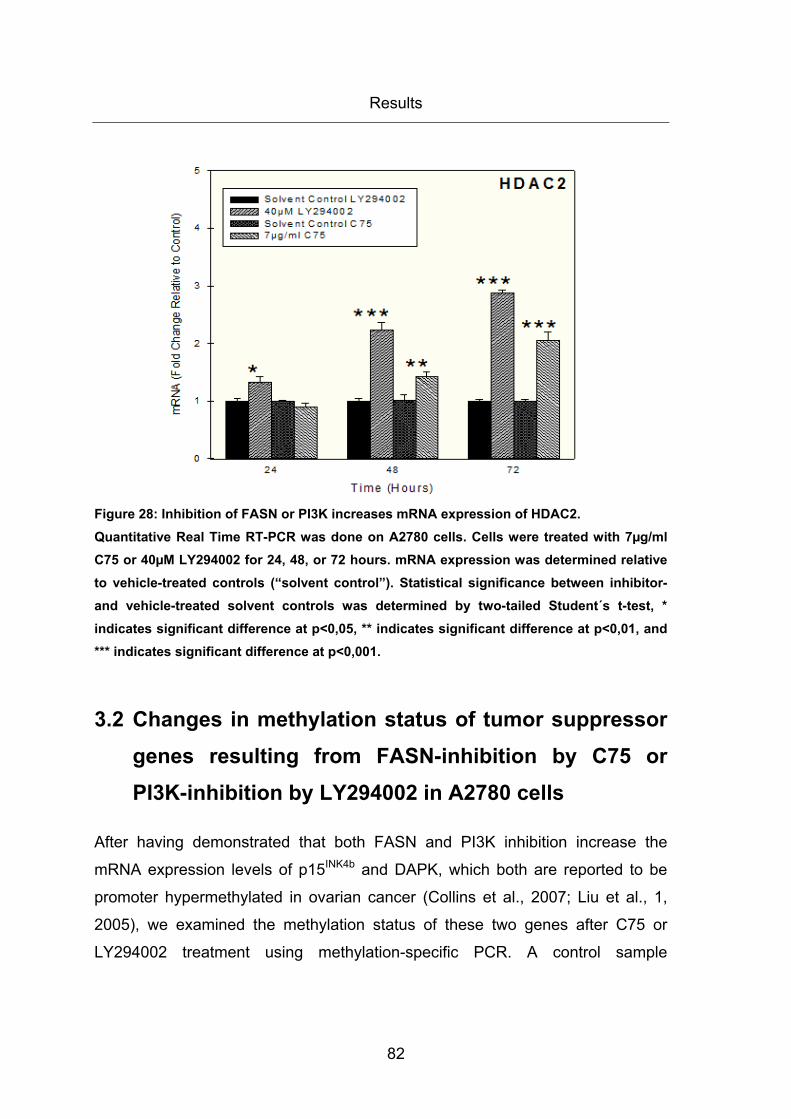
Results
82
Figure 28: Inhibition of FASN or PI3K increases mRNA expression of HDAC2. Quantitative Real Time RT-PCR was done on A2780 cells. Cells were treated with 7µg/ml C75 or 40µM LY294002 for 24, 48, or 72 hours. mRNA expression was determined relative to vehicle-treated controls (“solvent control”). Statistical significance between inhibitor- and vehicle-treated solvent controls was determined by two-tailed Student´s t-test, * indicates significant difference at p<0,05, ** indicates significant difference at p<0,01, and *** indicates significant difference at p<0,001.
3.2 Changes in methylation status of tumor suppressor genes resulting from FASN-inhibition by C75 or PI3K-inhibition by LY294002 in A2780 cells
After having demonstrated that both FASN and PI3K inhibition increase the
mRNA expression levels of p15INK4b and DAPK, which both are reported to be
promoter hypermethylated in ovarian cancer (Collins et al., 2007; Liu et al., 1,
2005), we examined the methylation status of these two genes after C75 or
LY294002 treatment using methylation-specific PCR. A control sample
Results
83
containing semi-methylated genomic DNA from healthy tissue was also included
in the analyses.
3.2.1 The promoter of the p15INK4b tumor suppressor gene is not hypermethylated in A2780 cells
The genomic DNA control which should not exhibit hypermethylation in any
tumor suppressor gene reveals higher methylation of p15INK4b than treated or
untreated A2780 at any time point. This indicates that the ovarian carcinoma cell
line A2780 does not feature a hypermethylation status in the promoter region of
p15INK4b (Figure 29). After having demonstrated that there is no hypermethylation
of the p15INK4b gene promoter region in A2780, no further demethylation can
obviously be achieved with C75 or with LY294002 (Figure 29).
Although a hypermethylated phenotype in ovarian cancer has often been
reported (Collins et al., 2007; Liu et al., 1, 2005) we could not show this
methylation status for the promoter of p15INK4b in the A2780 cell line. This
indicates that upregulation of p15INK4b mRNA expression must occur via
mechanisms that are not related to gene promoter demethylation.
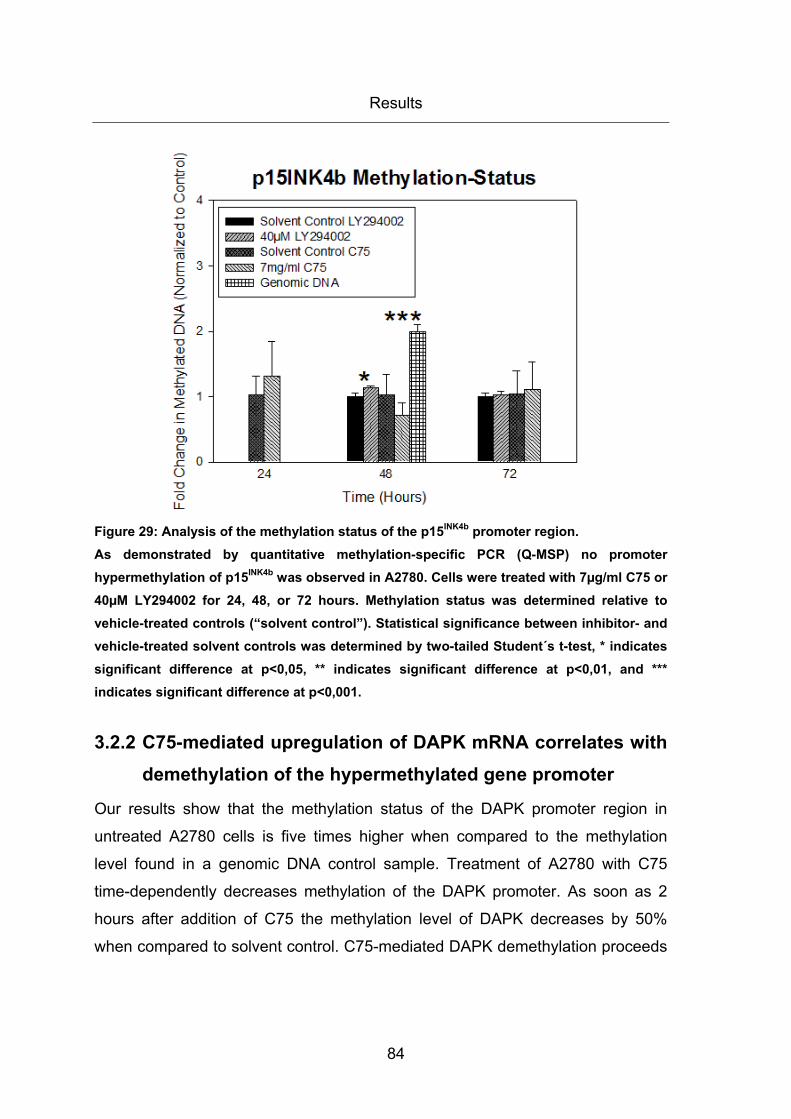
Results
84
Figure 29: Analysis of the methylation status of the p15INK4b promoter region. As demonstrated by quantitative methylation-specific PCR (Q-MSP) no promoter hypermethylation of p15INK4b was observed in A2780. Cells were treated with 7µg/ml C75 or 40µM LY294002 for 24, 48, or 72 hours. Methylation status was determined relative to vehicle-treated controls (“solvent control”). Statistical significance between inhibitor- and vehicle-treated solvent controls was determined by two-tailed Student´s t-test, * indicates significant difference at p<0,05, ** indicates significant difference at p<0,01, and *** indicates significant difference at p<0,001.
3.2.2 C75-mediated upregulation of DAPK mRNA correlates with demethylation of the hypermethylated gene promoter
Our results show that the methylation status of the DAPK promoter region in
untreated A2780 cells is five times higher when compared to the methylation
level found in a genomic DNA control sample. Treatment of A2780 with C75
time-dependently decreases methylation of the DAPK promoter. As soon as 2
hours after addition of C75 the methylation level of DAPK decreases by 50%
when compared to solvent control. C75-mediated DAPK demethylation proceeds
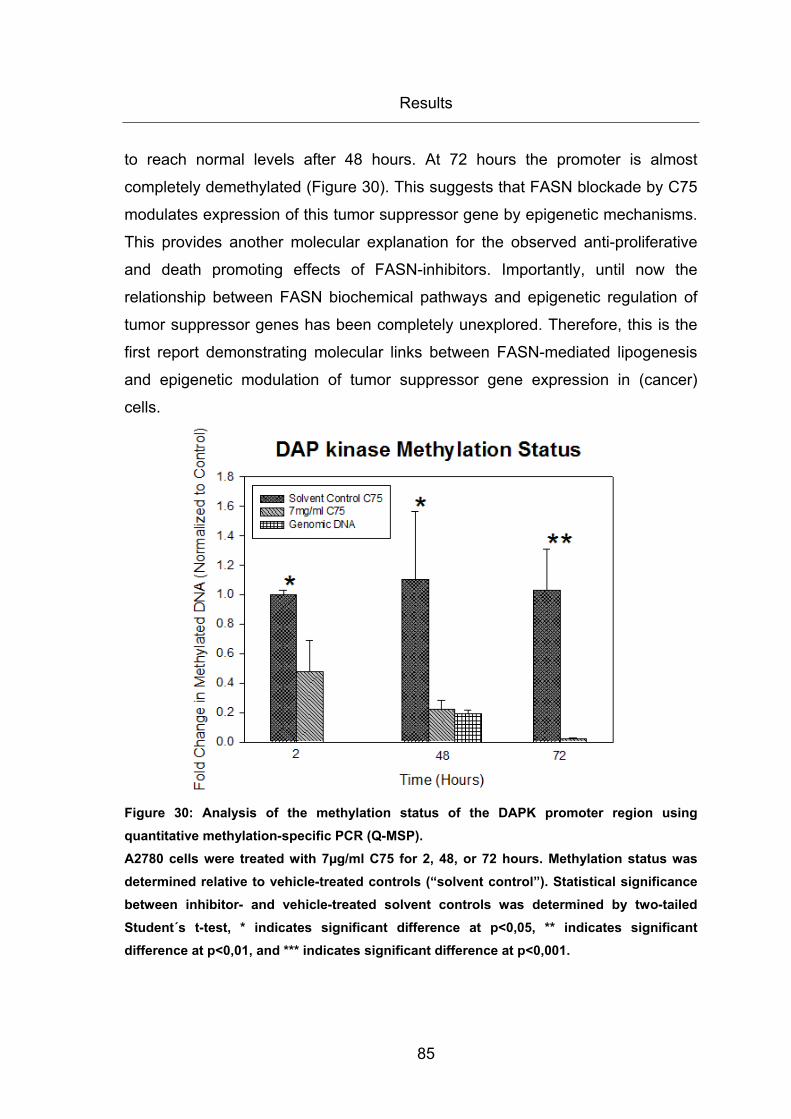
Results
85
to reach normal levels after 48 hours. At 72 hours the promoter is almost
completely demethylated (Figure 30). This suggests that FASN blockade by C75
modulates expression of this tumor suppressor gene by epigenetic mechanisms.
This provides another molecular explanation for the observed anti-proliferative
and death promoting effects of FASN-inhibitors. Importantly, until now the
relationship between FASN biochemical pathways and epigenetic regulation of
tumor suppressor genes has been completely unexplored. Therefore, this is the
first report demonstrating molecular links between FASN-mediated lipogenesis
and epigenetic modulation of tumor suppressor gene expression in (cancer)
cells.
Figure 30: Analysis of the methylation status of the DAPK promoter region using quantitative methylation-specific PCR (Q-MSP). A2780 cells were treated with 7µg/ml C75 for 2, 48, or 72 hours. Methylation status was determined relative to vehicle-treated controls (“solvent control”). Statistical significance between inhibitor- and vehicle-treated solvent controls was determined by two-tailed Student´s t-test, * indicates significant difference at p<0,05, ** indicates significant difference at p<0,01, and *** indicates significant difference at p<0,001.
Results
86
3.3 The FASN targeting drug C75 affects protein expression and activity (phosphorylation) of PI3K/AKT effector molecules
The expression of cyclin-dependent kinase inhibitors (CDKIs) is reported to be
regulated at least in part by the PI3K/AKT signaling pathway (Gao et al., 2004;
Katayama et al., 2008). After having demonstrated that FASN inhibition
increases mRNA expression of the CDKI p15INK4b in A2780 without inducing
demethylation of the corresponding promoter we therefore examined the effects
of C75 on the protein expression and activation (phosphorylation) of PI3K/AKT
signaling molecules. Modulation of the PI3K/AKT pathway by FASN inhibition in
ovarian carcinoma cell lines has already been observed (Grunt et al., 2009;
Wang et al., 2005) and the PI3K activity is known to be required for ovarian
cancer cell proliferation and G1 cell cycle progression (Gao et al., 2004;
Katayama et al., 2008). Thus, we treated A2780 with the FASN inhibitor C75
followed by immunoblot analysis of AKT, phospho-AKT, mTOR, phospho-mTOR,
p70S6K, phospho-p70S6K, 4eBP1, phospho-4eBP1, ERK1/2 and phospho-
ERK1/2 to examine the molecular interaction between FASN, PI3K/AKT
signaling, and the CDKI p15INK4b.
3.3.1 Reduction of protein expression and phosphorylation of PI3K/AKT signaling molecules by the FASN inhibitor C75
At first, we examined the p15 protein level in A2780 after treatment with C75.
Unexpectedly, we were unable to detect an increase of p15 protein level, which
would correspond to our mRNA expression data, rather we obtained a slight
decrease of p15INK4b upon C75 exposure indicating that p15INK4b is (post-)
translationally modulated by C75 (Figure 31A). Either p15INK4b mRNA translation
is affected or p15INK4b protein is post-translationally destabilized. Importantly, this
data, which is conflicting with our observation that C75 stimulates p15INK4b mRNA

Results
87
expression, indicates that this CDKI is not responsible for the G1 arrest caused
by FASN blockade (Knowles et al., 2004).
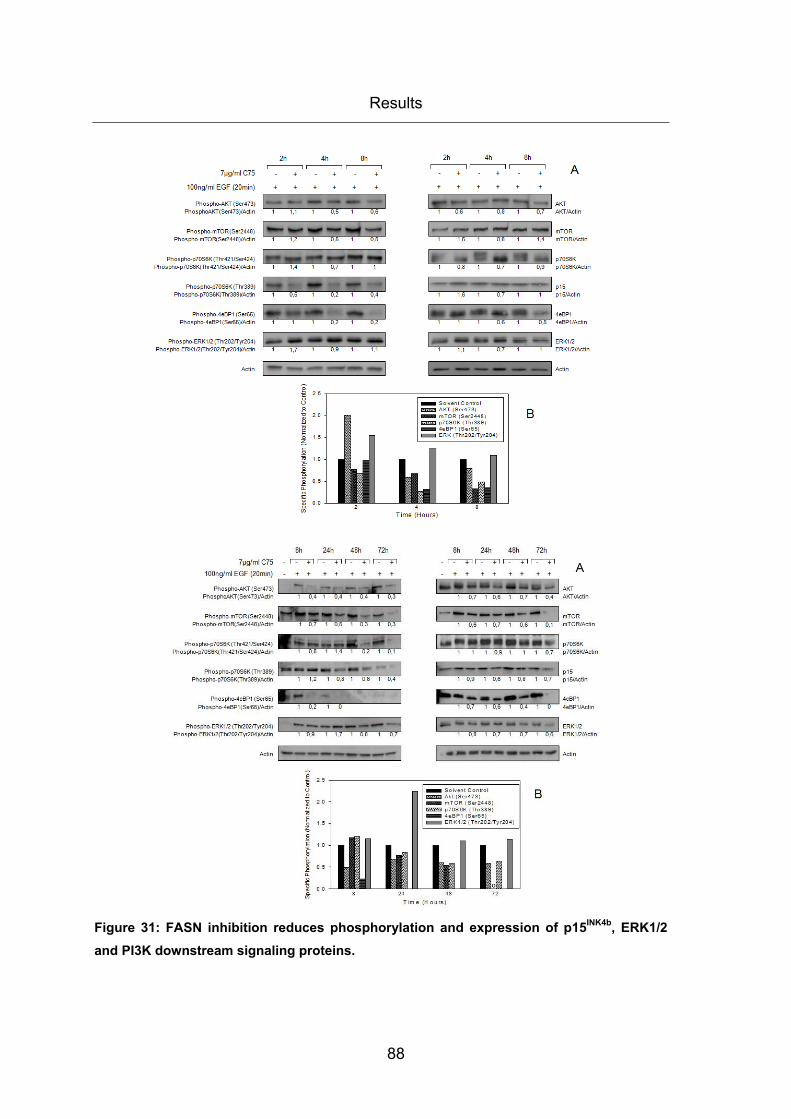
Results
88
Figure 31: FASN inhibition reduces phosphorylation and expression of p15INK4b, ERK1/2 and PI3K downstream signaling proteins.
Results
89
A, A2780 cells were treated with vehicle (0,0389% DMSO) or C75 (7µg/ml) for the indicated times. Except from one untreated sample in Figure 31, all cells were stimulated for 20 minutes with 100ng/ml EGF. Cell lysates were collected as described in Materials and Methods for immunoblot analysis with specific antibodies for AKT, phospho-AKT (Ser473), mTOR, phospho-mTOR(Ser2448), p70S6K, phospho-p70S6K (Thr389 or Thr421/Ser424), p15INK4b, 4eBP1, phospho-4eBP1 (Ser65), ERK1/2, phospho-ERK1/2 (Thr202/Tyr204), and ß-actin. Experiments were quantified using Herolab Software by measuring the optical density of the band specific for the respective protein of interest relative to that of ß-actin. Values of treated samples were then related to those of solvent control samples. B, specific phosphorylation level of each protein was quantified using the Herolab Software by relating the phospho-protein/ß-actin ratio to the corresponding protein/ß-actin ratio. The resulting value for the solvent control was arbitrarily set at 1 for each time point and the value for the corresponding C75-treated cells was related to it. Due to bad quality of the blot it was not possible to calculate the 72 hours time point for specific phosphorylation of mTOR.
Nevertheless, C75 downregulates expression and phosphorylation of signal
effector proteins of the PI3K/AKT pathway such as AKT, mTOR, p70S6K and
4eBP1 in A2780 cells (Figure 31A, B). Interestingly, C75 pre-treatment inhibits
AKT, mTOR, p70S6K and 4eBP1 phosphorylation elicited by EGF (100ng/ml)
and simultaneously decreases the corresponding protein levels. In contrast,
phospho-ERK1/2 levels slightly increase upon C75 treatment (Figure 31B), even
though total ERK1/2 protein expression slightly declines at later time points of
exposure (Figure 31A). Enhancement of ERK1/2 phosphorylation is also
observed in LY294002 treated A2780 (Figure 32B). Unlike FASN inhibition by
C75, the PI3K inhibitor LY294002 does not markedly lower the expression levels
of several PI3K/AKT signaling proteins (Figure 31A, Figure 32A). Nevertheless,
both drugs efficiently lower phosphorylation of the proteins (Figure 31B, Figure
32B). This data indicate that C75-mediated blockade of FASN reduces the
activity of the PI3K cascade even though C75 is not that effective in inhibiting
protein phosphorylation as compared to the specific PI3K inhibitor LY294002. In
contrast, our results demonstrate that inactivation of AKT signaling by LY294002

Results
90
or C75 concurrently slightly activates ERK1/2 in A2780. Moreover, C75 seems to
decrease the total protein level of all signal proteins analyzed, whereas
LY294002 does not down-regulate or even elevates signal protein expression
(Figure 32A).
Results
91
Figure 32: PI3K inhibition by LY294002 is more effective in blocking the PI3K pathway than FASN inhibition.
Results
92
A, A2780 cells were treated with vehicle (0,1% DMSO) or LY294002 (40µM) for the indicated times. Except from one untreated sample in Figure 32, all cells were stimulated for 20 minutes with 100ng/ml EGF. Cell lysates were collected as described in Materials and Methods for immunoblot analysis with specific antibodies for AKT, phospho-AKT (Ser473), mTOR, phospho-mTOR(Ser2448), p70S6K, phospho-p70S6K (Thr389 or Thr421/Ser424), p15INK4b, 4eBP1, phospho-4eBP1 (Ser65), ERK1/2, phospho-ERK1/2 (Thr202/Tyr204), and ß-actin. Experiments were quantified using Herolab Software by measuring the optical density of the band specific for the respective protein of interest relative to that of ß-actin. Values of treated samples were then related to those of solvent control samples. B, specific phosphorylation level of each protein was quantified using the Herolab Software by relating the phospho-protein/ß-actin ratio to the corresponding protein/ß-actin ratio. The resulting value for the solvent control was arbitrarily set at 1 for each time point and the value for the corresponding C75-treated cells was related to it.
3.3.2 Reduction of protein expression levels caused by FASN inhibition appears not to be due to translation inhibition by dephosphorylated 4eBP1
C75-mediated blockade of 4eBP1 phosphorylation (Figure 31B) results in
enhanced binding of 4eBP1 to elF4E thus preventing eIF4E from binding to
eIF4F complex and supporting protein translation. This might explain our
observation that the steady-state levels of all signaling proteins were reduced by
C75 in A2780 cells.
In contrast to many of the PI3K downstream proteins analyzed in this study, the
protein level of ß-actin which is transcribed from a “strong” mRNA and is
therefore known to be insensitive to alterations of eIF4E availability (Graff et al.,
2008), did not decrease. However, AKT and p70S6K decreased before the
blocking activity through dephosphorylated 4eBP1 has been established (Figure
31, earlier time points). Therefore, downregulation of signaling proteins can only
partially be explained by 4eBP1 bindings of eIF4E. Moreover, if C75-mediated
blockade of 4eBP1 phosphoylation would be responsible for a translational
blockade of the analyzed proteins, the LY294002-induced complete inhibition of
Results
93
4eBP1 phosphorylation would have led to the disappearance or at least to a
marked decrease of these proteins as well. However, this is not the case (Figure
32). Therefore, we can exclude that C75-mediated prevention of 4eBP1
phosphorylation and thus the consequent decreased eIF4F complex formation
and protein translation is the cause for protein level reduction of AKT, mTOR,
p70S6K, 4eBP1, p15INK4b and ERK1/2 in A2780.
3.3.3 Reduction of protein expression caused by FASN inhibition appears to be due to enhanced protein degradation
To further elucidate the possible mechanism of C75-dependent reduction of
signal protein expression we performed western blot analyzes on samples that
have been pretreated with cycloheximide (15µg/ml), a potent translation inhibitor,
and C75 (7µg/ml) seperately or in combination. The half-life (IT50) of each
PI3K/AKT signaling protein analyzed was reduced significantly by C75 (Figure
33) indicating that FASN inhibition by C75 causes enhanced protein degradation.
Cycloheximide single treatment (15µg/ml) downregulates AKT protein level in
A2780 with an IT50 of 48 hours. This time indicates the normal degradation time
of 50% of this protein without being newly synthesized. Co-exposure of the cells
to cyclohehimide and C75 decreased the IT50 for AKT protein to 19 hours
(Figure 33, B). Similar effects were seen for all analyzed proteins of the
PI3K/AKT cascade (Figure 33). However, the greatest C75-mediated
degradation effect was seen for p15. With cycloheximide alone the IT50 of
p15INK4b was 57 hours. This value was shortened by coexposure to C75 as low
as 18 hours. Our data thus suggest that C75 elevates p15INK4b protein
degradation, whereas it concurrently stimulates p15INK4b mRNA expression.
Results
94
Figure 33: FASN inhibition enhances protein degradation. A, A2780 cells were treated with vehicle, C75 (7µg/ml), cycloheximide (15µg/ml), or with C75 combined with cycloheximide for the indicated times. Except from one untreated
Results
95
sample, all cells were stimulated for 20 minutes with 100ng/ml. Cell lysates were collected as described in Materials and Methods for immunoblot analysis with antibodies specific for AKT, mTOR, p70S6K, p15INK4b, 4eBP1, ERK1/2, ß-actin and α/ß-tubulin. B, Experiments were quantified by relating the optical density of the band of the protein of interest to that of ß-actin. For each time point the resulting ratios of the sample treated with cycloheximide and C75 seperately or in combination were related to the vehicle control, which was arbitrarily set at 1.
3.3.4 Reduction of protein expression caused by FASN inhibition appears to be due to enhanced proteasomal protein degradation
After having demonstrated that FASN inhibition by C75 augments protein
degradation of AKT, mTOR, p70S6K, 4eBP1, p15INK4b and ERK1/2, we then
asked whether this might correlate with altered function of the proteasome.
Therefore, A2780 cells were treated with 7µg/ml C75 for the indicated periods of
time followed by immunoblot analysis of ubiquitin-modified proteins. As
expected, FASN inhibition induced accumulation of ubiquitinated proteins (Figure
34A, C). In contrast, inhibition of PI3K rather decreased protein ubiquitination
than increasing it (Figure 34B, C). This correlates with slightly enhanced protein
levels of several PI3K signaling proteins as demonstrated in Figure 32A. Most
importantly, the time-courses of C75-induced protein ubiquitination and C75-
mediated reduction of signal protein and p15INK4b protein expression closely
conform to each other (Figure 31, Figure 34, C) supporting the hypothesis that
FASN activity is involved in the functionality of the proteasomal pathway via a
molecular crosstalk between FASN and proteasome pathways.
Results
96
Figure 34: Fatty acid synthase and proteasome pathways crosstalk with each other. A, A2780 cells were treated with C75 (7µg/ml) or B, LY294002 (40µM) in the presence of DMSO (0,0389% final concentration in C75-treated cells and 0,1% final concentration in LY294002 treated cells) or with the adequate solvent control for 8, 24, 48, 72 hours. Except from one untreated sample, all cells were stimulated for 20 minutes with 100ng/ml EGF. Cell lysates were collected as described in Materials and Methods for immunoblot analysis with antibodies specific for ubiquitin and ß-actin. C, Experiments were quantified by using Herolab Software measuring the optical density of each lane relative to the of ß-actin band. Values of treated samples were then related to those of solvent control samples, which have been arbitrarily set at 1 for each individual time point.
3.4 Changes in gene expression resulting from inhibition of FASN
For gene analysis we used an mRNA array of A2780 FASN-overexpressing
ovarian cancer cells. Cells were incubated with 7µg/ml C75 or solvent (0,0389%
DMSO) for 48 hours before total mRNA was isolated. The mRNA gene
expression array was executed and analyzed by “Kompetenzzentrum für
Fluoreszente Bioanalytik in Heidelberg” based on standardized and evaluated
procedures. Genes, which have been modified by C75 at least more than 1,3-
fold or less than 0,7-fold related to the solvent control are designated as up- or
Results
97
downregulated, respectively. Only a short abstract of array-data are shown in
Table 22.
Inhibition of FASN affected genes that regulate a variety of biological processes
including cell proliferation, transcription, apoptosis and degradation are
presented. We found, that blockade of FASN enhanced the expression of
several anti-proliferative genes such as CDKN1A (p21) and TP53 (p53) (Table
22) or inhibited proliferation-promoting genes coding for various cyclins (CCNA2,
CCNB1, CCND2, CCND1, CCNF) (Table 22) and cyclin-dependent kinases
(CDK2, CDK10) (Table 22). This coincided with upregulation of several
apoptosis-enhancing genes such as FAS, some caspase-encoding genes
(CASP4, CASP8), DAPK1, BAX, the cell surface apoptosis genes ANXA1 and
ANXA4 and the death receptors TNFRSF10B (TNF-related apoptosis-inducing
ligand (TRAIL) receptor) and TNFRSF10D (Table 22). Moreover, our results
demonstrate that the inhibition of FASN enhances CPT1, a key enzyme in fatty
acid ß-oxidation whose increased expression implicates accumulation of pro-
apoptotic signaling molecule ceramide (Table 22). However, compared to our
Real Time PCR data the increased expression of CDH1 and CDKN2B could not
be confirmed by this array (Figure 19, Figure 21, Table 22). In three independent
biological experiments with C75 treated A2780 cells we showed a significant 5,9-
fold increase of mRNA expression of DAP kinase by Real Time PCR whereas
this array only showed an impaired effect of C75 on DAP kinase gene
expression of 1,4-fold augmentation after 48 hours of treatment (Figure 22, Table
22). Correspondingly, stimulation of SOD2 could not be shown that strongly by
the mRNA array analysis (1,2-fold) than by Real Time PCR (2,0-fold) after 48
hours of C75 treatment (Figure 24, Table 22). Strong enhancement in gene
expression of apoptosis-associated FAS was achieved by FASN inhibition in
both gene expression assays (Figure 23, Table 22).
Another effect of FASN inhibition is the regulation of enzymes involved in protein
ubiquitination. We found that 48 hours incubation with C75 altered not only the
expression of several E2 ubiquitin conjugating enzymes (UBE2Q1, UBE2D1) but
Results
98
also the expression of the cysteine protease ATG4A, whose activity is induced
by reactive oxygen species (ROS; especially via H2O2) and is responsible for
autophagosomal protein degradation in the cell (Shouval et al., 2007). Moreover,
the gene expression of PSMC4 and PMSC6 (26S proteasome subunits) were
also enhanced by FASN inhibition (Table 22). These results confirm
posttranslational effects in ovarian tumor cells caused by FASN blockade, which
is in accordance with our data shown above (Figure 33, Figure 34).
Abrogation of FASN leads to widespread changes in metabolism. In A2780
lipogenesis is affected by FASN inhibition caused by C75. After 48 hours of
treatment with C75 malonyl-CoA accumulation in the cell possibly leads to
modulation of ACACA, ACSL1, ACLY and FASN (Table 22). Besides changes in
fatty acid metabolism, C75 modulates genes extending to pathways other than
fatty acid metabolism. Inhibition of FASN impaired both the glycolysis and the
gluconeogenesis, which could be shown by downregulation of LDHC, HK2 and
PDK1 (Table 22). This suggests that inhibition of FASN may restrict the ability of
tumor cells to produce the energy necessary to proliferate.
While the transcription of PI3K cascade signaling molecules (AKT1, AKT2,
AKT3, FRAP1, RPS6KB1, EIF4EBP1) was slightly impaired and gene
expression of mTOR-inhibitor (TSC1) was slightly enhanced, our data show a
compensatory upregulation of MAP kinase survival pathways (MAPK11,
MAPKAP1) (Table 22). Similar compensatory effects were already shown above
on protein level in C75-treated A2780, when the specific phosphorylation levels
of AKT, mTOR and p70S6K were reduced while the specific phosphorylation
level of ERK1/2 was enhanced after 48 hours incubation (Figure 31B).
FASN inhibition also affects transcription. Some modulations in expression of
transcription factors are shown in Table 22. In A2780 cells, JUNB is upregulated
after 48 hours of incubation with C75, but its translation is reported to be
controlled via mTOR (Vesely et al., 2009). Gene expression of FOXO3 which is
known to be involved in apoptosis induction or cell-cycle arrest by transcription of
related genes (Katayama et al., 2008) is also enhanced by FASN inhibition
Results
99
(Table 22). Blocking of FASN also results in modulation of epigenetic active
enzymes. In contrast to real time PCR, this array did not show an increase in
HDAC2 and DNMT3a gene transcription (Figure 26, Figure 28, Table 22) after
48 hours of incubation with C75. However, similar results in real time PCR and
array analysis were obtained after 48 hours of incubation concerning the
downregulation of DNMT1 and DNMT3b (Figure 25, Figure 27, Table 22). In
conclusion, this short abstract of array data (Table 22) provides only a small
insight into the comprehensive database of genomic changes that occur in
response to FASN inhibition. Nevertheless, these array data confirm that FASN
is central not only for tumor cell metabolism, but also for tumor cell signaling.
Protein Symbol Gene Classication - Description Fold
change
Tumor Suppressor Genes
not significantly changed
p18 CDKN2C Cyclin-dependent kinase inhibitor 2C 0.84p16 CDKN2A Cyclin-dependent kinase inhibitor 2A 0.93E-Cadherin CDH1 Cadherin 1, E-cadherin 1.01p27 CDKN1B Cyclin-dependent kinase inhibitor 1B 1.06p15 CDKN2B Cyclin-dependent kinase inhibitor 2B 1.20PTEN PTEN Phosphatase and tensin homolog 1.25p19 CDKN2D Cyclin-dependent kinase inhibitor 2D 1.26p57 CDKN1C Cyclin-dependent kinase inhibitor 1C 1.28
upregulated
DAP kinase DAPK1 Death-associated protein kinase 1 1.41p53 TP53 Tumor protein p53 1.60MDM2 MDM2 Mdm2 p53 binding protein homolog 3.23p53INP1 TP53INP1 Tumor protein p53 inducible nuclear protein 1 3.51
Results
100
Protein Symbol Gene Classication - Description Fold
change
p53IP3 TP53I3 Tumor protein p53 inducible protein 3 4.37p21 CDKN1A Cyclin-dependent kinase inhibitor 1A 6.18
Proliferation/Cell Cycle
not significantly changed
CCND2 CCND2 Cyclin D2 0.73CCND1 CCND1 Cyclin D1 0.76CCNE2 CCNE2 Cyclin E2 0.76CDK9 CDK9 Cyclin-dependent kinase 9 0.81CDK4 CDK4 Cyclin-dependent kinase 4 0.82CDK3 CDK3 Cyclin-dependent kinase 3 0.92CDK5 CDK5 Cyclin-dependent kinase 5 0.95CDK7 CDK7 Cyclin-dependent kinase 7 1.22CDK8 CDK8 Cyclin-dependent kinase 8 1.26CDK6 CDK6 Cyclin-dependent kinase 6 1.32
downregulated
CDK2 CDK2 Cyclin-dependent kinase 2 0.68CDK10 CDK10 Cyclin-dependent kinase 10 0.63BRCA1 BRCA1 Breast cancer 1, early onset 0.55SKP2 SKP2 S-phase kinase-associated protein 2 (p45) 0.50CCNF CCNF Cyclin F 0.37CDC2 CDC2 Cell division cycle 2, G1 to S and G2 to M 0.34CCNA2 CCNA2 Cyclin A2 0.33CCNB1 CCNB1 Cyclin B1 0.30CDCA2 CDCA2 Cell division cycle associated 2 0.25
Signaling Molecules
not significantly changed EGFR EGFR Epidermal growth factor receptor 1.03ERBB2 ERBB2 v-erb-b2 erythroblastic leukemia viral oncogene homolog 2 0.95
Results
101
Protein Symbol Gene Classication - Description Fold
change ERBB3 ERBB3 v-erb-b2 erythroblastic leukemia viral oncogene homolog 3 (avian) 1.00ERBB4 ERBB4 v-erb-a erythroblastic leukemia viral oncogene homolog 4 (avian) 0.79AKT1 AKT1 v-akt murine thymoma viral oncogene homolog 1 0.73AKT2 AKT2 v-akt murine thymoma viral oncogene homolog 2 0.79
AKT3 AKT3 v-akt murine thymoma viral oncogene homolog 3 (protein kinase B,
gamma) 0.77
mTOR FRAP1 FK506 binding protein 12-rapamycin associated protein 1 0.78TSC1 TSC1 Tuberous sclerosis 1 1.21TSC2 TSC2 Tuberous sclerosis 2 1.07p70S6K RPS6KB1 Ribosomal protein S6 kinase, 70kDa, polypeptide 1 0.83p70S6K RPS6KB2 Ribosomal protein S6 kinase, 70kDa, polypeptide 2 0.98MAPK1 MAPK1 Mitogen-activated protein kinase 1 1.00BRAF BRAF v-raf murine sarcoma viral oncogene homolog B1 1.29ARAF ARAF v-raf murine sarcoma 3611 viral oncogene homolog 0.76RAF1 RAF1 v-raf-1 murine leukemia viral oncogene homolog 1 0.92
upregulated
MAPKAP1 MAPKAP1 Mitogen-activated protein kinase associated protein 1 1.41MAPK11 MAPK11 Mitogen-activated protein kinase 11 1.54
downregulated eIF4eBP1 EIF4EBP1 Eukaryotic translation initiation factor 4E binding protein 1 0.57
Protein Degradation
upregulated
26S proteasome PSMC6 Proteasome (prosome, macropain) 26S subunit, ATPase, 6 1.31UBE2D1 UBE2D1 Ubiquitin-conjugating enzyme E2D 1 (UBC4/5 homolog, yeast) 1.4026S proteasome PSMC4 Proteasome (prosome, macropain) 26S subunit, ATPase, 4 1.47UBE2Q1 UBE2Q1 Ubiquitin-conjugating enzyme E2Q family member 1 1.65ATG4A ATG4A ATG4 autophagy related 4 homolog A (S. cerevisiae) 2.10MDM2 MDM2 Mdm2 p53 binding protein homolog (mouse) 3.23
Results
102
Protein Symbol Gene Classication - Description Fold
change downregulated UBE2S UBE2S Ubiquitin-conjugating enzyme E2S 0.51UBE2S UBE2S OK/SW-cl.73 mRNA for ubiquitin carrier protein, complete cds. 0.51UBE2T UBE2T Ubiquitin-conjugating enzyme E2T (putative) 0.40UBE2C UBE2C Ubiquitin-conjugating enzyme E2C 0.34
Apoptosis
not significantly changed Caspase 2 CASP2 Caspase 2, apoptosis-related cysteine peptidase 0.75
BNIP3 BNIP3 BCL2/adenovirus E1B 19kDa interacting protein 3, nuclear gene
encoding mitoch. Protein 0.78
Caspase 7 CASP7 Caspase 7, apoptosis-related cysteine peptidase 0.89Caspase 3 CASP3 Caspase 3, apoptosis-related cysteine peptidase 1.06DDIT4 DDIT4 DNA-damage-inducible transcript 4 1.11
Caspase 1 CASP1 Caspase 1, apoptosis-related cysteine peptidase (interleukin 1, beta,
convertase) 1.16
Caspase 5 CASP5 Caspase 5, apoptosis-related cysteine peptidase 1.28Caspase 6 CASP6 Caspase 6, apoptosis-related cysteine peptidase 1.28
upregulated
DAP kinase DAPK1 Death-associated protein kinase 1 1.41Caspase 4 CASP4 Caspase 4, apoptosis-related cysteine peptidase 1.52BAX BAX BCL2-associated X protein 1.62Caspase 8 CASP8 Caspase 8, apoptosis-related cysteine peptidase 1.79ANXA1 ANXA1 Homo sapiens annexin A1 1.86AVEN AVEN Apoptosis, caspase activation inhibitor 2.00
TNFRSF10D TNFRSF10D Homo sapiens tumor necrosis factor receptor superfamily, member
10d 2.41
GADD45B GADD45B Growth arrest and DNA-damage-inducible, beta 2.55TNFRSF10B TNFRSF10B Homo sapiens tumor necrosis factor receptor superfamily, member 10b 2.62GADD45A GADD45A Growth arrest and DNA-damage-inducible, alpha 2.81FAS FAS Fas (TNF receptor superfamily, member 6) 4.03ANXA4 ANXA4 Homo sapiens annexin A4 7.45
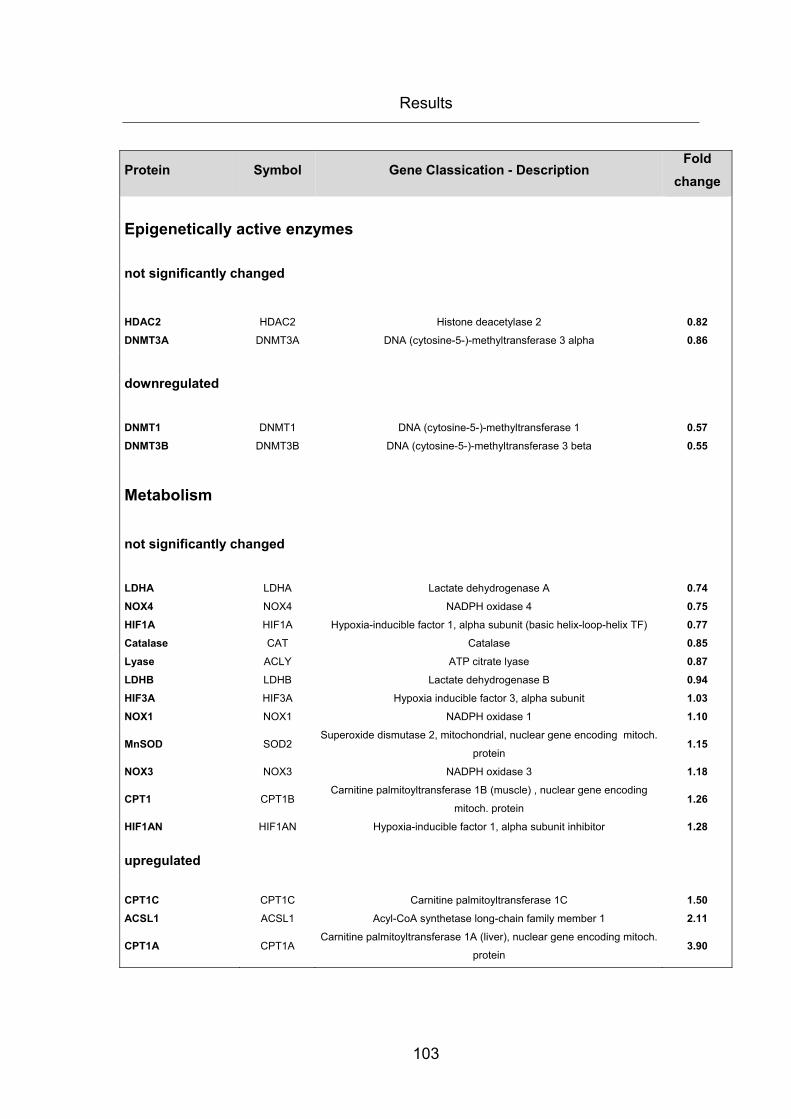
Results
103
Protein Symbol Gene Classication - Description Fold
change
Epigenetically active enzymes
not significantly changed
HDAC2 HDAC2 Histone deacetylase 2 0.82DNMT3A DNMT3A DNA (cytosine-5-)-methyltransferase 3 alpha 0.86
downregulated DNMT1 DNMT1 DNA (cytosine-5-)-methyltransferase 1 0.57DNMT3B DNMT3B DNA (cytosine-5-)-methyltransferase 3 beta 0.55
Metabolism
not significantly changed LDHA LDHA Lactate dehydrogenase A 0.74NOX4 NOX4 NADPH oxidase 4 0.75HIF1A HIF1A Hypoxia-inducible factor 1, alpha subunit (basic helix-loop-helix TF) 0.77Catalase CAT Catalase 0.85Lyase ACLY ATP citrate lyase 0.87LDHB LDHB Lactate dehydrogenase B 0.94HIF3A HIF3A Hypoxia inducible factor 3, alpha subunit 1.03NOX1 NOX1 NADPH oxidase 1 1.10
MnSOD SOD2 Superoxide dismutase 2, mitochondrial, nuclear gene encoding mitoch.
protein 1.15
NOX3 NOX3 NADPH oxidase 3 1.18
CPT1 CPT1B Carnitine palmitoyltransferase 1B (muscle) , nuclear gene encoding
mitoch. protein 1.26
HIF1AN HIF1AN Hypoxia-inducible factor 1, alpha subunit inhibitor 1.28
upregulated
CPT1C CPT1C Carnitine palmitoyltransferase 1C 1.50ACSL1 ACSL1 Acyl-CoA synthetase long-chain family member 1 2.11
CPT1A CPT1A Carnitine palmitoyltransferase 1A (liver), nuclear gene encoding mitoch.
protein 3.90
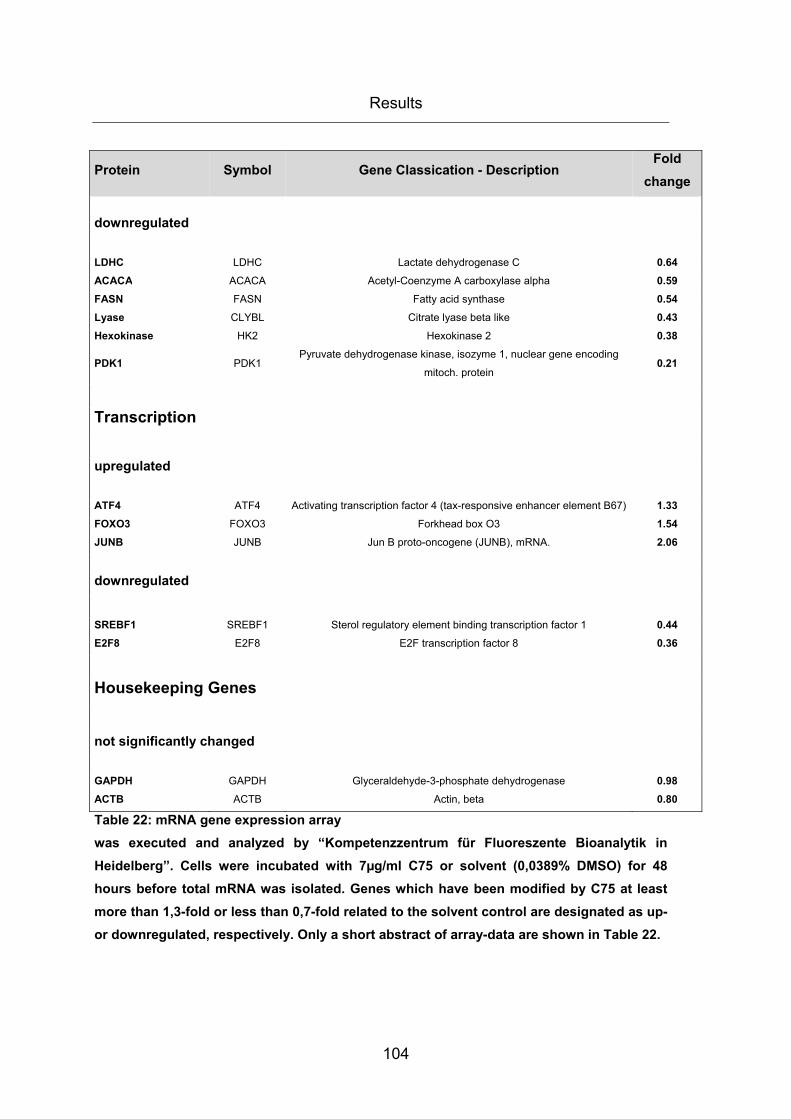
Results
104
Protein Symbol Gene Classication - Description Fold
change
downregulated
LDHC LDHC Lactate dehydrogenase C 0.64ACACA ACACA Acetyl-Coenzyme A carboxylase alpha 0.59FASN FASN Fatty acid synthase 0.54Lyase CLYBL Citrate lyase beta like 0.43Hexokinase HK2 Hexokinase 2 0.38
PDK1 PDK1 Pyruvate dehydrogenase kinase, isozyme 1, nuclear gene encoding
mitoch. protein 0.21
Transcription
upregulated
ATF4 ATF4 Activating transcription factor 4 (tax-responsive enhancer element B67) 1.33FOXO3 FOXO3 Forkhead box O3 1.54JUNB JUNB Jun B proto-oncogene (JUNB), mRNA. 2.06
downregulated SREBF1 SREBF1 Sterol regulatory element binding transcription factor 1 0.44E2F8 E2F8 E2F transcription factor 8 0.36
Housekeeping Genes
not significantly changed
GAPDH GAPDH Glyceraldehyde-3-phosphate dehydrogenase 0.98ACTB ACTB Actin, beta 0.80
Table 22: mRNA gene expression array was executed and analyzed by “Kompetenzzentrum für Fluoreszente Bioanalytik in Heidelberg”. Cells were incubated with 7µg/ml C75 or solvent (0,0389% DMSO) for 48 hours before total mRNA was isolated. Genes which have been modified by C75 at least more than 1,3-fold or less than 0,7-fold related to the solvent control are designated as up- or downregulated, respectively. Only a short abstract of array-data are shown in Table 22.
Discussion
105
4 Discussion
Unscheduled proliferation in tumor cells frequently results as a consequence of
hyperactivation of cell-cycle regulating cyclin-dependent kinases (Cdks) through
amplification or mutation or through overexpression of cyclins and, more
frequently, inactivation of Cdk inhibitors (Malumbres et al., 2001). In fact,
inactivation of Cdk inhibitors is a frequent oncogenic alteration in several tumor
types and both p15INK4b and p16INK4a proteins are inhibitors of Cdks that prevent
the cell from going through the G1-S phase transition. Therefore, inactivation of
p15INK4b and p16INK4a is thought to be an important step in cancer development
(Herman et al., 1996). It is well documented that a proportion of ovarian
carcinomas harbor p15INK4b methylation (≤33%) or p16INK4a methylation (≤19%)
and that CpG island methylation is associated with transcriptional silencing of the
tumor suppressor genes (Liu et al., 2, 2005; Rojas et al., 2009; Katsaros et al.,
2004; Tam et al., 2007). In our experiments, in FASN inhibited A2780 cells
enhanced expression of p15INK4b is more pronounced at the mRNA than at the
protein level and actually cannot have further implication on the cell cycle as the
protein level of p15INK4b is even reduced in C75 treated A2780 (Figure 19, Figure
31A). A p15INK4b hypermethylated phenotype in ovarian cancer has often been
reported (Collins et al., 2006; Liu et al., 1, 2005) but we could not show this
methylation status for the promoter gene of p15INK4b in the cell line A2780 (Figure
29). It is reported that inhibition of PI3K by LY294002 leads to G1 arrest in
human ovarian cancer cells through p16INK4a regulation by
PI3K/AKT/mTOR/p70S6K signaling (Gao et al., 2004). However, in A2780 cells
mRNA transcription of p16INK4a was neither stimulated by C75 nor by LY294002
treatment which suggests that the cyclin dependent kinase inhibitor p16INK4a is
not responsible for cell cycle blockade in G1, neither. In colon carcinoma and
hepatocellular carcinoma cells FASN blockade causes inhibition of DNA
replication by blockade of the cell cycle in G1 (Li et al., 2001; Gao et al., 2006).
Discussion
106
However, our data suggest that in A2780 ovarian carcinoma cells this C75-
induced cell-cycle arrest is caused through various molecular mechanisms that
may involve other cyclin dependent kinase inhibitors than p15INK4b or p16INK4a.
Interestingly, due to C75 treatment we found a significant augmentation of p21
(CDKN1A) expression in A2780 (Table 22). This cyclin dependent kinase
inhibitor is known to block cyclin A (CCNA) and cyclin-depedent kinase 2
(CDK2), which are proliferation promoting factors that are also transcriptionally
downregulated by FASN inhibition in A2780 cells (Table 22). Maybe massive
augmentation of p21 could also be responsible for cell-cycle arrest caused by
FASN inhibition in A2780 tumor cells. Moreover, p21 has been shown to play a
major role in inducing p53-dependent G1 cell-cycle arrest following DNA damage
resulting in Cdk inactivation (Malubres et al., 2003). Notably, in A2780 tumor
cells FASN inhibition caused by C75 increased p53 gene expression, which also
indicates blockade of S-phase entry by p21 in these cells. Furthermore, it has
been reported that in normal cells retinoblastoma (Rb) proteins repress the
transcription of genes required for DNA replication or mitosis through
sequestering of E2F transcription factors and therefore maintain cells in a
quiescent state (Attwool et al., 2004). Upon stimuli, cyclins are normally
activated and induce cyclin-depedent kinases Cdk4 and Cdk6. Cyclin D-Cdk4/6
complexes then phosphorylate and inactivate Rb protein, allowing the expression
of E2F target genes triggering massive transcription of genes required for DNA
replication and mitosis (Malumbres et al., 2001). Interestingly, in our experiments
FASN inhibition massively impairs mRNA expression of E2F8 transcription
factor, even though the cells have been stimulated with 100ng/ml EGF for
20minutes before lysis and mRNA isolation (Table 22). Maybe this E2F
transcriptional downregulation could also account for the possible cell-cycle
arrest caused by FASN inhibition in A2780 carcinoma cells. Additionally, FOXO3
(Forkhead box O) transcription factor mRNA expression was enhanced by C75
treatment in A2780 (Table 22). FOXOs are direct targets of AKT phosphorylation
and are negatively regulated by AKT (Brunet et al., 1999 C). AKT-dependent
Discussion
107
phosphorylation of FOXOs results in their cytoplasmatic localization and inability
to exhibit their gene transcriptional activity. FOXOs are reported to be involved in
apoptosis induction or cell-cycle arrest by transcription of related genes
(Medema et al., 2000). Our results suggest that augmentation in FOXO3 gene
expression (Table 22) and reduced AKT activity (Figure 31B) both caused by
FASN inhibition could also be associated with potential cell-cycle arrest in A2780
tumor cells. Besides possible C75-induced cell-cycle arrest in tumor cells
abrogation of FASN also leads to widespread changes in metabolism, which
often induces apoptosis in these cells (Bandyopadhyay et al., 2006). FASN
inhibition causes accumulation of its substrate malonyl-CoA. The activity of
carnitine palmitoyltransferase 1 (CPT1), which regulates ß-oxidation of fatty
acids is blocked by malonyl-CoA. Hence, inhibited CPT1 induces sphingolipid
ceramide accumulation, which then provokes ceramide-mediated mitochondrial
apoptotic pathway induction as the enhanced transcription of DAP kinase mRNA
in our results approves (Figure 22, Table 22) (Bandyopadhyay et al., 2006).
Moreover, our mRNA array data of C75 treated A2780 show an increase in
mRNA expression level of CPT1 (Table 22), which confirms this effect too
(Menendez et al., 2007). Furthermore, CPT1 was co-immunoprecipitated with
BCL-2 suggesting a physical association between CPT1 and the mitochondrial
apoptotic apparatus (Paumen et al., 1997). In our experiments the increased
mRNA levels of TNF-α-associated FAS, TNFRSF10B and TNFRSF10D (Figure
23, Table 22) suggest that FASN blockade in A2780 ovarian carcinoma cells
also elevates TNF-α-associated apoptosis. Similar effects caused by FASN
inhibition were reported in breast cancer cells (Bandyopadhyay et al., 2006).
Additionally, our mRNA array data of C75 treated A2780 cells show an increase
in transcription of p53 gene initiating growth arrest or enhanced apoptosis (Table
22). FASN is not only important for phospholipid synthesis of the outer cell
membrane but also for inner membranes such as the endoplasmatic reticulum
(ER) membrane. Furthermore, FASN activity drives phospholipid synthesis,
which primarily occurs in the ER (Swinnen et al., 2003). Because of the direct
Discussion
108
connection between FASN activity and phospholipid synthesis, FASN blockade
results in ER stress response in a variety of tumor cells, but not in normal cells
(Little et al., 2007). Indeed, FASN inhibition has even been shown to cooperate
with ER stress inducer to induce cell death by increased unfolded protein
response (UPR) signaling (Little et al., 2008). Accordingly, our array data show
an augmentation of ATF4 and GADD45A and GADD45B mRNA expression,
which are canonical markers of the endoplasmatic reticulum (ER) stress
response in tumor cells caused by FASN blockade. For instance, it is known that
ATF4 acts to protect the cells from ER-generated reactive oxygen species (Little
et al., 2007) indicating that ER-stress could also play a role in programmed cell
death induced by FASN inhibition in A2780 cells. All these data suggest that
FASN inhibition in tumor cells enhances programmed cell-death via several
pathways. In this work we could confirm TNFα-associated, nuclear, ER- and
mitochondrial stress induced apoptosis in FASN inhibited A2780 ovarian cancer
cells. Besides the already discussed apoptotic effects of FASN inhibition, FASN
blockade entails accumulation of NADPH that activates NADPH-oxidase (NOX)
thus causing formation of reactive oxygen species (ROS), which in turn
stimulates the detoxification activity of MnSOD (Menendez et al., 2007). MnSOD
catalyzes the reaction of O2 to H2O2, which is then catalyzed to H2O and O2 by
catalase. While we could show an increase of mRNA level of the antioxidant
enzyme MnSOD caused by FASN blockade (Figure 24, Table 22) in both Real
Time PCR and micro array experiments, we could not show any augmentation of
catalase in our mRNA array of C75 treated A2780 (Table 22). Hence, there is the
possibility that H2O2 is not finally cleaned up in the cells after C75 treatment has
induced oxidative stress in the cells. However, a conclusive molecular
explanation of the anti-proliferative and death promoting effects of FASN-
inhibitors is still missing. Moreover, recent findings suggest that ROS production
can lead to modulation of methylation of the CDH1 gene promoter (Lim et al.,
2008).
Discussion
109
It is shown that in a proportion of ovarian carcinomas aberrant promoter
methylation of CDH1 gene (≤42%) is detected and that methylation status of
CDH1 is closely associated with the decrease of E-Cadherin protein expression
(Yuecheng et al., 2006). Interestingly, in A2780 cells C75 and LY294002
increase E-Cadherin mRNA expression level in Real Time PCR indicating that
both compounds can modulate the adhesion specificity and maybe can improve
targeting invasion and metastases in ovarian carcinoma (Yuecheng et al., 2006).
If demethylating effects of C75 or LY294002 result in enhanced CDH1 mRNA
expression in A2780 cells remains unclear.
Several types of tumors, including ovarian cancer, are known to have a
hypermethylation phenotype (Esteller et al., 2001; Strathdee et al., 2001).
Especially, DAP kinase methylation is observed in 67% of patients with
malignant ovarian carcinomas (Collins et al., 2006). Our results also show a
hypermethylated status in the DAP kinase gene in solvent treated A2780 cells.
After C75 treatment, the level of methylated DNA in the DAP kinase gene was
decreased (Figure 30). Therefore, we hypothesize that the upregulation of DAP
kinase mRNA expression level by FASN blockade, which could be shown by
both Real Time PCR and array (Figure 22, Table 22), is caused by
demethylating effects of C75 targeting DAP kinase gene. Until now the
relationship between the FASN biochemical pathway and the epigenetic
regulation of tumor suppressor genes has been completely unexplored. The
present study is the first report about epigenetic effects caused by FASN
inhibition in ovarian carcinoma cells. Accordingly, we investigated whether
modulation of gene expression levels of epigenetic active enzymes might also
occur by blocking of FASN. Unlike DNMT3a, which was increased in its mRNA
level (Figure 26), DNMT3b and DNMT1 mRNA transcription levels were shown
to be decreased by C75-caused FASN inhibition by both Real Time PCR and
array (Figure 25, Figure 27, Table 22). This downregulation of DNMTs suggests
a transcription-activating effect on the genome and would correlate with the
increased DAP kinase gene demethylation and the increased mRNA expression
Discussion
110
if its gene after FASN blockade in A2780 cells. Interestingly, in our experiments
gene expression of HDAC2 could not be impaired by C75 treatment but was
even shown to be enhanced by Real Time PCR analysis (Figure 28). It is well
known that epigenetic transcriptional gene silencing is characterized by a
hypermethylated and hypoacetylated phenotype (Esteller et al., 2007). Thus, on
the one hand our results indicate a transcriptional activation by downregulation of
DNMTs (DNMT1, DNMT3b) mRNA levels but on the other hand our results
suggest a transcriptional silencing by augmentation of HDAC2 mRNA expression
level. Moreover, our mRNA array data of C75 treated A2780 show an increase in
mRNA expression level of CPT1 (Table 22). Recently, a new role of CPT1 in
histonic acetylation levels of tumors and cancer development was proposed,
because CPT1 proteins and HDAC1 were co-immunoprecipitated in nuclear
extracts from neoplastic MCF-7 cells (Mazzarelli et al., 2007). In this paper the
authors identified a new role of CPT1 in addition to the physiological role in the
transport of long-chain fatty acids into mitochondria and showed that CPT1 plays
a role in histone acetylation status of tumor cells (Mazzarelli et al., 2007). Maybe
in A2780 the C75-enhanced CPT1 also builds complexes with C75-induced
HDACs leading to their nuclear import and genome hypoacetylation in these
cells. Furthermore, our array data of C75 treated A2780 suggest, that citrate
lyase (CLYBL), which converts glucose-derived citrate into acetyl-CoA is
markedly decreased (Table 22). As citrate lyase is required for histone
acetylation (Wellen et al., 2009) this effect of FASN inhibition could also result in
a hypoacetylated phenotype in A2780 cells. In A2780 tumor cells the increase in
HDAC2 and CPT1 mRNA expression levels and the decrease of citrate lyase
gene expression level could support deacetylating effects caused by FASN
inhibition. Accordingly, upregulation of DNMT3a gene expression level by FASN
blocking could be a further response to the transcriptional silencing action of C75
in A2780 carcinoma cells. However, our array data also show a downregulation
of acetyl-CoA carboxylase (ACACA) mRNA level and a significant augmentation
of acetyl-CoA synthetase gene expression due to FASN inhibition (Table 22),
Discussion
111
which indicates accumulation of acetyl-CoA in C75-treated A2780 cells.
Therefore, we hypothesize that the increased HDAC2 transcription could also be
a counteraction against accumulated acetyl-CoA in A2780 cells caused by FASN
blockade. In general, the entire epigenetic machinery targets not only specifically
to tumor suppressor genes and the modulation of DNMTs or HDACs mRNA
expression levels gives us just very indecisive information about their epigenetic
activities (Esteller et al., 2007). Nevertheless, this study is the first report about
epigenetic effects caused by FASN inhibition in ovarian carcinoma cells and it
argues for epigenetic mechanism of action of the FASN blocking drug C75 –
although it is likely that many effects are the consequence of secondary
mechanisms.
Phosphatidylinositol 3-kinase (PI3K) activity in ovarian cancer cells is well known
to be required for the cell proliferation and G1 cell cycle progression. Recent
studies indicate that the gene encoding the catalytic subunit of PI3K is amplified
in ≤40% of primary ovarian carcinoma cells as well as in several ovarian
epithelial cancer cell lines (Gao et al., 2004; Katayama et al., 2008). Modulation
of the PI3K/AKT signaling pathway by FASN Inhibition in ovarian carcinoma cell
lines has already been observed (Grunt et al., 2009; Wang et al., 2005). Of note,
phospholipid endproducts of FASN action are incorporated into cell membranes
and form lipid rafts, which accommodate ErbB receptors. Inhibition of FASN
decreases these lipid rafts and impedes recruitment and phosphorylation of
downstream mediators such as AKT (Grunt et al., 2009). Interestingly, another
recent report suggests that ROS evokes an AKT conformational change by
forming intramolecular disulfide bonds, which results in disruption of AKT-HSP90
binding and enhancement of AKT-PP2A interaction and dephosphorylation at
Ser 473 (Cao et al., 2009). In our experiments we obtained reduction of total
protein expression levels (Figure 31A) and impaired phosphorylation levels of
AKT, mTOR, p70S6K, p15 and 4eBP1 (Figure 31B) through treatment of the
A2780 cells with the FASN inhibiting drug C75. Interestingly, C75 inhibits AKT,
mTOR, p70S6K and 4eBP1 phosphorylation caused by EGF stimulation
Discussion
112
(100ng/ml) and simultaneously decreases their total protein levels. In contrast,
phospho-ERK1/2 levels increase slightly upon C75 treatment in A2780, even
though total ERK1/2 protein expression also slightly declines at later time points
of exposure (Figure 31A, B). Enhancement of ERK1/2 phosphorylation is also
observed in LY294002 treated A2780 ovarian cancer cells (Figure 32A, B).
Unlike FASN inhibition by C75, the PI3K inhibitor LY294002 does not remarkably
lower the total protein levels of several proteins involved in PI3K/AKT signaling.
These data indicate that C75-mediated blockade of FASN reduces the activity of
the PI3K cascade and concurrently slightly activates ERK1/2 in A2780, which
supports the findings that phospho-AKT negatively regulates the MAPK cascade
e.g. by curbing Raf-1 function (Hennessy et al., 2005) or by the proximal mTOR
activator Rheb that has been implicated in the direct interaction and inhibition of
B-Raf and Raf1 (Karbowniczek et al., 2006). In our experiments C75 seems to
decrease the total protein level of all analyzed signal proteins of the PI3K
cascade, while LY294002 rather leaves the total protein levels unchanged or
even augments the total protein levels of the PI3K cascade molecules. A recent
study in breast cancer indicates that FASN inhibition enhances DDIT4 (DNA
damage inducible transcript 4), a stress response gene that negatively regulates
mTOR pathway, which controls protein biosynthesis through activation of
translation initiation factor eIF4E and induces caspase-8-mediated tumor cell
apoptosis (Knowles et al., 2008). In our mRNA array data we could not obtain a
significant increase of DDIT4 gene expression but caspase-8 gene expression
level was enhanced (Table 22). Another study suggests that FASN inhibition
causes ER stress and activates unfolded protein response in tumor cells (Little et
al., 2007). Interestingly, the authors could show that several indicators of ER
stress and inhibition of protein synthesis were detected before caspase 3 and
PARP cleavage, the hallmarks of apoptosis (Little et al., 2007). Maybe FASN
inhibition leads to apoptosis and protein degradation through ER stress and
unfold protein response in A2780 cells, too.
Discussion
113
Under normal cellular conditions, eIF4F translation complex assembly is limited
as eIF4E is sequestered from eIF4G by binding to eIF4eBP1 (4eBP1).
Stimulation of the PI3K/AKT/mTOR signaling then normally leads to 4eBP1
phosphorylation, dislodging 4eBP1 from eIF4E and enabling assembly of the
eIF4F complex (Graff et al., 2008). However, we could exclude that the
dephosphorylation of 4eBP1 and therefore the decreased eIF4F complex
formation and translation is the reason for protein level reduction of AKT, mTOR,
p70S6K, 4eBP1 and ERK1/2 by FASN inhibition in A2780 because incubation
with LY294002 totally abrogates phosphorylation of 4eBP1 without affecting
protein levels of these proteins (Figure 32A, B). Therefore, we assume that
translation inhibition by unphosphorylated 4eBP1 does not influence translation
of the analyzed proteins. We then investigated whether proteasomal degradation
is responsible for decrease in protein levels. Enhanced degradation was
obtained in all analyzed proteins caused by C75 while translation was inhibited
by Cycloheximide. Especially, the strong degradation of p15INK4b protein lets us
hypothesize that this post-translational modification caused by C75 compensates
the high increase in mRNA transcription of this gene. Our results show that
increased post-translational ubiquitination could be the reason for enhanced
protein degradation (Figure 34). Ubiquitination is an important regulatory post-
translational modification of lysine residues. Polyubiquitination targets proteins
for degradation via the 26S proteasomal pathway. The multienzyme complexes,
which mediate protein ubiquitination consist of activating (E1), conjugating (E2),
and ligating (E3) enzymes (Gwalter et al., 2008). However, ubiquitination-
associated enzymes target their client proteins in a quite non-specific way and
up to date only one deubiquitinating enzyme has been matched to a specific
substrate. This is ubiquitin-specific protease 2a (USP2a), which interacts with
and stabilizes FASN (Graner et al., 2004). Interestingly, a genome-wide analysis
of changes in MDA-MB-435 tumor cells caused by FASN knockdown, revealed
significant effects of FASN inhibition on enhanced protein ubiquitination
(Knowles et al., 2007). Moreover, it has already been reported that the cellular
Discussion
114
levels of several members of the serine/threonine protein kinases A, G and C
(AGC kinases) are controlled by polyubiquitination through mechanisms, which
are independent on activation state or kinase activity (Bogusz et al., 2006). In
particular, they could show that the protein levels of serum- and glucocorticoid-
induced kinase 1 (SGK1) and ribosomal protein S6 kinase (S6K) are regulated
by ubiquitination, which controls their steady-state levels (Brickley et al., 2002;
Wang et al., 2008). One study even suggests that ubiquitin ligases Roc1 and
MDM2 specifically interact with and induce the ubiquitination of S6K (Gwalter et
al., 2008). Thus, these studies show that several signaling pathways can be
regulated by steady-state levels of their signaling proteins next to activation by
phosphorylation. Even so, a number of studies support a model, whereby
activation of kinases triggers their own degradation via the ubiquitin-proteasome
pathway to prevent accumulation of activated kinases in the cells (Lu et al.,
1998). Our results show highest degradation of all analyzed protein after longer
times of exposure to C75. This coincides with the highest ubiquitination status
and minimal phosphorylation status of proteins after longer time of treatment with
the FASN inhibitor C75 (Figure 31, Figure 34). Theses findings indicate that in
A2780 ovarian cancer cells decrease in protein levels of AKT, mTOR, p70S6K,
p15INK4b and 4eBP1 is caused by FASN inhibition due to their enhanced
ubiquitination and proteasomal degradation and independent of their
phosphorylation. Moreover, in our array data we could show a significant
increase in MDM2 gene expression level indicating that this ubiquitin ligase could
also be associated with enhanced degradation caused by C75 treatment. In
absence of phosphorylation, AKT becomes protected by a molecular chaperone,
the heat shock protein 90 (Hsp90), from ubiquitination-mediated proteasome
degradation (Facchinetti et al., 2008). Maybe a combination of C75 and the
Hsp90 inhibitor 17-AAG would abrogate AKT activation even more effectively
and potentiate PI3K blockade in ovarian cancer cells. This idea could be a new
approach to dispose oncogenic AKT activation in tumor cells. Collectively, these
data show that FASN activity is involved in the functionality of the proteasomal
Discussion
115
pathway and that there consists a crosstalk between FASN and proteasome
pathways. This is an important issue on which further investigations should be
focused. In our mRNA array data we further found that FASN inhibition increases
the mRNA expression level of ATG4A, which encodes a cysteine protease that is
ROS, especially H2O2, induced and functions to target proteins for degradation
by autophagosomal degradation (Shouval et al., 2007). As we could already
show a possible accumulation of H2O2 in C75-treated A2780 cells (Table 22) this
indicates that maybe other degradation pathways are also influenced by FASN
inhibition in A2780 cells.
In summary, this is the first report about the epigenetic modulating action of the
FASN inhibitor C75. In this work we further pointed out several effects caused by
FASN blocking. We could show and confirm anti-proliferative and apoptotic-
inducing effects – among others - induced by demethylation activity, and
enhanced ubiquitin-mediated degradation of several protein members of the
PI3K cascade.

Discussion
116
117
References
Adams, J. (2003). The development of proteasome inhibitors as anticancer drugs
Cancer Cell 5, 417-421.
Adams, R.L. (1995). Eukaryotic DNA methyltransferases--structure and function.
Bioessays 17 (2), 139-145.
Alò, P.L., Visca, P., Framarino ,M.L., Botti, C., Monaco, S., Sebastiani, V.,
Serpieri, D.E., Di Tondo, U. (2000). Immunohistochemical study of fatty acid
synthase in ovarian neoplasms. Oncol. Rep. 7 (6), 1383-1388.
American Cancer Society Inc. (2009): Ovarian Cancer. Atlanta (USA). Online
source – website last visited on 25.07.2009:
http://www.cancer.org/docroot/CRI/CRI_2x.asp?sitearea=&dt=33
Attwooll, C., Deschi, E.L., and Helin, K. (2004). The E2F family: specific functions
and overlapping interests. The EMBO Journal 23, 4709–4716.
Bandyopadhyay, S., Zhan, R., Wang, Y., Pai, S.K., Hirota, S., Hosobe, S.,
Takano, Y., Saito, K., Furuta, E., Iiizumi, M., Mohinta,S., Watabe,M., Chalfant,
C., and Watabe, K. (2006). Mechanism of Apoptosis Induced by the Inhibition of
Fatty Acid Synthase in Breast Cancer Cells. Cancer Res. 66: (11), 5934-5940.
Bentebibel, A., Sebastia´n, D., Herrero L., Lo´pez-Vin˜as, L., Serra, D., Asins, G.,
Go´mez-Puertas, P., and Hegardt, F.G. (2006). Novel Effects of C75 on
Carnitine Palmitoyltransferase I Activity and Palmitate Oxidation. Biochemistry 45
(14), 4339.
References
118
Bentebibel, A., Sebastia´n, D., Herrero, L., Lo´pez-Vin˜as, E., Serra, D., Asins,
G., Go´mez-Puertas, P., and Hegardt, F.G. (2006). Novel Effect of C75 on
Carnitine Palmitoyltransferase I Activity and Palmitate Oxidation. Biochemistry 45
(14), 4339-4350.
Berchuck, A., Kohler, M.F., Marks, J.R., Wiseman, R., Boyd, J., Bast, R.C. Jr.
(1994). The p53 tumor suppressor gene frequently is altered in gynecologic
cancers. Am. J. Obstet. Gynecol. 170 (1), 246-252.
Bijman, M.N., van Berkel, M.P., Kok, M., Janmaat, M.L., Boven, E. (2009).
Inhibition of functional HER family members increases the sensitivity to
docetaxel in human ovarian cancer cell lines. Anticancer Drugs. 20 (6), 450-460.
Birch, D.E., et al. (1996). Simplified hot start PCR. Nature 381, 445-446.
Bogusz, A.M., Brickley, D.R., Pew, T., and Conzen, S.D. (2006). A novel N-
terminal hydrophobic motif mediates constitutive degradation of serum- and
glucocorticoidinduced kinase-1 by the ubiquitin–proteasome pathway. FEBS
Journal 273, 2913–2928.
Brewer, M.A., Johnson, .K, Follen, M., Gershenson, D., Bast, R. Jr. (2003).
Prevention of ovarian cancer: intraepithelial neoplasia. Clin Cancer Res. 9 (1),
20-30.
Brickley, D.R., Mikosz, C.A., Hagan, C.R., Conzen, S.D. (2002). Ubiquitin
modification of serum and glucocorticoid-induced protein kinase-1 (SGK-1). J.
Biol. Chem. 277 (45), 43064-43070.
Brunet, A., Bonni,A., Zigmond, M.J., Lin, M.Z., Juo,P., Hu, L.S., Anderson, M.J.,
Arden, K.C., Blenis, J., and Greenberg, M.E. (1999). Akt Promotes Cell Survival
References
119
by Phosphorylating and Inhibiting a Forkhead Transcription Factor. Cell 96, 857–
868.
Brusselmans, K., Vrolix, R., Verhoeven, G., and Swinnen, J.V. (2005). Induction
of Cancer Cell Apoptosis by Flavonoids Is Associated with Their Ability to Inhibit
Fatty Acid Synthase Activity. The Journal of Biological Chemistry 280 (7/18),
5636–5645.
Cannistra, S.A. (2004). Cancer of the Ovary. M.D. N Engl J Med. 351, 2519-29.
Cao, J., Xu, D., Wang, D., Wu, R., Zhang, L., Zhu, H., He, Q., Yang, B. (2009).
ROS-driven Akt dephosphorylation at Ser-473 is involved in 4-HPR-mediated
apoptosis in NB4 cells. Free Radical Biology & Medicine, Article in Press.
Carracedo, A., Ma, L., Teruya-Feldstein, J., Rojo, F., Salmena, L., Alimonti, A.,
Egia, A., Sasaki, A.T, Kozma, S.C., Papa, A., Nardella, C., Cantley, L.C.,
Baselga,J., and Pandolfi, P.P. (2008). Inhibition of mTORC1 leads to MAPK
pathway activation through a PI3K-dependent feedback loop in human cancer.
The Journal of Clinical Investigation 118 (9), 3065-3074
Citri, A., and Yarden, Y. (2006). EGF–ERBB signalling: towards the systems
level. Nature Reviews| Molecular Cell Biology 7, 505-516.
Collins, Y., Dicioccio, R., Keitz, B., Lele, S. and Odinsi, K. (2006). Methylation of
death-associated protein kinase in ovarian carcinomas. Int J Gynecol Cancer 16
(Suppl. 1), 195–199.
Costello, J.F., and Plass, C. (2001). Methylation matters. J Med Genet 38, 285–
303.
References
120
Darcy, KM., Brady, W.E., McBroom, J.W., Bell, J.G., Young, R.C., McGuire,
W.P., Linnoila, R.I., Hendricks, D., Bonome, T., Farley, J.H. (2008). Associations
between p53 overexpression and multiple measures of clinical outcome in high-
risk, early stage or suboptimally-resected, advanced stage epithelial ovarian
cancers: A Gynecologic Oncology Group study. Gynecologic Oncology 111,
487–495.
Datta, S.R., Brunet, A., and Greenberg, M.E. (1999). Cellular survival: a play in
three Akts. Genes Dev. 13, 2905-2927.
Easton, J.B., and Houghton, P.J. (2006). mTOR and cancer therapy. Oncogene
Review 25, 6436–6446.
Espada, J., Ballestar, E., Fraga, M.F. Villar-Garea, A., Juarranz, A., Stockert,
J.C., Robertson, K.D., Fuks, F., and Esteller, M. (2004). Human DNA
Methyltransferase 1 Is Required for Maintenance of the Histone H3 Modification
Pattern. The Journal of Biological Chemistry 279 (35/27), 37175–37184.
Esteller Manel (2007). Epigenetic gene silencing in cancer: the DNA
hypermethylome. Human Molecular Genetics 16, R50–R59.
Facchinetti, V., Ouyang, W., Wei, H., Soto, N., Lazorchak, A., Gould, C., Lowry,
C., Newton, A.C., Mao, Y., Miao, R.Q., Sessa, W.C., Qin, J., Zhang, P., Su, B.,
Jacinto, E. (2008). The mammalian target of rapamycin complex 2 controls
folding and stability of Akt and protein kinase C. EMBO J. 27 (14), 1932-1943.
Furuta, E., Pai, S.K., Zhan, R., Bandyopadhyay, S., Watabe, M., Mo, Y., Hirota,
S., Hosobe, S., Tsukada, T., Miura, K., Kamada, S., Saito, K., Iiizumi, M., Liu,
W., Ericsson, J., and Watabe, K. (2008). Fatty Acid Synthase Gene Is Up-
References
121
regulated by Hypoxia via Activation of Akt and Sterol Regulatory Element
Binding Protein-1. Cancer Res 68 (4), 1003-1011.
Gansler, T.S., Hardman, W., Hunt, D.A., Schaffel, S., Hennigar, R.A. (1997).
Increased expression of fatty acid synthase (OA-519) in ovarian neoplasms
predicts shorter survival. Hum. Pathol. 28(6), 686-692.
Gao, N., Flynn, D.C., Zhang, Z., Zhong, X., Walker, V., Liu, K.J., Shi, X., and
Jiang, B. (2004). G1 cell cycle progression and the expression of G1 cyclins are
regulated by PI3K/AKT/mTOR/p70S6K1 signaling in human ovarian cancer cells.
Am J Physiol Cell Physiol 287, C281–C291.
Gao, Y., Lin, L., Zhu, C., Chen, Y., Hou, Y., Ding, J. (2006). Growth Arrest
Induced by C75, A Fatty Acid Synthase Inhibitor, was Partially Modulated by p38
MAPK but Not by p53 In Human Hepatocellular Carcinoma. Cancer Biology &
Therapy 5 (8), 978-985.
Graff, J.R., Konicek, B.W., Carter, J.H., and Marcusson, E.G. (2008). Targeting
the Eukaryotic Translation Initiation Factor 4E for Cancer Therapy. Cancer Res
68 (3), 631-634
Graner, E., Tang, D., Rossi, S., Baron, A., Migita, T., Weinstein, L.J.,
Lechpammer, M., Huesken, D., Zimmermann, D., Signoretti, S., and Massimo
Loda, M. (2004). The isopeptidase USP2a regulates the stability of fatty acid
synthase in prostate cancer. Cancer Cell 5, 253-261.
Grunt, T.W., Wagner, R., Grusch, M., Berger, W., Singer, C.F., Marian, B.,
Zielinski, C.C., and Ruth Lupu, R. (2009). Interaction between fatty acid
synthase- and ErbB-systems in ovarian cancer cells. Biochem. Biophys. Res.
Comm. 385 (3), 454 – 459.
References
122
Gwalter, J., Wang, M.L., Gout, I. (2009). The ubiquitination of ribosomal S6
kinases is independent from the mitogen-induced phosphorylation/activation of
the kinase. The International Journal of Biochemistry & Cell Biology 41, 828–
833.
Harbour, J.W., and Dean. D.C. (2000). The Rb/E2F pathway: expanding roles
and emerging paradigms. Genes Dev. 14, 2393-2409.
Heinonen, H., Nieminen, A., Saarela, M., Kallioniemi, A., Klefström, J.,
Hautaniemi, S., and Monni, O. (2008). Deciphering downstream gene targets of
PI3K/mTOR/p70S6K pathway in breast cancer. BMC Genomics 9 (348), 1471-
2164.
Hennan, J.G., Jen, J., Merlo, A., and Baylin, S.B. (1996). Hypermethylation-
associated Inactivation Indicates a Tumor Suppressor Role for P15INK4B1.
Cancer Research 56, 722-727.
Hennessy, B.T., Smith, D.L., Ram, P.T., Lu, Y., and Mills, G.B. (1996). Exploiting
the PI3K/AKT Pathway for Cancer Drug Discovery. Nature Reviews/Drug
Discovery 4, 988 -1004.
House, M.G., Guo, M.Z., Iacobuzio-Donahue, C., and Herman, J.G. (2003).
Molecular progression of promoter methylation in intraductal papillary mucinous
neoplasms (IPMN) of the pancreas. Carcinogenesis 24 (2), 193–198.
Huang, J., and Manning, B.D. (2009). A complex interplay between Akt, TSC2
and the two mTOR complexes. Biochem. Soc. Trans. 37, 217–222.
Jin Sungkwan, H., Lee, H., Woo, S., Seo, S., Choe, T., Yoo, D., Lee, S., Um, H.,
Lee, S.J., Park, M., Kim, J., Hong, S., Rhee, C., Park, I. (2007). Hypoxic
References
123
condition- and high cell density-induced expression of Redd1 is regulated by
activation of hypoxia-inducible factor-1α and Sp1 through the
phosphatidylinositol 3-kinase/Akt signaling pathway. Cellular Signalling 19,
1393–1403.
Karbowniczek, M., Robertson, G.P., and Henske, E.P. (2006). Rheb Inhibits C-
Raf Activity and B-Raf/C-Raf Heterodimerization. The Journal of Biological
Chemistry 281 (35), 25447–25456.
Katayama, K., Nakamura, A., Sugimoto, Y., Tsuruo, T., and Fujita, N. (2008).
FOXO transcription factor-dependent p15INK4b and p19INK4d expression.
Oncogene 27, 1677–1686.
Katsaros, D., Cho, W., Singal, R., Fracchioli, S., Rigault de la Longrais, I.A.,
Arisio, R., Massobrio, M., Smith, M., Zheng, W., Glass, J., Yu,H. (2004).
Methylation of tumor suppressor gene p16 and prognosis of epithelial ovarian
cancer. Gynecologic Oncology 94, 685–692.
Kelland, L.R. (2005). Emerging drugs for ovarian cancer. Expert Opin. Emerg.
Drugs. 10 (2), 413-424.
Kim, W.Y., and Sharpless, N.E. (2006). The Regulation of INK4/ARF in Cancer
and Aging. Cell 127, 265-275.
Knowles, L. M., and Smith, J.W. (2007). Genome-wide changes accompanying
knockdown of fatty acid synthase in breast cancer. BMC Genomics 8, 168 181.
Knowles, L.M., Axelrod, F., Browne, C.D., and Smith, J.W. (2004). A Fatty Acid
Synthase Blockade Induces Tumor Cell-cycle Arrest by Down-regulating Skp2.
The Journal of Biological Chemistry 279 (29), 30540–30545.
References
124
Knowles, L.M., Yang, C., Osterman, A., and Smith, J.W. (2008). Inhibition of
Fatty-acid Synthase Induces Caspase-8-mediated Tumor Cell Apoptosis by Up-
regulating DDIT4. The Journal of Biological Chemistry 283 (46), 31378–31384.
Lassus, H., Leminen, A., Vayrynen, A., Cheng, G., Gustafsson, J., Isola, J., and
Butzowa, R. (2004). ERBB2 amplification is superior to protein expression status
in predicting patient outcome in serous ovarian carcinoma. Gynecologic
Oncology 92, 31–39.
Lassus, H., Sihto, H., Leminen, A., Joensuu, H., Isola, J., Nupponen, N.N.,
Butzow, R. (2006). Gene amplification, mutation, and protein expression of
EGFR and mutations of ERBB2 in serous ovarian carcinoma. J Mol Med 84,
671–681.
Li, J., Gorospe, M., Chrest, F.J., Kumaravel, T.S., Evans, M.K., Han, W.F., and
Pizer, E.S. (2001). Pharmacological Inhibition of Fatty Acid Synthase Activity
Produces Both Cytostatic and Cytotoxic Effects Modulated by p53. Cancer
Research 61, 1493–1499.
Lim, S., GU, J., Kim, M.S., Soo Kim, H., Park, Y.N., Keun Park, C., Cho, J.W.,
Min Park, Y., and Jung, G. (2008). Epigenetic Changes Induced by Reactive
Oxygen Species in Hepatocellular Carcinoma: Methylation of the E-cadherin
Promoter. Gastroenterology 135, 2128–2140.
Little, J.L., Wheeler, F.B., Fels, D.R., Koumenis, C., and Kridel, S.J. (2007).
Inhibition of Fatty Acid Synthase Induces Endoplasmic Reticulum Stress in
Tumor Cells. Cancer Res. 67 (3), 1262-1269.
Little, J.L., Wheeler, F.B., Koumenis, C., and Kridel; S.J. (2008). Disruption of
crosstalk between the fatty acid synthesis and proteasome pathways enhances
References
125
unfolded protein response signaling and cell death. Mol. Cancer Ther. 7, 3816-
3824.
Liu, W., 1, Innocenti, F., Wu, M.H., Desai, A.A., Dolan, M.E., Cook, E.H., and
Ratain, M.R. (2005). A Functional Common Polymorphism in a Sp1 Recognition
Site of the Epidermal Growth Factor Receptor Gene Promoter. Cancer Res. 65
(1), 46-53.
Liu, Z., 2, Wang, L.E., Wang, L., Lu, K.H., Mills, G.B., Bondy, M.L., and Qingyi
Wei, Q. (2005). Methylation and Messenger RNAExpression of p15INK4b but
Not p16INK4a Are Independent Risk Factors for Ovarian Cancer. Clin. Cancer
Res. 11 (13), 4968-4976.
Lu, Z., Liu, D., Hornia, A., Devonish, W., Pagano, M., and Foster; D.A. (1998).
Activation of Protein Kinase C Triggers Its Ubiquitination and Degradation.
Molecular and Cellular Biology 18 (2), 839–845.
Lupu, R., Menendez, J.A. (2006). Pharmacological inhibitors of Fatty Acid
Synthase (FASN)--catalyzed endogenous fatty acid biogenesis: a new family of
anti-cancer agents? Curr. Pharm. Biotechnol. 7 (6), 483-93. Review
Malumbres, M., and Barbacid, M. (2001). To Cycle or Not to Cycle: A Critical
Decision in Cancer. Nature/Reviews/Cancer 1, 222-231.
Malumbres, M., Carnero, A. (2003). Cell cycle deregulation: a common motif in
cancer. Prog. Cell Cycle Res. 5, 5-18 Review.
Manning, B.D., Tee, A.R., Logsdon, M.N., Blenis, J., and Cantley, L.C. (2002).
Identification of the Tuberous Sclerosis Complex-2 Tumor Suppressor Gene
References
126
Product Tuberin as a Target of the Phosphoinositide 3-Kinase/Akt Pathway.
Molecular Cell 10, 151–162.
Mazzarelli, P., Pucci, S., Bonanno, E., Sesti; F., Calvani, M., Spagnoli, L.G.
(2007). Carnitine Palmitoyltransferase I in Human Carcinomas Novel Role in
Histone Deacetylation? Cancer Biology and Therapy 6 (10), 1606-1613.
Medema, R.H., Kops, G.J.P.L., Bos, J.L., and Burgering, B.M.T. (2000). AFX-like
Forkhead transcription factorsmediate cell-cycle regulation by Ras and PKB
through p27kip1. Nature 404, 782-787.
Menendez, J.A., and Lupu, R. (2007). Fatty acid synthase and the lipogenic
phenotype in cancer pathogenesis. Nature Reviews 7, 763-777.
Menendez, J.A., 1, Lupu, R. (2005). RNA interference-mediated silencing of the
p53 tumor-suppressor protein drastically increases apoptosis after inhibition of
endogenous fatty acid metabolism in breast cancer cells. Int. J. Mol. Med. 15 (1),
33-40.
Menendez, J.A., 2, Vellon, L., and Lupu, R. (2005). Orlistat: From Antiobesity
Drug to Anticancer Agent in Her-2/neu (erbB-2)-Overexpressing Gastrointestinal
Tumors?, Society for Experimental Biology and Medicine 230, 151-154.
Menendez, J.A., 3, Vellon, L., and Lupu, R. (2005). Targeting fatty acid
synthase-driven lipid rafts: a novel strategy to overcome trastuzumab resistance
in breast cancer cells. Medical Hypotheses 64, 997–1001.
Menendez, J.A., 4, Mehmi, I., Atlas, E., Colomer, R., Lupu, R. (2004). Novel
signaling molecules implicated in tumor-associated fatty acid synthase-
dependent breast cancer cell proliferation and survival: Role of exogenous
References
127
dietary fatty acids, p53-p21WAF1/CIP1, ERK1/2 MAPK, p27KIP1, BRCA1, and
NF-kappaB. Int. J. Oncol. 24 (3), 591-608.
Menendez, J.A., 5, Vellon, L., Mehmi, I., Oza, B.P., Ropero, S., Colomer, R., and
Lupu, R. (2004). Inhibition of fatty acid synthase (FAS) suppresses HER2_neu
(erbB-2) oncogene overexpression in cancer cells. PNAS, 101 (29), 10715–
10720.
Meng, Q., Xia, C., Fang, J., Rojanasakul, Y., Jiang, B. (2006). Role of PI3K and
AKT specific isoforms in ovarian cancer cell migration, invasion and proliferation
through the p70S6K1 pathway. Cellular Signalling 18, 2262–2271.
Nagy, P., Vereb, G., Sebestyén, Z., Horváth, G., Lockett, S.J., Damjanovich, S.,
Park, J.W., Jovin, T.M., and Szöllo, J. (2002). Lipid rafts and the local density of
ErbB proteins influence the biological role of homo- and heteroassociations of
ErbB2. Journal of Cell Science 115 (22), 4251-4262.
Nave, B.T., Ouwens, D.M., Withers, D.J., Alessi, D.R., and Shepherd,
P.R.(1999). Mammalian target of rapamycin is a direct target for protein kinase
B: identification of a convergence point for opposing effects of insulin and amino-
acid deficiency on protein translation. Biochem. J. 344, 427-431.
Obrig, T.G., Culp, W.J., McKeehan, W.L., and Hardesty, B. (1971). The
Mechanism by which Cycloheximide and Related Glutarimide Antibiotics Inhibit
Peptide Synthesis on Reticulocyte Ribosomes. The Journal of Biological
Chemistry 246 (1), 174-181.
Olayioye, M.A., Neve, R.M., Lane, H.A., Hynes, N.E. (2000). The ErbB signalling
network: receptor heterodimerization in development and cancer. The EMBO
Journal 19 (13), 3159-3167.
References
128
Oncologychannel (2007): FIGO System & TNM System. Northampton (USA).
Online source – website last visited on 25.07.2009:
http://www.oncologychannel.com/ovariancancer/figo-system-tnm-system.shtml
Paumen, M.B., Ishida, Y., Han, H., Muramatsu, M., Eguchi, Y. Tsujimoto, Y., and
Honjo, T. (1997). Direct Interaction of the Mitochondrial Membrane Protein
Carnitine Palmitoyltransferase I with Bcl-2. Biochemical and Biophysical
Research Communications 231, 523–525.
Pizer, E.S., Thupari, J., Han, W.F., Pinn, M.L., Chrest, F.J., Frehywot,G.L.,
Townsend, C.A., and Kuhajda, F.P. (2000). Malonyl-Coenzyme-A Is a Potential
Mediator of Cytotoxicity Induced by Fatty-Acid Synthase Inhibition in Human
Breast Cancer Cells and Xenografts. Cancer Research 60, 213–218.
Pizer, E.S., Wood, F.D., Heine, H.S., Romantsev,F.E., Pasternack, G.R., and
Kuhajda, F.P. (1996). Inhibition of Fatty Acid Synthesis Delays Disease
Progression in a Xenograft Model of Ovarian Cancer Cancer Research 56, 1189-
1193.
Price, A.C., Choi, K., Heath, R.J., Li, Z., White, S.W., and Rock, C.O. (2001).
Inhibition of b-Ketoacyl-Acyl Carrier Protein Synthases by Thiolactomycin and
Cerulenin – Structure and Mechanim. The Journal of Biological Chemistry 276
(9), 6551–6559.
Pullen, N., Thomas, G. (1997). The modular phosphorylation and activation of
p70s6k. FEBS Letters 410, 78-82.
Rathi, A., Virmani, A.K., Schorge, J.O., Elias, K.J., Maruyama, R., Minna, J.D.,
Mok, S.C., Girard, L., Fishman, D.A., and Gazdar, A.F. (2002). Methylation
References
129
Profiles of Sporadic Ovarian Tumors and nonmalignant Ovaries from High-Risk
Women. Clinical Cancer Research 8, 3324–3331.
Reibenwein, J., Krainer, M. (2008). Targeting signaling pathways in ovarian
cancer. Expert Opin.Ther. Targets 12 (3), 353-365.
Rendina, A.R., and Cheng, D. (2005). Characterization of the inactivation of rat
fatty acid synthase by C75: inhibition of partial reactions and protection by
substrates. Biochem. J. 388, 895–903.
Roder, K., Wolf, S.S., Larkin, K.J., Schweizer, M. (1999). Interaction between the
two ubiquitously expressed transcription factors NF-Y and Sp1. Gene 234, 61–
69.
Rodríguez-González, A., Ramírez de Molina, A., Bañez-Coronel, M., Megias, D.,
Lacal, J.C. (2005). Inhibition of choline kinase renders a highly selective
cytotoxic effect in tumour cells through a mitochondrial independent mechanism.
Int. J. Oncol. 26 (4), 999-1008.
Sarbassov, D.D., Ali, S.M., Sengupta, S., Sheen, J., Hsu, P.P., Bagley, A.F.
Markhard, A.L., and Sabatini, D.M. (2006). Prolonged Rapamycin Treatment
Inhibits mTORC2 Assembly and Akt/PKB. Molecular Cell 22, 159–168.
Scherz-Shouval, R., Shvets, E., Fass, E., Shorer, H., Gil, L., and Elazar, Z.
(2007). Reactive oxygen species are essential for autophagy and specifically
regulate the activity of Atg4. The EMBO Journal 26, 1749–1760.
Shayesteh, L., Lu, Y., Kuo, W., Baldocchi, R., Godfrey, T., Collins, C., Pinkel, D.,
Powell, B., Mills, G.B., and Gray, J.W. (1999). PIK3CA is implicated as an
oncogene in ovarian cancer. Nature Genetics 21, 99-102.
References
130
Stephens, L., Anderson, K., Stokoe, D., Erdjument-Bromage, H., Painter, G.F.,
Holmes, A.B., Gaffney, P.R.J., Reese, C.B., McCormick, F., Tempst, P.,
Coadwell, J., Hawkins, P.T. (1998). Protein Kinase B Kinases That Mediate
Phosphatidylinositol 3,4,5-Trisphosphate– Dependent Activation of Protein
Kinase B. Science 279, 710-714.
Stirzaker, C., Millar, D.S., Paul, C.L., Warnecke, P.M., Harrison, J., Vincent, P.C.
Frommer, M., and Clark, S.J. (1997). Extensive DNA Methylation Spanning the
Rb Promoter in Retinoblastoma Tumors. Cancer Research 57, 2229-2237.
Strathdee, G., Appleton, K., Illand, M., Millan, D.W.M., Sargent, J., Paul, J., and
Brown, R. (2001). Primary Ovarian Carcinomas Display Multiple Methylator
Phenotypes Involving Known Tumor Suppressor Genes. American Journal of
Pathology 158 (3), 1121-1127.
Swinnen, J.V., Van Veldhoven, P.P., Timmermans, L., De Schrijver, E.,
Brusselmans, K., Vanderhoydonc, F., Van de Sande, T., Heemers, H., Heyns,
W., and Verhoevena, G. (2003). Fatty acid synthase drives the synthesis of
phospholipids partitioning into detergent-resistant membrane microdomains.
Biochemical and Biophysical Research Communications 302, 898–903.
Tam, K.F., Liu, V. W. S., Liu, S. S., Tsang, P. C. K., Cheung, A. N. Y., Yip, A. M.
W., Ngan H. Y. S. (2007). Methylation profile in benign, borderline and malignant
ovarian tumors. J. Cancer Res. Clin. Oncol. 133, 331–341.
Thupari, J.N., Pinn, M.L., and Kuhajda, F.P. (2001). Fatty Acid Synthase
Inhibition in Human Breast Cancer Cells Leads to Malonyl-CoA-Induced
Inhibition of Fatty Acid Oxidation and Cytotoxicity. Biochemical and Biophysical
Research Communications 285, 217–223.
References
131
Wakil, S.J., and Chirala, S.S. (2004). Structure and Function of Animal Fatty Acid
Synthase. Lipids 39 (11), 1045-1053.
Wang, H.Q., Altomare, D.A., Skele, K.L., Poulikakos, P.I., Kuhajda, F.P., Di
Cristofano, A., and Testa, J.R. (2005). Positive feedback regulation between
AKT activation and fatty acid synthase expression in ovarian carcinoma cells.
Oncogene 24, 3574–3582.
Wang, M., Panasyuk, G., Gwalter, J., Nemazanyy, I., Fenton, T., Filonenko, V.,
Gout, I. (2008). Regulation of ribosomal protein S6 kinases by ubiquitination.
Biochemical and Biophysical Research Communications 369, 382–387.
Wang, X., Lin, J., Chen, Y., Zhong, W., Zhao, G., Liu, ., Li, S., Wang, L., Li, S.
(2009). Novel fatty acid synthase (FAS) inhibitors: Design, synthesis, biological
evaluation, and molecular docking studies. Bioorganic & Medicinal Chemistry 17,
1898–1904.
Wellen, K.E., Hatzivassiliou, G., Sachdeva, U.M., Bui, T.V., Cross, J.R.,
Thompson, C.B. (2009). ATP-Citrate Lyase Links Cellular Metabolism to Histone
Acetylation. Science 324, 1076-1080.
Wong, Y.F., Chung, T.K.H., Cheung, T.H., Nobori, T., Yim, S.F., Lai, K.W.H, Yu,
A.l., Diccianni, M.B., Li, T.Z., Chang, A.M.Z. (1997). p16INK4 and p15INK4B
Alterations in Primary Gynecologic Malignancy. Gynecologic Oncology 65, 319–
324.
Yuecheng; Y., Hongmei, L., Xiaoyan, X. (2006). Clinical evaluation of E-cadherin
expression and its regulation mechanism in epithelial ovarian cancer. Clin. Exp.
Metastasis 23, 65–74.

References
132
Zipper, H., Brunner, H., Bernhagen, J., and Vitzthum, F. (2004). Investigations
on DNA intercalation and surface binding by SYBR Green I, its structure
determination and methodological implications. Nucleic Acids Research 32 (12),
e103, 1-10

133
Curriculum Vitae
Familienname: Tomek
Vorname: Katharina
Geburtsdatum: 22. September 1980
Geburtsort: Hainburg/Donau
Nationalität: Österreich
Familienstand: ledig
Schulbildung:
1995 – 1999 Oberstufenrealgymnasium Wr. Neustadt
1999 – 2002 Akademie für den Med. Techn. Laboratoriumsdienst 2002 - 2009 Universität Wien, Studienrichtung: Molekularbiologie
Berufserfahrung/Praktika während des Studiums:
Feb.03 -März 06: Inst. für Onkologie, Innere Med. I, AKH-Wien
Prof. Thomas W. Grunt, Signaling Networks Program
Juli-August 2007: Max F. Perutz Laboratories, University of Vienna
Prof. Baccarini, „Function of MAPK-Pathway in Differentiation Process in
Keratinozytes”
Sept. 2007: Department of Medical Biochemistry, Division of Molecular Genetics,
Medizinische Universität
Prof. Schneider, „Microglial Clusterin may be the missing link between
LR11 and ß-Amyloid in Alzheimer disease prevention”
März-April 2008: Institute of Molecular Cell Biology, University of Vienna
Prof. Wiche, „Phosphorylation of Plec1f may result in Disassembly of
Focal Adhesions”
Seit August 2008: Diplomarbeit am Inst. für Onkologie, Innere Med. I, AKH-Wien
Prof. Thomas W. Grunt, „Effects of Fatty Acid Synthase Inhibitor C75 in
Ovarian Cancer”
Curriculum Vitae
134
Sprachkenntnisse: Deutsch (Muttersprache), Englisch (fließend)
EDV-Kenntnisse: Microsoft Office Produkte, diverse Bild-Auswertungsprogramme
Kontakt: E-mail: [email protected]
Publikationen:
1. GRUNT, T.W., PUCKMAIER, K., TOMEK, K., KAINZ, B., GAIGER, A., : An EGFR
inhibitor induces RAR-beta expression in breast and ovarian cancer cells. Proc. AACR,
Anaheim, CA, 46, Abstr.# 1513, 2005
2. GRUNT, T.W., TOMEK, K., PUCKMAIER, K., KAINZ, B., GAIGER, A., ZIELINSKI, C.C.,
The Epidermal Growth Faktor-Receptor Inhibitor PD 153035 Upregulates Retinoic Acid
Receptor-beta by Epigenetic Mechanisms. Proc. AACR, Washington, DC, 47, Abstr.#
1248, 2006
3. GRUNT, T.W., TOMEK, K., WAGNER, R., PUCKMAIER, K., KAINZ, B., RUENZLER, D.,
GAIGER, A., KOEHLER, G., ZIELINSKI, C.C., : Effects of Epidermal Growth Factor-
Receptor Inhibitors that are not Mediated by Blockade of ErbB Pathways. 14th
International Conference of the International Society of Differentiation (ISD), Oct 7-11,
2006, Innsbruck, Austria; Differentiation, 74, 460, Abstr.# 040, 2006
4. GRUNT, T.W., WAGNER, R., TOMEK, K., PUCKMAIER, K., ZIELINSKI, C.C.: The
Epidermal Growth Factor-Receptor Inhibitor PD153035 Induces Retinoic Acid Receptor-
beta by Intercalation into DNA. 14th International Conference of the International Society
of Differentiation (ISD), Oct 7-11, 2006, Innsbruck, Austria; Differentiation, 74, 467,
Abstr.# P64, 2006.
5. GRUNT, T.W., WAGNER, R., TOMEK, K., PUCKMAIER, K., ZIELINSKI, C.C.: There is
more to some EGF receptor inhibitors – PD153035 reveals triple action: EGF receptor
inhibition, DNA – intercalation, RAR-beta induction. Proc. AACR, Los Angeles, CA,
submitted, 2007-02-27