Embed Size (px)
Citation preview
MICRODIS Working Paper Series
2008-September-30
Contextual Reports
on Survey Sites
Citizens' Disaster Response Center Philippines
C R E D
Centre for Research on
the Epidemiology of
Disasters (CRED)
School of Public Health,
Catholic University of
Louvain
Brussels, Belgium
D5.2.2 ‐ Contextual Reports on survey sites FINAL 2
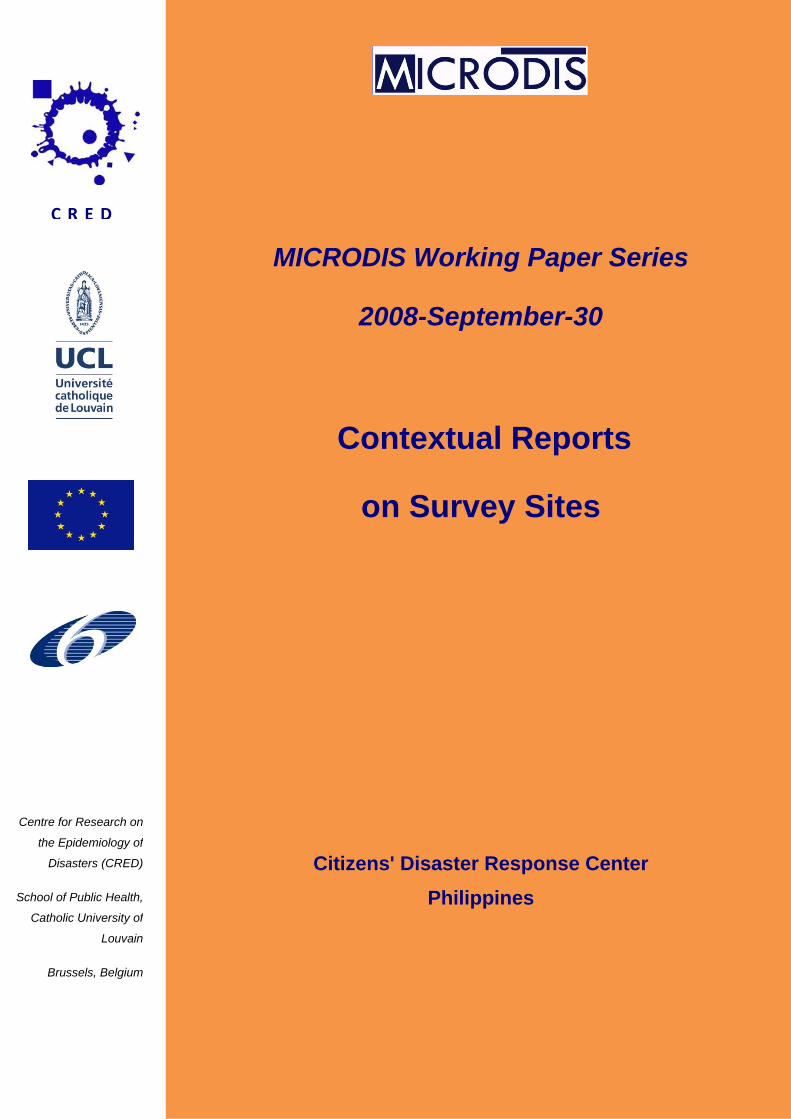
Table of Contents
Sections Page
List of Figures and Tables 3 1. Indonesia 5
1.1. Bojonegoro 5 2. Philippines 12
2.1. Southern Leyte 13 2.2. Albay 17
3. Vietnam 21 3.1. Thua Thien Hue 21
4. India 27 4.1. Orissa 29 4.2. West Bengal 35 4.3. Bahraich 42
5. France 44 5.1. Durban Corbieres 45 5.2. Aramon, Gard 53 6. United Kingdom 58 6.1. South Yorkshire 59 6.2. Gloucestershire 71 Refrences 81
List of Figures and Tables
Figures Page Figure 1. Bojonegoro Map 6 Figure 2. Southern Leyte Location Map 14 Figure 3. Southern Leyte Map 14 Figure 4. Albay Map 18 Figure 5. Thua Thien Hue Location Map 22 Figure 6. Thua Thien Hue Map 23 Figure 7. Distribution of historical floods (warning level 3) in some 25 provinces (1990‐2003) Figure 8. Distribution of the total deaths of disasters by provinces 26 (1979‐2001) Figure 9. Map of India 27 Figure 10. Map of Orissa 30 Figure 11. Map of Jagatsinghpur District 31 Figure 12. West Bengal Location Map 36 Figure 13. West Bengal Map 36 Figure 14. Bahraich Map 43
D5.2.2 ‐ Contextual Reports on survey sites FINAL 3
Figure 15. Durban Corbieres Location Map 45 Figure 16. Map of the Berre River watershed 47 Figure 17. Population Statistics 48 Figure 18. Durban‐Corbieres is located in few densely populated populated areas 48 Figure 19. Chronicles of floods in the Aude River (1840‐2007) 50 Figure 20. Distribution of rain depths during 1999’s floods 51 Figure 21. Damage due to 1999 and 2002 floods in Southern France 52 Figure 22. Aramon, Gard Location Map 54 Figure 23. Distribution of companies according to activity sectors 56 Figure 24. Private sector jobs, wage earners 57 Figure 25. UK survey sites location map 58 Figure 26. Sheffield’s river system and position of hills (indicated by numbers) 59 Figure 27. Topography of Sheffield MDC (Metropolitan District Council) 60 Figure 28. Population Pyramid for Sheffield 62 Figure 29. Flood Risk Map Sheffield 67 Figure 30. Percentage departure from average rainfall during June and July 2007 68 Figure 31. Maximum 24‐hour and monthly average rainfall values during the exceptional June and July rainfall events in three example locations across the UK 69 Figure 32. UK rainfall 2004‐2007 as percentage of monthly average rainfall 69 Figure 33. Extent of flooding in the UK during June and July 2007 70 Figure 34. Location of Tewkesbury in relation to the rivers Avon and Severn 72 Figure 35. Population Pyramid for Tewkesbury 74 Figure 36. Modelled potential flood extents around Tewkesbury 79 Figure 37. Extent of July 2007 flooding in Tewkesbury 80 Tables Page Table 1. Population by Age Classification, Bojonegoro District 7 Table 2. Bojonegoro Population, 2006 7 Table 3. Number of Establishment and Employee by Sector, 2004‐2006 8 Table 4. Number of Health Facilities, 2003‐2005 9 Table 5. Number of Visitors at Hospital, 2003‐2005 10 Table 6. Education Facilities, 2003‐2005 10 Table 7. Civil Worker by Education, 2004 – 2006 10 Table 8. Village Head by Education Level, 2004 – 2006 11 Table 9. Population by Religion, 2003‐2005 11 Table 10. Frequency of Natural Disasters by Type, 2003‐2005 12 Table 11. Economic Statistics 19 Table 12. Health Statistics 20 Table 13. Social and Economic aspects in 2002 24 Table 14. Summary of occupational structure 24 Table 15. Population of Jagatsinghpur District 31 Table 16. Summary of Recent Disasters in the district 34 Table 17. Population (2001 Census) 37 Table 18. Sex Ratio (Females per 1000 Males) 37 Table 19. Annual Growth Rate (1991‐2001) 37
D5.2.2 ‐ Contextual Reports on survey sites FINAL 4
Table 20. Population Density 37 Table 21. Population Rural Urban (2001) 37 Table 22. Other Population Data 37 Table 23. Main Industries 38 Table 24. On Bidi Industries 39 Table 25. Production in Sericulture Industry in the district of Murshidabad 39 Table 26. No. of Working Population and % of total Population 39 Table 27. Break up of Main + Marginal workers 39 Table 28. Medical Facilities 40 Table 29. Percentage of Children suffering from Malnutrition 40 Table 30. Vaccination Coverage in West Bengal 40 Table 31. No. of schools present 41 Table 32. Primary Education 41 Table 33. Literacy Rate (% in respect of total population Excluding 0‐6 population) 41 Table 34. Income level and distribution of working population in Durban‐Corbieres 49 Table 35. Employment and income in Aramon 55 Table 36. Housing and cars in Aramon 55 Table 37. Household Sizes in Sheffield 60 Table 38. Types of Dwellings in Sheffield 61 Table 39. Economic activity in Sheffield 63 Table 40. Industry of employment 63 Table 41. Job growth in Sheffield 1995‐2005 64 Table 42: Religious affiliations of the population in Sheffield 65 Table 43: Ethnic Composition of Sheffield 66 Table 44. Household Sizes in Tewkesbury 73 Table 45. Types of Dwellings in Tewkesbury 73 Table 46. Economic activity in Tewkesbury 75 Table 47. Industry of employment 75 Table 48. Religious affiliations of the population 77 Table 49. Ethnic Composition of Survey Sites 77 Table 50. Summary of July floods in Tewkesbury 79
D5.2.2 ‐ Contextual Reports on survey sites FINAL 5
The MICRODIS project (Integrated Health, Social and Economic Impacts of Extreme Events: Evidence, Methods and Tools) has chosen eleven (11) sites for the survey. These sites are:
1. Bojonegoro, Indonesia 2. Southern Leyte, Philippines 3. Albay, Philippines 4. Thua Thien Hue, Vietnam 5. Orissa, India 6. West Bengal, India 7. Bahraich, India 8. Durban Corbieres, France 9. Aramon, Gard, France 10. South Yorkshire, United Kingdom 11. Gloucestershire, United Kingdom
1. Indonesia
The Republic of Indonesia, a country located in Southeast Asia, is the world's largest archipelagic state with 17,508 islands. With a population of 222 million people in 2006, it is the world's fourth most populous country and the most populous Muslim‐majority nation. Indonesia is a republic, with an elected parliament and president. The nation's capital city is Jakarta. The country shares land borders with Papua New Guinea, East Timor and Malaysia. The Indonesian archipelago has been an important trade region since at least the seventh century, when the Srivijaya Kingdom traded with China and India. Indonesian history has been influenced by foreign powers drawn to its natural resources. Muslim traders brought Islam, and European powers fought one another to monopolize trade in the Spice Islands of Maluku during the Age of Discovery. Following three and a half centuries of Dutch colonialism, Indonesia secured its independence after World War II.
Across its many islands, Indonesia consists of distinct ethnic, linguistic, and religious groups. The Javanese are the largest and most politically dominant ethnic group. Despite its large population and densely populated regions, Indonesia has vast areas of wilderness that support the world's second highest level of biodiversity.
1.1. Bojonegoro Regency
The particular survey site chosen for the MICRODIS study in Indonesia is Bojonegoro, a regency in East Java. Bojonegoro is located in the inland part of northern Java plain on the banks of the Bengawan Solo River (the largest river in Java).
D5.2.2 ‐ Contextual Reports on survey sites FINAL 6
1.1.1. Geography
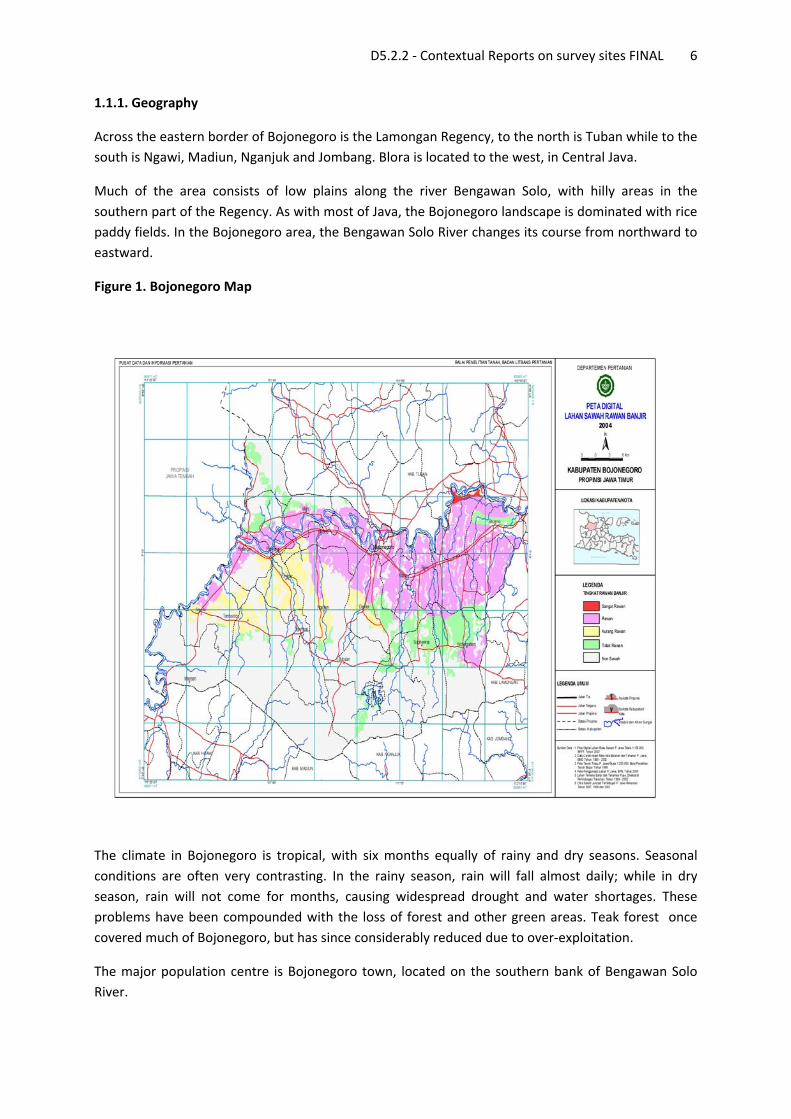
Across the eastern border of Bojonegoro is the Lamongan Regency, to the north is Tuban while to the south is Ngawi, Madiun, Nganjuk and Jombang. Blora is located to the west, in Central Java.
Much of the area consists of low plains along the river Bengawan Solo, with hilly areas in the southern part of the Regency. As with most of Java, the Bojonegoro landscape is dominated with rice paddy fields. In the Bojonegoro area, the Bengawan Solo River changes its course from northward to eastward.
Figure 1. Bojonegoro Map
The climate in Bojonegoro is tropical, with six months equally of rainy and dry seasons. Seasonal conditions are often very contrasting. In the rainy season, rain will fall almost daily; while in dry season, rain will not come for months, causing widespread drought and water shortages. These problems have been compounded with the loss of forest and other green areas. Teak forest once covered much of Bojonegoro, but has since considerably reduced due to over‐exploitation.
The major population centre is Bojonegoro town, located on the southern bank of Bengawan Solo River.
D5.2.2 ‐ Contextual Reports on survey sites FINAL 7
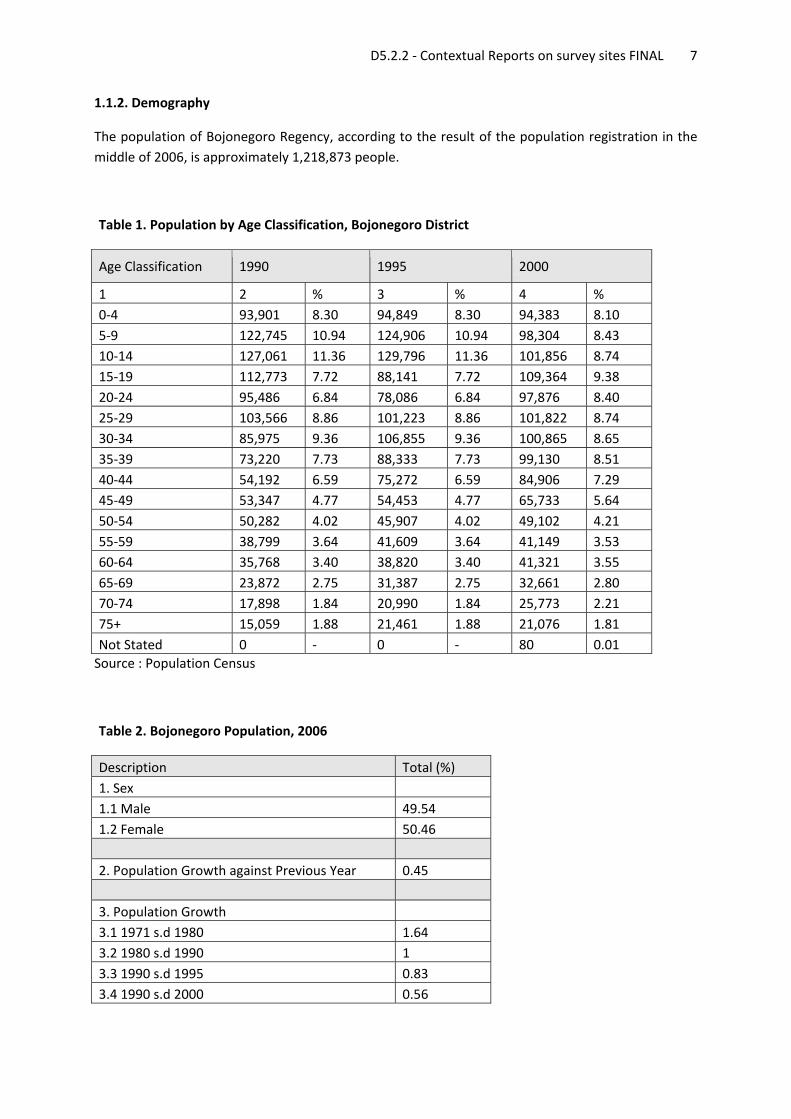
1.1.2. Demography
The population of Bojonegoro Regency, according to the result of the population registration in the middle of 2006, is approximately 1,218,873 people.
Table 1. Population by Age Classification, Bojonegoro District
Age Classification 1990 1995 2000
1 2 % 3 % 4 % 0‐4 93,901 8.30 94,849 8.30 94,383 8.10 5‐9 122,745 10.94 124,906 10.94 98,304 8.43 10‐14 127,061 11.36 129,796 11.36 101,856 8.74 15‐19 112,773 7.72 88,141 7.72 109,364 9.38 20‐24 95,486 6.84 78,086 6.84 97,876 8.40 25‐29 103,566 8.86 101,223 8.86 101,822 8.74 30‐34 85,975 9.36 106,855 9.36 100,865 8.65 35‐39 73,220 7.73 88,333 7.73 99,130 8.51 40‐44 54,192 6.59 75,272 6.59 84,906 7.29 45‐49 53,347 4.77 54,453 4.77 65,733 5.64 50‐54 50,282 4.02 45,907 4.02 49,102 4.21 55‐59 38,799 3.64 41,609 3.64 41,149 3.53 60‐64 35,768 3.40 38,820 3.40 41,321 3.55 65‐69 23,872 2.75 31,387 2.75 32,661 2.80 70‐74 17,898 1.84 20,990 1.84 25,773 2.21 75+ 15,059 1.88 21,461 1.88 21,076 1.81 Not Stated 0 ‐ 0 ‐ 80 0.01 Source : Population Census
Table 2. Bojonegoro Population, 2006
Description Total (%) 1. Sex 1.1 Male 49.54 1.2 Female 50.46 2. Population Growth against Previous Year 0.45 3. Population Growth 3.1 1971 s.d 1980 1.64 3.2 1980 s.d 1990 1 3.3 1990 s.d 1995 0.83 3.4 1990 s.d 2000 0.56
D5.2.2 ‐ Contextual Reports on survey sites FINAL 8
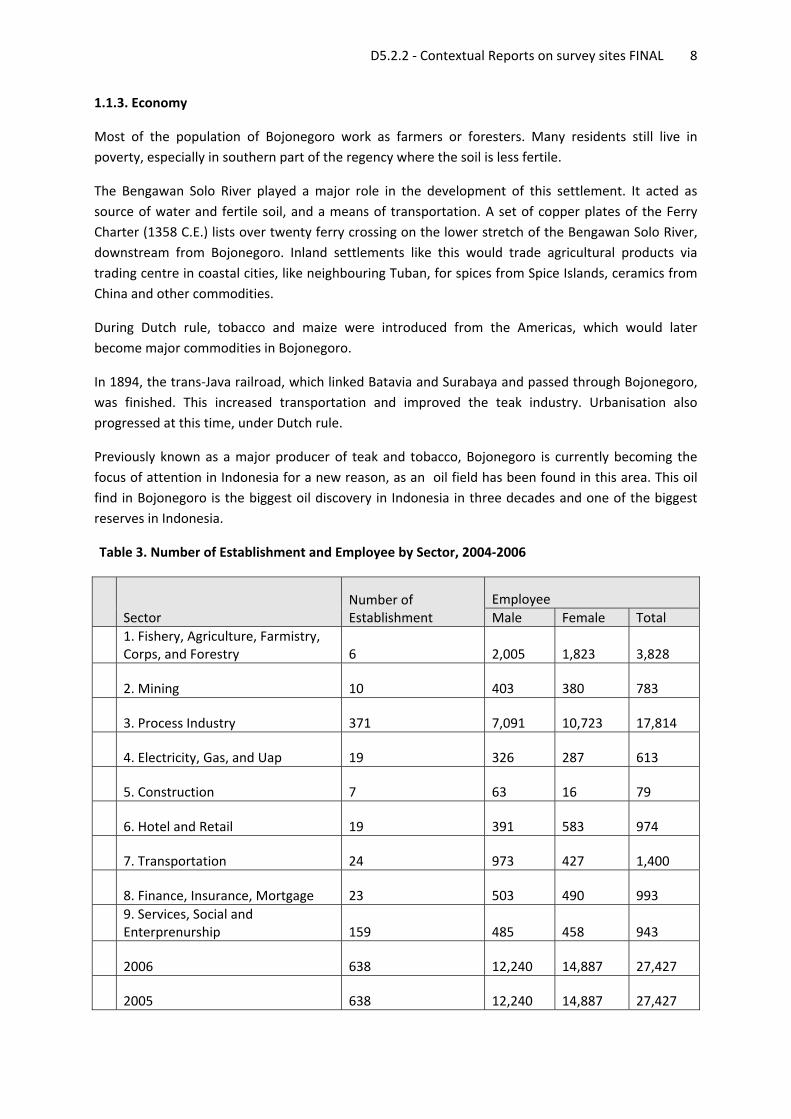
1.1.3. Economy
Most of the population of Bojonegoro work as farmers or foresters. Many residents still live in poverty, especially in southern part of the regency where the soil is less fertile.
The Bengawan Solo River played a major role in the development of this settlement. It acted as source of water and fertile soil, and a means of transportation. A set of copper plates of the Ferry Charter (1358 C.E.) lists over twenty ferry crossing on the lower stretch of the Bengawan Solo River, downstream from Bojonegoro. Inland settlements like this would trade agricultural products via trading centre in coastal cities, like neighbouring Tuban, for spices from Spice Islands, ceramics from China and other commodities.
During Dutch rule, tobacco and maize were introduced from the Americas, which would later become major commodities in Bojonegoro.
In 1894, the trans‐Java railroad, which linked Batavia and Surabaya and passed through Bojonegoro, was finished. This increased transportation and improved the teak industry. Urbanisation also progressed at this time, under Dutch rule.
Previously known as a major producer of teak and tobacco, Bojonegoro is currently becoming the focus of attention in Indonesia for a new reason, as an oil field has been found in this area. This oil find in Bojonegoro is the biggest oil discovery in Indonesia in three decades and one of the biggest reserves in Indonesia.
Table 3. Number of Establishment and Employee by Sector, 2004‐2006
Sector
Number of Establishment
Employee Male Female Total
1. Fishery, Agriculture, Farmistry, Corps, and Forestry 6 2,005 1,823 3,828
2. Mining 10 403 380 783
3. Process Industry 371 7,091 10,723 17,814
4. Electricity, Gas, and Uap 19 326 287 613
5. Construction 7 63 16 79
6. Hotel and Retail 19 391 583 974
7. Transportation 24 973 427 1,400
8. Finance, Insurance, Mortgage 23 503 490 993
9. Services, Social and Enterprenurship 159 485 458 943
2006 638 12,240 14,887 27,427
2005 638 12,240 14,887 27,427
D5.2.2 ‐ Contextual Reports on survey sites FINAL 9
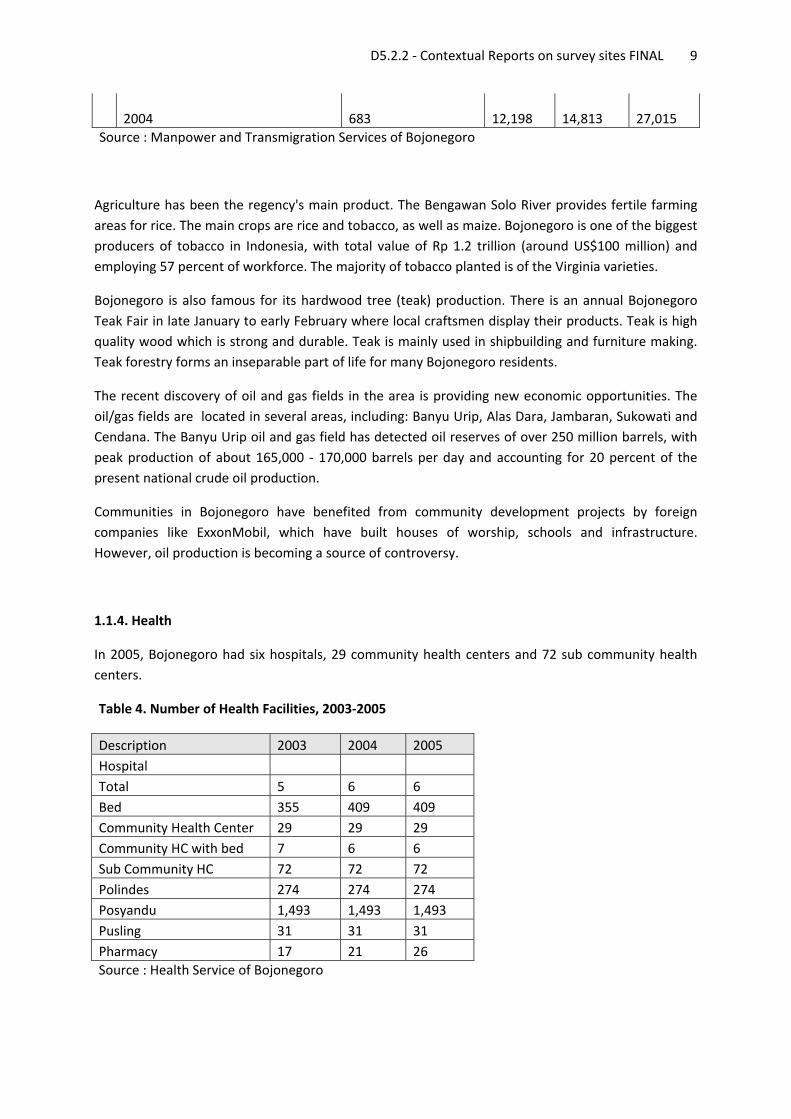
2004 683 12,198 14,813 27,015
Source : Manpower and Transmigration Services of Bojonegoro
Agriculture has been the regency's main product. The Bengawan Solo River provides fertile farming areas for rice. The main crops are rice and tobacco, as well as maize. Bojonegoro is one of the biggest producers of tobacco in Indonesia, with total value of Rp 1.2 trillion (around US$100 million) and employing 57 percent of workforce. The majority of tobacco planted is of the Virginia varieties.
Bojonegoro is also famous for its hardwood tree (teak) production. There is an annual Bojonegoro Teak Fair in late January to early February where local craftsmen display their products. Teak is high quality wood which is strong and durable. Teak is mainly used in shipbuilding and furniture making. Teak forestry forms an inseparable part of life for many Bojonegoro residents.
The recent discovery of oil and gas fields in the area is providing new economic opportunities. The oil/gas fields are located in several areas, including: Banyu Urip, Alas Dara, Jambaran, Sukowati and Cendana. The Banyu Urip oil and gas field has detected oil reserves of over 250 million barrels, with peak production of about 165,000 ‐ 170,000 barrels per day and accounting for 20 percent of the present national crude oil production.
Communities in Bojonegoro have benefited from community development projects by foreign companies like ExxonMobil, which have built houses of worship, schools and infrastructure. However, oil production is becoming a source of controversy.
1.1.4. Health
In 2005, Bojonegoro had six hospitals, 29 community health centers and 72 sub community health centers.
Table 4. Number of Health Facilities, 2003‐2005
Description 2003 2004 2005 Hospital Total 5 6 6 Bed 355 409 409 Community Health Center 29 29 29 Community HC with bed 7 6 6 Sub Community HC 72 72 72 Polindes 274 274 274 Posyandu 1,493 1,493 1,493 Pusling 31 31 31 Pharmacy 17 21 26 Source : Health Service of Bojonegoro
D5.2.2 ‐ Contextual Reports on survey sites FINAL 10
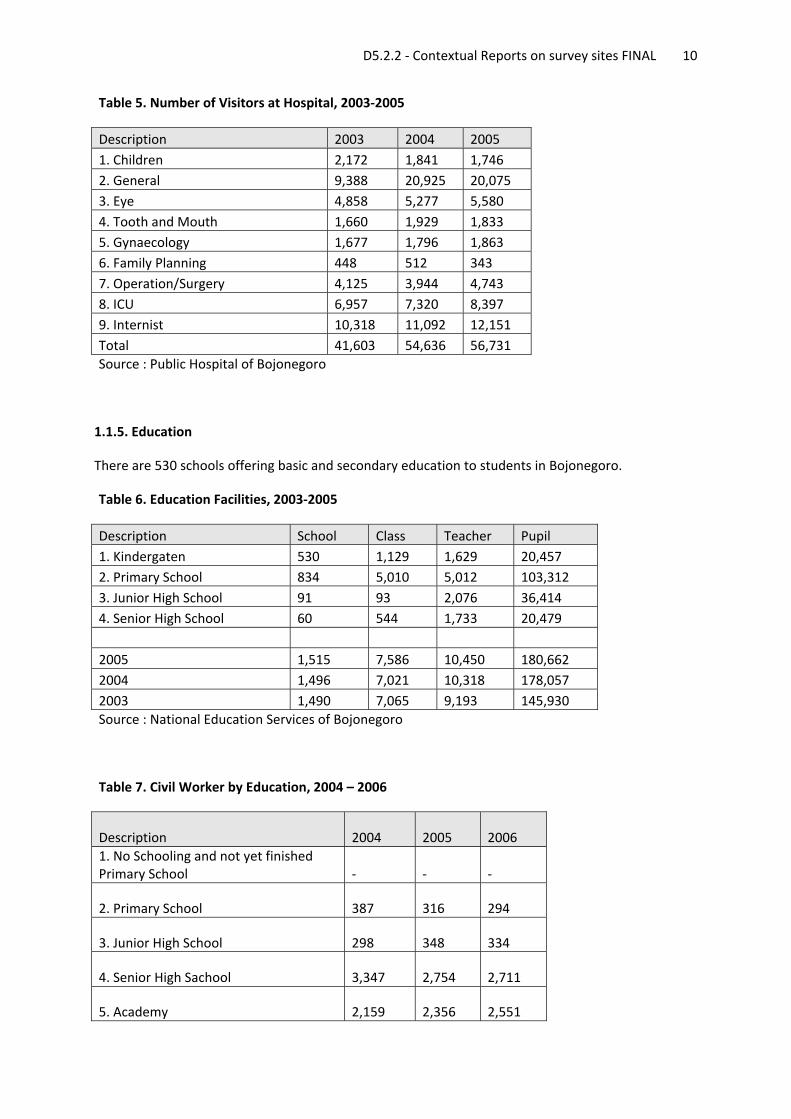
Table 5. Number of Visitors at Hospital, 2003‐2005
Description 2003 2004 2005 1. Children 2,172 1,841 1,746 2. General 9,388 20,925 20,075 3. Eye 4,858 5,277 5,580 4. Tooth and Mouth 1,660 1,929 1,833 5. Gynaecology 1,677 1,796 1,863 6. Family Planning 448 512 343 7. Operation/Surgery 4,125 3,944 4,743 8. ICU 6,957 7,320 8,397 9. Internist 10,318 11,092 12,151 Total 41,603 54,636 56,731 Source : Public Hospital of Bojonegoro
1.1.5. Education
There are 530 schools offering basic and secondary education to students in Bojonegoro.
Table 6. Education Facilities, 2003‐2005
Description School Class Teacher Pupil 1. Kindergaten 530 1,129 1,629 20,457 2. Primary School 834 5,010 5,012 103,312 3. Junior High School 91 93 2,076 36,414 4. Senior High School 60 544 1,733 20,479 2005 1,515 7,586 10,450 180,662 2004 1,496 7,021 10,318 178,057 2003 1,490 7,065 9,193 145,930 Source : National Education Services of Bojonegoro
Table 7. Civil Worker by Education, 2004 – 2006
Description 2004 2005 2006
1. No Schooling and not yet finished Primary School ‐ ‐ ‐
2. Primary School 387 316 294
3. Junior High School 298 348 334
4. Senior High Sachool 3,347 2,754 2,711
5. Academy 2,159 2,356 2,551
D5.2.2 ‐ Contextual Reports on survey sites FINAL 11
6. University 4,726 5,211 5,408
Total 10,917 10,985 11,298
Source : Government official Administration Board of Bojonegoro
Table 8. Village Head by Education Level, 2004 – 2006
Education 2004 2005 2006 1. SD/Primary School 13 13 11 2. SLTP/Junior High School 107 107 73 3. SMU/Senior High School 224 224 214 4. Sarjana Muda/Academy 6 6 6 5. Sarjana/University 65 65 56 Total 415 415 360 Source : Governments Division of Bojonegoro Regency
1.1.6. Religion
Most Javanese are Muslim, with small number belonging to various sects of Christianity. Ethnic Chinese follow various religions, often with an aspect of syncretism with traditional Chinese culture.
Table 9. Population by Religion, 2003‐2005
Year Islam Protestant Catholic Hindu/ Budhist Others
2003 1,189,417 2,383 4,814 68 ‐
2004 1,226,414 2,461 3,658 663 ‐
2005 1,215,668 3,906 2,724 797 ‐ Source : Departement of Religious Affair Representative of Bojonegoro
1.1.7. Language
Most people in Bojonegoro speak Bahasa Indonesia and Javanese.
1.1.8. Ethnicity
Most people in Bojonegoro are ethnic Javanese, with sizable minority of ethnic Chinese, Balinese and other Indonesian ethnic groups.
One of the distinctive communities in Bojonegoro is the Samin people. They are ethnically indistinguishable from other Javanese people; however, they follow a unique communalism movement. Samin people are follower of Surosentiko Samin, a local farmer who preached pacifist
D5.2.2 ‐ Contextual Reports on survey sites FINAL 12
resistance to Dutch colonial rule in the 1890s. Samin was incited by acquisition of local teak forest by Dutch colonial authority. Dutch officials refused access to the forest for local people, as it was claimed as Dutch property. Rather than rising in a violent uprising, Samin taught peaceful resistance, such as refusing to pay taxes to the colonial authority and continuing to take teak from the forest as they had for generations.
Samin people are nominally Muslim, but do not practice many Islamic rituals such as fasting or regular prayer. Rather, they emphasize the spiritual aspect, as well as honesty, modesty and simplicity in their lives. In this, they are similar to Kejawen followers.
Currently Samin people reside in the southwestern part of Bojonegoro, in the hearts of its teak forest. Samin people are also found in Blora Regency, Central Java, across the river Solo.
1.1.9. Disaster experience
Natural disasters like floods, landslides, hurricanes and fires represent routine occurrence each year. In 2005, both major hurricane and fire disasters occurred, with over 1,654 billion rupiah in losses.
Table 10. Frequency of Natural Disasters by Type, 2003‐2005
Description 2003 2004 2005 1. Flood ‐ ‐ 2 2. Earth Slide 3 1 ‐ 3. Fire 12 14 15 4. Hurricane 9 18 20 Source : Social Welfare Services of Bojonegoro
Floods in 2007 were much bigger than in previous years. Bengawan Solo River's water levels rose due to heavy rains, especially in the upper valley of Central Java, forcing Gajahmungkur dam to be opened. The resulting flood submerged 15 districts, with water as high as 1.5 m, and displaced 2,715 families. At least 2.544 ha of rice fields were damaged as well. Fortunately no casualties were reported.
2. Philippines
The Philippines is an archipelagic country located in Southeast Asia with Manila as its capital city. The Philippine archipelago comprises 7,107 islands in the western Pacific Ocean, sharing maritime borders with Indonesia, Malaysia, Palau, Taiwan and Vietnam. The Philippines is the world's 12th most populous country, with a population approaching 90 million people. There are more than 11 million overseas Filipinos worldwide (about 11 percent of the total population), making it the largest diaspora network in the world. Ecologically, Philippines is considered to be among 17 of the most diverse countries in the world.
D5.2.2 ‐ Contextual Reports on survey sites FINAL 13
The Philippines became a Spanish colony in the 16th century and an American territory at the beginning of the 20th century. In 1896, it won independence from Spain. American occupation of the Philippines during the Spanish‐American War led to the outbreak of the Philippine‐American War. A Commonwealth‐style government was established in 1935, which allowed self‐governance as well as the first national elections. The country gained its independence from the United States on July 4, 1946. Martial law was declared in 1972 by Ferdinand Marcos, which led to the insurgencies of the New People's Army and the Moro National Liberation Front. Ninoy Aquino's assassination would soon inspire his widow, Corazon Aquino, as well as the country's then‐spiritual leader Jaime Cardinal Sin to lead the People Power Revolution of 1986, which would bring the country back to democracy. Catholicism is the country's predominant religion, although pre‐Hispanic indigenous religious practices still exist. There are also followers of Islam.
2.1. Southern Leyte
Southern Leyte is one of the two survey sites in the Philippines selected for the MICRODIS study. It is a province located in the Eastern Visayas region. Maasin is the capital of Southern Leyte. Limasawa, an island to the south, is part of the province where the first Christian mass was held and is said to be the birthplace of Christianity in the Philippines.
The province ranks as the second least populated area in the region. According to the 2007 census, the province has a population of 390,847, a 1.13% growth compared to the last census in 2000 where it recorded a population of 360,160.
Southern Leyte's geological features created several issues in the province after the flooding of Subangdaku River and the mudslide in Guinsaugon. Organizations warned the province as susceptible to natural occurrences like landslides and floodings.
Southern Leyte contributes to the economy of the country. It forms an important part of the inter‐island transportation system of the country, with ferries transporting people and goods between Liloan and Surigao del Norte in Mindanao. The province is well known for its quality abaca products and the countries' major producer of abaca fiber.
2.1.1. Geography
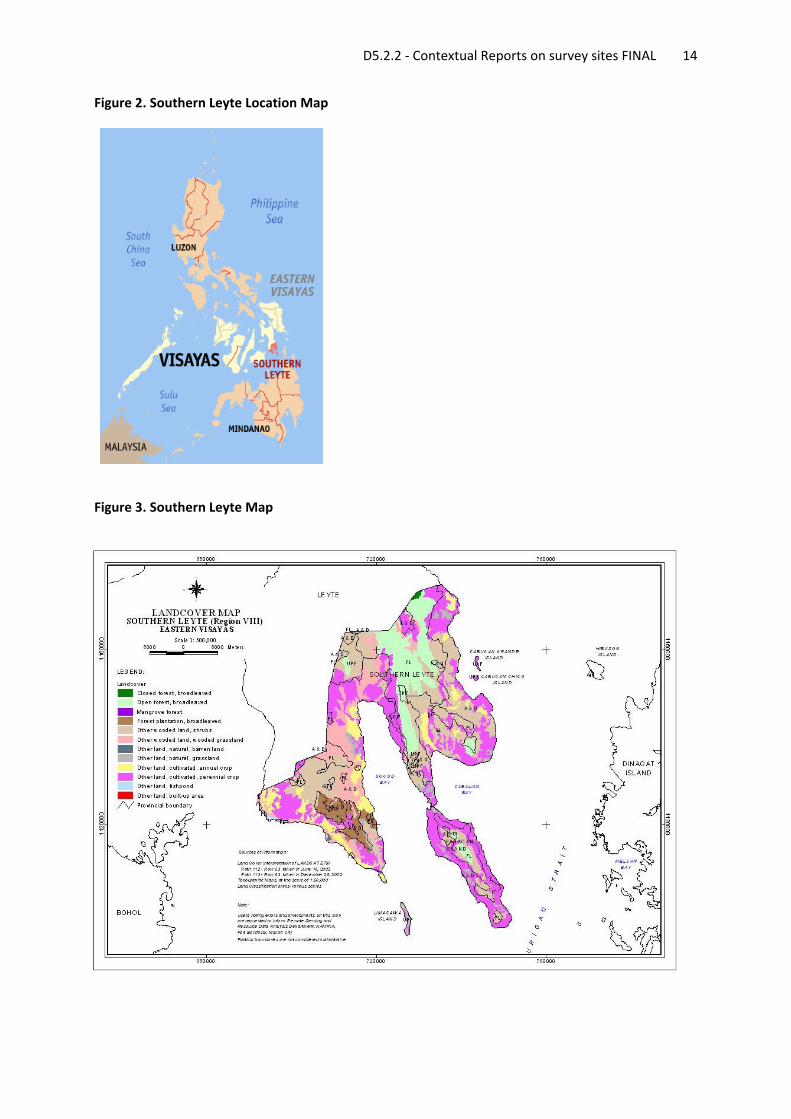
Southern Leyte occupies the southern one‐fourth of the island of Leyte. It is bounded by the province of Leyte to the north, by Surigao Strait to the east, Bohol Sea to the south, and Canigao Channel across from Bohol to the west. Its total land area is 173,480 hectares.
D5.2.2 ‐ Contextual Reports on survey sites FINAL 14
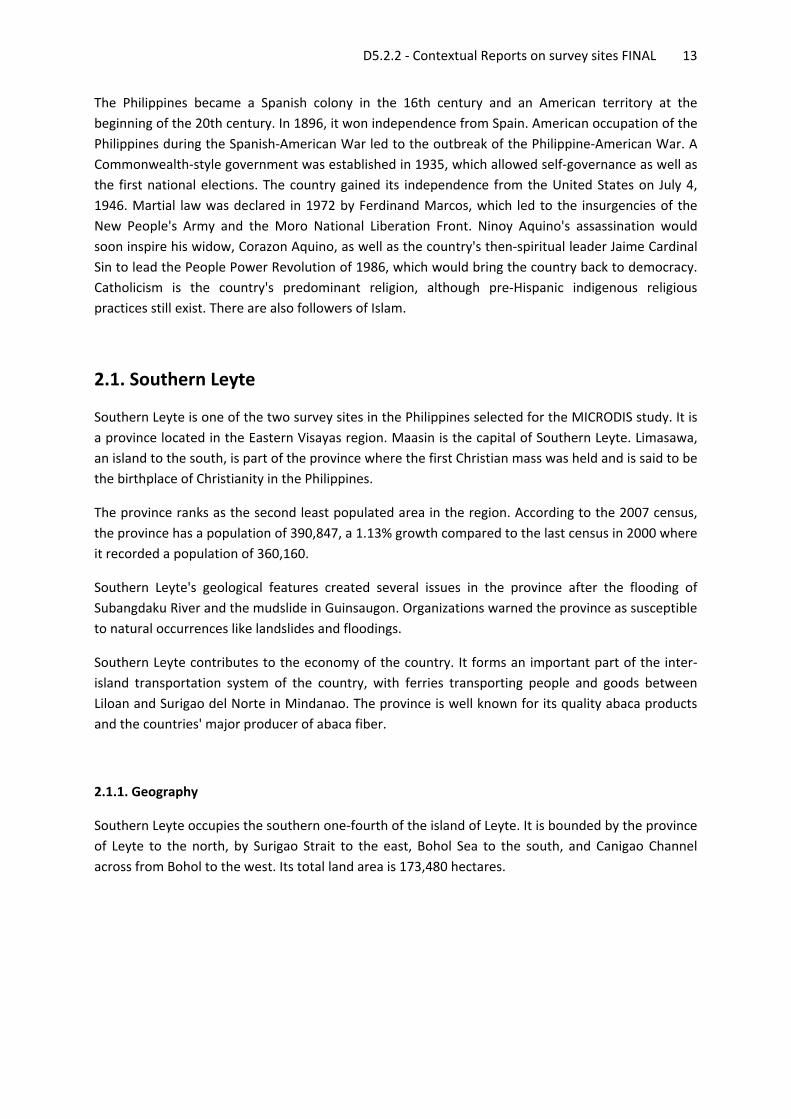
Figure 2. Southern Leyte Location Map
Figure 3. Southern Leyte Map
D5.2.2 ‐ Contextual Reports on survey sites FINAL 15
2.1.2. Demography
The population of Southern Leyte has reached 390,847 in the 2007 census of the National Statistics Office. The recent census revealed a lower population growth rate compared to the last census undertaken in 2000. For the past seven years, the growth rate is pegged at less than one percent. Lower growth rate was attributed primarily to an out‐migration phenomenon of the residents from the province to other places around the globe.
2.1.3. Economy
Most of the people in Southern Leyte go into coconut planting, a widely distributed industry, especially in mountainous and even plain regions.
The people are also into abaca planting. The province is one of the major producers of abaca fiber in the country. The fibers from Southern Leyte and the province are recognized as having the best quality. Abaca fiber helps livelihood in the province. Many women go into abaca‐based handicrafts, which are widely known in the area as tagak or spooled abaca fiber. The half‐finished product is then made into sinamay or hand woven clothe out of tinagak, ready to be made into other sinamay‐based products. Products are exported by Manila to Japan.
Aside from abaca‐based products, ceramics and handicraft items made from coconut and bamboo are also the province's industry. Among the province’s economic activity includes fishing, livestock and poultry raising.
2.1.4. Health
In 1996, the health and medical need of the province were provided by 8 government hospitals, 6 private hospitals and clinics, 20 rural health units/Municipal Health Centers, 93 Barangay Health Stations and 10 out‐patient private clinics. The total bed capacity of government hospitals is 265 while that of private, 110.
2.1.5. Education
Southern Leyte has one state university and six colleges. Most of these colleges are located in Maasin City, the capital of the province.
2.1.6. Religion
People in the province are generally Roman Catholic, 87.28 percent of which adheres to the Roman Catholic Church. Aglipayan or the Philippine Independent Church ranks second with 4.51 percent affiliates and Evangelicals with 2.03 percent. Other religious affiliations include Iglesia Ni Cristo, Jehovah's Witnesses and the Seventh‐day Adventist Church, among others.
D5.2.2 ‐ Contextual Reports on survey sites FINAL 16
2.1.7. Language
The native language is of Southern Leyte Cebuano, which is the main language spoken in the province. The speech variety used by natives has also Boholano influences because of its proximity with the province Bohol. Furthermore, Tagalog and Waray are widely spoken as second languages in the province. Some people also understand English and Spanish.
2.1.8. Ethnicity
In terms of ethnicity, in the 2000 census, 80.8 percent of the people are Bisaya or Binisaya, 16.6 percent are Boholano, 5.1 percent are Cebuano, and other includes Tagalog, Waray and other foreign ethnicity.
2.1.9. Disaster experience
The province of Southern Leyte, according to the Mines and Geo Sciences Bureau (MGB), is one of the ten (10) provinces in the country that is highly prone to natural disasters.
Southern Leyte is located within the Philippine Rift Zone. The major fault line traverses the municipalities of Sogod, Libagon, St. Bernard and Liloan, San Francisco, Pintuyan and San Ricardo in Panaon Island. Other regional geological structures which indicate its vulnerability to earthquakes are likewise found in the municipalities of Silago, Hinunangan, Bontoc, Tomas Oppus, Malitbog, Padre Burgos, Limasawa and Macrohon and the City of Maasin.
The impact of a disaster in Southern Leyte is far‐reaching. Based on the report of MGB, some 104 barangays (21 percent) of the total barangays in Southern Leyte are highly susceptible to landslides that would likely affect about 36,431 hectares and around 75,633 people.
On February 17, 2006, several mudslides caused by heavy rains (amounting over 200cm) and a minor earthquake destroyed at least one town and various commercial and residential infrastructure, leaving hundreds dead. The municipality of St. Bernard was one of the worst hit areas, where up to 200 were estimated dead and another 1,500 missing. Barangay Guinsaugon, a mountain village with 2,500 people, was almost completely levelled. Everything from trees to homes was destroyed, killing 1,800 of its 1,857 residents. Many rescuers from national and international teams responded to the incident. However, rescue efforts were greatly hampered by poor road conditions and lack of heavy equipment. Survivors reported a lack of coordination of rescue efforts. The Philippines Government again stated their inability to cope with disasters. The handful of Guinsaugon citizens which escaped the mudslide were put up in emergency shelters without adequate nutrition and care, despite the National Government collecting millions of dollars worth of donations for this case.
D5.2.2 ‐ Contextual Reports on survey sites FINAL 17
2.2. Albay
The second survey site in the Philippines is the province of Albay, located in the Bicol Region in Luzon (one of the three island groups in the country). Its capital is Legazpi City. The Mayon Volcano is the symbol most associated with this province. This nearly perfect cone‐shaped active volcano forms a scenic backdrop to the capital city of Legazpi, which is located 15 kilometers to the south.
2.2.1. Geography
Albay province is located in the southern part of Luzon. The province is bounded by the Lagonoy Gulf and Camarines Sur on the north‐northwest; the Pacific Ocean on the east; the province of Sorsogon on the south; and the Burias Pass on the southeast.
Albay has a total land area of 2,552.6 square kilometers or 255,257 hectares, which is 14.5 percent of the Bicol Region’s total land area. It is the 26th smallest province in the country. Most of Albay is located on mainland Bicol Peninsula and has four major islands to the east: Rapu‐Rapu, Batan (part of Rapu‐Rapu), Cagraray (part of Bacacay) and San Miguel (part of Tabaco City).
The province is generally mountainous with scattered fertile plains and valleys. Approximately 40 percent of the land area is flat, surrounded by the mountains of Masaraga (1,337 m high), Malinao (1,629 m high), Pantao (527 m high) and Mayon Volcano (2,496 m high), which is the most famous landform.
Basically an agricultural province, 61 percent of the land area is considered as agricultural crop zone. Total forest land covers 19 percent of the provincial land area.
The province’s soils are suitable for diversified upland crops, paddy rice, forage production and tree farming. The dominant soil types are those fit for tree farms.
About 42 percent of the province’s land area exhibits slight erosion. Slight erosion is characterized by the formation of tiny incisions, mainly sheet and rills along trails and creeks.
Moderate erosion is found in 32 percent of the land area. This type of erosion features the occurrence of well‐defined rills and gullies along waterways or slope breaks on cultivated land.
Severe erosion affects 7 percent of the land. Severe erosion usually occurs on steep, hilly or mountainous areas with slopes above 30 percent. Specifically, affected are areas where logging and excessive slash and burn farming are practiced.
Albay has a total of 121 million cubic meters of surface water, well drained through five major rivers (Yawa, Quinale, Talisay, Calibogan and Nasisi Rivers) and several minor creeks and springs utilized for irrigation and drainage. In addition, about one‐third of Lake Bato is under the administrative jurisdiction of Albay.
Albay has 15 municipalities, 3 cities and 720 barangays (villages).
D5.2.2 ‐ Contextual Reports on survey sites FINAL 18
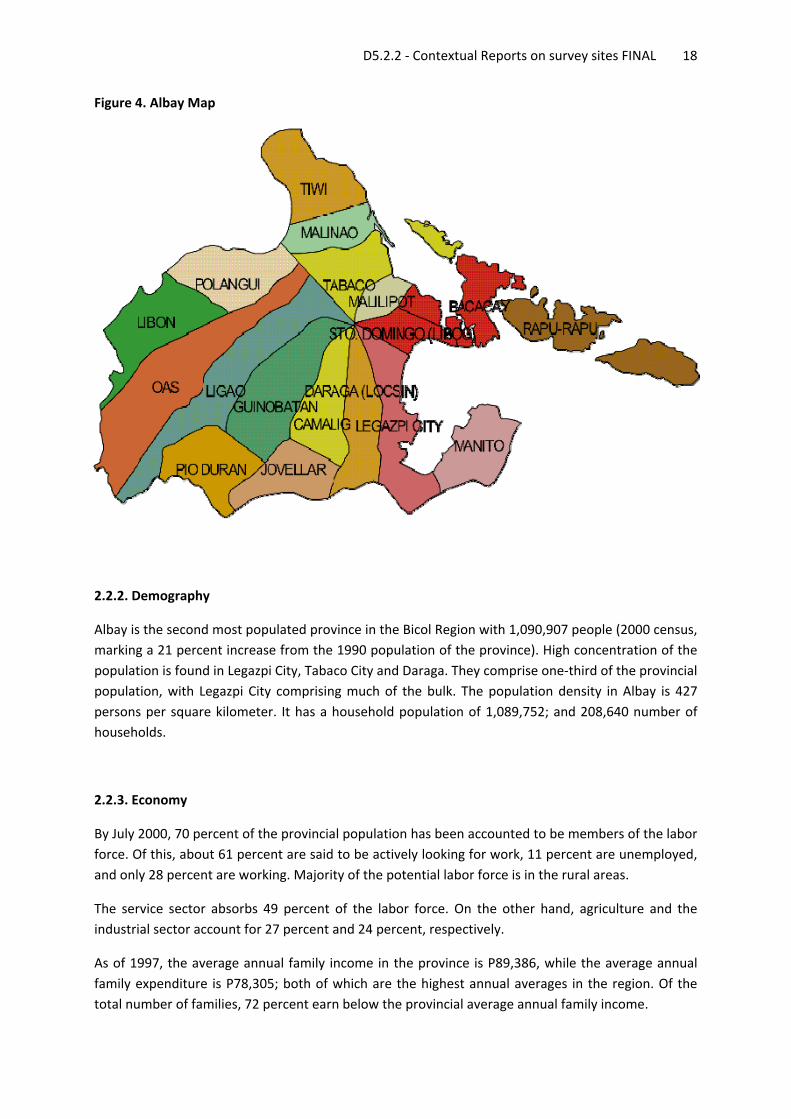
Figure 4. Albay Map
2.2.2. Demography
Albay is the second most populated province in the Bicol Region with 1,090,907 people (2000 census, marking a 21 percent increase from the 1990 population of the province). High concentration of the population is found in Legazpi City, Tabaco City and Daraga. They comprise one‐third of the provincial population, with Legazpi City comprising much of the bulk. The population density in Albay is 427 persons per square kilometer. It has a household population of 1,089,752; and 208,640 number of households.
2.2.3. Economy
By July 2000, 70 percent of the provincial population has been accounted to be members of the labor force. Of this, about 61 percent are said to be actively looking for work, 11 percent are unemployed, and only 28 percent are working. Majority of the potential labor force is in the rural areas.
The service sector absorbs 49 percent of the labor force. On the other hand, agriculture and the industrial sector account for 27 percent and 24 percent, respectively.
As of 1997, the average annual family income in the province is P89,386, while the average annual family expenditure is P78,305; both of which are the highest annual averages in the region. Of the total number of families, 72 percent earn below the provincial average annual family income.
D5.2.2 ‐ Contextual Reports on survey sites FINAL 19
By source of income, 122,682 families source their income from wages and salaries, most of which are non‐agricultural related. Those families who source their income from entrepreneurial activities reach 62,743. The rest of the 13.8 percent have other sources of income such as cash receipts from domestic sources as well as from abroad.
Agriculture is the main industry in Albay, which produces such crops as coconut, rice, sugar and abaca. Handicrafts are also a major source of rural income.
The total agricultural area in the province is about 135,000 hectares. Coconut‐based farms cover 50 percent of the agricultural crop zone, mostly located in hilly areas and foot slopes. Of the coconut‐based agricultural area, about 40,000 hectares are solely planted with coconuts; 33,000 hectares are coconut areas under multiple cropping systems; and 20,000 hectares have multi‐storey cropping.
Rice‐based agriculture covers 35,000 hectares or 26.3 percent of the total agricultural crop zone. Most of these are irrigated and planted solely with rice; more than 1,400 hectares are irrigated and adopt multi‐cropping system; and 5,700 hectares are non‐irrigated or rainfed with multi‐cropping system.
Fifteen percent of the total agricultural crop zone is considered corn‐based agricultural area. A little over 2,800 hectares, or 2 percent, of the total agricultural crop zone are planted to root crops. Industrial crops cover around 15,000 hectares, of which 12,300 hectares are considered abaca‐based agriculture and 1,400 hectares planted sugarcane.
Nearly 48 percent of the total agricultural production of Albay is rice production, which is tilled from 53,000 hectares of agricultural land. The second major crop produced is coconut with 15 percent share. Other major crops are corn, camote and cassava.
The province also has its fair share of livestock and poultry with about 3.5 million heads, majority of which are chickens.
Table 11. Economic Statistics
Income Classification : 1st Class
Poverty Incidence : 39.6% (2000)
Functional Employment Rate : 16.5% (2003)
Investment Generation : 29.88% over the regional data
Average Monthly Family Income : P 9, 171.42
Annual Income Rate : 5.2% (2003)
2.2.4. Health
There are nine government hospitals and 27 privately owned hospitals in the province as of 2006. The number of rural health units is 15, and the village health stations are 194. Health professionals in ratio to the population are 1 doctor for every 31,200, 1 dentist for every 72,700, 1 nurse for every 22,700, and 1 midwife for every 6,300.
D5.2.2 ‐ Contextual Reports on survey sites FINAL 20
There are 87.9 percent of households with access to potable water and 54 percent with access to sanitary toilet facilities.
Table 12. Health Statistics
Malnutrition Rate (Severe) : 1.43%
Infant Mortality Rate : 11.9 / 1000 livebirths
Maternal Mortality Rate : 0.83 / 1000 livebirths
2.2.5. Education
As of the school year 1999‐2000, there are 550 elementary schools and 62 secondary schools in the province. All these are government education institutions. They are being provided with 7,565 public school teachers.
2.2.6. Religion
The majority of people living in Albay practice Catholicism.
2.2.7. Language
Bicol is the local dialect. Surprisingly, it constitutes a strange variety in words and in diction among the seventeen municipalities compromising the province. In some towns, there are clear distinctions of variable terminologies in their use of words to convey their messages as compared with the nearest neighboring towns. What puzzles visitors and tourists is the amazing variation of many words of the same meaning for one object or concept among the people in every town.
2.2.8. Disaster experience
Albay has three types of climate. The eastern areas experiences no dry season with a very pronounced maximum rain period from December to January, the western areas have more or less heavily distributed rainfall throughout the year and the central areas have no pronounced maximum rain period with a short dry season from November to January. The province has a yearly average of 20 typhoons ranging from 60‐180 kph. Average rainfall is 233 millimeters with a lowest at 130 millimeters in April and the highest at 389 millimeters during December. Average temperature is 33.15 Celsius high and 22.60 Celsius low.
Albay is one of the most typhoon‐prone provinces in the Philippines. The area is located on the typhoon belt and experiences this hazard at the average of two major destructive typhoons per year.
In November 2006, Albay was one of the areas hardest‐hit by Typhoon Reming (International name: Durian). Reming was one of the most deadly and destructive tropical cyclones to ravage the Philippines in recent years. The typhoon brought 466 millimeters of rainfall, the highest in 40 years. A
D5.2.2 ‐ Contextual Reports on survey sites FINAL 21
number of communities in Albay were immediately buried under tons of rocks and mud that rushed down from the Mayon Volcano’s slopes during the typhoon. Aside from Reming, three other major typhoons hit Daraga in 2006: Tropical Storm Caloy (Chanchu), Typhoon Milenyo (Xangsane), and Typhoon Seniang (Utor).
Recently, back‐to‐back super typhoons battered the Bicol Region once again. Typhoons Lando (Hagibis) and Mina (Mitag) affected 69,465 families in Region V last year (November 2007). Both typhoons caused flashfloods and landslides.
3. Vietnam
Vietnam is the easternmost country on the Indochina Peninsula in Southeast Asia. It is bordered by China to the north, Laos to the northwest, Cambodia to the southwest and the South China Sea to the east. With a population of over 86 million, Vietnam is the 13th most populous country in the world.
Vietnam was under Chinese control for a thousand years before becoming a nation‐state in the 10th century. Successive dynasties flourished along with geographic and political expansion deeper into Southeast Asia until it was colonized by the French in the mid‐19th century. Efforts to resist the French eventually led to their expulsion from the country in the mid‐20th century, leaving a nation divided politically into two countries. Bitter fighting between the two sides continued during the Vietnam War, ending with a communist victory in 1975.
In 1986, the country instituted economic and political reforms, and by 2000, it had established diplomatic relations with most nations. Its economic growth had been among the highest in the world in the past decade. These efforts culminated in Vietnam joining the World Trade Organization in 2007 and its successful bid to become a non‐permanent member of the United Nations Security Council in 2008.
3.1. Thua Thien Hue
Thua Thien Hue is a province in the north central coast of Vietnam, approximately in the center of the country. The capital city of the province, Hue, was once the royal capital of Vietnam. There is an extensive complex of imperial tombs and temples in Hue.
The province wass known as an area of heavy fighting during the Vietnam War. More U.S. soldiers died in this province than in any other province in Vietnam (2,893).
This province and neighbouring Quang Nam Province suffered greatly from flooding in November 1999.
D5.2.2 ‐ Contextual Reports on survey sites FINAL 22
3.1.1. Geography
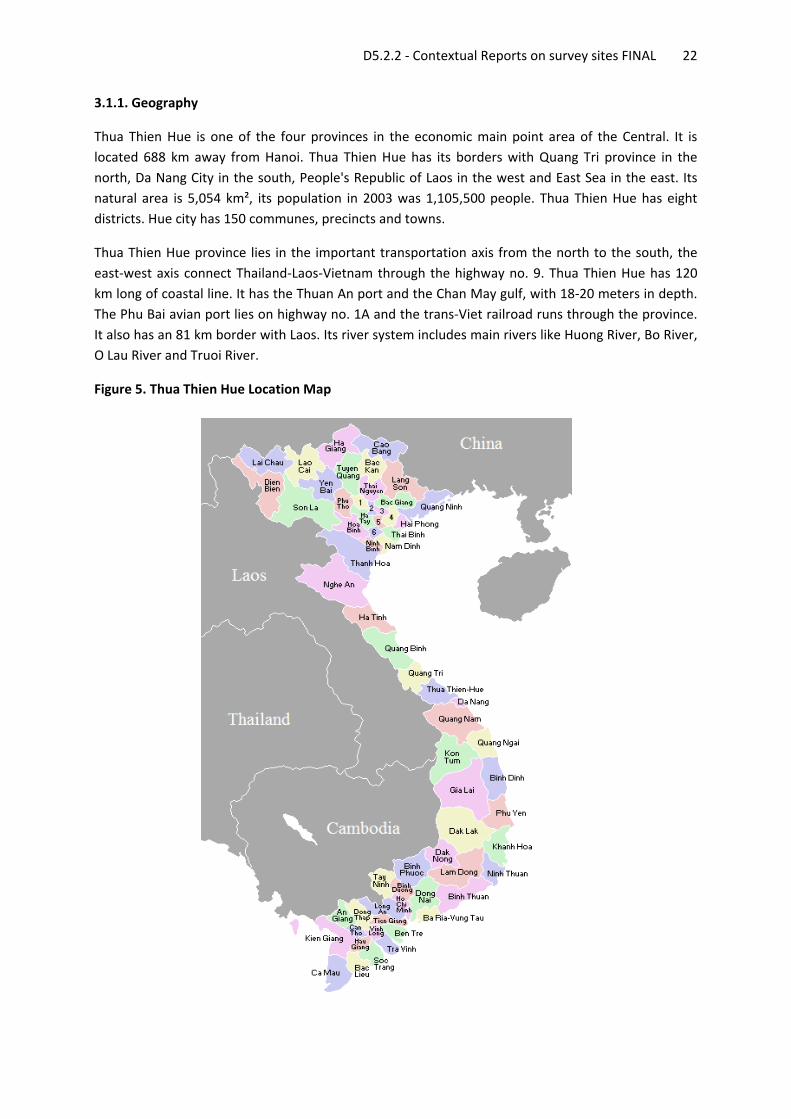
Thua Thien Hue is one of the four provinces in the economic main point area of the Central. It is located 688 km away from Hanoi. Thua Thien Hue has its borders with Quang Tri province in the north, Da Nang City in the south, People's Republic of Laos in the west and East Sea in the east. Its natural area is 5,054 km², its population in 2003 was 1,105,500 people. Thua Thien Hue has eight districts. Hue city has 150 communes, precincts and towns.
Thua Thien Hue province lies in the important transportation axis from the north to the south, the east‐west axis connect Thailand‐Laos‐Vietnam through the highway no. 9. Thua Thien Hue has 120 km long of coastal line. It has the Thuan An port and the Chan May gulf, with 18‐20 meters in depth. The Phu Bai avian port lies on highway no. 1A and the trans‐Viet railroad runs through the province. It also has an 81 km border with Laos. Its river system includes main rivers like Huong River, Bo River, O Lau River and Truoi River.
Figure 5. Thua Thien Hue Location Map
D5.2.2 ‐ Contextual Reports on survey sites FINAL 23
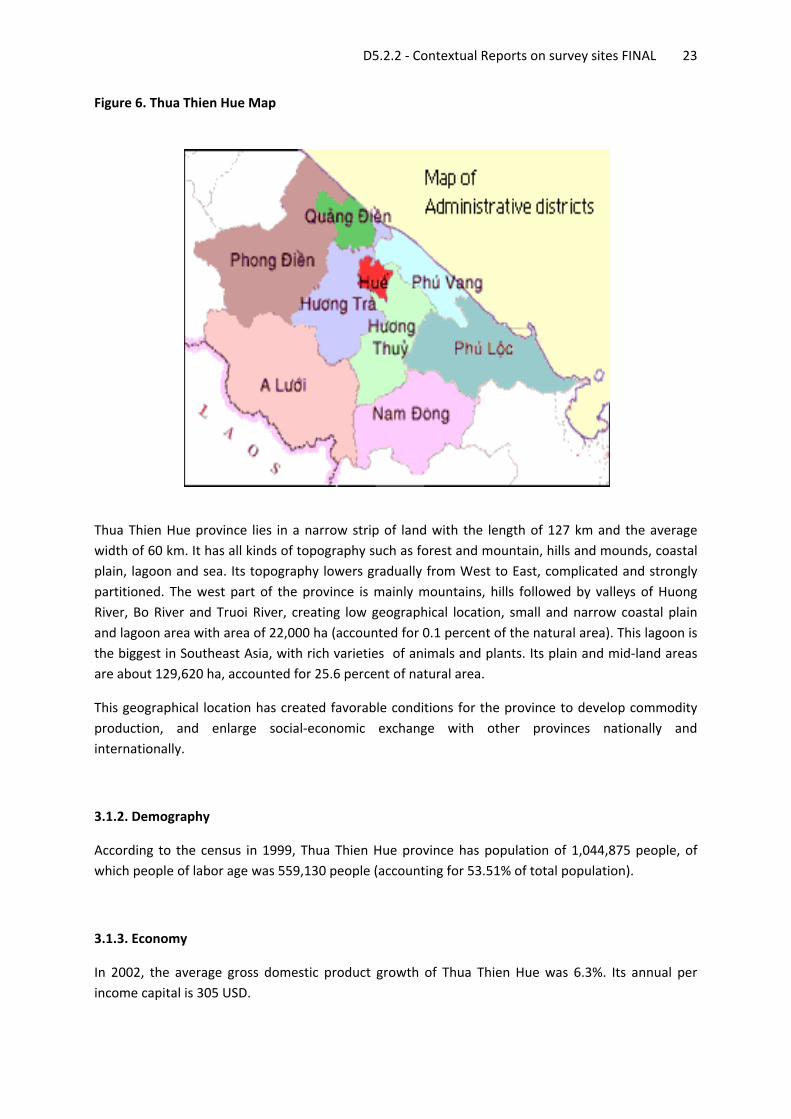
Figure 6. Thua Thien Hue Map
Thua Thien Hue province lies in a narrow strip of land with the length of 127 km and the average width of 60 km. It has all kinds of topography such as forest and mountain, hills and mounds, coastal plain, lagoon and sea. Its topography lowers gradually from West to East, complicated and strongly partitioned. The west part of the province is mainly mountains, hills followed by valleys of Huong River, Bo River and Truoi River, creating low geographical location, small and narrow coastal plain and lagoon area with area of 22,000 ha (accounted for 0.1 percent of the natural area). This lagoon is the biggest in Southeast Asia, with rich varieties of animals and plants. Its plain and mid‐land areas are about 129,620 ha, accounted for 25.6 percent of natural area.
This geographical location has created favorable conditions for the province to develop commodity production, and enlarge social‐economic exchange with other provinces nationally and internationally.
3.1.2. Demography
According to the census in 1999, Thua Thien Hue province has population of 1,044,875 people, of which people of labor age was 559,130 people (accounting for 53.51% of total population).
3.1.3. Economy
In 2002, the average gross domestic product growth of Thua Thien Hue was 6.3%. Its annual per income capital is 305 USD.
D5.2.2 ‐ Contextual Reports on survey sites FINAL 24
Table 13. Social and Economic aspects in 2002
Average annual GDP growth 6.3%
Average annual income per capital 305 USD
Table 14. Summary of occupational structure
Industrial – basic construction 34.4%
Agriculture ‐ forestry 22.5%
Commercial ‐ services 43.1%
3.1.4. Health
The total provincial pharmaceutical staff was 32 and the total number of medical doctors and nurses were 463 to service a population of 1.5 million people. On average, there are 44 medical doctors/nurses per 10 thousand people.
Each commune has a heath care center. In each district there is a district general hospital, a Center for disease prevention and a health service.
3.1.5. Education
The province has made education compulsory for everyone in the 9 districts at the level of primary school since 2002. Provincial literate proportion was 98.6 percent. During school year 2001‐2002, the proportion of secondary school was 132,120/256,813. The total number of teachers was 4,550.
3.1.6. Religion
Buddhism is the dominant religion in Hue. In fact, Hue is an important center of Buddhism in Vietnam. In Hue, there still exists pagodas constructed more than 300 years ago and over a hundred temples and pagodas built in the early century.
3.1.7. Language
Vietnamese is the national language.
D5.2.2 ‐ Contextual Reports on survey sites FINAL 25
3.1.8. Ethnicity
The province has 35 ethnic groups, of which Kinh people accounts for 96.29 percent of total population. Other minority groups such as Ta Oi accounts for 2.34 percent ; Co Tu accounts for 1.17 percent ; Bru‐Van Kieu is 0.075 percent ; Hoa is 0.037 percent ; Tay is 0.017 percent ; Ngai is 0.009 percent and Muong is 0.008 percent .
The majority of the minority populations in Thua Thien Hue province do not follow any religion. The majority of Kinh people living in mountainous communes of A Luoi and Nam Ðong follow Christianism and Buddhism, with 14,607 people over 3,168 households. Buddhist followers comprise 9,179 people or 1,952 households; Christian followers account for 5,366 people or 1,216 households; and Protestant followers are 62 people or 13 households.
3.1.9. Disaster experience
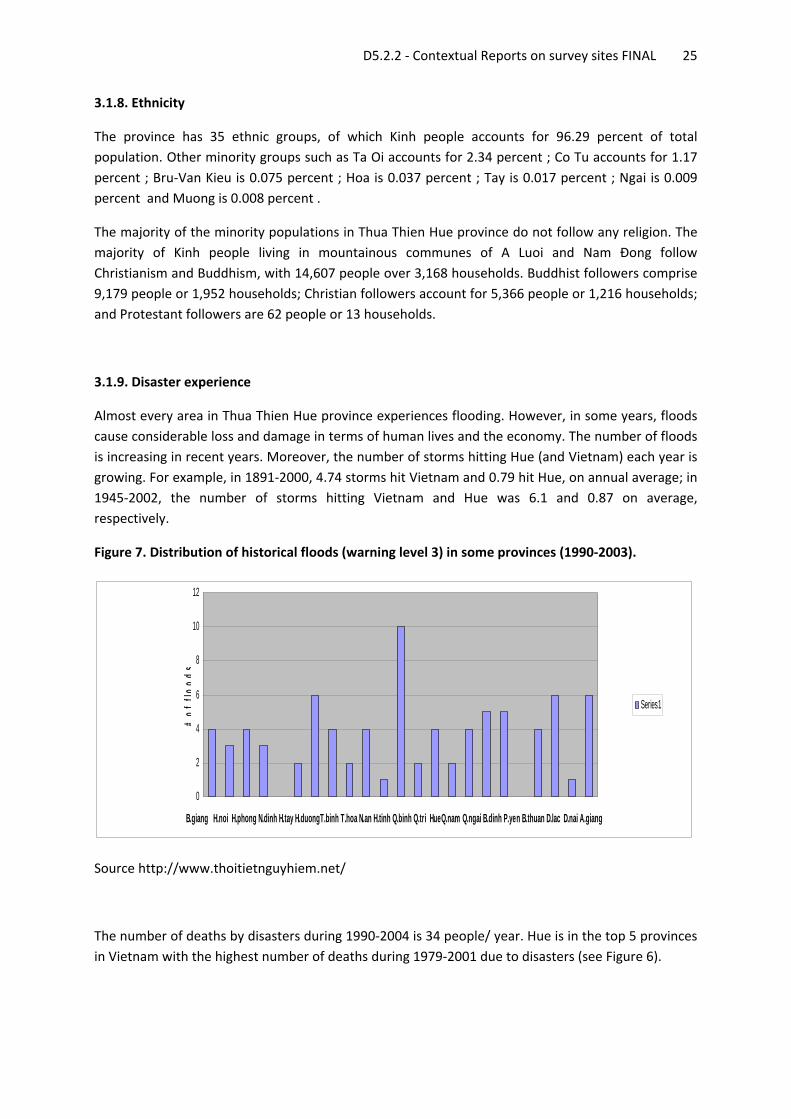
Almost every area in Thua Thien Hue province experiences flooding. However, in some years, floods cause considerable loss and damage in terms of human lives and the economy. The number of floods is increasing in recent years. Moreover, the number of storms hitting Hue (and Vietnam) each year is growing. For example, in 1891‐2000, 4.74 storms hit Vietnam and 0.79 hit Hue, on annual average; in 1945‐2002, the number of storms hitting Vietnam and Hue was 6.1 and 0.87 on average, respectively.
Figure 7. Distribution of historical floods (warning level 3) in some provinces (1990‐2003).
0
2
4
6
8
10
12
B.giang H.noi H.phong N.dinh H.tay H.duongT.binh T.hoa N.an H.tinh Q.binh Q.tri HueQ.nam Q.ngai B.dinh P.yen B.thuan D.lac D.nai A.giang
#of
flood
s
Series1
Source http://www.thoitietnguyhiem.net/
The number of deaths by disasters during 1990‐2004 is 34 people/ year. Hue is in the top 5 provinces in Vietnam with the highest number of deaths during 1979‐2001 due to disasters (see Figure 6).
D5.2.2 ‐ Contextual Reports on survey sites FINAL 26
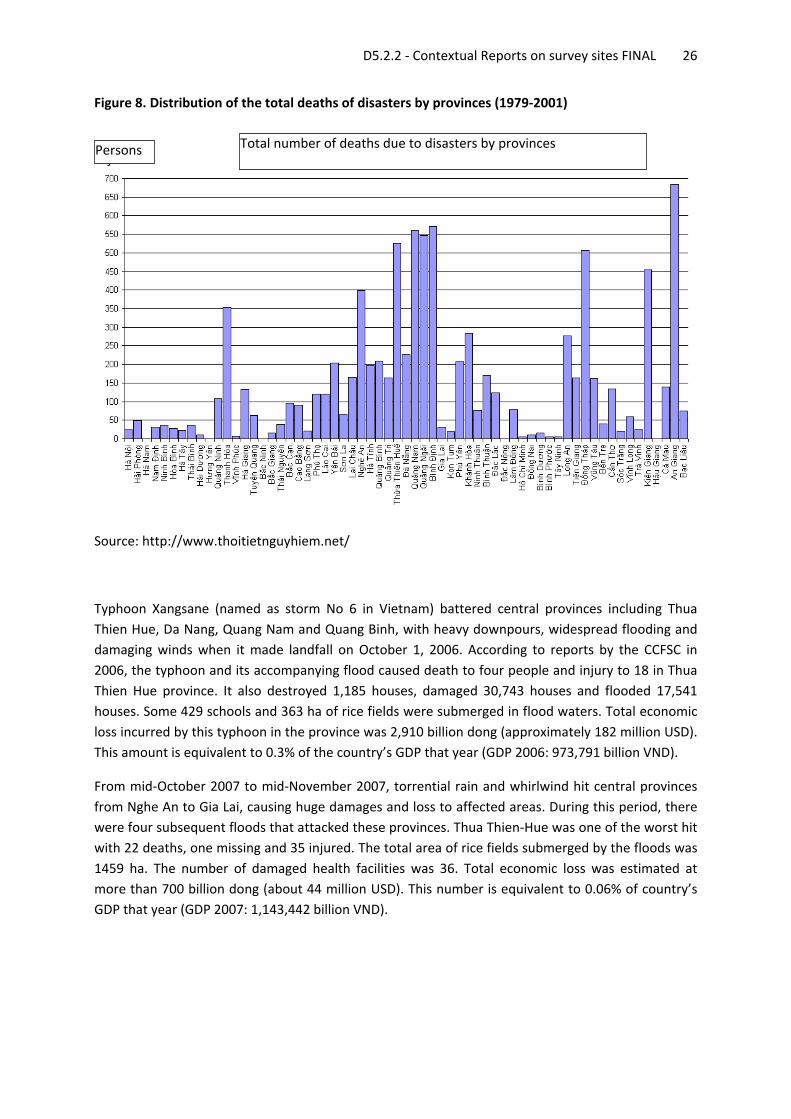
Figure 8. Distribution of the total deaths of disasters by provinces (1979‐2001)
Source: http://www.thoitietnguyhiem.net/
Typhoon Xangsane (named as storm No 6 in Vietnam) battered central provinces including Thua Thien Hue, Da Nang, Quang Nam and Quang Binh, with heavy downpours, widespread flooding and damaging winds when it made landfall on October 1, 2006. According to reports by the CCFSC in 2006, the typhoon and its accompanying flood caused death to four people and injury to 18 in Thua Thien Hue province. It also destroyed 1,185 houses, damaged 30,743 houses and flooded 17,541 houses. Some 429 schools and 363 ha of rice fields were submerged in flood waters. Total economic loss incurred by this typhoon in the province was 2,910 billion dong (approximately 182 million USD). This amount is equivalent to 0.3% of the country’s GDP that year (GDP 2006: 973,791 billion VND).
From mid‐October 2007 to mid‐November 2007, torrential rain and whirlwind hit central provinces from Nghe An to Gia Lai, causing huge damages and loss to affected areas. During this period, there were four subsequent floods that attacked these provinces. Thua Thien‐Hue was one of the worst hit with 22 deaths, one missing and 35 injured. The total area of rice fields submerged by the floods was 1459 ha. The number of damaged health facilities was 36. Total economic loss was estimated at more than 700 billion dong (about 44 million USD). This number is equivalent to 0.06% of country’s GDP that year (GDP 2007: 1,143,442 billion VND).
Total number of deaths due to disasters by provincesPersons
D5.2.2 ‐ Contextual Reports on survey sites FINAL 27
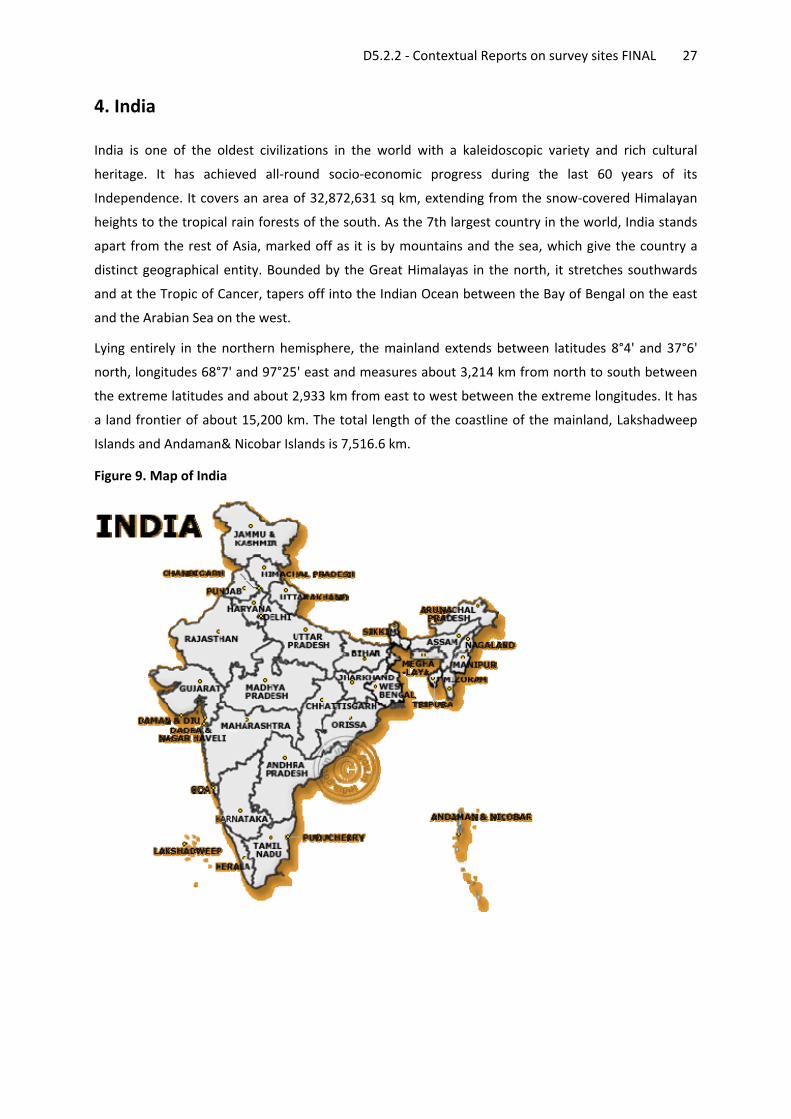
4. India
India is one of the oldest civilizations in the world with a kaleidoscopic variety and rich cultural
heritage. It has achieved all‐round socio‐economic progress during the last 60 years of its
Independence. It covers an area of 32,872,631 sq km, extending from the snow‐covered Himalayan
heights to the tropical rain forests of the south. As the 7th largest country in the world, India stands
apart from the rest of Asia, marked off as it is by mountains and the sea, which give the country a
distinct geographical entity. Bounded by the Great Himalayas in the north, it stretches southwards
and at the Tropic of Cancer, tapers off into the Indian Ocean between the Bay of Bengal on the east
and the Arabian Sea on the west.
Lying entirely in the northern hemisphere, the mainland extends between latitudes 8°4' and 37°6'
north, longitudes 68°7' and 97°25' east and measures about 3,214 km from north to south between
the extreme latitudes and about 2,933 km from east to west between the extreme longitudes. It has
a land frontier of about 15,200 km. The total length of the coastline of the mainland, Lakshadweep
Islands and Andaman& Nicobar Islands is 7,516.6 km.
Figure 9. Map of India
D5.2.2 ‐ Contextual Reports on survey sites FINAL 28
Some Facts:
Country Name: Republic of India
Government Type: Sovereign Socialist Democratic Republic with a Parliamentary
system of Government.
Capital: New Delhi
Administrative Divisions: 28 States and 7 Union Territories.
Population: 1.1 billion (Office of the Registrar General & Census
Commissioner, 2006 [2008 projected population]).
Population Growth Rate: The average annual exponential growth rate stands at 1.93
per cent during 1991‐2001.
Birth Rate: The Crude Birth rate according to the 2001 census is 24.8
Death Rate: The Crude Death rate according to the 2001 census is 8.9
Life Expectancy Rate: 63.9 years (Males); 66.9 years (Females) (As of Sep 2005)
Sex Ratio: 933 according to the 2001 census
Religions: According to the 2001 census, out of the total population of
1.028 million in the Country, Hindus constituted the majority
with 80.5 %, Muslims came second at 13.4%, followed by
Christians, Sikhs, Buddhists, Jains, and others.
Languages: There are 22 National Languages have been recognized by
the Constitution of India, of which Hindi is the Official Union
Language. Besides these, there are 844 different dialects
that are practiced in various parts of the Country.
Literacy: According to the provisional results of the 2001 census, the
literacy rate in the Country stands at 64.84 per cent, 75.26%
for males and 53.67% for females.
Average per capita income: US$2,740 (purchasing power parity (PPP) rate) (WDI, 2007).
UK: US$33.800 (PPP rate) (WDI, 2007).
Gross national income (GNI): US$3,078 billion (PPP rate) (WDI, 2007).
Percentage of people not
meeting daily food needs:
27.5% (Government of India, 2007).
Women dying in childbirth: 450 per 100,000 live births (World Health Organisation,
2005).
Children dying before age 5: 74 per 1,000 live births (National Family Health Survey
(NFHS), 2005‐06).
The Indian Subcontinent is among the world’s most disaster prone areas, with 54% of land vulnerable to earthquakes, 8% vulnerable to cyclones and 5% vulnerable to floods. 12% land is liable to severe earthquakes, 18% of land is liable to MSK VIII and 27% is liable to MSK VIIIts unique geo‐climatic conditions make this region among the most vulnerable to natural disasters in the world. India is one
D5.2.2 ‐ Contextual Reports on survey sites FINAL 29
of the most hazard prone countries in the world, and poor people are at high risk when disaster strikes. Floods, drought, landslides and cyclones occur regularly. Earthquake risk is extremely high. These hazards threaten millions of lives and can cause large‐scale financial, infrastructure, crop, and productivity losses that hinder India’s development. In the decade 1990‐2000, an average of about 4,344 people lost their lives and about 30 million people were affected by disasters every year.
Over the past couple of years, the Government of India has brought about a paradigm shift in the approach to disaster management. The new approach proceeds from the conviction that development cannot be sustainable unless disaster mitigation is built into the development process. Another corner stone of the approach is that mitigation has to be multi‐disciplinary spanning across all sectors of development. The new policy also emanates from the belief that investments in mitigation are much more cost effective than expenditure on relief and rehabilitation. Disaster management occupies an important place in this country’s policy framework as it is the poor and the under‐privileged who are worst affected on account of calamities/disasters.
4.1. Orissa
Orissa is a state situated in the east coast of India. It has a population of 36.8 million. Orissa is bounded on the north by Jharkhand, on the north‐east by West Bengal, on the east by the Bay of Bengal, on the south by Andhra Pradesh and on the west by Chhattisgarh. The state is known for its temples, especially in the cities of Konark, Puri, and Bhubaneswar. The dense population, concentrated on the coastal alluvial plain, is inhabited by the non‐tribal speakers of the Oriya language. The interior, inhabited largely by the indigenous people known as Adivasis is hilly and mountainous. The official language of the state, spoken by the majority of the people is Oriya. Oriya belongs to the Indo‐Aryan branch of the Indo‐European language family.
Despite its rich natural endowments, Orissa remains the poorest of the fourteen major Indian states, with 47.15 percent of the rural population (or 17.35 million people) living below the poverty line. (National Sample Survey (NSS) th 55 round 1999/00). The state has the lowest social and human development indicators in the country. The IMR in Orissa stands at 87/1000 live births much higher than the national average of 63/1000 births. Despite Orissa ranking well below national averages in terms of social welfare indicators the issue is not necessarily one of a lack of resources, but poorly managed systems of delivery, poorly informed decision making, weak policies and unaccountable delivery mechanisms. A further factor in the disparities and limited impact of progressive programmes within Orissa lies in a lack of accountability and underlying social mobilisation or transformation.
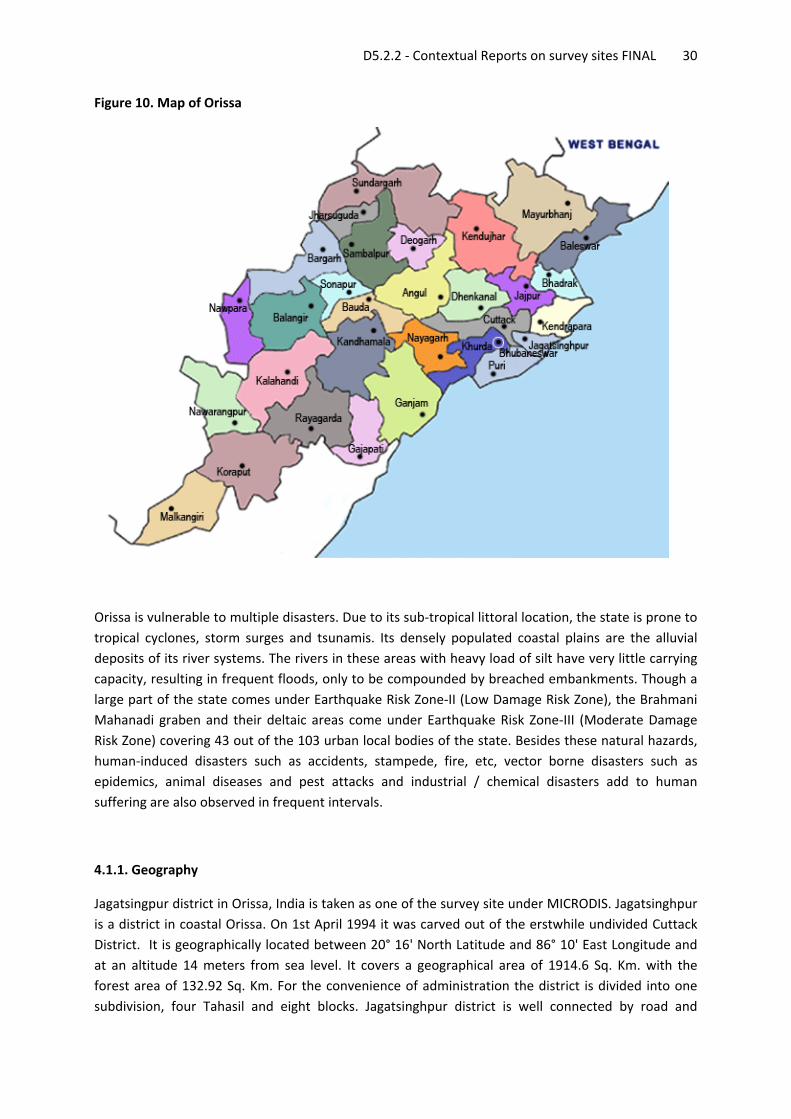
D5.2.2 ‐ Contextual Reports on survey sites FINAL 30
Figure 10. Map of Orissa
Orissa is vulnerable to multiple disasters. Due to its sub‐tropical littoral location, the state is prone to tropical cyclones, storm surges and tsunamis. Its densely populated coastal plains are the alluvial deposits of its river systems. The rivers in these areas with heavy load of silt have very little carrying capacity, resulting in frequent floods, only to be compounded by breached embankments. Though a large part of the state comes under Earthquake Risk Zone‐II (Low Damage Risk Zone), the Brahmani Mahanadi graben and their deltaic areas come under Earthquake Risk Zone‐III (Moderate Damage Risk Zone) covering 43 out of the 103 urban local bodies of the state. Besides these natural hazards, human‐induced disasters such as accidents, stampede, fire, etc, vector borne disasters such as epidemics, animal diseases and pest attacks and industrial / chemical disasters add to human suffering are also observed in frequent intervals.
4.1.1. Geography
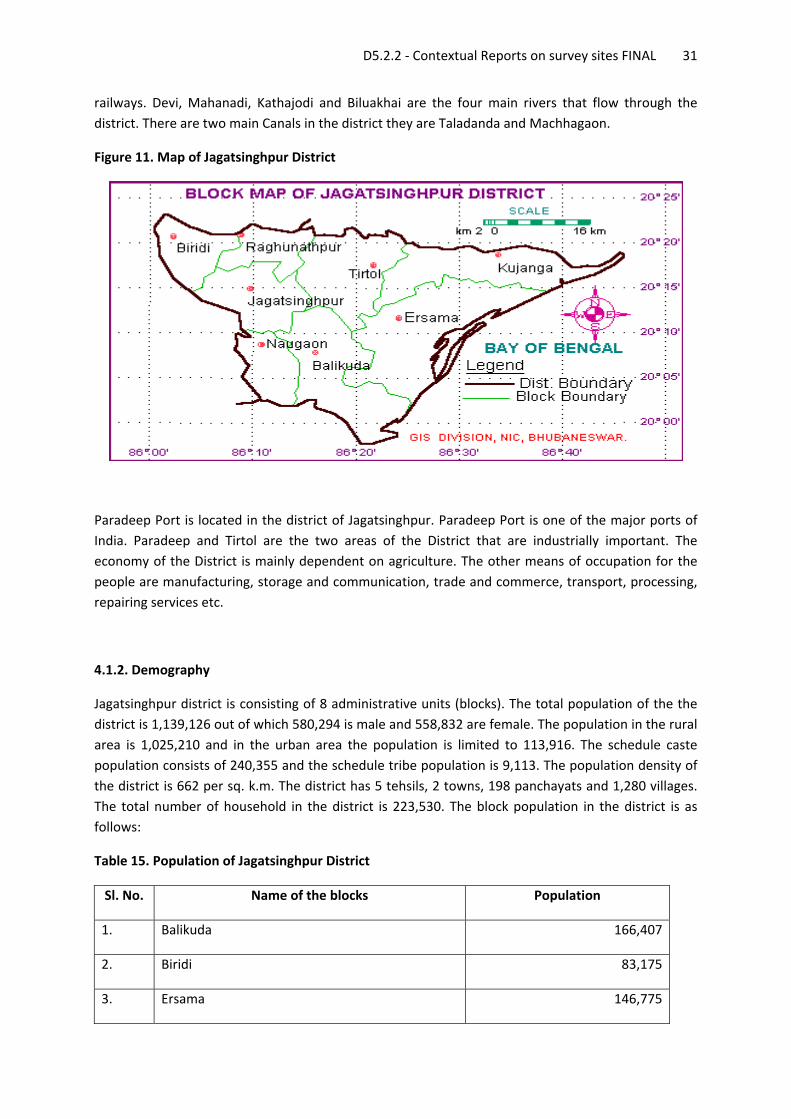
Jagatsingpur district in Orissa, India is taken as one of the survey site under MICRODIS. Jagatsinghpur is a district in coastal Orissa. On 1st April 1994 it was carved out of the erstwhile undivided Cuttack District. It is geographically located between 20° 16' North Latitude and 86° 10' East Longitude and at an altitude 14 meters from sea level. It covers a geographical area of 1914.6 Sq. Km. with the forest area of 132.92 Sq. Km. For the convenience of administration the district is divided into one subdivision, four Tahasil and eight blocks. Jagatsinghpur district is well connected by road and
D5.2.2 ‐ Contextual Reports on survey sites FINAL 31
railways. Devi, Mahanadi, Kathajodi and Biluakhai are the four main rivers that flow through the district. There are two main Canals in the district they are Taladanda and Machhagaon.
Figure 11. Map of Jagatsinghpur District
Paradeep Port is located in the district of Jagatsinghpur. Paradeep Port is one of the major ports of India. Paradeep and Tirtol are the two areas of the District that are industrially important. The economy of the District is mainly dependent on agriculture. The other means of occupation for the people are manufacturing, storage and communication, trade and commerce, transport, processing, repairing services etc.
4.1.2. Demography
Jagatsinghpur district is consisting of 8 administrative units (blocks). The total population of the the district is 1,139,126 out of which 580,294 is male and 558,832 are female. The population in the rural area is 1,025,210 and in the urban area the population is limited to 113,916. The schedule caste population consists of 240,355 and the schedule tribe population is 9,113. The population density of the district is 662 per sq. k.m. The district has 5 tehsils, 2 towns, 198 panchayats and 1,280 villages. The total number of household in the district is 223,530. The block population in the district is as follows:
Table 15. Population of Jagatsinghpur District
Sl. No. Name of the blocks Population
1. Balikuda 166,407
2. Biridi 83,175
3. Ersama 146,775
D5.2.2 ‐ Contextual Reports on survey sites FINAL 32
4. Jagatsinghpur 147,118
5. Kujanga 175,241
6. Naugaon 81,504
7. Raghunathpur 85,119
8. Tirtol 164,549
4.1.3. Economy
The economy of the district primarily depends on agriculture. The small land holding and rain fed farming system rules the agri economy of the district. Two crops are yielded in a year. i.e. Rabi and Kharif. The key crops of the district are paddy, sugarcane, turmeric and cotton. Processing, manufacturing, and fisheries industries have a dominant contribution towards the economic development of Jagatsinghpur district. Industry, handicraft, prawn culture and daily wage work also contributes to the economy of the people of the district. Due to presence of the government establishments and educational institutions, a number of people is also occupied in the service sector. Paradeep port Sarala temple is two magnificient tourist destinations of the district whereas Paradeep port generates employment and revenue from the port transactions. Out of the total population of the district 46% depend on fisheries, 82% depend on agriculture, 21% on industrial work and 8% depend on handicraft activities.
4.1.4. Health
The total population of the district is 1,139,126 consisting of 580,294 male and 558,832 female population. The sex ratio in the district is 962/1,000. There are 174,425 eligible couples. The decadal growth of population is 1.2%. There is 1 District Health Center, 8 C.H.C.s, 25 PHCs and 1 area hospital. Through these health centers 83.2% of the deliveries are institutionalized in the year 2006‐ 2007. The Infant Mortality Rate in the district is 55.3 per 1000 live birth and the child (1‐5 years) mortality is 61.2. The Maternal Mortality Rate is 178 per lakh.
The above data is referred from the government report. However the reality at the ground is far grim and serious. In the district the morbidity among the community is mainly due to diarrhea, fever, eye infection, skin infection, malaria, arthritis, gastritis, tuberculosis, dysentery, worm infestation etc. The major causes of death are pneumonia, heart diseases, ARI, cancer.
4.1.5. Education
The district is among the first few most literate populated districts in the State. The literacy level is more than 75% which consists of 81% male literacy and 69% female literacy. The literacy rate at the national level is 65.38% and in Orissa is 63.61%. The literacy rate in Jagatsinghpur district is higher than the national and state literacy rate.
D5.2.2 ‐ Contextual Reports on survey sites FINAL 33
In all the villages of the panchayats there are Anganwadi Centers. At the Panchayat level U.G.M.E., M.E. and High Schools are there. The schools are either managed by government or privately by the committees formed at panchayat level.
4.1.6. Religion
Hinduism is the main religion in this area. The second largest populated religion is Muslim. Christian population is in very small size in the district.
4.1.7. Language
Oriya language is spoken and understood by majority of the population. Besides Oriya, Urdu language is spoken, understood and written by the Muslim population. In school curriculum, Urdu language is also included as an optional subject.
4.1.8. Disaster experience
The state of Orissa is one of the most disaster prone states in the Indian Union. Orissa's six coastal districts are often subjected to tropical storm systems like cyclones as well as storm induced flooding and surges. Severe flooding caused by storm surges during the 1999 super cyclone caused massive damage to life and property. In the last decade 5 major disasters have affected the State severely. The district, as well as blocks, is disaster prone due to their geographic location. The entire geography of the district is coastal plain land with network of rivers and canals. The 5 survey blocks are closely located to the Bay of Bengal. In the districts there are 3 disaster sensitive blocks; namely Ersama, Kujanga and Tirtol. However Balikuda, Biridi, are also prone to disasters of relatively high intensity. In the last decade 5 disasters have affected the district. The major disasters that occurred in the district in 1999 were: a Super cyclone and a gas leakage in Paradeep Phosphet Ltd; in 2001 it was heavy flood; in 2005 another heavy flood; and in 2007 another major flood. In the year 2008 the flood was of very high intensity which caused massive devastation to a large number of the population and affected a larger geographic area. The vulnerability of the district as well as the blocks was clearly observed during the last Super cyclone and consecutive floods. People with lower income group and lower social strata are those who reside near the most vulnerable points of disaster. People living below poverty line, SC and ST population, women headed houses, physically challenged people, are the worst affected during a disaster. Pregnant women, elderly and children are also badly affected during the disasters. The entire geography of the district is coastal plain land with network of rivers and canals. The district is situated very near the Bay of Bengal. It comes under the watershed of river Mahanadi and Paika. In the rainy season, when the rivers are full, there are strong chances of flood. Due to lack of infrastructure such as embankments, strong water dam or storage, the flood situation has worsened.
D5.2.2 ‐ Contextual Reports on survey sites FINAL 34
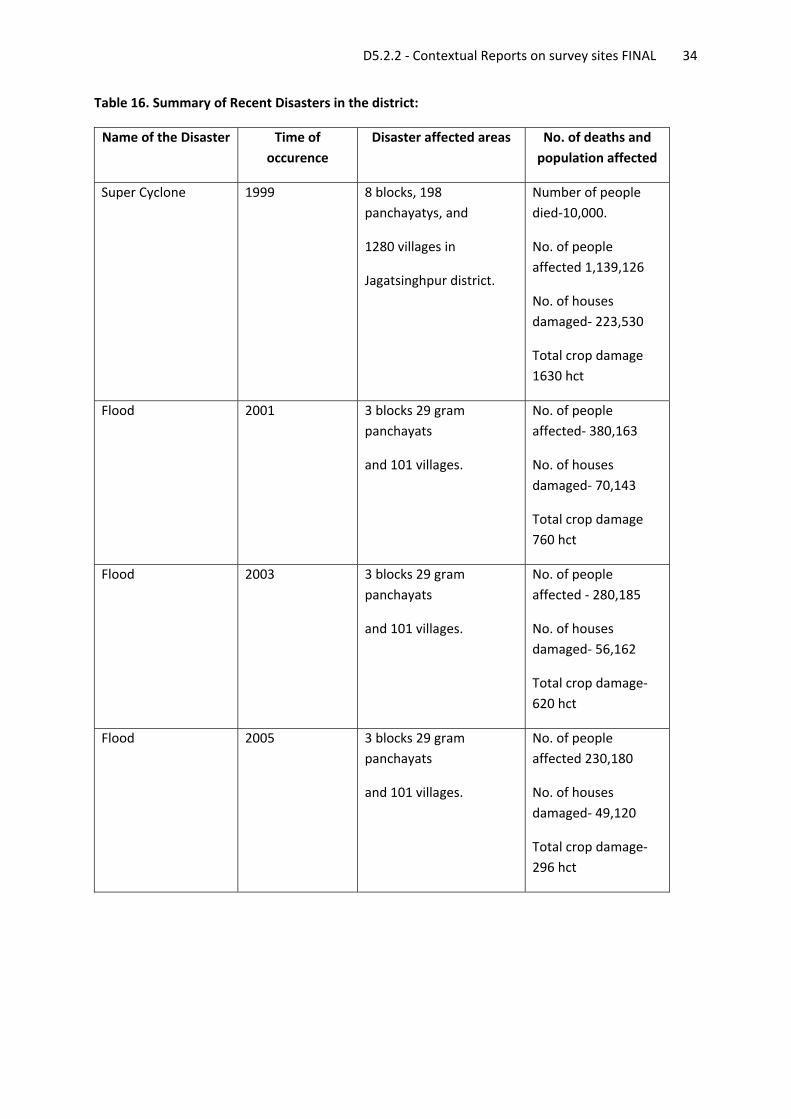
Table 16. Summary of Recent Disasters in the district:
Name of the Disaster Time of occurence
Disaster affected areas No. of deaths and population affected
Super Cyclone 1999 8 blocks, 198 panchayatys, and
1280 villages in
Jagatsinghpur district.
Number of people died‐10,000.
No. of people affected 1,139,126
No. of houses damaged‐ 223,530
Total crop damage 1630 hct
Flood 2001 3 blocks 29 gram panchayats
and 101 villages.
No. of people affected‐ 380,163
No. of houses damaged‐ 70,143
Total crop damage 760 hct
Flood 2003 3 blocks 29 gram panchayats
and 101 villages.
No. of people affected ‐ 280,185
No. of houses damaged‐ 56,162
Total crop damage‐ 620 hct
Flood 2005 3 blocks 29 gram panchayats
and 101 villages.
No. of people affected 230,180
No. of houses damaged‐ 49,120
Total crop damage‐ 296 hct
D5.2.2 ‐ Contextual Reports on survey sites FINAL 35
4.2. West Bengal
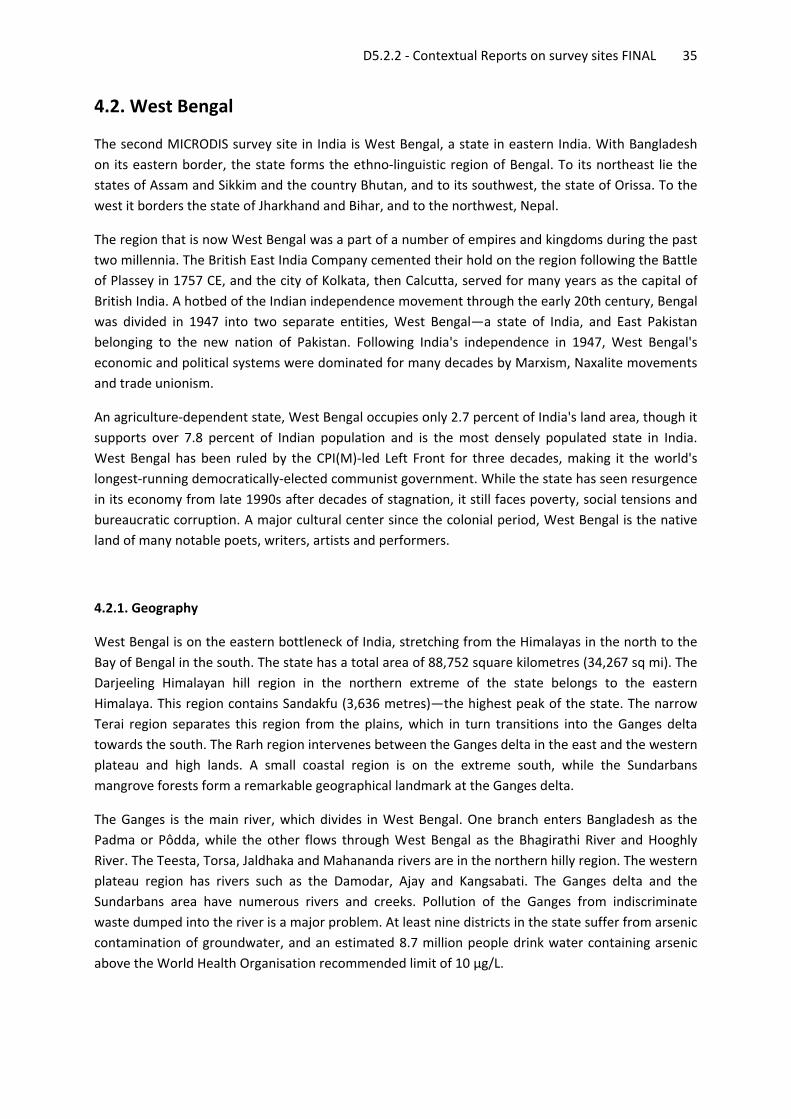
The second MICRODIS survey site in India is West Bengal, a state in eastern India. With Bangladesh on its eastern border, the state forms the ethno‐linguistic region of Bengal. To its northeast lie the states of Assam and Sikkim and the country Bhutan, and to its southwest, the state of Orissa. To the west it borders the state of Jharkhand and Bihar, and to the northwest, Nepal.
The region that is now West Bengal was a part of a number of empires and kingdoms during the past two millennia. The British East India Company cemented their hold on the region following the Battle of Plassey in 1757 CE, and the city of Kolkata, then Calcutta, served for many years as the capital of British India. A hotbed of the Indian independence movement through the early 20th century, Bengal was divided in 1947 into two separate entities, West Bengal—a state of India, and East Pakistan belonging to the new nation of Pakistan. Following India's independence in 1947, West Bengal's economic and political systems were dominated for many decades by Marxism, Naxalite movements and trade unionism.
An agriculture‐dependent state, West Bengal occupies only 2.7 percent of India's land area, though it supports over 7.8 percent of Indian population and is the most densely populated state in India. West Bengal has been ruled by the CPI(M)‐led Left Front for three decades, making it the world's longest‐running democratically‐elected communist government. While the state has seen resurgence in its economy from late 1990s after decades of stagnation, it still faces poverty, social tensions and bureaucratic corruption. A major cultural center since the colonial period, West Bengal is the native land of many notable poets, writers, artists and performers.
4.2.1. Geography
West Bengal is on the eastern bottleneck of India, stretching from the Himalayas in the north to the Bay of Bengal in the south. The state has a total area of 88,752 square kilometres (34,267 sq mi). The Darjeeling Himalayan hill region in the northern extreme of the state belongs to the eastern Himalaya. This region contains Sandakfu (3,636 metres)—the highest peak of the state. The narrow Terai region separates this region from the plains, which in turn transitions into the Ganges delta towards the south. The Rarh region intervenes between the Ganges delta in the east and the western plateau and high lands. A small coastal region is on the extreme south, while the Sundarbans mangrove forests form a remarkable geographical landmark at the Ganges delta.
The Ganges is the main river, which divides in West Bengal. One branch enters Bangladesh as the Padma or Pôdda, while the other flows through West Bengal as the Bhagirathi River and Hooghly River. The Teesta, Torsa, Jaldhaka and Mahananda rivers are in the northern hilly region. The western plateau region has rivers such as the Damodar, Ajay and Kangsabati. The Ganges delta and the Sundarbans area have numerous rivers and creeks. Pollution of the Ganges from indiscriminate waste dumped into the river is a major problem. At least nine districts in the state suffer from arsenic contamination of groundwater, and an estimated 8.7 million people drink water containing arsenic above the World Health Organisation recommended limit of 10 µg/L.
D5.2.2 ‐ Contextual Reports on survey sites FINAL 36
Figure 12. West Bengal Location Map
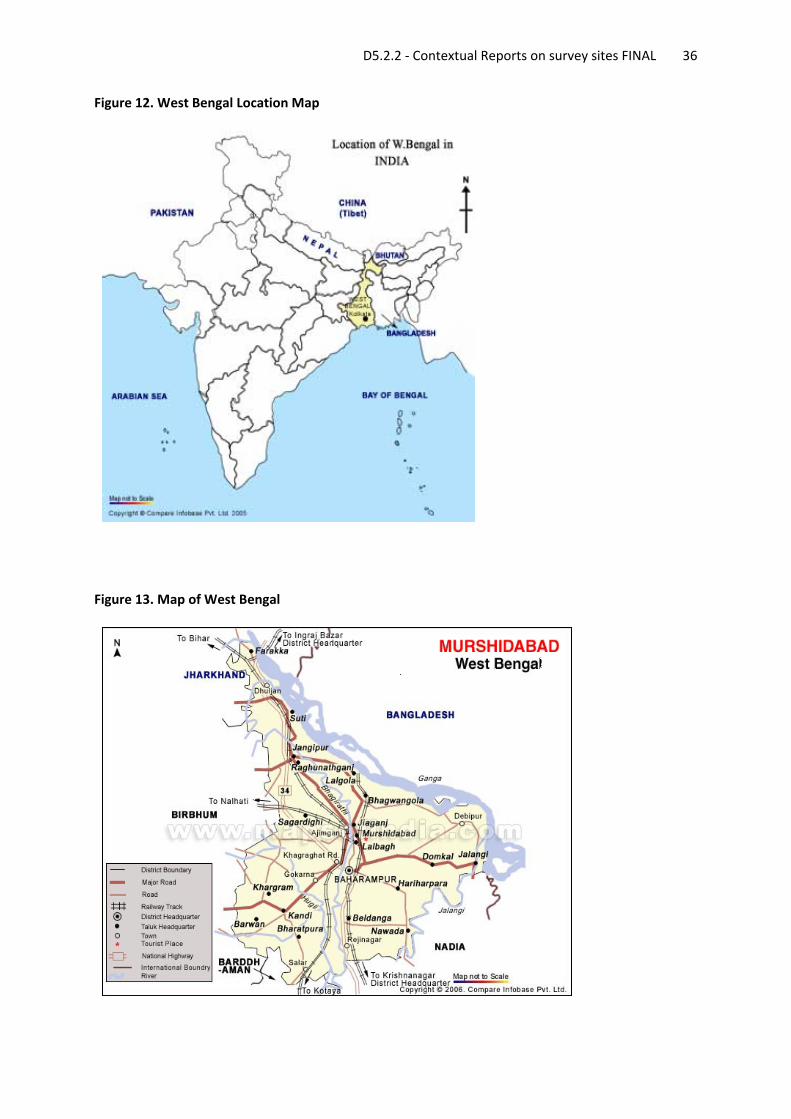
Figure 13. Map of West Bengal
D5.2.2 ‐ Contextual Reports on survey sites FINAL 37
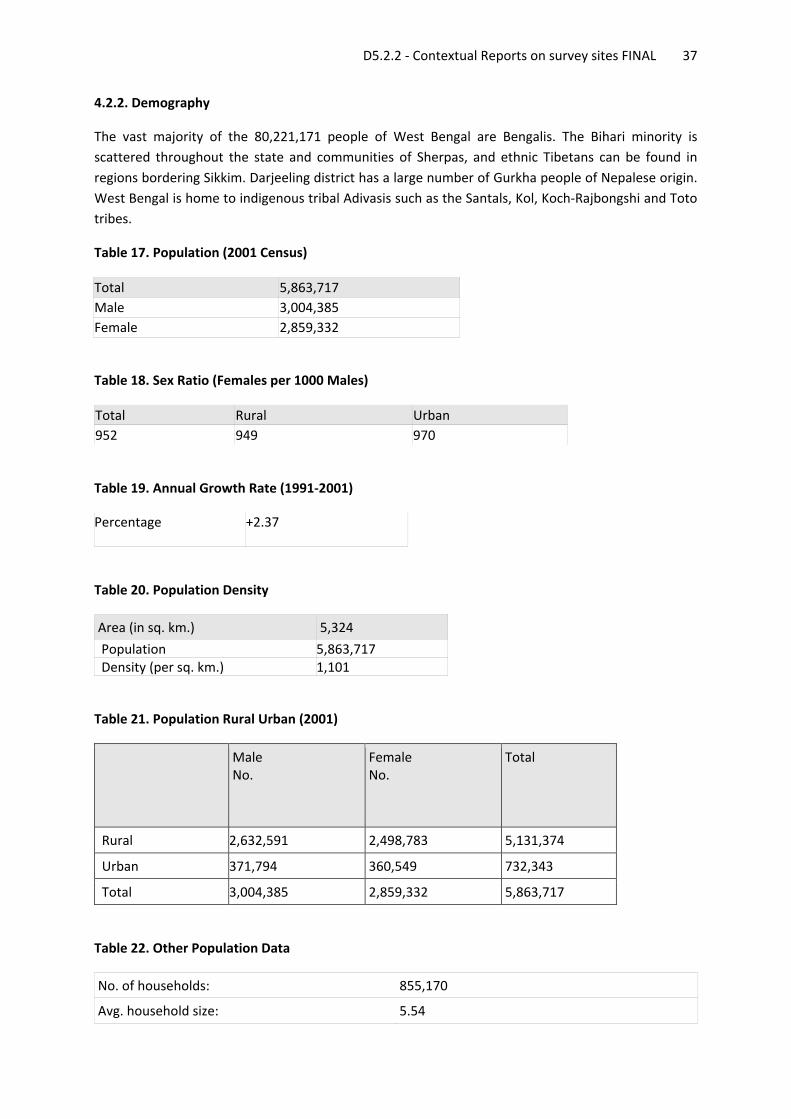
4.2.2. Demography
The vast majority of the 80,221,171 people of West Bengal are Bengalis. The Bihari minority is scattered throughout the state and communities of Sherpas, and ethnic Tibetans can be found in regions bordering Sikkim. Darjeeling district has a large number of Gurkha people of Nepalese origin. West Bengal is home to indigenous tribal Adivasis such as the Santals, Kol, Koch‐Rajbongshi and Toto tribes.
Table 17. Population (2001 Census)
Total 5,863,717 Male 3,004,385 Female 2,859,332
Table 18. Sex Ratio (Females per 1000 Males)
Total Rural Urban 952 949 970
Table 19. Annual Growth Rate (1991‐2001)
Percentage +2.37
Table 20. Population Density
Area (in sq. km.) 5,324
Population 5,863,717 Density (per sq. km.) 1,101
Table 21. Population Rural Urban (2001)
Male No.
Female No.
Total
Rural 2,632,591 2,498,783 5,131,374
Urban 371,794 360,549 732,343
Total 3,004,385 2,859,332 5,863,717
Table 22. Other Population Data
No. of households: 855,170
Avg. household size: 5.54
D5.2.2 ‐ Contextual Reports on survey sites FINAL 38
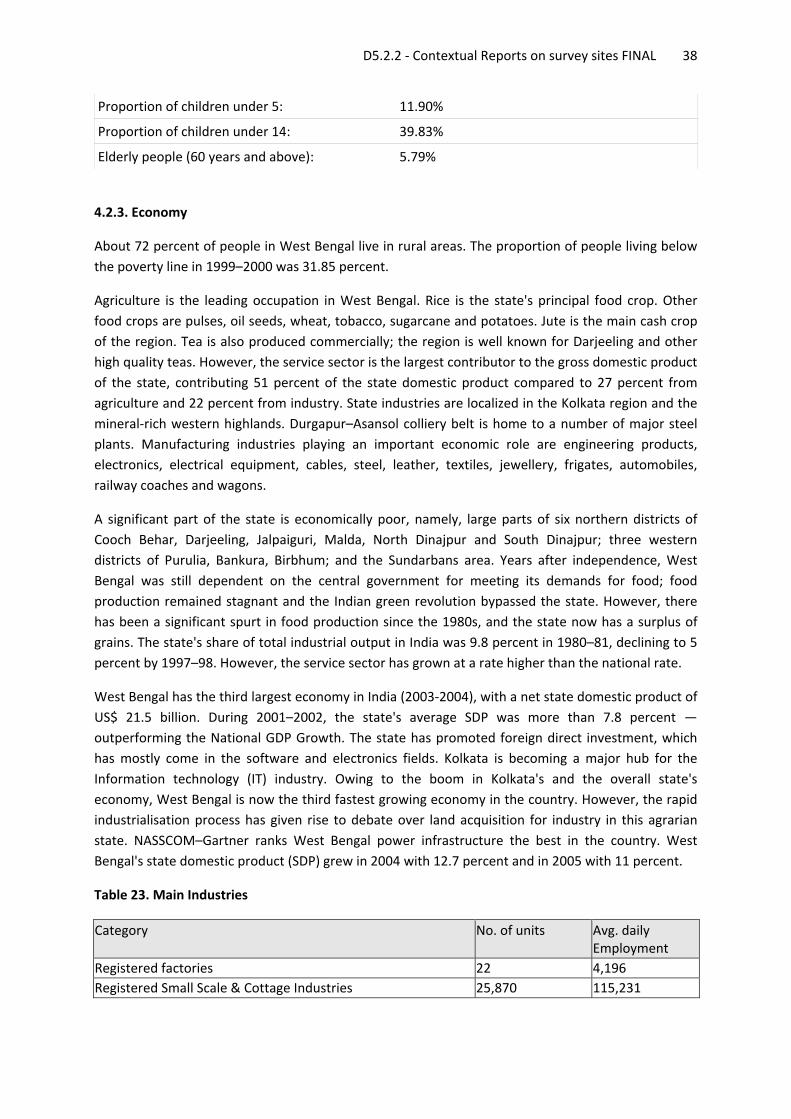
Proportion of children under 5: 11.90%
Proportion of children under 14: 39.83%
Elderly people (60 years and above): 5.79%
4.2.3. Economy
About 72 percent of people in West Bengal live in rural areas. The proportion of people living below the poverty line in 1999–2000 was 31.85 percent.
Agriculture is the leading occupation in West Bengal. Rice is the state's principal food crop. Other food crops are pulses, oil seeds, wheat, tobacco, sugarcane and potatoes. Jute is the main cash crop of the region. Tea is also produced commercially; the region is well known for Darjeeling and other high quality teas. However, the service sector is the largest contributor to the gross domestic product of the state, contributing 51 percent of the state domestic product compared to 27 percent from agriculture and 22 percent from industry. State industries are localized in the Kolkata region and the mineral‐rich western highlands. Durgapur–Asansol colliery belt is home to a number of major steel plants. Manufacturing industries playing an important economic role are engineering products, electronics, electrical equipment, cables, steel, leather, textiles, jewellery, frigates, automobiles, railway coaches and wagons.
A significant part of the state is economically poor, namely, large parts of six northern districts of Cooch Behar, Darjeeling, Jalpaiguri, Malda, North Dinajpur and South Dinajpur; three western districts of Purulia, Bankura, Birbhum; and the Sundarbans area. Years after independence, West Bengal was still dependent on the central government for meeting its demands for food; food production remained stagnant and the Indian green revolution bypassed the state. However, there has been a significant spurt in food production since the 1980s, and the state now has a surplus of grains. The state's share of total industrial output in India was 9.8 percent in 1980–81, declining to 5 percent by 1997–98. However, the service sector has grown at a rate higher than the national rate.
West Bengal has the third largest economy in India (2003‐2004), with a net state domestic product of US$ 21.5 billion. During 2001–2002, the state's average SDP was more than 7.8 percent — outperforming the National GDP Growth. The state has promoted foreign direct investment, which has mostly come in the software and electronics fields. Kolkata is becoming a major hub for the Information technology (IT) industry. Owing to the boom in Kolkata's and the overall state's economy, West Bengal is now the third fastest growing economy in the country. However, the rapid industrialisation process has given rise to debate over land acquisition for industry in this agrarian state. NASSCOM–Gartner ranks West Bengal power infrastructure the best in the country. West Bengal's state domestic product (SDP) grew in 2004 with 12.7 percent and in 2005 with 11 percent.
Table 23. Main Industries
Category No. of units Avg. daily Employment
Registered factories 22 4,196 Registered Small Scale & Cottage Industries 25,870 115,231
D5.2.2 ‐ Contextual Reports on survey sites FINAL 39
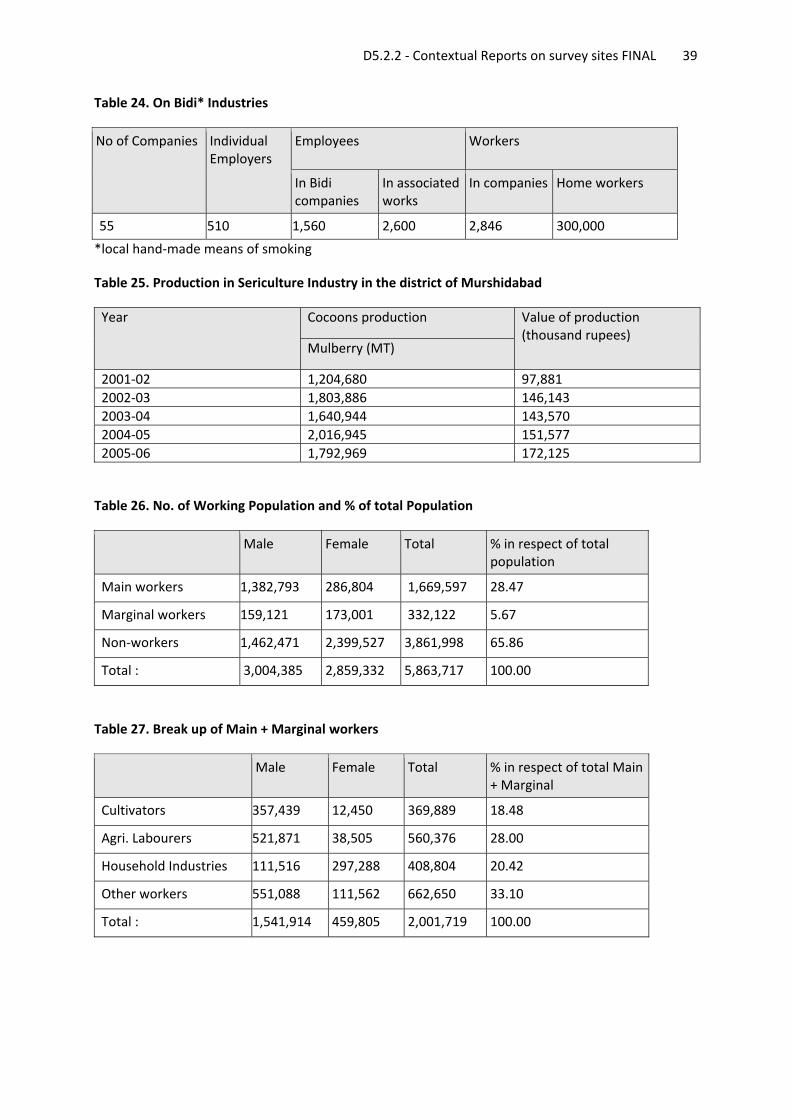
Table 24. On Bidi* Industries
No of Companies Individual Employers
Employees Workers
In Bidi companies
In associated works
In companies Home workers
55 510 1,560 2,600 2,846 300,000
*local hand‐made means of smoking
Table 25. Production in Sericulture Industry in the district of Murshidabad
Year Cocoons production Value of production (thousand rupees)
Mulberry (MT)
2001‐02 1,204,680 97,881 2002‐03 1,803,886 146,143 2003‐04 1,640,944 143,570 2004‐05 2,016,945 151,577 2005‐06 1,792,969 172,125
Table 26. No. of Working Population and % of total Population
Male Female Total % in respect of total population
Main workers 1,382,793 286,804 1,669,597 28.47
Marginal workers 159,121 173,001 332,122 5.67
Non‐workers 1,462,471 2,399,527 3,861,998 65.86
Total : 3,004,385 2,859,332 5,863,717 100.00
Table 27. Break up of Main + Marginal workers
Male Female Total % in respect of total Main + Marginal
Cultivators 357,439 12,450 369,889 18.48
Agri. Labourers 521,871 38,505 560,376 28.00
Household Industries 111,516 297,288 408,804 20.42
Other workers 551,088 111,562 662,650 33.10
Total : 1,541,914 459,805 2,001,719 100.00
D5.2.2 ‐ Contextual Reports on survey sites FINAL 40
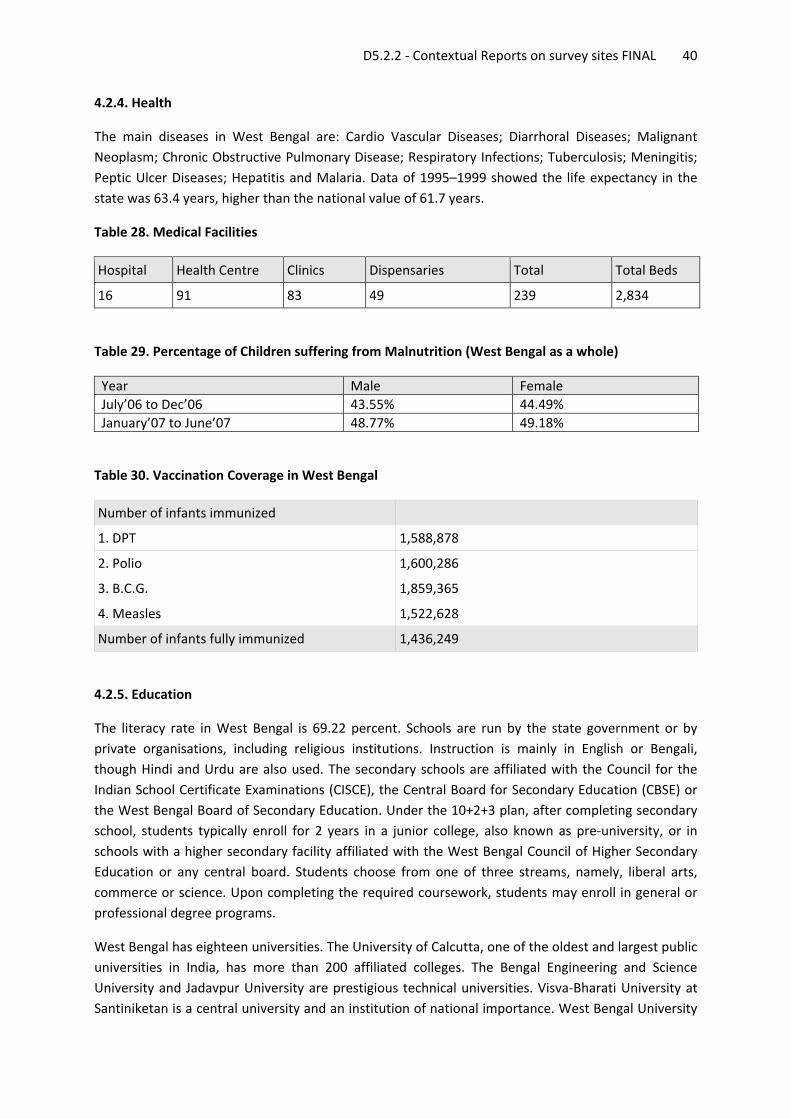
4.2.4. Health
The main diseases in West Bengal are: Cardio Vascular Diseases; Diarrhoral Diseases; Malignant Neoplasm; Chronic Obstructive Pulmonary Disease; Respiratory Infections; Tuberculosis; Meningitis; Peptic Ulcer Diseases; Hepatitis and Malaria. Data of 1995–1999 showed the life expectancy in the state was 63.4 years, higher than the national value of 61.7 years.
Table 28. Medical Facilities
Hospital Health Centre Clinics Dispensaries Total Total Beds
16 91 83 49 239 2,834
Table 29. Percentage of Children suffering from Malnutrition (West Bengal as a whole)
Year Male Female July’06 to Dec’06 43.55% 44.49% January’07 to June’07 48.77% 49.18%
Table 30. Vaccination Coverage in West Bengal
Number of infants immunized
1. DPT 1,588,878
2. Polio 1,600,286
3. B.C.G. 1,859,365
4. Measles 1,522,628
Number of infants fully immunized 1,436,249
4.2.5. Education
The literacy rate in West Bengal is 69.22 percent. Schools are run by the state government or by private organisations, including religious institutions. Instruction is mainly in English or Bengali, though Hindi and Urdu are also used. The secondary schools are affiliated with the Council for the Indian School Certificate Examinations (CISCE), the Central Board for Secondary Education (CBSE) or the West Bengal Board of Secondary Education. Under the 10+2+3 plan, after completing secondary school, students typically enroll for 2 years in a junior college, also known as pre‐university, or in schools with a higher secondary facility affiliated with the West Bengal Council of Higher Secondary Education or any central board. Students choose from one of three streams, namely, liberal arts, commerce or science. Upon completing the required coursework, students may enroll in general or professional degree programs.
West Bengal has eighteen universities. The University of Calcutta, one of the oldest and largest public universities in India, has more than 200 affiliated colleges. The Bengal Engineering and Science University and Jadavpur University are prestigious technical universities. Visva‐Bharati University at Santiniketan is a central university and an institution of national importance. West Bengal University
D5.2.2 ‐ Contextual Reports on survey sites FINAL 41
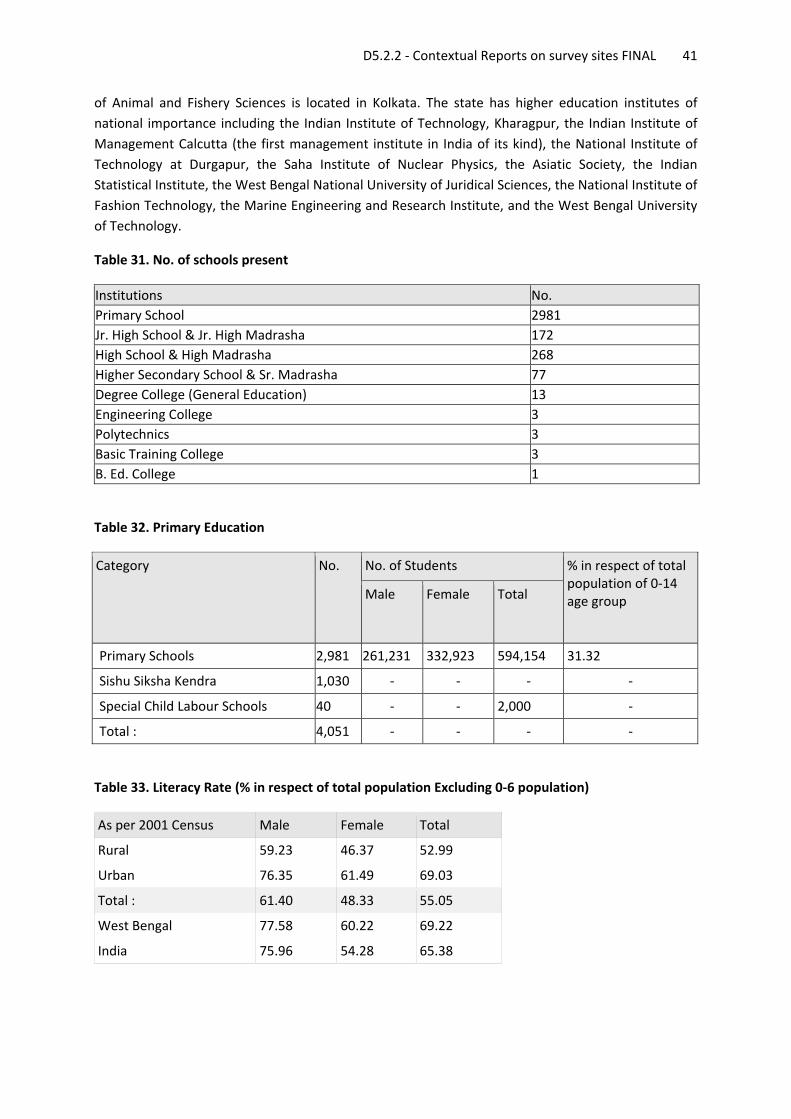
of Animal and Fishery Sciences is located in Kolkata. The state has higher education institutes of national importance including the Indian Institute of Technology, Kharagpur, the Indian Institute of Management Calcutta (the first management institute in India of its kind), the National Institute of Technology at Durgapur, the Saha Institute of Nuclear Physics, the Asiatic Society, the Indian Statistical Institute, the West Bengal National University of Juridical Sciences, the National Institute of Fashion Technology, the Marine Engineering and Research Institute, and the West Bengal University of Technology.
Table 31. No. of schools present
Institutions No. Primary School 2981 Jr. High School & Jr. High Madrasha 172 High School & High Madrasha 268 Higher Secondary School & Sr. Madrasha 77 Degree College (General Education) 13 Engineering College 3 Polytechnics 3 Basic Training College 3 B. Ed. College 1
Table 32. Primary Education
Category No. No. of Students % in respect of total population of 0‐14 age group Male Female Total
Primary Schools 2,981 261,231 332,923 594,154 31.32
Sishu Siksha Kendra 1,030 ‐ ‐ ‐ ‐
Special Child Labour Schools 40 ‐ ‐ 2,000 ‐
Total : 4,051 ‐ ‐ ‐ ‐
Table 33. Literacy Rate (% in respect of total population Excluding 0‐6 population)
As per 2001 Census Male Female Total
Rural 59.23 46.37 52.99
Urban 76.35 61.49 69.03
Total : 61.40 48.33 55.05
West Bengal 77.58 60.22 69.22
India 75.96 54.28 65.38
D5.2.2 ‐ Contextual Reports on survey sites FINAL 42
4.2.6. Religion
Muslim is dominant religious community. Total Muslim population is 3,735,380 (63.67 percent) and 2,107,469 (35.92 percent) are Hindu.
4.2.7. Language
Bengali is spoken and understood by majority of the population, and is the official language. Hindi and English are also commonly used. Nepali is spoken primarily in the Darjeeling district. Languages such as Rajbongshi, Santali and Ho are used in some parts of the state. Hinduism is the principal religion at 72.5 percent of the total population, while Muslims comprise 25 percent. Sikhism, Christianity and other religions make up the remainder. West Bengal has a population density of 904 inhabitants per square kilometre, making it the most densely populated state in India. The state contributes 7.81 percent of India's population. The state's 1991–2001 growth rate of 17.84 percent is lower than the national rate of 21.34 percent. The gender ratio is 934 females per 1,000 males.
4.2.8. Disaster experience
Murshidabad, the northernmost district of ‘South Bengal’ includes the rivers Padma, Bhagirathi, Jalangi, Mayurakshi, Brahmani, Dwarka, Pagla, Bhairab and many others. The Bhagirathi has divided this triangle shaped district into two distinct physiographic regions – the ‘Rarh’ to its west and the ‘Bagri’ to the east. The rock character, slope, topography and drainage are also distinctive in these two regions. The general slope of the land in the Rarh is from the northwest to the southeast so that all the waters go to the Bhagirathi. But to the east of the river the slope is irregular and so also the flow of the water. The excess of water of the Bhagirathi rushes towards the Padma and that of the Padma also rushes towards the Bhagirathi. Because of this unique nature, the areas to the east of the Bhagirathi get inundated almost every year. In the state of West Bengal, only five years could be identified as flood free years between 1960 and 2007, where only less than 500 sq. kms of area were inundated. Thus Murshidabad district has a long history of floods.
During the Millennium flood of 2000, the areas of Burdwan, Khargram, Kandi, Bharatpur blocks and also Kandi Municipality were severely affected.
4.3. Bahraich
The third MICRODIS survey site in India is Bahraich. Bahraich is a city and a municipal board in Bahraich district in the state of Uttar Pradesh. Located on the Saryu River, a tributary of river Ghaghra, Bahraich is 125 km north‐east of Lucknow ‐ the state capital.
Bahraich got its name from the Arabic word ‘bahr’ which means a large body of water. Situated on the bank of river Ghaghra, it was named Bahraich. Although a small town, Bahraich happens to be a very old town of India. It was inhabited around the 10th century.
D5.2.2 ‐ Contextual Reports on survey sites FINAL 43
4.3.1. Geography
District Bahraich is situated in North eastern part of Devipatan Division. It is situated between the 28.24 and 27.4 latitude and 81.65 to 81.3 eastern longitude. According to census of 1991, the area of the district is 4,696.8 sq km which is 31.99 percent of the Devipatan Division. District Bahraich has an international border with Nepal on the northern part. Districts Barabanki and Sitapur are in south, Khiri in west, and Gonda and Srawasti are in eastern side of the district Bahraich. In the northern part of the district is the Tarai region which is covered by the dense natural forest. Chakia, Sujauli, Nishangara, Mihinpurwa, Bichia and Baghauli are the main forest areas of the district. Sarju and Ghaghra are the major rivers of the district.
District Bahraich is connected with Railway and Road routes to the other parts of the nation.
Figure 14. Bahraich Map
4.3.2. Demography
As of 2001 India census, Bahraich had a population of 168,376. Males constitute 53 percent of the population and females 47 percent.
At least 15 percent of the population is under 6 years of age.
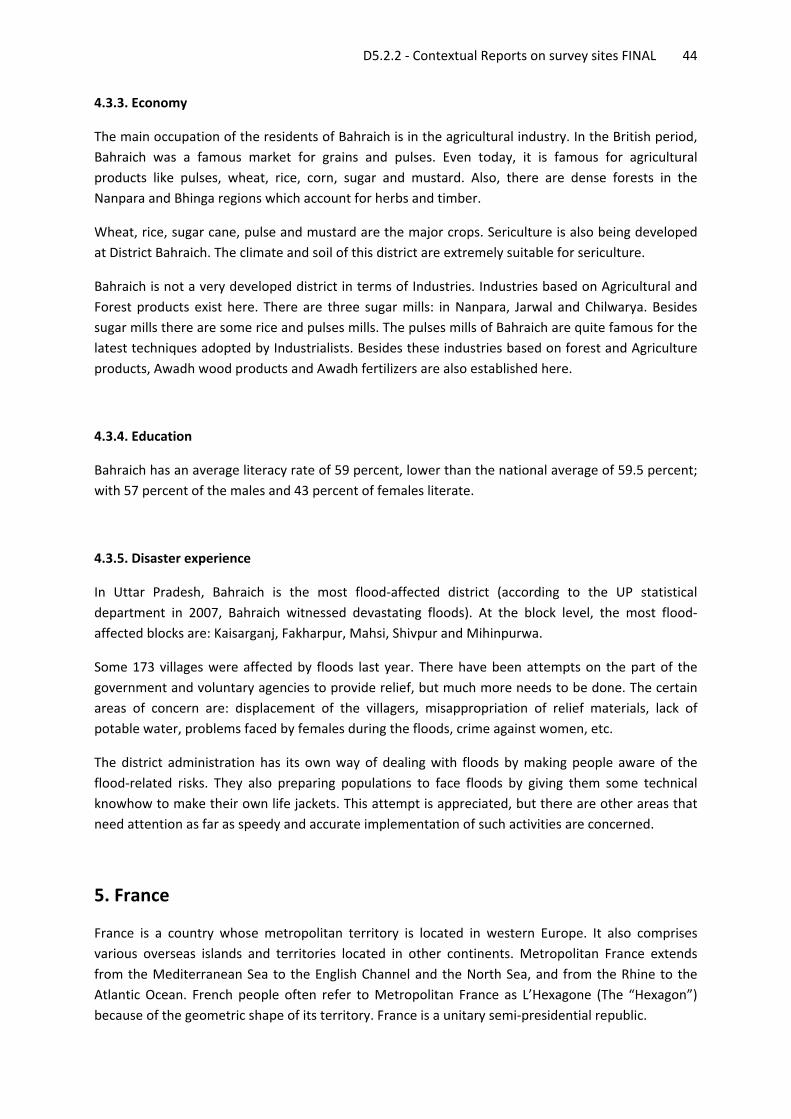
D5.2.2 ‐ Contextual Reports on survey sites FINAL 44
4.3.3. Economy
The main occupation of the residents of Bahraich is in the agricultural industry. In the British period, Bahraich was a famous market for grains and pulses. Even today, it is famous for agricultural products like pulses, wheat, rice, corn, sugar and mustard. Also, there are dense forests in the Nanpara and Bhinga regions which account for herbs and timber.
Wheat, rice, sugar cane, pulse and mustard are the major crops. Sericulture is also being developed at District Bahraich. The climate and soil of this district are extremely suitable for sericulture.
Bahraich is not a very developed district in terms of Industries. Industries based on Agricultural and Forest products exist here. There are three sugar mills: in Nanpara, Jarwal and Chilwarya. Besides sugar mills there are some rice and pulses mills. The pulses mills of Bahraich are quite famous for the latest techniques adopted by Industrialists. Besides these industries based on forest and Agriculture products, Awadh wood products and Awadh fertilizers are also established here.
4.3.4. Education
Bahraich has an average literacy rate of 59 percent, lower than the national average of 59.5 percent; with 57 percent of the males and 43 percent of females literate.
4.3.5. Disaster experience
In Uttar Pradesh, Bahraich is the most flood‐affected district (according to the UP statistical department in 2007, Bahraich witnessed devastating floods). At the block level, the most flood‐affected blocks are: Kaisarganj, Fakharpur, Mahsi, Shivpur and Mihinpurwa.
Some 173 villages were affected by floods last year. There have been attempts on the part of the government and voluntary agencies to provide relief, but much more needs to be done. The certain areas of concern are: displacement of the villagers, misappropriation of relief materials, lack of potable water, problems faced by females during the floods, crime against women, etc.
The district administration has its own way of dealing with floods by making people aware of the flood‐related risks. They also preparing populations to face floods by giving them some technical knowhow to make their own life jackets. This attempt is appreciated, but there are other areas that need attention as far as speedy and accurate implementation of such activities are concerned.
5. France
France is a country whose metropolitan territory is located in western Europe. It also comprises various overseas islands and territories located in other continents. Metropolitan France extends from the Mediterranean Sea to the English Channel and the North Sea, and from the Rhine to the Atlantic Ocean. French people often refer to Metropolitan France as L’Hexagone (The “Hexagon”) because of the geometric shape of its territory. France is a unitary semi‐presidential republic.
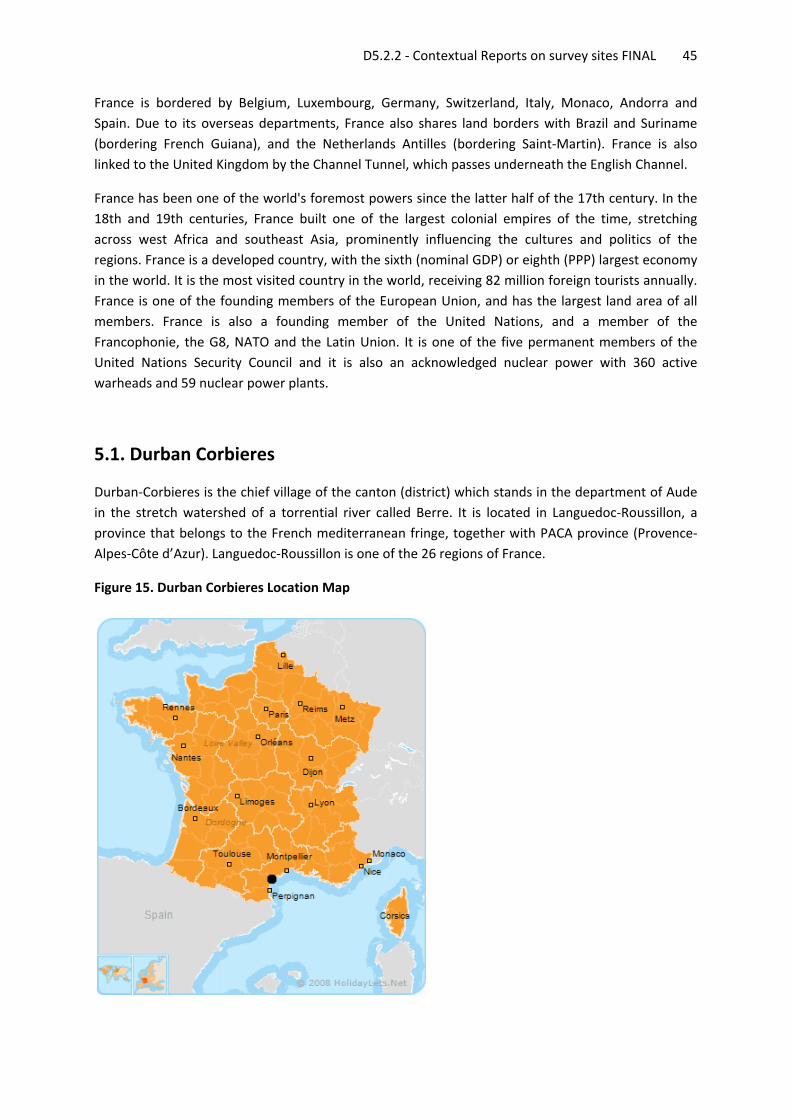
D5.2.2 ‐ Contextual Reports on survey sites FINAL 45
France is bordered by Belgium, Luxembourg, Germany, Switzerland, Italy, Monaco, Andorra and Spain. Due to its overseas departments, France also shares land borders with Brazil and Suriname (bordering French Guiana), and the Netherlands Antilles (bordering Saint‐Martin). France is also linked to the United Kingdom by the Channel Tunnel, which passes underneath the English Channel.
France has been one of the world's foremost powers since the latter half of the 17th century. In the 18th and 19th centuries, France built one of the largest colonial empires of the time, stretching across west Africa and southeast Asia, prominently influencing the cultures and politics of the regions. France is a developed country, with the sixth (nominal GDP) or eighth (PPP) largest economy in the world. It is the most visited country in the world, receiving 82 million foreign tourists annually. France is one of the founding members of the European Union, and has the largest land area of all members. France is also a founding member of the United Nations, and a member of the Francophonie, the G8, NATO and the Latin Union. It is one of the five permanent members of the United Nations Security Council and it is also an acknowledged nuclear power with 360 active warheads and 59 nuclear power plants.
5.1. Durban Corbieres
Durban‐Corbieres is the chief village of the canton (district) which stands in the department of Aude in the stretch watershed of a torrential river called Berre. It is located in Languedoc‐Roussillon, a province that belongs to the French mediterranean fringe, together with PACA province (Provence‐Alpes‐Côte d’Azur). Languedoc‐Roussillon is one of the 26 regions of France.
Figure 15. Durban Corbieres Location Map
D5.2.2 ‐ Contextual Reports on survey sites FINAL 46
5.1.1. Geography
Languedoc‐Roussillon comprises five departments, and borders the other French regions of PACA, Rhône‐Alpes, Auvergne, Midi‐Pyrénées on the one side, and Spain, Andorra and the Mediterranean Sea on the other side.
All small Mediterranean watersheds display the same physical pattern. It is important to know the topographical conditions to understand the type and the localisation of damage. Except big rivers such as Rhone River in France, Po River in Italy or Ebro River in Spain that all flow down from extra Mediterranean regions, the Mediterranean regions are characterized by small watersheds (from 500 to 5,000 km2). In the Languedoc‐Roussillon region, the distance between mountain ridge and sea is never more than 150 km. Gard River watershed covers an area of 2.500 km². The largest one is the 4.840 Km² Aude River watershed. The tributaries run‐off begins above 1.000 m high.
The typical Mediterranean watershed is divided in three parts. The high valleys are rather narrow and deep. Few people live there (population density is around 20 inhabitants per km²) but roads and networks are obliged to follow the valley corridors. The strong declivity contributes to generate flash floods. Seven meters per second stream velocities have been deduced from damage and testimonies. However, hills are coved by a deep bush that protects slopes from landslides.
Down the hills, the valleys become wider and the flood‐prone zone is 500 to 1,000 m wide. Those are piedmonts where the density of population is higher (50 to 100 habitants per km²) and vineyard is the main crop.
Going downstream, the rivers leave the piedmonts to run into low plains. In general, water is streaming slowly between dikes. The speed of water is slower (less than 1 m.s‐1) and the peak discharge is used to come several hours, sometimes one day, after having affected the high part of watershed. The plains are very large and population density is high (over 150 inhabitants per km²) due to the presence of many towns and touristy implantations. If forecasting and flood warnings are done correctly, people can protect themselves against the floods. Fatalities or heavy damage may only occur when dikes fail. In 1999 and 2002, many dikes failed and the floods overwhelmed hundreds of km².
As in Europe as a whole, France has an oceanic climate in its north and a Mediterranean climate in the south. Thus, the northern part of the country is affected by slow‐rise floods whereas southern and mountainous regions suffer from flash floods. Despite little spatial extension, Mediterranean flash floods are very damaging. National authorities and international organisations sometimes neglect this kind of flood because it concerns small catchments. According to insurance companies, Mediterranean flash floods trigger 66 percent of the damage due to flooding in France. If we include damage on public infrastructures and industries, both major torrential floods in 1999 and 2002 triggered 58 fatalities and 2 billion euros of damage.
Peak discharges are the highest in the extra‐tropical world. They have been studied by Gaume and other authors. In small watersheds (fewer than 20 km²), the peak discharges exceeded 10 m3/s/km²,
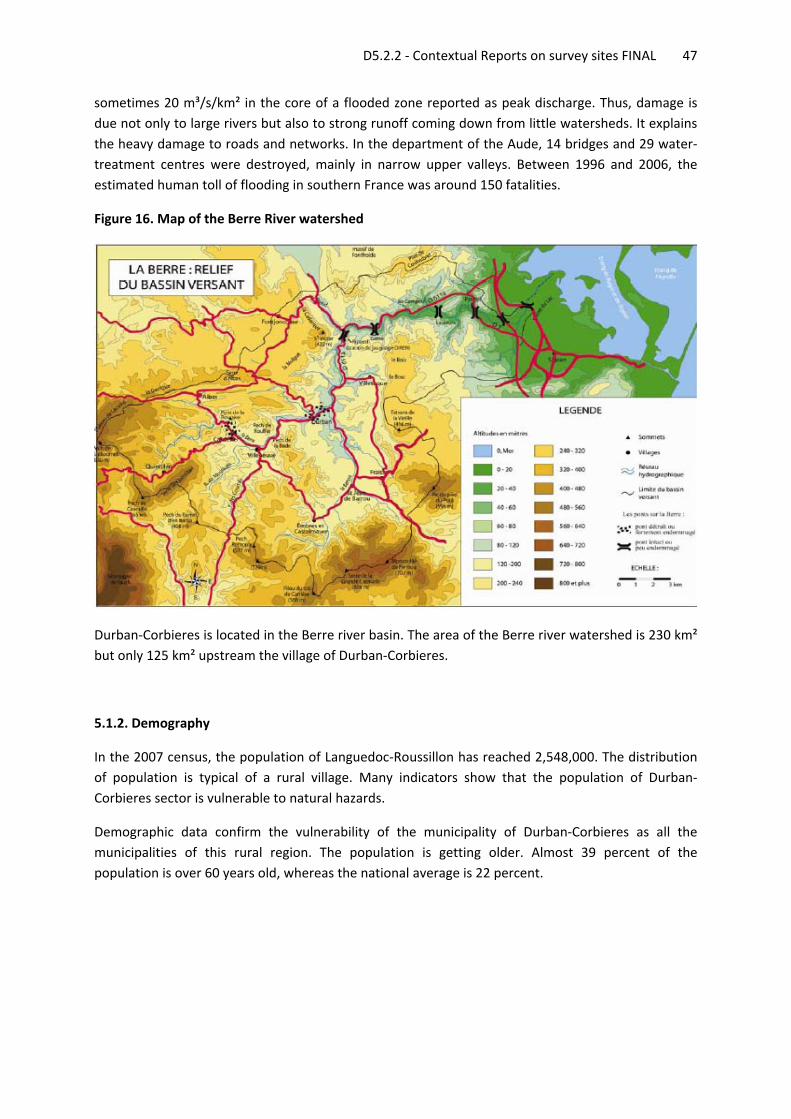
D5.2.2 ‐ Contextual Reports on survey sites FINAL 47
sometimes 20 m³/s/km² in the core of a flooded zone reported as peak discharge. Thus, damage is due not only to large rivers but also to strong runoff coming down from little watersheds. It explains the heavy damage to roads and networks. In the department of the Aude, 14 bridges and 29 water‐treatment centres were destroyed, mainly in narrow upper valleys. Between 1996 and 2006, the estimated human toll of flooding in southern France was around 150 fatalities.
Figure 16. Map of the Berre River watershed
Durban‐Corbieres is located in the Berre river basin. The area of the Berre river watershed is 230 km² but only 125 km² upstream the village of Durban‐Corbieres.
5.1.2. Demography
In the 2007 census, the population of Languedoc‐Roussillon has reached 2,548,000. The distribution of population is typical of a rural village. Many indicators show that the population of Durban‐Corbieres sector is vulnerable to natural hazards.
Demographic data confirm the vulnerability of the municipality of Durban‐Corbieres as all the municipalities of this rural region. The population is getting older. Almost 39 percent of the population is over 60 years old, whereas the national average is 22 percent.
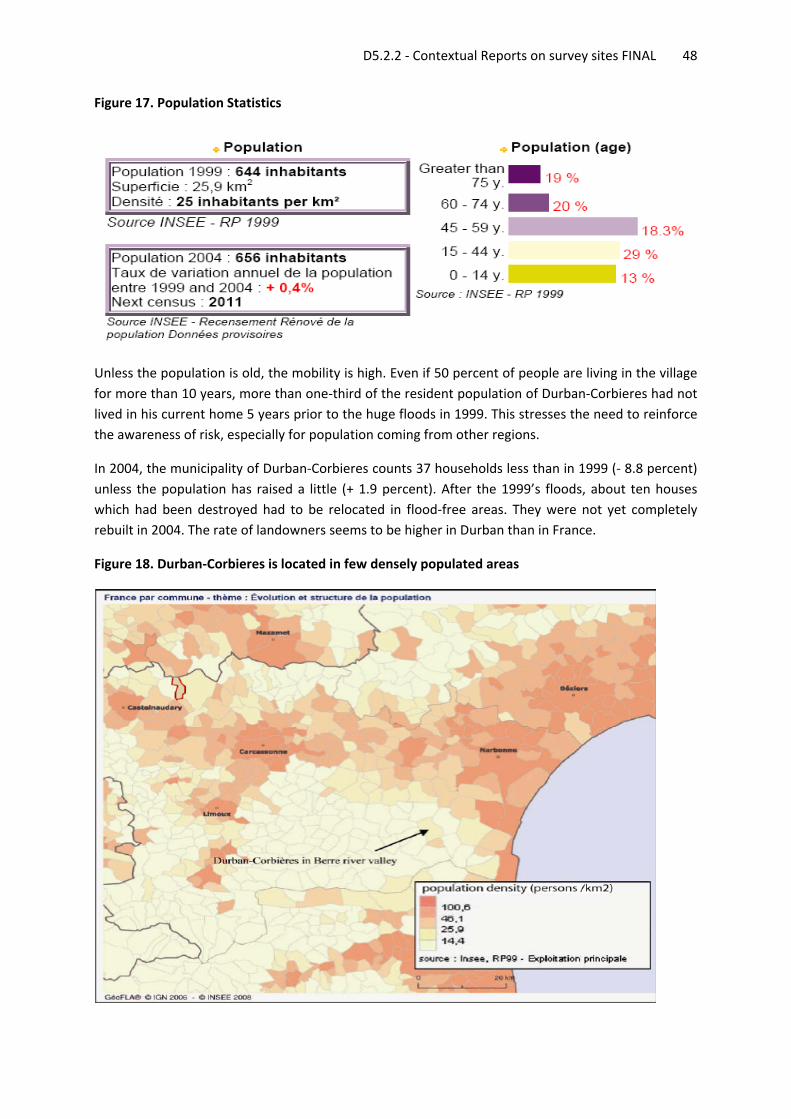
D5.2.2 ‐ Contextual Reports on survey sites FINAL 48
Figure 17. Population Statistics
Unless the population is old, the mobility is high. Even if 50 percent of people are living in the village for more than 10 years, more than one‐third of the resident population of Durban‐Corbieres had not lived in his current home 5 years prior to the huge floods in 1999. This stresses the need to reinforce the awareness of risk, especially for population coming from other regions.
In 2004, the municipality of Durban‐Corbieres counts 37 households less than in 1999 (‐ 8.8 percent) unless the population has raised a little (+ 1.9 percent). After the 1999’s floods, about ten houses which had been destroyed had to be relocated in flood‐free areas. They were not yet completely rebuilt in 2004. The rate of landowners seems to be higher in Durban than in France.
Figure 18. Durban‐Corbieres is located in few densely populated areas
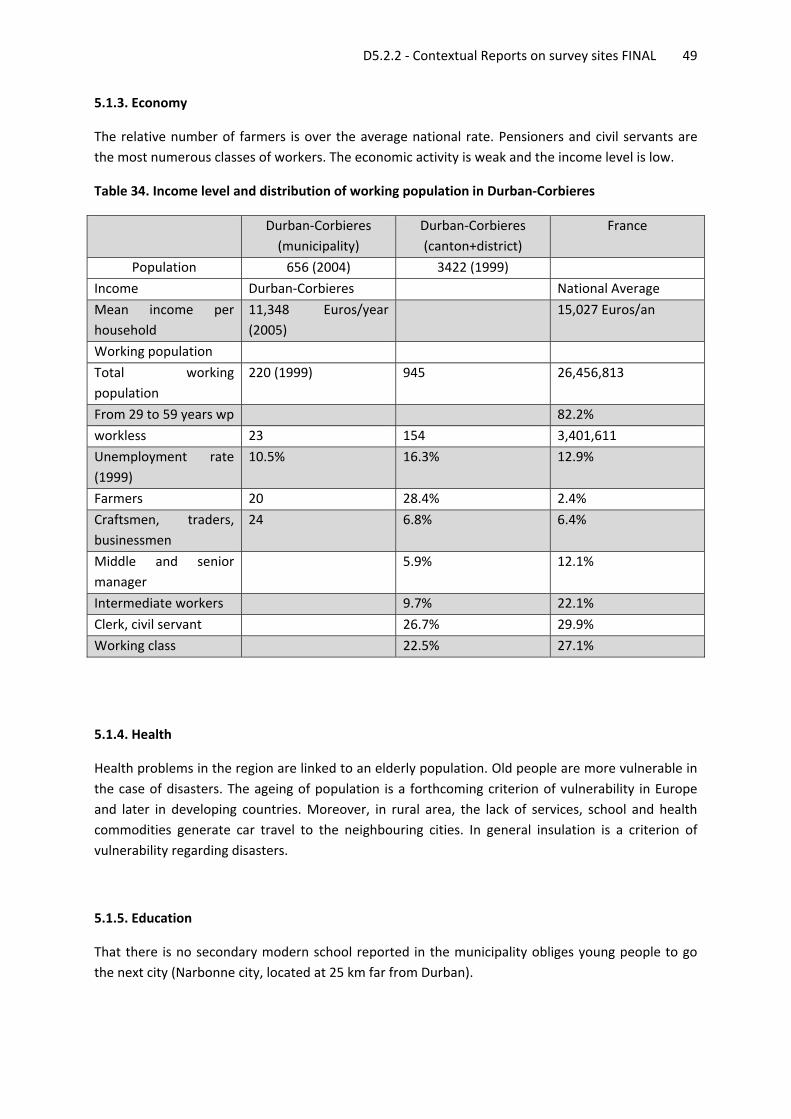
D5.2.2 ‐ Contextual Reports on survey sites FINAL 49
5.1.3. Economy
The relative number of farmers is over the average national rate. Pensioners and civil servants are the most numerous classes of workers. The economic activity is weak and the income level is low.
Table 34. Income level and distribution of working population in Durban‐Corbieres
Durban‐Corbieres (municipality)
Durban‐Corbieres (canton+district)
France
Population 656 (2004) 3422 (1999)
Income Durban‐Corbieres National Average
Mean income per household
11,348 Euros/year (2005)
15,027 Euros/an
Working population
Total working population
220 (1999) 945 26,456,813
From 29 to 59 years wp 82.2%
workless 23 154 3,401,611
Unemployment rate (1999)
10.5% 16.3% 12.9%
Farmers 20 28.4% 2.4%
Craftsmen, traders, businessmen
24 6.8% 6.4%
Middle and senior manager
5.9% 12.1%
Intermediate workers 9.7% 22.1%
Clerk, civil servant 26.7% 29.9%
Working class 22.5% 27.1%
5.1.4. Health
Health problems in the region are linked to an elderly population. Old people are more vulnerable in the case of disasters. The ageing of population is a forthcoming criterion of vulnerability in Europe and later in developing countries. Moreover, in rural area, the lack of services, school and health commodities generate car travel to the neighbouring cities. In general insulation is a criterion of vulnerability regarding disasters.
5.1.5. Education
That there is no secondary modern school reported in the municipality obliges young people to go the next city (Narbonne city, located at 25 km far from Durban).
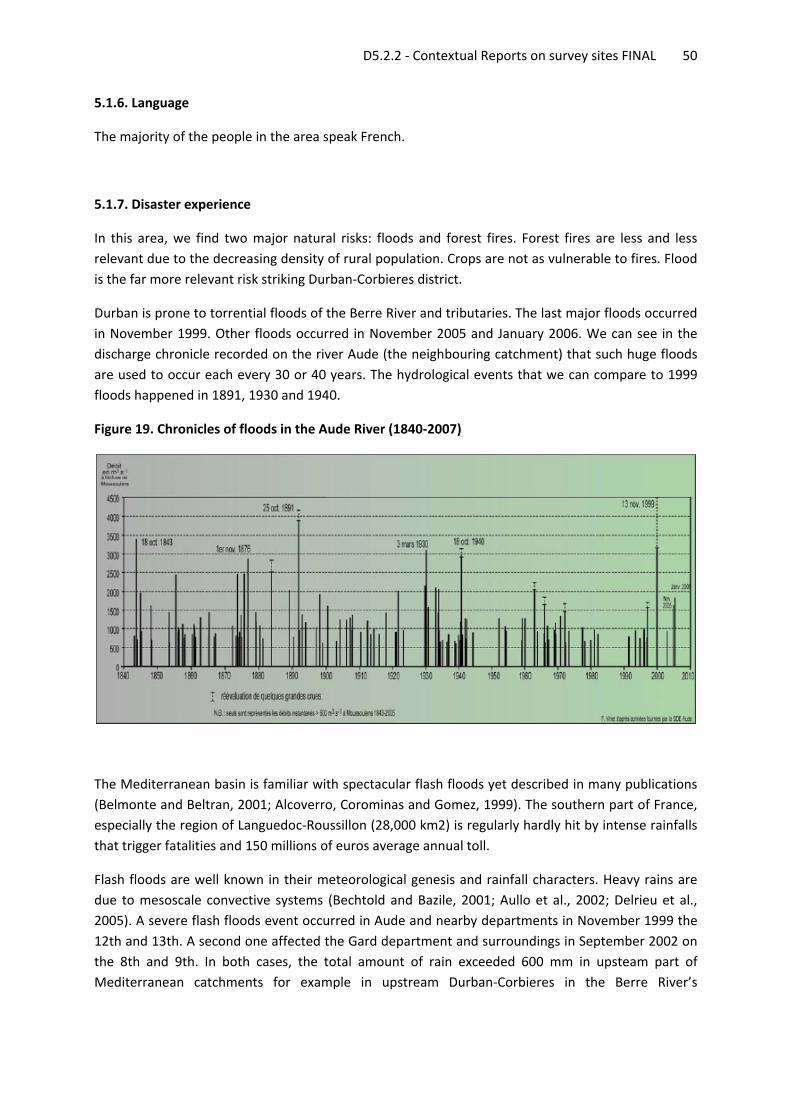
D5.2.2 ‐ Contextual Reports on survey sites FINAL 50
5.1.6. Language
The majority of the people in the area speak French.
5.1.7. Disaster experience
In this area, we find two major natural risks: floods and forest fires. Forest fires are less and less relevant due to the decreasing density of rural population. Crops are not as vulnerable to fires. Flood is the far more relevant risk striking Durban‐Corbieres district.
Durban is prone to torrential floods of the Berre River and tributaries. The last major floods occurred in November 1999. Other floods occurred in November 2005 and January 2006. We can see in the discharge chronicle recorded on the river Aude (the neighbouring catchment) that such huge floods are used to occur each every 30 or 40 years. The hydrological events that we can compare to 1999 floods happened in 1891, 1930 and 1940.
Figure 19. Chronicles of floods in the Aude River (1840‐2007)
The Mediterranean basin is familiar with spectacular flash floods yet described in many publications (Belmonte and Beltran, 2001; Alcoverro, Corominas and Gomez, 1999). The southern part of France, especially the region of Languedoc‐Roussillon (28,000 km2) is regularly hardly hit by intense rainfalls that trigger fatalities and 150 millions of euros average annual toll.
Flash floods are well known in their meteorological genesis and rainfall characters. Heavy rains are due to mesoscale convective systems (Bechtold and Bazile, 2001; Aullo et al., 2002; Delrieu et al., 2005). A severe flash floods event occurred in Aude and nearby departments in November 1999 the 12th and 13th. A second one affected the Gard department and surroundings in September 2002 on the 8th and 9th. In both cases, the total amount of rain exceeded 600 mm in upsteam part of Mediterranean catchments for example in upstream Durban‐Corbieres in the Berre River’s
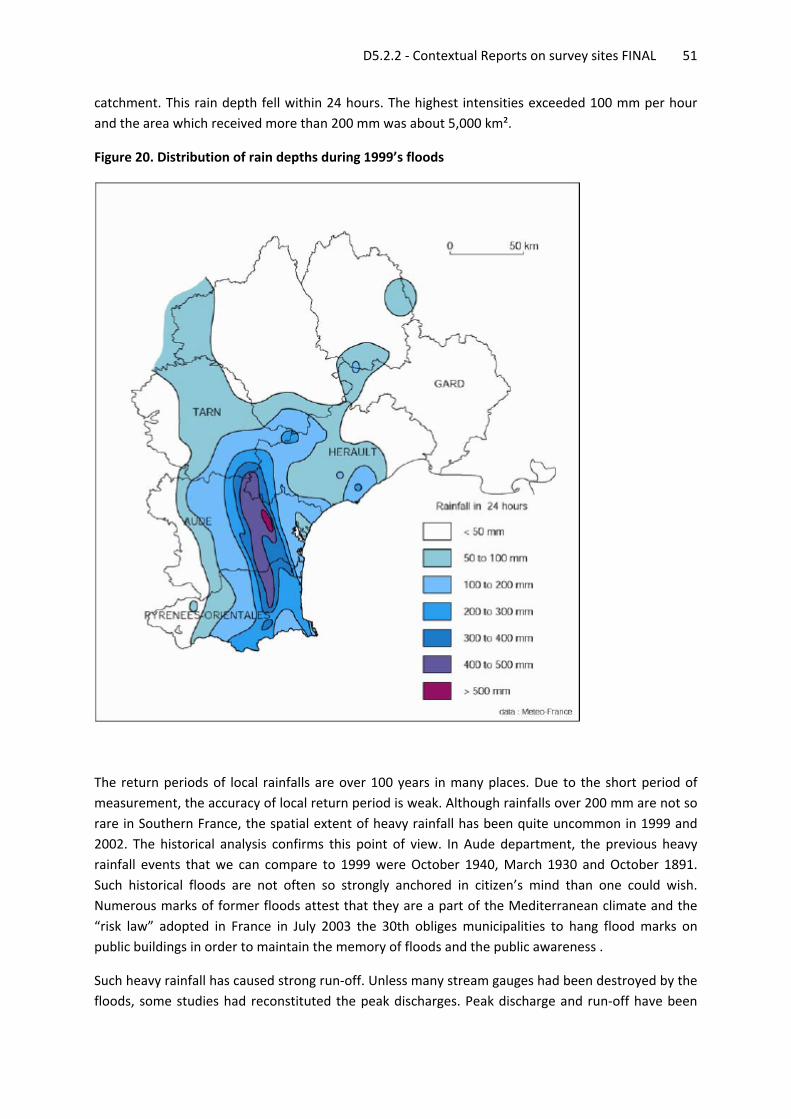
D5.2.2 ‐ Contextual Reports on survey sites FINAL 51
catchment. This rain depth fell within 24 hours. The highest intensities exceeded 100 mm per hour and the area which received more than 200 mm was about 5,000 km².
Figure 20. Distribution of rain depths during 1999’s floods
The return periods of local rainfalls are over 100 years in many places. Due to the short period of measurement, the accuracy of local return period is weak. Although rainfalls over 200 mm are not so rare in Southern France, the spatial extent of heavy rainfall has been quite uncommon in 1999 and 2002. The historical analysis confirms this point of view. In Aude department, the previous heavy rainfall events that we can compare to 1999 were October 1940, March 1930 and October 1891. Such historical floods are not often so strongly anchored in citizen’s mind than one could wish. Numerous marks of former floods attest that they are a part of the Mediterranean climate and the “risk law” adopted in France in July 2003 the 30th obliges municipalities to hang flood marks on public buildings in order to maintain the memory of floods and the public awareness .
Such heavy rainfall has caused strong run‐off. Unless many stream gauges had been destroyed by the floods, some studies had reconstituted the peak discharges. Peak discharge and run‐off have been
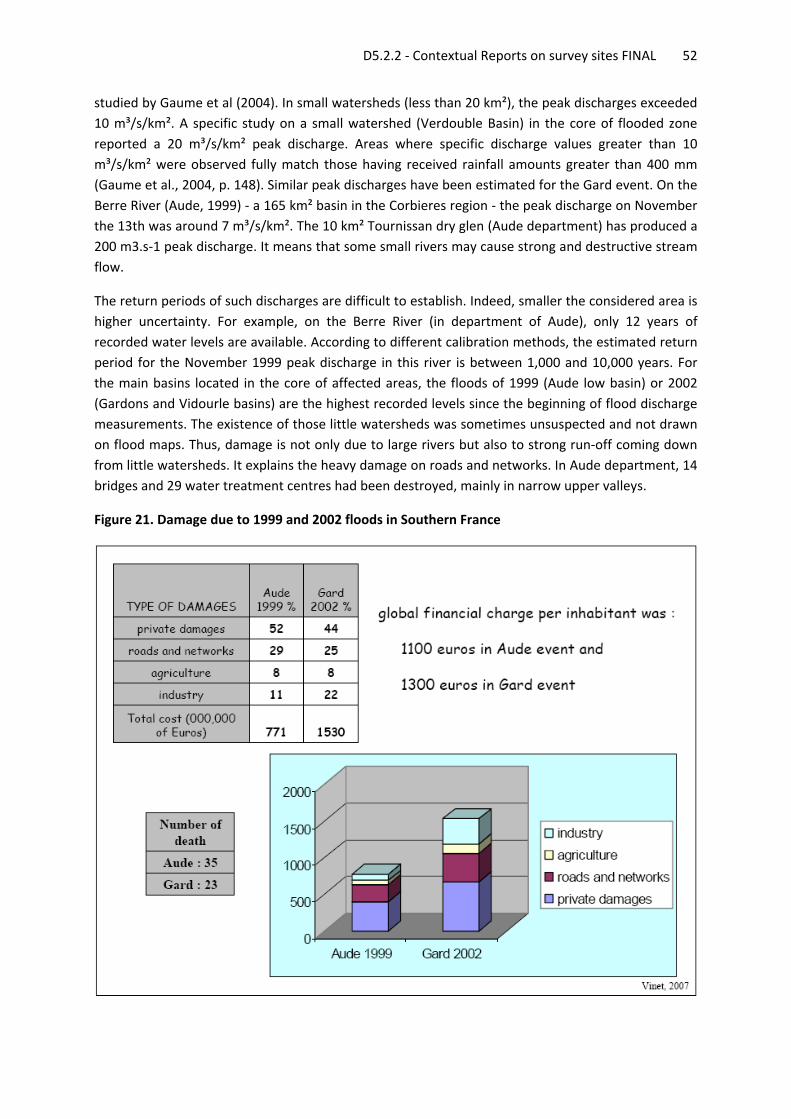
D5.2.2 ‐ Contextual Reports on survey sites FINAL 52
studied by Gaume et al (2004). In small watersheds (less than 20 km²), the peak discharges exceeded 10 m³/s/km². A specific study on a small watershed (Verdouble Basin) in the core of flooded zone reported a 20 m³/s/km² peak discharge. Areas where specific discharge values greater than 10 m³/s/km² were observed fully match those having received rainfall amounts greater than 400 mm (Gaume et al., 2004, p. 148). Similar peak discharges have been estimated for the Gard event. On the Berre River (Aude, 1999) ‐ a 165 km² basin in the Corbieres region ‐ the peak discharge on November the 13th was around 7 m³/s/km². The 10 km² Tournissan dry glen (Aude department) has produced a 200 m3.s‐1 peak discharge. It means that some small rivers may cause strong and destructive stream flow.
The return periods of such discharges are difficult to establish. Indeed, smaller the considered area is higher uncertainty. For example, on the Berre River (in department of Aude), only 12 years of recorded water levels are available. According to different calibration methods, the estimated return period for the November 1999 peak discharge in this river is between 1,000 and 10,000 years. For the main basins located in the core of affected areas, the floods of 1999 (Aude low basin) or 2002 (Gardons and Vidourle basins) are the highest recorded levels since the beginning of flood discharge measurements. The existence of those little watersheds was sometimes unsuspected and not drawn on flood maps. Thus, damage is not only due to large rivers but also to strong run‐off coming down from little watersheds. It explains the heavy damage on roads and networks. In Aude department, 14 bridges and 29 water treatment centres had been destroyed, mainly in narrow upper valleys.
Figure 21. Damage due to 1999 and 2002 floods in Southern France
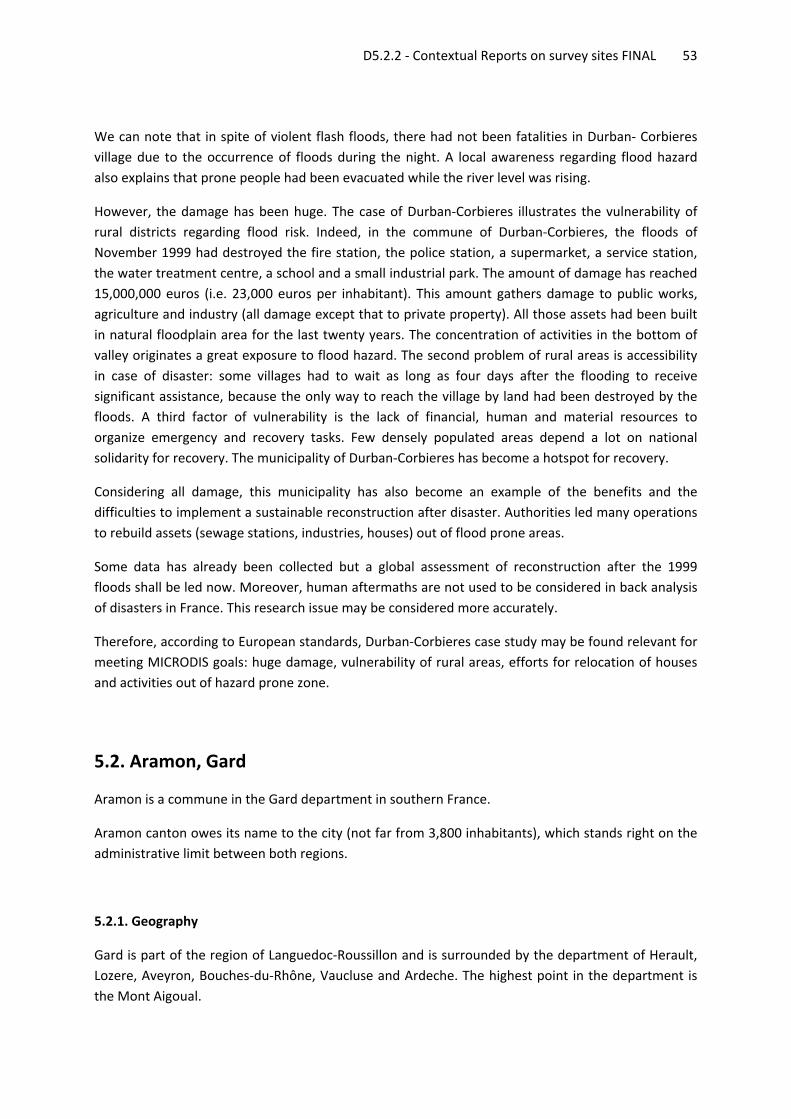
D5.2.2 ‐ Contextual Reports on survey sites FINAL 53
We can note that in spite of violent flash floods, there had not been fatalities in Durban‐ Corbieres village due to the occurrence of floods during the night. A local awareness regarding flood hazard also explains that prone people had been evacuated while the river level was rising.
However, the damage has been huge. The case of Durban‐Corbieres illustrates the vulnerability of rural districts regarding flood risk. Indeed, in the commune of Durban‐Corbieres, the floods of November 1999 had destroyed the fire station, the police station, a supermarket, a service station, the water treatment centre, a school and a small industrial park. The amount of damage has reached 15,000,000 euros (i.e. 23,000 euros per inhabitant). This amount gathers damage to public works, agriculture and industry (all damage except that to private property). All those assets had been built in natural floodplain area for the last twenty years. The concentration of activities in the bottom of valley originates a great exposure to flood hazard. The second problem of rural areas is accessibility in case of disaster: some villages had to wait as long as four days after the flooding to receive significant assistance, because the only way to reach the village by land had been destroyed by the floods. A third factor of vulnerability is the lack of financial, human and material resources to organize emergency and recovery tasks. Few densely populated areas depend a lot on national solidarity for recovery. The municipality of Durban‐Corbieres has become a hotspot for recovery.
Considering all damage, this municipality has also become an example of the benefits and the difficulties to implement a sustainable reconstruction after disaster. Authorities led many operations to rebuild assets (sewage stations, industries, houses) out of flood prone areas.
Some data has already been collected but a global assessment of reconstruction after the 1999 floods shall be led now. Moreover, human aftermaths are not used to be considered in back analysis of disasters in France. This research issue may be considered more accurately.
Therefore, according to European standards, Durban‐Corbieres case study may be found relevant for meeting MICRODIS goals: huge damage, vulnerability of rural areas, efforts for relocation of houses and activities out of hazard prone zone.
5.2. Aramon, Gard
Aramon is a commune in the Gard department in southern France.
Aramon canton owes its name to the city (not far from 3,800 inhabitants), which stands right on the administrative limit between both regions.
5.2.1. Geography
Gard is part of the region of Languedoc‐Roussillon and is surrounded by the department of Herault, Lozere, Aveyron, Bouches‐du‐Rhône, Vaucluse and Ardeche. The highest point in the department is the Mont Aigoual.
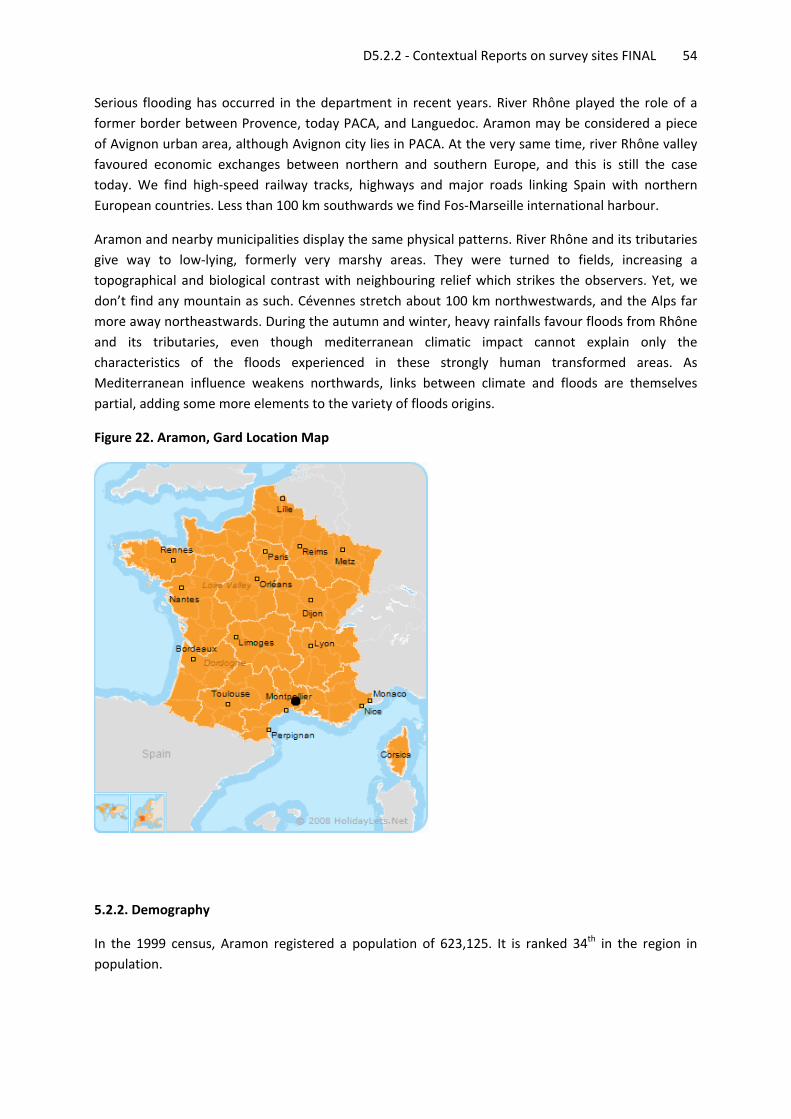
D5.2.2 ‐ Contextual Reports on survey sites FINAL 54
Serious flooding has occurred in the department in recent years. River Rhône played the role of a former border between Provence, today PACA, and Languedoc. Aramon may be considered a piece of Avignon urban area, although Avignon city lies in PACA. At the very same time, river Rhône valley favoured economic exchanges between northern and southern Europe, and this is still the case today. We find high‐speed railway tracks, highways and major roads linking Spain with northern European countries. Less than 100 km southwards we find Fos‐Marseille international harbour.
Aramon and nearby municipalities display the same physical patterns. River Rhône and its tributaries give way to low‐lying, formerly very marshy areas. They were turned to fields, increasing a topographical and biological contrast with neighbouring relief which strikes the observers. Yet, we don’t find any mountain as such. Cévennes stretch about 100 km northwestwards, and the Alps far more away northeastwards. During the autumn and winter, heavy rainfalls favour floods from Rhône and its tributaries, even though mediterranean climatic impact cannot explain only the characteristics of the floods experienced in these strongly human transformed areas. As Mediterranean influence weakens northwards, links between climate and floods are themselves partial, adding some more elements to the variety of floods origins.
Figure 22. Aramon, Gard Location Map
5.2.2. Demography
In the 1999 census, Aramon registered a population of 623,125. It is ranked 34th in the region in population.
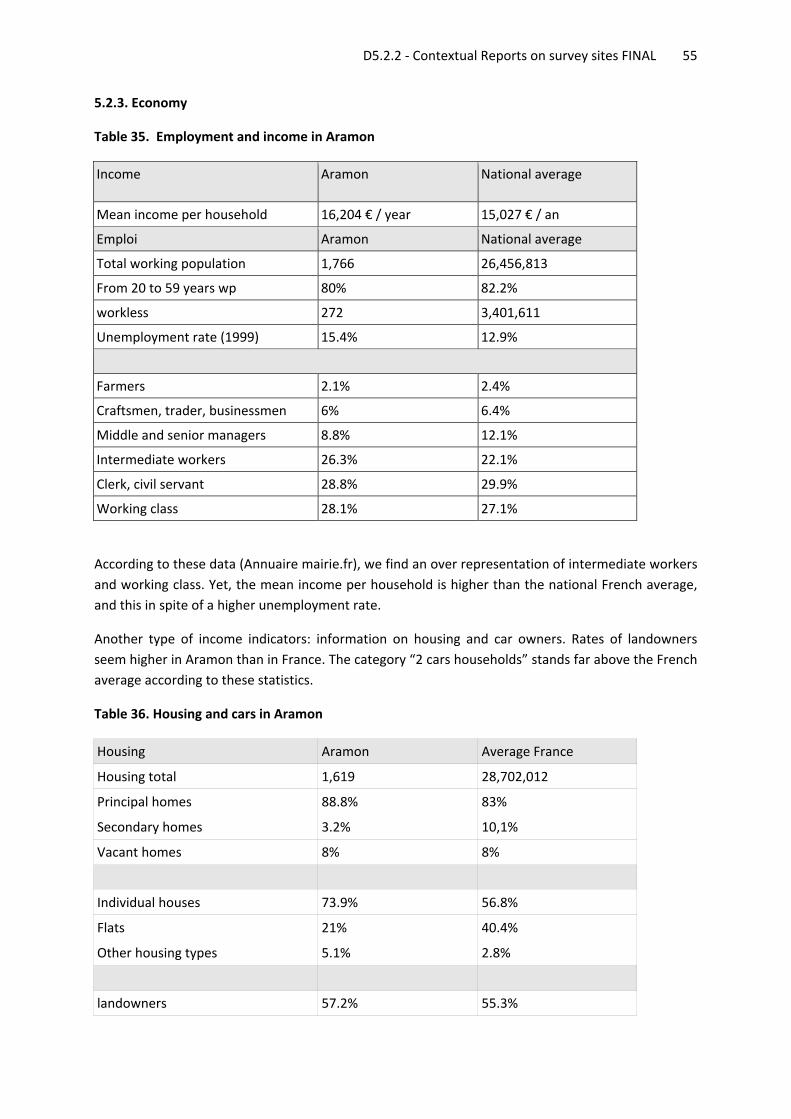
D5.2.2 ‐ Contextual Reports on survey sites FINAL 55
5.2.3. Economy
Table 35. Employment and income in Aramon
Income Aramon National average
Mean income per household 16,204 € / year 15,027 € / an
Emploi Aramon National average
Total working population 1,766 26,456,813
From 20 to 59 years wp 80% 82.2%
workless 272 3,401,611
Unemployment rate (1999) 15.4% 12.9%
Farmers 2.1% 2.4%
Craftsmen, trader, businessmen 6% 6.4%
Middle and senior managers 8.8% 12.1%
Intermediate workers 26.3% 22.1%
Clerk, civil servant 28.8% 29.9%
Working class 28.1% 27.1%
According to these data (Annuaire mairie.fr), we find an over representation of intermediate workers and working class. Yet, the mean income per household is higher than the national French average, and this in spite of a higher unemployment rate.
Another type of income indicators: information on housing and car owners. Rates of landowners seem higher in Aramon than in France. The category “2 cars households” stands far above the French average according to these statistics.
Table 36. Housing and cars in Aramon
Housing Aramon Average France
Housing total 1,619 28,702,012
Principal homes 88.8% 83%
Secondary homes 3.2% 10,1%
Vacant homes 8% 8%
Individual houses 73.9% 56.8%
Flats 21% 40.4%
Other housing types 5.1% 2.8%
landowners 57.2% 55.3%
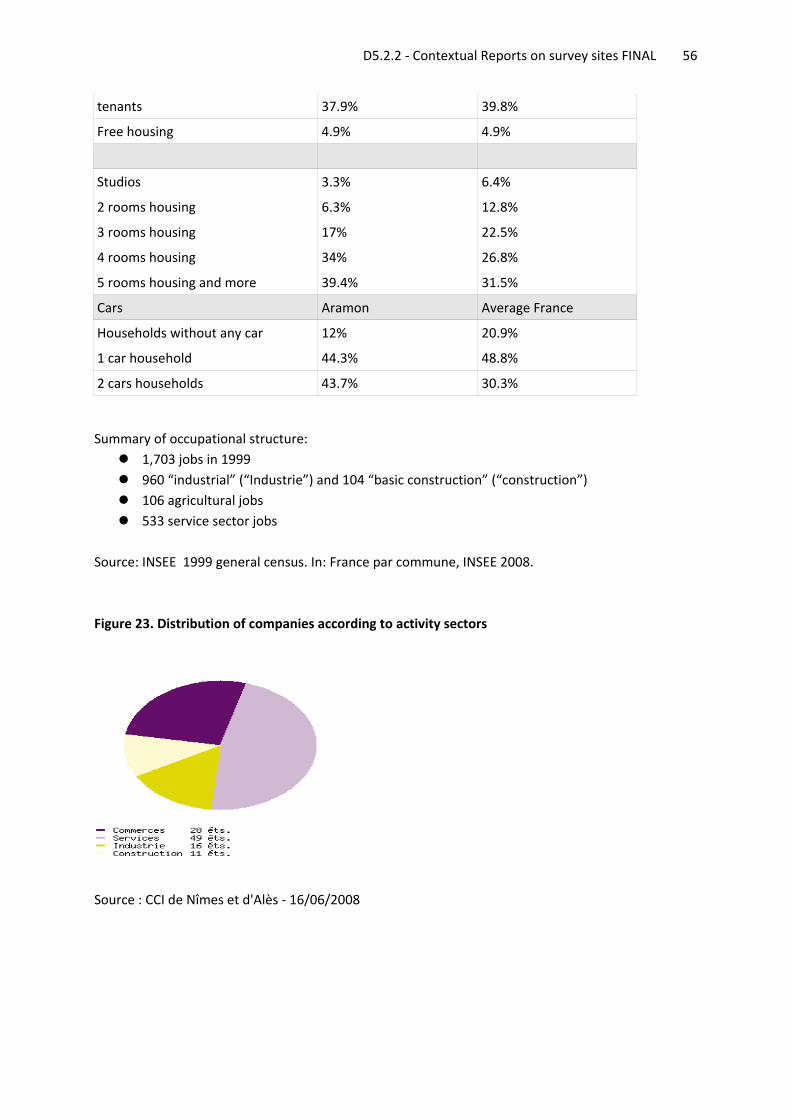
D5.2.2 ‐ Contextual Reports on survey sites FINAL 56
tenants 37.9% 39.8%
Free housing 4.9% 4.9%
Studios 3.3% 6.4%
2 rooms housing 6.3% 12.8%
3 rooms housing 17% 22.5%
4 rooms housing 34% 26.8%
5 rooms housing and more 39.4% 31.5%
Cars Aramon Average France
Households without any car 12% 20.9%
1 car household 44.3% 48.8%
2 cars households 43.7% 30.3%
Summary of occupational structure: 1,703 jobs in 1999 960 “industrial” (“Industrie”) and 104 “basic construction” (“construction”) 106 agricultural jobs 533 service sector jobs
Source: INSEE 1999 general census. In: France par commune, INSEE 2008. Figure 23. Distribution of companies according to activity sectors
Source : CCI de Nîmes et d'Alès ‐ 16/06/2008
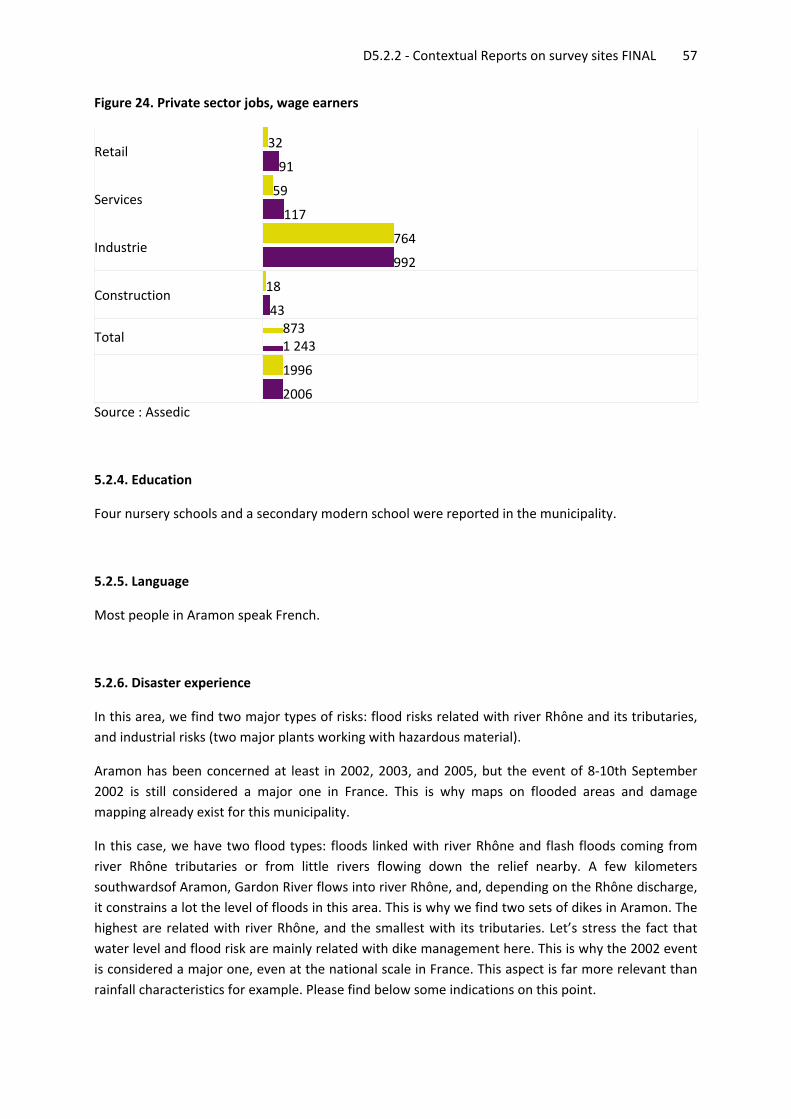
D5.2.2 ‐ Contextual Reports on survey sites FINAL 57
Figure 24. Private sector jobs, wage earners
Retail 32
91
Services 59
117
Industrie 764
992
Construction 18
43
Total 873 1 243
1996
2006 Source : Assedic
5.2.4. Education
Four nursery schools and a secondary modern school were reported in the municipality.
5.2.5. Language
Most people in Aramon speak French.
5.2.6. Disaster experience
In this area, we find two major types of risks: flood risks related with river Rhône and its tributaries, and industrial risks (two major plants working with hazardous material).
Aramon has been concerned at least in 2002, 2003, and 2005, but the event of 8‐10th September 2002 is still considered a major one in France. This is why maps on flooded areas and damage mapping already exist for this municipality.
In this case, we have two flood types: floods linked with river Rhône and flash floods coming from river Rhône tributaries or from little rivers flowing down the relief nearby. A few kilometers southwardsof Aramon, Gardon River flows into river Rhône, and, depending on the Rhône discharge, it constrains a lot the level of floods in this area. This is why we find two sets of dikes in Aramon. The highest are related with river Rhône, and the smallest with its tributaries. Let’s stress the fact that water level and flood risk are mainly related with dike management here. This is why the 2002 event is considered a major one, even at the national scale in France. This aspect is far more relevant than rainfall characteristics for example. Please find below some indications on this point.
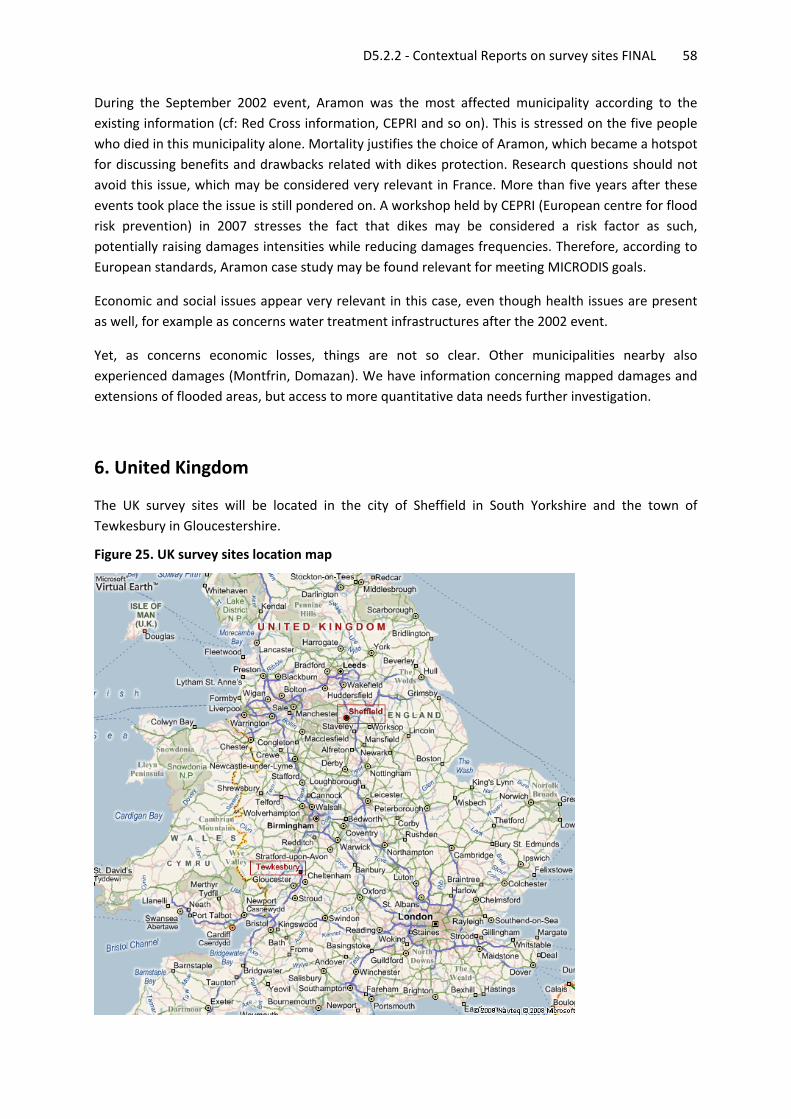
D5.2.2 ‐ Contextual Reports on survey sites FINAL 58
During the September 2002 event, Aramon was the most affected municipality according to the existing information (cf: Red Cross information, CEPRI and so on). This is stressed on the five people who died in this municipality alone. Mortality justifies the choice of Aramon, which became a hotspot for discussing benefits and drawbacks related with dikes protection. Research questions should not avoid this issue, which may be considered very relevant in France. More than five years after these events took place the issue is still pondered on. A workshop held by CEPRI (European centre for flood risk prevention) in 2007 stresses the fact that dikes may be considered a risk factor as such, potentially raising damages intensities while reducing damages frequencies. Therefore, according to European standards, Aramon case study may be found relevant for meeting MICRODIS goals.
Economic and social issues appear very relevant in this case, even though health issues are present as well, for example as concerns water treatment infrastructures after the 2002 event.
Yet, as concerns economic losses, things are not so clear. Other municipalities nearby also experienced damages (Montfrin, Domazan). We have information concerning mapped damages and extensions of flooded areas, but access to more quantitative data needs further investigation.
6. United Kingdom
The UK survey sites will be located in the city of Sheffield in South Yorkshire and the town of Tewkesbury in Gloucestershire.
Figure 25. UK survey sites location map
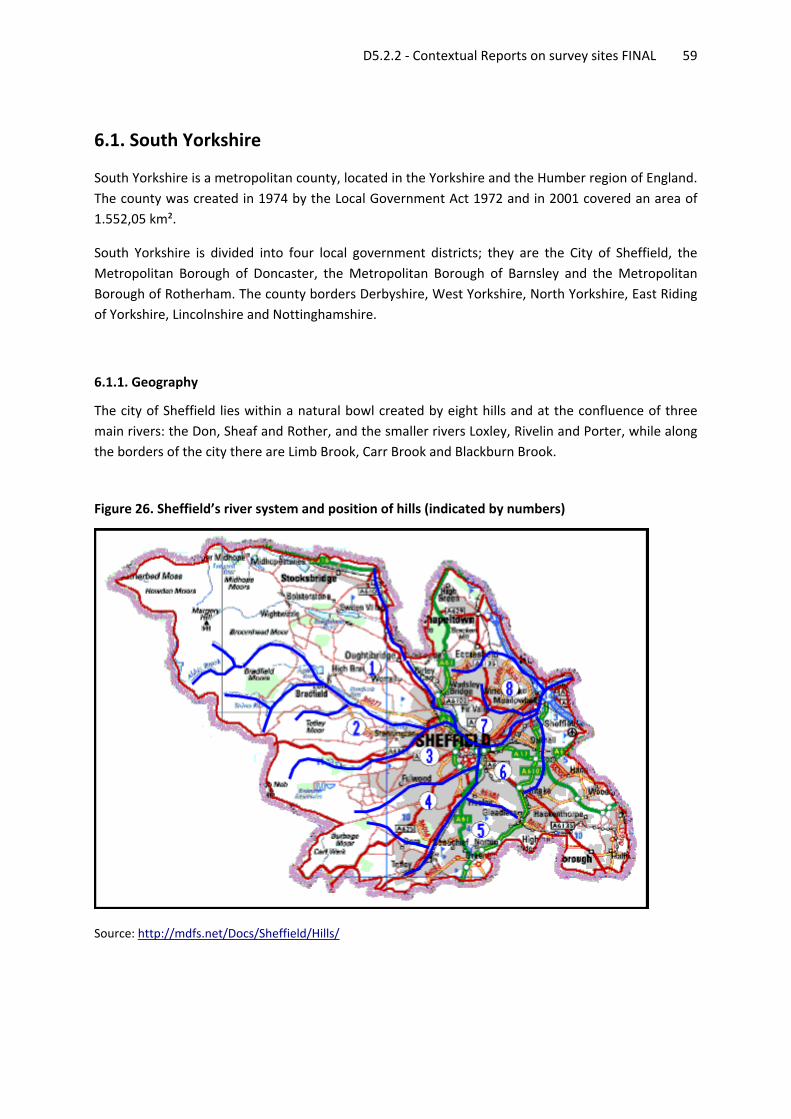
D5.2.2 ‐ Contextual Reports on survey sites FINAL 59
6.1. South Yorkshire
South Yorkshire is a metropolitan county, located in the Yorkshire and the Humber region of England. The county was created in 1974 by the Local Government Act 1972 and in 2001 covered an area of 1.552,05 km².
South Yorkshire is divided into four local government districts; they are the City of Sheffield, the Metropolitan Borough of Doncaster, the Metropolitan Borough of Barnsley and the Metropolitan Borough of Rotherham. The county borders Derbyshire, West Yorkshire, North Yorkshire, East Riding of Yorkshire, Lincolnshire and Nottinghamshire.
6.1.1. Geography
The city of Sheffield lies within a natural bowl created by eight hills and at the confluence of three main rivers: the Don, Sheaf and Rother, and the smaller rivers Loxley, Rivelin and Porter, while along the borders of the city there are Limb Brook, Carr Brook and Blackburn Brook.
Figure 26. Sheffield’s river system and position of hills (indicated by numbers)
Source: http://mdfs.net/Docs/Sheffield/Hills/
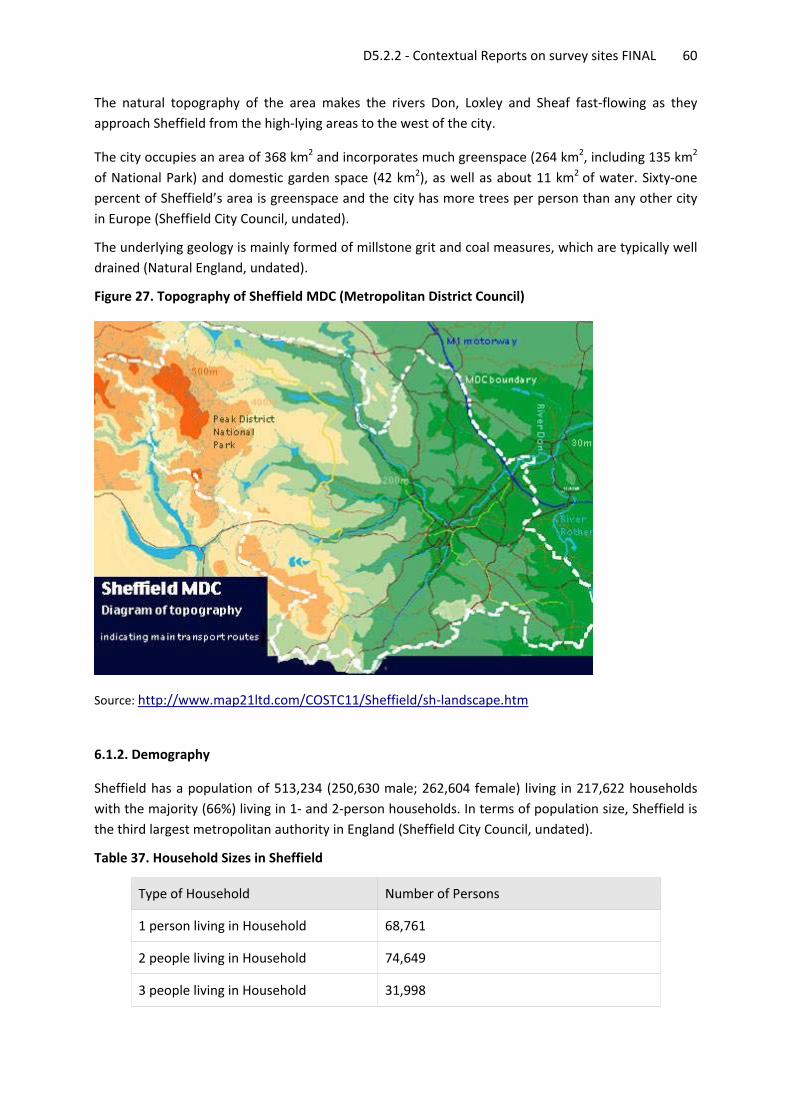
D5.2.2 ‐ Contextual Reports on survey sites FINAL 60
The natural topography of the area makes the rivers Don, Loxley and Sheaf fast‐flowing as they approach Sheffield from the high‐lying areas to the west of the city.
The city occupies an area of 368 km2 and incorporates much greenspace (264 km2, including 135 km2
of National Park) and domestic garden space (42 km2), as well as about 11 km2 of water. Sixty‐one percent of Sheffield’s area is greenspace and the city has more trees per person than any other city in Europe (Sheffield City Council, undated).
The underlying geology is mainly formed of millstone grit and coal measures, which are typically well drained (Natural England, undated).
Figure 27. Topography of Sheffield MDC (Metropolitan District Council)
Source: http://www.map21ltd.com/COSTC11/Sheffield/sh‐landscape.htm
6.1.2. Demography
Sheffield has a population of 513,234 (250,630 male; 262,604 female) living in 217,622 households with the majority (66%) living in 1‐ and 2‐person households. In terms of population size, Sheffield is the third largest metropolitan authority in England (Sheffield City Council, undated).
Table 37. Household Sizes in Sheffield
Type of Household Number of Persons
1 person living in Household 68,761
2 people living in Household 74,649
3 people living in Household 31,998
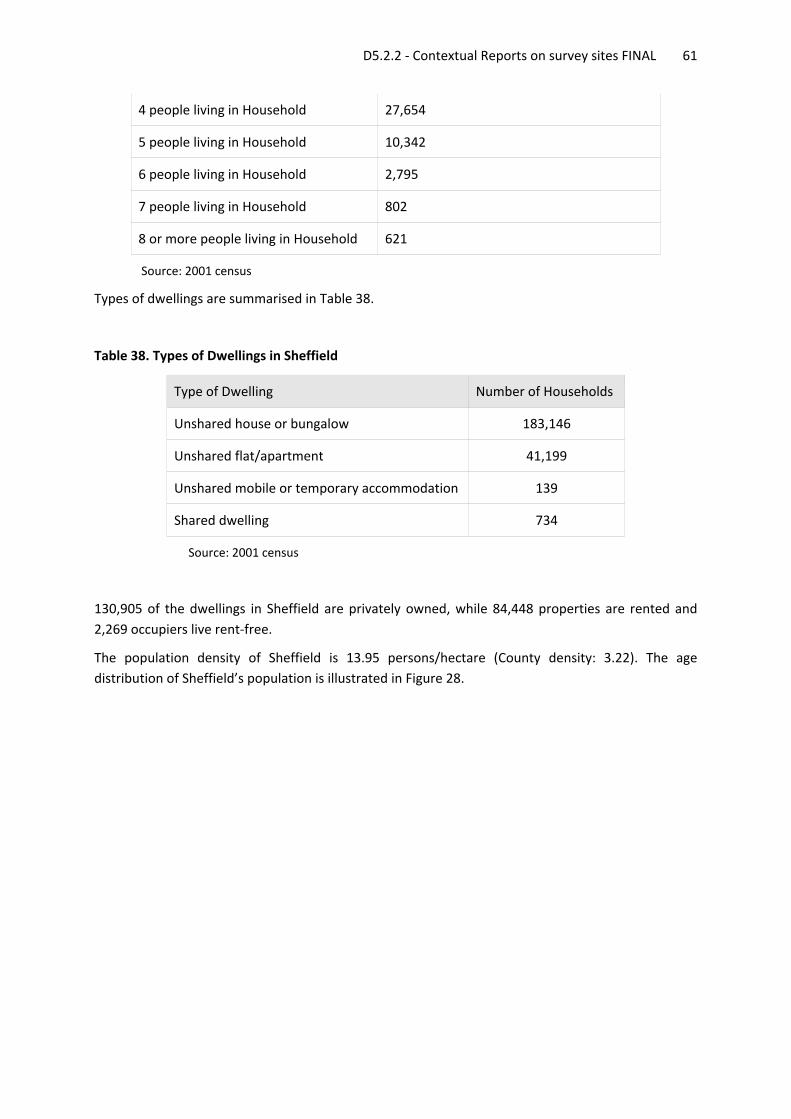
D5.2.2 ‐ Contextual Reports on survey sites FINAL 61
4 people living in Household 27,654
5 people living in Household 10,342
6 people living in Household 2,795
7 people living in Household 802
8 or more people living in Household 621
Source: 2001 census
Types of dwellings are summarised in Table 38.
Table 38. Types of Dwellings in Sheffield
Type of Dwelling Number of Households
Unshared house or bungalow 183,146
Unshared flat/apartment 41,199
Unshared mobile or temporary accommodation 139
Shared dwelling 734
Source: 2001 census
130,905 of the dwellings in Sheffield are privately owned, while 84,448 properties are rented and 2,269 occupiers live rent‐free.
The population density of Sheffield is 13.95 persons/hectare (County density: 3.22). The age distribution of Sheffield’s population is illustrated in Figure 28.
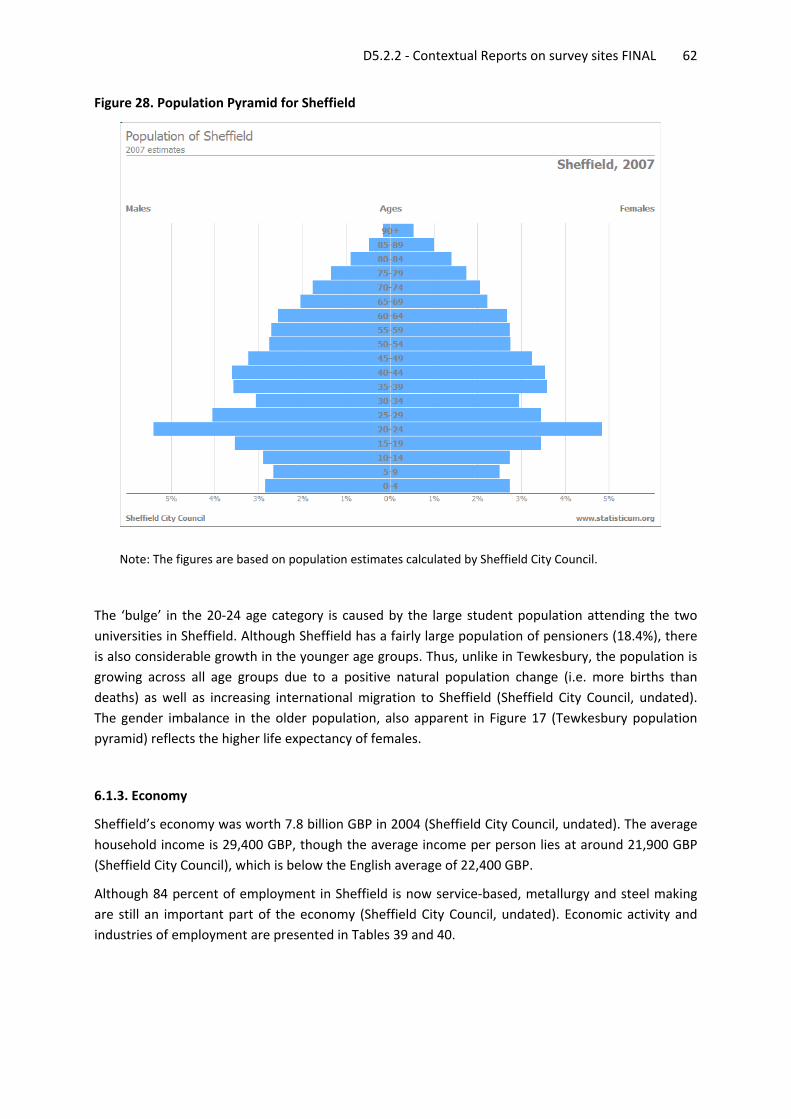
D5.2.2 ‐ Contextual Reports on survey sites FINAL 62
Figure 28. Population Pyramid for Sheffield
Note: The figures are based on population estimates calculated by Sheffield City Council.
The ‘bulge’ in the 20‐24 age category is caused by the large student population attending the two universities in Sheffield. Although Sheffield has a fairly large population of pensioners (18.4%), there is also considerable growth in the younger age groups. Thus, unlike in Tewkesbury, the population is growing across all age groups due to a positive natural population change (i.e. more births than deaths) as well as increasing international migration to Sheffield (Sheffield City Council, undated). The gender imbalance in the older population, also apparent in Figure 17 (Tewkesbury population pyramid) reflects the higher life expectancy of females.
6.1.3. Economy
Sheffield’s economy was worth 7.8 billion GBP in 2004 (Sheffield City Council, undated). The average household income is 29,400 GBP, though the average income per person lies at around 21,900 GBP (Sheffield City Council), which is below the English average of 22,400 GBP.
Although 84 percent of employment in Sheffield is now service‐based, metallurgy and steel making are still an important part of the economy (Sheffield City Council, undated). Economic activity and industries of employment are presented in Tables 39 and 40.
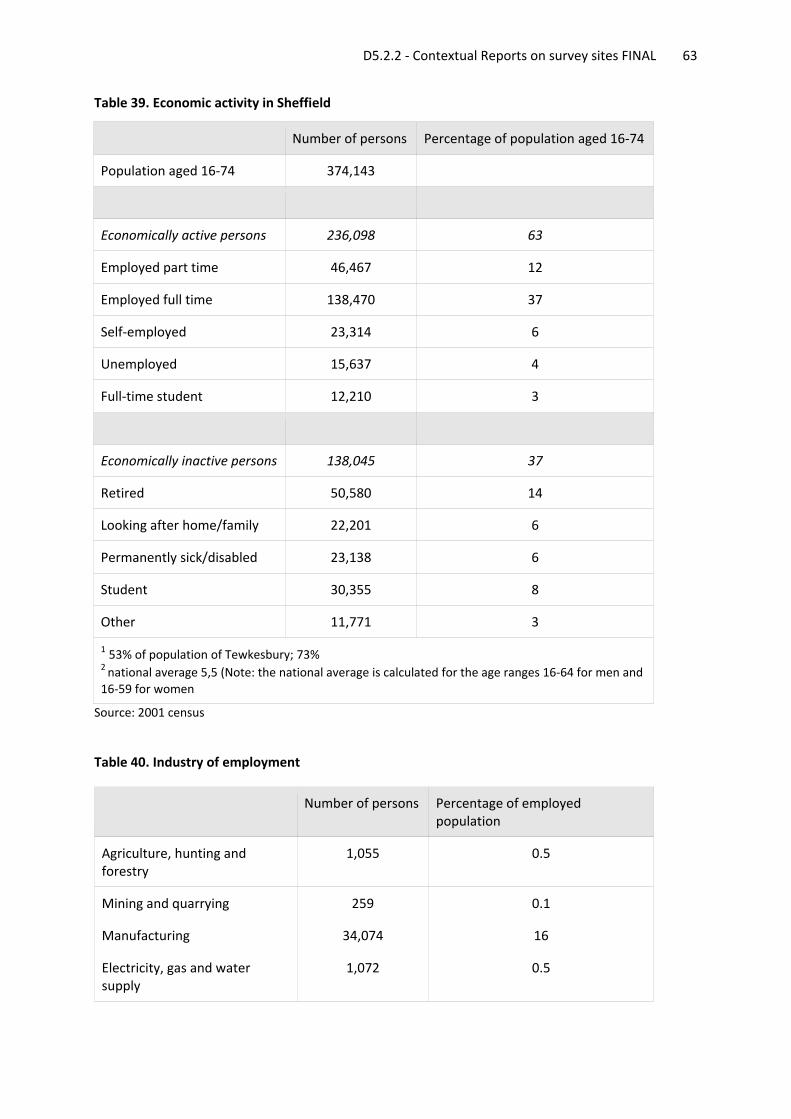
D5.2.2 ‐ Contextual Reports on survey sites FINAL 63
Table 39. Economic activity in Sheffield
Number of persons Percentage of population aged 16‐74
Population aged 16‐74 374,143
Economically active persons 236,098 63
Employed part time 46,467 12
Employed full time 138,470 37
Self‐employed 23,314 6
Unemployed 15,637 4
Full‐time student 12,210 3
Economically inactive persons 138,045 37
Retired 50,580 14
Looking after home/family 22,201 6
Permanently sick/disabled 23,138 6
Student 30,355 8
Other 11,771 3
1 53% of population of Tewkesbury; 73% 2 national average 5,5 (Note: the national average is calculated for the age ranges 16‐64 for men and 16‐59 for women
Source: 2001 census Table 40. Industry of employment
Number of persons Percentage of employed population
Agriculture, hunting and forestry
1,055 0.5
Mining and quarrying 259 0.1
Manufacturing 34,074 16
Electricity, gas and water supply
1,072 0.5
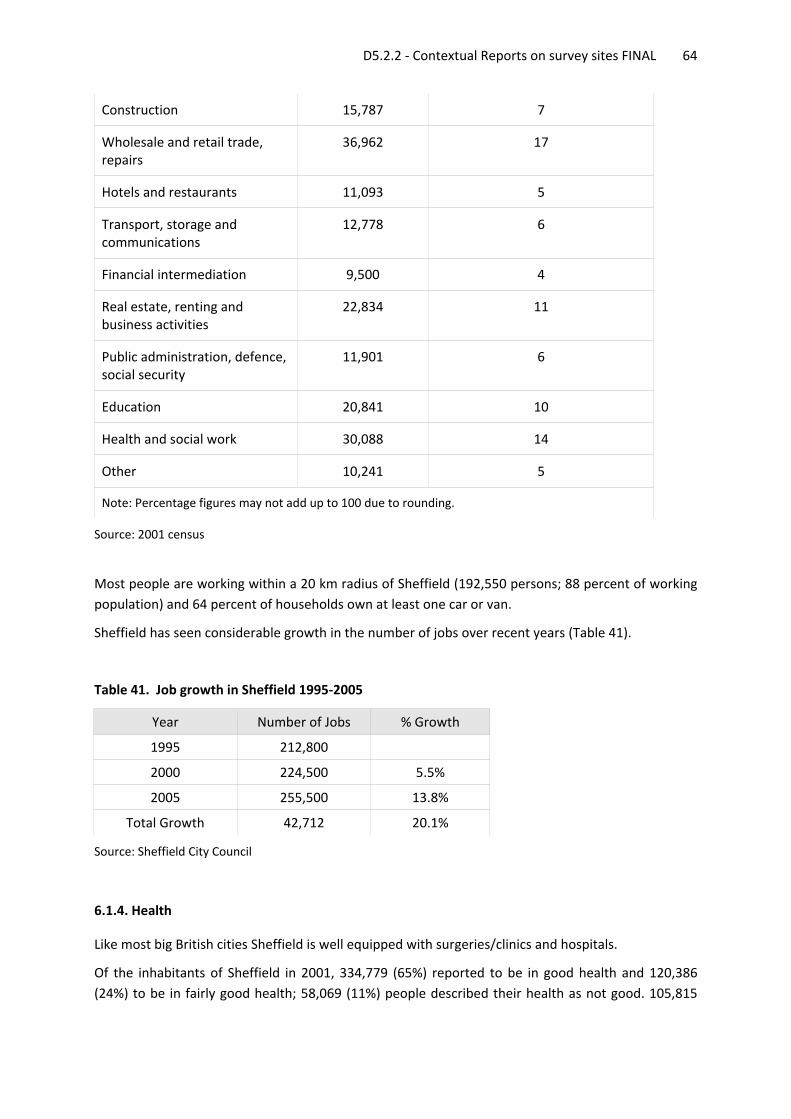
D5.2.2 ‐ Contextual Reports on survey sites FINAL 64
Construction 15,787 7
Wholesale and retail trade, repairs
36,962 17
Hotels and restaurants 11,093 5
Transport, storage and communications
12,778 6
Financial intermediation 9,500 4
Real estate, renting and business activities
22,834 11
Public administration, defence, social security
11,901 6
Education 20,841 10
Health and social work 30,088 14
Other 10,241 5
Note: Percentage figures may not add up to 100 due to rounding.
Source: 2001 census
Most people are working within a 20 km radius of Sheffield (192,550 persons; 88 percent of working population) and 64 percent of households own at least one car or van.
Sheffield has seen considerable growth in the number of jobs over recent years (Table 41).
Table 41. Job growth in Sheffield 1995‐2005
Year Number of Jobs % Growth
1995 212,800
2000 224,500 5.5%
2005 255,500 13.8%
Total Growth 42,712 20.1%
Source: Sheffield City Council
6.1.4. Health
Like most big British cities Sheffield is well equipped with surgeries/clinics and hospitals.
Of the inhabitants of Sheffield in 2001, 334,779 (65%) reported to be in good health and 120,386 (24%) to be in fairly good health; 58,069 (11%) people described their health as not good. 105,815
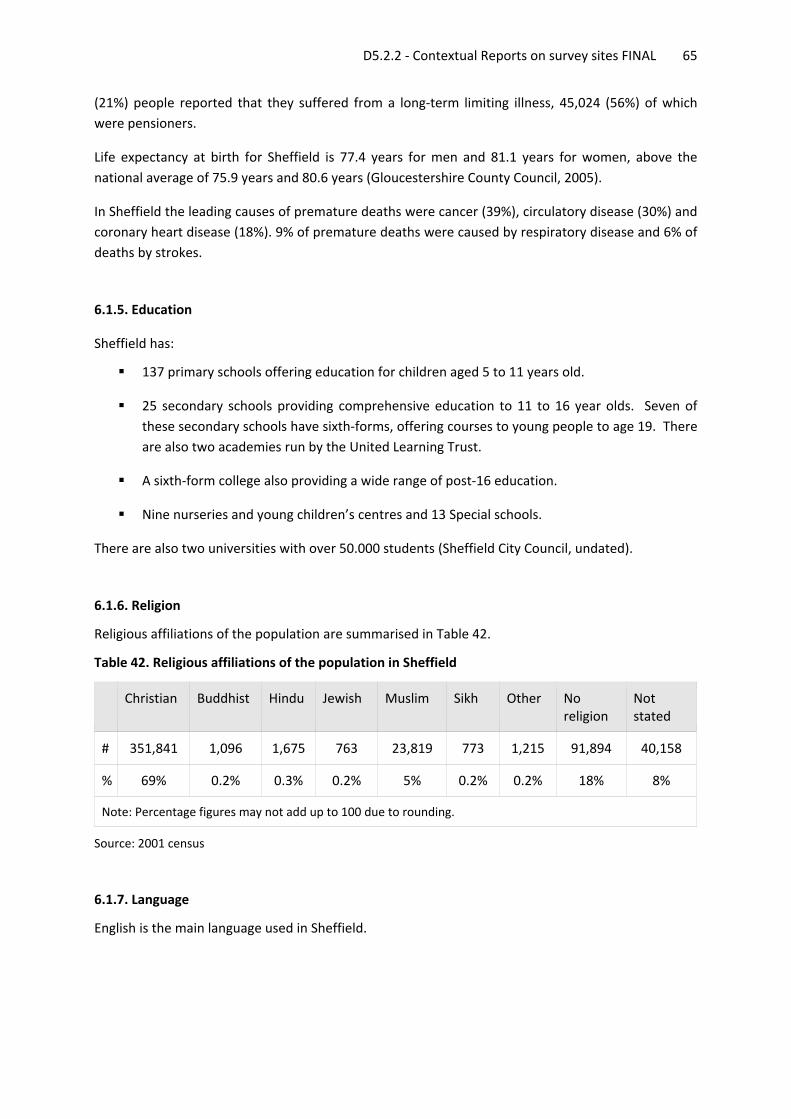
D5.2.2 ‐ Contextual Reports on survey sites FINAL 65
(21%) people reported that they suffered from a long‐term limiting illness, 45,024 (56%) of which were pensioners.
Life expectancy at birth for Sheffield is 77.4 years for men and 81.1 years for women, above the national average of 75.9 years and 80.6 years (Gloucestershire County Council, 2005).
In Sheffield the leading causes of premature deaths were cancer (39%), circulatory disease (30%) and coronary heart disease (18%). 9% of premature deaths were caused by respiratory disease and 6% of deaths by strokes.
6.1.5. Education
Sheffield has:
137 primary schools offering education for children aged 5 to 11 years old.
25 secondary schools providing comprehensive education to 11 to 16 year olds. Seven of these secondary schools have sixth‐forms, offering courses to young people to age 19. There are also two academies run by the United Learning Trust.
A sixth‐form college also providing a wide range of post‐16 education.
Nine nurseries and young children’s centres and 13 Special schools.
There are also two universities with over 50.000 students (Sheffield City Council, undated).
6.1.6. Religion
Religious affiliations of the population are summarised in Table 42.
Table 42. Religious affiliations of the population in Sheffield
Christian Buddhist Hindu Jewish Muslim Sikh Other No religion
Not stated
# 351,841 1,096 1,675 763 23,819 773 1,215 91,894 40,158
% 69% 0.2% 0.3% 0.2% 5% 0.2% 0.2% 18% 8%
Note: Percentage figures may not add up to 100 due to rounding.
Source: 2001 census
6.1.7. Language
English is the main language used in Sheffield.
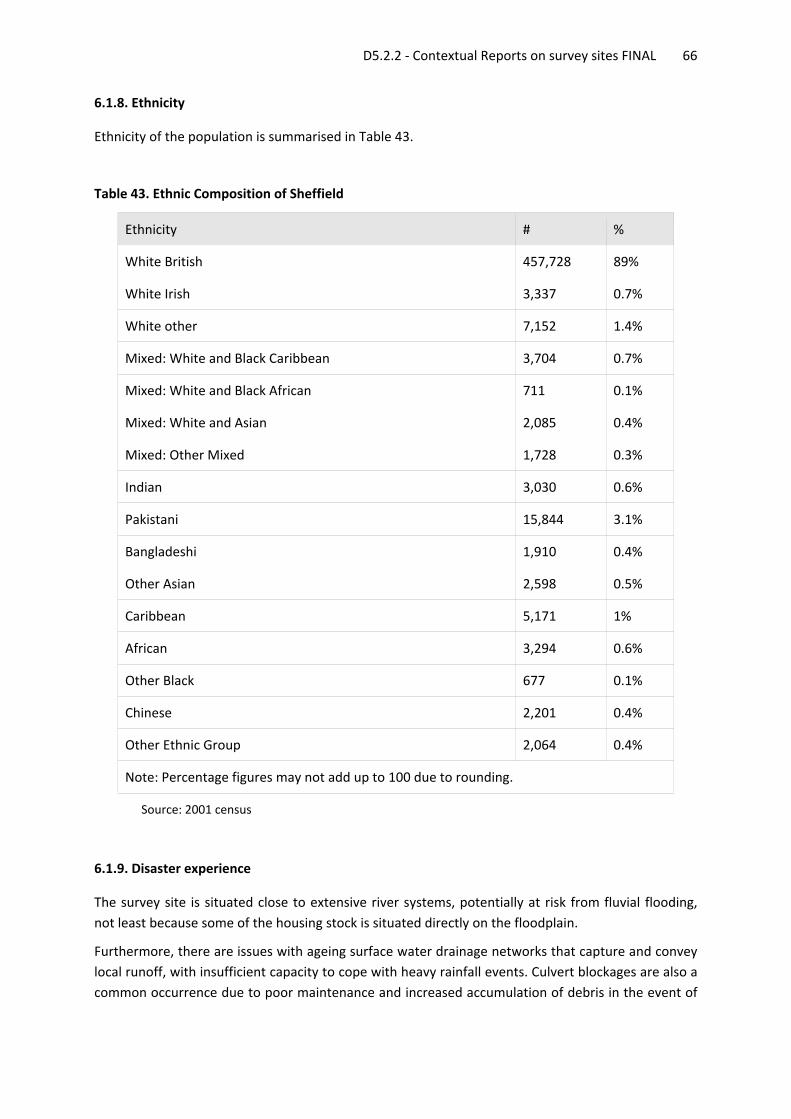
D5.2.2 ‐ Contextual Reports on survey sites FINAL 66
6.1.8. Ethnicity
Ethnicity of the population is summarised in Table 43.
Table 43. Ethnic Composition of Sheffield
Ethnicity # %
White British 457,728 89%
White Irish 3,337 0.7%
White other 7,152 1.4%
Mixed: White and Black Caribbean 3,704 0.7%
Mixed: White and Black African 711 0.1%
Mixed: White and Asian 2,085 0.4%
Mixed: Other Mixed 1,728 0.3%
Indian 3,030 0.6%
Pakistani 15,844 3.1%
Bangladeshi 1,910 0.4%
Other Asian 2,598 0.5%
Caribbean 5,171 1%
African 3,294 0.6%
Other Black 677 0.1%
Chinese 2,201 0.4%
Other Ethnic Group 2,064 0.4%
Note: Percentage figures may not add up to 100 due to rounding.
Source: 2001 census
6.1.9. Disaster experience
The survey site is situated close to extensive river systems, potentially at risk from fluvial flooding, not least because some of the housing stock is situated directly on the floodplain.
Furthermore, there are issues with ageing surface water drainage networks that capture and convey local runoff, with insufficient capacity to cope with heavy rainfall events. Culvert blockages are also a common occurrence due to poor maintenance and increased accumulation of debris in the event of
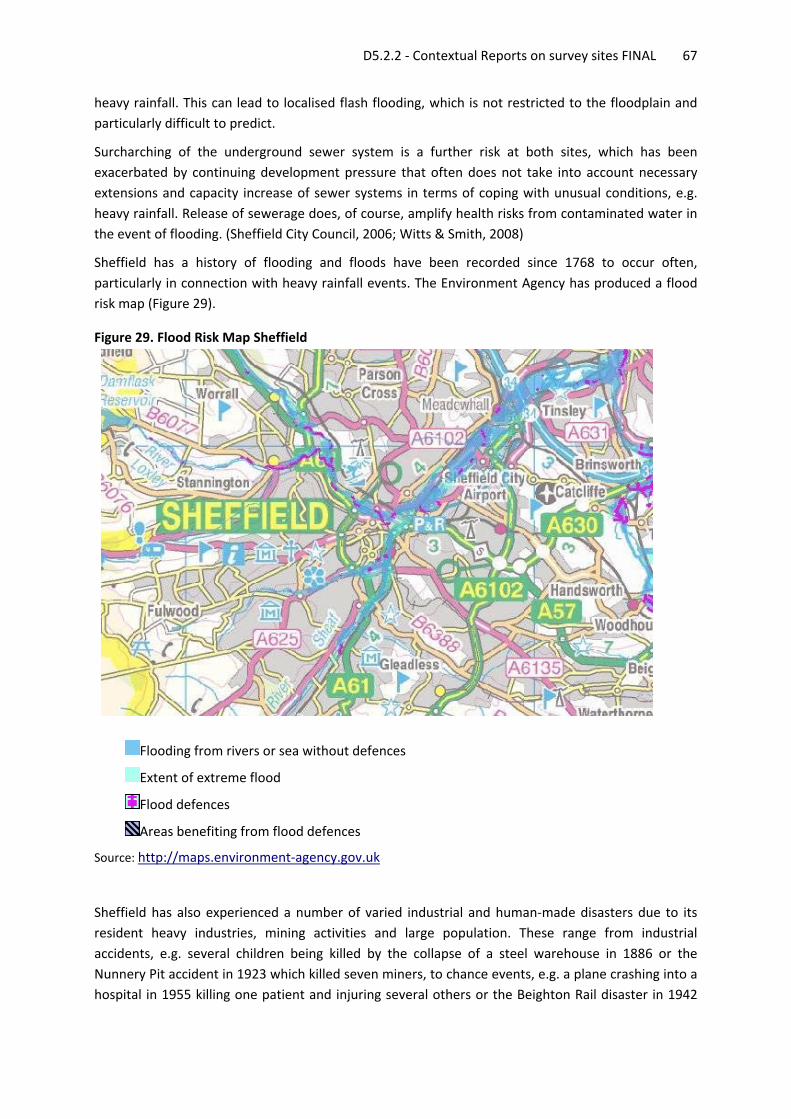
D5.2.2 ‐ Contextual Reports on survey sites FINAL 67
heavy rainfall. This can lead to localised flash flooding, which is not restricted to the floodplain and particularly difficult to predict.
Surcharching of the underground sewer system is a further risk at both sites, which has been exacerbated by continuing development pressure that often does not take into account necessary extensions and capacity increase of sewer systems in terms of coping with unusual conditions, e.g. heavy rainfall. Release of sewerage does, of course, amplify health risks from contaminated water in the event of flooding. (Sheffield City Council, 2006; Witts & Smith, 2008)
Sheffield has a history of flooding and floods have been recorded since 1768 to occur often, particularly in connection with heavy rainfall events. The Environment Agency has produced a flood risk map (Figure 29).
Figure 29. Flood Risk Map Sheffield
Flooding from rivers or sea without defences
Extent of extreme flood
Flood defences
Areas benefiting from flood defences
Source: http://maps.environment‐agency.gov.uk
Sheffield has also experienced a number of varied industrial and human‐made disasters due to its resident heavy industries, mining activities and large population. These range from industrial accidents, e.g. several children being killed by the collapse of a steel warehouse in 1886 or the Nunnery Pit accident in 1923 which killed seven miners, to chance events, e.g. a plane crashing into a hospital in 1955 killing one patient and injuring several others or the Beighton Rail disaster in 1942
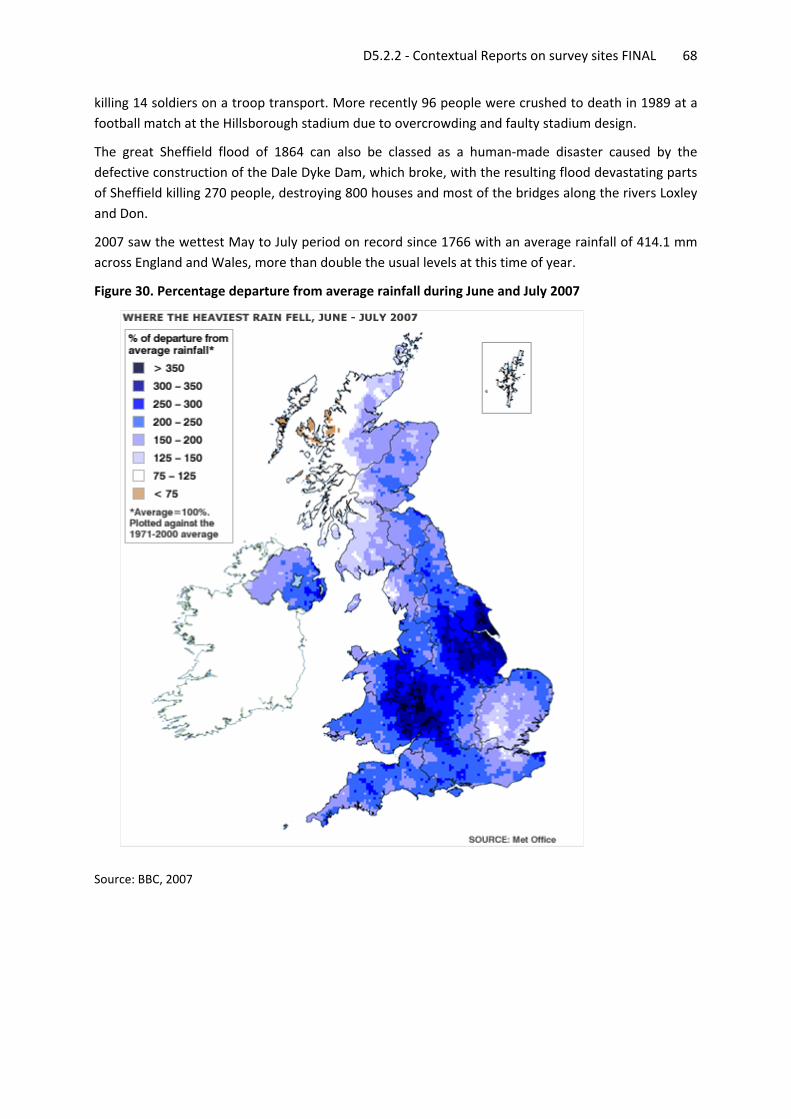
D5.2.2 ‐ Contextual Reports on survey sites FINAL 68
killing 14 soldiers on a troop transport. More recently 96 people were crushed to death in 1989 at a football match at the Hillsborough stadium due to overcrowding and faulty stadium design.
The great Sheffield flood of 1864 can also be classed as a human‐made disaster caused by the defective construction of the Dale Dyke Dam, which broke, with the resulting flood devastating parts of Sheffield killing 270 people, destroying 800 houses and most of the bridges along the rivers Loxley and Don.
2007 saw the wettest May to July period on record since 1766 with an average rainfall of 414.1 mm across England and Wales, more than double the usual levels at this time of year.
Figure 30. Percentage departure from average rainfall during June and July 2007
Source: BBC, 2007
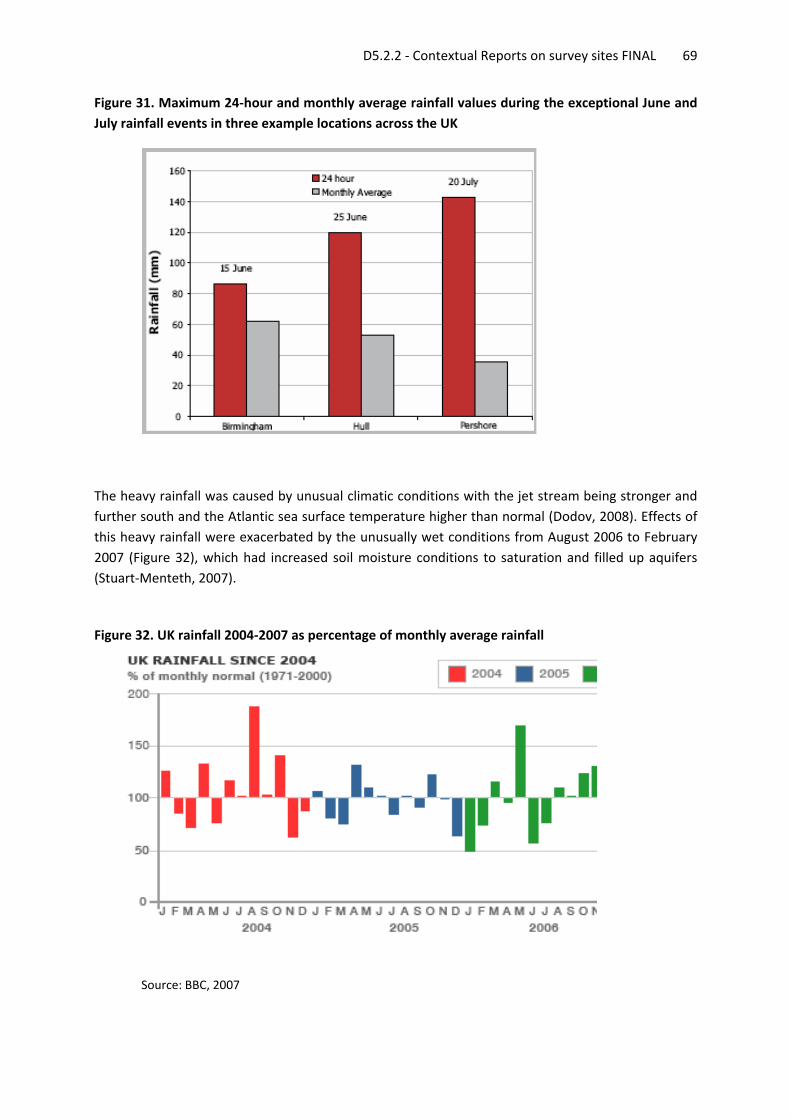
D5.2.2 ‐ Contextual Reports on survey sites FINAL 69
Figure 31. Maximum 24‐hour and monthly average rainfall values during the exceptional June and July rainfall events in three example locations across the UK
The heavy rainfall was caused by unusual climatic conditions with the jet stream being stronger and further south and the Atlantic sea surface temperature higher than normal (Dodov, 2008). Effects of this heavy rainfall were exacerbated by the unusually wet conditions from August 2006 to February 2007 (Figure 32), which had increased soil moisture conditions to saturation and filled up aquifers (Stuart‐Menteth, 2007).
Figure 32. UK rainfall 2004‐2007 as percentage of monthly average rainfall
Source: BBC, 2007
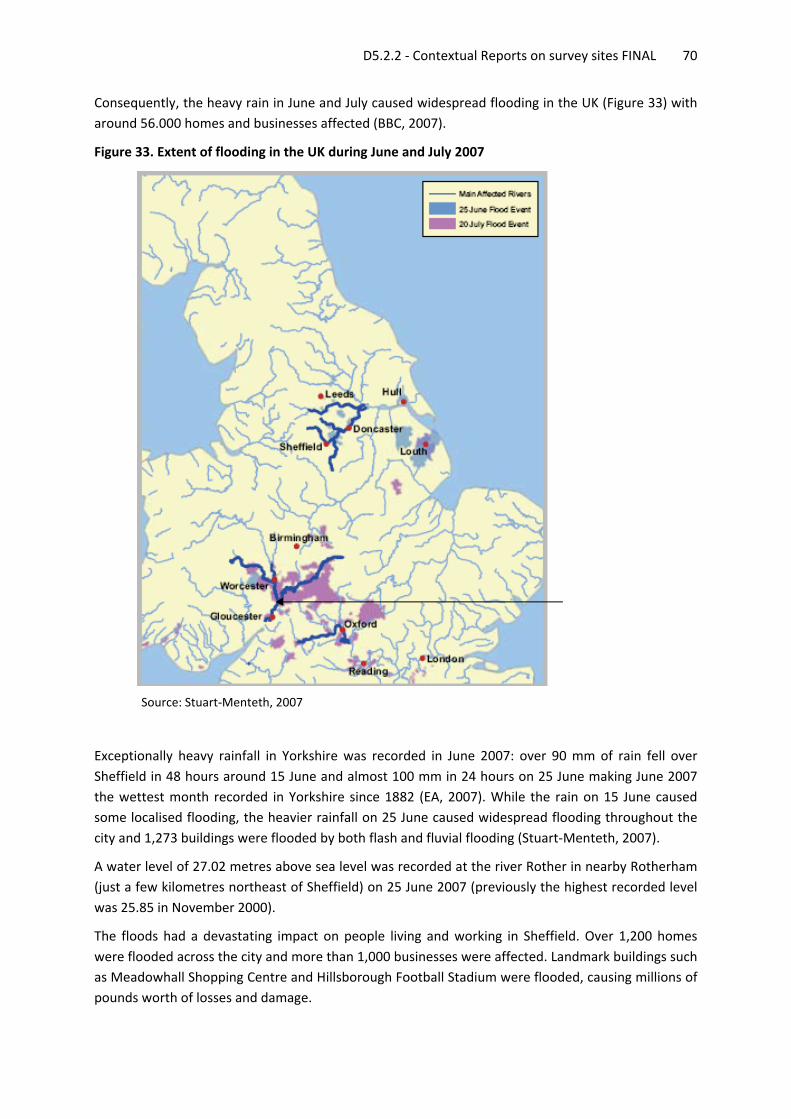
D5.2.2 ‐ Contextual Reports on survey sites FINAL 70
Consequently, the heavy rain in June and July caused widespread flooding in the UK (Figure 33) with around 56.000 homes and businesses affected (BBC, 2007).
Figure 33. Extent of flooding in the UK during June and July 2007
Source: Stuart‐Menteth, 2007
Exceptionally heavy rainfall in Yorkshire was recorded in June 2007: over 90 mm of rain fell over Sheffield in 48 hours around 15 June and almost 100 mm in 24 hours on 25 June making June 2007 the wettest month recorded in Yorkshire since 1882 (EA, 2007). While the rain on 15 June caused some localised flooding, the heavier rainfall on 25 June caused widespread flooding throughout the city and 1,273 buildings were flooded by both flash and fluvial flooding (Stuart‐Menteth, 2007).
A water level of 27.02 metres above sea level was recorded at the river Rother in nearby Rotherham (just a few kilometres northeast of Sheffield) on 25 June 2007 (previously the highest recorded level was 25.85 in November 2000).
The floods had a devastating impact on people living and working in Sheffield. Over 1,200 homes were flooded across the city and more than 1,000 businesses were affected. Landmark buildings such as Meadowhall Shopping Centre and Hillsborough Football Stadium were flooded, causing millions of pounds worth of losses and damage.
D5.2.2 ‐ Contextual Reports on survey sites FINAL 71
As the floodwaters rose rapidly on 25 June, many people were caught unawares and had to be evacuated from flooded buildings. Others were trapped overnight, until the floodwaters receded the next day. Roads were damaged, a bridge collapsed, 13,000 people were left without power and two people died in the floodwaters. The M1 motorway was shut for three days.
The worst flooding occurred in the low‐lying parts of the city, in the floodplain. These areas are still home to some of the key metals and manufacturing industries that have made Sheffield famous. Businesses such as the toolmaker Clarkson Osborn were devastated by the floods which caused over £15million worth of damage to their works. Other major firms such as Sheffield Forgemasters International and Cadbury Trebor Bassett, were equally devastated and faced massive clean‐up operations and costs running into tens of millions of pounds. (Source: EA, 2007)
The effect of the flooding on the City of Sheffield was devastating with the City divided in half by floodwater, along a corridor some 23km in length, effectively isolating half of the City from access to the main accident and emergency centre and effectively trapping large numbers of people at the hospital.
Numerous roads, retaining walls, bridges, items of street furniture and sections of public rights of way were badly damaged. The damage, estimated to cost £15 million to repair, caused 28 roads to be closed requiring extensive traffic management measures. Some roads were made inaccessible, in particular along the Upper and Lower Don transport corridor due to large accumulations of debris [1,590 tonnes] deposited by the flood water. Gully pots, culverts and other drainage systems were blocked due to debris washed down by the flood water and a large volume of debris and vegetation collected under bridges over rivers. 16 traffic signal controllers were put out of action because of flood water damage to electronic equipment and a further 20 suffered impact damage.
RAF Sea King helicopters were used for rooftop rescues with other people being rescued by boat and in some cases by a tractor.
A large number of people were left stranded and unable to get home; others were evacuated from flooded homes. A number of reception centres were established these included pre‐determined and ad hoc centres to accommodate and feed over 1,400 people.
The City’s railway station was closed and passengers were left stranded, needing accommodation which was provided by Sheffield City Council. Assistance was also provided the following day with onward travel arrangements. (Source: Sheffield City Council, 2008)
6.2. Gloucestershire
The second MICRODIS survey site in UK is Gloucestershire, a county in south west England. The county comprises part of the Cotswold Hills, part of the flat fertile valley of the River Severn, and the entire Forest of Dean.
The county town is the city of Gloucester, and other principal towns include Cheltenham, Stroud, Cirencester, and Tewkesbury. The MICRODIS study will focus on the town of Tewkesbury.
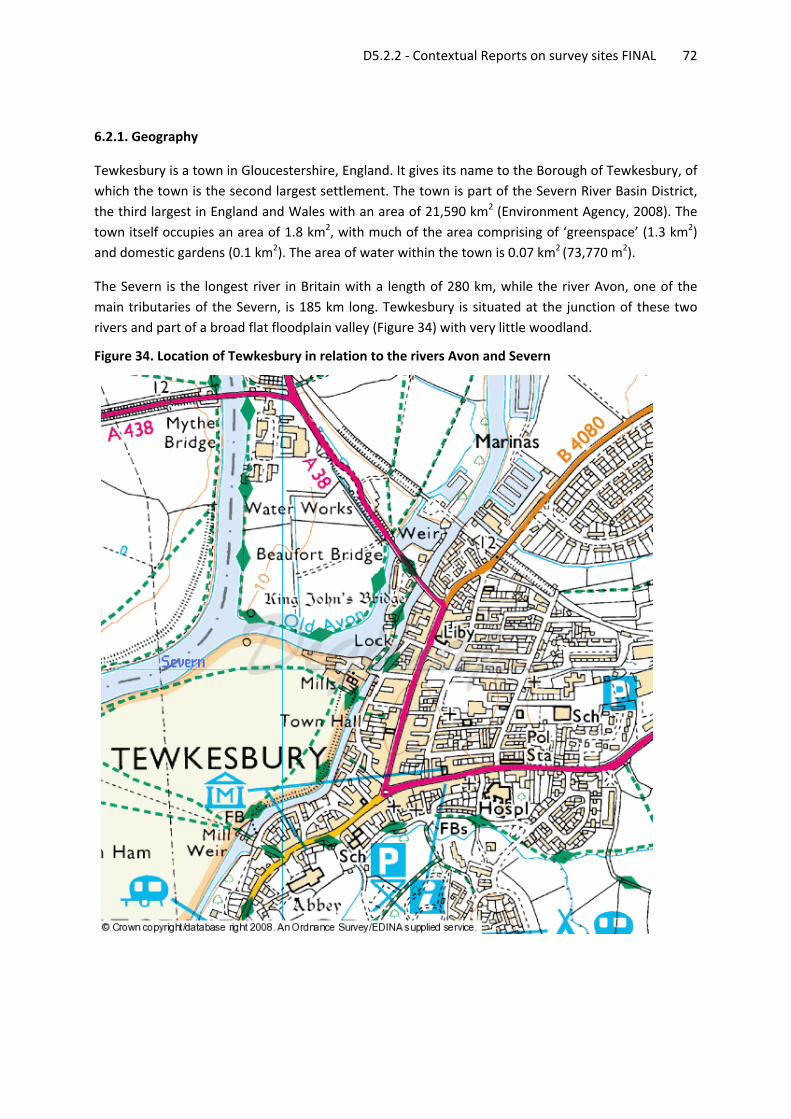
D5.2.2 ‐ Contextual Reports on survey sites FINAL 72
6.2.1. Geography
Tewkesbury is a town in Gloucestershire, England. It gives its name to the Borough of Tewkesbury, of which the town is the second largest settlement. The town is part of the Severn River Basin District, the third largest in England and Wales with an area of 21,590 km2 (Environment Agency, 2008). The town itself occupies an area of 1.8 km2, with much of the area comprising of ‘greenspace’ (1.3 km2) and domestic gardens (0.1 km2). The area of water within the town is 0.07 km2 (73,770 m2).
The Severn is the longest river in Britain with a length of 280 km, while the river Avon, one of the main tributaries of the Severn, is 185 km long. Tewkesbury is situated at the junction of these two rivers and part of a broad flat floodplain valley (Figure 34) with very little woodland.
Figure 34. Location of Tewkesbury in relation to the rivers Avon and Severn
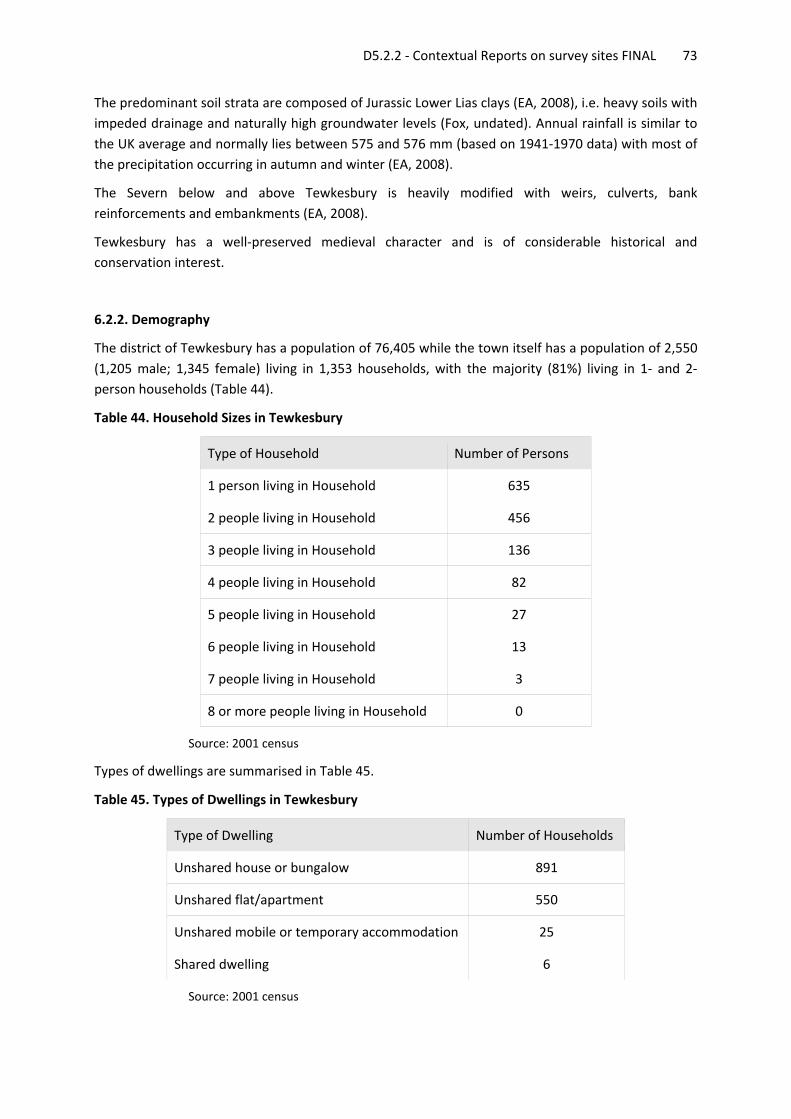
D5.2.2 ‐ Contextual Reports on survey sites FINAL 73
The predominant soil strata are composed of Jurassic Lower Lias clays (EA, 2008), i.e. heavy soils with impeded drainage and naturally high groundwater levels (Fox, undated). Annual rainfall is similar to the UK average and normally lies between 575 and 576 mm (based on 1941‐1970 data) with most of the precipitation occurring in autumn and winter (EA, 2008).
The Severn below and above Tewkesbury is heavily modified with weirs, culverts, bank reinforcements and embankments (EA, 2008).
Tewkesbury has a well‐preserved medieval character and is of considerable historical and conservation interest.
6.2.2. Demography
The district of Tewkesbury has a population of 76,405 while the town itself has a population of 2,550 (1,205 male; 1,345 female) living in 1,353 households, with the majority (81%) living in 1‐ and 2‐person households (Table 44).
Table 44. Household Sizes in Tewkesbury
Type of Household Number of Persons
1 person living in Household 635
2 people living in Household 456
3 people living in Household 136
4 people living in Household 82
5 people living in Household 27
6 people living in Household 13
7 people living in Household 3
8 or more people living in Household 0
Source: 2001 census
Types of dwellings are summarised in Table 45.
Table 45. Types of Dwellings in Tewkesbury
Type of Dwelling Number of Households
Unshared house or bungalow 891
Unshared flat/apartment 550
Unshared mobile or temporary accommodation 25
Shared dwelling 6
Source: 2001 census
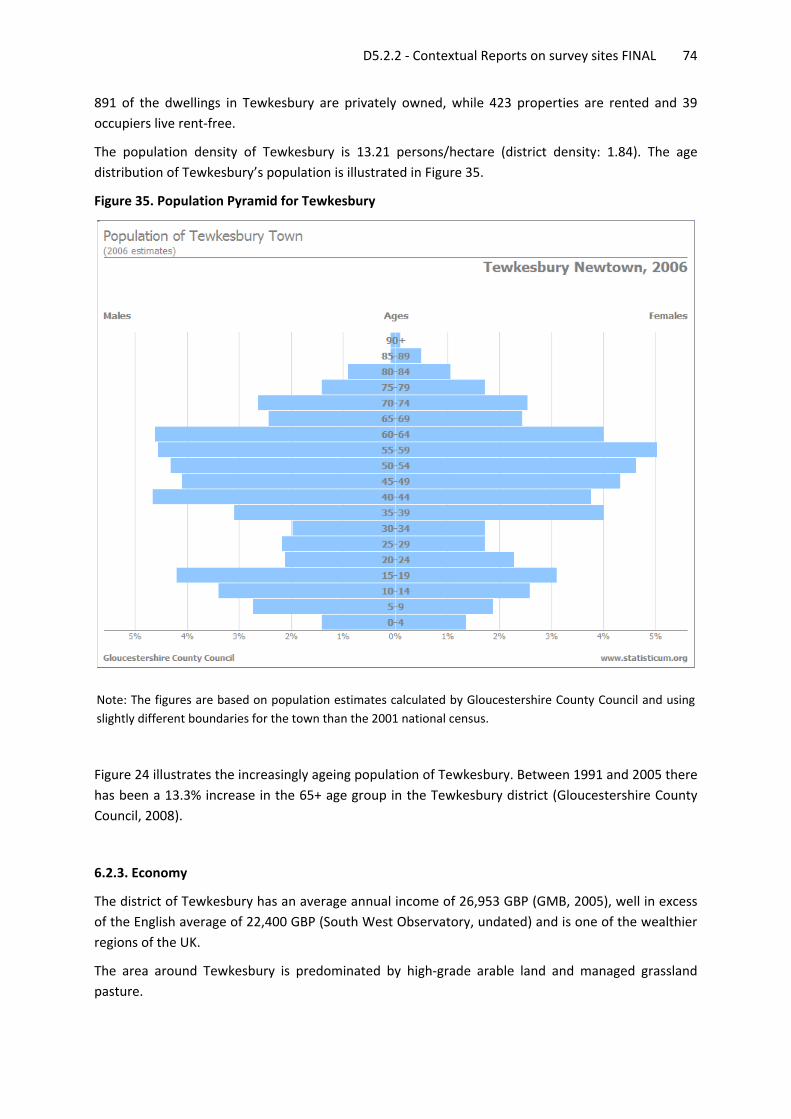
D5.2.2 ‐ Contextual Reports on survey sites FINAL 74
891 of the dwellings in Tewkesbury are privately owned, while 423 properties are rented and 39 occupiers live rent‐free.
The population density of Tewkesbury is 13.21 persons/hectare (district density: 1.84). The age distribution of Tewkesbury’s population is illustrated in Figure 35.
Figure 35. Population Pyramid for Tewkesbury
Note: The figures are based on population estimates calculated by Gloucestershire County Council and using slightly different boundaries for the town than the 2001 national census.
Figure 24 illustrates the increasingly ageing population of Tewkesbury. Between 1991 and 2005 there has been a 13.3% increase in the 65+ age group in the Tewkesbury district (Gloucestershire County Council, 2008).
6.2.3. Economy
The district of Tewkesbury has an average annual income of 26,953 GBP (GMB, 2005), well in excess of the English average of 22,400 GBP (South West Observatory, undated) and is one of the wealthier regions of the UK.
The area around Tewkesbury is predominated by high‐grade arable land and managed grassland pasture.
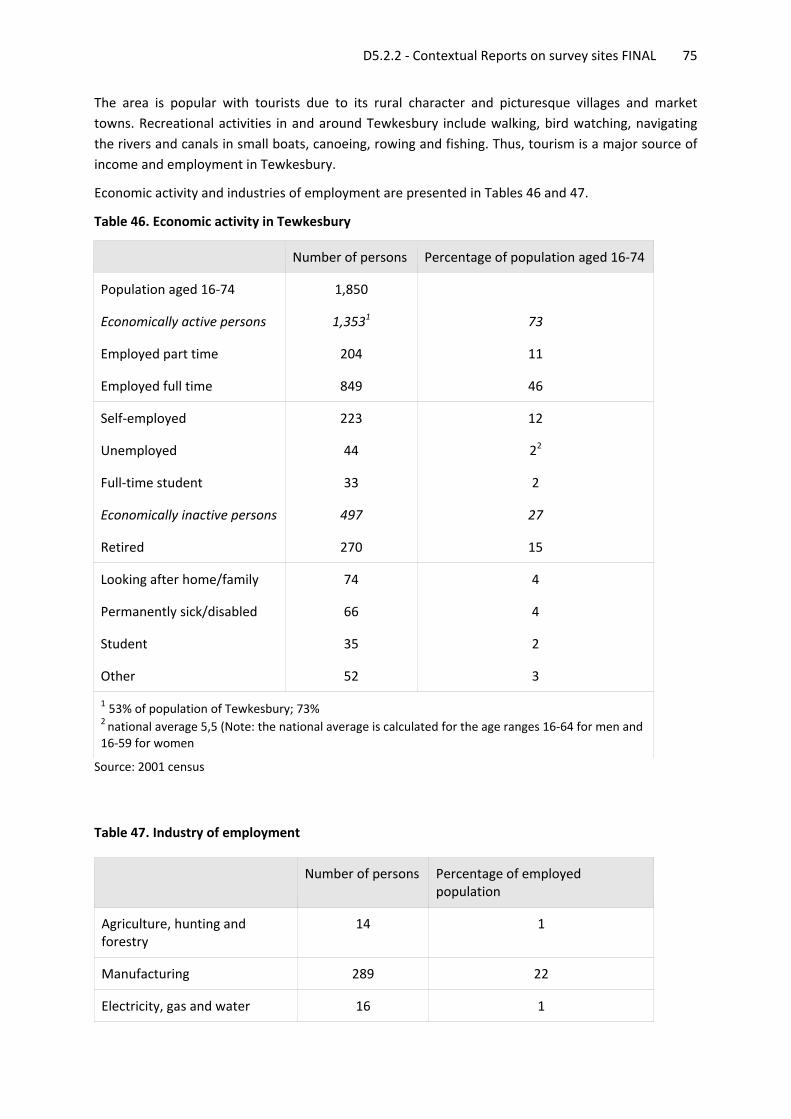
D5.2.2 ‐ Contextual Reports on survey sites FINAL 75
The area is popular with tourists due to its rural character and picturesque villages and market towns. Recreational activities in and around Tewkesbury include walking, bird watching, navigating the rivers and canals in small boats, canoeing, rowing and fishing. Thus, tourism is a major source of income and employment in Tewkesbury.
Economic activity and industries of employment are presented in Tables 46 and 47.
Table 46. Economic activity in Tewkesbury
Number of persons Percentage of population aged 16‐74
Population aged 16‐74 1,850
Economically active persons 1,3531 73
Employed part time 204 11
Employed full time 849 46
Self‐employed 223 12
Unemployed 44 22
Full‐time student 33 2
Economically inactive persons 497 27
Retired 270 15
Looking after home/family 74 4
Permanently sick/disabled 66 4
Student 35 2
Other 52 3
1 53% of population of Tewkesbury; 73% 2 national average 5,5 (Note: the national average is calculated for the age ranges 16‐64 for men and 16‐59 for women
Source: 2001 census Table 47. Industry of employment
Number of persons Percentage of employed population
Agriculture, hunting and forestry
14 1
Manufacturing 289 22
Electricity, gas and water 16 1
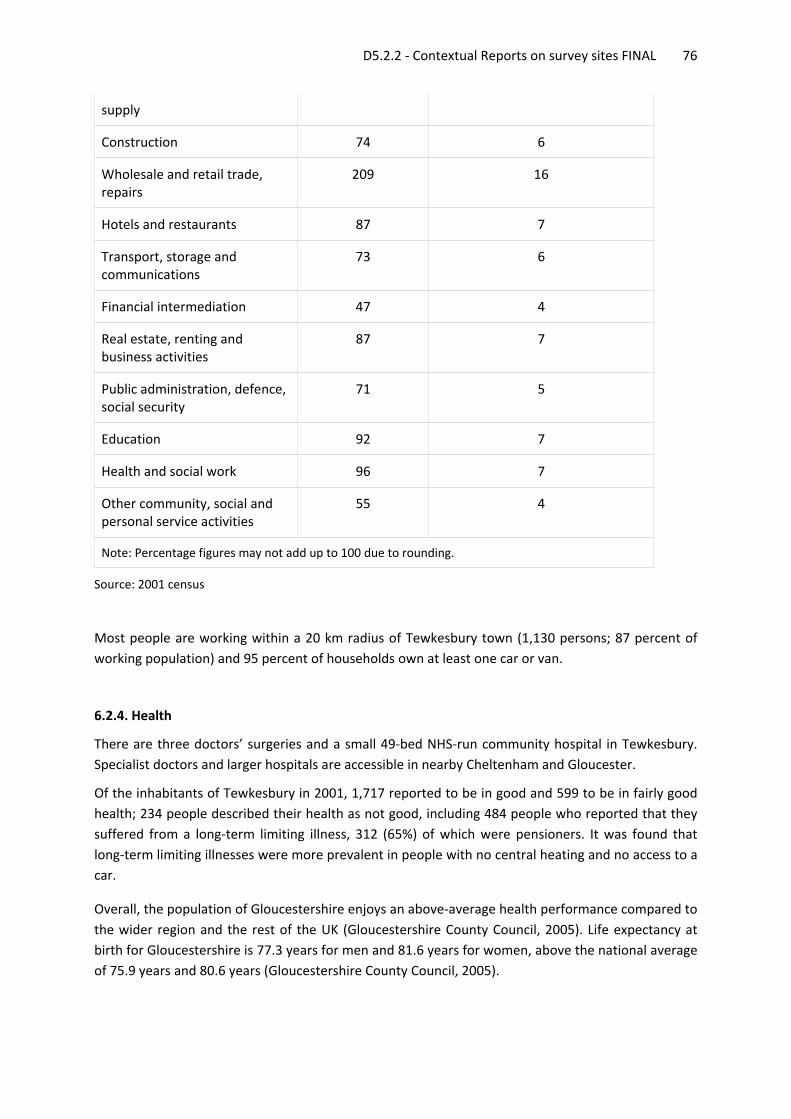
D5.2.2 ‐ Contextual Reports on survey sites FINAL 76
supply
Construction 74 6
Wholesale and retail trade, repairs
209 16
Hotels and restaurants 87 7
Transport, storage and communications
73 6
Financial intermediation 47 4
Real estate, renting and business activities
87 7
Public administration, defence, social security
71 5
Education 92 7
Health and social work 96 7
Other community, social and personal service activities
55 4
Note: Percentage figures may not add up to 100 due to rounding.
Source: 2001 census
Most people are working within a 20 km radius of Tewkesbury town (1,130 persons; 87 percent of working population) and 95 percent of households own at least one car or van.
6.2.4. Health
There are three doctors’ surgeries and a small 49‐bed NHS‐run community hospital in Tewkesbury. Specialist doctors and larger hospitals are accessible in nearby Cheltenham and Gloucester.
Of the inhabitants of Tewkesbury in 2001, 1,717 reported to be in good and 599 to be in fairly good health; 234 people described their health as not good, including 484 people who reported that they suffered from a long‐term limiting illness, 312 (65%) of which were pensioners. It was found that long‐term limiting illnesses were more prevalent in people with no central heating and no access to a car.
Overall, the population of Gloucestershire enjoys an above‐average health performance compared to the wider region and the rest of the UK (Gloucestershire County Council, 2005). Life expectancy at birth for Gloucestershire is 77.3 years for men and 81.6 years for women, above the national average of 75.9 years and 80.6 years (Gloucestershire County Council, 2005).
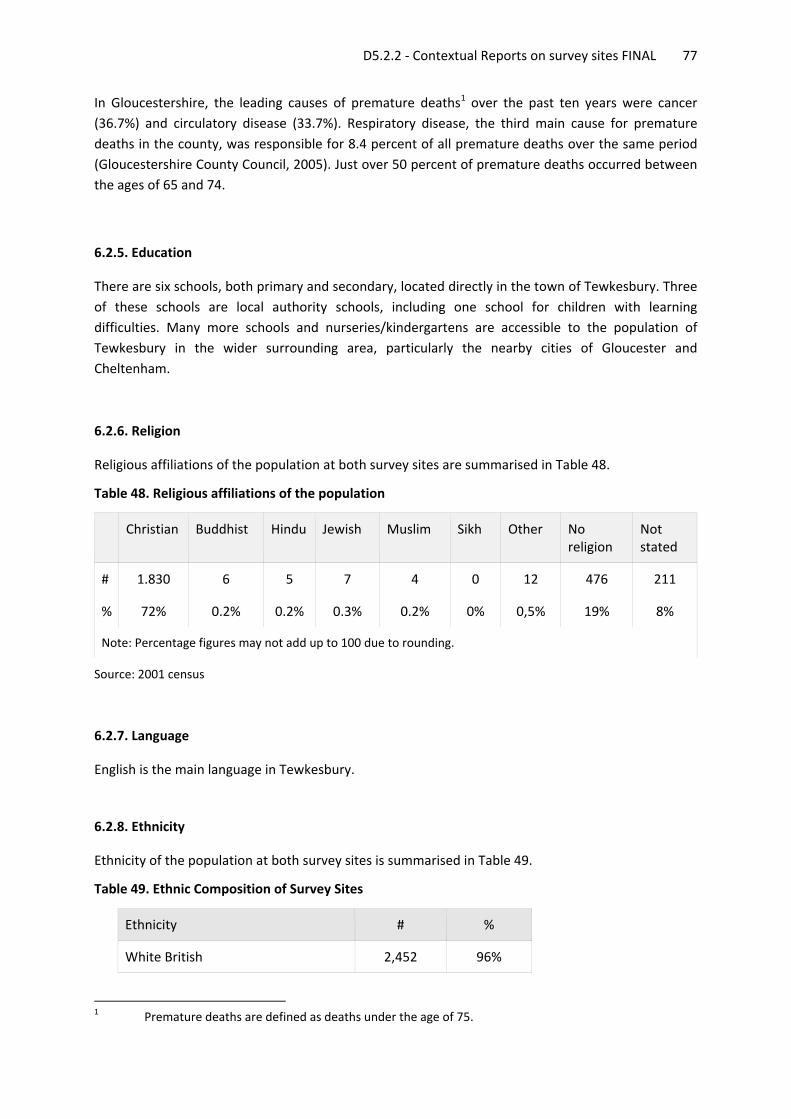
D5.2.2 ‐ Contextual Reports on survey sites FINAL 77
In Gloucestershire, the leading causes of premature deaths1 over the past ten years were cancer (36.7%) and circulatory disease (33.7%). Respiratory disease, the third main cause for premature deaths in the county, was responsible for 8.4 percent of all premature deaths over the same period (Gloucestershire County Council, 2005). Just over 50 percent of premature deaths occurred between the ages of 65 and 74.
6.2.5. Education
There are six schools, both primary and secondary, located directly in the town of Tewkesbury. Three of these schools are local authority schools, including one school for children with learning difficulties. Many more schools and nurseries/kindergartens are accessible to the population of Tewkesbury in the wider surrounding area, particularly the nearby cities of Gloucester and Cheltenham.
6.2.6. Religion
Religious affiliations of the population at both survey sites are summarised in Table 48.
Table 48. Religious affiliations of the population
Christian Buddhist Hindu Jewish Muslim Sikh Other No religion
Not stated
# 1.830 6 5 7 4 0 12 476 211
% 72% 0.2% 0.2% 0.3% 0.2% 0% 0,5% 19% 8%
Note: Percentage figures may not add up to 100 due to rounding.
Source: 2001 census
6.2.7. Language
English is the main language in Tewkesbury.
6.2.8. Ethnicity
Ethnicity of the population at both survey sites is summarised in Table 49.
Table 49. Ethnic Composition of Survey Sites
Ethnicity # %
White British 2,452 96%
1 Premature deaths are defined as deaths under the age of 75.
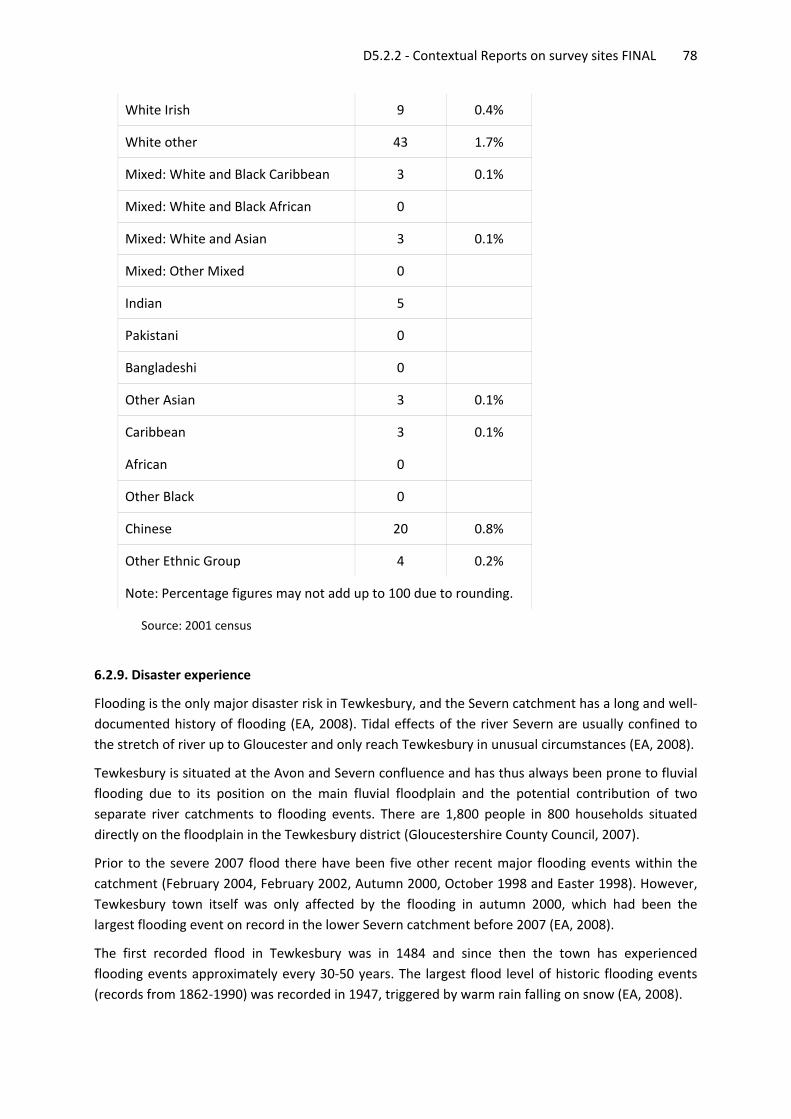
D5.2.2 ‐ Contextual Reports on survey sites FINAL 78
White Irish 9 0.4%
White other 43 1.7%
Mixed: White and Black Caribbean 3 0.1%
Mixed: White and Black African 0
Mixed: White and Asian 3 0.1%
Mixed: Other Mixed 0
Indian 5
Pakistani 0
Bangladeshi 0
Other Asian 3 0.1%
Caribbean 3 0.1%
African 0
Other Black 0
Chinese 20 0.8%
Other Ethnic Group 4 0.2%
Note: Percentage figures may not add up to 100 due to rounding.
Source: 2001 census
6.2.9. Disaster experience
Flooding is the only major disaster risk in Tewkesbury, and the Severn catchment has a long and well‐documented history of flooding (EA, 2008). Tidal effects of the river Severn are usually confined to the stretch of river up to Gloucester and only reach Tewkesbury in unusual circumstances (EA, 2008).
Tewkesbury is situated at the Avon and Severn confluence and has thus always been prone to fluvial flooding due to its position on the main fluvial floodplain and the potential contribution of two separate river catchments to flooding events. There are 1,800 people in 800 households situated directly on the floodplain in the Tewkesbury district (Gloucestershire County Council, 2007).
Prior to the severe 2007 flood there have been five other recent major flooding events within the catchment (February 2004, February 2002, Autumn 2000, October 1998 and Easter 1998). However, Tewkesbury town itself was only affected by the flooding in autumn 2000, which had been the largest flooding event on record in the lower Severn catchment before 2007 (EA, 2008).
The first recorded flood in Tewkesbury was in 1484 and since then the town has experienced flooding events approximately every 30‐50 years. The largest flood level of historic flooding events (records from 1862‐1990) was recorded in 1947, triggered by warm rain falling on snow (EA, 2008).
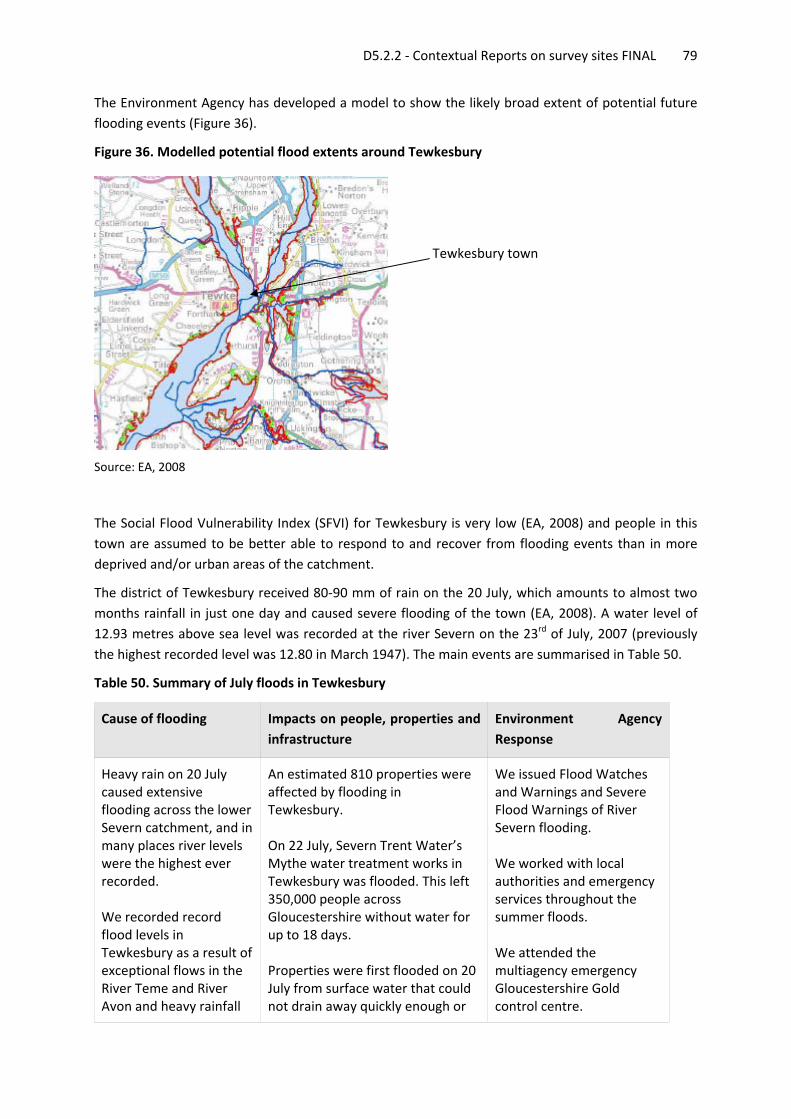
D5.2.2 ‐ Contextual Reports on survey sites FINAL 79
The Environment Agency has developed a model to show the likely broad extent of potential future flooding events (Figure 36).
Figure 36. Modelled potential flood extents around Tewkesbury
Tewkesbury town
Source: EA, 2008
The Social Flood Vulnerability Index (SFVI) for Tewkesbury is very low (EA, 2008) and people in this town are assumed to be better able to respond to and recover from flooding events than in more deprived and/or urban areas of the catchment.
The district of Tewkesbury received 80‐90 mm of rain on the 20 July, which amounts to almost two months rainfall in just one day and caused severe flooding of the town (EA, 2008). A water level of 12.93 metres above sea level was recorded at the river Severn on the 23rd of July, 2007 (previously the highest recorded level was 12.80 in March 1947). The main events are summarised in Table 50.
Table 50. Summary of July floods in Tewkesbury
Cause of flooding Impacts on people, properties and infrastructure
Environment Agency Response
Heavy rain on 20 July caused extensive flooding across the lower Severn catchment, and in many places river levels were the highest ever recorded. We recorded record flood levels in Tewkesbury as a result of exceptional flows in the River Teme and River Avon and heavy rainfall
An estimated 810 properties were affected by flooding in Tewkesbury. On 22 July, Severn Trent Water’s Mythe water treatment works in Tewkesbury was flooded. This left 350,000 people across Gloucestershire without water for up to 18 days. Properties were first flooded on 20 July from surface water that could not drain away quickly enough or
We issued Flood Watches and Warnings and Severe Flood Warnings of River Severn flooding. We worked with local authorities and emergency services throughout the summer floods. We attended the multiagency emergency Gloucestershire Gold control centre.
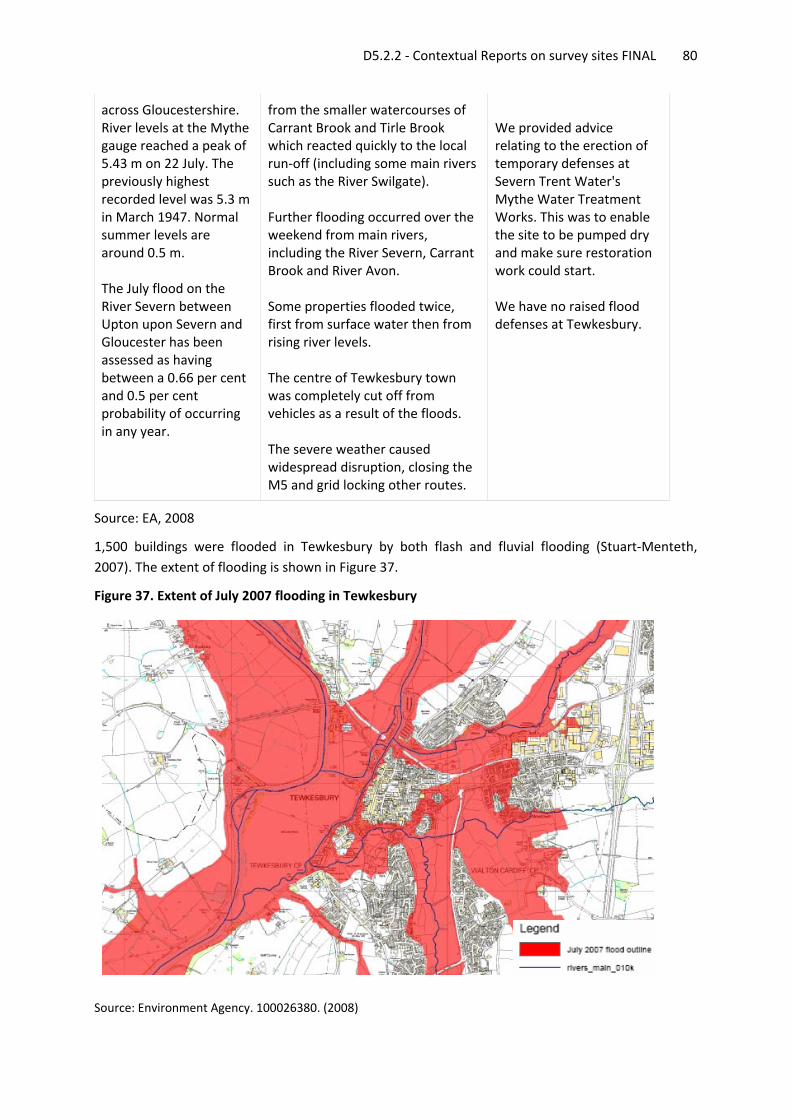
D5.2.2 ‐ Contextual Reports on survey sites FINAL 80
across Gloucestershire. River levels at the Mythe gauge reached a peak of 5.43 m on 22 July. The previously highest recorded level was 5.3 m in March 1947. Normal summer levels are around 0.5 m. The July flood on the River Severn between Upton upon Severn and Gloucester has been assessed as having between a 0.66 per cent and 0.5 per cent probability of occurring in any year.
from the smaller watercourses of Carrant Brook and Tirle Brook which reacted quickly to the local run‐off (including some main rivers such as the River Swilgate). Further flooding occurred over the weekend from main rivers, including the River Severn, Carrant Brook and River Avon. Some properties flooded twice, first from surface water then from rising river levels. The centre of Tewkesbury town was completely cut off from vehicles as a result of the floods. The severe weather caused widespread disruption, closing the M5 and grid locking other routes.
We provided advice relating to the erection of temporary defenses at Severn Trent Water's Mythe Water Treatment Works. This was to enable the site to be pumped dry and make sure restoration work could start. We have no raised flood defenses at Tewkesbury.
Source: EA, 2008
1,500 buildings were flooded in Tewkesbury by both flash and fluvial flooding (Stuart‐Menteth, 2007). The extent of flooding is shown in Figure 37.
Figure 37. Extent of July 2007 flooding in Tewkesbury
Source: Environment Agency. 100026380. (2008)
D5.2.2 ‐ Contextual Reports on survey sites FINAL 81
References
Bojonegoro Bojonegoro in Figures, www.bojonegoro.go.id Wikipedia, http://en.wikipedia.org/wiki/Bojonegoro Southern Leyte Mines and GeoSciences Bureau (MGB) National Statistics Office 2007 Census Wikipedia Albay Albay Provincial Disaster Coordinating Council Official Website, http://www.albay.gov.ph Center for Environmental Geomatics ‐ Manila Observatory, 2005, http://www.observatory.ph/vm/cw_maps.html. Department of Health, Bicol Health Profile, 2006. Department of Social Welfare and Development, Data on Disasters, 2005‐2007. IBON Foundation, IBON Philippines Profile: Region V, 2002. National Statistics Office 2007 Census Wikipedia Thua Thien Hue http://www.thoitietnguyhiem.net/ http://www.hcmussh.edu.vn/USSH/ImportFile/Magazine/Journal141006114021.doc, 10 Feb 2008 http://vietbao.vn/Xa‐hoi/Mien‐Trung‐oan‐minh‐vi‐lu/10888875/157/, 26 November 2004 http://vietnamnet.vn/xahoi/doisong/2004/11/350668/ http://www.gso.gov.vn/default.aspx?tabid=413&thangtk=12/2004 http://www.gso.gov.vn/default.aspx?tabid=413&thangtk=12/2007 www.ccfsc.gov.vn, 22 January 2008 http://www.gso.gov.vn/default.aspx?tabid=413&thangtk=12/2006 National report on disaster reduction in Vietnam (For the World Conference on Disaster Reduction, Kobe‐Hyogo, Japan, 18‐22 January 2005), Hanoi, September 2004 Situation report No 282/BC/PCLBTW, 4 October 2006 Situation report No 282/BC/PCLBTW, 8 and 15 November 2007 Orissa http://india.gov.in http://osdma.org www.dfid.gov.uk www.concern.net http://pdm.madicine.wisc Bahraich http://www.unicef.org/india/emergency_320.htm
D5.2.2 ‐ Contextual Reports on survey sites FINAL 82
http://news.indiainfo.com/2007/08/01/flood‐up.html http://www.reliefweb.int/rw/RWB.NSF/db900SID/LSGZ‐76RG7W? Panchsheel Development Trust, Bahraich, Uttar Pradesh Durban Corbieres Alcoverro J., Corominas J. and Gomez M. (1999) The barranco de Aras flood of 7 August 1996 (Biescas, Central Pyrenees, Spain). Engineering Geology, 51, p. 237‐255. Aullo G., Santurette P., Ducrocq V., Jacq V., Guillemot F., Sénequier D., Bourdette N., Bessemoulin P. (2002) L’épisode de pluies diluviennes du 12 au 13 novembre 1999 sur le sud de la France. Météo‐ France, 79 p. Bechtold P., Bazile E. (2001) The 12–13 November 1999 flash flood in southern France. Atmospheric Research, 56, p. 171–189. Belmonte A. C., Beltran F. S. (2001) Flood events in Mediterranean ephemeral streams (ramblas) in Valencia region, Spain. Catena , 45, p. 229–249. Delrieu, G., Ducrocq V., Andrieu H., Gaume E., Anquetin S., Creutin J.D. (2005) The catastrophic flash‐flood event of 8‐9 September 2002 in the Gard region, France: a first case study for the Cévennes‐Vivarais Mediterranean Hydrometeorological Observatory. Journal of Hydrometeorology, Vol. 6, 1, p. 34‐52. Gaume E., Livet M., Desbordes M. and Villeneuve J. P. (2004) Hydrological analysis of the river Aude, France, flash flood on 12 and 13 November 1999. Journal of Hydrology, 286, p. 135‐154. Lefrou C. (dir) (2000) Les crues des 12, 13 et 14 novembre 1999 dans les départements de l'Aude, de l'Hérault, des Pyrénées‐Orientales et du Tarn. Rapport au Ministre de l'Aménagement du Territoire et de l'Environnement, 99 p. + annexes. Aramon, Gard INSEE 1999 general census France par commune, INSEE 2008 Commercial and industrial chamber of Gard CEPRI (European centre for flood risk prevention), 2007 South Yorkshire and Gloucestershire 2001 census data available online: http://www.statistics.gov.uk/default.asp accessed: 22.09.2008 BBC (2007) The summer floods: What happened [online] http://news.bbc.co.uk/1/hi/uk/7446721.stm accessed: 08.09.08 Dodov B. (2008) Assessing Flood Risk: A Hydrological Overview of the July UK Floods [online] http://www.air‐worldwide.com/_public/html/air_currentsitem.asp?ID=1298 accessed: 23.09.08 Environment Agency (2007) 2007 Summer Floods – Case study: reducing the pressure on Sheffield’s floodplain Environment Agency, Bristol Environment Agency (2008) Managing Flood Risk: River Severn Catchment Flood Management Plan, Consultation Draft Plan May 2008, Environment Agency, Bristol Fox S. (undated) Letter to Cllr V. Smith re increased flooding risk in Tewkesbury and environs [online] http://www.nacra‐tewkesbury.org.uk/Influence_of_soils_&_topography_‐_letter%5B1%5D%20ammended.pdf accessed: 23.09.2008 Gloucestershire County Council (2005) Health Needs and Care Provisions in Gloucestershire, Environment Research Team, Gloucestershire County Council, Gloucester
D5.2.2 ‐ Contextual Reports on survey sites FINAL 83
Gloucestershire County Council (2007) Demography of floodplain in Gloucestershire Gloucestershire County Council, Gloucester Gloucestershire County Council (2008) Gloucestershire Population Monitor 2006, Gloucestershire County Council, Gloucester GMB – Britain’s General Union (2005) First time buyers and low paid priced out of home ownership in 39 southwest areas [online] http://www.gmb.org.uk/shared_asp_files/uploadedfiles/D014776E‐529B‐4459‐B4CB‐2F06EC84806F_Housingsw.pdf accessed: 27.09.2008 Natural England (undated) England’s Geology: South Yorkshire [online] http://www.english‐nature.org.uk/special/geological/sites/area_ID42.asp accessed: 30.09.2008 Sheffield City Council (undated) Various Documents, available online at: http://www.sheffield.gov.uk/your‐city‐council/sheffield‐facts‐figures accessed: 29.09.2008 Sheffield City Council (2006) Strategic Flood Risk Assessment Sheffield City Council, Sheffield Sheffield City Council (2008) Report of the Chief Executive – Joint meeting of the strategic resources and performance and culture, economy and sustainability scrutiny and policy development boards: the Sheffield flood Sheffield City Council, Sheffield South West Observatory (undated) State of the South West: Income, Expenditure and Wealth [online] http://www.swo.org.uk/SoSW2007/web/section_229.html accessed: 27.09.2008 Stuart‐Menteth A. (2007) UK Summer 2007 Floods Risk Management Solutions Ltd., London Witts D.A., Smith V. (2008) Building on the floodplain is misguided (a proof of evidence): a study of Tewkesbury [online] http://www.floodforum.org.uk/communitygroups/groupupdates/Severn%20and%20Avon%20Combined%20Flood%20Group%20Report%202008.pdf