Embed Size (px)
Citation preview
Technical Guidebook of Efficient Cold Products in Residential and Tertiary Sectors. PROEFFICIENCY project.
Technical Guidebook of Efficient Cold Products in Residential and Tertiary Sectors. PROEFFICIENCY project.
TECHNICAL GUIDEBOOK OF EFFICIENT COLD PRODUCTS
1. INTRODUCTION ....................................................................................................................... 3
2. ENERGY LABELLING INCLUDING “ECO LABELLING” .............................................. 5
2.1. ENERGY LABELLING IN REFRIGERATORS, FREEZERS AND COMBIS ......................... 5
2.2. ECO LABEL ........................................................................................................................... 9
3. LEGISLATION ......................................................................................................................... 10
3.1. EUROPEAN LEGISLATION ................................................................................................ 10
3.2. NORMS; REGULATIONS, STANDARDS .......................................................................... 15
3.3. NATIONAL LEGISLATIONS ............................................................................................... 15
4. COLD PRODUCTS IN RESIDENTIAL AND TERTIARY SECTORS ............................. 18
4.1 ENERGY CONSUMPTION OF COLD PRODUCTS IN RESIDENTIAL AND IN
TERTIARY SECTOR ..................................................................................................................... 18
4.2 EVOLUTION OF THE COLD PRODUCTS......................................................................... 29
4.3 THE “MOST EFFICIENT” COLD PRODUCTS ................................................................... 37
5. ENERGY AND ECONOMIC ANALYSIS ............................................................................. 40
5.1. COST BENEFIT ANALYSIS IN SEVERAL COUNTRIES..................................................... 40
5.2. NATIONAL ECONOMIC SUPPORT ................................................................................ 42
6. PRACTICAL ADVICE............................................................................................................. 43
7. INFORMATION SOURCES.................................................................................................... 45
The contents of this Technical Guidebook have been supported by European Commission. The sole responsibility for the contents of this report lies with the authors. It does not necessarily reflect the opinion of the European Communities. The European Commission is not responsible for any use that may be made of the information contained therein
Technical Guidebook for Efficient Cold Products in Residential and Tertiary Sectors. PROEFFICIENCY project.
3
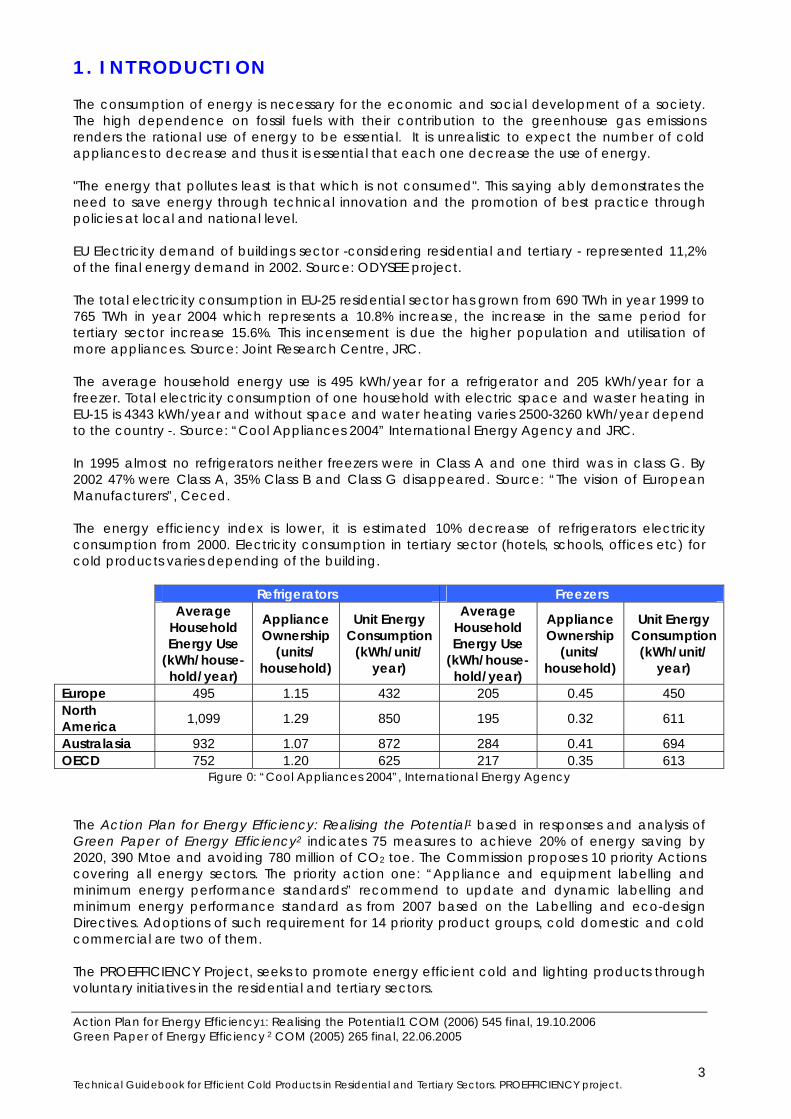
1. INTRODUCTION The consumption of energy is necessary for the economic and social development of a society. The high dependence on fossil fuels with their contribution to the greenhouse gas emissions renders the rational use of energy to be essential. It is unrealistic to expect the number of cold appliances to decrease and thus it is essential that each one decrease the use of energy. "The energy that pollutes least is that which is not consumed". This saying ably demonstrates the need to save energy through technical innovation and the promotion of best practice through policies at local and national level. EU Electricity demand of buildings sector -considering residential and tertiary - represented 11,2% of the final energy demand in 2002. Source: ODYSEE project. The total electricity consumption in EU-25 residential sector has grown from 690 TWh in year 1999 to 765 TWh in year 2004 which represents a 10.8% increase, the increase in the same period for tertiary sector increase 15.6%. This incensement is due the higher population and utilisation of more appliances. Source: Joint Research Centre, JRC. The average household energy use is 495 kWh/year for a refrigerator and 205 kWh/year for a freezer. Total electricity consumption of one household with electric space and waster heating in EU-15 is 4343 kWh/year and without space and water heating varies 2500-3260 kWh/year depend to the country -. Source: “Cool Appliances 2004” International Energy Agency and JRC. In 1995 almost no refrigerators neither freezers were in Class A and one third was in class G. By 2002 47% were Class A, 35% Class B and Class G disappeared. Source: “The vision of European Manufacturers”, Ceced. The energy efficiency index is lower, it is estimated 10% decrease of refrigerators electricity consumption from 2000. Electricity consumption in tertiary sector (hotels, schools, offices etc) for cold products varies depending of the building.
Refrigerators Freezers Average
Household Energy Use
(kWh/house-hold/year)
Appliance Ownership
(units/ household)
Unit Energy Consumption
(kWh/unit/ year)
Average Household Energy Use
(kWh/house-hold/year)
Appliance Ownership
(units/ household)
Unit Energy Consumption
(kWh/unit/ year)
Europe 495 1.15 432 205 0.45 450 North America 1,099 1.29 850 195 0.32 611
Australasia 932 1.07 872 284 0.41 694 OECD 752 1.20 625 217 0.35 613
Figure 0: “Cool Appliances 2004”, International Energy Agency The Action Plan for Energy Efficiency: Realising the Potential1 based in responses and analysis of Green Paper of Energy Efficiency2 indicates 75 measures to achieve 20% of energy saving by 2020, 390 Mtoe and avoiding 780 million of CO2 toe. The Commission proposes 10 priority Actions covering all energy sectors. The priority action one: “Appliance and equipment labelling and minimum energy performance standards” recommend to update and dynamic labelling and minimum energy performance standard as from 2007 based on the Labelling and eco-design Directives. Adoptions of such requirement for 14 priority product groups, cold domestic and cold commercial are two of them. The PROEFFICIENCY Project, seeks to promote energy efficient cold and lighting products through voluntary initiatives in the residential and tertiary sectors. Action Plan for Energy Efficiency1: Realising the Potential1 COM (2006) 545 final, 19.10.2006 Green Paper of Energy Efficiency 2 COM (2005) 265 final, 22.06.2005
Technical Guidebook for Efficient Cold Products in Residential and Tertiary Sectors. PROEFFICIENCY project.
4
Which is the main objective of the guidebook? The objective of this technical guidebook is to show the advantages of using eco-efficient cold products compared to the use of conventional ones by means of energy savings and environmentally friendliness. What are the contents of the guidebook? The contents of this guidebook consist of Energy Labelling and Ecological labelling; Legislation (EU and National); Cold Products in Residential and Tertiary Sectors; Energy and Economical Analysis and Practical Advice about cold appliances for end-users. To whom is focused this technical guidebook?
Appliance manufacturers, Importers, Distributors.
Large and individual Retailers.
Public Authorities, National and Regional Governments, Energy Agencies.
Local residents associations, consumers associations.
Managers and Directors of Hotels, public centres (offices, schools, etc.).
Citizens.
This “Technical Guidebook of Efficient Cold Products in Residential and Tertiary Sector” was prepared within the PROEFFICIENCY Projects by ESCAN S.A., Energiespaverband, Gertec, Ispe, Kape and SWEA. Very grateful to CECED Polska, CECED Romania and manufacturers (BSH Group, Fagor, Electrolux, Frigicoll) who did contribute with their advice and deep knowledge of the detail of this guidebook.
Technical Guidebook for Efficient Cold Products in Residential and Tertiary Sectors. PROEFFICIENCY project.
5
2. ENERGY LABELLING INCLUDING “ECO LABELLING” An efficient refrigerator saves money and energy should be chosen at the moment of purchasing. The energy label allows the consumer to know in a quick and simple way the energy efficiency of an appliance. The label shows the capacity of the appliance to work with less energy consumptions than others of the same class. Commencing in 1992 several European Directives, followed by national legislation have been focused in energy saving of appliances and introduced the mandatory use of eco-labels. 1. Promotion of energy saving in the domestic sector 2. Informing the consumer of the energy efficiency of the appliances
during the purchase, so that it is a more decisive variable in the process of decision.
3. To reduce the CO2 emissions to the atmosphere, diminishing the greenhouse effect.
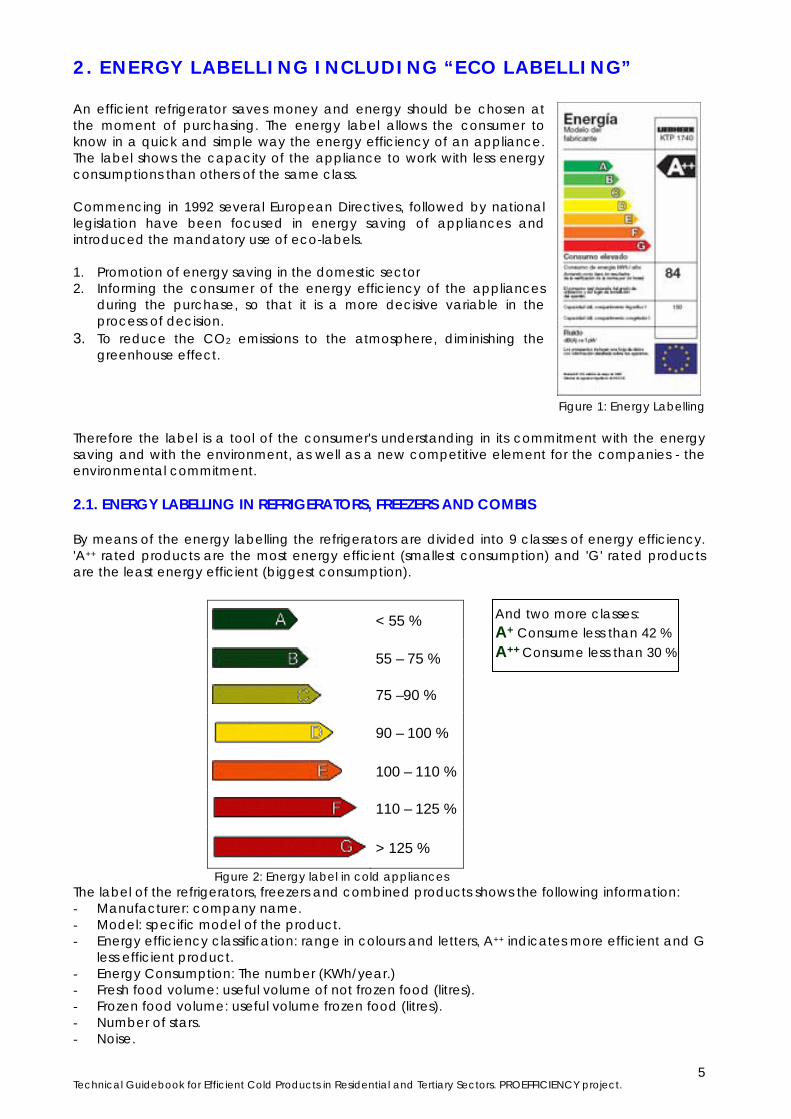
Figure 1: Energy Labelling Therefore the label is a tool of the consumer's understanding in its commitment with the energy saving and with the environment, as well as a new competitive element for the companies - the environmental commitment. 2.1. ENERGY LABELLING IN REFRIGERATORS, FREEZERS AND COMBIS By means of the energy labelling the refrigerators are divided into 9 classes of energy efficiency. 'A++ rated products are the most energy efficient (smallest consumption) and 'G' rated products are the least energy efficient (biggest consumption).
Figure 2: Energy label in cold appliances The label of the refrigerators, freezers and combined products shows the following information: - Manufacturer: company name. - Model: specific model of the product. - Energy efficiency classification: range in colours and letters, A++ indicates more efficient and G
less efficient product. - Energy Consumption: The number (KWh/year.) - Fresh food volume: useful volume of not frozen food (litres). - Frozen food volume: useful volume frozen food (litres). - Number of stars. - Noise.
< 55 %
55 – 75 %
75 –90 %
90 – 100 %
100 – 110 %
110 – 125 %
> 125 %
And two more classes: A+ Consume less than 42 % A++ Consume less than 30 %
Technical Guidebook for Efficient Cold Products in Residential and Tertiary Sectors. PROEFFICIENCY project.
6
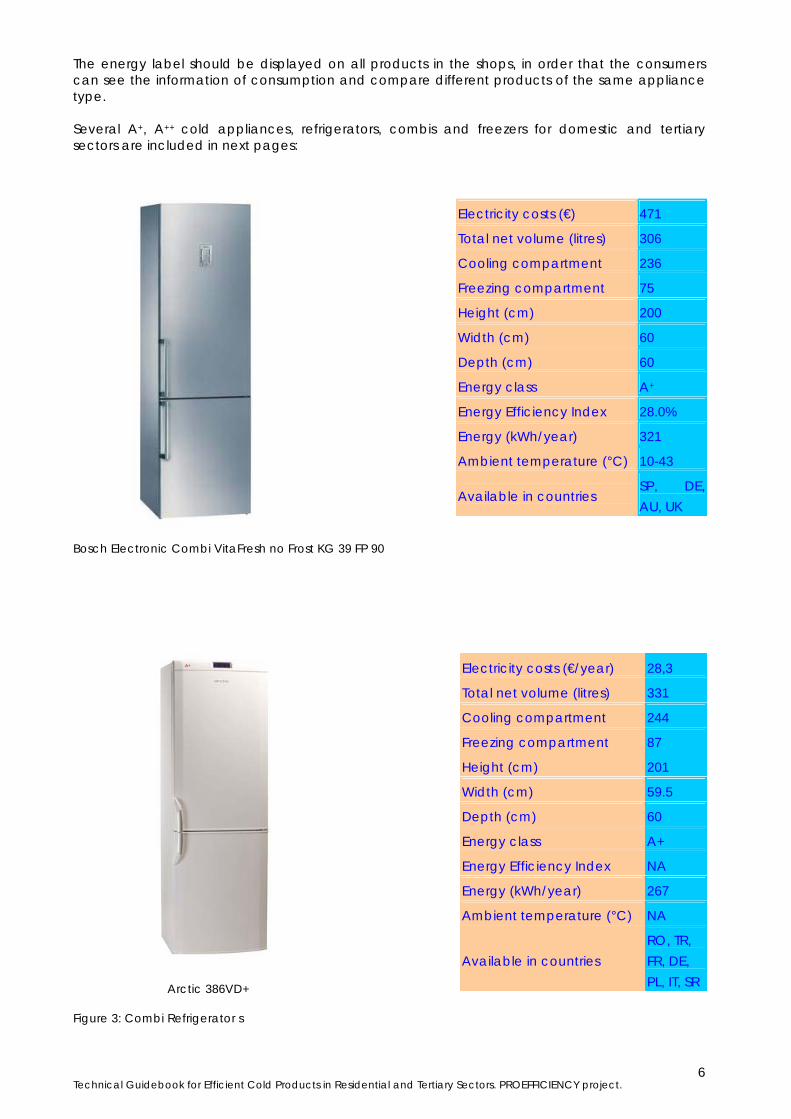
The energy label should be displayed on all products in the shops, in order that the consumers can see the information of consumption and compare different products of the same appliance type. Several A+, A++ cold appliances, refrigerators, combis and freezers for domestic and tertiary sectors are included in next pages:
Bosch Electronic Combi VitaFresh no Frost KG 39 FP 90
Arctic 386VD+ Figure 3: Combi Refrigerator s
Electricity costs (€) 471
Total net volume (litres) 306
Cooling compartment 236
Freezing compartment 75
Height (cm) 200
Width (cm) 60
Depth (cm) 60
Energy class A+
Energy Efficiency Index 28.0%
Energy (kWh/year) 321
Ambient temperature (°C) 10-43
Available in countries SP, DE, AU, UK
Electricity costs (€/year) 28,3
Total net volume (litres) 331
Cooling compartment 244
Freezing compartment 87
Height (cm) 201
Width (cm) 59.5
Depth (cm) 60
Energy class A+
Energy Efficiency Index NA
Energy (kWh/year) 267
Ambient temperature (°C) NA
Available in countries RO, TR, FR, DE, PL, IT, SR
Technical Guidebook for Efficient Cold Products in Residential and Tertiary Sectors. PROEFFICIENCY project.
7
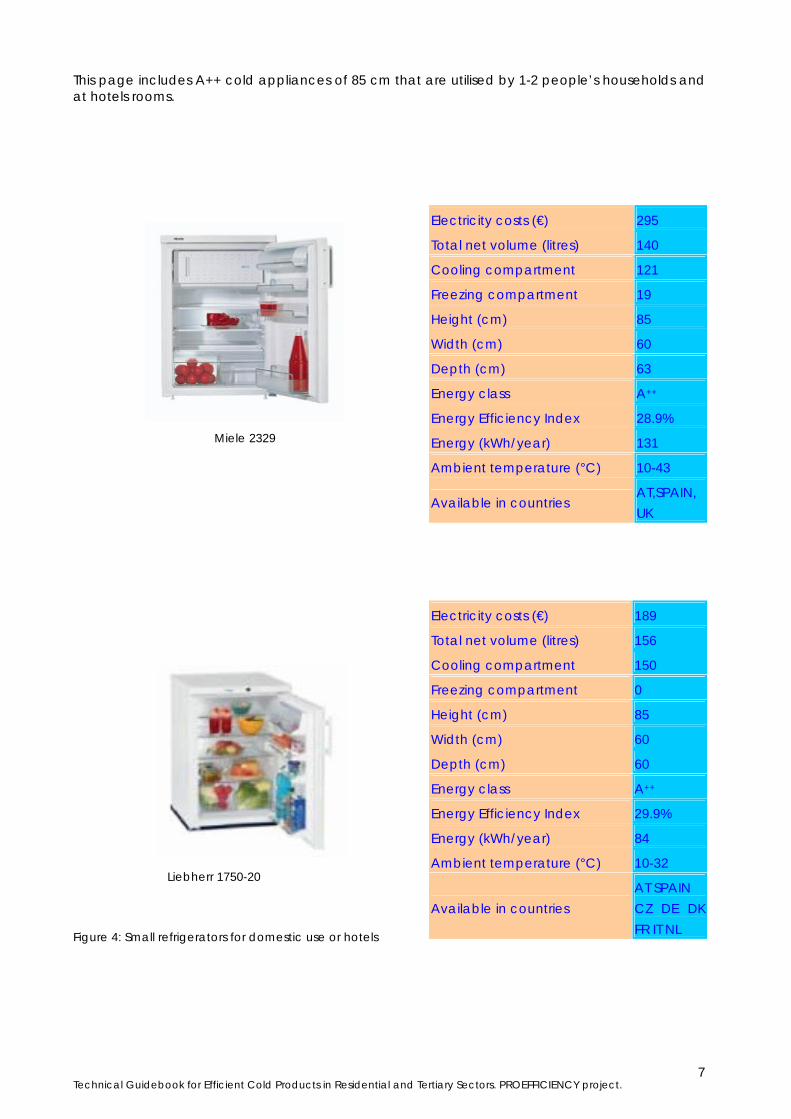
This page includes A++ cold appliances of 85 cm that are utilised by 1-2 people’s households and at hotels rooms.
Miele 2329 Liebherr 1750-20 Figure 4: Small refrigerators for domestic use or hotels
Electricity costs (€) 295
Total net volume (litres) 140
Cooling compartment 121
Freezing compartment 19
Height (cm) 85
Width (cm) 60
Depth (cm) 63
Energy class A++
Energy Efficiency Index 28.9%
Energy (kWh/year) 131
Ambient temperature (°C) 10-43
Available in countries AT,SPAIN, UK
Electricity costs (€) 189
Total net volume (litres) 156
Cooling compartment 150
Freezing compartment 0
Height (cm) 85
Width (cm) 60
Depth (cm) 60
Energy class A++
Energy Efficiency Index 29.9%
Energy (kWh/year) 84
Ambient temperature (°C) 10-32
Available in countries AT SPAIN CZ DE DK FR IT NL
Technical Guidebook for Efficient Cold Products in Residential and Tertiary Sectors. PROEFFICIENCY project.
8
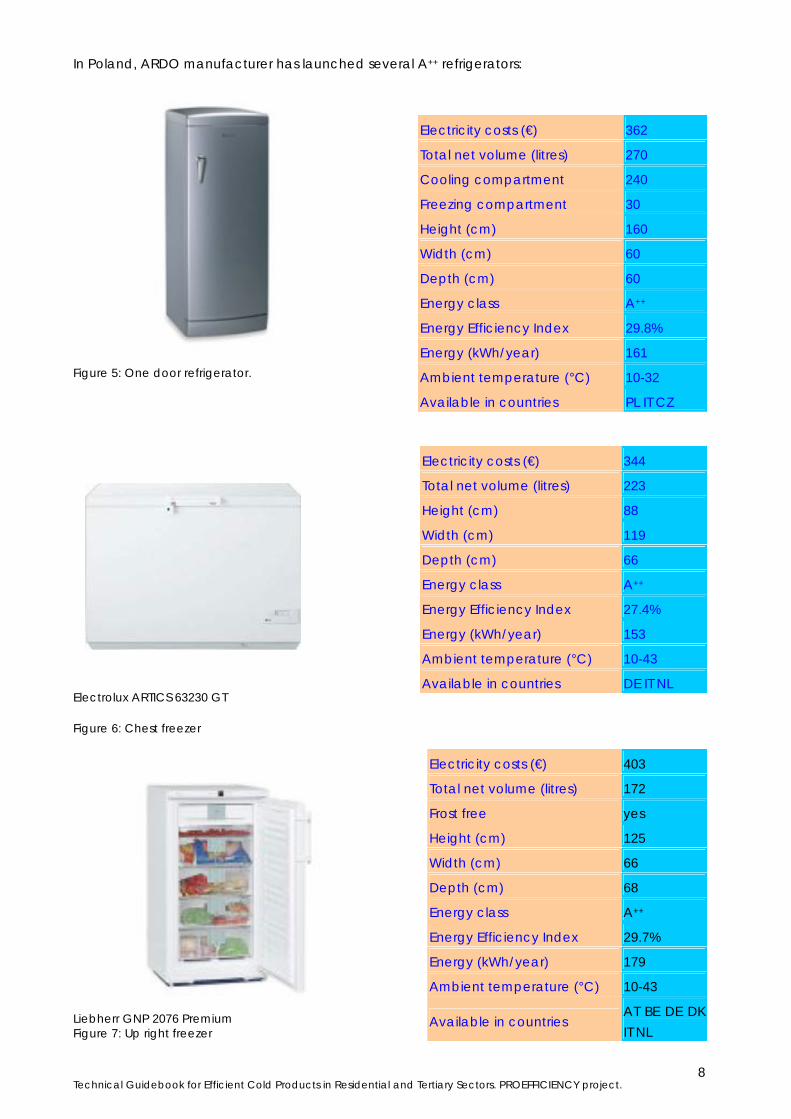
In Poland, ARDO manufacturer has launched several A++ refrigerators:
Figure 5: One door refrigerator.
Electrolux ARTICS 63230 GT Figure 6: Chest freezer Liebherr GNP 2076 Premium Figure 7: Up right freezer
Electricity costs (€) 362
Total net volume (litres) 270
Cooling compartment 240
Freezing compartment 30
Height (cm) 160
Width (cm) 60
Depth (cm) 60
Energy class A++
Energy Efficiency Index 29.8%
Energy (kWh/year) 161
Ambient temperature (°C) 10-32
Available in countries PL IT CZ
Electricity costs (€) 344
Total net volume (litres) 223
Height (cm) 88
Width (cm) 119
Depth (cm) 66
Energy class A++
Energy Efficiency Index 27.4%
Energy (kWh/year) 153
Ambient temperature (°C) 10-43
Available in countries DE IT NL
Electricity costs (€) 403
Total net volume (litres) 172
Frost free yes
Height (cm) 125
Width (cm) 66
Depth (cm) 68
Energy class A++
Energy Efficiency Index 29.7%
Energy (kWh/year) 179
Ambient temperature (°C) 10-43
Available in countries AT BE DE DK IT NL
Technical Guidebook for Efficient Cold Products in Residential and Tertiary Sectors. PROEFFICIENCY project.
9
2.2. ECO LABEL The eco label is voluntarily and common to all countries of the European Union. This label informs that a product has been valued environmentally as more efficient that other similar product. It presents the following characteristics: - The label is compatible with other eco-label national systems. - The label is authorised and managed through organisations appointed in each of the
members states, but the approaches to grant or to refuse the label to a product are the same in all countries.
- The label once granted is valid in all the countries of the European Union. The objectives of the Ecolabel European System, established in 1992, are: - To encourage the development of clean products. - To promote the valuation of the environmental impact of the products during their life cycle. - To show to the consumers and users less harmful alternatives from the environmental point of
view. - To promote improvements in waste management. - To support the research of less polluting techniques that give place to innovations inside the
market. The assessment process for the eco-label utilises Life Cycle Analysis (LCA). The environmental impact of different products may be higher in one phase or another of the life cycle: - Pre-production. - Production. - Distribution (included the packing). Ecolabel - Use. - Disposal. LCA requires an assessment of environmental impacts: - Pollution and degradation of soil. - water pollution - Atmospheric pollution. - Noise. - Energy consumption. - Natural resources consumption. - Repercussion in the ecosystems. Therefore, a product with the distinguishing characteristic of the Ecolabel will be a product with high-energy efficiency, a design that facilitates easy recycling and a strict limitation of dangerous substances for human health and the environment.
Technical Guidebook for Efficient Cold Products in Residential and Tertiary Sectors. PROEFFICIENCY project.
10
3. LEGISLATION 3.1. EUROPEAN LEGISLATION
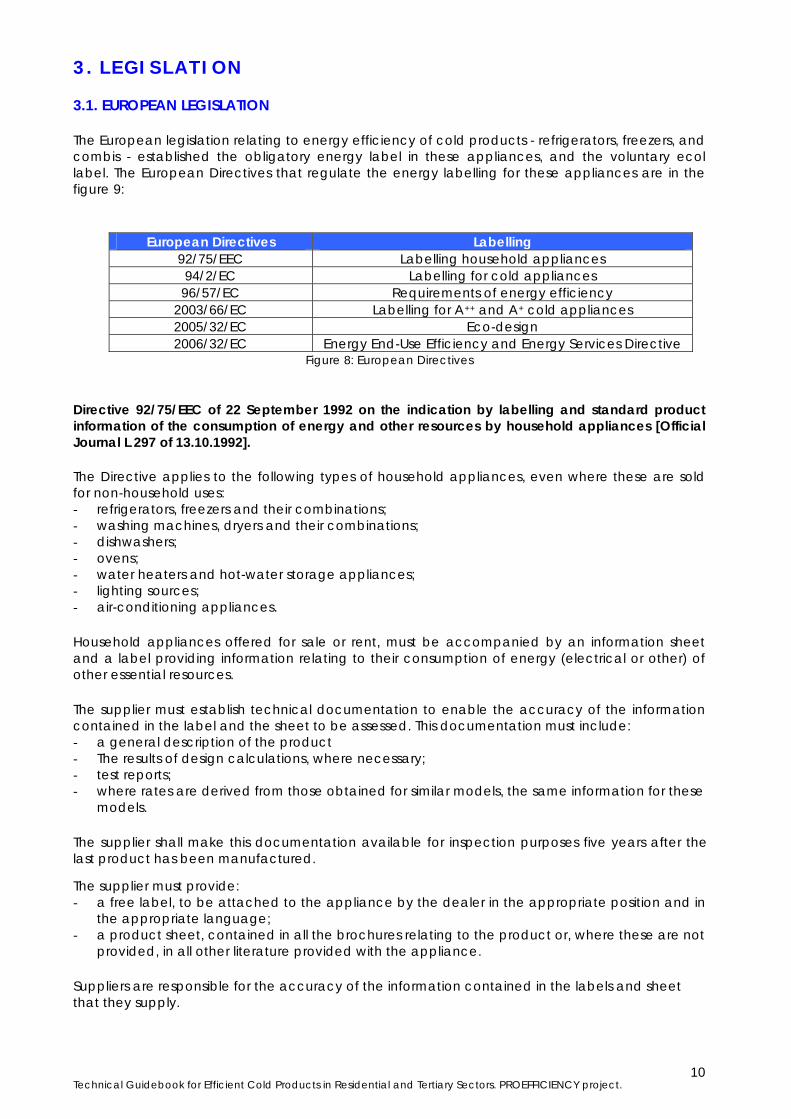
The European legislation relating to energy efficiency of cold products - refrigerators, freezers, and combis - established the obligatory energy label in these appliances, and the voluntary ecol label. The European Directives that regulate the energy labelling for these appliances are in the figure 9:
European Directives Labelling 92/75/EEC Labelling household appliances 94/2/EC Labelling for cold appliances 96/57/EC Requirements of energy efficiency
2003/66/EC Labelling for A++ and A+ cold appliances 2005/32/EC Eco-design 2006/32/EC Energy End-Use Efficiency and Energy Services Directive
Figure 8: European Directives Directive 92/75/EEC of 22 September 1992 on the indication by labelling and standard product information of the consumption of energy and other resources by household appliances [Official Journal L 297 of 13.10.1992]. The Directive applies to the following types of household appliances, even where these are sold for non-household uses: - refrigerators, freezers and their combinations; - washing machines, dryers and their combinations; - dishwashers; - ovens; - water heaters and hot-water storage appliances; - lighting sources; - air-conditioning appliances.
Household appliances offered for sale or rent, must be accompanied by an information sheet and a label providing information relating to their consumption of energy (electrical or other) of other essential resources.
The supplier must establish technical documentation to enable the accuracy of the information contained in the label and the sheet to be assessed. This documentation must include: - a general description of the product - The results of design calculations, where necessary; - test reports; - where rates are derived from those obtained for similar models, the same information for these
models.
The supplier shall make this documentation available for inspection purposes five years after the last product has been manufactured.
The supplier must provide: - a free label, to be attached to the appliance by the dealer in the appropriate position and in
the appropriate language; - a product sheet, contained in all the brochures relating to the product or, where these are not
provided, in all other literature provided with the appliance.
Suppliers are responsible for the accuracy of the information contained in the labels and sheet that they supply.
Technical Guidebook for Efficient Cold Products in Residential and Tertiary Sectors. PROEFFICIENCY project.
11
Each different Appliance Directive will establish the definition of the energy label and information sheet, and must specify: - the exact definition of the type of appliances to be included; - the measurement standards and methods to be used in obtaining the information relating to
energy consumption; - details of the technical documentation required; - the design and content of the label; - the location where the label shall be fixed to the appliance; - the content and where appropriate the format of the sheet, on which must be included the
information appearing on the label; - the information details to be provided in the case of mail-order offers for sale.
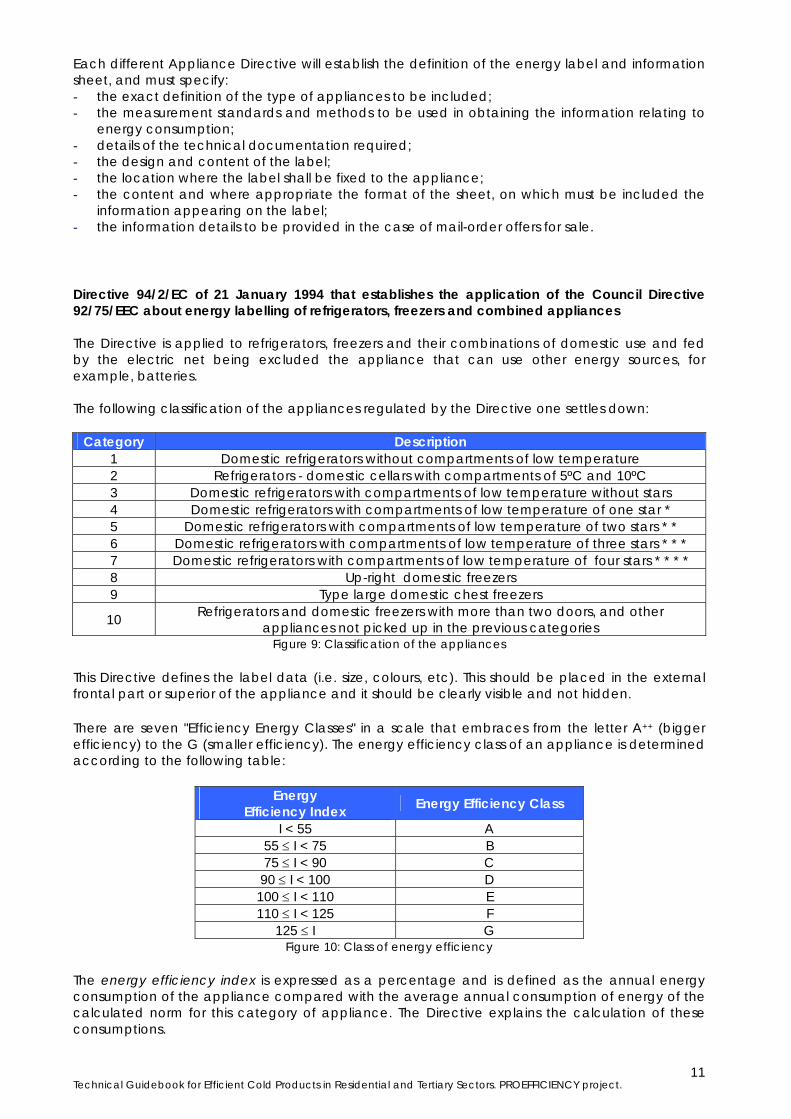
Directive 94/2/EC of 21 January 1994 that establishes the application of the Council Directive 92/75/EEC about energy labelling of refrigerators, freezers and combined appliances The Directive is applied to refrigerators, freezers and their combinations of domestic use and fed by the electric net being excluded the appliance that can use other energy sources, for example, batteries. The following classification of the appliances regulated by the Directive one settles down:
Category Description 1 Domestic refrigerators without compartments of low temperature 2 Refrigerators - domestic cellars with compartments of 5ºC and 10ºC 3 Domestic refrigerators with compartments of low temperature without stars 4 Domestic refrigerators with compartments of low temperature of one star * 5 Domestic refrigerators with compartments of low temperature of two stars * * 6 Domestic refrigerators with compartments of low temperature of three stars * * * 7 Domestic refrigerators with compartments of low temperature of four stars * * * * 8 Up-right domestic freezers 9 Type large domestic chest freezers
10 Refrigerators and domestic freezers with more than two doors, and other appliances not picked up in the previous categories
Figure 9: Classification of the appliances This Directive defines the label data (i.e. size, colours, etc). This should be placed in the external frontal part or superior of the appliance and it should be clearly visible and not hidden. There are seven "Efficiency Energy Classes" in a scale that embraces from the letter A++ (bigger efficiency) to the G (smaller efficiency). The energy efficiency class of an appliance is determined according to the following table:
Energy Efficiency Index Energy Efficiency Class
I < 55 A 55 ≤ I < 75 B 75 ≤ I < 90 C 90 ≤ I < 100 D 100 ≤ I < 110 E 110 ≤ I < 125 F
125 ≤ I G Figure 10: Class of energy efficiency
The energy efficiency index is expressed as a percentage and is defined as the annual energy consumption of the appliance compared with the average annual consumption of energy of the calculated norm for this category of appliance. The Directive explains the calculation of these consumptions.
Technical Guidebook for Efficient Cold Products in Residential and Tertiary Sectors. PROEFFICIENCY project.
12
The content of the information will be: - Names or the supplier's commercial mark. - Identification of the supplier's pattern. - Appliance type according to the previously defined category. - Classification of the pattern according to their energy efficiency. - Reproduction of the community eco label in a case the appliance would have obtained it. - Energy Consumption. - Useful Volume of the compartment of fresh foods. - Useful Volume of the compartment of frozen foods. - In the products of category 2 and 10 the useful volume of all the compartments should be
included. - Classification for stars of the compartment of frozen foods if it proceeds. - The mention "Without frost" when it proceeds. - "Autonomy of X hours", that is to say, "the period of increase of the temperature". - "Freezing capacity in kg/24h". Directive 96/57/CE of the European Parliament and of the Council of 3 September of 1996 relative to the requirements of energy performance of the refrigerators, freezers and electric combined appliances of domestic use. Minimum energy performance (maximum electricity consumption allowed for a volume and a category of appliances) applicable to the appliances refrigerators of domestic use. Also, the placement of the marked "CE" of conformity in the label guarantees that the appliance responds to the mentioned norms. This Directive is applied to the refrigerators, storage of frozen foods, freezers of foods and combined appliances, connected to the electric net and of domestic use. Refrigerating appliances will not be able to be put on the market when their electricity consumption is inferior or similar to the maximum consumption of electricity authorized for its category.
Figure 11: Marked CE of conformity
Therefore, it is necessary the appropriate Technical Documentation that allows the evaluation of conformity of the refrigerating appliance with the requirements of this Directive one should also include the design, the production and the operation of the team.
Ecologic Label CEE 880 / 92 First Reglament of Ecologic Label
EC 1980 / 2000 Concession of ecological label 2004 / 669 / EC Sets the principles to obtain the ecological label 2005 / 32 / EC Ecodesign
Figure 12: Ecological Label
Regulation (EEC) nº 880/92 of the Council of 23th March 1992 relative to a community system of ecological label (it is not longer in use). This was the first Directive that set the Ecolabel.
Technical Guidebook for Efficient Cold Products in Residential and Tertiary Sectors. PROEFFICIENCY project.
13
Regulation CE 1980/2000 of the European Parliament and of the Council, of 17th July of 2000, relative to a revised community system of concession of ecological label. The objective of the community system in introducing ecological label or eco-label is the promotion of products that can reduce the adverse environmental effects, in comparison with other products of the same category, contributing this way to an effective use of the resources and a high level of protection of the environment. The attainment of this objective will be to provide consumers, with accurate, scientific information. Specific approaches have become established for different product categories. The key requirements leading to granting of an eco-label are largely environmental but will include the suitability of the product to satisfy the requirements of the consumer. To be included in the community system, a category should complete the following requirements: - To represent a significant volume of sales and trade in the interior market; - To have an important environmental impact; - To present a significant potential to improve the environment through the option of the
consumers; - To dedicate a significant part from their volume of sales to the final consumption. All products with eco-label will be recognisable by the logo. In them, the information will show one or more of the three reasons of the label: - Lower energy consumption; - Greenhouse gas emissions reduced to a minimum; - Low level of noise. Directive 2003/66/EC of the Commission of 3 of July 2003, - which modifies the Directive one 94/2/CE, for which the dispositions of the Directive one 92/75/CEE of the Council in what concerns the one labeled energy of refrigerators, freezers, and appliances combined appliances. In this Directive two classes of energy efficiency are included, A++ and A+. Figure 12 shows the Energy Efficiency Index and the Energy Efficiency Class:
Energy Efficiency Index α (Iα)
“Energy Efficiency Class”
30 > Iα A++
42 > Iα ≥ 30 A+
Iα ≥ 42 A-G Figure 13: Class of energy efficiency
Energy Efficiency Index Iα is defined as the energy consumption of the appliance among the energy consumption normalized that is calculated in function of the type of category and it is a percentage. The Directive explains in a detailed way the calculation of these consumptions. 2004/669/CE, Decision of the Commission of 6 th of April 2004, for which ecological approaches revised for the concession from the community ecological label to the refrigerators consolidates and modifies the Decision 2000/40/CE. The category of “Refrigerating Products” includes all the refrigerators, closets of conservation of frozen foods, freezers of foods and its combinations that are connected to the electric net and utilised for domestic purpose. Appliances that can also use other energy sources like batteries are not included. To obtain an ecological label the appliance it will complete the approaches with following objectives: - To reduce the damage or derived environmental risks of energy consumption (heating of the
planet, acidification and exhaustion of non renewable resources) by means of the decrease of this consumption.
- To reduce the damage or derived environmental risks of the use of substances that deteriorates the layer of ozone and of other dangerous substances by diminishing the use of these substances.
Technical Guidebook for Efficient Cold Products in Residential and Tertiary Sectors. PROEFFICIENCY project.
14
- To reduce the damage or derived environmental risks of the use of substances those have a potential of global heating.
Furthermore, the approach encourages the application of the best practices and the ecological sensibility of consumers. Approaches 1. Save energy: the appliance will have a class of energy efficiency A+ or A++, according to the definition of the Directive one 94/2/CE, modified by the Directive one 2003/66/CE. 2. Reduction of the potential of exhaustion of the ozone layer: The coolant in the refrigeration circuit and the foam employed in the insulation of the appliance may have potential to damage the ozone layer. 3. Reduction of the potential of global heating of coolant and foam: the coolant in the refrigeration circuit and the foam employed in the insulation of the appliance may be significant greenhouse gases. Additional Approaches 4. Continuation of the period of useful life: the availability of spare parts will be guaranteed during 12 years starting from the date of the ceasing of the production. 5. Recovery and recycling: the manufacturer will offer to take back for recycling appliances and the substituted components, except the articles contaminated by the users (for example, the appliances coming from sanitary or nuclear establishments). 6. Directions for Use: the appliance will be sold with a manual of instructions that contains environmentally advices of the correct use. 7. Limit of acoustic emissions: appliance air noise emission, expressed in acoustic power, iwon't surpass 40 dB(A) (1 pW). Clearly visible information will be provided for the consumer on the appliance noise level. To such an end, it will incorporate this information in the label of energy consumption of the refrigerators. 8. Packing: all components of the packing they will be easily detachable by hand in different materials in order to facilitate recycling. If cardboard packing is used, it will consist at least on 80% of recycled material. 9. Information to the consumer: in the square 2 of the ecological label will figure the following text: - lower energy consumption - Potential of heating global minimum - Low level of noise Directive 2005/32/CE of the European Parliament and of the Council of 6th July 2005 establishing a framework for the setting of eco-design requirements for energy-using products and amending Council Directive 92/42/EEC and Directives 96/57/CE and 2000/55/CE of the European Parliament and of the Council. The Directive framework defines the principles, the conditions and the approaches to establish applicable environmental requirements for the products (ecological design). Consequently, it does not provide binding requirements applicable to specific products; these will be made later by means of executive measures that will be applied once interested parts have been consulted and after an impact evaluation. Directive 2006/32/EC of the European Parliament and of the Council of 5 April 2006 on energy end-use efficiency and energy services (and repealing Council Directive 93/76/EEC). Improved energy end-use efficiency will make it possible to exploit potential cost-effective energy savings in an economically efficient way. Energy efficiency improvements measures could realise these energy savings and thus help the Community reduce its dependence on energy imports. Furthermore, a move towards more energy-efficient technologies can boost the Community´s innovativeness and competitiveness as underlined in the Lisbon strategy. Improved energy end-use can be achieved by increasing the availability of and demand for energy services or by other energy efficiency improvement measures.
Technical Guidebook for Efficient Cold Products in Residential and Tertiary Sectors. PROEFFICIENCY project.
15
Member States shall adopt and aim to achieve an overall national indicative energy savings target of 9% for the ninth year of application of this Directive, to be reached by way of energy services and other energy efficiency improvement measures. Those energy savings targets shall be achieved by: - Providing the necessary indicative targets as well as mechanism, incentives and institutional,
financial and legal framework to remove existing market barriers and imperfections that impede the efficient end use of energy;
- Creating the conditions for the development and promotion of a market for energy services and for the delivery of other energy efficiency improvement measures to final consumers.
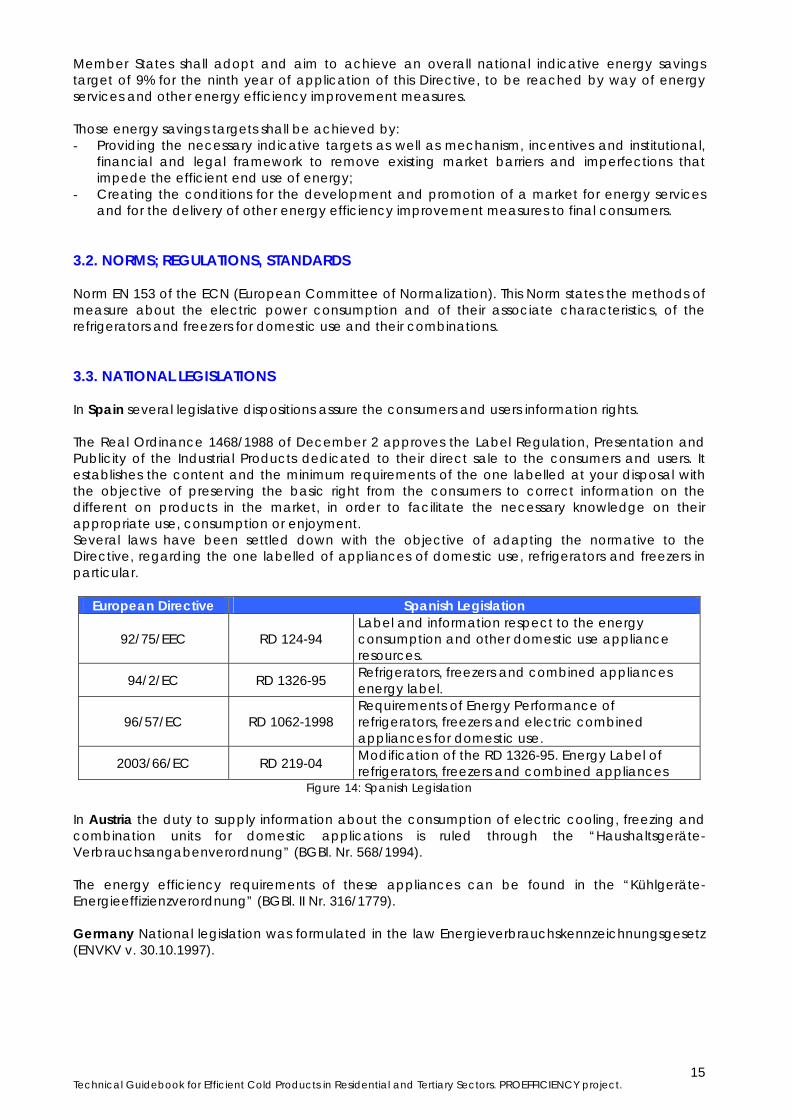
3.2. NORMS; REGULATIONS, STANDARDS Norm EN 153 of the ECN (European Committee of Normalization). This Norm states the methods of measure about the electric power consumption and of their associate characteristics, of the refrigerators and freezers for domestic use and their combinations. 3.3. NATIONAL LEGISLATIONS In Spain several legislative dispositions assure the consumers and users information rights. The Real Ordinance 1468/1988 of December 2 approves the Label Regulation, Presentation and Publicity of the Industrial Products dedicated to their direct sale to the consumers and users. It establishes the content and the minimum requirements of the one labelled at your disposal with the objective of preserving the basic right from the consumers to correct information on the different on products in the market, in order to facilitate the necessary knowledge on their appropriate use, consumption or enjoyment. Several laws have been settled down with the objective of adapting the normative to the Directive, regarding the one labelled of appliances of domestic use, refrigerators and freezers in particular.
European Directive Spanish Legislation
92/75/EEC RD 124-94 Label and information respect to the energy consumption and other domestic use appliance resources.
94/2/EC RD 1326-95 Refrigerators, freezers and combined appliances energy label.
96/57/EC RD 1062-1998 Requirements of Energy Performance of refrigerators, freezers and electric combined appliances for domestic use.
2003/66/EC RD 219-04 Modification of the RD 1326-95. Energy Label of refrigerators, freezers and combined appliances
Figure 14: Spanish Legislation In Austria the duty to supply information about the consumption of electric cooling, freezing and combination units for domestic applications is ruled through the “Haushaltsgeräte-Verbrauchsangabenverordnung” (BGBl. Nr. 568/1994). The energy efficiency requirements of these appliances can be found in the “Kühlgeräte-Energieeffizienzverordnung” (BGBl. II Nr. 316/1779). Germany National legislation was formulated in the law Energieverbrauchskennzeichnungsgesetz (ENVKV v. 30.10.1997).
Technical Guidebook for Efficient Cold Products in Residential and Tertiary Sectors. PROEFFICIENCY project.
16
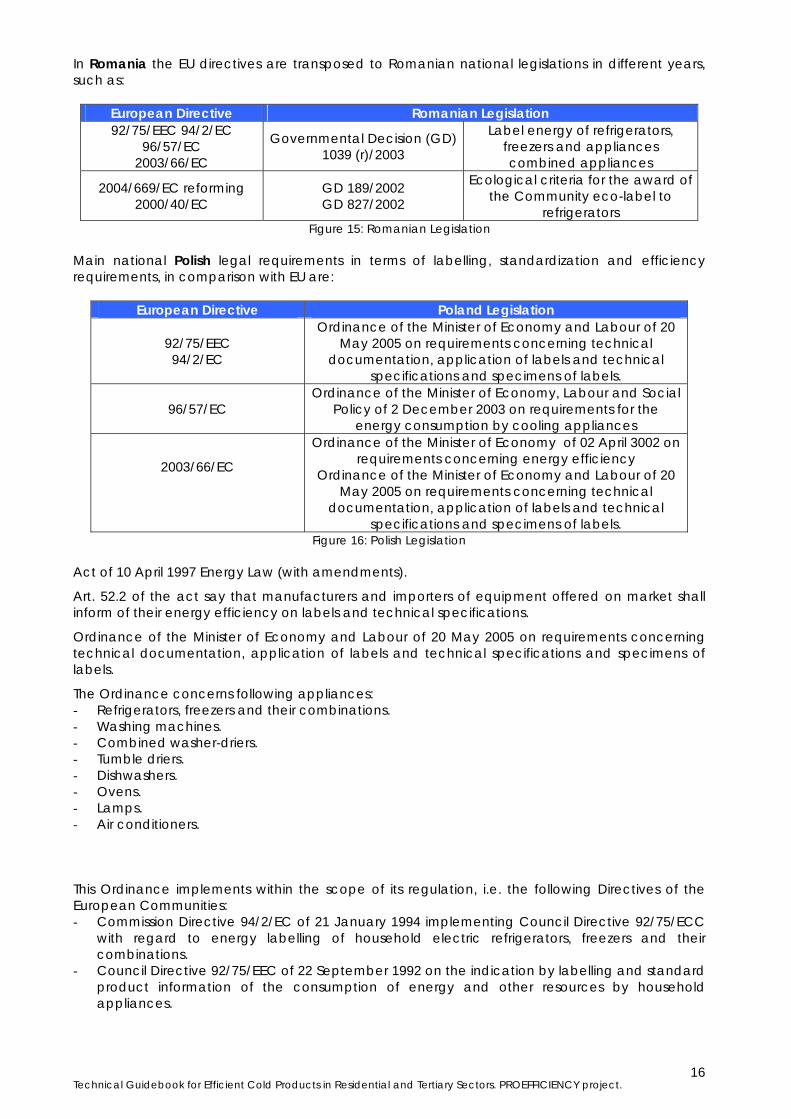
In Romania the EU directives are transposed to Romanian national legislations in different years, such as:
European Directive Romanian Legislation 92/75/EEC 94/2/EC
96/57/EC 2003/66/EC
Governmental Decision (GD) 1039 (r)/2003
Label energy of refrigerators, freezers and appliances combined appliances
2004/669/EC reforming 2000/40/EC
GD 189/2002 GD 827/2002
Ecological criteria for the award of the Community eco-label to
refrigerators Figure 15: Romanian Legislation
Main national Polish legal requirements in terms of labelling, standardization and efficiency requirements, in comparison with EU are:
European Directive Poland Legislation
92/75/EEC 94/2/EC
Ordinance of the Minister of Economy and Labour of 20 May 2005 on requirements concerning technical
documentation, application of labels and technical specifications and specimens of labels.
96/57/EC Ordinance of the Minister of Economy, Labour and Social
Policy of 2 December 2003 on requirements for the energy consumption by cooling appliances
2003/66/EC
Ordinance of the Minister of Economy of 02 April 3002 on requirements concerning energy efficiency
Ordinance of the Minister of Economy and Labour of 20 May 2005 on requirements concerning technical
documentation, application of labels and technical specifications and specimens of labels.
Figure 16: Polish Legislation Act of 10 April 1997 Energy Law (with amendments).
Art. 52.2 of the act say that manufacturers and importers of equipment offered on market shall inform of their energy efficiency on labels and technical specifications. Ordinance of the Minister of Economy and Labour of 20 May 2005 on requirements concerning technical documentation, application of labels and technical specifications and specimens of labels.
The Ordinance concerns following appliances: - Refrigerators, freezers and their combinations. - Washing machines. - Combined washer-driers. - Tumble driers. - Dishwashers. - Ovens. - Lamps. - Air conditioners.
This Ordinance implements within the scope of its regulation, i.e. the following Directives of the European Communities: - Commission Directive 94/2/EC of 21 January 1994 implementing Council Directive 92/75/ECC
with regard to energy labelling of household electric refrigerators, freezers and their combinations.
- Council Directive 92/75/EEC of 22 September 1992 on the indication by labelling and standard product information of the consumption of energy and other resources by household appliances.
Technical Guidebook for Efficient Cold Products in Residential and Tertiary Sectors. PROEFFICIENCY project.
17
Ordinance of the Minister of Economy, Labour and Social Policy of 2 December 2003 establishes requirements for the energy consumption by cooling appliances.
The Ordinance concerns refrigerators, freezers and their combinations and implements Directive 96/57/EC of the European Parliament and of the Council of 3 September 1996 on energy efficiency requirements for household electric refrigerators, freezers and their combinations. The United Kingdom Energy Information (Household Refrigerators and Freezers) Regulations 2004 (Statutory Instrument 2004, number 1468), implements the Framework Directive and Application Directive 94/2/EC as amended by Application Directive 2003/66/EC by requiring energy labels for domestic refrigerators and freezers and by dividing the energy efficiency rating category of “A” for household refrigerators and freezers into 3 new categories (“A”, “A+” and “A++”) from 1st July 2004. - The UK does not have a national eco-labelling scheme, focusing instead on supporting the
European scheme, the EU Eco-label. - The energy Saving Trust (EST), which develops and rolls out programmes on behalf of the UK
government, issues the Energy Efficiency Recommended logo for the products which meet or exceed the EST´s energy efficiency criteria. Cold products have to be at least A+ class to be issued with the Energy Saving Recommended logo.
European Directive UK Legislation
92/75/EEC
Originally S.I. 1994/3076 Amended by S.I. 2001/3142
S.I. 1994/3076 and S.I. 2001/3142 revoked in 2004 and replaced with S.I. 2004/1468
94/2/EC
Originally S.I. 1994/3076 Amended by S.I. 2001/3142
S.I. 1994/3076 and S.I. 2001/3142 revoked in 2004 and replaced with S.I. 2004/1468
96/57/EC S.I. 1997/1941 2003/66/EC S.I. 2004/1468
Figure 17: UK Legislation
Technical Guidebook for Efficient Cold Products in Residential and Tertiary Sectors. PROEFFICIENCY project.
18
4. COLD PRODUCTS IN RESIDENTIAL AND TERTIARY SECTORS
Figure 18: Breakdown of electricity consumption of residential end-use equipment in EU-15 in 2004.
Figure 19: Breakdown of electricity consumption of residential end-use equipment in NMS12+Hr in 2004
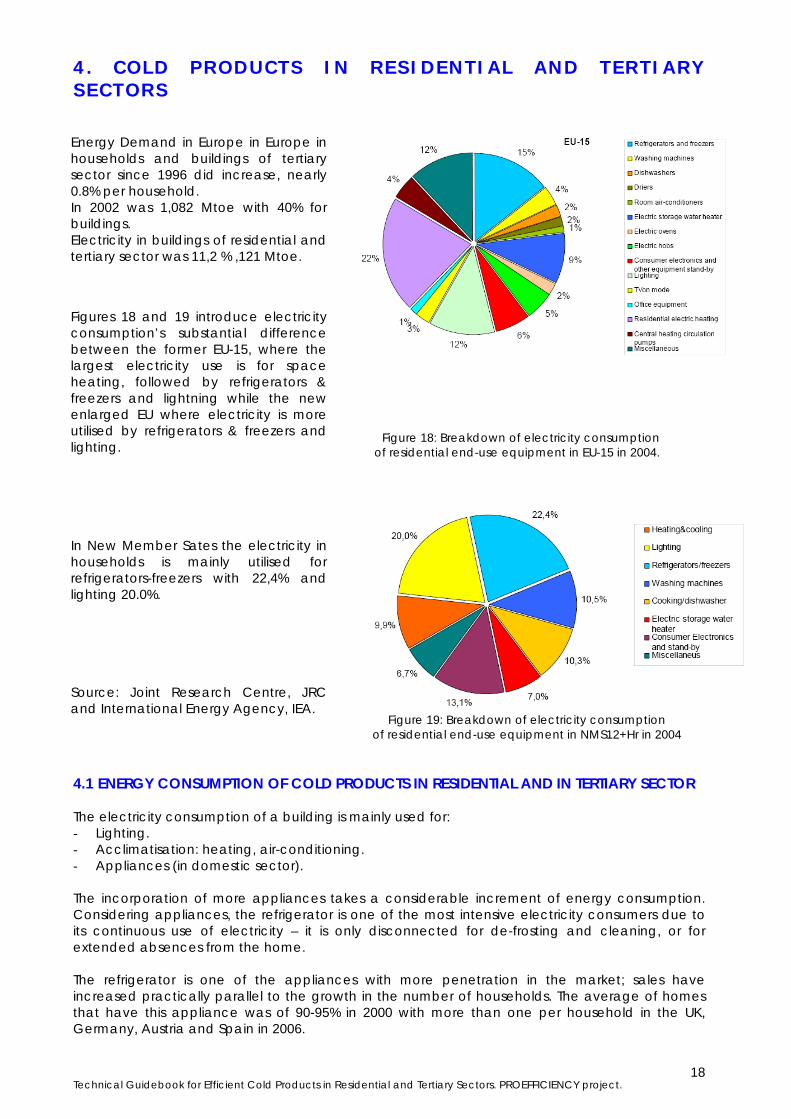
4.1 ENERGY CONSUMPTION OF COLD PRODUCTS IN RESIDENTIAL AND IN TERTIARY SECTOR The electricity consumption of a building is mainly used for: - Lighting. - Acclimatisation: heating, air-conditioning. - Appliances (in domestic sector). The incorporation of more appliances takes a considerable increment of energy consumption. Considering appliances, the refrigerator is one of the most intensive electricity consumers due to its continuous use of electricity – it is only disconnected for de-frosting and cleaning, or for extended absences from the home. The refrigerator is one of the appliances with more penetration in the market; sales have increased practically parallel to the growth in the number of households. The average of homes that have this appliance was of 90-95% in 2000 with more than one per household in the UK, Germany, Austria and Spain in 2006.
In New Member Sates the electricity in households is mainly utilised for refrigerators-freezers with 22,4% and lighting 20.0%. Source: Joint Research Centre, JRC and International Energy Agency, IEA.
Energy Demand in Europe in Europe in households and buildings of tertiary sector since 1996 did increase, nearly 0.8% per household. In 2002 was 1,082 Mtoe with 40% for buildings. Electricity in buildings of residential and tertiary sector was 11,2 % ,121 Mtoe. Figures 18 and 19 introduce electricity consumption’s substantial difference between the former EU-15, where the largest electricity use is for space heating, followed by refrigerators & freezers and lightning while the new enlarged EU where electricity is more utilised by refrigerators & freezers and lighting.
Technical Guidebook for Efficient Cold Products in Residential and Tertiary Sectors. PROEFFICIENCY project.
19
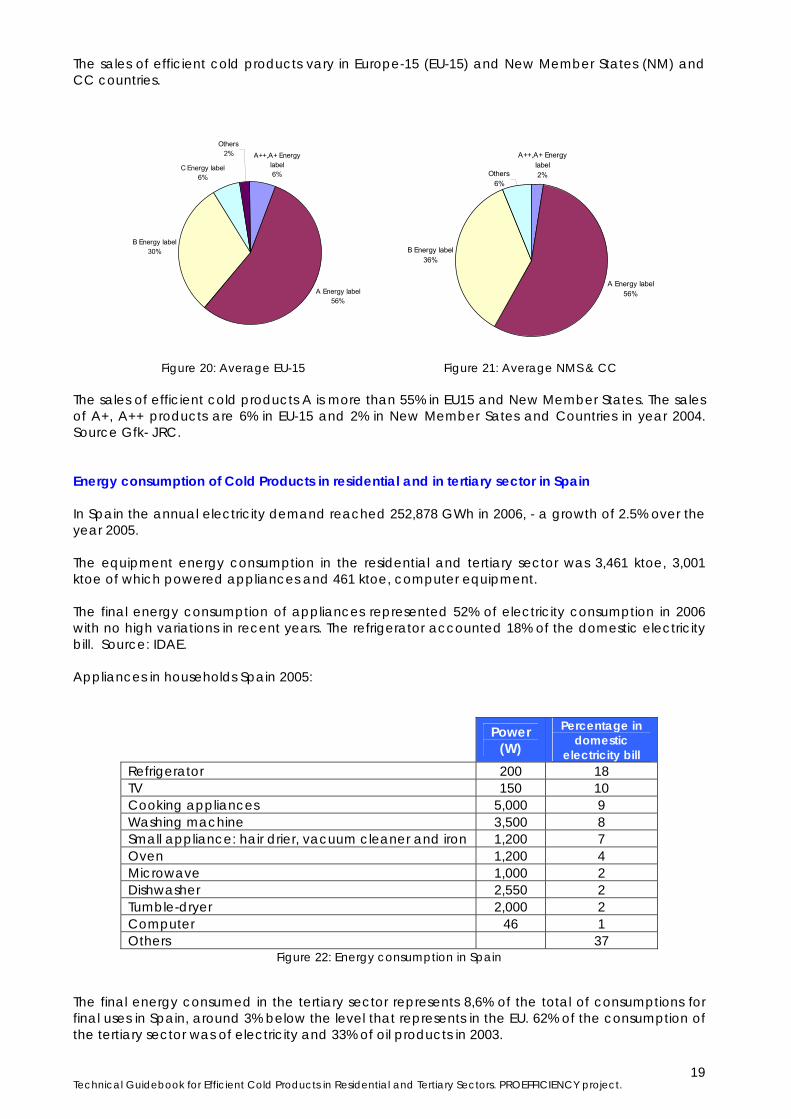
The sales of efficient cold products vary in Europe-15 (EU-15) and New Member States (NM) and CC countries.
Figure 20: Average EU-15 Figure 21: Average NMS & CC
The sales of efficient cold products A is more than 55% in EU15 and New Member States. The sales of A+, A++ products are 6% in EU-15 and 2% in New Member Sates and Countries in year 2004. Source Gfk- JRC. Energy consumption of Cold Products in residential and in tertiary sector in Spain In Spain the annual electricity demand reached 252,878 GWh in 2006, - a growth of 2.5% over the year 2005. The equipment energy consumption in the residential and tertiary sector was 3,461 ktoe, 3,001 ktoe of which powered appliances and 461 ktoe, computer equipment. The final energy consumption of appliances represented 52% of electricity consumption in 2006 with no high variations in recent years. The refrigerator accounted 18% of the domestic electricity bill. Source: IDAE. Appliances in households Spain 2005:
Power (W)
Percentage in domestic
electricity bill Refrigerator 200 18 TV 150 10 Cooking appliances 5,000 9 Washing machine 3,500 8 Small appliance: hair drier, vacuum cleaner and iron 1,200 7 Oven 1,200 4 Microwave 1,000 2 Dishwasher 2,550 2 Tumble-dryer 2,000 2 Computer 46 1 Others 37
Figure 22: Energy consumption in Spain The final energy consumed in the tertiary sector represents 8,6% of the total of consumptions for final uses in Spain, around 3% below the level that represents in the EU. 62% of the consumption of the tertiary sector was of electricity and 33% of oil products in 2003.
A++,A+ Energy label 6%
A Energy label56%
B Energy label30%
C Energy label6%
Others2% A++,A+ Energy
label 2%
A Energy label56%
B Energy label36%
Others6%
Technical Guidebook for Efficient Cold Products in Residential and Tertiary Sectors. PROEFFICIENCY project.
20
Spanish Savings and Efficiency Energy Strategy, E4, shows that 18% of the electricity bill is for cold products’ electricity consume. In Hotel, restaurant, bars sub-sector; others like office building, school and shops estimations are on study.
Tertiary sector (Unit: TWh)
Electricity consumption-2004
Thermal energy consumption-2004
Offices 31.50 5.13 Health and social action section 3.88 3.88
Wholesale and retail 14.37 - Hotels, restaurants 7.61 7.02
Education, research 3.31 7.37 TOTAL 60.67 23.4
Figure 23: Energy consumption in tertiary sector in Spain The number of refrigerators (mini-bars, etc) in the tertiary sector is not officially estimated in Spain. Few studies of some sub-sectors such as hotels, restaurants &bars in order to analyse energy consumption have been done.
1991 1995 2003 TOTAL CLASS A TOTAL CLASS A TOTAL CLASS A
Refrigerators 98 % 1 % 99.2 % 4 % 99.5 % 14 % Freezer 6.4 % 11 % 12.2 %
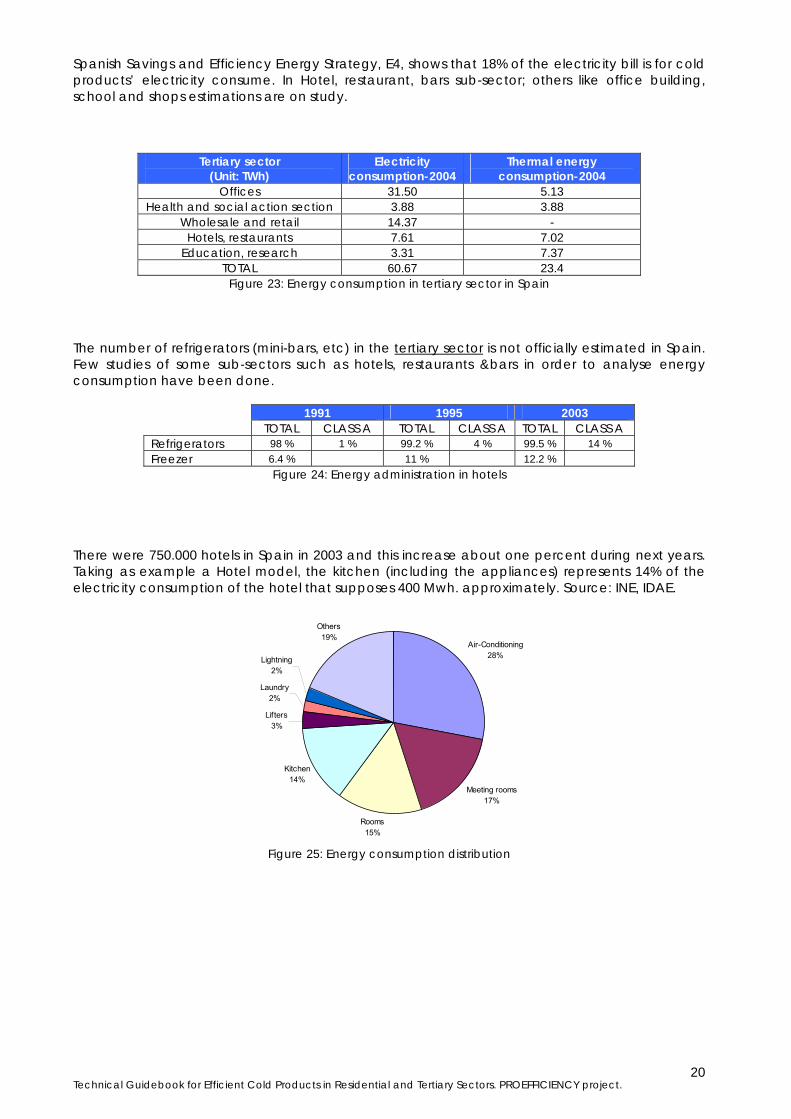
Figure 24: Energy administration in hotels There were 750.000 hotels in Spain in 2003 and this increase about one percent during next years. Taking as example a Hotel model, the kitchen (including the appliances) represents 14% of the electricity consumption of the hotel that supposes 400 Mwh. approximately. Source: INE, IDAE.
Air-Conditioning28%
Meeting rooms17%
Rooms15%
Kitchen14%
Lifters3%
Laundry 2%
Lightning2%
Others19%
Figure 25: Energy consumption distribution
Technical Guidebook for Efficient Cold Products in Residential and Tertiary Sectors. PROEFFICIENCY project.
21
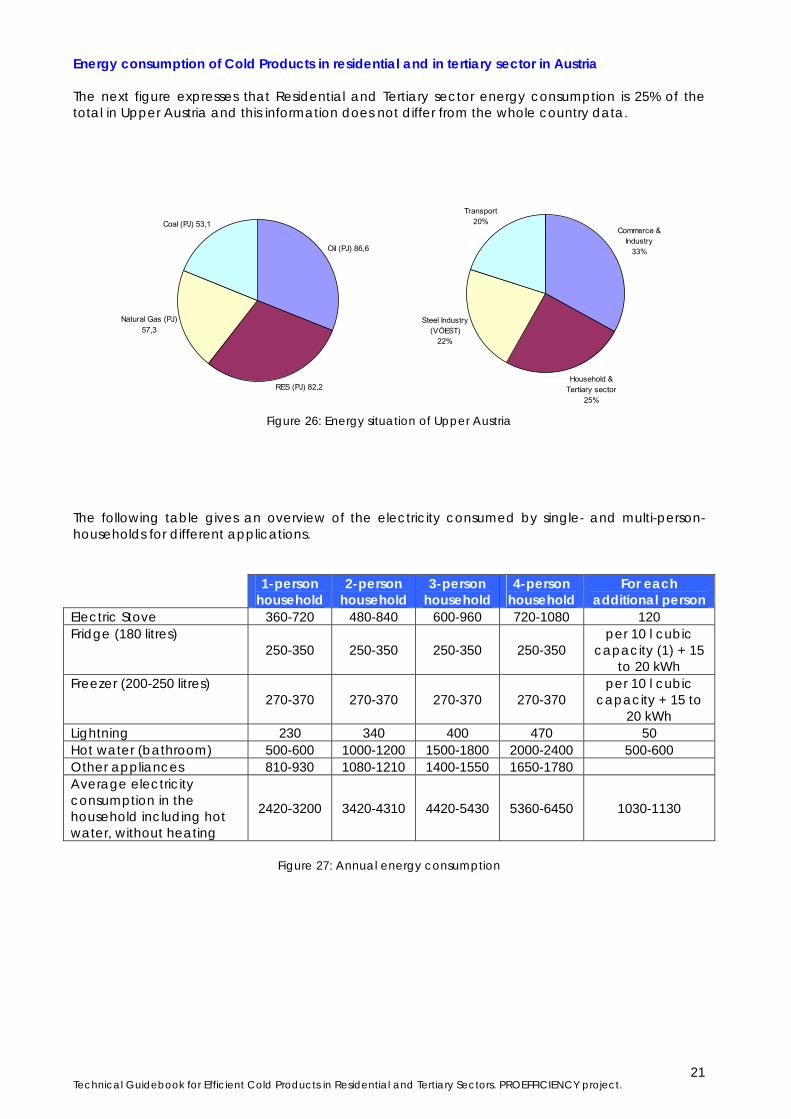
Energy consumption of Cold Products in residential and in tertiary sector in Austria The next figure expresses that Residential and Tertiary sector energy consumption is 25% of the total in Upper Austria and this information does not differ from the whole country data.
Oil (PJ) 86,6
RES (PJ) 82,2
Natural Gas (PJ) 57,3
Coal (PJ) 53,1Commerce &
Industry33%
Household & Tertiary sector
25%
Steel Industry (VÖEST)
22%
Transport20%
Figure 26: Energy situation of Upper Austria
The following table gives an overview of the electricity consumed by single- and multi-person-households for different applications. 1-person
household 2-person
household 3-person
household 4-person
household For each
additional person Electric Stove 360-720 480-840 600-960 720-1080 120 Fridge (180 litres)
250-350 250-350 250-350 250-350 per 10 l cubic
capacity (1) + 15 to 20 kWh
Freezer (200-250 litres) 270-370 270-370 270-370 270-370
per 10 l cubic capacity + 15 to
20 kWh Lightning 230 340 400 470 50 Hot water (bathroom) 500-600 1000-1200 1500-1800 2000-2400 500-600 Other appliances 810-930 1080-1210 1400-1550 1650-1780 Average electricity consumption in the household including hot water, without heating
2420-3200 3420-4310 4420-5430 5360-6450 1030-1130
Figure 27: Annual energy consumption
Technical Guidebook for Efficient Cold Products in Residential and Tertiary Sectors. PROEFFICIENCY project.
22
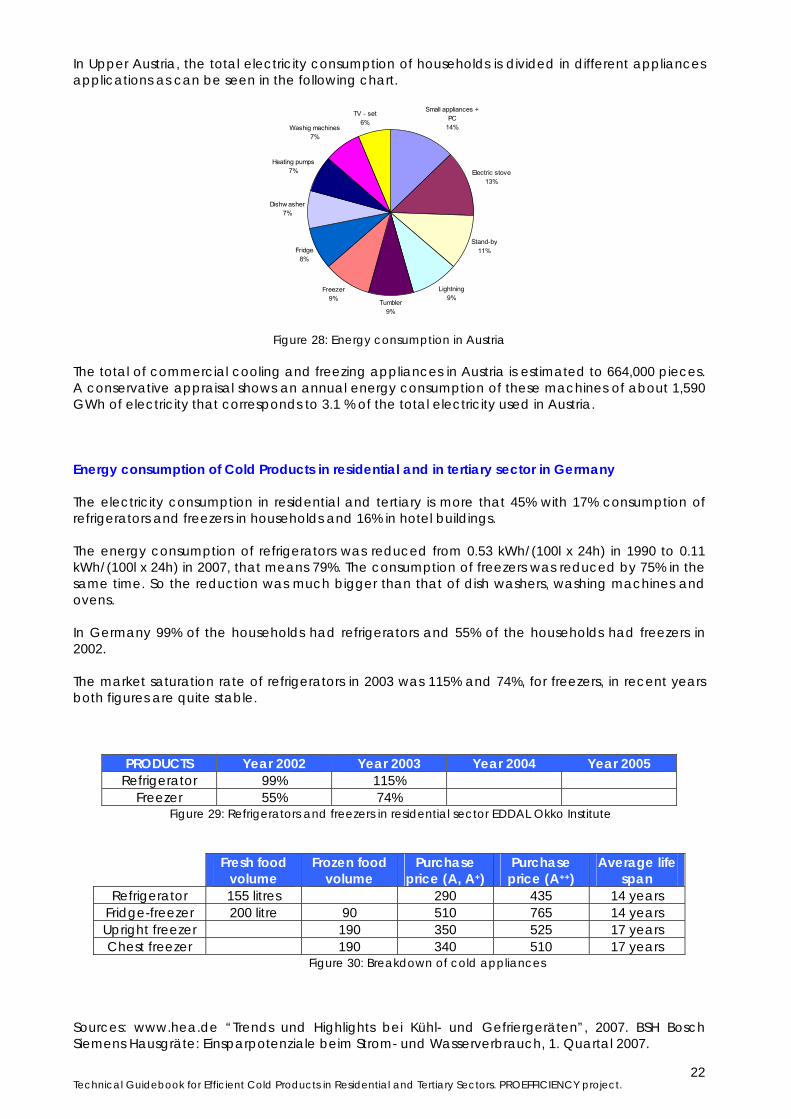
In Upper Austria, the total electricity consumption of households is divided in different appliances applications as can be seen in the following chart.
Small appliances + PC
14%
Electric stove13%
Stand-by11%
Lightning9%
Tumbler9%
Freezer9%
Fridge8%
Dishw asher7%
Heating pumps7%
Washig machines7%
TV - set6%
Figure 28: Energy consumption in Austria The total of commercial cooling and freezing appliances in Austria is estimated to 664,000 pieces. A conservative appraisal shows an annual energy consumption of these machines of about 1,590 GWh of electricity that corresponds to 3.1 % of the total electricity used in Austria. Energy consumption of Cold Products in residential and in tertiary sector in Germany The electricity consumption in residential and tertiary is more that 45% with 17% consumption of refrigerators and freezers in households and 16% in hotel buildings. The energy consumption of refrigerators was reduced from 0.53 kWh/(100l x 24h) in 1990 to 0.11 kWh/(100l x 24h) in 2007, that means 79%. The consumption of freezers was reduced by 75% in the same time. So the reduction was much bigger than that of dish washers, washing machines and ovens. In Germany 99% of the households had refrigerators and 55% of the households had freezers in 2002. The market saturation rate of refrigerators in 2003 was 115% and 74%, for freezers, in recent years both figures are quite stable.
PRODUCTS Year 2002 Year 2003 Year 2004 Year 2005 Refrigerator 99% 115%
Freezer 55% 74% Figure 29: Refrigerators and freezers in residential sector EDDAL Okko Institute
Fresh food volume
Frozen food volume
Purchase price (A, A+)
Purchase price (A++)
Average life span
Refrigerator 155 litres 290 435 14 years Fridge-freezer 200 litre 90 510 765 14 years Upright freezer 190 350 525 17 years Chest freezer 190 340 510 17 years
Figure 30: Breakdown of cold appliances Sources: www.hea.de “Trends und Highlights bei Kühl- und Gefriergeräten”, 2007. BSH Bosch Siemens Hausgräte: Einsparpotenziale beim Strom- und Wasserverbrauch, 1. Quartal 2007.
Technical Guidebook for Efficient Cold Products in Residential and Tertiary Sectors. PROEFFICIENCY project.
23
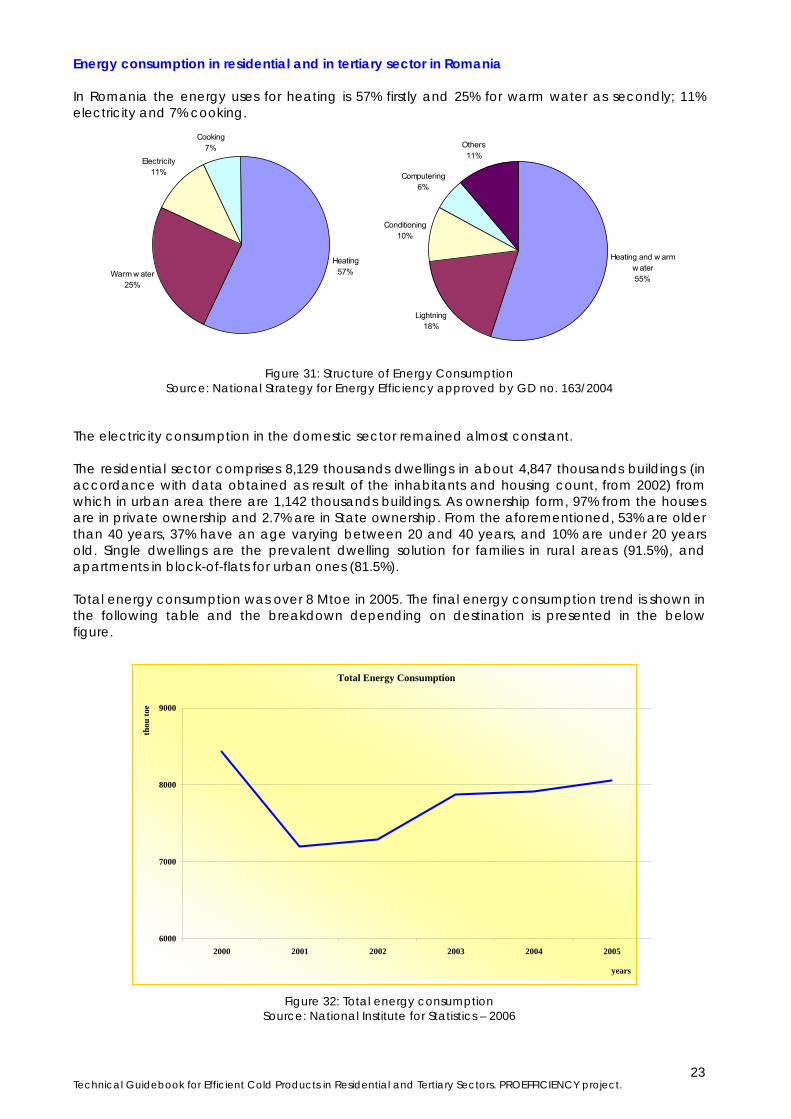
Energy consumption in residential and in tertiary sector in Romania In Romania the energy uses for heating is 57% firstly and 25% for warm water as secondly; 11% electricity and 7% cooking.
Heating57%Warm w ater
25%
Electricity11%
Cooking7%
Heating and w arm w ater55%
Lightning18%
Conditioning10%
Computering6%
Others11%
Figure 31: Structure of Energy Consumption Source: National Strategy for Energy Efficiency approved by GD no. 163/2004
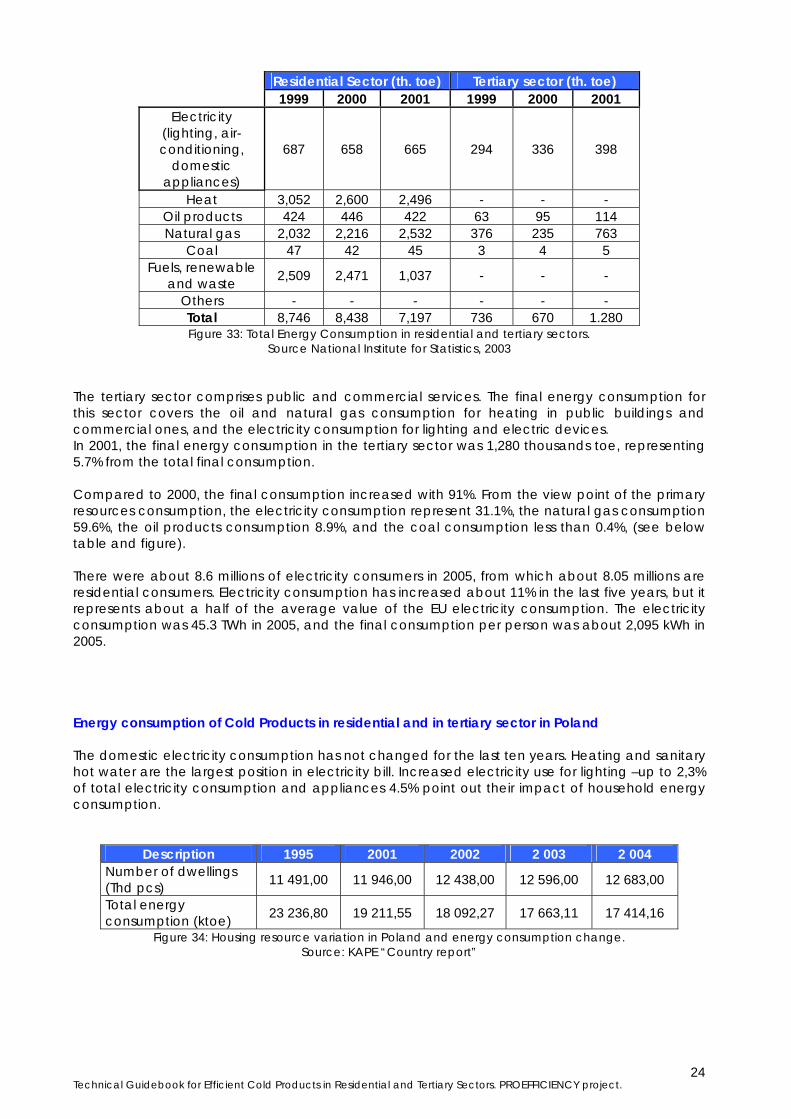
The electricity consumption in the domestic sector remained almost constant. The residential sector comprises 8,129 thousands dwellings in about 4,847 thousands buildings (in accordance with data obtained as result of the inhabitants and housing count, from 2002) from which in urban area there are 1,142 thousands buildings. As ownership form, 97% from the houses are in private ownership and 2.7% are in State ownership. From the aforementioned, 53% are older than 40 years, 37% have an age varying between 20 and 40 years, and 10% are under 20 years old. Single dwellings are the prevalent dwelling solution for families in rural areas (91.5%), and apartments in block-of-flats for urban ones (81.5%). Total energy consumption was over 8 Mtoe in 2005. The final energy consumption trend is shown in the following table and the breakdown depending on destination is presented in the below figure.
Figure 32: Total energy consumption Source: National Institute for Statistics – 2006
Total Energy Consumption
6000
7000
8000
9000
2000 2001 2002 2003 2004 2005
years
thou
toe
Technical Guidebook for Efficient Cold Products in Residential and Tertiary Sectors. PROEFFICIENCY project.
24
Residential Sector (th. toe) Tertiary sector (th. toe) 1999 2000 2001 1999 2000 2001
Electricity (lighting, air-conditioning,
domestic appliances)
687 658 665 294 336 398
Heat 3,052 2,600 2,496 - - - Oil products 424 446 422 63 95 114 Natural gas 2,032 2,216 2,532 376 235 763
Coal 47 42 45 3 4 5 Fuels, renewable
and waste 2,509 2,471 1,037 - - -
Others - - - - - - Total 8,746 8,438 7,197 736 670 1.280 Figure 33: Total Energy Consumption in residential and tertiary sectors.
Source National Institute for Statistics, 2003 The tertiary sector comprises public and commercial services. The final energy consumption for this sector covers the oil and natural gas consumption for heating in public buildings and commercial ones, and the electricity consumption for lighting and electric devices. In 2001, the final energy consumption in the tertiary sector was 1,280 thousands toe, representing 5.7% from the total final consumption. Compared to 2000, the final consumption increased with 91%. From the view point of the primary resources consumption, the electricity consumption represent 31.1%, the natural gas consumption 59.6%, the oil products consumption 8.9%, and the coal consumption less than 0.4%, (see below table and figure). There were about 8.6 millions of electricity consumers in 2005, from which about 8.05 millions are residential consumers. Electricity consumption has increased about 11% in the last five years, but it represents about a half of the average value of the EU electricity consumption. The electricity consumption was 45.3 TWh in 2005, and the final consumption per person was about 2,095 kWh in 2005. Energy consumption of Cold Products in residential and in tertiary sector in Poland The domestic electricity consumption has not changed for the last ten years. Heating and sanitary hot water are the largest position in electricity bill. Increased electricity use for lighting –up to 2,3% of total electricity consumption and appliances 4.5% point out their impact of household energy consumption.
Description 1995 2001 2002 2 003 2 004 Number of dwellings (Thd pcs) 11 491,00 11 946,00 12 438,00 12 596,00 12 683,00
Total energy consumption (ktoe) 23 236,80 19 211,55 18 092,27 17 663,11 17 414,16
Figure 34: Housing resource variation in Poland and energy consumption change. Source: KAPE “Country report”
Technical Guidebook for Efficient Cold Products in Residential and Tertiary Sectors. PROEFFICIENCY project.
25
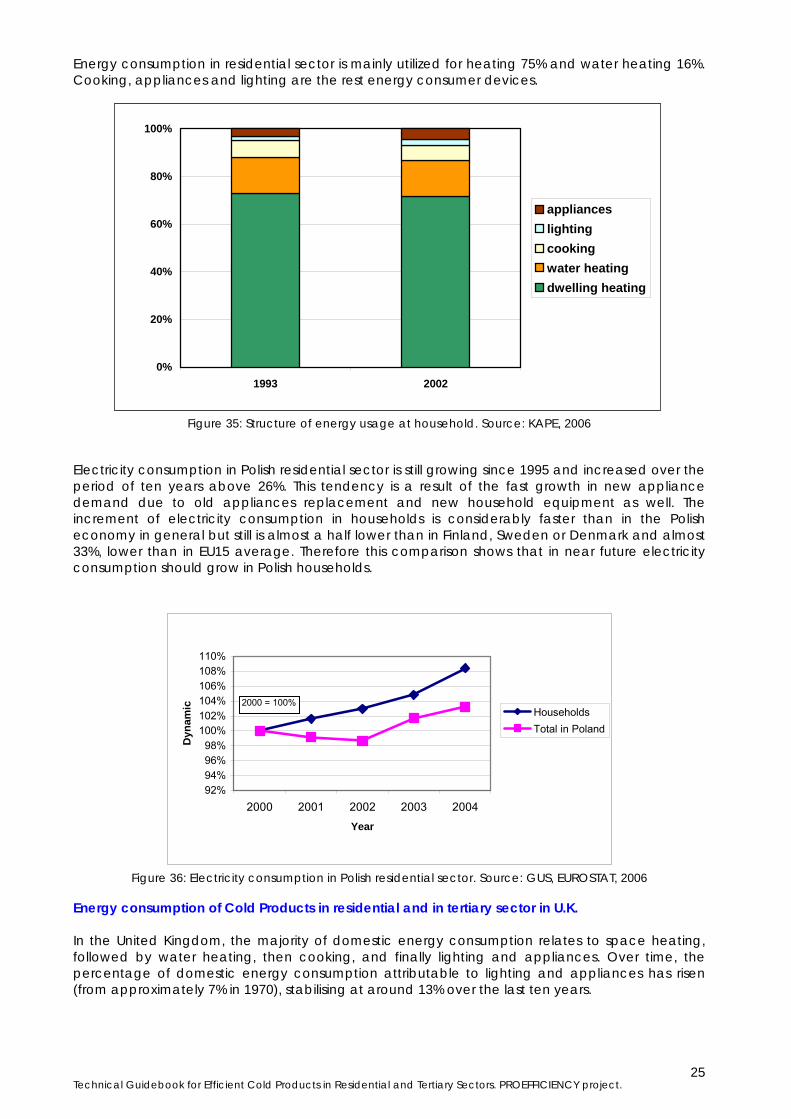
Energy consumption in residential sector is mainly utilized for heating 75% and water heating 16%. Cooking, appliances and lighting are the rest energy consumer devices.
Figure 35: Structure of energy usage at household. Source: KAPE, 2006
Electricity consumption in Polish residential sector is still growing since 1995 and increased over the period of ten years above 26%. This tendency is a result of the fast growth in new appliance demand due to old appliances replacement and new household equipment as well. The increment of electricity consumption in households is considerably faster than in the Polish economy in general but still is almost a half lower than in Finland, Sweden or Denmark and almost 33%, lower than in EU15 average. Therefore this comparison shows that in near future electricity consumption should grow in Polish households.
92%94%96%98%
100%102%104%106%108%110%
2000 2001 2002 2003 2004Year
Dyn
amic Households
Total in Poland
2000 = 100%
Figure 36: Electricity consumption in Polish residential sector. Source: GUS, EUROSTAT, 2006
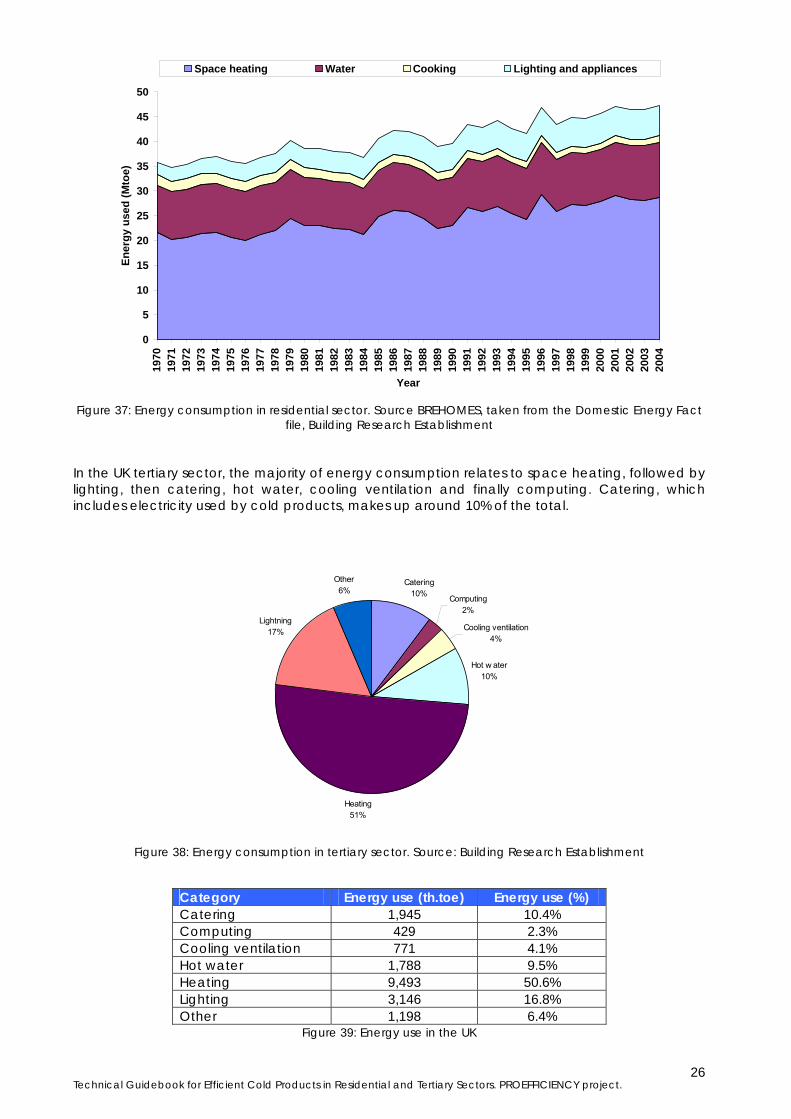
Energy consumption of Cold Products in residential and in tertiary sector in U.K. In the United Kingdom, the majority of domestic energy consumption relates to space heating, followed by water heating, then cooking, and finally lighting and appliances. Over time, the percentage of domestic energy consumption attributable to lighting and appliances has risen (from approximately 7% in 1970), stabilising at around 13% over the last ten years.
0%
20%
40%
60%
80%
100%
1993 2002
applianceslightingcookingwater heatingdwelling heating
Technical Guidebook for Efficient Cold Products in Residential and Tertiary Sectors. PROEFFICIENCY project.
26
0
5
10
15
20
25
30
35
40
45
50
1970
1971
1972
1973
1974
1975
1976
1977
1978
1979
1980
1981
1982
1983
1984
1985
1986
1987
1988
1989
1990
1991
1992
1993
1994
1995
1996
1997
1998
1999
2000
2001
2002
2003
2004
Year
Ener
gy u
sed
(Mto
e)
Space heating Water Cooking Lighting and appliances
Figure 37: Energy consumption in residential sector. Source BREHOMES, taken from the Domestic Energy Fact
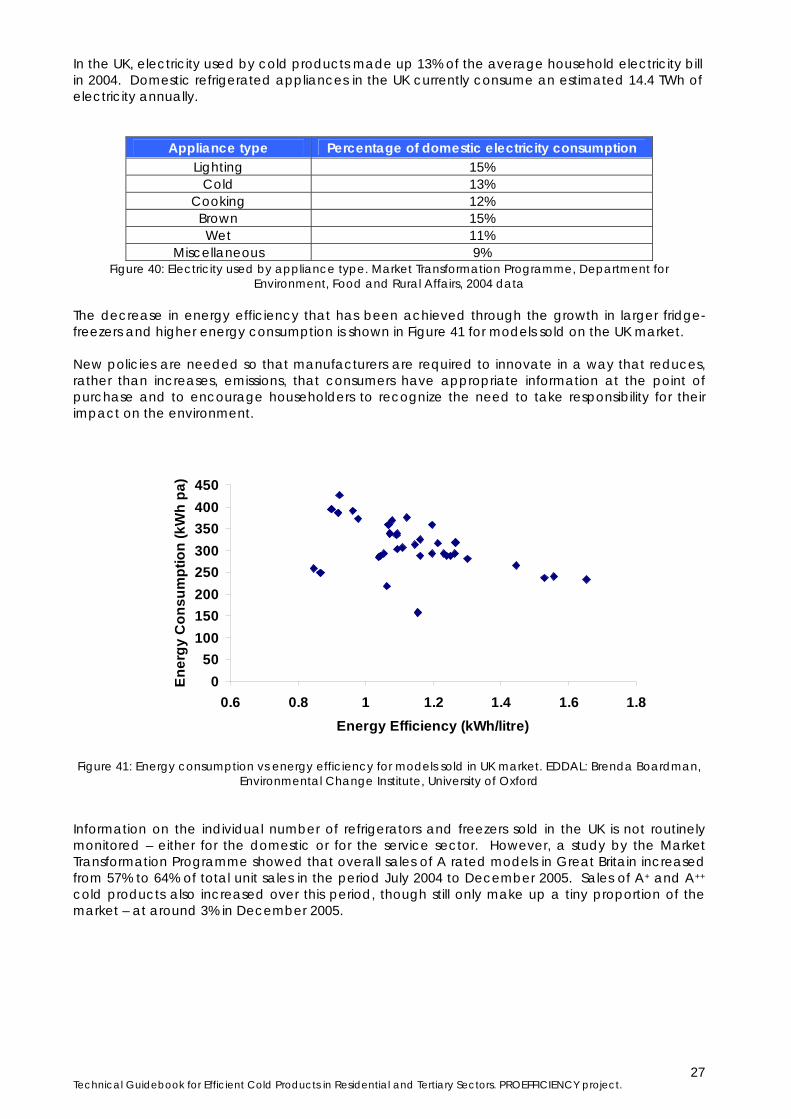
file, Building Research Establishment In the UK tertiary sector, the majority of energy consumption relates to space heating, followed by lighting, then catering, hot water, cooling ventilation and finally computing. Catering, which includes electricity used by cold products, makes up around 10% of the total.
Catering10% Computing
2%
Cooling ventilation4%
Hot w ater10%
Heating51%
Lightning17%
Other6%
Figure 38: Energy consumption in tertiary sector. Source: Building Research Establishment
Category Energy use (th.toe) Energy use (%) Catering 1,945 10.4% Computing 429 2.3% Cooling ventilation 771 4.1% Hot water 1,788 9.5% Heating 9,493 50.6% Lighting 3,146 16.8% Other 1,198 6.4%
Figure 39: Energy use in the UK
Technical Guidebook for Efficient Cold Products in Residential and Tertiary Sectors. PROEFFICIENCY project.
27
In the UK, electricity used by cold products made up 13% of the average household electricity bill in 2004. Domestic refrigerated appliances in the UK currently consume an estimated 14.4 TWh of electricity annually.
Appliance type Percentage of domestic electricity consumption Lighting 15%
Cold 13% Cooking 12%
Brown 15% Wet 11%
Miscellaneous 9% Figure 40: Electricity used by appliance type. Market Transformation Programme, Department for
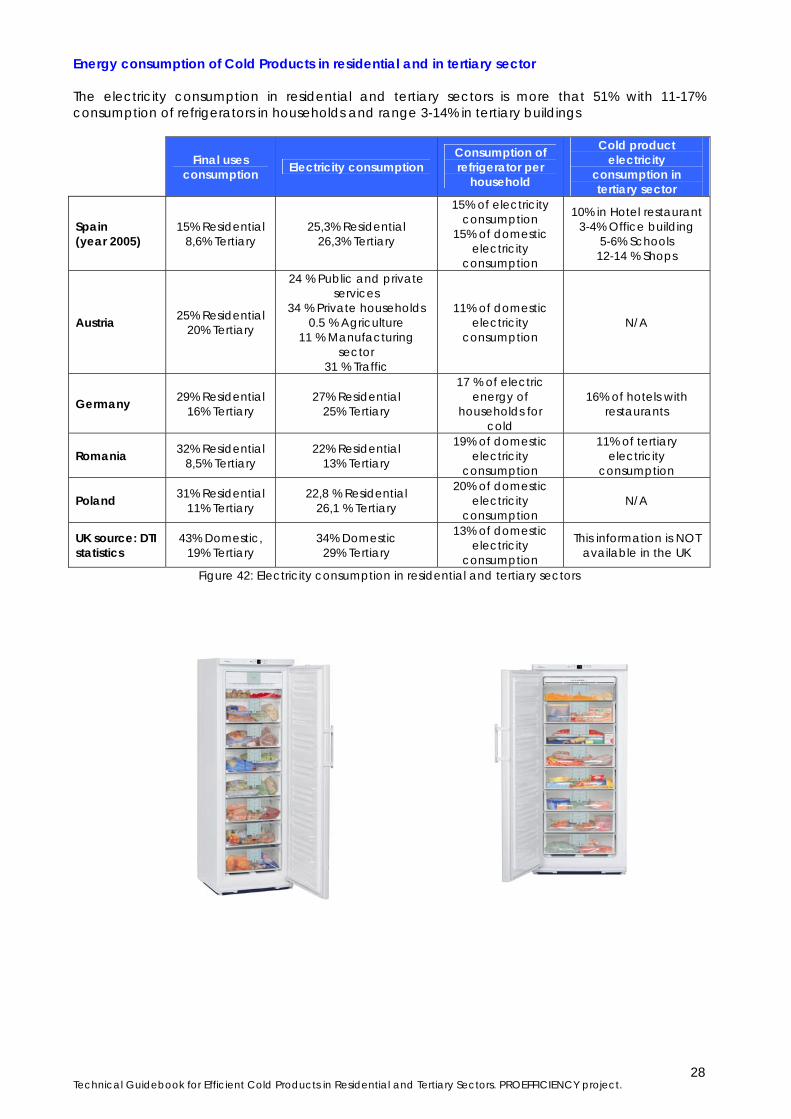
Environment, Food and Rural Affairs, 2004 data The decrease in energy efficiency that has been achieved through the growth in larger fridge-freezers and higher energy consumption is shown in Figure 41 for models sold on the UK market. New policies are needed so that manufacturers are required to innovate in a way that reduces, rather than increases, emissions, that consumers have appropriate information at the point of purchase and to encourage householders to recognize the need to take responsibility for their impact on the environment.
Figure 41: Energy consumption vs energy efficiency for models sold in UK market. EDDAL: Brenda Boardman, Environmental Change Institute, University of Oxford
Information on the individual number of refrigerators and freezers sold in the UK is not routinely monitored – either for the domestic or for the service sector. However, a study by the Market Transformation Programme showed that overall sales of A rated models in Great Britain increased from 57% to 64% of total unit sales in the period July 2004 to December 2005. Sales of A+ and A++ cold products also increased over this period, though still only make up a tiny proportion of the market – at around 3% in December 2005.
050
100150200250300350400450
0.6 0.8 1 1.2 1.4 1.6 1.8Energy Efficiency (kWh/litre)
Ener
gy C
onsu
mpt
ion
(kW
h pa
)
Technical Guidebook for Efficient Cold Products in Residential and Tertiary Sectors. PROEFFICIENCY project.
28
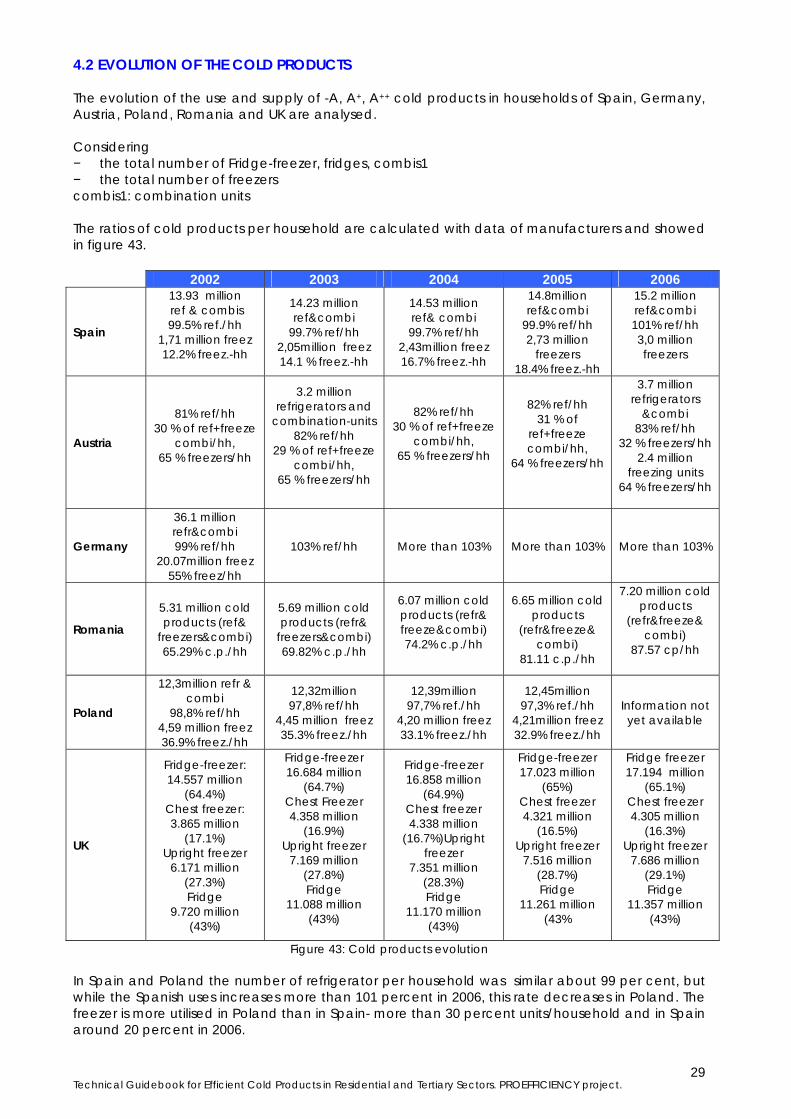
Energy consumption of Cold Products in residential and in tertiary sector The electricity consumption in residential and tertiary sectors is more that 51% with 11-17% consumption of refrigerators in households and range 3-14% in tertiary buildings
Final uses consumption Electricity consumption
Consumption of refrigerator per
household
Cold product electricity
consumption in tertiary sector
Spain (year 2005)
15% Residential 8,6% Tertiary
25,3% Residential 26,3% Tertiary
15% of electricity consumption
15% of domestic electricity
consumption
10% in Hotel restaurant 3-4% Office building
5-6% Schools 12-14 % Shops
Austria 25% Residential 20% Tertiary
24 % Public and private services
34 % Private households 0.5 % Agriculture
11 % Manufacturing sector
31 % Traffic
11% of domestic electricity
consumption N/A
Germany 29% Residential 16% Tertiary
27% Residential 25% Tertiary
17 % of electric energy of
households for cold
16% of hotels with restaurants
Romania 32% Residential 8,5% Tertiary
22% Residential 13% Tertiary
19% of domestic electricity
consumption
11% of tertiary electricity
consumption
Poland 31% Residential 11% Tertiary
22,8 % Residential 26,1 % Tertiary
20% of domestic electricity
consumption N/A
UK source: DTI statistics
43% Domestic, 19% Tertiary
34% Domestic 29% Tertiary
13% of domestic electricity
consumption
This information is NOT available in the UK
Figure 42: Electricity consumption in residential and tertiary sectors
Technical Guidebook for Efficient Cold Products in Residential and Tertiary Sectors. PROEFFICIENCY project.
29
4.2 EVOLUTION OF THE COLD PRODUCTS The evolution of the use and supply of -A, A+, A++ cold products in households of Spain, Germany, Austria, Poland, Romania and UK are analysed. Considering − the total number of Fridge-freezer, fridges, combis1 − the total number of freezers combis1: combination units The ratios of cold products per household are calculated with data of manufacturers and showed in figure 43.
Figure 43: Cold products evolution In Spain and Poland the number of refrigerator per household was similar about 99 per cent, but while the Spanish uses increases more than 101 percent in 2006, this rate decreases in Poland. The freezer is more utilised in Poland than in Spain- more than 30 percent units/household and in Spain around 20 percent in 2006.
2002 2003 2004 2005 2006
Spain
13.93 million ref & combis 99.5% ref./hh
1,71 million freez 12.2% freez.-hh
14.23 million ref&combi
99.7% ref/hh 2,05million freez 14.1 % freez.-hh
14.53 million ref& combi 99.7% ref/hh
2,43million freez 16.7% freez.-hh
14.8million ref&combi
99.9% ref/hh 2,73 million
freezers 18.4% freez.-hh
15.2 million ref&combi 101% ref/hh 3,0 million freezers
Austria
81% ref/hh 30 % of ref+freeze
combi/hh, 65 % freezers/hh
3.2 million refrigerators and
combination-units 82% ref/hh
29 % of ref+freeze combi/hh,
65 % freezers/hh
82% ref/hh 30 % of ref+freeze
combi/hh, 65 % freezers/hh
82% ref/hh 31 % of
ref+freeze combi/hh,
64 % freezers/hh
3.7 million refrigerators
&combi 83% ref/hh
32 % freezers/hh 2.4 million
freezing units 64 % freezers/hh
Germany
36.1 million refr&combi 99% ref/hh
20.07million freez 55% freez/hh
103% ref/hh More than 103% More than 103% More than 103%
Romania
5.31 million cold products (ref&
freezers&combi) 65.29% c.p./hh
5.69 million cold products (refr&
freezers&combi) 69.82% c.p./hh
6.07 million cold products (refr& freeze&combi) 74.2% c.p./hh
6.65 million cold products
(refr&freeze& combi)
81.11 c.p./hh
7.20 million cold products
(refr&freeze& combi)
87.57 cp/hh
Poland
12,3million refr & combi
98,8% ref/hh 4,59 million freez 36.9% freez./hh
12,32million 97,8% ref/hh
4,45 million freez 35.3% freez./hh
12,39million 97,7% ref./hh
4,20 million freez 33.1% freez./hh
12,45million 97,3% ref./hh
4,21million freez 32.9% freez./hh
Information not yet available
UK
Fridge-freezer: 14.557 million
(64.4%) Chest freezer: 3.865 million
(17.1%) Upright freezer
6.171 million (27.3%) Fridge
9.720 million (43%)
Fridge-freezer 16.684 million
(64.7%) Chest Freezer 4.358 million
(16.9%) Upright freezer
7.169 million (27.8%) Fridge
11.088 million (43%)
Fridge-freezer 16.858 million
(64.9%) Chest freezer 4.338 million
(16.7%)Upright freezer
7.351 million (28.3%) Fridge
11.170 million (43%)
Fridge-freezer 17.023 million
(65%) Chest freezer 4.321 million
(16.5%) Upright freezer
7.516 million (28.7%) Fridge
11.261 million (43%
Fridge freezer 17.194 million
(65.1%) Chest freezer 4.305 million
(16.3%) Upright freezer
7.686 million (29.1%) Fridge
11.357 million (43%)
Technical Guidebook for Efficient Cold Products in Residential and Tertiary Sectors. PROEFFICIENCY project.
30
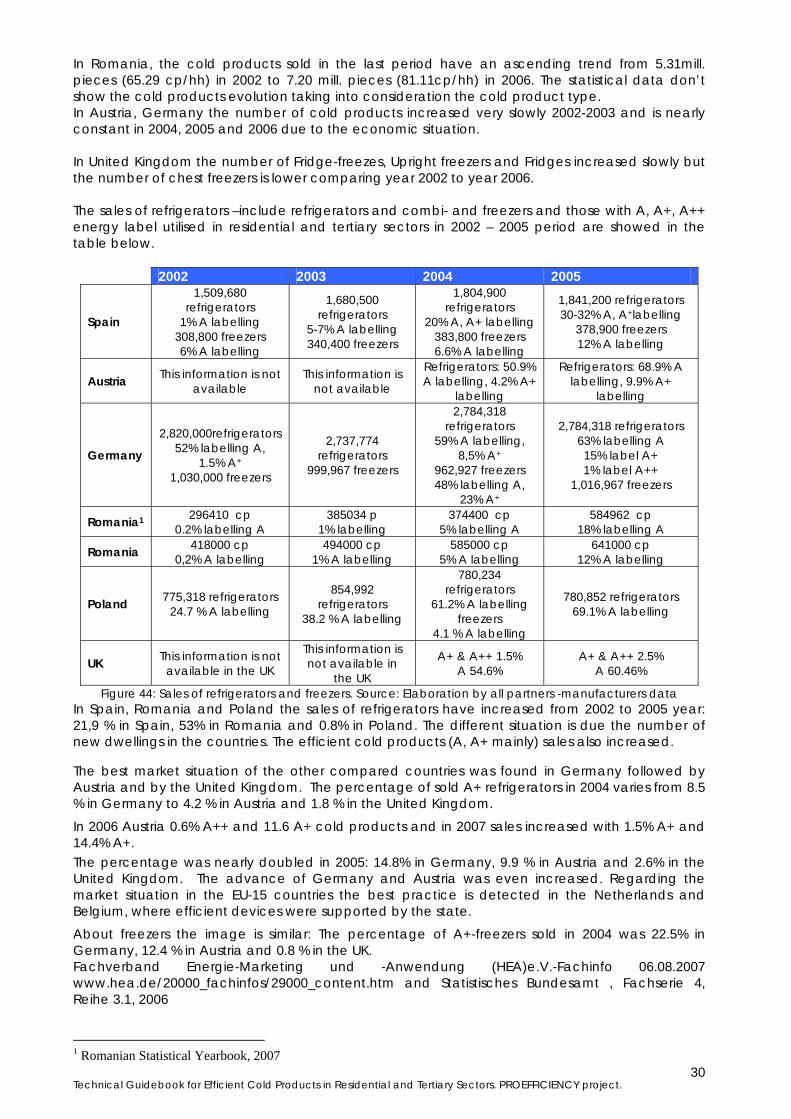
In Romania, the cold products sold in the last period have an ascending trend from 5.31mill. pieces (65.29 cp/hh) in 2002 to 7.20 mill. pieces (81.11cp/hh) in 2006. The statistical data don’t show the cold products evolution taking into consideration the cold product type. In Austria, Germany the number of cold products increased very slowly 2002-2003 and is nearly constant in 2004, 2005 and 2006 due to the economic situation. In United Kingdom the number of Fridge-freezes, Upright freezers and Fridges increased slowly but the number of chest freezers is lower comparing year 2002 to year 2006. The sales of refrigerators –include refrigerators and combi- and freezers and those with A, A+, A++ energy label utilised in residential and tertiary sectors in 2002 – 2005 period are showed in the table below.
2002 2003 2004 2005
Spain
1,509,680 refrigerators
1% A labelling 308,800 freezers 6% A labelling
1,680,500 refrigerators
5-7% A labelling 340,400 freezers
1,804,900 refrigerators
20% A, A+ labelling 383,800 freezers 6.6% A labelling
1,841,200 refrigerators 30-32% A, A+labelling
378,900 freezers 12% A labelling
Austria This information is not available
This information is not available
Refrigerators: 50.9% A labelling, 4.2% A+
labelling
Refrigerators: 68.9% A labelling, 9.9% A+
labelling
Germany
2,820,000refrigerators 52% labelling A,
1.5% A+
1,030,000 freezers
2,737,774 refrigerators
999,967 freezers
2,784,318 refrigerators
59% A labelling, 8,5% A+
962,927 freezers 48% labelling A,
23% A+
2,784,318 refrigerators 63% labelling A 15% label A+ 1% label A++
1,016,967 freezers
Romania1 296410 cp 0.2% labelling A
385034 p 1% labelling
374400 cp 5% labelling A
584962 cp 18% labelling A
Romania 418000 cp 0,2% A labelling
494000 cp 1% A labelling
585000 cp 5% A labelling
641000 cp 12% A labelling
Poland 775,318 refrigerators 24.7 % A labelling
854,992 refrigerators
38.2 % A labelling
780,234 refrigerators
61.2% A labelling freezers
4.1 % A labelling
780,852 refrigerators 69.1% A labelling
UK This information is not available in the UK
This information is not available in
the UK
A+ & A++ 1.5% A 54.6%
A+ & A++ 2.5% A 60.46%
Figure 44: Sales of refrigerators and freezers. Source: Elaboration by all partners -manufacturers data In Spain, Romania and Poland the sales of refrigerators have increased from 2002 to 2005 year: 21,9 % in Spain, 53% in Romania and 0.8% in Poland. The different situation is due the number of new dwellings in the countries. The efficient cold products (A, A+ mainly) sales also increased. The best market situation of the other compared countries was found in Germany followed by Austria and by the United Kingdom. The percentage of sold A+ refrigerators in 2004 varies from 8.5 % in Germany to 4.2 % in Austria and 1.8 % in the United Kingdom.
In 2006 Austria 0.6% A++ and 11.6 A+ cold products and in 2007 sales increased with 1.5% A+ and 14.4% A+.
The percentage was nearly doubled in 2005: 14.8% in Germany, 9.9 % in Austria and 2.6% in the United Kingdom. The advance of Germany and Austria was even increased. Regarding the market situation in the EU-15 countries the best practice is detected in the Netherlands and Belgium, where efficient devices were supported by the state.
About freezers the image is similar: The percentage of A+-freezers sold in 2004 was 22.5% in Germany, 12.4 % in Austria and 0.8 % in the UK. Fachverband Energie-Marketing und -Anwendung (HEA)e.V.-Fachinfo 06.08.2007 www.hea.de/20000_fachinfos/29000_content.htm and Statistisches Bundesamt , Fachserie 4, Reihe 3.1, 2006
1 Romanian Statistical Yearbook, 2007
Technical Guidebook for Efficient Cold Products in Residential and Tertiary Sectors. PROEFFICIENCY project.
31
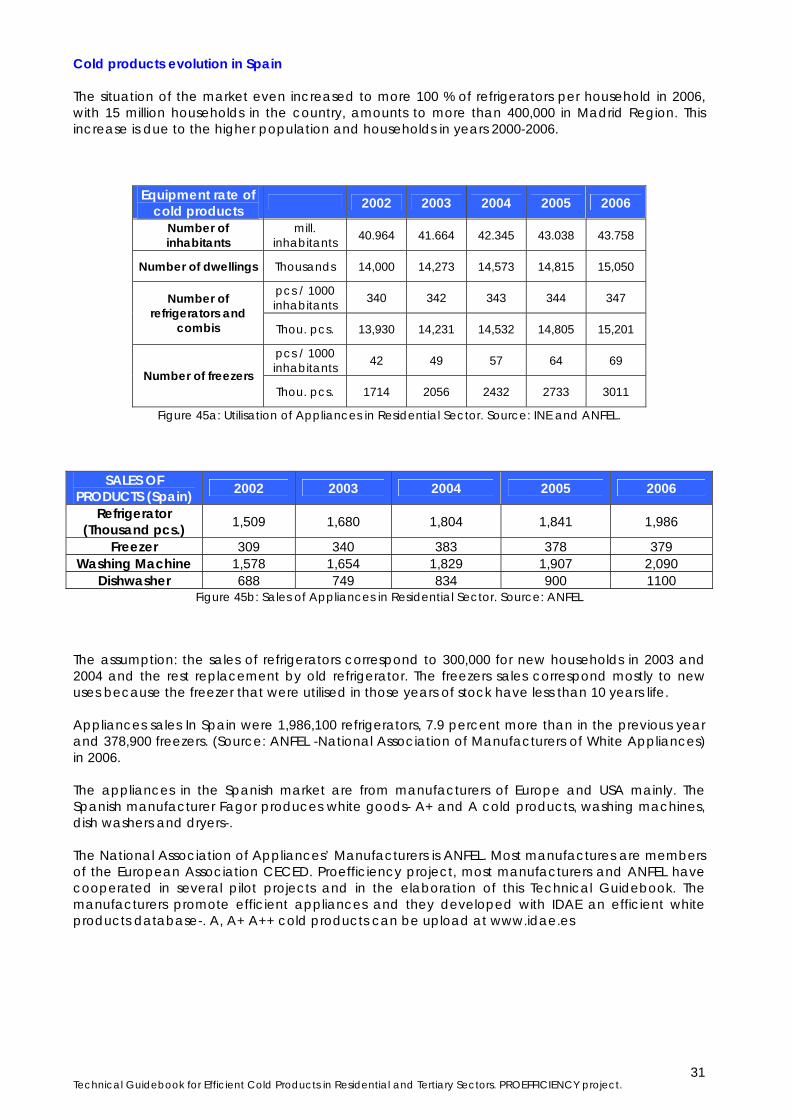
Cold products evolution in Spain The situation of the market even increased to more 100 % of refrigerators per household in 2006, with 15 million households in the country, amounts to more than 400,000 in Madrid Region. This increase is due to the higher population and households in years 2000-2006.
Equipment rate of cold products 2002 2003 2004 2005 2006
Number of inhabitants
mill. inhabitants 40.964 41.664 42.345 43.038 43.758
Number of dwellings Thousands 14,000 14,273 14,573 14,815 15,050
pcs / 1000 inhabitants 340 342 343 344 347 Number of
refrigerators and combis Thou. pcs. 13,930 14,231 14,532 14,805 15,201
pcs / 1000 inhabitants 42 49 57 64 69
Number of freezers Thou. pcs. 1714 2056 2432 2733 3011
Figure 45a: Utilisation of Appliances in Residential Sector. Source: INE and ANFEL.
SALES OF PRODUCTS (Spain) 2002 2003 2004 2005 2006
Refrigerator (Thousand pcs.) 1,509 1,680 1,804 1,841 1,986
Freezer 309 340 383 378 379 Washing Machine 1,578 1,654 1,829 1,907 2,090
Dishwasher 688 749 834 900 1100 Figure 45b: Sales of Appliances in Residential Sector. Source: ANFEL
The assumption: the sales of refrigerators correspond to 300,000 for new households in 2003 and 2004 and the rest replacement by old refrigerator. The freezers sales correspond mostly to new uses because the freezer that were utilised in those years of stock have less than 10 years life. Appliances sales In Spain were 1,986,100 refrigerators, 7.9 percent more than in the previous year and 378,900 freezers. (Source: ANFEL -National Association of Manufacturers of White Appliances) in 2006. The appliances in the Spanish market are from manufacturers of Europe and USA mainly. The Spanish manufacturer Fagor produces white goods- A+ and A cold products, washing machines, dish washers and dryers-. The National Association of Appliances’ Manufacturers is ANFEL. Most manufactures are members of the European Association CECED. Proefficiency project, most manufacturers and ANFEL have cooperated in several pilot projects and in the elaboration of this Technical Guidebook. The manufacturers promote efficient appliances and they developed with IDAE an efficient white products database-. A, A+ A++ cold products can be upload at www.idae.es
Technical Guidebook for Efficient Cold Products in Residential and Tertiary Sectors. PROEFFICIENCY project.
32
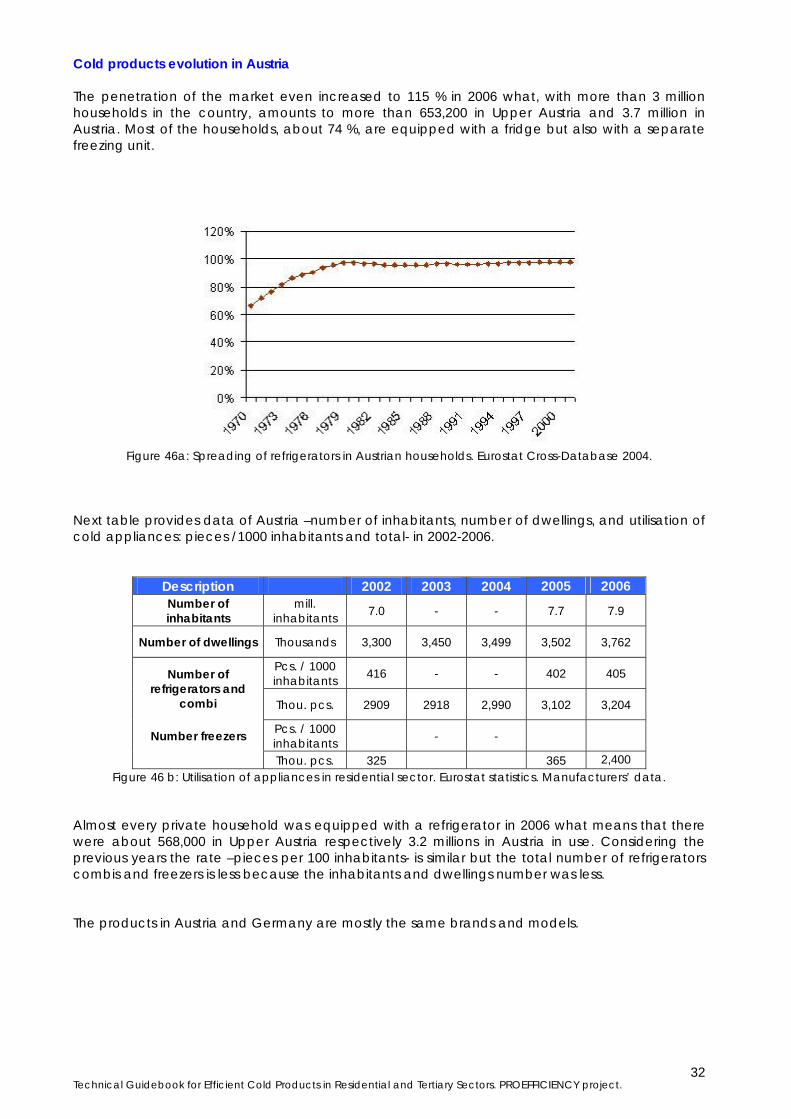
Cold products evolution in Austria The penetration of the market even increased to 115 % in 2006 what, with more than 3 million households in the country, amounts to more than 653,200 in Upper Austria and 3.7 million in Austria. Most of the households, about 74 %, are equipped with a fridge but also with a separate freezing unit.
Figure 46a: Spreading of refrigerators in Austrian households. Eurostat Cross-Database 2004.
Next table provides data of Austria –number of inhabitants, number of dwellings, and utilisation of cold appliances: pieces /1000 inhabitants and total- in 2002-2006.
Description 2002 2003 2004 2005 2006 Number of inhabitants
mill. inhabitants 7.0 - - 7.7 7.9
Number of dwellings Thousands 3,300 3,450 3,499 3,502 3,762
Pcs. / 1000 inhabitants 416 - - 402 405 Number of
refrigerators and combi Thou. pcs. 2909 2918 2,990 3,102 3,204
Number freezers Pcs. / 1000 inhabitants - -
Thou. pcs. 325 365 2,400 Figure 46 b: Utilisation of appliances in residential sector. Eurostat statistics. Manufacturers’ data.
Almost every private household was equipped with a refrigerator in 2006 what means that there were about 568,000 in Upper Austria respectively 3.2 millions in Austria in use. Considering the previous years the rate –pieces per 100 inhabitants- is similar but the total number of refrigerators combis and freezers is less because the inhabitants and dwellings number was less. The products in Austria and Germany are mostly the same brands and models.
Technical Guidebook for Efficient Cold Products in Residential and Tertiary Sectors. PROEFFICIENCY project.
33
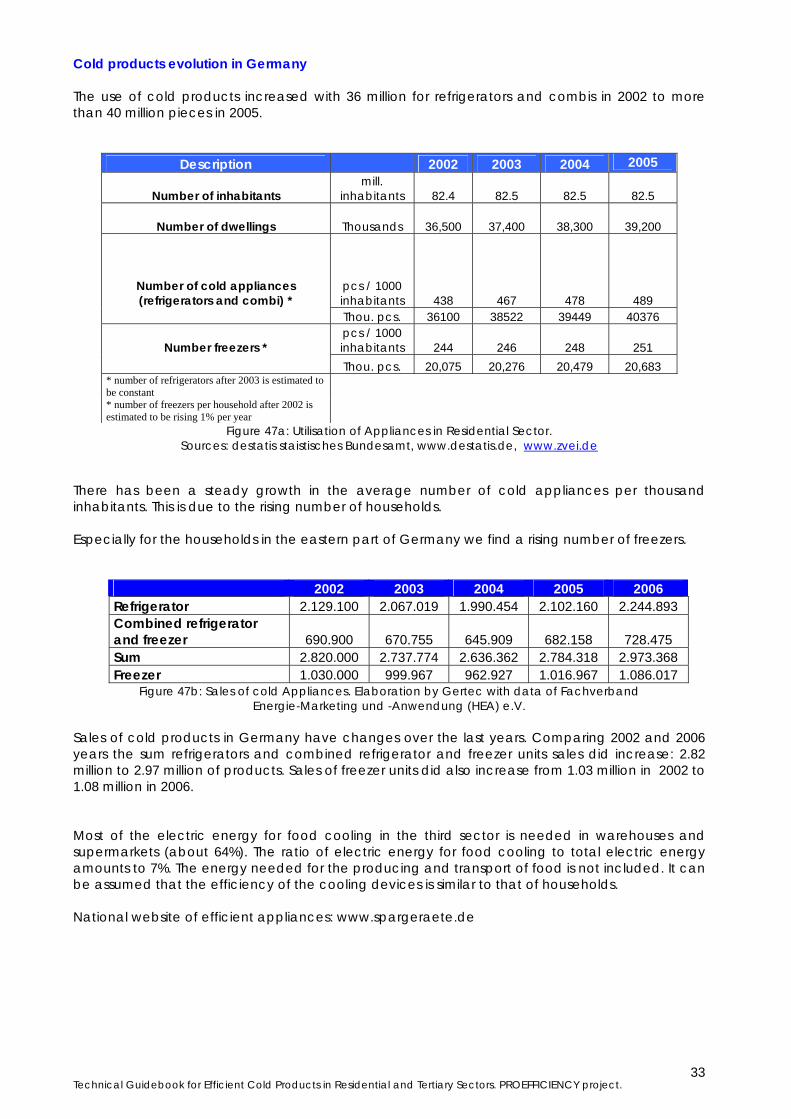
Cold products evolution in Germany The use of cold products increased with 36 million for refrigerators and combis in 2002 to more than 40 million pieces in 2005.
Description 2002 2003 2004 2005
Number of inhabitants mill.
inhabitants 82.4 82.5 82.5 82.5
Number of dwellings Thousands 36,500 37,400 38,300 39,200
Number of cold appliances (refrigerators and combi) *
pcs / 1000 inhabitants 438 467 478 489
Thou. pcs. 36100 38522 39449 40376
Number freezers * pcs / 1000 inhabitants 244 246 248 251
Thou. pcs. 20,075 20,276 20,479 20,683 * number of refrigerators after 2003 is estimated to be constant * number of freezers per household after 2002 is estimated to be rising 1% per year
Figure 47a: Utilisation of Appliances in Residential Sector. Sources: destatis staistisches Bundesamt, www.destatis.de, www.zvei.de
There has been a steady growth in the average number of cold appliances per thousand inhabitants. This is due to the rising number of households. Especially for the households in the eastern part of Germany we find a rising number of freezers.
2002 2003 2004 2005 2006 Refrigerator 2.129.100 2.067.019 1.990.454 2.102.160 2.244.893 Combined refrigerator and freezer 690.900 670.755 645.909 682.158 728.475 Sum 2.820.000 2.737.774 2.636.362 2.784.318 2.973.368 Freezer 1.030.000 999.967 962.927 1.016.967 1.086.017
Figure 47b: Sales of cold Appliances. Elaboration by Gertec with data of Fachverband Energie-Marketing und -Anwendung (HEA) e.V.
Sales of cold products in Germany have changes over the last years. Comparing 2002 and 2006 years the sum refrigerators and combined refrigerator and freezer units sales did increase: 2.82 million to 2.97 million of products. Sales of freezer units did also increase from 1.03 million in 2002 to 1.08 million in 2006. Most of the electric energy for food cooling in the third sector is needed in warehouses and supermarkets (about 64%). The ratio of electric energy for food cooling to total electric energy amounts to 7%. The energy needed for the producing and transport of food is not included. It can be assumed that the efficiency of the cooling devices is similar to that of households. National website of efficient appliances: www.spargeraete.de
Technical Guidebook for Efficient Cold Products in Residential and Tertiary Sectors. PROEFFICIENCY project.
34
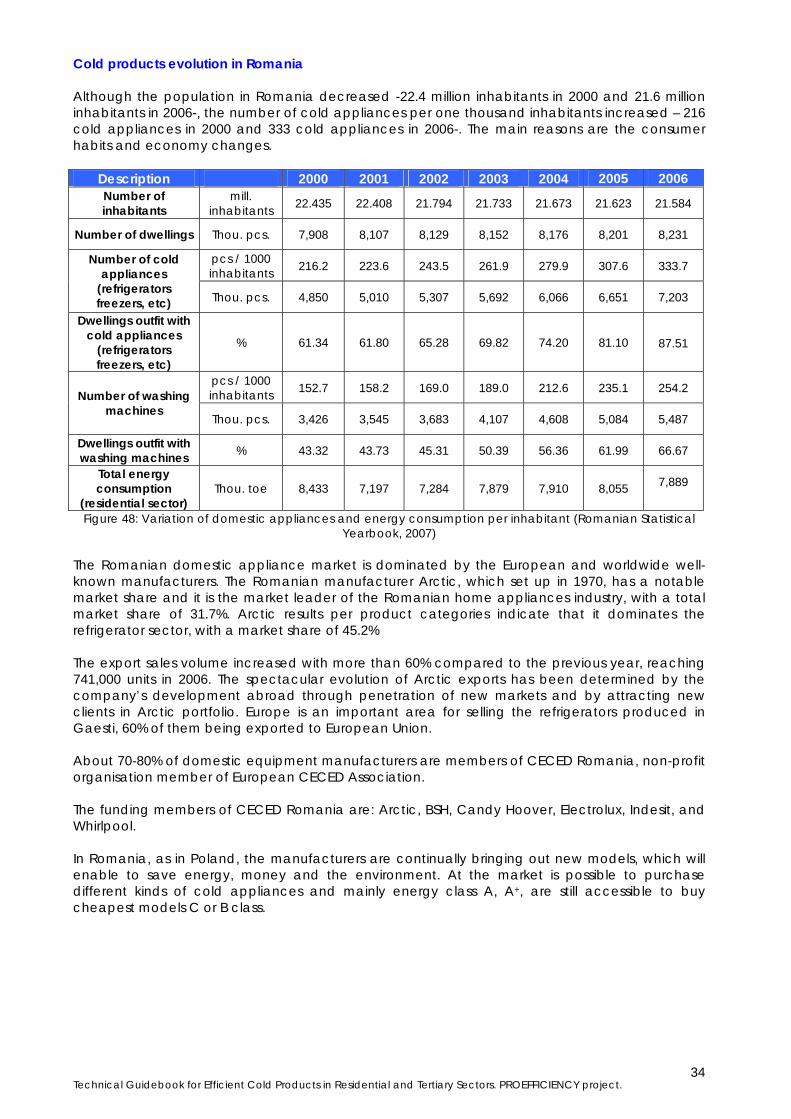
Cold products evolution in Romania Although the population in Romania decreased -22.4 million inhabitants in 2000 and 21.6 million inhabitants in 2006-, the number of cold appliances per one thousand inhabitants increased – 216 cold appliances in 2000 and 333 cold appliances in 2006-. The main reasons are the consumer habits and economy changes.
Description 2000 2001 2002 2003 2004 2005 2006 Number of inhabitants
mill. inhabitants 22.435 22.408 21.794 21.733 21.673 21.623 21.584
Number of dwellings Thou. pcs. 7,908 8,107 8,129 8,152 8,176 8,201 8,231
pcs / 1000 inhabitants 216.2 223.6 243.5 261.9 279.9 307.6 333.7 Number of cold
appliances (refrigerators freezers, etc) Thou. pcs. 4,850 5,010 5,307 5,692 6,066 6,651 7,203
Dwellings outfit with cold appliances
(refrigerators freezers, etc)
% 61.34 61.80 65.28 69.82 74.20 81.10
87.51
pcs / 1000 inhabitants 152.7 158.2 169.0 189.0 212.6 235.1 254.2 Number of washing
machines Thou. pcs. 3,426 3,545 3,683 4,107 4,608 5,084 5,487
Dwellings outfit with washing machines % 43.32 43.73 45.31 50.39 56.36 61.99 66.67
Total energy consumption
(residential sector) Thou. toe 8,433 7,197 7,284 7,879 7,910 8,055 7,889
Figure 48: Variation of domestic appliances and energy consumption per inhabitant (Romanian Statistical Yearbook, 2007)
The Romanian domestic appliance market is dominated by the European and worldwide well-known manufacturers. The Romanian manufacturer Arctic, which set up in 1970, has a notable market share and it is the market leader of the Romanian home appliances industry, with a total market share of 31.7%. Arctic results per product categories indicate that it dominates the refrigerator sector, with a market share of 45.2% The export sales volume increased with more than 60% compared to the previous year, reaching 741,000 units in 2006. The spectacular evolution of Arctic exports has been determined by the company’s development abroad through penetration of new markets and by attracting new clients in Arctic portfolio. Europe is an important area for selling the refrigerators produced in Gaesti, 60% of them being exported to European Union. About 70-80% of domestic equipment manufacturers are members of CECED Romania, non-profit organisation member of European CECED Association. The funding members of CECED Romania are: Arctic, BSH, Candy Hoover, Electrolux, Indesit, and Whirlpool. In Romania, as in Poland, the manufacturers are continually bringing out new models, which will enable to save energy, money and the environment. At the market is possible to purchase different kinds of cold appliances and mainly energy class A, A+, are still accessible to buy cheapest models C or B class.
Technical Guidebook for Efficient Cold Products in Residential and Tertiary Sectors. PROEFFICIENCY project.
35
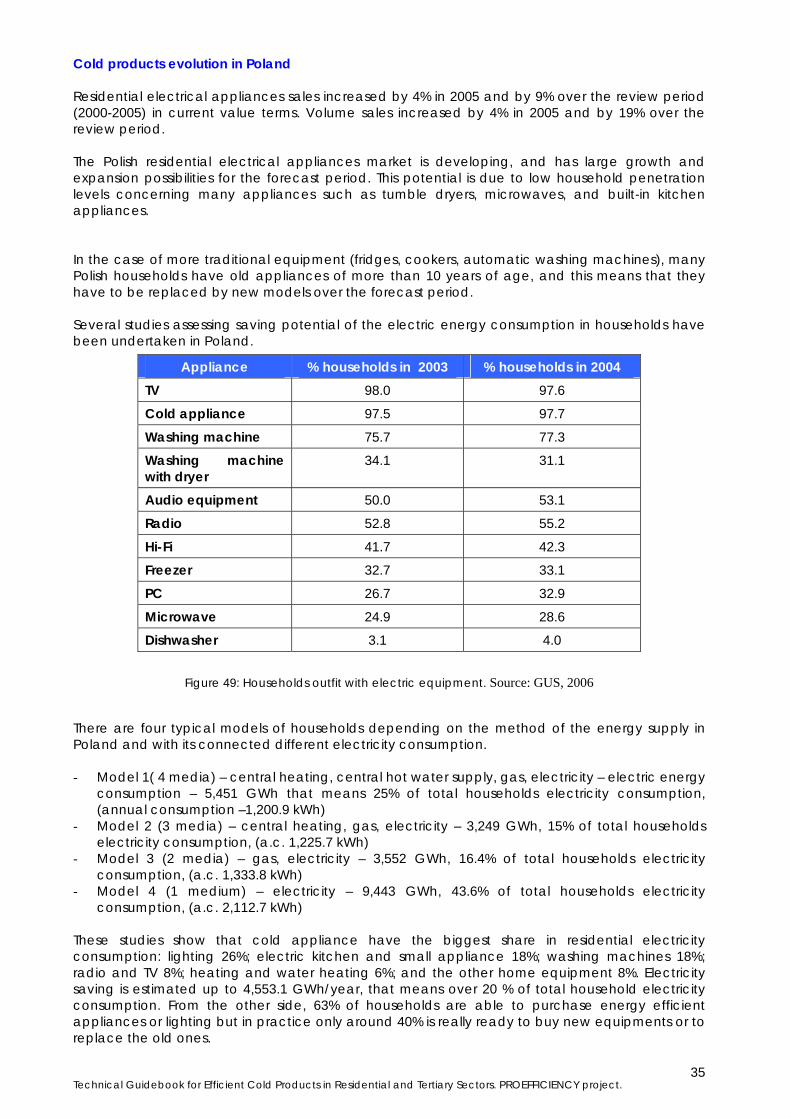
Cold products evolution in Poland Residential electrical appliances sales increased by 4% in 2005 and by 9% over the review period (2000-2005) in current value terms. Volume sales increased by 4% in 2005 and by 19% over the review period. The Polish residential electrical appliances market is developing, and has large growth and expansion possibilities for the forecast period. This potential is due to low household penetration levels concerning many appliances such as tumble dryers, microwaves, and built-in kitchen appliances. In the case of more traditional equipment (fridges, cookers, automatic washing machines), many Polish households have old appliances of more than 10 years of age, and this means that they have to be replaced by new models over the forecast period. Several studies assessing saving potential of the electric energy consumption in households have been undertaken in Poland.
Figure 49: Households outfit with electric equipment. Source: GUS, 2006
There are four typical models of households depending on the method of the energy supply in Poland and with its connected different electricity consumption. - Model 1( 4 media) – central heating, central hot water supply, gas, electricity – electric energy
consumption – 5,451 GWh that means 25% of total households electricity consumption, (annual consumption –1,200.9 kWh)
- Model 2 (3 media) – central heating, gas, electricity – 3,249 GWh, 15% of total households electricity consumption, (a.c. 1,225.7 kWh)
- Model 3 (2 media) – gas, electricity – 3,552 GWh, 16.4% of total households electricity consumption, (a.c. 1,333.8 kWh)
- Model 4 (1 medium) – electricity – 9,443 GWh, 43.6% of total households electricity consumption, (a.c. 2,112.7 kWh)
These studies show that cold appliance have the biggest share in residential electricity consumption: lighting 26%; electric kitchen and small appliance 18%; washing machines 18%; radio and TV 8%; heating and water heating 6%; and the other home equipment 8%. Electricity saving is estimated up to 4,553.1 GWh/year, that means over 20 % of total household electricity consumption. From the other side, 63% of households are able to purchase energy efficient appliances or lighting but in practice only around 40% is really ready to buy new equipments or to replace the old ones.
Appliance % households in 2003 % households in 2004 TV 98.0 97.6
Cold appliance 97.5 97.7
Washing machine 75.7 77.3
Washing machine with dryer
34.1 31.1
Audio equipment 50.0 53.1
Radio 52.8 55.2
Hi-Fi 41.7 42.3
Freezer 32.7 33.1
PC 26.7 32.9
Microwave 24.9 28.6
Dishwasher 3.1 4.0
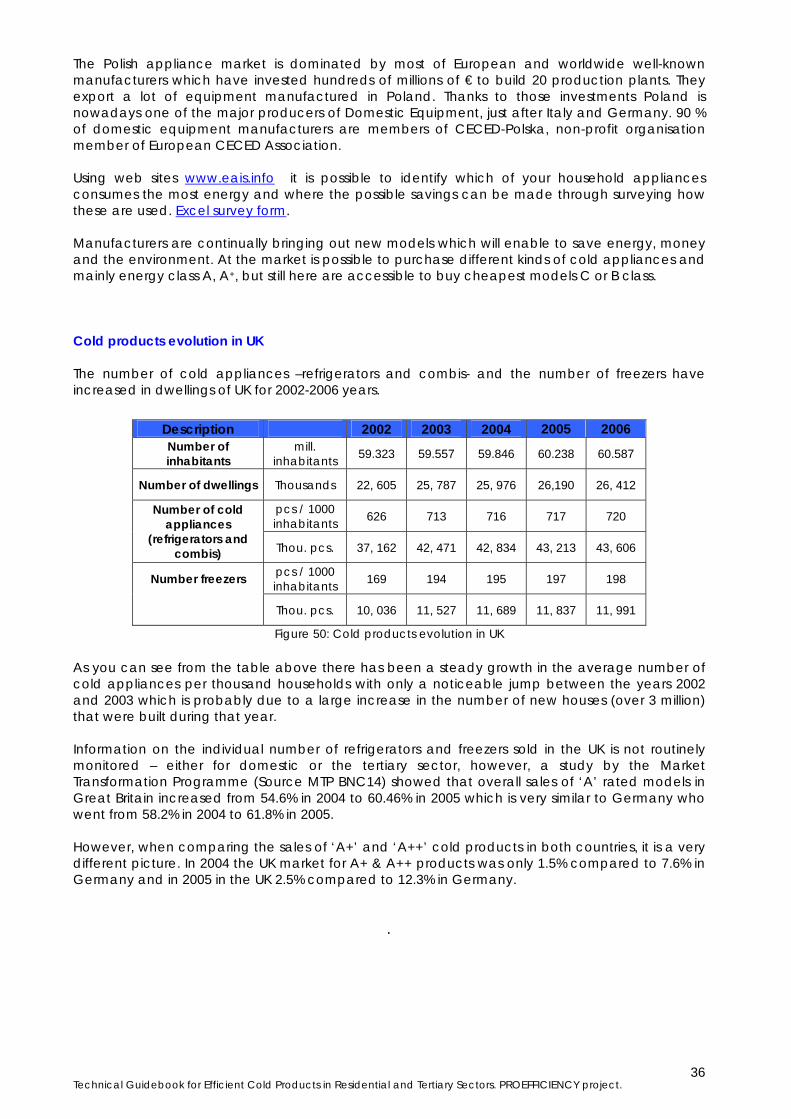
Technical Guidebook for Efficient Cold Products in Residential and Tertiary Sectors. PROEFFICIENCY project.
36
The Polish appliance market is dominated by most of European and worldwide well-known manufacturers which have invested hundreds of millions of € to build 20 production plants. They export a lot of equipment manufactured in Poland. Thanks to those investments Poland is nowadays one of the major producers of Domestic Equipment, just after Italy and Germany. 90 % of domestic equipment manufacturers are members of CECED-Polska, non-profit organisation member of European CECED Association. Using web sites www.eais.info it is possible to identify which of your household appliances consumes the most energy and where the possible savings can be made through surveying how these are used. Excel survey form. Manufacturers are continually bringing out new models which will enable to save energy, money and the environment. At the market is possible to purchase different kinds of cold appliances and mainly energy class A, A+, but still here are accessible to buy cheapest models C or B class. Cold products evolution in UK The number of cold appliances –refrigerators and combis- and the number of freezers have increased in dwellings of UK for 2002-2006 years.
Figure 50: Cold products evolution in UK As you can see from the table above there has been a steady growth in the average number of cold appliances per thousand households with only a noticeable jump between the years 2002 and 2003 which is probably due to a large increase in the number of new houses (over 3 million) that were built during that year. Information on the individual number of refrigerators and freezers sold in the UK is not routinely monitored – either for domestic or the tertiary sector, however, a study by the Market Transformation Programme (Source MTP BNC14) showed that overall sales of ‘A’ rated models in Great Britain increased from 54.6% in 2004 to 60.46% in 2005 which is very similar to Germany who went from 58.2% in 2004 to 61.8% in 2005. However, when comparing the sales of ‘A+’ and ‘A++’ cold products in both countries, it is a very different picture. In 2004 the UK market for A+ & A++ products was only 1.5% compared to 7.6% in Germany and in 2005 in the UK 2.5% compared to 12.3% in Germany.
Description 2002 2003 2004 2005 2006 Number of inhabitants
mill. inhabitants 59.323 59.557 59.846 60.238 60.587
Number of dwellings Thousands 22, 605 25, 787 25, 976 26,190 26, 412
pcs / 1000 inhabitants 626 713 716 717 720 Number of cold
appliances (refrigerators and
combis) Thou. pcs. 37, 162 42, 471 42, 834 43, 213 43, 606
Number freezers pcs / 1000 inhabitants 169 194 195 197 198
Thou. pcs. 10, 036 11, 527 11, 689 11, 837 11, 991
Technical Guidebook for Efficient Cold Products in Residential and Tertiary Sectors. PROEFFICIENCY project.
37
4.3 THE “MOST EFFICIENT” COLD PRODUCTS The cold products consume energy during 24 hours per day and the energy label is the information tool in which the appliance total electricity consumption per year is showed: the less efficient appliances with “G” and the most efficient ones with “A” and last years A+ and A++
energy label. To consider for the purchase the A, A+ and A++ refrigerators, combis and freezers is always advised. Although the purchase cost of them is higher than the other C or B appliances, the electricity and money saving during the 14 years compensate it and moreover saves money. 1. The penetration of A+ and A++ cold products in Spain: the most efficient cold products are sold
slowly because the cost is much higher. In 2005 44.1% of the sales of refrigerators were A label but only 2% were A+ and no data of A++. The freezers of A label were 12%.
2. The penetration of A+ and A++ cold products in Austria: in the last 5 years, sales of A and A+ models increased. In 2005 58.9% of the sales of refrigerators were A label, 9.9% were A+ and no data of A++.
3. The penetration of A+ and A++ cold products in Germany: sales in A rated cold products increased from 52% in 2002 to 63% in 2005, but the most important evolution were the sales of A+ cold products, increasing from 1.5% in 2002 to 15% in 2005.
4. The penetration of A+ and A++ cold products in Romania: the price level is an important determinant factor for choosing the cold appliance type. In the last period, the customers appreciate as an important issue, the Energy Efficiency class. That fact can be proved through the selling evolution of the A class cold products (12% in 2005 in comparison with 5% in 2004).
5. The penetration of A+ and A++ cold products in Poland: cold products with A+ and A++ energy labels exist since 2005. In 2004 A+ refrigerators were sold in 2.2% and freezers A+ also in 2.2%.
6. The penetration of A+ and A++ cold products in UK: in the market remains low, representing only 3% of sales in the six months to December 2005. Although A++ models are found in continental Europe, they are very seldom available from UK retailers.
Information Source: Electricity consumption and efficiency trends in the enlarged European Union. 2007. GfK. The main manufacturers of refrigerators and freezers in EU are BSH Group of Germany, Electrolux-AB Group of Sweden, Fagor of Spain, Hoover-Candy and Indesit Groups of Italy, Ardo of Poland and Arctic of Romania. The most efficient cold products utilised in the six EU countries belong to BSH Group and Liebherr of Germany, Electrolux – AB Group of Sweden, Fagor of Spain, Hoover Candy Group, Indesit Group of Italy, Arctic of Romania and Ardo of Poland. Others as Whirpool, General Electric and Amica of USA Manufacturers of cooling appliances available in Spain The manufacturers of appliances, and in particular refrigerators, freezers, and combined appliances, they are: - BSH Group: Balay, Bosch, Siemens, Lynx, Gaggenau, Neff. - Liebherr – Frigicoll - Fagor Appliances: Fagor, Edesa, Aspes, De Dietrich - Electrolux Group: Electrolux, Zanussi-Electrolux, AEG-Electrolux and Corberó. - Whirpool Group: Whirpool, Ignis y Bauknecht - Hoover - Candy Group: Candy, Hoover and Otsein - Teka Group: Teka, Küppersbusch, Thor - Indesit Group: Indesit, NewPol, Ariston - Miele - Smeg - Beko: Beko, Ardem, Bru - Daewoo: Daewoo, Ecron, White Westinghouse
Technical Guidebook for Efficient Cold Products in Residential and Tertiary Sectors. PROEFFICIENCY project.
38
Some of the most efficient cold products retailed in Spain include: - Liebherr KTPES 1740 and KTPES 1750 refrigerator (both A++ rated). - Bosch GSN40A30 and Siemens GS40NA30 up-right freezers (both A++ rated). - Electrolux ERB3226 combi (also A++ rated). Manufacturers of domestic cool appliances available in Austria AEG, Amica, Bauknecht, Blomberg, Bomann, Bosch, Candy, Daewoo-Electronics, Dometic, Electrolux, Elektra Bregenz, Exquisit, Fagor, Gorenje, Hoover, Juno, Küppersbusch, Liebherr, Miele, Neff, Oranier, Samsung, Severin, Siemens, SMEG, Waeco, Whirlpool, Zanussi Manufacturers of mini-bars available in Austria are: AEG, Amica, Bauknecht, Blomberg, Bomann, Bosch, Candy, Dometic, Electrolux, Elektra Bregenz, Exquisit, Fagor, Gorenje, Hoover, Juno, Küppersbusch, Liebherr, Miele, Neff, Oranier, Siemens, Whirlpool and Zanussi. Some efficient cooling appliances are: - Liebherr CTNes 2123 Premium NoFrost, CBPes 3656 Premium BioFresh, CBNes 3856. - Whirpool fRAA 2 VAF 20/0. - Exquisit KGC 230/60. - Electrolux ERZ 36700. - Gorenje RK 6285 OR, RK 65365, RK 36693. - Siemens KA 58NA40, KG 36 VX 50. - Bauknecht KGA 355 Optima. - Bosch KGN 34 X40. Manufacturers of domestic cold products available in Germany The manufacturers of efficient cold products A (A, A+, A++)-Devices for domestic use are Liebherr, Miele, Bosch Siemens, Bauknecht, Quelle, AEG Electrolux, Ariston, Zanker, Imperial, Juno, Gorenje, Küppersbusch, NET, Smeg, Gaggenau, Seppelfricke, EBD, Amica, Haier, Foron, LG Electronics. Manufactuers for minabars from Germany are Bartech, Dometic, Messerschmitt and Sibra; and Minibar, Fors and Hinti from Switzerland. Source: www.spargeraete.de und www.bfe.admin.ch search: minibar. Manufacturers of domestic cold products available in Poland The members of CECED Polska are: Amica, Beko, BSH, Candy, Ciarko, Electrolux, Fagor Mastercook, Gorenje, Indesit Company, Miele, Philips, Groupe SEB and Whirlpool. Some of the most efficient cold products retailed in Poland are: - Whirlpool – ARC 6708 IX, ARC 6678 IX, ARC 5754/1 IX – EE class – A+, BSH - KGF39P90,
KGN36A60 – A+ - Amica ACZ320iXM, ACZ310iXMA+…………….. - Electrolux - ERN22500 - Gorenje RK 4296 W - Indesit IN CB 310 AI D Manufacturers of domestic cold products available in Romania Arctic, Electrolux, Whirpool, Indesit, Zanussi, Westewood, LG, Hansa, Beko, Ariston, Bisch, Samsung and Siemens. Some efficient cooling appliances (A+ class) are: - Single Door refrigerator: LG GC-051SS, Gorenje RB 6288 W - Double Door Refrigerator: Arctic D276+, Ardo DP40SH, Beko RDP 6901HCA, Bosch KDV 29V00,
Indesit TAAN 3 , Zanussi ZRD 27 JD; Snaige FR275-1501AA - Combi: Ardo CO2210SHT, Arctic K386+, Beko BKE386WD+, Bosch KGS39X01, Candy CSCN
6610, Franke FCB 3901, Gorenje EUROCOMBI RK 60358, Hotpoint Ariston MBL 2021, Indesit BAAN 13, Siemens KG 39 VX 50, Whirlpool ARC 5774
- Chest freezer: Candy CCFE 205, Arctic O23+, Gorenje FH 9238 W - Upright freezer: Ardo FR20SA
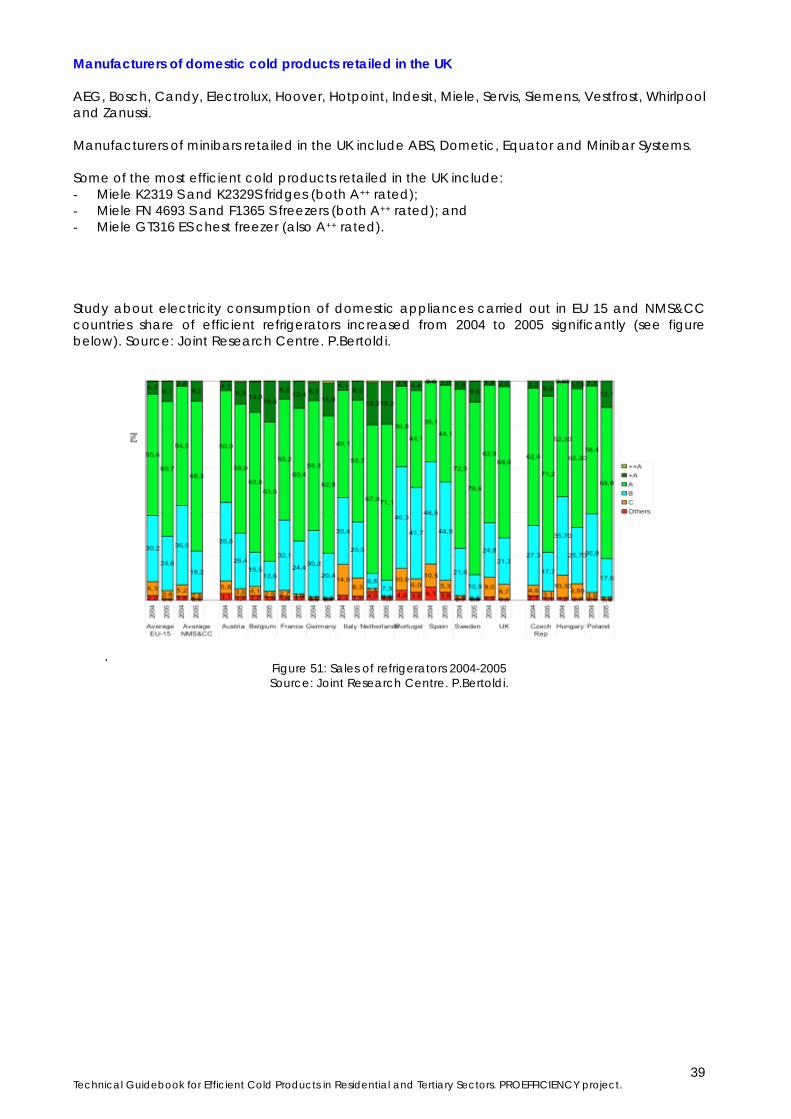
Technical Guidebook for Efficient Cold Products in Residential and Tertiary Sectors. PROEFFICIENCY project.
39
Manufacturers of domestic cold products retailed in the UK AEG, Bosch, Candy, Electrolux, Hoover, Hotpoint, Indesit, Miele, Servis, Siemens, Vestfrost, Whirlpool and Zanussi. Manufacturers of minibars retailed in the UK include ABS, Dometic, Equator and Minibar Systems. Some of the most efficient cold products retailed in the UK include: - Miele K2319 S and K2329S fridges (both A++ rated); - Miele FN 4693 S and F1365 S freezers (both A++ rated); and - Miele GT316 ES chest freezer (also A++ rated). Study about electricity consumption of domestic appliances carried out in EU 15 and NMS&CC countries share of efficient refrigerators increased from 2004 to 2005 significantly (see figure below). Source: Joint Research Centre. P.Bertoldi.
Figure 51: Sales of refrigerators 2004-2005 Source: Joint Research Centre. P.Bertoldi.
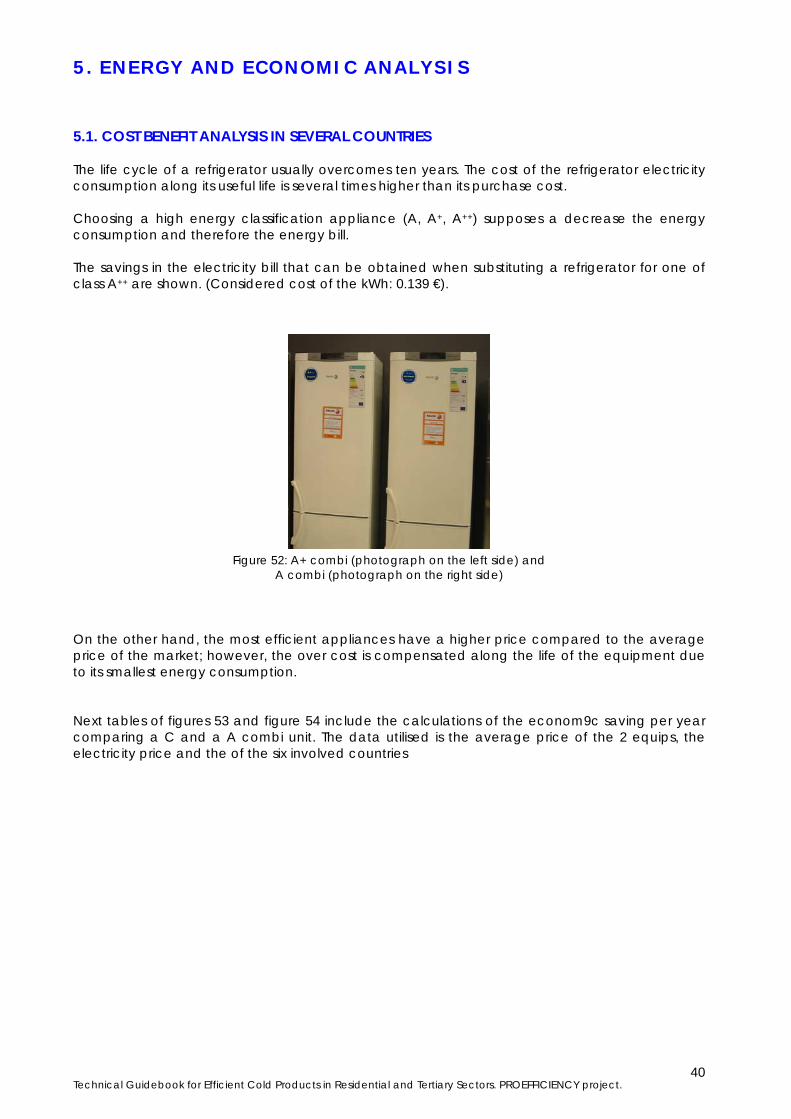
Technical Guidebook for Efficient Cold Products in Residential and Tertiary Sectors. PROEFFICIENCY project.
40
5. ENERGY AND ECONOMIC ANALYSIS 5.1. COST BENEFIT ANALYSIS IN SEVERAL COUNTRIES The life cycle of a refrigerator usually overcomes ten years. The cost of the refrigerator electricity consumption along its useful life is several times higher than its purchase cost. Choosing a high energy classification appliance (A, A+, A++) supposes a decrease the energy consumption and therefore the energy bill. The savings in the electricity bill that can be obtained when substituting a refrigerator for one of class A++ are shown. (Considered cost of the kWh: 0.139 €).
Figure 52: A+ combi (photograph on the left side) and A combi (photograph on the right side)
On the other hand, the most efficient appliances have a higher price compared to the average price of the market; however, the over cost is compensated along the life of the equipment due to its smallest energy consumption. Next tables of figures 53 and figure 54 include the calculations of the econom9c saving per year comparing a C and a A combi unit. The data utilised is the average price of the 2 equips, the electricity price and the of the six involved countries
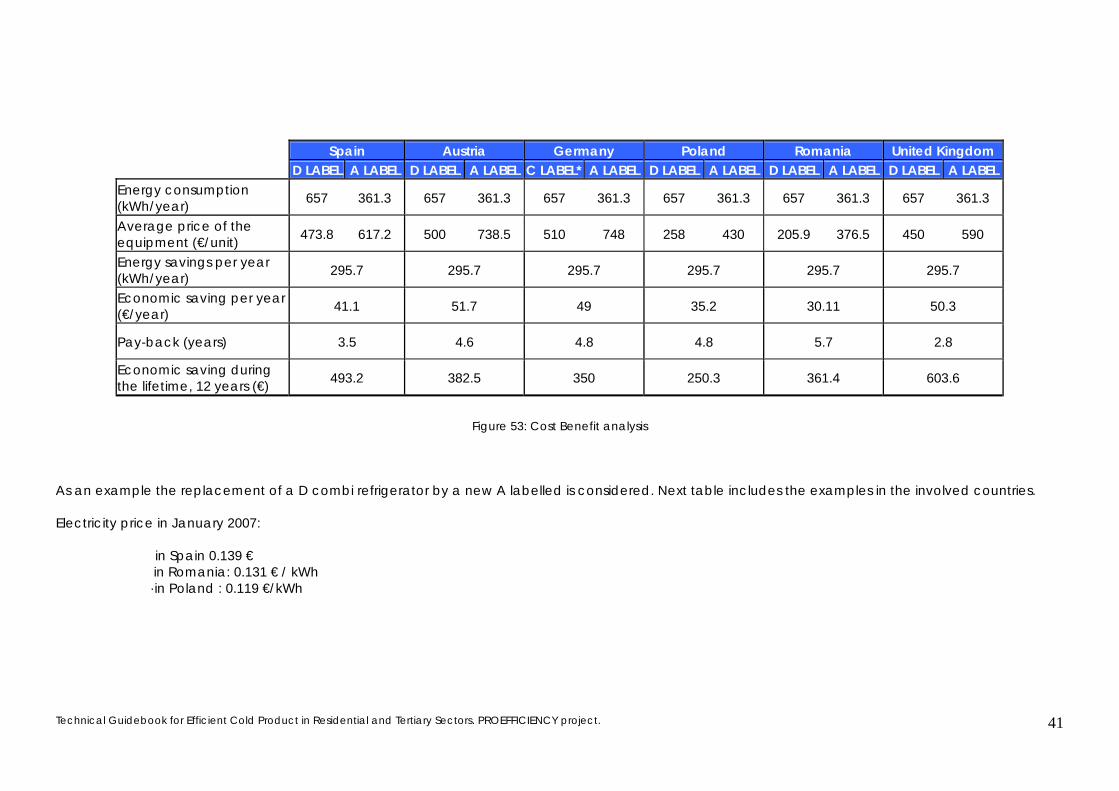
Technical Guidebook for Efficient Cold Product in Residential and Tertiary Sectors. PROEFFICIENCY project.
41
Figure 53: Cost Benefit analysis
As an example the replacement of a D combi refrigerator by a new A labelled is considered. Next table includes the examples in the involved countries. Electricity price in January 2007:
in Spain 0.139 € in Romania: 0.131 € / kWh ·in Poland : 0.119 €/kWh
Spain Austria Germany Poland Romania United Kingdom D LABEL A LABEL D LABEL A LABEL C LABEL* A LABEL D LABEL A LABEL D LABEL A LABEL D LABEL A LABEL
Energy consumption (kWh/year) 657 361.3 657 361.3 657 361.3 657 361.3 657 361.3 657 361.3
Average price of the equipment (€/unit) 473.8 617.2 500 738.5 510 748 258 430 205.9 376.5 450 590
Energy savings per year (kWh/year) 295.7 295.7 295.7 295.7 295.7 295.7
Economic saving per year (€/year) 41.1 51.7 49 35.2 30.11 50.3
Pay-back (years) 3.5 4.6 4.8 4.8 5.7 2.8
Economic saving during the lifetime, 12 years (€) 493.2 382.5 350 250.3 361.4 603.6
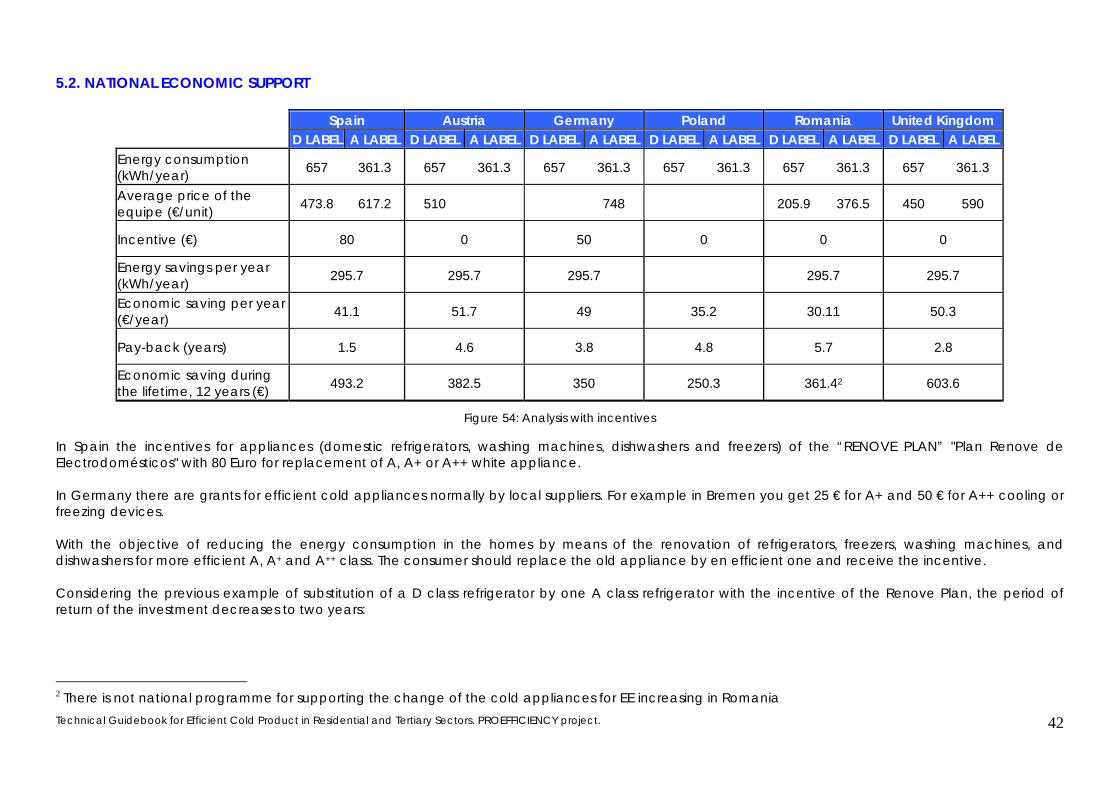
Technical Guidebook for Efficient Cold Product in Residential and Tertiary Sectors. PROEFFICIENCY project.
42
5.2. NATIONAL ECONOMIC SUPPORT
Figure 54: Analysis with incentives
In Spain the incentives for appliances (domestic refrigerators, washing machines, dishwashers and freezers) of the “RENOVE PLAN” "Plan Renove de Electrodomésticos" with 80 Euro for replacement of A, A+ or A++ white appliance. In Germany there are grants for efficient cold appliances normally by local suppliers. For example in Bremen you get 25 € for A+ and 50 € for A++ cooling or freezing devices. With the objective of reducing the energy consumption in the homes by means of the renovation of refrigerators, freezers, washing machines, and dishwashers for more efficient A, A+ and A++ class. The consumer should replace the old appliance by en efficient one and receive the incentive. Considering the previous example of substitution of a D class refrigerator by one A class refrigerator with the incentive of the Renove Plan, the period of return of the investment decreases to two years:
2 There is not national programme for supporting the change of the cold appliances for EE increasing in Romania
Spain Austria Germany Poland Romania United Kingdom D LABEL A LABEL D LABEL A LABEL D LABEL A LABEL D LABEL A LABEL D LABEL A LABEL D LABEL A LABEL
Energy consumption (kWh/year) 657 361.3 657 361.3 657 361.3 657 361.3 657 361.3 657 361.3
Average price of the equipe (€/unit) 473.8 617.2 510 748 205.9 376.5 450 590
Incentive (€) 80 0 50 0 0 0
Energy savings per year (kWh/year) 295.7 295.7 295.7 295.7 295.7
Economic saving per year (€/year) 41.1 51.7 49 35.2 30.11 50.3
Pay-back (years) 1.5 4.6 3.8 4.8 5.7 2.8
Economic saving during the lifetime, 12 years (€) 493.2 382.5 350 250.3 361.42 603.6
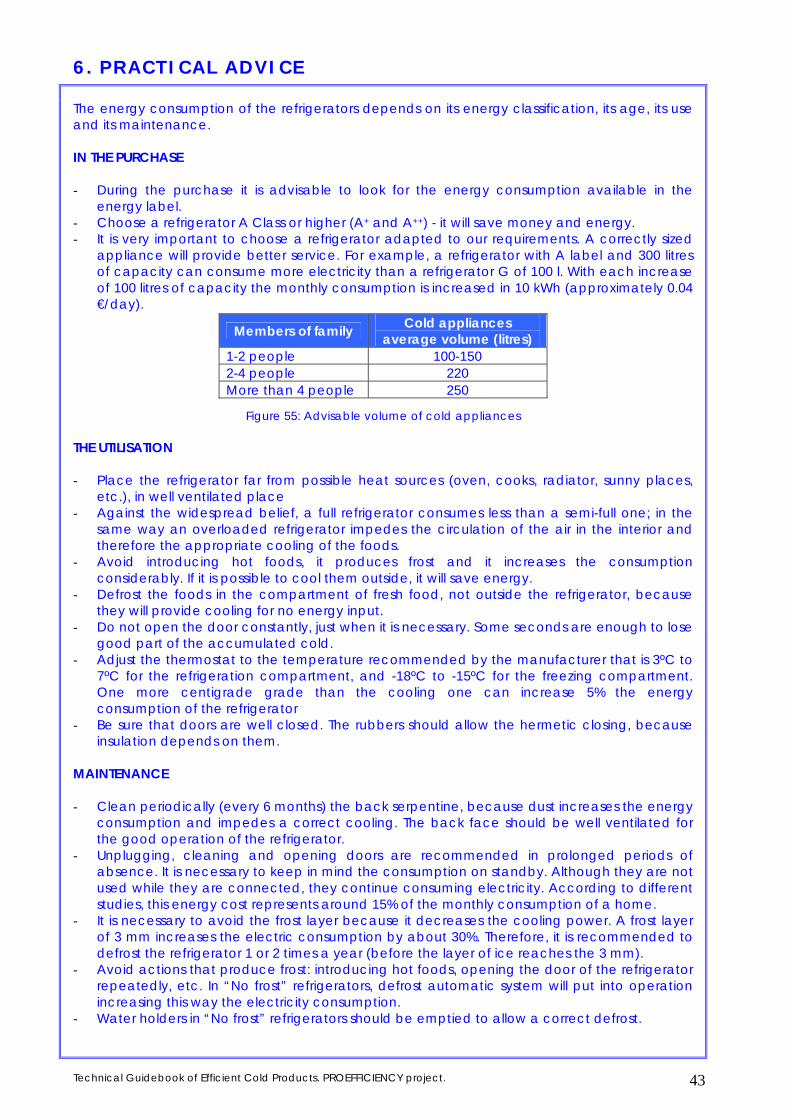
Technical Guidebook of Efficient Cold Products. PROEFFICIENCY project. 43
6. PRACTICAL ADVICE
The energy consumption of the refrigerators depends on its energy classification, its age, its use and its maintenance. IN THE PURCHASE - During the purchase it is advisable to look for the energy consumption available in the
energy label. - Choose a refrigerator A Class or higher (A+ and A++) - it will save money and energy. - It is very important to choose a refrigerator adapted to our requirements. A correctly sized
appliance will provide better service. For example, a refrigerator with A label and 300 litres of capacity can consume more electricity than a refrigerator G of 100 l. With each increase of 100 litres of capacity the monthly consumption is increased in 10 kWh (approximately 0.04 €/day).
Figure 55: Advisable volume of cold appliances THE UTILISATION - Place the refrigerator far from possible heat sources (oven, cooks, radiator, sunny places,
etc.), in well ventilated place - Against the widespread belief, a full refrigerator consumes less than a semi-full one; in the
same way an overloaded refrigerator impedes the circulation of the air in the interior and therefore the appropriate cooling of the foods.
- Avoid introducing hot foods, it produces frost and it increases the consumption considerably. If it is possible to cool them outside, it will save energy.
- Defrost the foods in the compartment of fresh food, not outside the refrigerator, because they will provide cooling for no energy input.
- Do not open the door constantly, just when it is necessary. Some seconds are enough to lose good part of the accumulated cold.
- Adjust the thermostat to the temperature recommended by the manufacturer that is 3ºC to 7ºC for the refrigeration compartment, and -18ºC to -15ºC for the freezing compartment. One more centigrade grade than the cooling one can increase 5% the energy consumption of the refrigerator
- Be sure that doors are well closed. The rubbers should allow the hermetic closing, because insulation depends on them.
MAINTENANCE - Clean periodically (every 6 months) the back serpentine, because dust increases the energy
consumption and impedes a correct cooling. The back face should be well ventilated for the good operation of the refrigerator.
- Unplugging, cleaning and opening doors are recommended in prolonged periods of absence. It is necessary to keep in mind the consumption on standby. Although they are not used while they are connected, they continue consuming electricity. According to different studies, this energy cost represents around 15% of the monthly consumption of a home.
- It is necessary to avoid the frost layer because it decreases the cooling power. A frost layer of 3 mm increases the electric consumption by about 30%. Therefore, it is recommended to defrost the refrigerator 1 or 2 times a year (before the layer of ice reaches the 3 mm).
- Avoid actions that produce frost: introducing hot foods, opening the door of the refrigerator repeatedly, etc. In “No frost” refrigerators, defrost automatic system will put into operation increasing this way the electricity consumption.
- Water holders in “No frost” refrigerators should be emptied to allow a correct defrost.
Members of family Cold appliances average volume (litres)
1-2 people 100-150 2-4 people 220 More than 4 people 250
Technical Guidebook for Efficient Cold Product in Residential and Tertiary Sectors. PROEFFICIENCY project.
44
DISPOSAL - If an appliance is going to be replaced for another one, it should be placed in a Cleaning
Point or in a Centre of Collection and Recycling, where the recycling treatment is managed. - The Directive 2002/96/CE of the European Parliament includes to the refrigerators inside "big
appliances" group, and it assigns them an objective of recovery of 80% in weight, with a minimum of 75% recycled. Likewise, this Directive fixed as a global objective 4 kg for person and year of REEA (Residuals of Electric and Electronic Appliances).
- In the purchase of a new refrigerator, the price includes a small part to cover final disposal costs.
FOOD COOLING TECHNOLOGY Advice in respect of food cooling technology is: - Cold products shall be located in a cold, shaded and ventilated place. - Chest freezers doors shall be closed in shops or shopping malls. - Evaporators with large surfaces (for an easier cleaning) - Efficient lighting of displays. The present system of energy labels helps consumers to rank very few appliances, but is encouraging manufacturers to produce every bigger pieces of equipment. This is because the energy labels are based on the level of energy service per unit volume (or similar) and larger machines are, by definition with this scheme, more energy efficient. Energy consumption per household continues to grow across most of Europe, despite the lower number of people per household. Therefore, just when there should be reduced consumption per household as a result of smaller equipment, the trend is in the reverse direction, aided and abetted by the design of a policy tool, the energy label. The net effect is a growth in energy demand. The slow introduction of mandatory minimum efficiency standards also permits this growth in demand. In some cases, this higher level of appliance ownership does represent an increase in the standard of living. However, the are a growing number of examples where consumers are being encouraged, by manufacturers, to purchase and use unnecessary appliances, or ones that use profligate amounts of energy. To constrain this growth, policy needs to be more actively involved with the decisions being made by manufacturers and customers. Three options have been discussed: No energy-consuming product is sold without a label confirming its level of demand; manufacturers cannot produce a new line without demonstrating its environmental benefits and gaining permission from the government. Consumers have a personal carbon allowance, which encourages personal responsibility. There are advantages and disadvantages with all three systems. The ideal combination, in preparation for greater personal responsibility by consumers, would be to start with aspects of all three: manufacturers will produce new products and range that are confirmed by government as having environmental benefits; each product will carry an energy label before it is placed on the market, and policies to encourage consumer energy literacy will all proceed together. Then, policy would prevent today’s householders unwittingly causing unnecessary carbon dioxide emissions to the detriment of the environment.
Technical Guidebook for Efficient Cold Product in Residential and Tertiary Sectors. PROEFFICIENCY project.
45
7. INFORMATION SOURCES Figure 0: “Cool Appliances 2004”, page 3. Cool Appliances 2004. International Energy Agency,
IEA.
Figure 1: “Energy Labelling”. Frificoll- Liebherr Spain.
Figures 3, 4, 5, 6 and 7: Manufacturers. www.arctic.ro
Figures 18 and 19: “Breakdown of electricity consumption of residential end-use equipment in EU-
15 in 2004” and “Breakdown of electricity consumption of residential end-use equipment in
NMS12+Hr in 2004”. Cool Appliances: Policies Strategies for Energy Efficiency Homes International
Energy Agency, IEA. The Historic and Potential Impact of Residential Electrical equipment Energy
Efficiency Policies in the OCDE. P Waide, B. LRebot and P. Harrington.
Figure 20: “Average EU-15” and Figure 21: “Average NMS & CC”. Electricity consumption and
efficiency Trends in the Enlarged EU. 2007. P. Bertoldi and B. Atanasiu.
Figure 22: “Energy consumption in Spain”. Spanish Savings and Efficiency Energy Strategy, E4 2004-
2012.
Figure 23:”Energy consumption in tertiary sector in Spain”. Statistics of Ministry of Industry,
Commerce and Tourism.
Figure 24: Energy administration in hotels. Elaboration by Escan with data of studies of National
Institute of Statistics and Guide of Energy Efficiency in Hotels, 2007.
Figure 25: Energy consumption distribution. Institute of Energy Saving and Diversification, IDAE.
Figure 26: Energy situation of Upper Austria.
Figure 27: Annual energy consumption.
Figure 28: Energy consumption in Austria.
Figure 29: Refrigerators and freezers in residential sector. EDDAL Okko Institute.
Figure 30: Breakdown of cold appliances.
Figure 31: Structure of Energy Consumption. Romania. National Strategy for Energy Efficiency
approved by GD no. 163/2004.
Figure 32: Total energy consumption. Romania. National Institute for Statistics, 2006.
Figure 33: Total Energy Consumption in residential and tertiary sectors. National Institute for
Statistics, 2003.
Figure 34: Housing resource variation in Poland and energy consumption change. KAPE source
“Country report”.
Figure 35: Structure of energy usage at household. KAPE Source , 2006
Figure 36: Electricity consumption in Polish residential sector. KAPE. Source: GUS, EUROSTAT, 2006
Figure 37: Energy consumption in residential sector. BREHOMES, taken from the Domestic Energy
Fact file, Building Research Establishment.
Figure 38: Energy consumption in tertiary sector. Building Research Establishment.
Figure 39: Energy use in the UK. Building Research Establishment.
Technical Guidebook for Efficient Cold Product in Residential and Tertiary Sectors. PROEFFICIENCY project.
46
Figure 40: Electricity used by appliance type. Market Transformation Programme, Department for
Environment, Food and Rural Affairs, 2004 data.
Figure 41: Energy consumption vs energy efficiency for models sold in UK market. EDDAL
Conferences June 2006. Environmental Change Institute, University of Oxford.
Figure 42: “Electricity consumption in residential and tertiary sectors”. Romania: National Institute
for Statistics.
Figure 43: “Cold products evolution”. Elaboration by all partners. Romanian Statistical Yearbook,
2007.
Figure 44: “Sales of refrigerators and freezers” Source: Elaboration by all partners -manufacturers’
data.
Figure 45a: “Utilisation of Appliances in Residential Sector “. Source: INE and ANFEL
Figure 45b: “Appliances in Residential Sector”. Source: ANFEL.
Figure 46a: Spreading of refrigerators in Austrian households. Eurostat Cross-Database 2004.
Figure 46 b: Utilisation of appliances in residential sector. Eurostat statistics. Manufacturers’ data.
Figure 47a: Utilisation of Appliances in Residential Sector. Sources: Destatis staistisches Bundesamt,
www.destatis.de, www.wikipedia.de, www.zvei.de
Figure 47b: Sales of cold Appliances. Elaboration by Gertec with data of Fachverband Energie-
Marketing und -Anwendung (HEA) e.V.
Figure 48: Variation of domestic appliances and energy consumption per inhabitant. Romania
Figure 49: Households outfit with electric equipment. GUS statistics 2006.
Figure 50: Cold products evolution in UK. Elaboration by SWEA.
Figure 51: Sales of refrigerators 2004-2005. Source: Electricity consumption and efficiency trends in
the enlarged European Union. 2007. P. Bertoldi and B. Atanasiu. GfK.
Figure 52: A+ combi (photograph on the left side) and A combi (photograph on the right side).
Escan.
Figure 53: Cost Benefit analysis. Elaboration by all partners.
Figure 54: Analysis with incentives. Elaboration by all partners.
Figure 55: Advisable volume of cold appliances. Manufacturers.
Technical Guidebook for Efficient Cold Product in Residential and Tertiary Sectors. PROEFFICIENCY project.
47
This guidebook is produced as part of PROEFFICIENCY Project with the technical
elaboration of all partners and the final recompilation and structure of the
Coordinator.
Proefficiency project is co-funded by Intelligent Energy Europe
Programme of EACI Agency. The contents of this Technical
Guidebook have been supported by European Commission. The sole responsibility of the content lies with the
authors. The EC is not responsible for any use that may be made of the information contained therein.
The Project coordinator:
ESCAN, S.A.,
Mrs. Margarita Puente, [email protected]
www.escansa.com/proefficiency
Project partners:
Gertec GMBH, Germany
OOEnergiespaverband, Austria
ISPE, Istitutul de Studii si Procectari Energetice, Romania
KAPE, Krajowa Agencja Poszanowania Energii, S.A., Poland
SWEA, Severn Wye Energy Agency, United Kingdom