Embed Size (px)
Citation preview
D3.js Tutorial (Hands on Session)
Ayush Kumar
D3: Data-Driven Documents
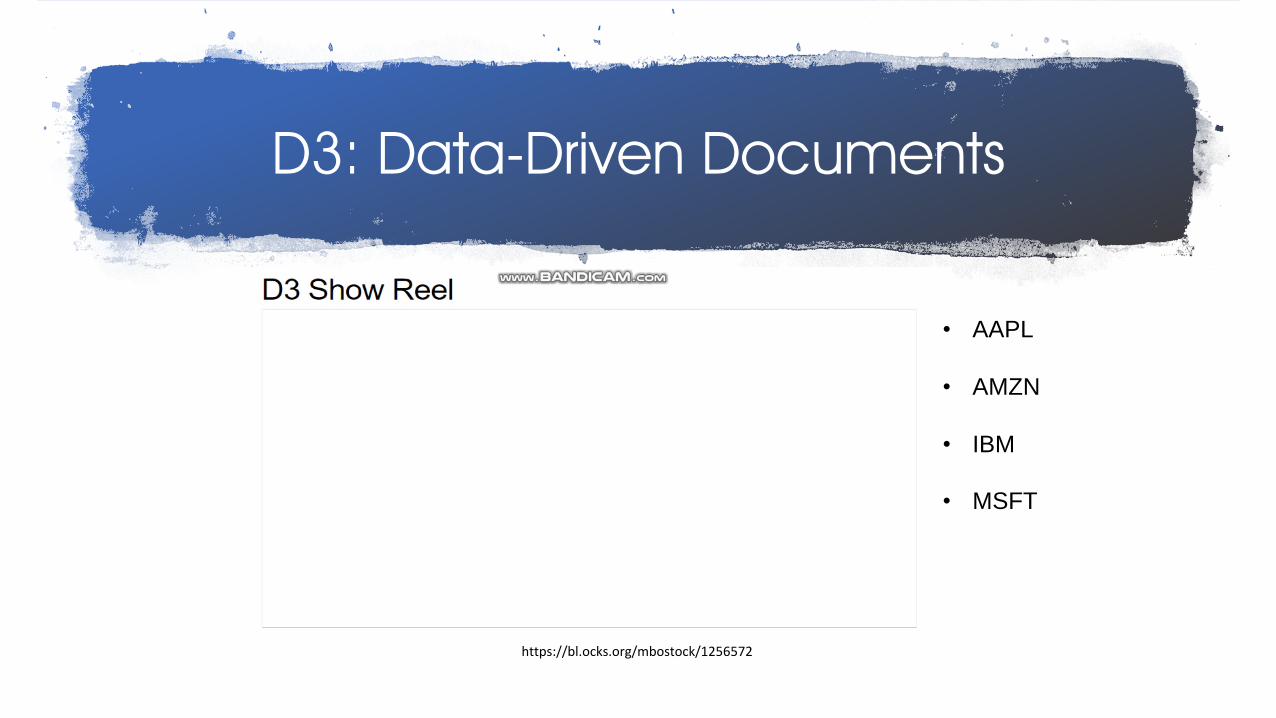
• AAPL
• AMZN
• IBM
• MSFT
https://bl.ocks.org/mbostock/1256572
D3: Data-Driven Documents
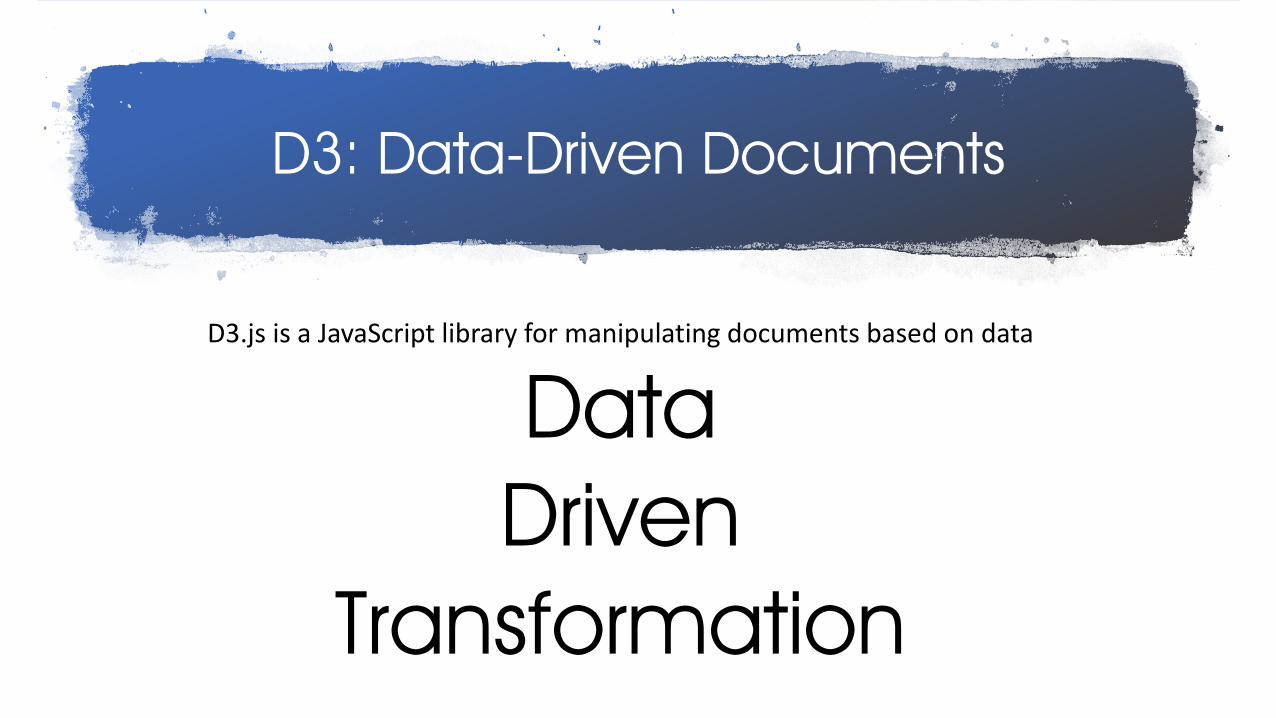
D3.js is a JavaScript library for manipulating documents based on data
Data Driven
Transformation
D3: Technology & Concept
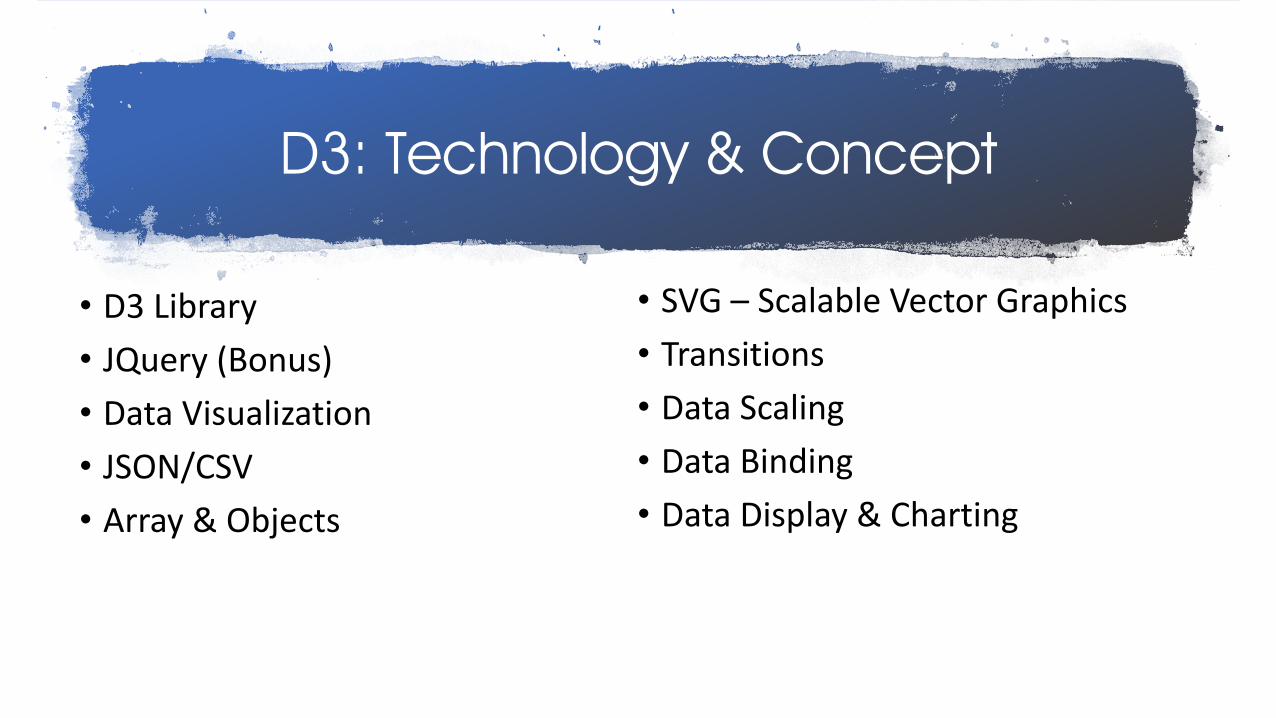
• SVG – Scalable Vector Graphics
• Transitions
• Data Scaling
• Data Binding
• Data Display & Charting
• D3 Library
• JQuery (Bonus)
• Data Visualization
• JSON/CSV
• Array & Objects
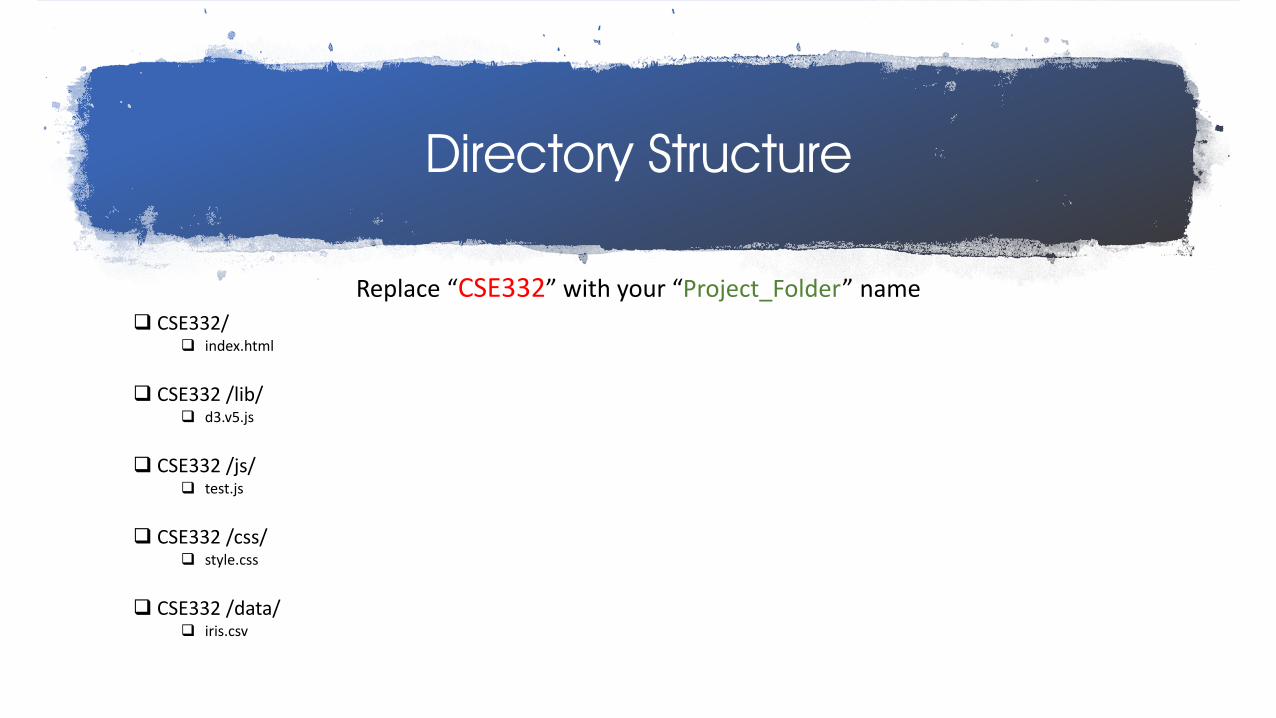
Directory Structure
Replace “CSE332” with your “Project_Folder” name CSE332/
index.html
CSE332 /lib/ d3.v5.js
CSE332 /js/ test.js
CSE332 /css/ style.css
CSE332 /data/ iris.csv
VERY VERY IMPORTANT !!!
Please do not be hesitant to ask questions!
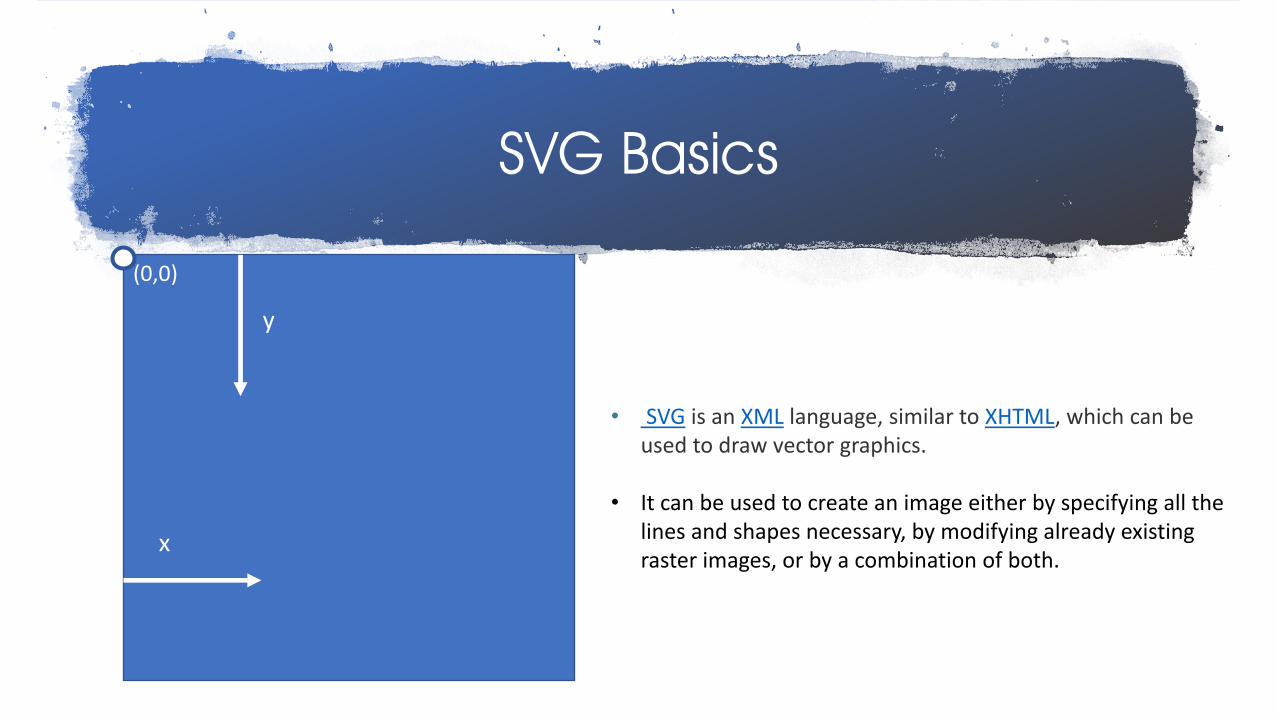
SVG Basics
(0,0)
y
x
• SVG is an XML language, similar to XHTML, which can be used to draw vector graphics.
• It can be used to create an image either by specifying all the
lines and shapes necessary, by modifying already existing raster images, or by a combination of both.
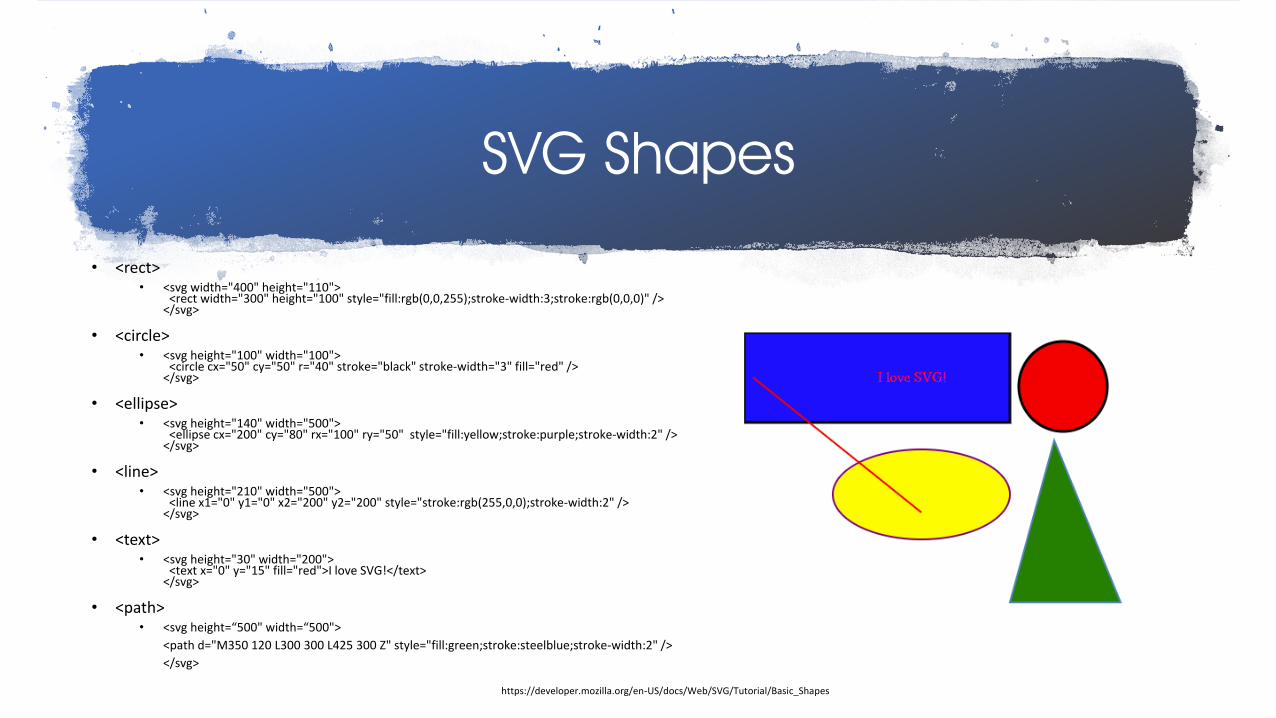
SVG Shapes
• <rect> • <svg width="400" height="110">
<rect width="300" height="100" style="fill:rgb(0,0,255);stroke-width:3;stroke:rgb(0,0,0)" /> </svg>
• <circle> • <svg height="100" width="100">
<circle cx="50" cy="50" r="40" stroke="black" stroke-width="3" fill="red" /> </svg>
• <ellipse> • <svg height="140" width="500">
<ellipse cx="200" cy="80" rx="100" ry="50" style="fill:yellow;stroke:purple;stroke-width:2" /> </svg>
• <line> • <svg height="210" width="500">
<line x1="0" y1="0" x2="200" y2="200" style="stroke:rgb(255,0,0);stroke-width:2" /> </svg>
• <text> • <svg height="30" width="200">
<text x="0" y="15" fill="red">I love SVG!</text> </svg>
• <path> • <svg height=“500" width=“500">
<path d="M350 120 L300 300 L425 300 Z" style="fill:green;stroke:steelblue;stroke-width:2" />
</svg>
https://developer.mozilla.org/en-US/docs/Web/SVG/Tutorial/Basic_Shapes
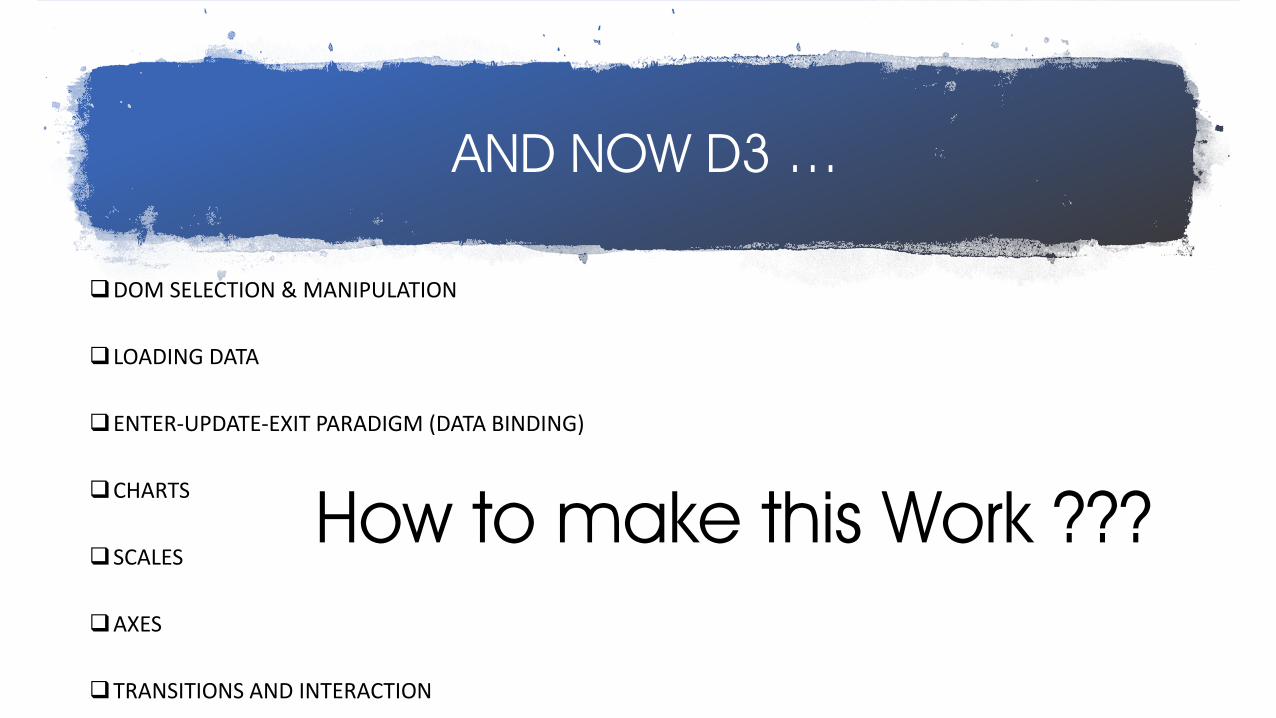
AND NOW D3 …
DOM SELECTION & MANIPULATION
LOADING DATA
ENTER-UPDATE-EXIT PARADIGM (DATA BINDING)
CHARTS
SCALES
AXES
TRANSITIONS AND INTERACTION
How to make this Work ???
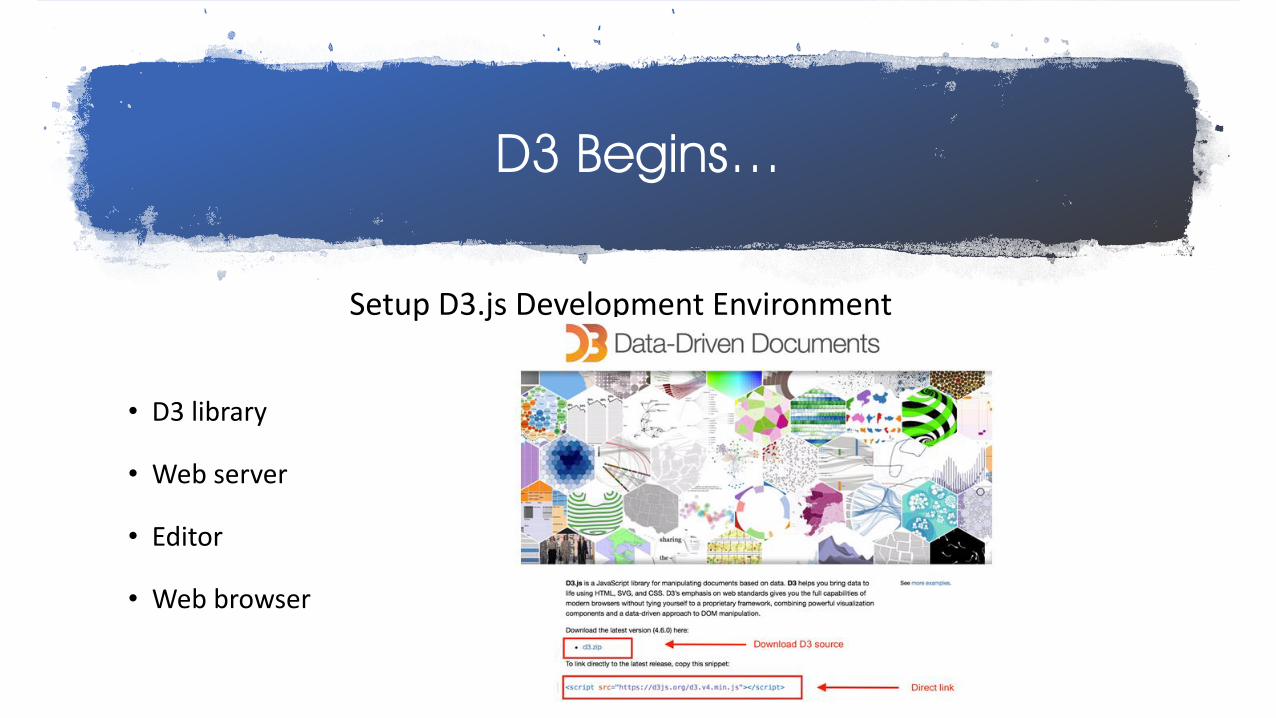
D3 Begins…
Setup D3.js Development Environment
• D3 library
• Web server
• Editor
• Web browser
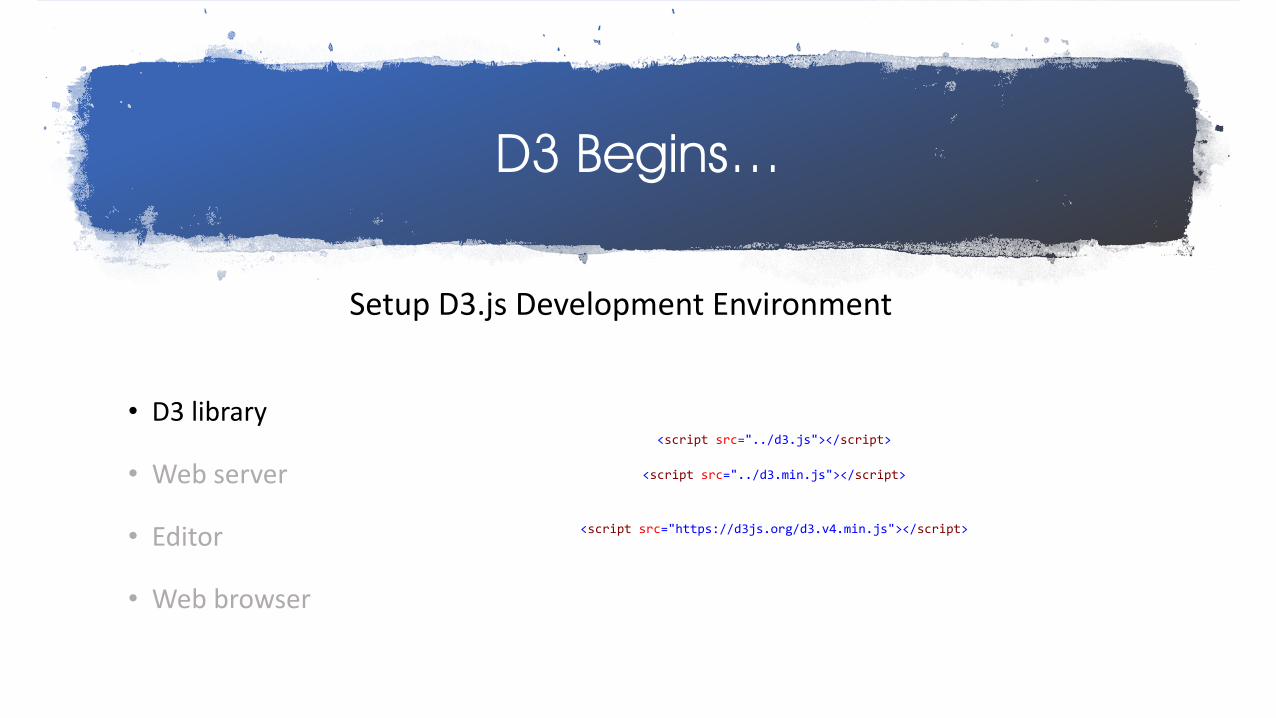
D3 Begins…
Setup D3.js Development Environment
• D3 library
• Web server
• Editor • Web browser
<script src="../d3.min.js"></script>
<script src="https://d3js.org/d3.v4.min.js"></script>
<script src="../d3.js"></script>
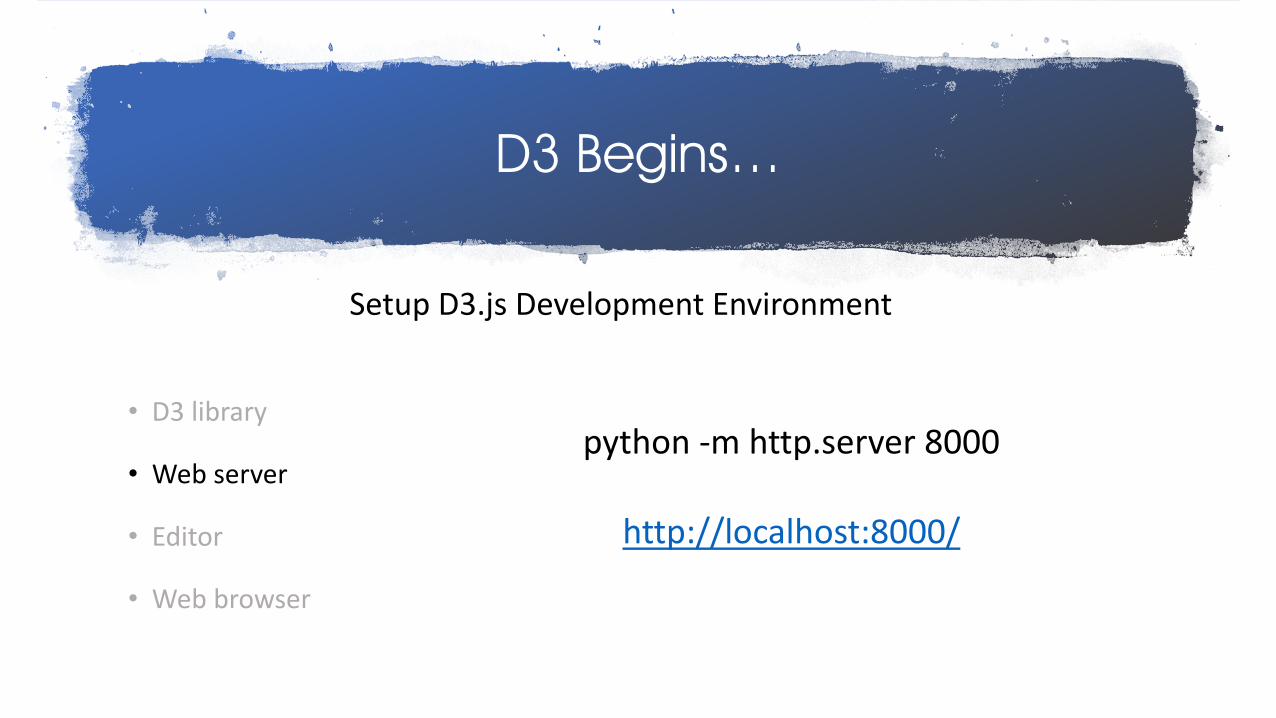
D3 Begins…
Setup D3.js Development Environment
• D3 library
• Web server
• Editor • Web browser
python -m http.server 8000
http://localhost:8000/
D3 Begins…
Setup D3.js Development Environment
• D3 library
• Web server
• Editor • Web browser
D3 Begins…
Setup D3.js Development Environment
• D3 library
• Web server
• Editor • Web browser
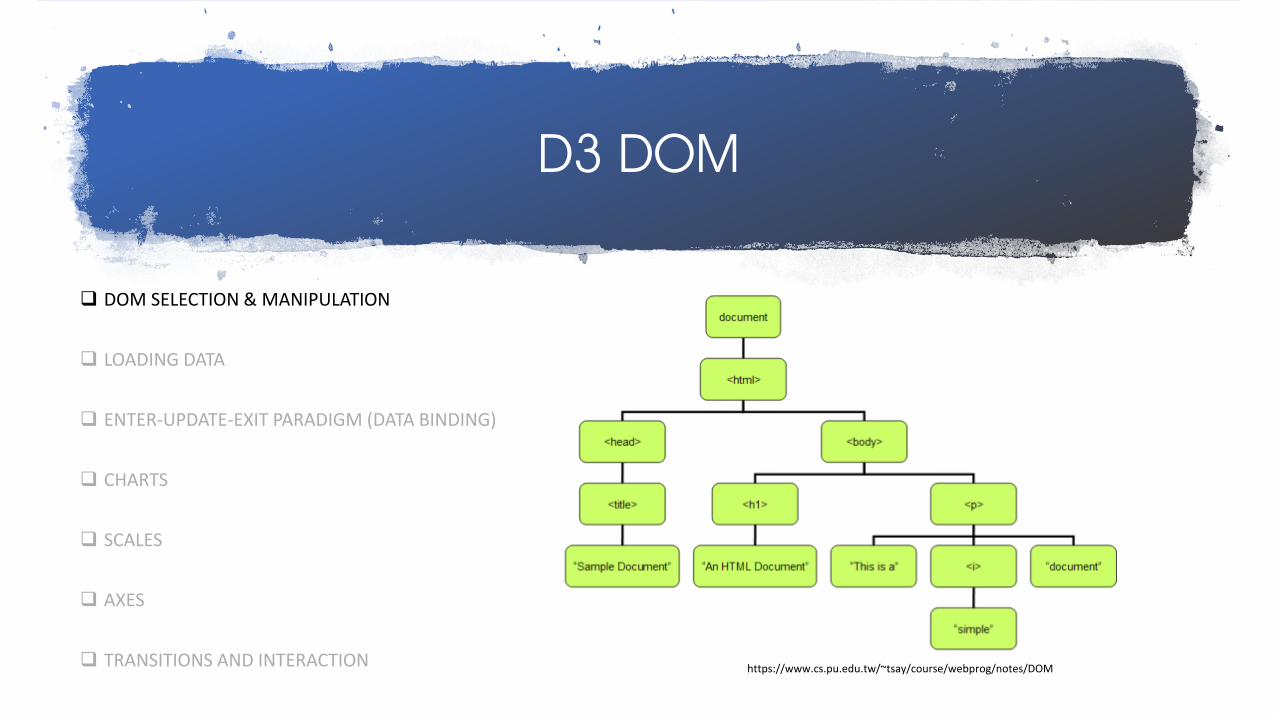
D3 DOM
DOM SELECTION & MANIPULATION
LOADING DATA
ENTER-UPDATE-EXIT PARADIGM (DATA BINDING)
CHARTS
SCALES
AXES
TRANSITIONS AND INTERACTION
https://www.cs.pu.edu.tw/~tsay/course/webprog/notes/DOM
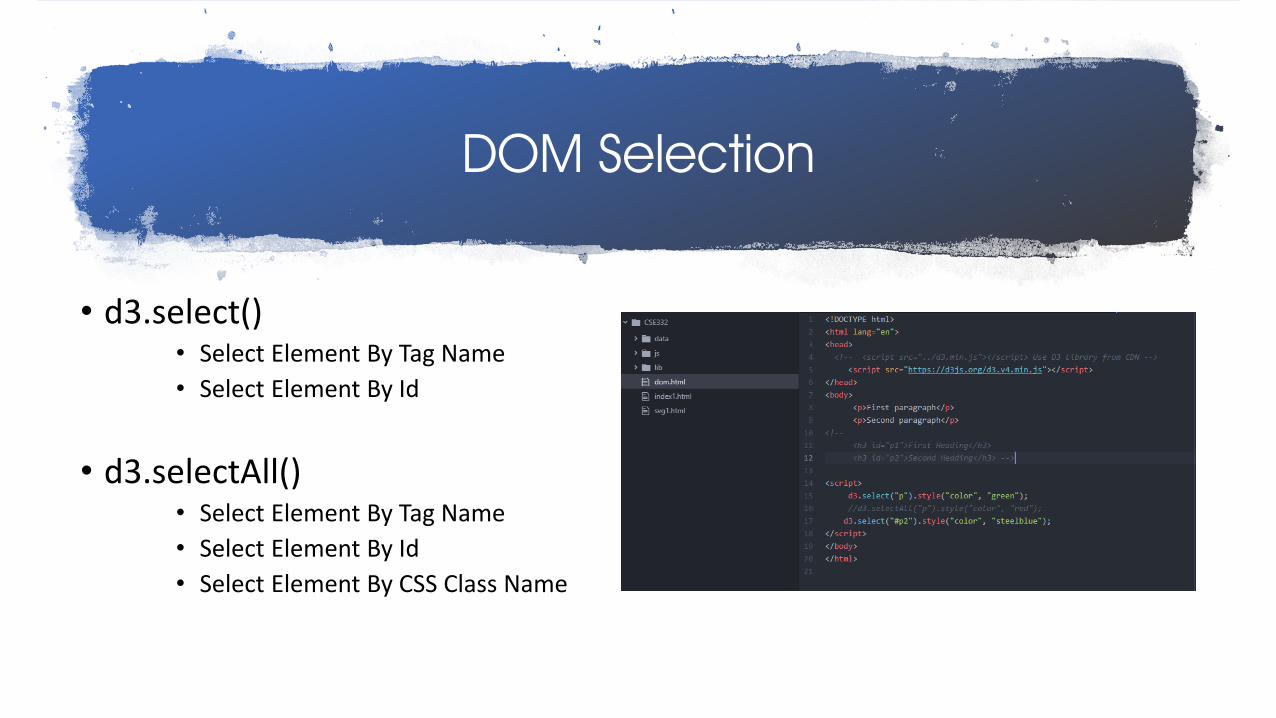
DOM Selection
• d3.select() • Select Element By Tag Name
• Select Element By Id
• d3.selectAll() • Select Element By Tag Name
• Select Element By Id
• Select Element By CSS Class Name
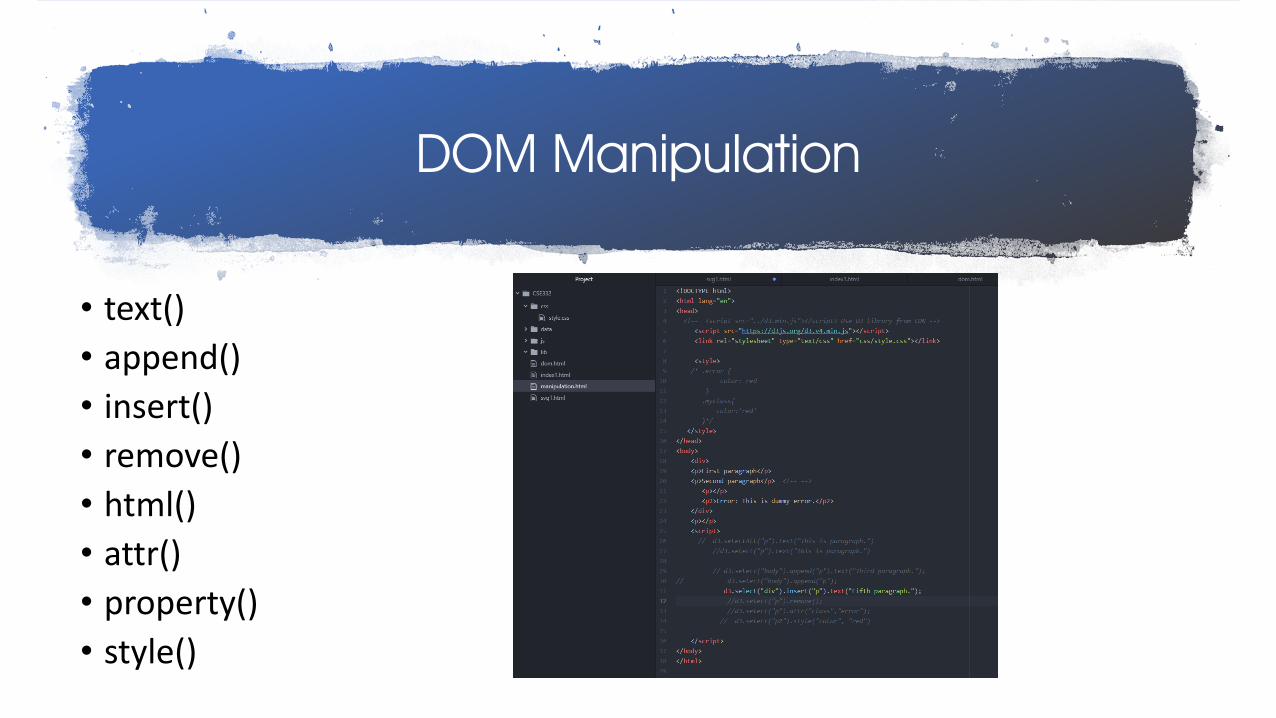
DOM Manipulation
• text()
• append()
• insert()
• remove()
• html()
• attr()
• property()
• style()
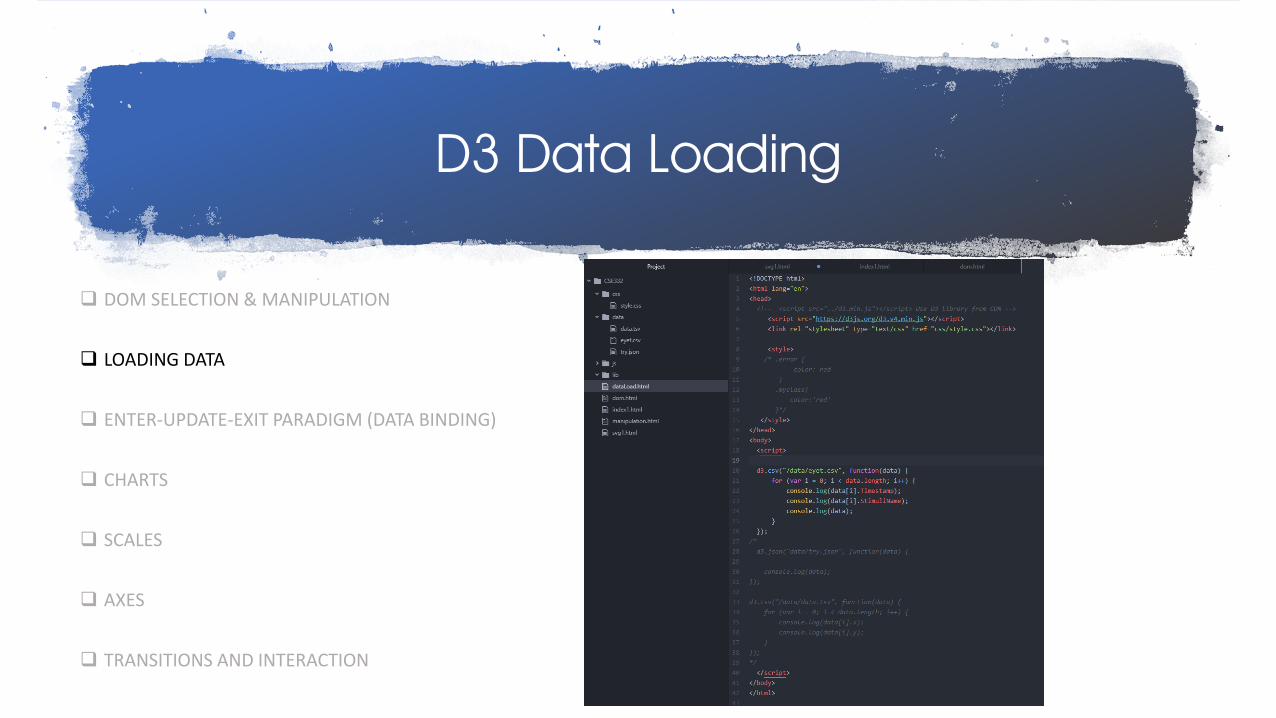
D3 Data Loading
DOM SELECTION & MANIPULATION
LOADING DATA
ENTER-UPDATE-EXIT PARADIGM (DATA BINDING)
CHARTS
SCALES
AXES
TRANSITIONS AND INTERACTION
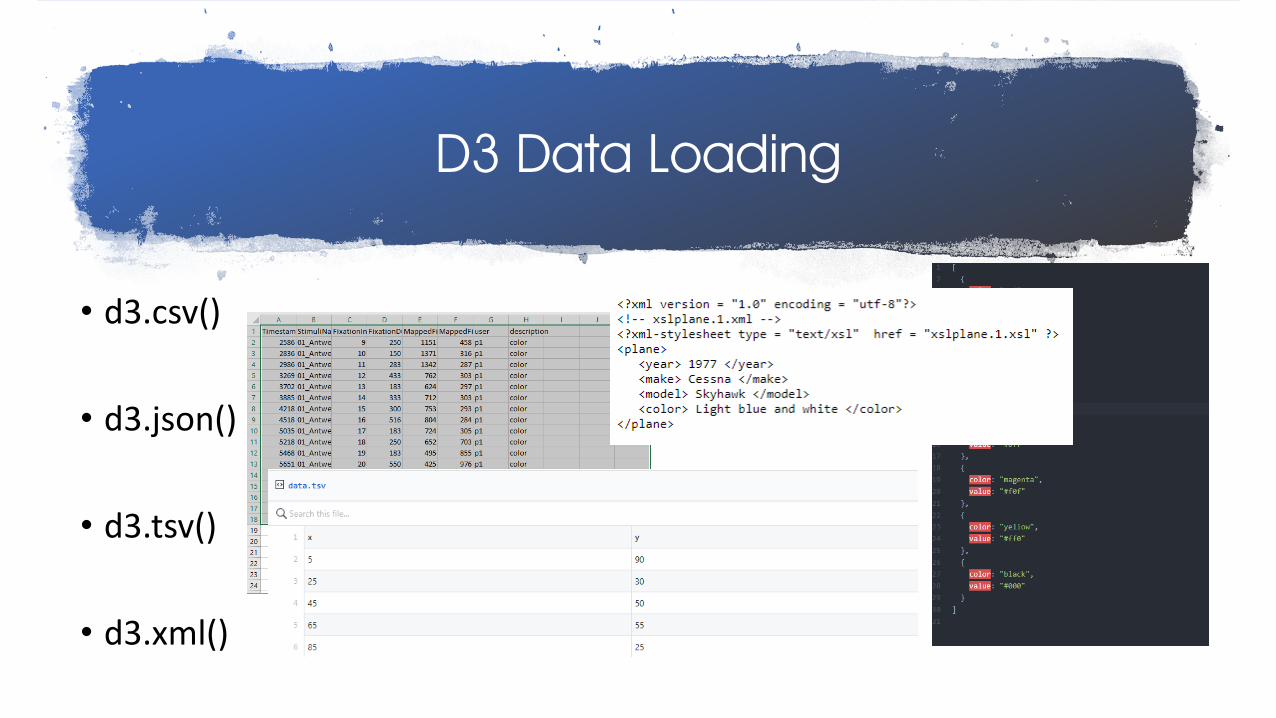
D3 Data Loading
• d3.csv()
• d3.json()
• d3.tsv()
• d3.xml()
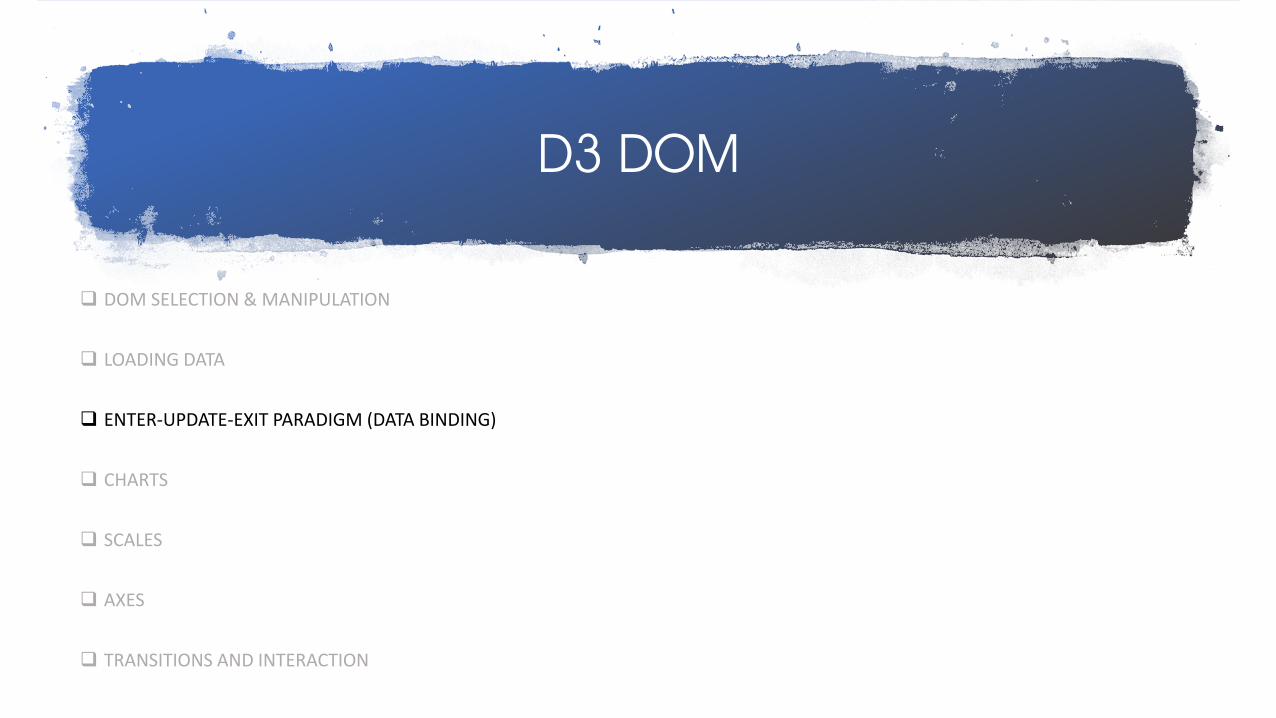
D3 DOM
DOM SELECTION & MANIPULATION
LOADING DATA
ENTER-UPDATE-EXIT PARADIGM (DATA BINDING)
CHARTS
SCALES
AXES
TRANSITIONS AND INTERACTION
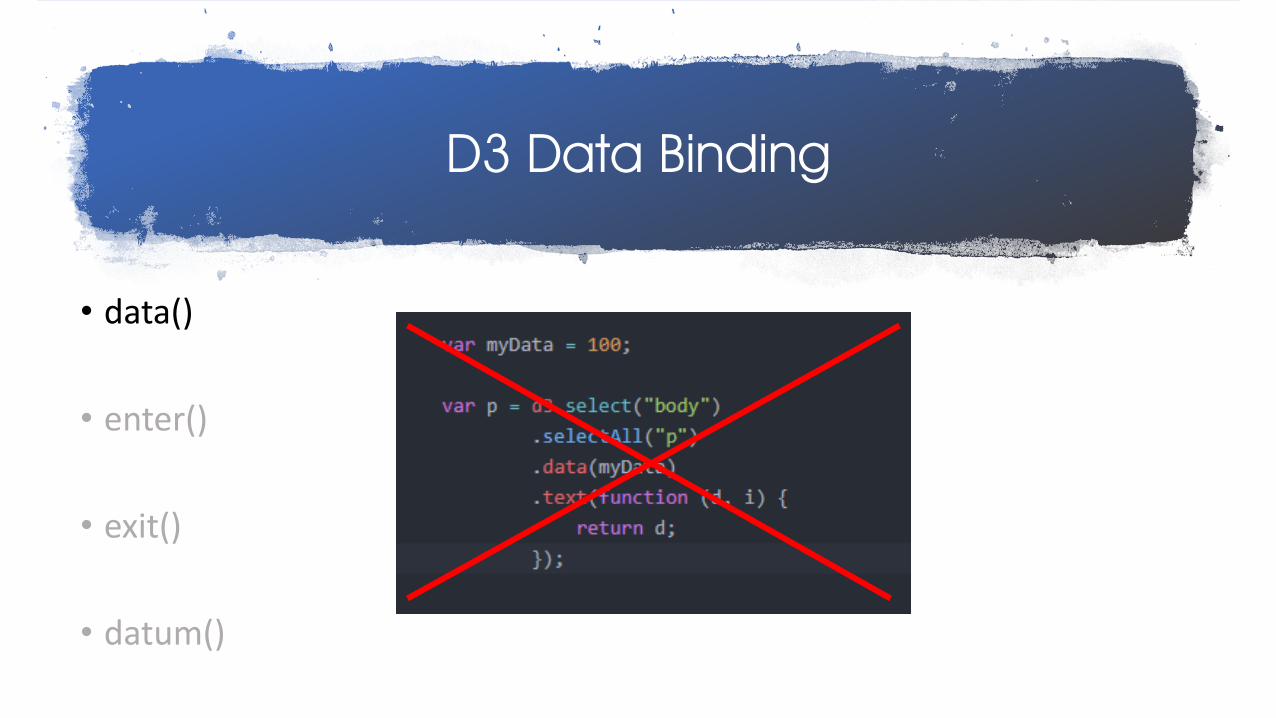
D3 Data Binding
• data()
• enter()
• exit()
• datum()
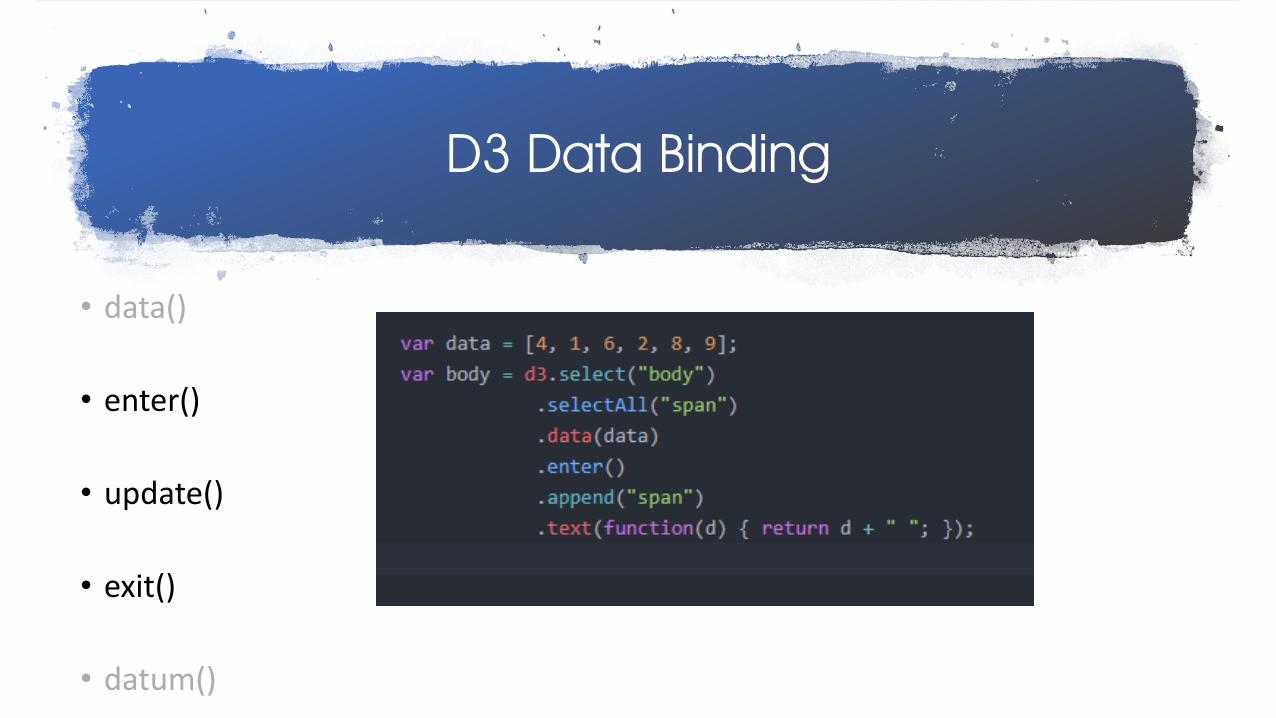
D3 Data Binding
• data()
• enter()
• update()
• exit()
• datum()
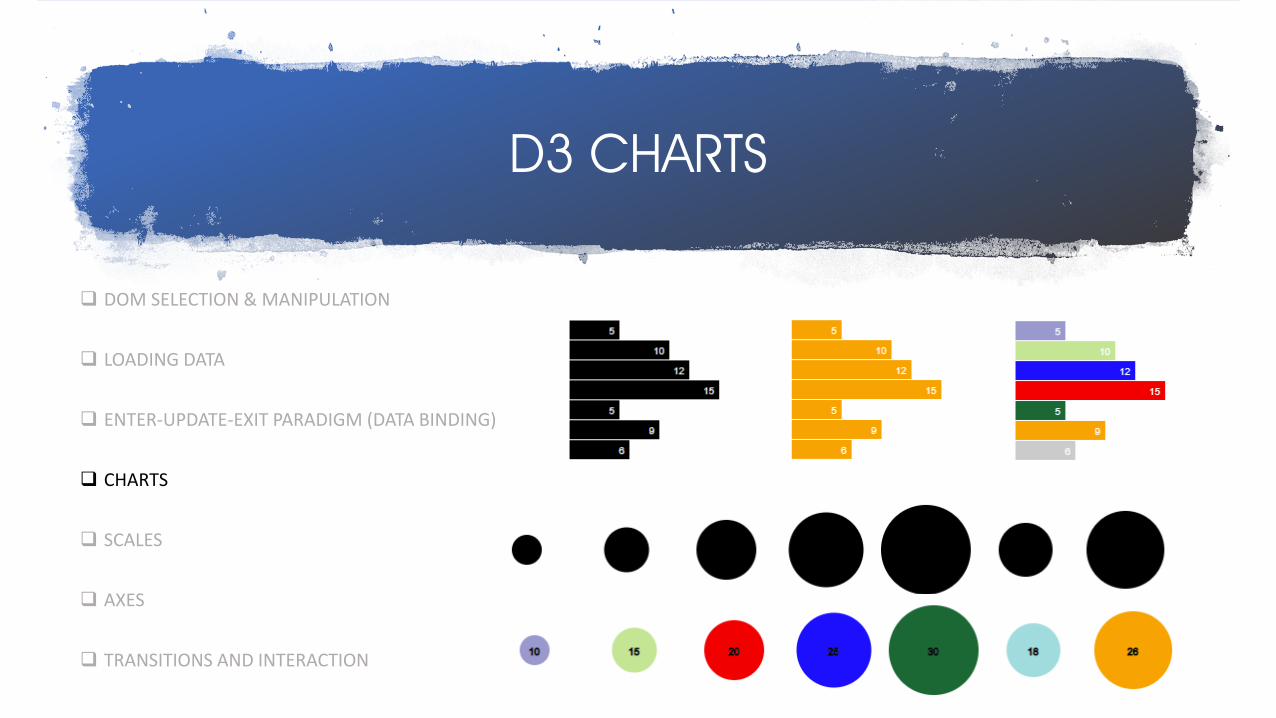
D3 CHARTS
DOM SELECTION & MANIPULATION
LOADING DATA
ENTER-UPDATE-EXIT PARADIGM (DATA BINDING)
CHARTS
SCALES
AXES
TRANSITIONS AND INTERACTION
D3 SCALING
DOM SELECTION & MANIPULATION
LOADING DATA
ENTER-UPDATE-EXIT PARADIGM (DATA BINDING)
CHARTS
SCALES
AXES
TRANSITIONS AND INTERACTION
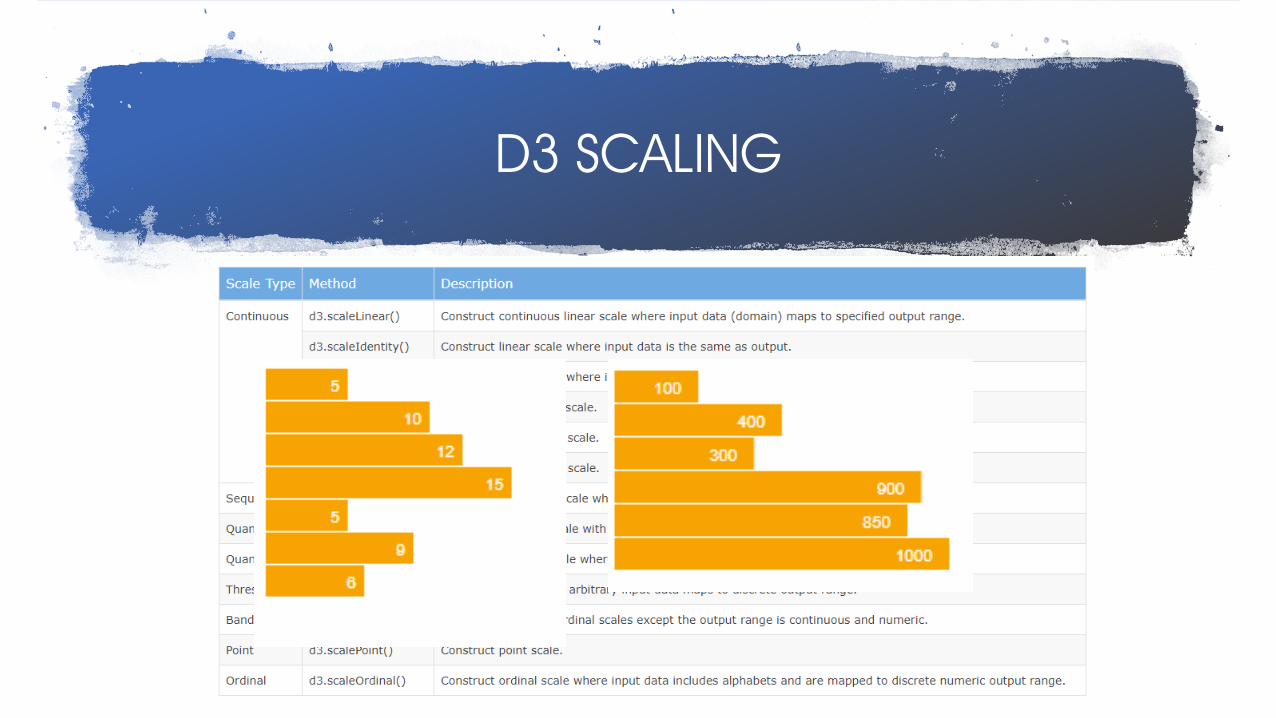
D3 SCALING
D3 Axis
DOM SELECTION & MANIPULATION
LOADING DATA
ENTER-UPDATE-EXIT PARADIGM (DATA BINDING)
CHARTS
SCALES
AXES
TRANSITIONS AND INTERACTION
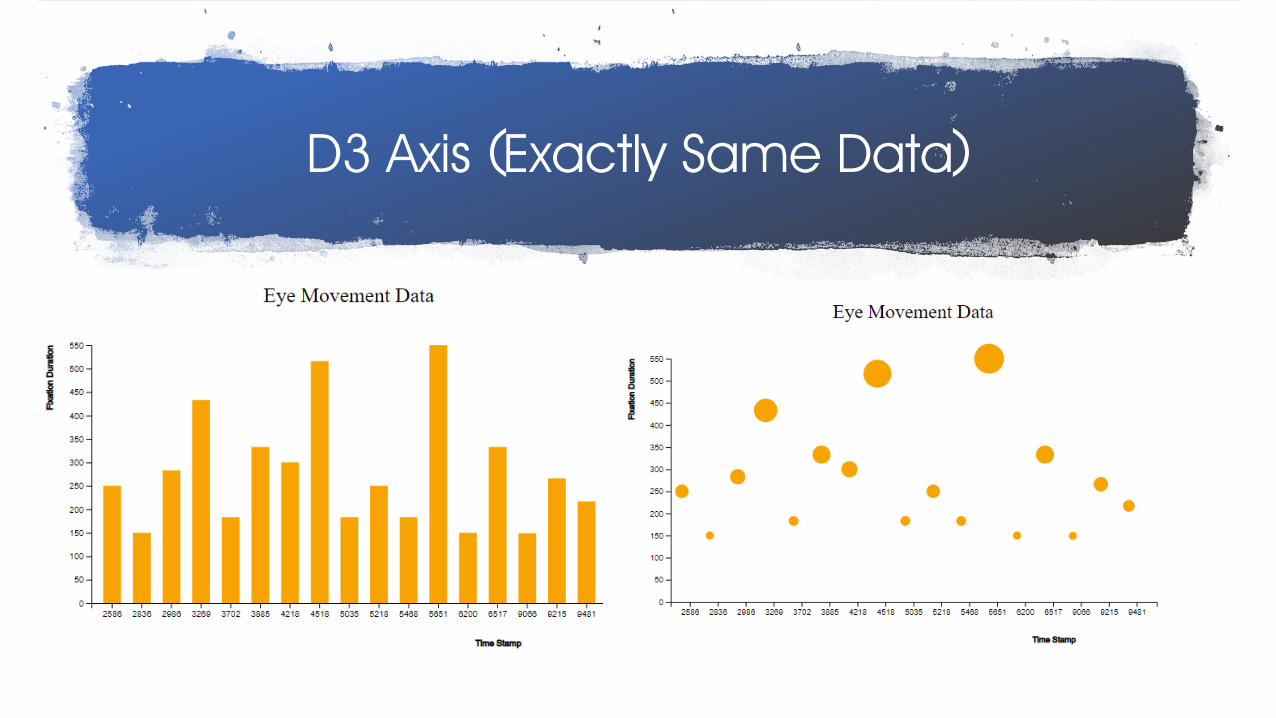
D3 Axis (Exactly Same Data)

D3 Animation
DOM SELECTION & MANIPULATION
LOADING DATA
ENTER-UPDATE-EXIT PARADIGM (DATA BINDING)
CHARTS
SCALES
AXES
TRANSITIONS AND INTERACTION
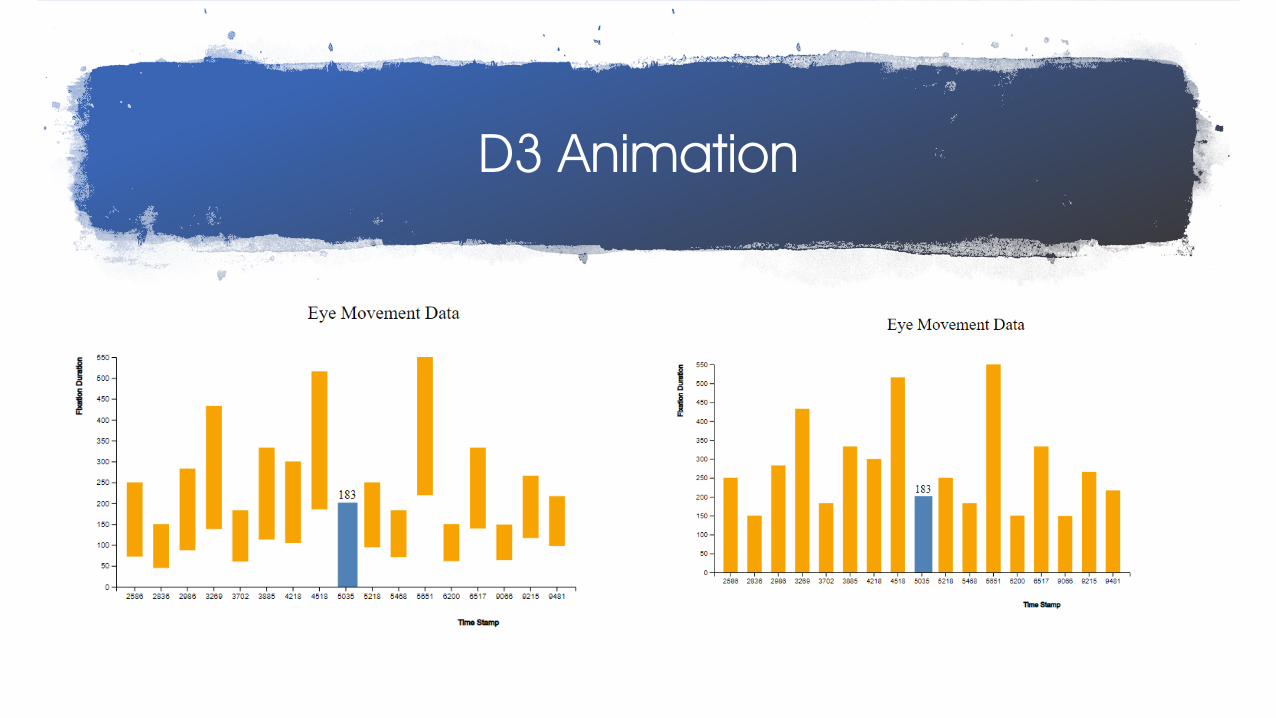
D3 Animation
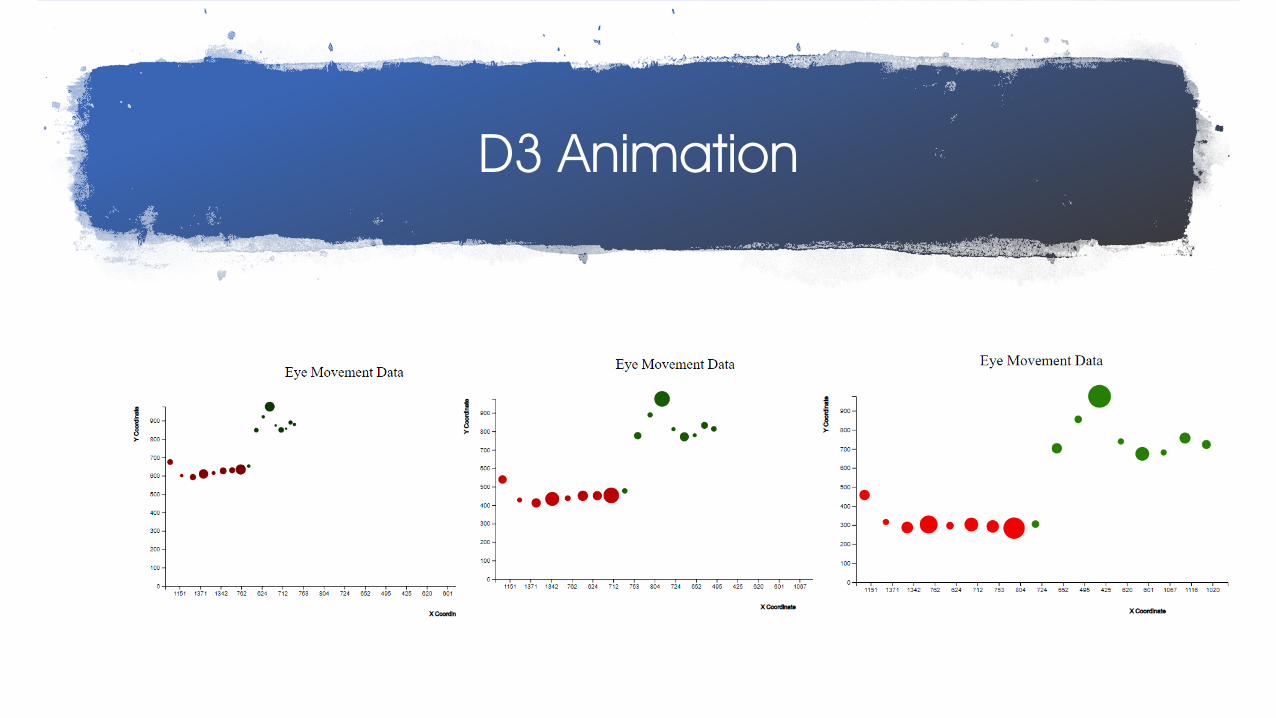
D3 Animation
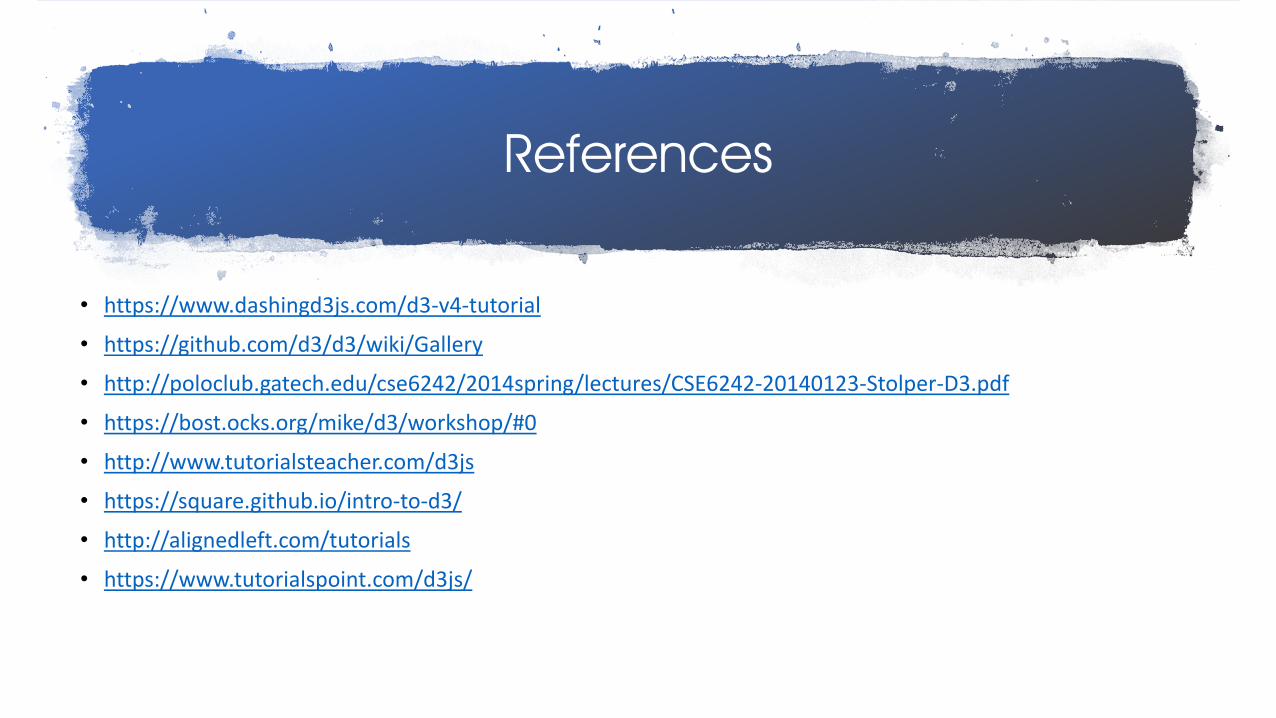
References
• https://www.dashingd3js.com/d3-v4-tutorial
• https://github.com/d3/d3/wiki/Gallery
• http://poloclub.gatech.edu/cse6242/2014spring/lectures/CSE6242-20140123-Stolper-D3.pdf
• https://bost.ocks.org/mike/d3/workshop/#0
• http://www.tutorialsteacher.com/d3js
• https://square.github.io/intro-to-d3/
• http://alignedleft.com/tutorials
• https://www.tutorialspoint.com/d3js/


![[MS-SVG]: Internet Explorer Scalable Vector Graphics (SVG ...MS-SVG].pdfGraphics (SVG) 1.1 Specification (Second Edition) [W3C-SVG1.1/2], W3C Recommendation published August 16, 2011](https://img.pdfslide.us/doc/110x75/5ee21471ad6a402d666cb6ad/ms-svg-internet-explorer-scalable-vector-graphics-svg-ms-svgpdf-graphics.jpg)


![[MS-SVG]: Internet Explorer Scalable Vector Graphics (SVG ...interoperability.blob.core.windows.net/web/MS-SVG/[MS-SVG].pdf · Internet Explorer Scalable Vector Graphics (SVG) Standards](https://img.pdfslide.us/doc/110x75/5a6fc5167f8b9ac0538b6194/ms-svg-internet-explorer-scalable-vector-graphics-svg-interoperabilityblobcorewindowsnetwebms-svgms-svgpdfpdf.jpg)