Embed Size (px)
Citation preview
D2.1 – ORCHESTRA dynamic optical network, reference
scenarios and use cases
Optical peRformanCe monitoring enabling dynamic networks using a Holistic cross-layEr,
Self-configurable Truly flexible appRoAch H2020-ICT- 645360
ORCHESTRA ORCHESTRA_D2.1
Optical peRformanCe monitoring enabling dynamic networks using a Holistic cross-layEr, Self-configurable Truly flexible appRoAch
Created on 01.10.2015
D2.1 – ORCHESTRA dynamic optical network, reference scenarios and use cases
www.orchestraproject.eu 2/73
Document Information
Scheduled delivery 1.10.2015
Actual delivery 1.10.2015
Version 1
Responsible Partner TILAB
Dissemination Level
PU Public
Revision History
Date Editor Status Version Changes
20.07.2015 Andrea Di Giglio Draft 0.1 Deliverable layout, including the table of contents and the cost model
22.07.2015 Annachiara Pagano
Draft 0.2 Updating document, including use cases
02.09.2015 Andrea Di Giglio Draft 0.3 Updating document, including cost model sections
07.09.2015 Nicola Sambo Draft 0.3-SSSA Updates: control/management referent architecture and soft-failure management
14.09.2015 Andrea Di Giglio Draft 0.4 Consolidation of the document
25.09.2015 Kostas Christodoulopoulos
Draft 0.5 Updates in section 1 and use cases. Review other sections
30.09.2015 Annachiara Pagano
Final Draft 0.6 Final draft, circulating among the Consortium
1.10.2015 Nicola Sambo Review on Final draft
RevSSSA Review
1.10.2015 Giacomo Bernini
Review on Final draft
RevNXW Review
1.10.2015 TILAB Final version
1
Contributors
Emmanouel Varvarigos (CTI), Aristotelis Kretsis (CTI), Kostas Christodoulopoulos (CTI), Stefanos Dris (NTUA), Nikos Argyris (NTUA), Christos Spatharakis (NTUA), Giacomo Bernini (NXW), Gino Carrozzo (NXW), Andrea Di Giglio (TILAB), Annachiara Pagano (TILAB), Marco Quagliotti (TILAB), Diego Roccato (TILAB), Nicola Sambo (SSSA), Filippo Cugini (SSSA), Yvan Pointurier (ALBLF), Jelena Pesic (ALBLF), Camille Delezoide (ALBLF)

ORCHESTRA ORCHESTRA_D2.1
Optical peRformanCe monitoring enabling dynamic networks using a Holistic cross-layEr, Self-configurable Truly flexible appRoAch
Created on 01.10.2015
D2.1 – ORCHESTRA dynamic optical network, reference scenarios and use cases
www.orchestraproject.eu 3/73
Internal Reviewers
Nextworks, SSSA
Copyright
This report is © by CTI and other members of the ORCHESTRA Consortium 2015-2018. Its duplication is allowed only in the integral form for anyone's personal use and for the purposes of research or education.
Acknowledgements
The research leading to these results has received funding from the EC HORIZON 2020 under grant agreement n° 645360.
ORCHESTRA ORCHESTRA_D2.1
Optical peRformanCe monitoring enabling dynamic networks using a Holistic cross-layEr, Self-configurable Truly flexible appRoAch
Created on 01.10.2015
D2.1 – ORCHESTRA dynamic optical network, reference scenarios and use cases
www.orchestraproject.eu 4/73
Glossary of Acronyms
Acronym Definition
ABNO Application-Based Network Operations
API Application Programming Interfaces
ASE Amplified Spontaneous Emission
ASIC Application-Specific Integrated Circuit
AWG Array waveguide grating
BER Bit Error Rate
BOL Beginning of LIfe
BVT Bandwidth Variable Transponder
CAPEX Capital Expenditure
CCAMP-WG Common Control and Measurement Plane Working Group
CD Chromatic Dispersion
C&M Control and Monitoring
D Deliverable
DCM Dispersion compensating Module
DGD Differential Group Dispersion
DLI Delay line interferometer
DoW Description of Work
DSLAM Digital Subscriber Line Access Multiplexer
DSP Digital Signal Processor
EC European Commission
EDFA Erbium doped Fiber Amplifier
EOL End of Life
FEC Forward error correction
FTTC Fiber to the Cabinet
FWM Four Wave Mixing
GMPLS Generalised Multi Protocol Label Switching
GN Gaussian Model
GSM Generalized Multi-Protocol Label Switching
ICT Information and Communication Technologies
LSP-DB Label Switched Path DataBase
LTE Long-Term Evolution
L-UFL Local unambiguous failure localization
M Milestone
MFVT Modulation Format Variable Transponders
NLI Non Linear Effect
NMS Network Management System
MIMO Multiple Input and Multiple Output
NMS Network Management System
NXW Nextworks
OAM Operations, Administration, and Maintenance
OCM Optical Channel Monitoring
ODU Optical Data Unit
OLO Other Licensed Operators

ORCHESTRA ORCHESTRA_D2.1
Optical peRformanCe monitoring enabling dynamic networks using a Holistic cross-layEr, Self-configurable Truly flexible appRoAch
Created on 01.10.2015
D2.1 – ORCHESTRA dynamic optical network, reference scenarios and use cases
www.orchestraproject.eu 5/73
OLT Optical Line Terminal
OPEX Operational Expenditure
OPB Optical packet backbone
OPM Optical Performance Monitoring
OSNR Optical Signal to Noise Ratio
OSPF-TE Open Shortest Path First – Traffic Engineering
OTN Optical Transport Network
OXC Optical cross Connect
PCE Path Computation Element
PDL Polarization Dependent Loss
PM Project Manager
PM-mQAM Polarization multiplexing m quadrature amplitude modulation
PM-QPSK Polarization multiplexing quadrature phase shift keying
PMD Polarization Mode Dispersion
PO Project Officer
PON Passive Optical Network
POP Point of Presence
PSP Principal States of Polarization
PT Packet Transport
PPM Protocol Performance Monitoring
PU Public
QAM Quadrature amplitude modulation
QoS Quality of Service
QoT Quality of Traffic
QPSK Quadrature phase shift keying
ROADM Reconfigurable Optical Add Drop Multiplexer
RF Radio Frequency
RX Receiver
SD-FEC Soft Decision Forward Error Correction
SMF Single Mode Fiber
RWA Routing Wavelength Assignment
SDH Synchronous Digital Hierarchy
SDN Software Defined Networking
SLA Service-level agreement (
SOP State of Polarization
SPM Self Phase Modulation
SSS Spectrum Selective Switch
SSSA Scuola Superiore Sant’Anna
TED Traffic Engineering Database
TILAB Telecom Italia Lab
UMTS Universal Mobile Telecommunications System
WDM Wavelength Division Multiplexing
WSON Wavelength Switched Optical Networks
WSS Wavelength Selective Switch
WP Work Package
XPM Cross Phase Modulation
ORCHESTRA ORCHESTRA_D2.1
Optical peRformanCe monitoring enabling dynamic networks using a Holistic cross-layEr, Self-configurable Truly flexible appRoAch
Created on 01.10.2015
D2.1 – ORCHESTRA dynamic optical network, reference scenarios and use cases
www.orchestraproject.eu 6/73
Table of Contents 1. Executive Summary ............................................................................................................ 8
2. The ORCHESTRA architecture .......................................................................................... 10
2.1. The ORCHESTRA network control loop ............................................................................ 11
2.1.1. OBSERVE ............................................................................................................................... 11
2.1.2. OBSERVE DECIDE .......................................................................................................... 12
2.1.3. DECIDE ................................................................................................................................... 12
2.1.4. ACT ........................................................................................................................................... 13
2.2. The ORCHESTRA network functionalities ....................................................................... 14
2.2.1. Monitors ................................................................................................................................. 14
2.2.2. Correlation functionalities .............................................................................................. 15
2.2.3. Control plane functionalities ......................................................................................... 15
2.2.4. Optimization algorithms functionalities ................................................................... 15
2.3. ORCHESTRA Keywords ........................................................................................................... 16
3. Optical Performance Monitors (OPMs) ........................................................................... 18
3.1. Overview of OPM ....................................................................................................................... 18
3.2. Current OPM methods ............................................................................................................. 19
3.2.1. Optical Power....................................................................................................................... 20
3.2.2. Optical signal-to-noise ratio ........................................................................................... 20
3.2.3. Chromatic Dispersion ....................................................................................................... 21
3.2.4. Polarization Effects ............................................................................................................ 21
3.2.5. Q-factor and BER ................................................................................................................ 22
3.2.6. Summary of OPM parameters ....................................................................................... 22
4. Reference scenarios ......................................................................................................... 25
4.1. Reference technology .............................................................................................................. 25
4.2. General network framework ................................................................................................ 26
4.3. Other network framework: data centers cloud ............................................................. 27
4.4. Alien wavelength as a disrupting solution ...................................................................... 27
4.5. Reference topology ................................................................................................................... 28
4.5.1. A PAN-European Network: Telecom Italia Sparkle European Network ....... 28
4.5.2. Telecom Italia Nationwide optical transport networks ...................................... 30
4.5.3. Core Telecom Italia optical transport networks .................................................... 31
4.5.4. Metro Telecom Italia optical segment ........................................................................ 32
4.5.5. Reference traffic scenarios ............................................................................................. 36
4.6. Reference control and management architecture ........................................................ 37
4.7. Reference ageing model .......................................................................................................... 39
5. Use cases .......................................................................................................................... 42
5.1. Network planning and provisioning with reduced margins .................................... 42
5.1.1. Establishing a new connection ...................................................................................... 44
5.2. Dynamic network adaptation ............................................................................................... 45
5.2.1. Elastic transponder rate maximization in case of network congestion ........ 46
5.3. Failure prediction, localization and handling of degradations ................................ 47
5.3.1. Hard failure prediction .................................................................................................... 47
5.3.2. Hard failures localization and fast restoration ....................................................... 49
5.3.3. Soft failures management ............................................................................................... 50

ORCHESTRA ORCHESTRA_D2.1
Optical peRformanCe monitoring enabling dynamic networks using a Holistic cross-layEr, Self-configurable Truly flexible appRoAch
Created on 01.10.2015
D2.1 – ORCHESTRA dynamic optical network, reference scenarios and use cases
www.orchestraproject.eu 7/73
5.4. Optimize transmission during network upgrade and network maintenance tasks 53
5.4.1. Handling possible degradation occurred when reverting traffic after a maintenance job .................................................................................................................................. 54
5.5. Alien wavelengths handling .................................................................................................. 54
6. Cost model........................................................................................................................ 56
6.1. Introduction................................................................................................................................. 56
6.2. Methods analysis ....................................................................................................................... 57
6.2.1. Symbols and nomenclature ............................................................................................ 57
6.3. Cost evaluation (entire network) ........................................................................................ 57
6.4. Alternative method: use cases and statistical projection on the entire network 59
7. Multi-period transponder and regenerator placement ................................................... 61
7.1. Scenario description................................................................................................................. 62
7.2. Illustrative results ..................................................................................................................... 64
8. Conclusion ........................................................................................................................ 69
9. References ........................................................................................................................ 71
ORCHESTRA ORCHESTRA_D2.1
Optical peRformanCe monitoring enabling dynamic networks using a Holistic cross-layEr, Self-configurable Truly flexible appRoAch
Created on 01.10.2015
D2.1 – ORCHESTRA dynamic optical network, reference scenarios and use cases
www.orchestraproject.eu 8/73
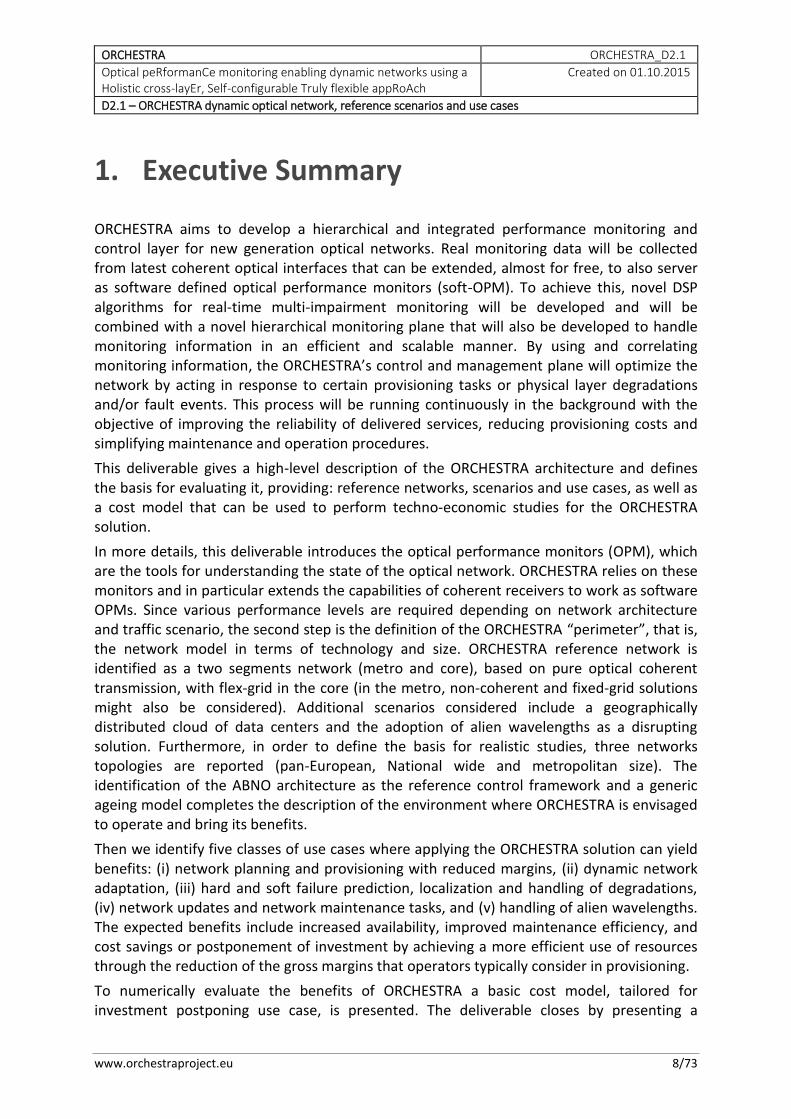
1. Executive Summary
ORCHESTRA aims to develop a hierarchical and integrated performance monitoring and control layer for new generation optical networks. Real monitoring data will be collected from latest coherent optical interfaces that can be extended, almost for free, to also server as software defined optical performance monitors (soft-OPM). To achieve this, novel DSP algorithms for real-time multi-impairment monitoring will be developed and will be combined with a novel hierarchical monitoring plane that will also be developed to handle monitoring information in an efficient and scalable manner. By using and correlating monitoring information, the ORCHESTRA’s control and management plane will optimize the network by acting in response to certain provisioning tasks or physical layer degradations and/or fault events. This process will be running continuously in the background with the objective of improving the reliability of delivered services, reducing provisioning costs and simplifying maintenance and operation procedures.
This deliverable gives a high-level description of the ORCHESTRA architecture and defines the basis for evaluating it, providing: reference networks, scenarios and use cases, as well as a cost model that can be used to perform techno-economic studies for the ORCHESTRA solution.
In more details, this deliverable introduces the optical performance monitors (OPM), which are the tools for understanding the state of the optical network. ORCHESTRA relies on these monitors and in particular extends the capabilities of coherent receivers to work as software OPMs. Since various performance levels are required depending on network architecture and traffic scenario, the second step is the definition of the ORCHESTRA “perimeter”, that is, the network model in terms of technology and size. ORCHESTRA reference network is identified as a two segments network (metro and core), based on pure optical coherent transmission, with flex-grid in the core (in the metro, non-coherent and fixed-grid solutions might also be considered). Additional scenarios considered include a geographically distributed cloud of data centers and the adoption of alien wavelengths as a disrupting solution. Furthermore, in order to define the basis for realistic studies, three networks topologies are reported (pan-European, National wide and metropolitan size). The identification of the ABNO architecture as the reference control framework and a generic ageing model completes the description of the environment where ORCHESTRA is envisaged to operate and bring its benefits.
Then we identify five classes of use cases where applying the ORCHESTRA solution can yield benefits: (i) network planning and provisioning with reduced margins, (ii) dynamic network adaptation, (iii) hard and soft failure prediction, localization and handling of degradations, (iv) network updates and network maintenance tasks, and (v) handling of alien wavelengths. The expected benefits include increased availability, improved maintenance efficiency, and cost savings or postponement of investment by achieving a more efficient use of resources through the reduction of the gross margins that operators typically consider in provisioning.
To numerically evaluate the benefits of ORCHESTRA a basic cost model, tailored for investment postponing use case, is presented. The deliverable closes by presenting a

ORCHESTRA ORCHESTRA_D2.1
Optical peRformanCe monitoring enabling dynamic networks using a Holistic cross-layEr, Self-configurable Truly flexible appRoAch
Created on 01.10.2015
D2.1 – ORCHESTRA dynamic optical network, reference scenarios and use cases
www.orchestraproject.eu 9/73
preliminary study on the planning with reduced margins use case, which shows the potential of the ORCHESTRA solution and encourages the project to continue on that path.
The present document is the first technical deliverable of the project, aiming at describing the ORCHESTRA solution and defining the basis and the perimeter of the studies to be performed. More details on the physical layer and monitors will be given in D2.2, while the control plane requirements and specifications will be reported in D2.3; technical solutions will be provided by WP3, WP4 and WP5, while the proposed solutions will be tested and demonstrated by WP6.
ORCHESTRA ORCHESTRA_D2.1
Optical peRformanCe monitoring enabling dynamic networks using a Holistic cross-layEr, Self-configurable Truly flexible appRoAch
Created on 01.10.2015
D2.1 – ORCHESTRA dynamic optical network, reference scenarios and use cases
www.orchestraproject.eu 10/73
2. The ORCHESTRA architecture
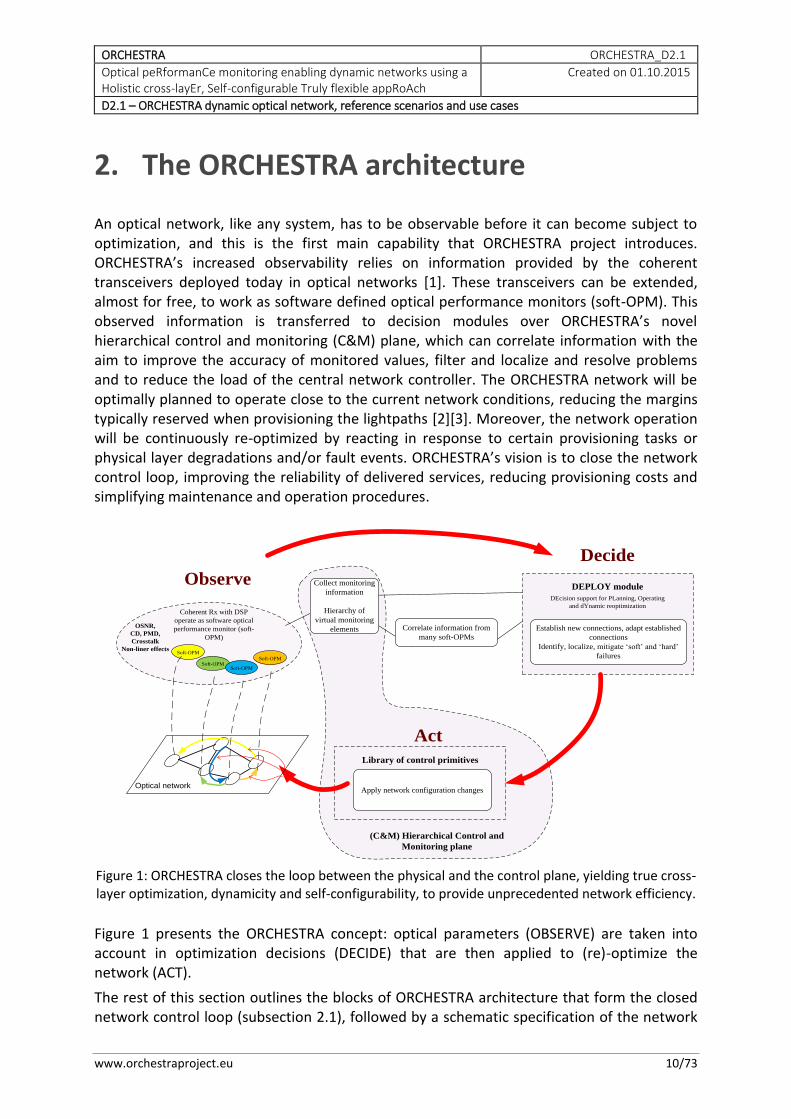
An optical network, like any system, has to be observable before it can become subject to optimization, and this is the first main capability that ORCHESTRA project introduces. ORCHESTRA’s increased observability relies on information provided by the coherent transceivers deployed today in optical networks [1]. These transceivers can be extended, almost for free, to work as software defined optical performance monitors (soft-OPM). This observed information is transferred to decision modules over ORCHESTRA’s novel hierarchical control and monitoring (C&M) plane, which can correlate information with the aim to improve the accuracy of monitored values, filter and localize and resolve problems and to reduce the load of the central network controller. The ORCHESTRA network will be optimally planned to operate close to the current network conditions, reducing the margins typically reserved when provisioning the lightpaths [2][3]. Moreover, the network operation will be continuously re-optimized by reacting in response to certain provisioning tasks or physical layer degradations and/or fault events. ORCHESTRA’s vision is to close the network control loop, improving the reliability of delivered services, reducing provisioning costs and simplifying maintenance and operation procedures.
Library of control primitives
Soft-OPM
Soft-OPM
Coherent Rx with DSP
operate as software optical
performance monitor (soft-
OPM)
Observe Collect monitoring
information
Hierarchy of
virtual monitoring
elements Correlate information from
many soft-OPMs
DEPLOY module
DEcision support for PLanning, Operating
and dYnamic reoptimization
Establish new connections, adapt established
connections
Identify, localize, mitigate ‘soft’ and ‘hard’
failures
Decide
Act
Apply network configuration changes
OSNR,
CD, PMD,
Crosstalk
Non-liner effects
Optical network
(C&M) Hierarchical Control and
Monitoring plane
Soft-OPM
Soft-OPM
Figure 1: ORCHESTRA closes the loop between the physical and the control plane, yielding true cross-layer optimization, dynamicity and self-configurability, to provide unprecedented network efficiency.
Figure 1 presents the ORCHESTRA concept: optical parameters (OBSERVE) are taken into account in optimization decisions (DECIDE) that are then applied to (re)-optimize the network (ACT).
The rest of this section outlines the blocks of ORCHESTRA architecture that form the closed network control loop (subsection 2.1), followed by a schematic specification of the network
ORCHESTRA ORCHESTRA_D2.1
Optical peRformanCe monitoring enabling dynamic networks using a Holistic cross-layEr, Self-configurable Truly flexible appRoAch
Created on 01.10.2015
D2.1 – ORCHESTRA dynamic optical network, reference scenarios and use cases
www.orchestraproject.eu 11/73
functionalities under study and development (subsection 2.2) and an univocal definition of the keywords that will be used along the whole lifetime of the Project (subsection 2.3).
2.1. The ORCHESTRA network control loop
2.1.1. OBSERVE Optical networks are moving towards the coherent and elastic era: operators are deploying an all-coherent, multi-format transport layer, allowing operators to shed redundant optical hardware (e.g., dispersion compensation modules) and simplify network design, while enabling opportunities for unprecedented functionalities. ORCHESTRA will take advantage of the evolving telecom trends and pursue the development of advanced DSP algorithms that will add real-time impairment measurement capability to optical transceivers; potentially, every single transceiver in the network can be used as a software Optical Performance Monitor (soft-OPM). Moreover, a key point is that monitoring functions come almost for free, since the ASICs for DSP in coherent transceivers are already deployed.
Commercial coherent transceivers come with DSP algorithms for mitigation of chromatic and polarization mode dispersion (CD, PMD). ORCHESTRA will work on algorithms with the goal of improving the accuracy of these measured parameters, but will also work on monitoring algorithms for optical signal to noise ratio (OSNR), self-phase modulation (SPM), cross-polarization modulation (XPolM), and also take on the challenge of estimating inter-channel effects such as cross-phase modulation (XPM) and crosstalk. Emphasis will be placed on developing DSP schemes that are hardware-efficient and modular: the monitoring plane will be able to make optimal use of them by engaging and disengaging the functional blocks of the transceivers, as dictated by continuously changing network-wide conditions and operational goals.
In ORCHESTRA, network receivers operating as soft-OPM will function in three modes: (i) polling mode, where the control plane requests for a specific parameter, or (ii) threshold mode, where alarm messages are created when a single or a combination of metrics reach specific thresholds, or (iii) time mode, where monitored values are sent periodically.
According to ORCHESTRA’s vision, the control and monitoring plane will have a plethora of soft-OPMs from which it can extract physical-layer information. In addition, ORCHESTRA can do even more: a soft-OPM at a receiver provides aggregate performance measurements over a path that usually spans multiple network links. ORCHESTRA’s ambitious objective is to correlate information from multiple soft-OPMs deployed throughout a network, using methods such as network kriging and statistical estimation [4][5], in order to infer new information and estimates on the state of the network. Correlation of information from multiple soft-OPMs opens up a multitude of possibilities for efficient network operation including, but not limited to: improving the accuracy of measured parameters, Quality of Traffic (QoT) prediction before actual establishment of a lightpath, detection and localization, as well as anticipation, of both ‘hard’ (total link failure) and ‘soft’ (link degradation) failures. Moreover, such methods make the gradual deployment of the ORCHESTRA solution more appealing, since added value can be obtained even with a small set of soft-OPMs.
ORCHESTRA ORCHESTRA_D2.1
Optical peRformanCe monitoring enabling dynamic networks using a Holistic cross-layEr, Self-configurable Truly flexible appRoAch
Created on 01.10.2015
D2.1 – ORCHESTRA dynamic optical network, reference scenarios and use cases
www.orchestraproject.eu 12/73
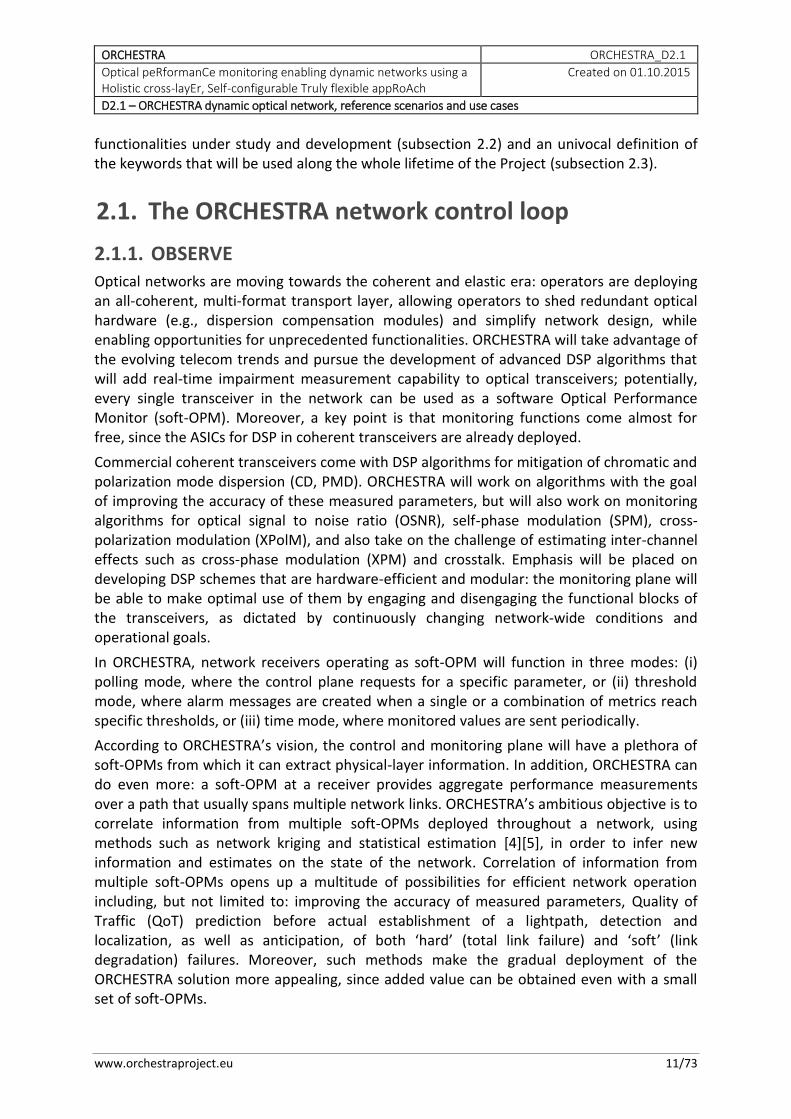
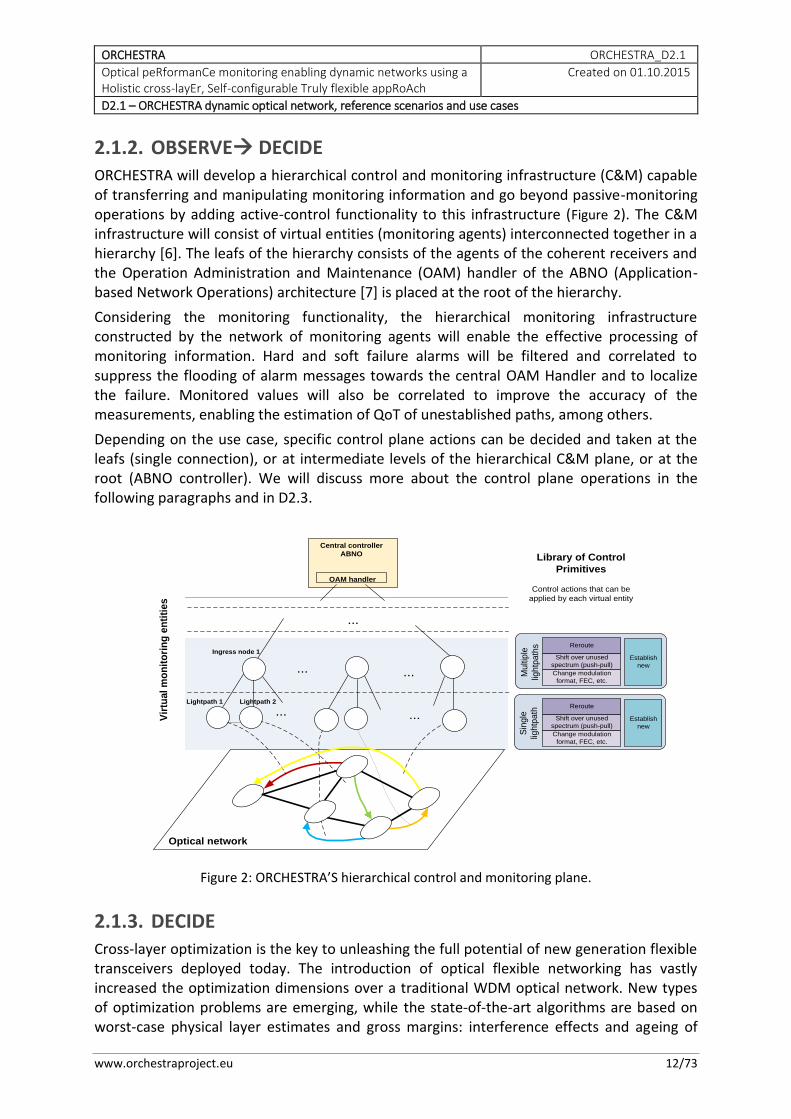
2.1.2. OBSERVE DECIDE ORCHESTRA will develop a hierarchical control and monitoring infrastructure (C&M) capable of transferring and manipulating monitoring information and go beyond passive-monitoring operations by adding active-control functionality to this infrastructure (Figure 2). The C&M infrastructure will consist of virtual entities (monitoring agents) interconnected together in a hierarchy [6]. The leafs of the hierarchy consists of the agents of the coherent receivers and the Operation Administration and Maintenance (OAM) handler of the ABNO (Application-based Network Operations) architecture [7] is placed at the root of the hierarchy.
Considering the monitoring functionality, the hierarchical monitoring infrastructure constructed by the network of monitoring agents will enable the effective processing of monitoring information. Hard and soft failure alarms will be filtered and correlated to suppress the flooding of alarm messages towards the central OAM Handler and to localize the failure. Monitored values will also be correlated to improve the accuracy of the measurements, enabling the estimation of QoT of unestablished paths, among others.
Depending on the use case, specific control plane actions can be decided and taken at the leafs (single connection), or at intermediate levels of the hierarchical C&M plane, or at the root (ABNO controller). We will discuss more about the control plane operations in the following paragraphs and in D2.3.
Lightpath 1 Lightpath 2
...
Ingress node 1
...
Central controller
ABNO
OAM handler
Vir
tua
l m
on
ito
rin
g e
nti
tie
s
Library of Control
Primitives
Control actions that can be
applied by each virtual entity
Change modulation
format, FEC, etc.
Shift over unused
spectrum (push-pull)
Reroute
Optical network
Establish
new
Establish
new
Mu
ltip
le
ligh
tpa
ths
Sin
gle
ligh
tpa
th
...
...
... Change modulation
format, FEC, etc.
Shift over unused
spectrum (push-pull)
Reroute
Figure 2: ORCHESTRA’S hierarchical control and monitoring plane.
2.1.3. DECIDE Cross-layer optimization is the key to unleashing the full potential of new generation flexible transceivers deployed today. The introduction of optical flexible networking has vastly increased the optimization dimensions over a traditional WDM optical network. New types of optimization problems are emerging, while the state-of-the-art algorithms are based on worst-case physical layer estimates and gross margins: interference effects and ageing of
ORCHESTRA ORCHESTRA_D2.1
Optical peRformanCe monitoring enabling dynamic networks using a Holistic cross-layEr, Self-configurable Truly flexible appRoAch
Created on 01.10.2015
D2.1 – ORCHESTRA dynamic optical network, reference scenarios and use cases
www.orchestraproject.eu 13/73
equipment are two typical issues in which worst-case (pessimistic) assumptions are used today, rendering the provisioning decisions largely sub-optimal.
ORCHESTRA will develop a library of optimization algorithms to target a wide set of use cases, ranging from traditional use cases such as network planning and network upgrade, hard-failure handling, to more specific ones, such as hard failure prediction [8], handling of performance degradation (e.g., due to high degradation after fixing failures), or by operating the network under low margins among others. So the algorithms developed will target a mixed set of use cases initiated in central controller (e.g., ABNO controller), or in the control and monitoring (C&M) infrastructure.
Utilizing the advanced monitoring functions, ORCHESTRA optimization algorithms will achieve true cross-layer optimization, yielding a network with unprecedented efficiency in the use of capacity (e.g., lower the margins of the transceivers, enabling them to use their capabilities to the fullest extent) and increased availability (e.g., hard failure prediction).
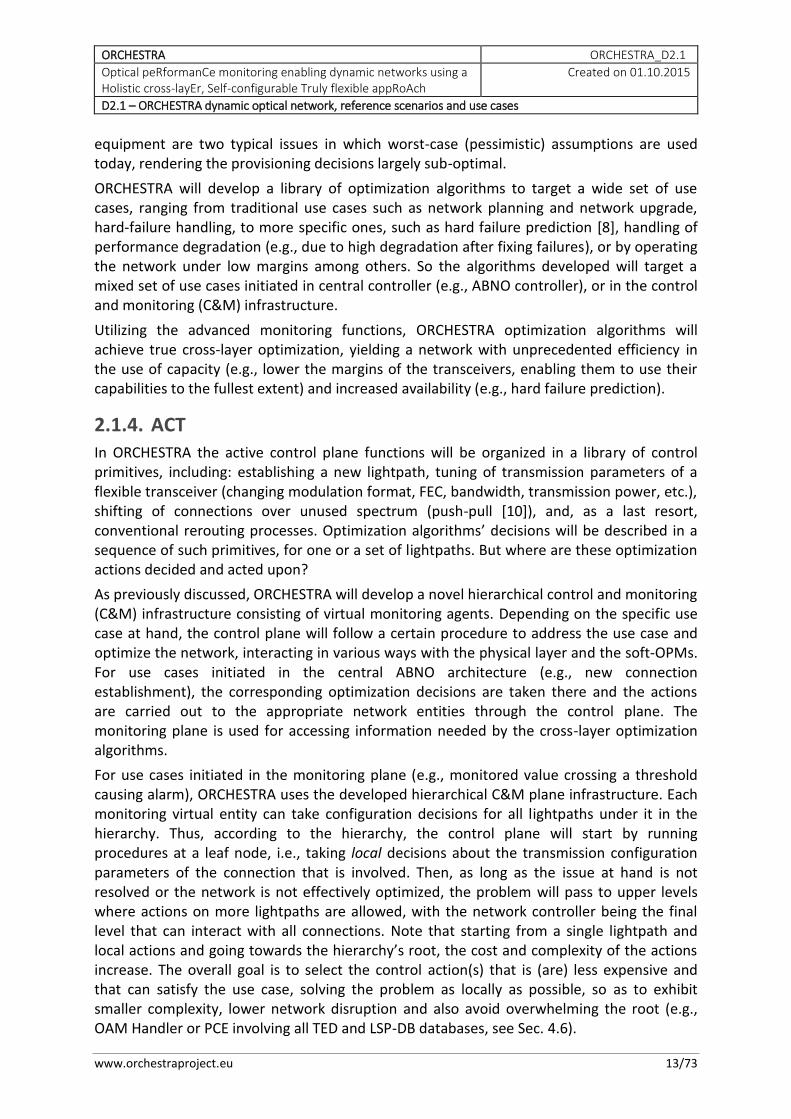
2.1.4. ACT In ORCHESTRA the active control plane functions will be organized in a library of control primitives, including: establishing a new lightpath, tuning of transmission parameters of a flexible transceiver (changing modulation format, FEC, bandwidth, transmission power, etc.), shifting of connections over unused spectrum (push-pull [10]), and, as a last resort, conventional rerouting processes. Optimization algorithms’ decisions will be described in a sequence of such primitives, for one or a set of lightpaths. But where are these optimization actions decided and acted upon?
As previously discussed, ORCHESTRA will develop a novel hierarchical control and monitoring (C&M) infrastructure consisting of virtual monitoring agents. Depending on the specific use case at hand, the control plane will follow a certain procedure to address the use case and optimize the network, interacting in various ways with the physical layer and the soft-OPMs. For use cases initiated in the central ABNO architecture (e.g., new connection establishment), the corresponding optimization decisions are taken there and the actions are carried out to the appropriate network entities through the control plane. The monitoring plane is used for accessing information needed by the cross-layer optimization algorithms.
For use cases initiated in the monitoring plane (e.g., monitored value crossing a threshold causing alarm), ORCHESTRA uses the developed hierarchical C&M plane infrastructure. Each monitoring virtual entity can take configuration decisions for all lightpaths under it in the hierarchy. Thus, according to the hierarchy, the control plane will start by running procedures at a leaf node, i.e., taking local decisions about the transmission configuration parameters of the connection that is involved. Then, as long as the issue at hand is not resolved or the network is not effectively optimized, the problem will pass to upper levels where actions on more lightpaths are allowed, with the network controller being the final level that can interact with all connections. Note that starting from a single lightpath and local actions and going towards the hierarchy’s root, the cost and complexity of the actions increase. The overall goal is to select the control action(s) that is (are) less expensive and that can satisfy the use case, solving the problem as locally as possible, so as to exhibit smaller complexity, lower network disruption and also avoid overwhelming the root (e.g., OAM Handler or PCE involving all TED and LSP-DB databases, see Sec. 4.6).
ORCHESTRA ORCHESTRA_D2.1
Optical peRformanCe monitoring enabling dynamic networks using a Holistic cross-layEr, Self-configurable Truly flexible appRoAch
Created on 01.10.2015
D2.1 – ORCHESTRA dynamic optical network, reference scenarios and use cases
www.orchestraproject.eu 14/73
A special case of local actions is of particular interest, namely actions involving just a certain transmitter and the corresponding receiver, which can be viewed as a sort of automatic self-tuning of a lightpath. Assuming that the underlying network is quite complicated, having transceivers with self-tuning capabilities (e.g., adjusting FEC or modulation format) can be very beneficial. These transceivers can be used in different networks with totally different characteristics, from the type of fiber to the amplifiers and optical switches that are used. Note that even a network that is owned by a single operator may be heterogeneous. The transceivers envisioned in ORCHESTRA, packed with self-adjusting capabilities enabled by their enhanced impairment estimation-monitoring functionalities, can yield superior performance and operate close to their maximum capabilities in any type of network and under any capacity requirement.
2.2. The ORCHESTRA network functionalities The description of the ORCHESTRA network control loop defined some network functionalities that could be considered in different ways, depending on the context in which they are used. Considering the introductory purpose of this section, we specify these network functionalities in more details, in order to avoid misunderstandings and ambiguous interpretations.
The ORCHESTRA network functionalities are categorized in 4 sets, and in particular:
Monitors (MO)
Correlation (CO)
Control Plane (CP)
Optimization (OP)
In short these four sets are described by the initials: MO, CO, CP, OP, respectively, and the functionalities in each set are numbered in increasing order. For example, “MO.2” refers to the second functionality of monitors. This notation can be used to refer to the related functionalities in this deliverable (this is done in the use cases – Section 5) or future deliverables.
2.2.1. Monitors As mentioned previously, the monitors in the ORCHESTRA network may work in a threshold-based, or on demand, or periodic manner.
MO.1 Failure alarm: threshold-based alarms are generated by the receiver’s agent when a monitored parameter (e.g., OSNR, NLI, BER) becomes lower than a given threshold. These are referred to as soft failure alarms. This functionality requires that we can set thresholds per agent and per monitored parameter. It has to be noted that the thresholds can be applied to the instantaneous value or to the average value of the parameter. Failure alarms include also hard failure alarms of two types: actual or predicted hard failure.
MO.2 On-demand monitoring: collect the (instantaneous or average) value of a monitored parameter on-demand when explicitly requested by the control and monitoring plane.
MO.3 Periodic monitoring: monitoring agents report the (instant or average) values of a monitored parameter in a specified period. This requires that we can set the period per agent and per monitored parameter.
ORCHESTRA ORCHESTRA_D2.1
Optical peRformanCe monitoring enabling dynamic networks using a Holistic cross-layEr, Self-configurable Truly flexible appRoAch
Created on 01.10.2015
D2.1 – ORCHESTRA dynamic optical network, reference scenarios and use cases
www.orchestraproject.eu 15/73
2.2.2. Correlation functionalities Correlation algorithms run at the monitoring agents of the hierarchical monitoring architecture or at the OAM Handler of the central controller (see Sec. 4.6).
CA.1 Alarms correlation: Soft or hard failure alarms are correlated (i) at the monitoring agents in order to suppress the number of alarms propagated to higher hierarchical levels, and/or localize the failure (in order to apply a local remedy action at the agent), and (ii) in the OAM Handler of the central controller to localize the failure.
CA.2 Monitoring information correlation: correlate monitored values to (i) improve the accuracy of monitored parameter, (ii) identify the cause of a QoT degradation, (iii) estimate QoT of a yet unestablished lightpath (before trying to establish it), and (iv) estimate the effect of establishing a new lightpath on existing ones (before actually establishing it).
2.2.3. Control plane functionalities CP.1 Establish a new lightpath: configure transponder (if it is tunable specify the transmission options) and switches (wavelength, spectrum) to establish the lightpath.
CP.2 Re-configure a lightpath: Perform any, or both, of the following: (i) change the configuration of the transponder (if it is tunable specify the new transmission options), (ii) change the configuration of switches (in case that the spectrum utilized by the lightpath has to change).
CP.3 Push-pull a lightpath: shift a lightpath in the spectrum domain in a hitless manner. Thanks to DSP into coherent receiver, the central frequency at the transmitter can be shifted without any loss of data. Indeed, the automatic frequency control – typically implemented in DSP of coherent receivers – is able to follow such a shift in a hitless way. This requires, apart from configuring the transponder to perform the shifting operation, to configure the intermediate switches as well. Note that this action relies on flex-grid technology and thus cannot be used if the underlying network employs fixed-grid switches (see the related discussion in Section 4).
CP.4 Reroute a lightpath: typically this is done in a make-before-break manner. The new lightpath is established using a new transponder with the new path/spectrum specified, using control plane action CP1, and then traffic is switched, and the previous lightpath is torn down so that the previously used resources (transponder and spectrum at the links/nodes) are freed.
2.2.4. Optimization algorithms functionalities Optimization algorithms run at the monitoring agents or at the PCE (see Sec. 4.6) which exploits monitoring information provided by the OAM Handler.
OP.1 Establish a new lightpath: this type of algorithm runs at the PCE and selects what is needed to perform CP1 - the transponder to use (its configuration if it is tunable), the path and wavelength/spectrum slots for establishing the new lightpath. In this selection process the algorithm can take into account monitoring information by using correlation algorithms (CO.2) and/or provided by the OAM Handler.
OP.2 Lightpath self-configuration: decide how to tune the transmission parameters (e.g., modulation format, baudrate, and FEC) of an established lightpath. This can be done locally,
ORCHESTRA ORCHESTRA_D2.1
Optical peRformanCe monitoring enabling dynamic networks using a Holistic cross-layEr, Self-configurable Truly flexible appRoAch
Created on 01.10.2015
D2.1 – ORCHESTRA dynamic optical network, reference scenarios and use cases
www.orchestraproject.eu 16/73
in the sense that the algorithm runs at the agent of the lightpath, or at a higher level of the monitoring system, but it can also run at the PCE. A key constraint is that this configuration does not affect any other lightpath and does not require a re-configuration of the switches (i.e. it does not result in the change of the spectrum used by the lightpath).
OP.3 Lightpath re-optimization: decide how to tune the transmission parameters (e.g., modulation format, baud-rate, FEC and spectrum used) or decide to push-pull or reroute an already established lightpath. Compared to the previous self-configuration case, the difference is that such algorithm runs only at the PCE and might result in the change of the spectrum used by the lightpath.
OP.4 Network re-optimization: This algorithm runs at the PCE and is the combinatorial version of OP3. So it decides on the re-optimization of one or more lightpaths.
OP.5 Network planning under low margins: combinatorial algorithms that decide how to plan the network under low margins.
The above listed correspond to basic functionalities. Starting from basic functionalities, more complex ones could be obtained. A complex functionality that seems quite important in ORCHESTRA is the handling of a soft-failure, describe next.
Soft failure handling: It starts as a soft failure alarm (MO1), then correlation is used to suppress the alarm (CO.1), and to collect more information and identify the problem (CO.2) at an agent or at the OAM Handler. Depending on the alarm type, a local lightpath self-configuration (OP.2), or a lightpath re-optimization (OP.3), or a network re-optimization (OP4) is used, and related control plane actions (CO.2, CO.3, CO.4) are applied.
2.3. ORCHESTRA Keywords The title of D2.1 is “ORCHESTRA dynamic optical network, reference scenarios and use cases”. As the present document is the first technical deliverable of the project, it is essential, in order to avoid misunderstandings to give the meaning of these keywords, which will be used during the entire duration of the Project.
Dynamic. In ORCHESTRA dynamic traffic is considered both as (i) native traffic dynamicity (meaning that new lightpaths are dynamically set-up and old ones are torn-down, or that the connection parameters are modified to better follow the traffic demand), and (ii) events triggered dynamicity (e.g., hard failures, or degradations, etc). For the ORCHESTRA scope, a network capable of quickly seting-up, tearing-down or modifying connection parameters (because it is equipped by an efficient control plane) is considered.
Optical network. In ORCHESTRA only the optical layer is considered. The context is core optical network, adopting coherent technology. It will be possible to study metro optical networks (where coherent technology has not been adopted yet). Electrical (OTN or packet transport) networks are out of the scope of the Project. Although the focus is on the optical layer, it is possible to consider trigger events there originated by the electrical layer.
Reference scenarios. The most useful scenario is a coherent optical core network. In addition, future metro networks, involving coherent channels and eventually populated by alien wavelengths, might complete the ORCHESTRA reference

ORCHESTRA ORCHESTRA_D2.1
Optical peRformanCe monitoring enabling dynamic networks using a Holistic cross-layEr, Self-configurable Truly flexible appRoAch
Created on 01.10.2015
D2.1 – ORCHESTRA dynamic optical network, reference scenarios and use cases
www.orchestraproject.eu 17/73
scenarios. Traffic exchanged among data centers could benefit from the ORCHESTRA solutions, given the intrinsic dynamicity of data flows among geographical distributed data-centers.
Use cases. Five use cases are defined in order to validate and demonstrate the efficiency of the ORCHESTRA concept (OBSERVE DECIDE ACT) from an economic and energy consumption point of view. The competitive advantage expected from network implementation of the features envisaged by ORCHESTRA is, besides a key improvement in the offered quality of service (increased network availability) and the dynamicity with which it is offered, a reduction of investment (CAPEX) and operating and maintenance costs (OPEX).
ORCHESTRA ORCHESTRA_D2.1
Optical peRformanCe monitoring enabling dynamic networks using a Holistic cross-layEr, Self-configurable Truly flexible appRoAch
Created on 01.10.2015
D2.1 – ORCHESTRA dynamic optical network, reference scenarios and use cases
www.orchestraproject.eu 18/73
3. Optical Performance Monitors (OPMs) Today’s optical networks are static and are built to operate within well-defined specifications, usually taking into account end-of-life, worst-case margins. ORCHESTRA aims to change this paradigm with optical performance monitoring as a key enabling component of the concept. The ability to observe the state of the physical layer accurately and at all times allows the control plane to efficiently allocate available resources, and do so in a dynamic fashion and in response to changing network conditions. These could be either due to varying transmission impairments along the fiber transmission path, or because of changing client-side bandwidth demands, requiring changes in the parameters of the optical channel (e.g., modulation format, baud-rate, etc.).
The ability to measure the network infrastructure and resources in a real-time fashion is typically known as network monitoring. In order to enable robust, self-managed, and smart operation, OPM should be able to accurately measure and rapidly reflect the physical states of network elements, paths, and the quality of propagating data signals. The ability to measure both the data quality and the network path’s physical state in a real-time fashion has been traditionally proven as difficult due to several aspects: large number of impairments, variety of data formats being introduced with the advent of coherent technology, variety of data rates, and continuous growth and change of the network structure. As a result, multiple impairments that cause the alarms must be isolated, localized, and compensated, requiring real-time monitoring.
Routing in current networks typically relies on either a shortest-path calculation or on paths that satisfy certain network Quality of Service (QoS) constraints such as, e.g., data rate, delay or packet loss. With the advent of coherent technology, however, transparency domains are growing, data rates are increasing, and channel spacing is becoming denser than ever; these changes are offering the opportunity to increase capacity and efficiency of future optical networks. To this end, ORCHESTRA’s vision is to employ optimization algorithms that also take into account the variable physical state of the network in an accurate way and achieve what we call true-cross layer optimization. Decisions can be updated dynamically using OPM information, therefore reflecting the actual state of the physical paths and the QoS of the channels (accounting for ageing, increased interference due to traffic evolution, etc). OPM is therefore a vital part of the impairment-aware routing operation that is envisioned [11][12].
The purpose of this section is to give a brief overview of performance monitoring for optical networks, putting it in the context of ORCHESTRA’s technology and requirements. A more detailed description of the OPM concept is ongoing, and will be reported in Deliverable D2.2 (“Impairment monitoring: from a hardware to a software ecosystem”), which will be completed by M12. D2.2 will include the findings of Milestone MS1 (“First internal report on impairment effects”) that details linear and nonlinear optical channel impairments, as well as the state of the art in associated DSP monitoring algorithms for coherent optical systems.
3.1. Overview of OPM The hierarchical and integrated performance monitoring layer of ORCHESTRA (Section 2.1.1) is populated by data coming from Optical Performance Monitors (OPMs). More specifically,
ORCHESTRA ORCHESTRA_D2.1
Optical peRformanCe monitoring enabling dynamic networks using a Holistic cross-layEr, Self-configurable Truly flexible appRoAch
Created on 01.10.2015
D2.1 – ORCHESTRA dynamic optical network, reference scenarios and use cases
www.orchestraproject.eu 19/73
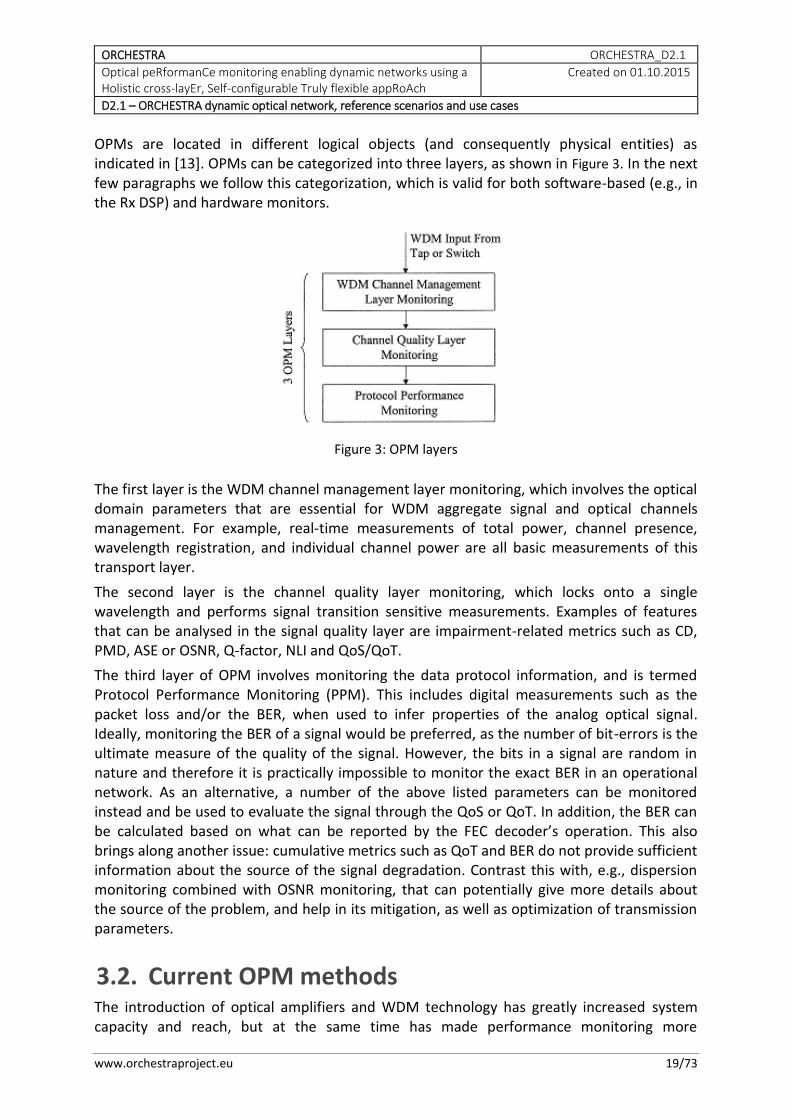
OPMs are located in different logical objects (and consequently physical entities) as indicated in [13]. OPMs can be categorized into three layers, as shown in Figure 3. In the next few paragraphs we follow this categorization, which is valid for both software-based (e.g., in the Rx DSP) and hardware monitors.
Figure 3: OPM layers
The first layer is the WDM channel management layer monitoring, which involves the optical domain parameters that are essential for WDM aggregate signal and optical channels management. For example, real-time measurements of total power, channel presence, wavelength registration, and individual channel power are all basic measurements of this transport layer.
The second layer is the channel quality layer monitoring, which locks onto a single wavelength and performs signal transition sensitive measurements. Examples of features that can be analysed in the signal quality layer are impairment-related metrics such as CD, PMD, ASE or OSNR, Q-factor, NLI and QoS/QoT.
The third layer of OPM involves monitoring the data protocol information, and is termed Protocol Performance Monitoring (PPM). This includes digital measurements such as the packet loss and/or the BER, when used to infer properties of the analog optical signal. Ideally, monitoring the BER of a signal would be preferred, as the number of bit-errors is the ultimate measure of the quality of the signal. However, the bits in a signal are random in nature and therefore it is practically impossible to monitor the exact BER in an operational network. As an alternative, a number of the above listed parameters can be monitored instead and be used to evaluate the signal through the QoS or QoT. In addition, the BER can be calculated based on what can be reported by the FEC decoder’s operation. This also brings along another issue: cumulative metrics such as QoT and BER do not provide sufficient information about the source of the signal degradation. Contrast this with, e.g., dispersion monitoring combined with OSNR monitoring, that can potentially give more details about the source of the problem, and help in its mitigation, as well as optimization of transmission parameters.
3.2. Current OPM methods The introduction of optical amplifiers and WDM technology has greatly increased system capacity and reach, but at the same time has made performance monitoring more
ORCHESTRA ORCHESTRA_D2.1
Optical peRformanCe monitoring enabling dynamic networks using a Holistic cross-layEr, Self-configurable Truly flexible appRoAch
Created on 01.10.2015
D2.1 – ORCHESTRA dynamic optical network, reference scenarios and use cases
www.orchestraproject.eu 20/73
challenging. In current networks, performance monitoring in the physical layer primarily involves a combination of individual component alarms, aggregate power measurement, and in some cases, optical channel monitoring (OCM). Examples of parameters that can trigger component alarms include amplifier pump laser power or temperature controller limits. This is an indirect approach to OPM, working on the assumption that if all of the components are working correctly, then the signal is considered to be good. While this is a very powerful technique that comes for free, it unfortunately cannot monitor the signal failures that violate this assumption. OCM includes measurements of channel power, presence, and wavelength. From an OPM perspective, channel monitoring as well as aggregate power monitoring are extensions of component alarms in that they indirectly measure signal quality. The term ‘OPM’ is often used to designate OCM devices with the additional capability of monitoring other signal quality metrics such as OSNR, chromatic dispersion (CD) and polarization mode dispersion (PMD).
The evolution of optical communication systems towards more advanced digital formats relying on coherent detection has in turn created a need for more sophisticated performance monitoring. A fortunate side effect of the adoption of coherent technology that has enabled improved system reach and capacity is that it can simultaneously be used to enhance system performance monitoring. Many performance metrics can be extracted from the same DSP algorithms used for demodulation of the optical dual-polarization QPSK/QAM signals. Moreover, the digital receiver can be augmented with additional algorithms to monitor impairments that cannot be estimated via conventional DSP procedures. Note that in these cases, the cost of the performance monitors can be fully justified on the basis of the system’s improved performance. Not all monitors can be so easily justified, but service providers have a history of deploying additional equipment when necessary. There is no level of performance monitoring that is superfluous; there are only levels that are too expensive.
In the next subsections some of the key OPM parameters that are relevant to ORCHESTRA are briefly outlined. A brief description of monitoring methods is given, including hardware and software implementations.
3.2.1. Optical Power Optical power monitoring consitutes the most widely deployed type of monitors in optical networks, owing to its low cost and implementation simplicity [12]. The power of all transmit WDM channels can be measured using a tap, in order to obtain a small fraction (<5%) of the signal power, and low-bandwidth photo-detectors. Monitoring the power on a per-channel basis requires a tunable filter to select the desired channel, or an optical demultiplexer coupled to arrays of photo-detectors for parallel measurement. Power monitors are strategically placed and are present at multiple points and components of the network, including at optical transmitters, multiplexer/demultiplexers, amplification stages, optical cross-connects (OXCs) and receivers.
3.2.2. Optical signal-to-noise ratio Optical signal-to-noise ratio (OSNR) is one of the most important parameters for estimating the quality of a signal directly in the physical layer, as it is directly related to the bit error rate (BER) of the transmitted signal through an optically amplified link. Moreover, since the OSNR
ORCHESTRA ORCHESTRA_D2.1
Optical peRformanCe monitoring enabling dynamic networks using a Holistic cross-layEr, Self-configurable Truly flexible appRoAch
Created on 01.10.2015
D2.1 – ORCHESTRA dynamic optical network, reference scenarios and use cases
www.orchestraproject.eu 21/73
is transparent to both the bit rate and the modulation format of the optical signal, it is ideally suited for use in dynamically reconfigurable optical networks. It can be used for link setup and optimization, root-cause analysis of system problems, the setup of an early signal degradation alarm, resilience mechanism activation, service-level agreement (SLA) verification, etc. The capability to monitor OSNR on a per-channel basis is therefore imperative for the efficient operation and maintenance of such dynamic optical networks.
OSNR monitoring hardware-based implementations are mostly using out-of-band measurement techniques, such as the linear interpolation method [14], the use of tunable optical filtering [15] and array waveguide grating (AWG)-based monitors [16]. Linear interpolation is based on the spectral analysis of the WDM signals and derives the OSNR by interpolating the out-of-band noise level into the signal band, namely by estimating the in-band noise level using the out-of-band noise level. However, such a technique suffers from the use of optical filtering and routing in the link path since the out-of-band noise is filtered out and therefore the interpolating method leads to severe underestimates of the in-band OSNR level. In-band OSNR methods attempt to derive the OSNR level by estimating the in-band noise level directly, even in the presence of optical filters. Such approaches include spectral analysis after frequency down-conversion, polarisation nulling [17], polarisation diversity [18] and optical delay interferometer [19]. DSP-based methods for application in the coherent digital receiver include magnitude statistics approaches such as in [20], or those based on the receiver’s 2x2 MIMO adaptive equalizer taps [21].
3.2.3. Chromatic Dispersion Chromatic dispersion occurring in the fiber severely affects high-bitrate optical systems and causes signal distortions leading to BER degradation. CD is a linear effect that can be compensated using either optical dispersion compensation modules (DCM) or by electronic mitigation (nowadays using equalizer filters in the Rx DSP). The latter is preferred in modern networks employing coherent technology, as it eliminated the need for DCMs that are inherently nonlinear and introduce performance penalties. With the development of reconfigurable optical networking, any change in the path lengths as a result of optical switching will produce a different amount of accumulated CD, reducing the performance of fixed CD compensators. Moreover, CD is not a static phenomenon and can change with environment conditions such as temperature, pressure (in deep sea for example) and tension variations. For adaptive dispersion compensation, it is necessary to develop an appropriate dispersion-monitoring technique.
Conventional CD monitoring methods relies on pilot tone-based methods, where the CD-induced phase mismatch between the pilot tone spectral components is measured (e.g., [22]). DSP-based schemes are also abundant, as in the blind, adaptive filter approach used in [23].
3.2.4. Polarization Effects Polarization Mode Dispersion (PMD) is a crucial limitation for high-bitrate WDM systems operating because of high-PMD legacy fibres, in-line components or PMD accumulation in long-haul systems with even moderate PMD levels. It is a linear but stochastic effect that varies with time and environmental conditions. Therefore PMD must be monitored and mitigated in optical transparent/translucent systems. As PMD varies on a millisecond
ORCHESTRA ORCHESTRA_D2.1
Optical peRformanCe monitoring enabling dynamic networks using a Holistic cross-layEr, Self-configurable Truly flexible appRoAch
Created on 01.10.2015
D2.1 – ORCHESTRA dynamic optical network, reference scenarios and use cases
www.orchestraproject.eu 22/73
timescale, electrical or optical PMD mitigators must be dynamic, with a feed-forward or feedback loop that monitors the quality of the incoming signal and provides a control signal to the PMD equalizer. PMD is caused by the different transmission speeds of the signal’s two states of polarization (SOPs) as they propagate along a fiber having a small birefringence. It is the random variation of birefringence along the fiber that makes PMD statistically random quantity. PMD can be characterized by the Differential Group Delay (DGD) between the two principle states of polarization (PSPs) after a given length of fiber.
Another polarization-related impairment is Polarization Dependent Loss (PDL), expressed as the ratio of the maximum to minimum transmission (in dB) as the launch polarization is rotated through all possible states. Due to non-negligible PDL in various in-line optical components (e.g., switches, isolators, couplers, filters, and circulators) the optical pulse splits between two orthogonal polarization modes that attenuate each pulse replica differently. PDL can cause optical power fluctuations resulting in random OSNR variations due to polarization-state wandering during propagation.
A number of monitoring techniques are based on spectral analysis of RF tones, as in the example of [24]. A clock tone-based technique was demonstrated for NRZ and DPSK signals that incorporates an unbalanced Mach-Zehnder delay line interferometer (DLI) and can monitor CD and PMD simultaneously [25]. A CD-insensitive method for QPSK has been demonstrated in [26], where a DGD element coupled with a passive polarisation beam splitter (PBS) was used to create an interferometric filter transfer, leading to variations in the power of the detected low RF spectral content that are related to the DGD of the link and not affected by CD [27]. Other common schemes include those based on the degree of polarization (DOP). These are simple, and unaffected by other degrading effects such as CD. PDL can be measured using the polarization scanning technique or Mueller method [28]. Finally, in the digital coherent receiver, polarization effects can be readily extracted from the DSP algorithm used for polarization demultiplexing of the incoming signal (i.e. from the 2x2 MIMO adaptive equalizer taps) [29].
3.2.5. Q-factor and BER The BER is the ultimate parameter for monitoring the QoT of a channel. In live traffic, such a measurement can be performed at the Rx-side with transmitted test sequences. In opaque networks, BER monitoring can be performed at every regeneration site and is a simple tool for maintenance and fault localisation procedures. However, this is impossible in transparent networks. One option to overcome this is to use a polling approach, where a tap followed by a tunable filter and the receiver side of a transponder is used. In order to be non-intrusive, a 1-2% optical tap can be used. An alternative solution is to monitor the Q-factor that is closely related to the BER.
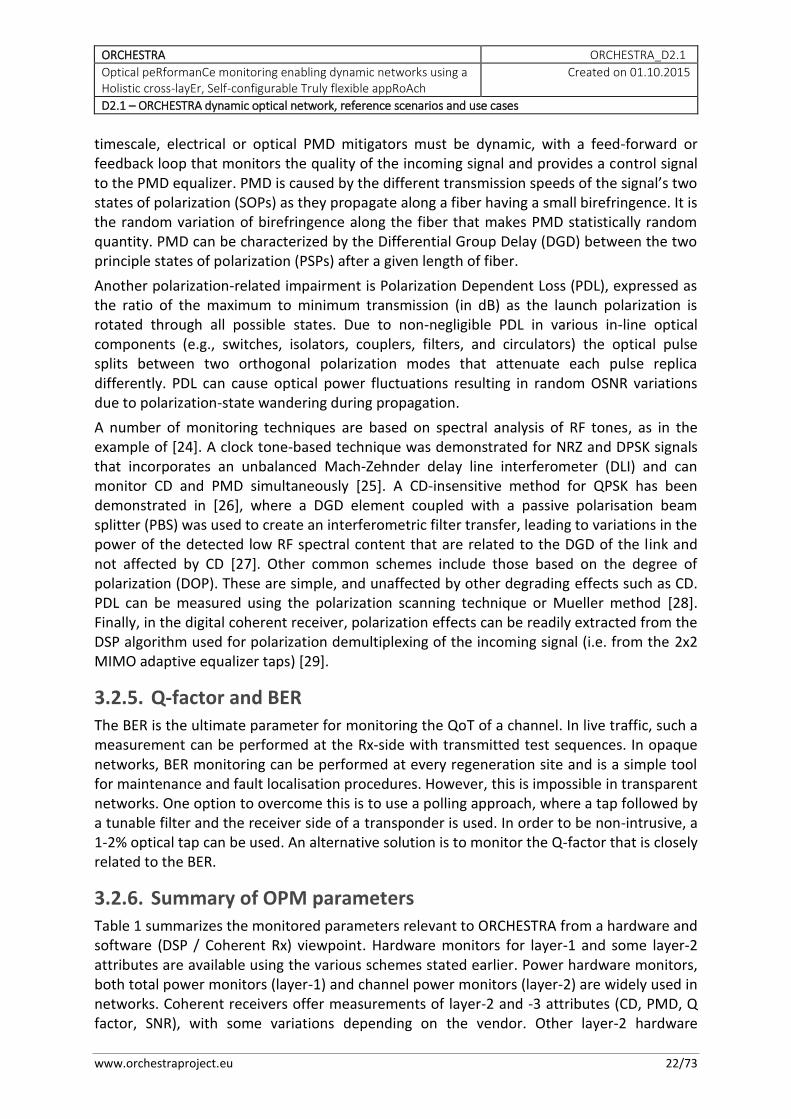
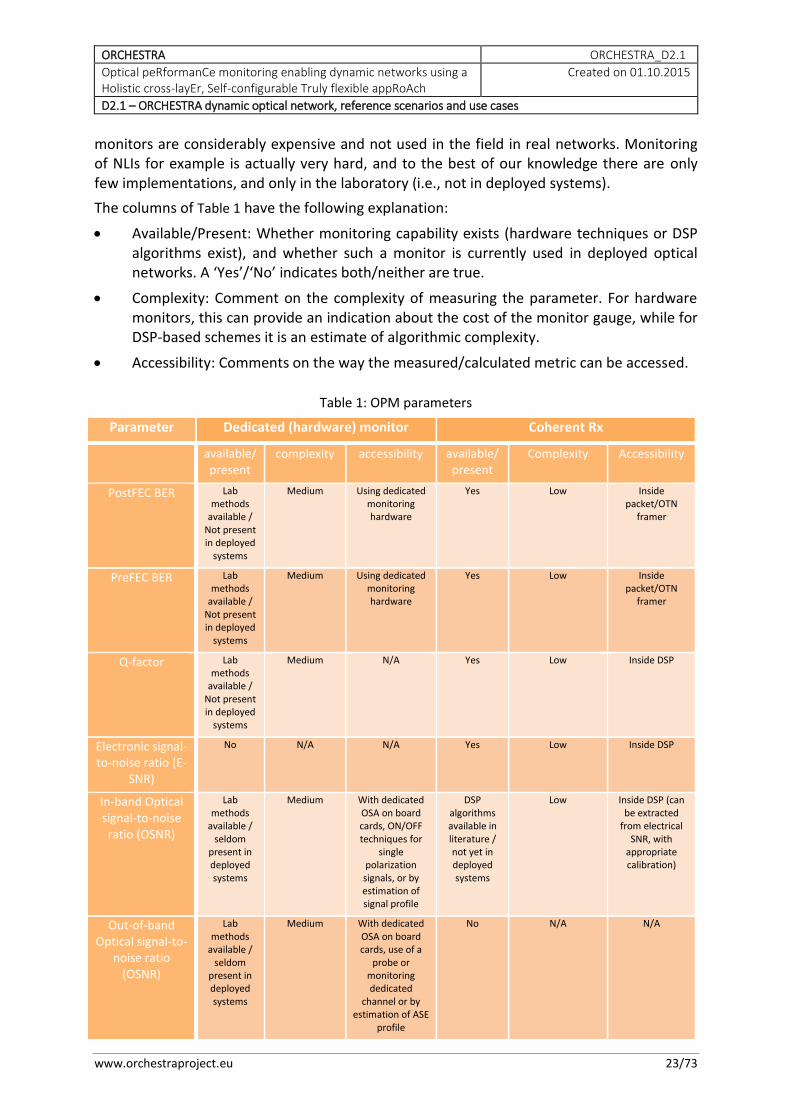
3.2.6. Summary of OPM parameters Table 1 summarizes the monitored parameters relevant to ORCHESTRA from a hardware and software (DSP / Coherent Rx) viewpoint. Hardware monitors for layer-1 and some layer-2 attributes are available using the various schemes stated earlier. Power hardware monitors, both total power monitors (layer-1) and channel power monitors (layer-2) are widely used in networks. Coherent receivers offer measurements of layer-2 and -3 attributes (CD, PMD, Q factor, SNR), with some variations depending on the vendor. Other layer-2 hardware
ORCHESTRA ORCHESTRA_D2.1
Optical peRformanCe monitoring enabling dynamic networks using a Holistic cross-layEr, Self-configurable Truly flexible appRoAch
Created on 01.10.2015
D2.1 – ORCHESTRA dynamic optical network, reference scenarios and use cases
www.orchestraproject.eu 23/73
monitors are considerably expensive and not used in the field in real networks. Monitoring of NLIs for example is actually very hard, and to the best of our knowledge there are only few implementations, and only in the laboratory (i.e., not in deployed systems).
The columns of Table 1 have the following explanation:
Available/Present: Whether monitoring capability exists (hardware techniques or DSP algorithms exist), and whether such a monitor is currently used in deployed optical networks. A ‘Yes’/‘No’ indicates both/neither are true.
Complexity: Comment on the complexity of measuring the parameter. For hardware monitors, this can provide an indication about the cost of the monitor gauge, while for DSP-based schemes it is an estimate of algorithmic complexity.
Accessibility: Comments on the way the measured/calculated metric can be accessed.
Table 1: OPM parameters
Parameter Dedicated (hardware) monitor Coherent Rx
available/ present
complexity accessibility available/present
Complexity Accessibility
PostFEC BER Lab methods
available / Not present in deployed
systems
Medium Using dedicated monitoring hardware
Yes Low Inside packet/OTN
framer
PreFEC BER Lab methods
available / Not present in deployed
systems
Medium Using dedicated monitoring hardware
Yes Low Inside packet/OTN
framer
Q-factor Lab methods
available / Not present in deployed
systems
Medium N/A Yes Low Inside DSP
Electronic signal-to-noise ratio (E-
SNR)
No N/A N/A Yes Low Inside DSP
In-band Optical signal-to-noise ratio (OSNR)
Lab methods
available / seldom
present in deployed systems
Medium With dedicated OSA on board cards, ON/OFF techniques for
single polarization signals, or by estimation of signal profile
DSP algorithms available in literature / not yet in deployed systems
Low Inside DSP (can be extracted
from electrical SNR, with
appropriate calibration)
Out-of-band Optical signal-to-
noise ratio (OSNR)
Lab methods
available / seldom
present in deployed systems
Medium With dedicated OSA on board cards, use of a
probe or monitoring dedicated
channel or by estimation of ASE
profile
No N/A N/A
ORCHESTRA ORCHESTRA_D2.1
Optical peRformanCe monitoring enabling dynamic networks using a Holistic cross-layEr, Self-configurable Truly flexible appRoAch
Created on 01.10.2015
D2.1 – ORCHESTRA dynamic optical network, reference scenarios and use cases
www.orchestraproject.eu 24/73
Non-linear Impairments
No N/A N/A DSP-based algorithms
being researched / Not available in deployed
systems
High Inside DSP
Non-linear phase noise
No N/A N/A DSP-based algorithms
being researched / Not available in deployed
systems
Unknown Inside DSP
Polarization Mode Dispersion
(PMD)
Lab methods
available / Not present in deployed
systems
Medium Using dedicated monitoring hardware
Yes Low Inside DSP
Chromatic Dispersion (CD)
Lab methods
available / Not present in deployed
systems
Medium Using dedicated monitoring hardware
Yes Low Inside DSP
Differential group delay
(DGD)
Lab methods
available / Not present in deployed
systems
Medium Using dedicated monitoring hardware
Yes Low Inside DSP
Polarization dependent loss
(PDL)
Lab methods
available / Not present in deployed
systems
Medium Using dedicated monitoring hardware
Yes Low Inside DSP
States of polarization
(SOP)
Lab methods
available / Not present in deployed
systems
Medium Using dedicated monitoring hardware
Yes Low Inside DSP
Channel power Yes Low Using tap coupler, filter (or
DEMUX) and PD(s)
Yes Low RX, WSS and ROADMs
Total power Yes Low Either inline or using tap coupler
and PD
Yes Low EDFAs WSS and ROADMs
OPMs provide data that should be collected, analysed and correlated to network performance and network events. This is realised by the DECIDE section of the ORCHESTRA process. Various performance levels are required depending on network architecture and traffic scenarios. Moreover, according to the provisioned equipment and its level of reliability, various events could happen in response to external stimuli, with different impact on traffic survivability and network efficiency. For this reason, it is important to describe the various network scenarios and use cases that make use of ORCHESTRA’s advanced OPMs functionalities.
ORCHESTRA ORCHESTRA_D2.1
Optical peRformanCe monitoring enabling dynamic networks using a Holistic cross-layEr, Self-configurable Truly flexible appRoAch
Created on 01.10.2015
D2.1 – ORCHESTRA dynamic optical network, reference scenarios and use cases
www.orchestraproject.eu 25/73
4. Reference scenarios
The second step in forming the basis for ORCHESTRA studies is the definition of the ORCHESTRA “perimeter”, that is, the kind of networks the solutions to be produced will apply to, in terms of technology and size. Towards this purpose, this chapter identifies the edges of this perimeter as follows:
The technology: pure optical coherent transmission, flex-grid in the core; in the metro, non-coherent and fixed-grid solutions may also be considered.
The general network framework: an optical network, composed of two segments (metro and core); additionally, geographically distributed data centers and the adoption of alien wavelengths as a disrupting solution are considered as well.
The topology: three network topologies have been identified and are reported (pan-European, National wide and metropolitan size).
The reference control and management framework: the ABNO architecture is adopted.
The reference ageing model: a generic model that captures the effects of ageing on network performance and can be used in network evolution studies.
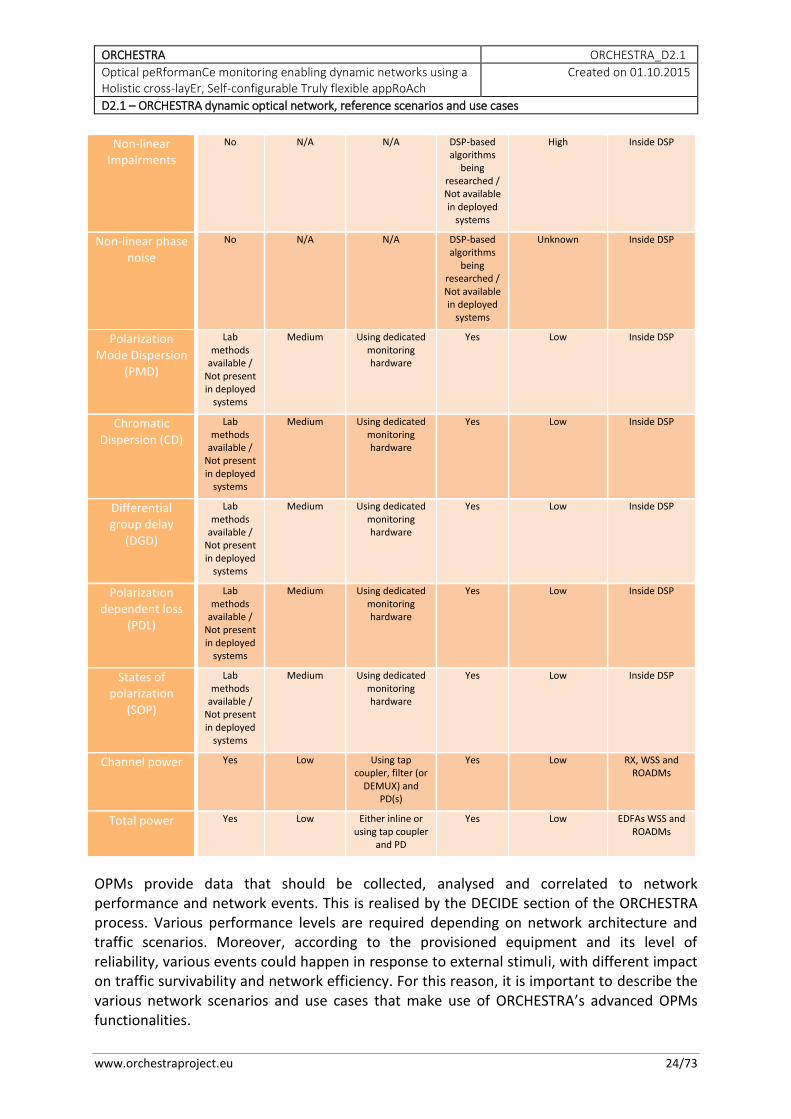
4.1. Reference technology As reference technology, ORCHESTRA will cover a very large area of possible alternatives, depicted in Figure 4.
Figure 4: example of optical link
In more details, ORCHESTRA will consider:
Both EDFA and Raman link amplification;
Various fiber types, such as conventional SMF, non zero dispersion shifted, pure silica core fibers;
Mainly flex-grid wavelength allocation, particularly in the core segment. In metro networks, fixed-grid use cases will also be considered, as a special case of flex-grid.
ORCHESTRA ORCHESTRA_D2.1
Optical peRformanCe monitoring enabling dynamic networks using a Holistic cross-layEr, Self-configurable Truly flexible appRoAch
Created on 01.10.2015
D2.1 – ORCHESTRA dynamic optical network, reference scenarios and use cases
www.orchestraproject.eu 26/73
Multi-receivers: even if each channel has just one receiver (i.e., one laser one DSP) it is possible to correlate information extracted by different DSPs located at different cards.
ROADM nodes: colorless, directionless and eventually contentionless architectures.
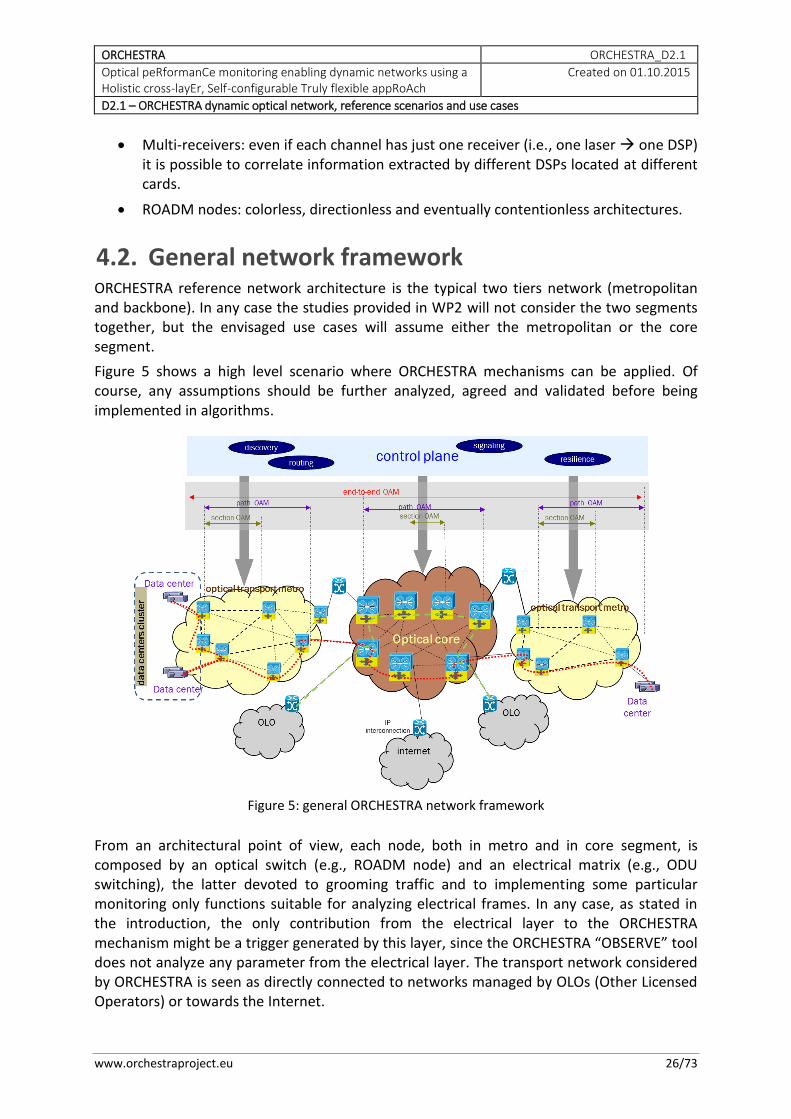
4.2. General network framework ORCHESTRA reference network architecture is the typical two tiers network (metropolitan and backbone). In any case the studies provided in WP2 will not consider the two segments together, but the envisaged use cases will assume either the metropolitan or the core segment.
Figure 5 shows a high level scenario where ORCHESTRA mechanisms can be applied. Of course, any assumptions should be further analyzed, agreed and validated before being implemented in algorithms.
Figure 5: general ORCHESTRA network framework
From an architectural point of view, each node, both in metro and in core segment, is composed by an optical switch (e.g., ROADM node) and an electrical matrix (e.g., ODU switching), the latter devoted to grooming traffic and to implementing some particular monitoring only functions suitable for analyzing electrical frames. In any case, as stated in the introduction, the only contribution from the electrical layer to the ORCHESTRA mechanism might be a trigger generated by this layer, since the ORCHESTRA “OBSERVE” tool does not analyze any parameter from the electrical layer. The transport network considered by ORCHESTRA is seen as directly connected to networks managed by OLOs (Other Licensed Operators) or towards the Internet.
ORCHESTRA ORCHESTRA_D2.1
Optical peRformanCe monitoring enabling dynamic networks using a Holistic cross-layEr, Self-configurable Truly flexible appRoAch
Created on 01.10.2015
D2.1 – ORCHESTRA dynamic optical network, reference scenarios and use cases
www.orchestraproject.eu 27/73
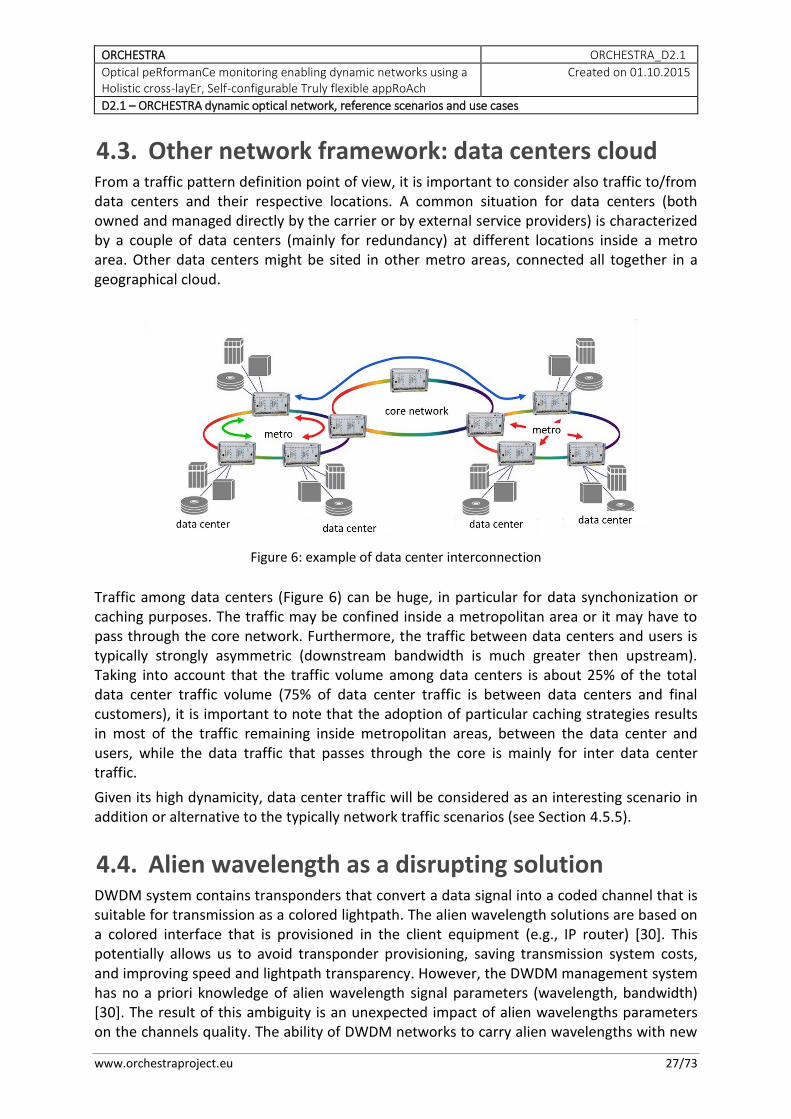
4.3. Other network framework: data centers cloud From a traffic pattern definition point of view, it is important to consider also traffic to/from data centers and their respective locations. A common situation for data centers (both owned and managed directly by the carrier or by external service providers) is characterized by a couple of data centers (mainly for redundancy) at different locations inside a metro area. Other data centers might be sited in other metro areas, connected all together in a geographical cloud.
Figure 6: example of data center interconnection
Traffic among data centers (Figure 6) can be huge, in particular for data synchonization or caching purposes. The traffic may be confined inside a metropolitan area or it may have to pass through the core network. Furthermore, the traffic between data centers and users is typically strongly asymmetric (downstream bandwidth is much greater then upstream). Taking into account that the traffic volume among data centers is about 25% of the total data center traffic volume (75% of data center traffic is between data centers and final customers), it is important to note that the adoption of particular caching strategies results in most of the traffic remaining inside metropolitan areas, between the data center and users, while the data traffic that passes through the core is mainly for inter data center traffic.
Given its high dynamicity, data center traffic will be considered as an interesting scenario in addition or alternative to the typically network traffic scenarios (see Section 4.5.5).
4.4. Alien wavelength as a disrupting solution DWDM system contains transponders that convert a data signal into a coded channel that is suitable for transmission as a colored lightpath. The alien wavelength solutions are based on a colored interface that is provisioned in the client equipment (e.g., IP router) [30]. This potentially allows us to avoid transponder provisioning, saving transmission system costs, and improving speed and lightpath transparency. However, the DWDM management system has no a priori knowledge of alien wavelength signal parameters (wavelength, bandwidth) [30]. The result of this ambiguity is an unexpected impact of alien wavelengths parameters on the channels quality. The ability of DWDM networks to carry alien wavelengths with new
ORCHESTRA ORCHESTRA_D2.1
Optical peRformanCe monitoring enabling dynamic networks using a Holistic cross-layEr, Self-configurable Truly flexible appRoAch
Created on 01.10.2015
D2.1 – ORCHESTRA dynamic optical network, reference scenarios and use cases
www.orchestraproject.eu 28/73
bit rates and advanced formats (e.g., DPSK-Differential Phase Shift Keying) has been demonstrated in the context of 40Gb/s alien wavelengths over DWDM networks designed for 10Gb/s signals [31].
Despite this, and until now, European carriers (including Telecom Italia) do not plan to offer aliens to external customers, but they only consider alien wavelengths between different vendors’ equipment as an option for IP over DWDM. In any case no optical handover outside of the carrier is on the Operators’ services roadmap.
Having stated this, ORCHESTRA, being a research project, is going to consider as a scenario the case where an “alien wavelength” could be originated from data centers equipment and routed inside the network. In ORCHESTRA paradigm, alien wavelengths are routed only inside native metro network. Any geographical routing involving core links is handled electrically with OTN transparent transport at the borders between the core and the metro.
4.5. Reference topology As stated in the introduction, ORCHESTRA aims to design a new control and management architecture that exploits the monitoring and re-configurability capabilities of enhanced tunable transceivers. In order to confirm the validity and the benefits of the mechanism, in terms of investments and power savings, under various contexts, different reference networks are considered:
A pan European network;
A national-wide network;
A metropolitan network.
In the following sections, reference networks are described: nodes and links characteristics, network diameter, and network elements’ features are reported based on what is installed in the corresponding reference networks of Telecom Italia, one of the major incumbent network operators.
4.5.1. A PAN-European Network: Telecom Italia Sparkle European Network
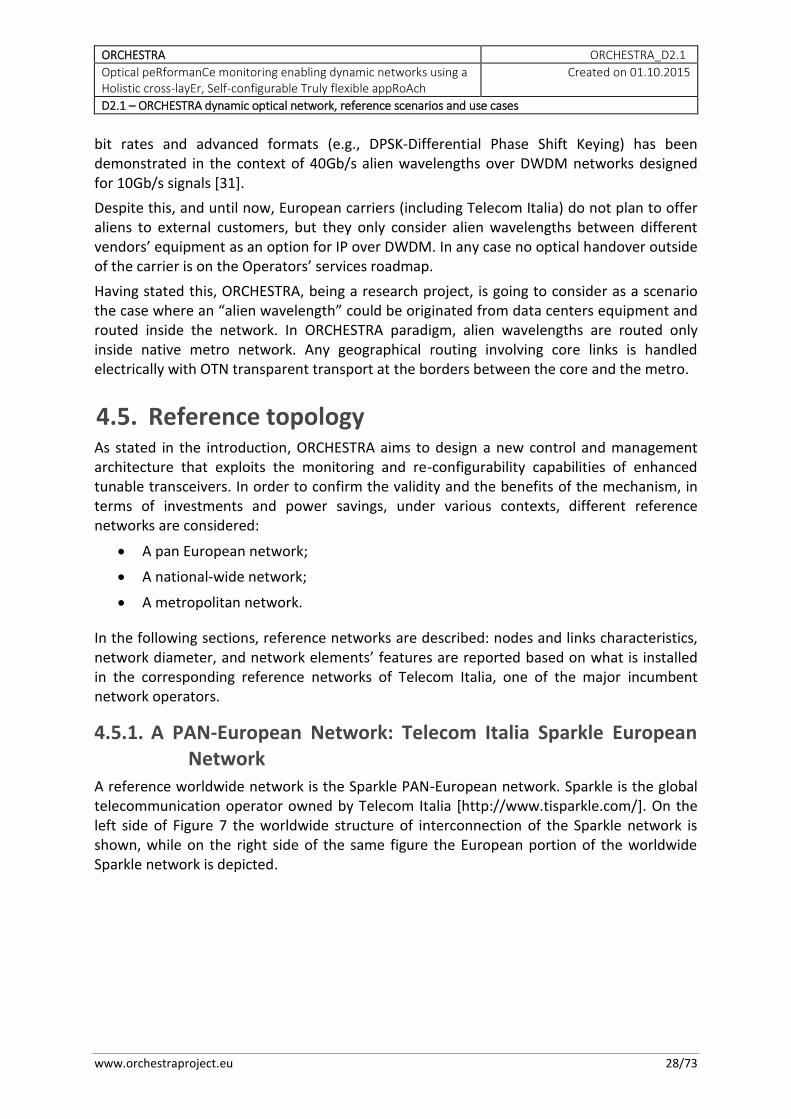
A reference worldwide network is the Sparkle PAN-European network. Sparkle is the global telecommunication operator owned by Telecom Italia [http://www.tisparkle.com/]. On the left side of Figure 7 the worldwide structure of interconnection of the Sparkle network is shown, while on the right side of the same figure the European portion of the worldwide Sparkle network is depicted.
ORCHESTRA ORCHESTRA_D2.1
Optical peRformanCe monitoring enabling dynamic networks using a Holistic cross-layEr, Self-configurable Truly flexible appRoAch
Created on 01.10.2015
D2.1 – ORCHESTRA dynamic optical network, reference scenarios and use cases
www.orchestraproject.eu 29/73
Figure 7: Telecom Italia Sparkle worldwide infrastructure and the European Network.
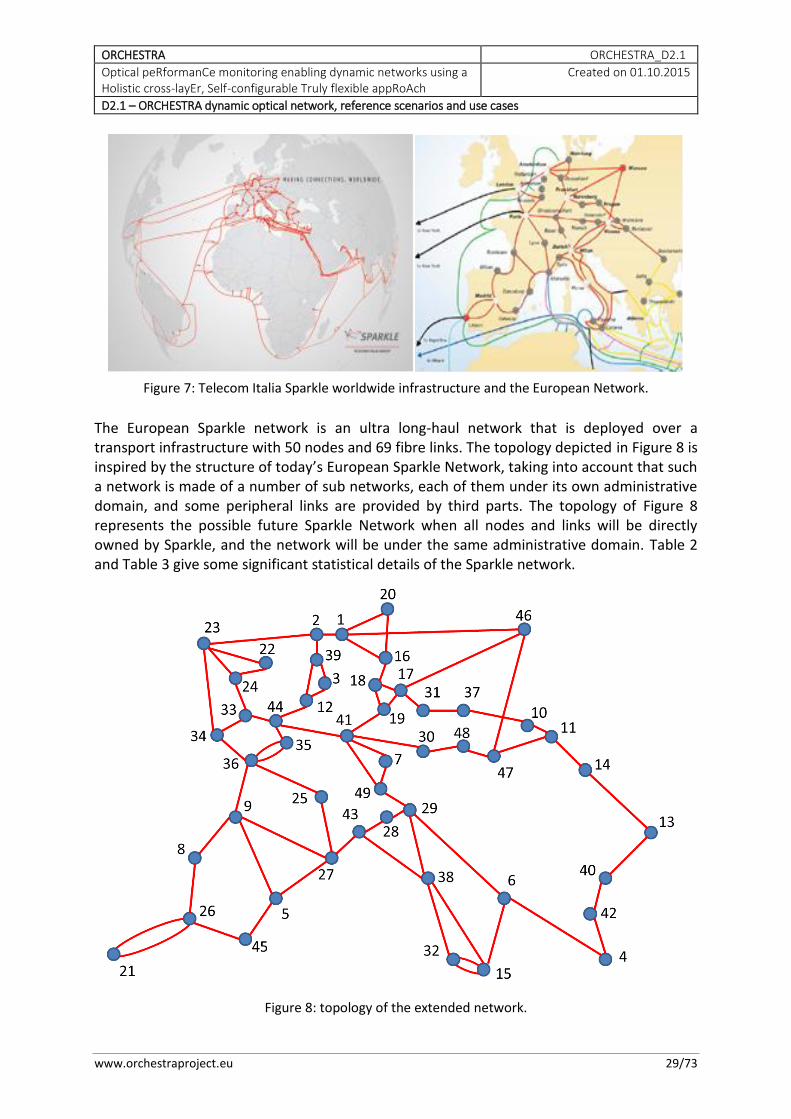
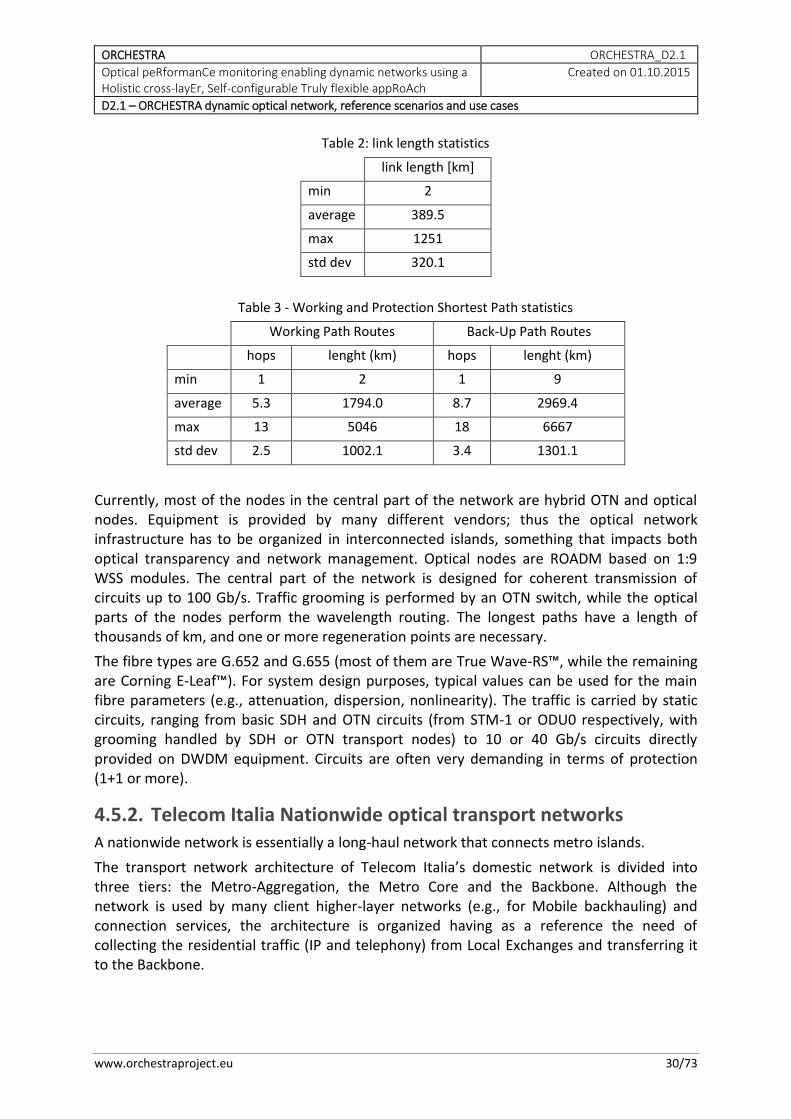
The European Sparkle network is an ultra long-haul network that is deployed over a transport infrastructure with 50 nodes and 69 fibre links. The topology depicted in Figure 8 is inspired by the structure of today’s European Sparkle Network, taking into account that such a network is made of a number of sub networks, each of them under its own administrative domain, and some peripheral links are provided by third parts. The topology of Figure 8 represents the possible future Sparkle Network when all nodes and links will be directly owned by Sparkle, and the network will be under the same administrative domain. Table 2 and Table 3 give some significant statistical details of the Sparkle network.
Figure 8: topology of the extended network.
ORCHESTRA ORCHESTRA_D2.1
Optical peRformanCe monitoring enabling dynamic networks using a Holistic cross-layEr, Self-configurable Truly flexible appRoAch
Created on 01.10.2015
D2.1 – ORCHESTRA dynamic optical network, reference scenarios and use cases
www.orchestraproject.eu 30/73
Table 2: link length statistics
link length [km]
min 2
average 389.5
max 1251
std dev 320.1
Table 3 - Working and Protection Shortest Path statistics
Working Path Routes Back-Up Path Routes
hops lenght (km) hops lenght (km)
min 1 2 1 9
average 5.3 1794.0 8.7 2969.4
max 13 5046 18 6667
std dev 2.5 1002.1 3.4 1301.1
Currently, most of the nodes in the central part of the network are hybrid OTN and optical nodes. Equipment is provided by many different vendors; thus the optical network infrastructure has to be organized in interconnected islands, something that impacts both optical transparency and network management. Optical nodes are ROADM based on 1:9 WSS modules. The central part of the network is designed for coherent transmission of circuits up to 100 Gb/s. Traffic grooming is performed by an OTN switch, while the optical parts of the nodes perform the wavelength routing. The longest paths have a length of thousands of km, and one or more regeneration points are necessary.
The fibre types are G.652 and G.655 (most of them are True Wave-RS™, while the remaining are Corning E-Leaf™). For system design purposes, typical values can be used for the main fibre parameters (e.g., attenuation, dispersion, nonlinearity). The traffic is carried by static circuits, ranging from basic SDH and OTN circuits (from STM-1 or ODU0 respectively, with grooming handled by SDH or OTN transport nodes) to 10 or 40 Gb/s circuits directly provided on DWDM equipment. Circuits are often very demanding in terms of protection (1+1 or more).
4.5.2. Telecom Italia Nationwide optical transport networks A nationwide network is essentially a long-haul network that connects metro islands.
The transport network architecture of Telecom Italia’s domestic network is divided into three tiers: the Metro-Aggregation, the Metro Core and the Backbone. Although the network is used by many client higher-layer networks (e.g., for Mobile backhauling) and connection services, the architecture is organized having as a reference the need of collecting the residential traffic (IP and telephony) from Local Exchanges and transferring it to the Backbone.
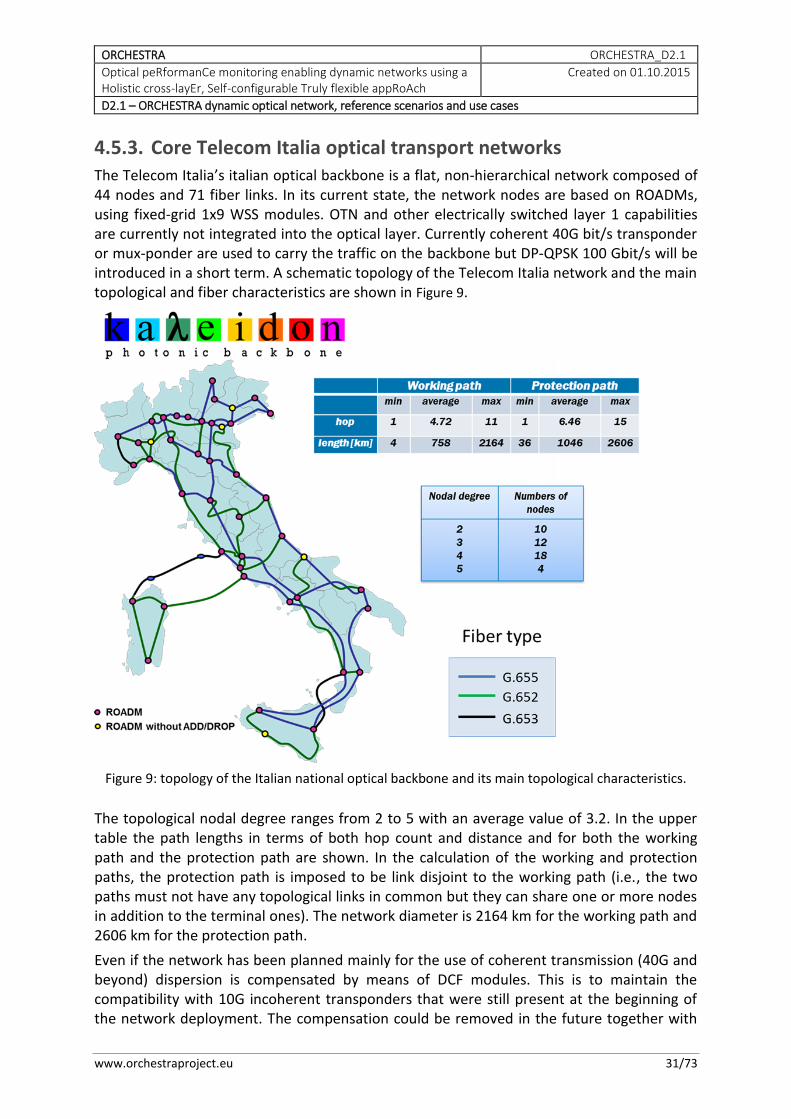
ORCHESTRA ORCHESTRA_D2.1
Optical peRformanCe monitoring enabling dynamic networks using a Holistic cross-layEr, Self-configurable Truly flexible appRoAch
Created on 01.10.2015
D2.1 – ORCHESTRA dynamic optical network, reference scenarios and use cases
www.orchestraproject.eu 31/73
4.5.3. Core Telecom Italia optical transport networks The Telecom Italia’s italian optical backbone is a flat, non-hierarchical network composed of 44 nodes and 71 fiber links. In its current state, the network nodes are based on ROADMs, using fixed-grid 1x9 WSS modules. OTN and other electrically switched layer 1 capabilities are currently not integrated into the optical layer. Currently coherent 40G bit/s transponder or mux-ponder are used to carry the traffic on the backbone but DP-QPSK 100 Gbit/s will be introduced in a short term. A schematic topology of the Telecom Italia network and the main topological and fiber characteristics are shown in Figure 9.
Figure 9: topology of the Italian national optical backbone and its main topological characteristics.
The topological nodal degree ranges from 2 to 5 with an average value of 3.2. In the upper table the path lengths in terms of both hop count and distance and for both the working path and the protection path are shown. In the calculation of the working and protection paths, the protection path is imposed to be link disjoint to the working path (i.e., the two paths must not have any topological links in common but they can share one or more nodes in addition to the terminal ones). The network diameter is 2164 km for the working path and 2606 km for the protection path.
Even if the network has been planned mainly for the use of coherent transmission (40G and beyond) dispersion is compensated by means of DCF modules. This is to maintain the compatibility with 10G incoherent transponders that were still present at the beginning of the network deployment. The compensation could be removed in the future together with
ORCHESTRA ORCHESTRA_D2.1
Optical peRformanCe monitoring enabling dynamic networks using a Holistic cross-layEr, Self-configurable Truly flexible appRoAch
Created on 01.10.2015
D2.1 – ORCHESTRA dynamic optical network, reference scenarios and use cases
www.orchestraproject.eu 32/73
incoherent 10 G transponders with benefits for the performance of the coherent transmission.
Three types of fiber are present in the network: G.652, G.653 and G.655 (Corning E-Leaf™). The links are all of terrestrial type except for three: two of them connecting Sardinia and the other connecting Sicily to the Italian peninsula. Concerning the occurrences of different types of fiber, the situation is as follows: 25 links are G.652, 2 links are G.653, 33 links are G.655, one link is mixed G.652 and G.653, and 9 links are mixed G.652 and G.655. As things stand now, the chromatic dispersion of the network is always compensated with dispersion compensating modules (DCM).
The structure of the future optical transport network of Telecom Italia is not yet defined, but in all probably the network will include flex-grid optical cross connects instead of the fixed-grid ones present today, and also an integrated OTN layer in the optical transport nodes will allow the grooming of demands at rates up to 10 Gbit/s. From the data plane point of view flex-grid multi-flow transponders with aggregated traffic of the order of Terabit/s are also expected to be deployed.
In the Backbone, all the exchanged traffic is IP (other, non-IP traffic, like the voice circuits, is packetized at the Metro-Backbone boundary).
Additional aspects and considerations, such as the capability of handling dynamic traffic at the optical layer (both in switching on and tearing down connections, and in handling bandwidth fluctuations within a connection during its lifetime), and, more generally, the introduction of transport SDN concept in the control plane will most likely guide the development of the future photonic backbone.
4.5.4. Metro Telecom Italia optical segment The Metro Aggregation layer connects about 10,000 Local exchanges, which aggregate the traffic from the access network to about 600 Urban Exchanges. The Metro Core segment connects the 600 Urban Exchanges (most of them, about 570, are Point of Presence of the IP Metro Network called Optical Packet Metro (OPM)) to the 32 main POPs of the Metro. These 32 Metro POP nodes are co-located with the service servers and the IP backbone nodes, constituting the Optical Packet Backbone (OPB). On those 32 common Metro and Backbone locations the Metro network is interconnected to the Domestic Backbone or to other licensed operators (OLO) networks.
The Metro Regional optical transport network covers the tiers of Metro Aggregation and Metro Core. The Metro Aggregation has two different architectural solutions depending on the type of the area that is covered. In dense urban areas, where the number of circuits and their average rates are higher, the transport network is implemented with WDM rings. In the other urban areas or in the countryside, the transport network is implemented with Packet Transport (PT) technology (considered, in this context, a transport technology) that assures higher flexibility and better use of the resources.
In the Metro Core, where the circuit rates match the lambda capacities (up to 10 Gbit/s), the transport connectivity is made by WDM rings only.
As far as OPM (the packet network, L2/3) is concerned, the Metro-Core is organized into two tiers: an Aggregation tier with about 500 sites and a concentration tier with about 70 sites.
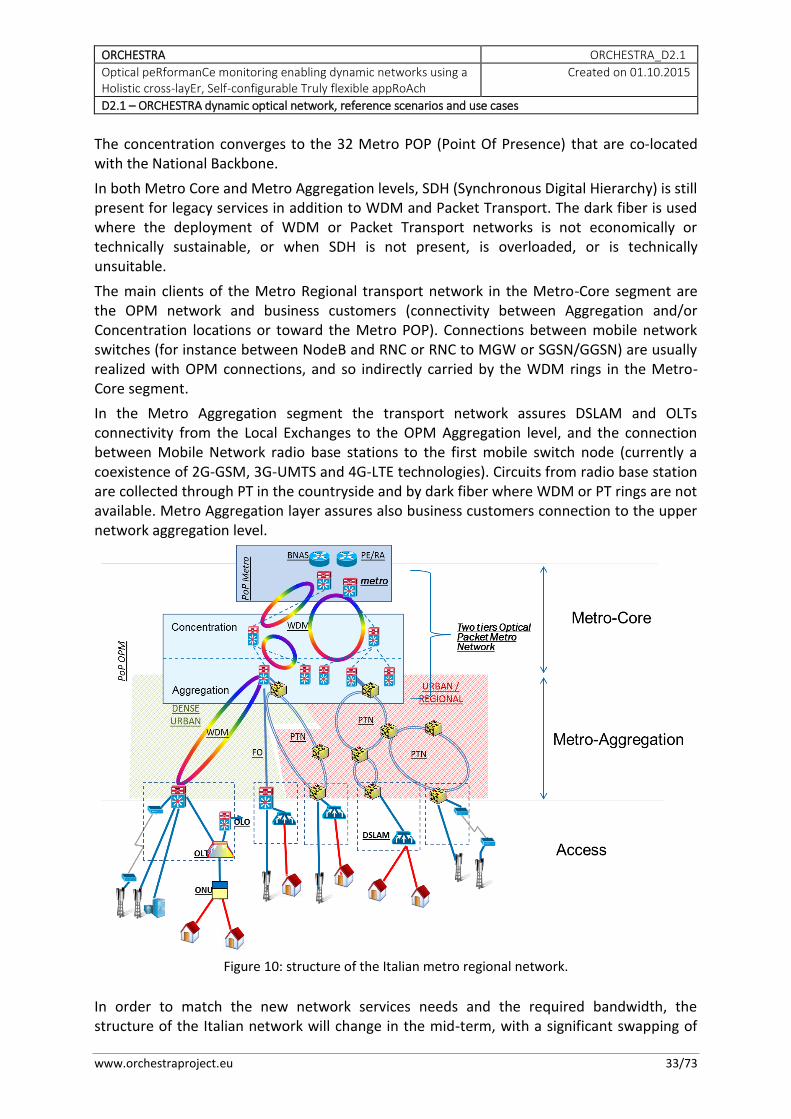
ORCHESTRA ORCHESTRA_D2.1
Optical peRformanCe monitoring enabling dynamic networks using a Holistic cross-layEr, Self-configurable Truly flexible appRoAch
Created on 01.10.2015
D2.1 – ORCHESTRA dynamic optical network, reference scenarios and use cases
www.orchestraproject.eu 33/73
The concentration converges to the 32 Metro POP (Point Of Presence) that are co-located with the National Backbone.
In both Metro Core and Metro Aggregation levels, SDH (Synchronous Digital Hierarchy) is still present for legacy services in addition to WDM and Packet Transport. The dark fiber is used where the deployment of WDM or Packet Transport networks is not economically or technically sustainable, or when SDH is not present, is overloaded, or is technically unsuitable.
The main clients of the Metro Regional transport network in the Metro-Core segment are the OPM network and business customers (connectivity between Aggregation and/or Concentration locations or toward the Metro POP). Connections between mobile network switches (for instance between NodeB and RNC or RNC to MGW or SGSN/GGSN) are usually realized with OPM connections, and so indirectly carried by the WDM rings in the Metro-Core segment.
In the Metro Aggregation segment the transport network assures DSLAM and OLTs connectivity from the Local Exchanges to the OPM Aggregation level, and the connection between Mobile Network radio base stations to the first mobile switch node (currently a coexistence of 2G-GSM, 3G-UMTS and 4G-LTE technologies). Circuits from radio base station are collected through PT in the countryside and by dark fiber where WDM or PT rings are not available. Metro Aggregation layer assures also business customers connection to the upper network aggregation level.
Figure 10: structure of the Italian metro regional network.
In order to match the new network services needs and the required bandwidth, the structure of the Italian network will change in the mid-term, with a significant swapping of
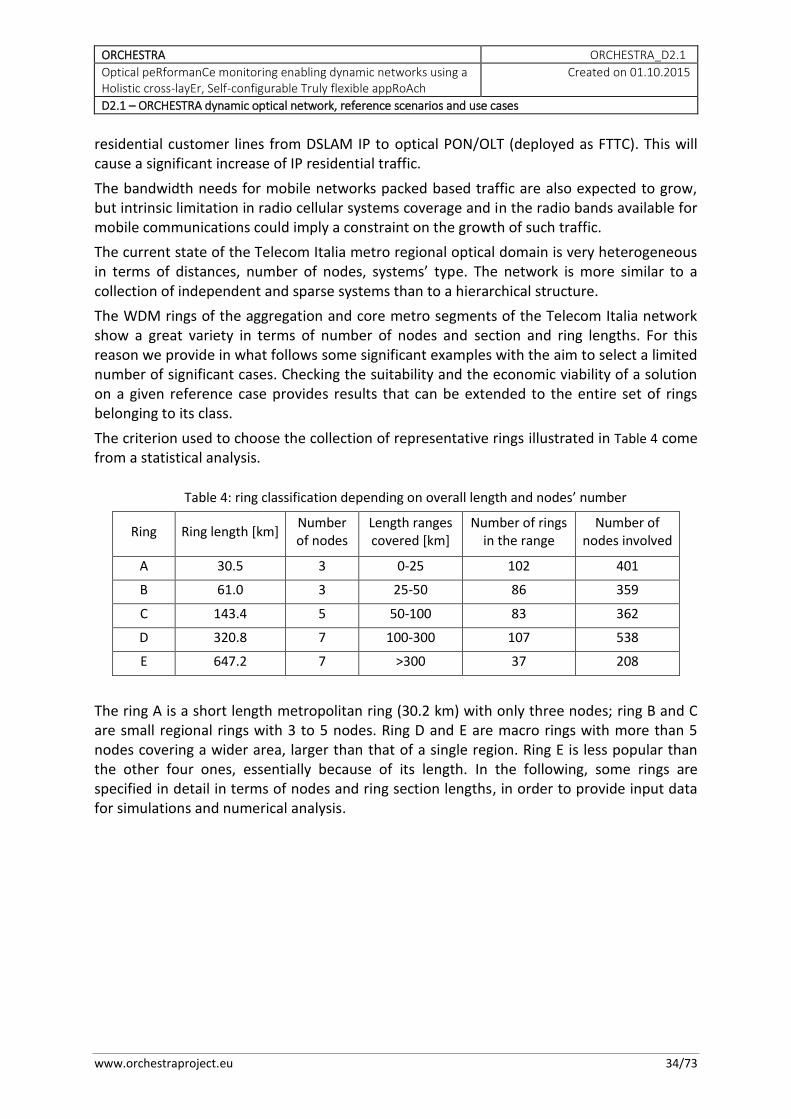
ORCHESTRA ORCHESTRA_D2.1
Optical peRformanCe monitoring enabling dynamic networks using a Holistic cross-layEr, Self-configurable Truly flexible appRoAch
Created on 01.10.2015
D2.1 – ORCHESTRA dynamic optical network, reference scenarios and use cases
www.orchestraproject.eu 34/73
residential customer lines from DSLAM IP to optical PON/OLT (deployed as FTTC). This will cause a significant increase of IP residential traffic.
The bandwidth needs for mobile networks packed based traffic are also expected to grow, but intrinsic limitation in radio cellular systems coverage and in the radio bands available for mobile communications could imply a constraint on the growth of such traffic.
The current state of the Telecom Italia metro regional optical domain is very heterogeneous in terms of distances, number of nodes, systems’ type. The network is more similar to a collection of independent and sparse systems than to a hierarchical structure.
The WDM rings of the aggregation and core metro segments of the Telecom Italia network show a great variety in terms of number of nodes and section and ring lengths. For this reason we provide in what follows some significant examples with the aim to select a limited number of significant cases. Checking the suitability and the economic viability of a solution on a given reference case provides results that can be extended to the entire set of rings belonging to its class.
The criterion used to choose the collection of representative rings illustrated in Table 4 come from a statistical analysis.
Table 4: ring classification depending on overall length and nodes’ number
Ring Ring length [km] Number of nodes
Length ranges covered [km]
Number of rings in the range
Number of nodes involved
A 30.5 3 0-25 102 401
B 61.0 3 25-50 86 359
C 143.4 5 50-100 83 362
D 320.8 7 100-300 107 538
E 647.2 7 >300 37 208
The ring A is a short length metropolitan ring (30.2 km) with only three nodes; ring B and C are small regional rings with 3 to 5 nodes. Ring D and E are macro rings with more than 5 nodes covering a wider area, larger than that of a single region. Ring E is less popular than the other four ones, essentially because of its length. In the following, some rings are specified in detail in terms of nodes and ring section lengths, in order to provide input data for simulations and numerical analysis.
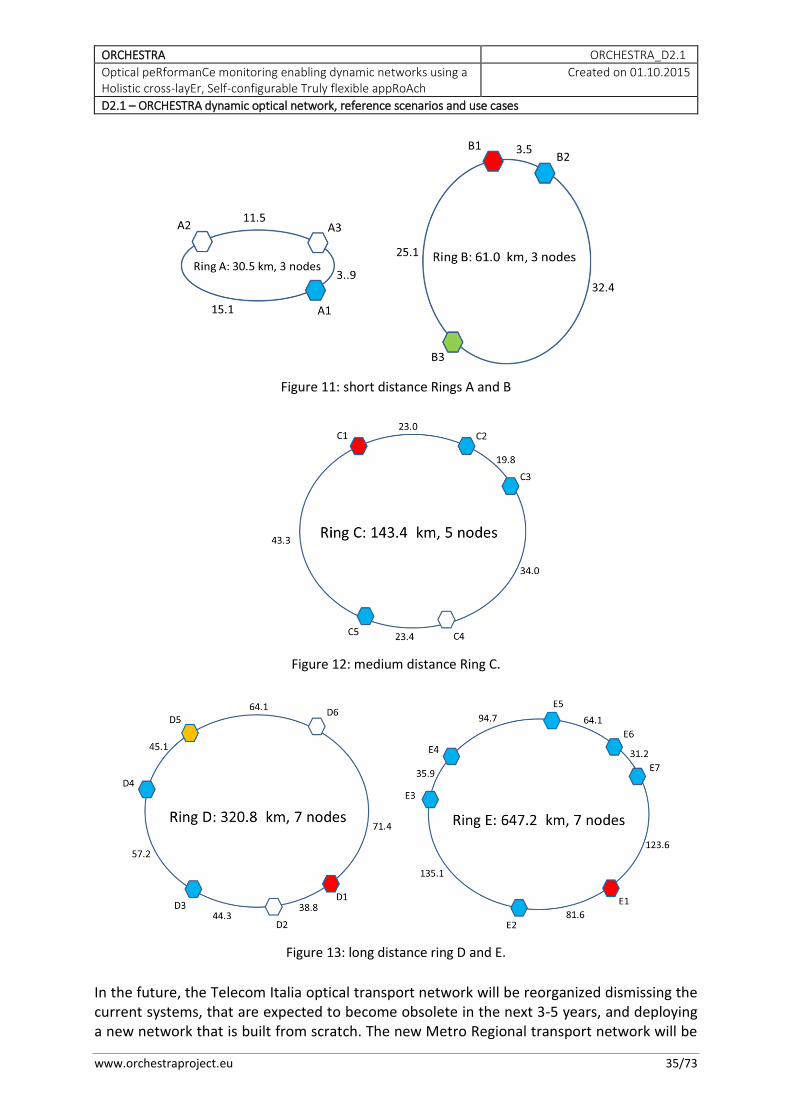
ORCHESTRA ORCHESTRA_D2.1
Optical peRformanCe monitoring enabling dynamic networks using a Holistic cross-layEr, Self-configurable Truly flexible appRoAch
Created on 01.10.2015
D2.1 – ORCHESTRA dynamic optical network, reference scenarios and use cases
www.orchestraproject.eu 35/73
Figure 11: short distance Rings A and B
Figure 12: medium distance Ring C.
Figure 13: long distance ring D and E.
In the future, the Telecom Italia optical transport network will be reorganized dismissing the current systems, that are expected to become obsolete in the next 3-5 years, and deploying a new network that is built from scratch. The new Metro Regional transport network will be
ORCHESTRA ORCHESTRA_D2.1
Optical peRformanCe monitoring enabling dynamic networks using a Holistic cross-layEr, Self-configurable Truly flexible appRoAch
Created on 01.10.2015
D2.1 – ORCHESTRA dynamic optical network, reference scenarios and use cases
www.orchestraproject.eu 36/73
organized on the basis of a macro-regional partitioning of the network, with the objective to rationalize the structure of the WDM infrastructure.
Due to the higher number of pieces of equipment required in the whole Metro Regional infrastructure, the introduction of advanced and expensive capabilities (configurability, i.e., use of ROADMs, flexibility, i.e., use of flexible grid and BVT S-BVT, and control plane functionalities, i.e., W/S-SON and/or SDN) is planned to be introduced gradually and only when really necessary.
4.5.5. Reference traffic scenarios Typically the traffic of the network is represented in what is called the “traffic matrix”, defined as a matrix that includes the capacity requests for all communicating pairs. Different types of traffic can pass over the optical network, such as IP traffic, OTN, or lightpaths that are sold to customers (wholesale Lambdas). So, an actual matrix representation of such traffic might not be feasible, since we might need separate lightpaths for serving the different types of traffic for two communicating end-points. Each lightpath can be protected or not, depending on the related SLA, with 1+1 protection being the most typical protection service.
Regarding long term traffic evolution, a widely used model is to assume that traffic increases uniformly with time by a specific factor in a given period (e.g., per year). We can have different uniform increasing factors for the different types of traffic or even assume that the network follows a non-uniform evolution (for this, we need for each demand its factor of yearly increase). In most cases we assume that all different types of traffic have the same and constant rate of increase, with typical factors of increase used in the studies being between 33% and 35% per year [32].
Short time traffic changes (e.g., daily fluctuations) can also be modeled. The traffic matrix described above contains the peak values for the communicating pairs. The traffic fluctuations during the day have a specific sinusoidal pattern: the traffic is heavy during the day (people use the network at work) and becomes lighter during the night. Most connections in a national or metro network exhibit a similar daily pattern and are almost synchronized, meaning that traffic increases and decreases almost in-phase in a given time zone. A shift in the daily pattern is experienced in traffic in continental and inter-continental networks, due to the different time-zones and working/daily habits of the different countries.
For the reference networks presented in D2.1, realistic traffic matrix will be provided to the consortium in order to evaluate the ORCHESTRA concepts (the realistic traffic matrix of the “Kaleidon” the core DWDM optical transport network of Telecom Italia is provided in a separate excel file, and not embedded here due to confidentiality issues). Evolution network scenarios will be evaluated using a model such as that of uniform or non-uniform traffic increase over a period of time. For short time traffic variations, a day-night model will also be used, calibrated by the peaks of the connections described in the given realistic traffic matrix.
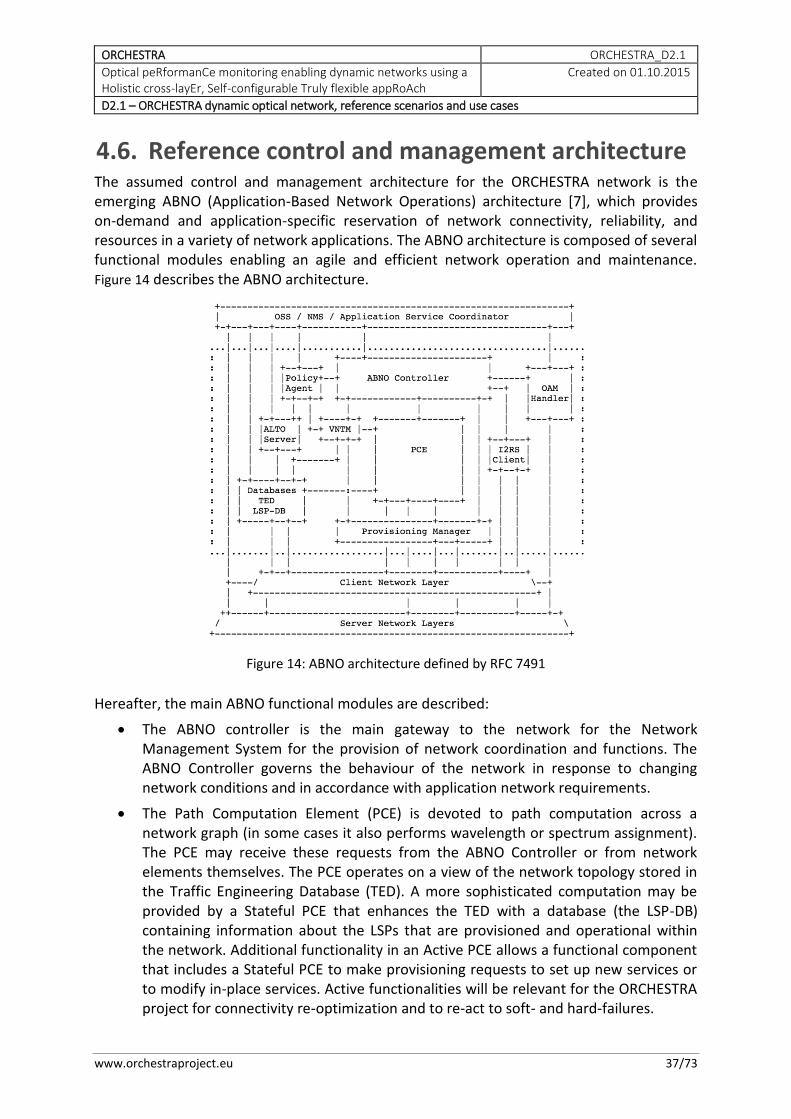
ORCHESTRA ORCHESTRA_D2.1
Optical peRformanCe monitoring enabling dynamic networks using a Holistic cross-layEr, Self-configurable Truly flexible appRoAch
Created on 01.10.2015
D2.1 – ORCHESTRA dynamic optical network, reference scenarios and use cases
www.orchestraproject.eu 37/73
4.6. Reference control and management architecture The assumed control and management architecture for the ORCHESTRA network is the emerging ABNO (Application-Based Network Operations) architecture [7], which provides on-demand and application-specific reservation of network connectivity, reliability, and resources in a variety of network applications. The ABNO architecture is composed of several functional modules enabling an agile and efficient network operation and maintenance. Figure 14 describes the ABNO architecture.
Figure 14: ABNO architecture defined by RFC 7491
Hereafter, the main ABNO functional modules are described:
The ABNO controller is the main gateway to the network for the Network Management System for the provision of network coordination and functions. The ABNO Controller governs the behaviour of the network in response to changing network conditions and in accordance with application network requirements.
The Path Computation Element (PCE) is devoted to path computation across a network graph (in some cases it also performs wavelength or spectrum assignment). The PCE may receive these requests from the ABNO Controller or from network elements themselves. The PCE operates on a view of the network topology stored in the Traffic Engineering Database (TED). A more sophisticated computation may be provided by a Stateful PCE that enhances the TED with a database (the LSP-DB) containing information about the LSPs that are provisioned and operational within the network. Additional functionality in an Active PCE allows a functional component that includes a Stateful PCE to make provisioning requests to set up new services or to modify in-place services. Active functionalities will be relevant for the ORCHESTRA project for connectivity re-optimization and to re-act to soft- and hard-failures.
ORCHESTRA ORCHESTRA_D2.1
Optical peRformanCe monitoring enabling dynamic networks using a Holistic cross-layEr, Self-configurable Truly flexible appRoAch
Created on 01.10.2015
D2.1 – ORCHESTRA dynamic optical network, reference scenarios and use cases
www.orchestraproject.eu 38/73
Operations, Administration, and Maintenance (OAM) Handler is devoted to detecting faults or degradations and taking actions to react to problems in the network. The OAM Handler is responsible for receiving alerts from the network about potential problems, for correlating them, and for triggering other components of the system to take actions in order to preserve or recover the affected services. The OAM Handler interacts with monitoring agents and devices and with other ABNO modules. Such functional element is particularly relevant in ORCHESTRA to provide the dynamic and automated management and monitoring functions. In particular, one of the main innovations of ORCHESTRA regarding the control and management plane is the proposal of a hierarchical monitoring architecture. The specification of this new architecture is under study in WP2 and WP5 and will be finalized with upcoming deliverables. The core idea is to spread the main OAM Handler functionalities, such as receiving alerts, correlating them and deciding about actions to take, in a hierarchical monitoring system composed by dedicated coordinated and cooperative agents providing high reliability and scalability.
The Provisioning Manager is responsible for all the interactions and communications with the network control plane. It is in charge of requesting the provisioning of new lightpaths as well as of their dynamic modification and reconfiguration according to decisions taken by the PCE. The Provisioning Manager within the ABNO architecture has to be able to interact with heterogeneous control plane technologies (either distributed or centralized) exposing different control primitives.
As already mentioned, ORCHESTRA aims at enhancing the OAM functions and procedures within the ABNO architecture. In particular, a hierarchical monitoring architecture is going to be proposed and implemented during the project; each layer of the hierarchy will be responsible for a specific portion of the physical layer. The root of the hierarchical monitoring architecture is the ABNO OAM Handler that interacts with the monitoring hierarchy and its agents, the ABNO controller, and other ABNO modules such as TED and LSP-DB. The ORCHESTRA monitoring architecture requirements and specifications are still under investigation in task T2.3 and will be reported in deliverable D2.3. On the other hand, the monitoring architecture,, monitoring protocol and procedures will be designed and achieved in WP5.
Since ORCHESTRA aims at closing the loop between the optical layer and the control and management functions, the proposed hierarchical monitoring architecture will be also integrated with enhanced control plane technologies able to implement dynamic actions and reactions to failures and degradations. Re-active and pro-active re-optimization procedures will be implemented inside the ABNO PCE which, besides TED and LSP-DB, exploiting the OAM Handler in order to retrieve information regarding the physical layer through the monitored parameters. In addition, the study on the ORCHESTRA control plane will consider the main current state of the art in terms of control plane and protocols: a distributed GMPLS control plane and a centralized Software Defined Networking (SDN) approach.
The Generalized Multi-Protocol Label Switching (GMPLS) framework [33] is defined within the IETF Common Control and Measurement Plane Working Group (CCAMP WG) and provides network control plane procedures for automated provisioning of network connectivity services with functions for Traffic Engineering, network resource management,
ORCHESTRA ORCHESTRA_D2.1
Optical peRformanCe monitoring enabling dynamic networks using a Holistic cross-layEr, Self-configurable Truly flexible appRoAch
Created on 01.10.2015
D2.1 – ORCHESTRA dynamic optical network, reference scenarios and use cases
www.orchestraproject.eu 39/73
and service recovery. The GMPLS architecture, as defined in related standards, is conceived to operate over multiple switching technologies (packet, Layer-2, Time Division Multiplexing –TDM-, fibre and wavelength switching). A wide set of extensions are defined for GMPLS signalling (e.g., RSVP-TE) and routing (e.g., OSPF-TE) protocols in order to support specific technologies like Wavelength Switched Optical Networks (WSON), G.709 Optical Transport Networks (OTN) and Flexi-Grid.
On the other hand, SDN is standardized in the context of the Open Networking Forum (ONF) and can be defined as a control framework that provides programmability of network functions and protocols by decoupling the data plane and the control plane [34]. With SDN, network intelligence and state information is logically centralized within controllers, while an abstracted and vendor independent view of network resources is exposed to upper layers by means of open Application Programming Interfaces (APIs). SDN provides a software abstraction of the physical network that allows the network itself to be programmable and therefore closely tied to application and service needs. OpenFlow [35] is the most prominent SDN standard protocol driving the integration of SDN controllers and network devices. It is based on flow switching and is capable to provide software and user-defined flow based routing, control and management functions, in support of both packet and optical technologies. Also NetConf protocol [36] based on YANG description model (i.e., an emerging data modelling written in XML language) [37] for the data plane will be considered, especially in retrieving monitored information.
4.7. Reference ageing model The performance of network equipment deteriorates during its lifetime, reducing the feasible transmission reach of the connections. In particular, the ageing of the transponders, fibers and EDFAs are the most dominant factors that result in the gradual reduction of the transmission reach. Typically, when the connection is provisioned, the effect of ageing is taken into account thought a worst case design, by making sure that the established connection is feasible at the predicted end of the network operation. This is achieved by adding a related loss margin to anticipate what is called the “end of life” performance of the system. In some cases this margin accounts for the extra degradations due to splices or extra connectors to fix fiber cuts or other types of failures. For example, [38] suggests allocating a 3dB margin per span to account for the end of life ageing effects.
In ORCHESTRA, a key use case (as described in the next chapter) is to reduce the margins employed in provisioning and operate the network close to the limit imposed by the actual network conditions at any given time. To evaluate the benefits of such an approach we need to consider the evolution of the network and account for the ageing effects as they appear. Note that in the literature there are references dealing with the ageing of subsystems and equipment, but there is a lack of information on a network-level ageing model, apart from end of life/coarse margins that are typically used in provisioning.
Therefore in this deliverable a basic and generic description of an ageing model is given, and more details will follow in related deliverables (D2.2 and deliverables of WP3).
We start by focusing on a span s where we assume that ageing affects the fiber attenuation parameter aloss, which therefore has to be modeled as a function aloss(t) that can be a linear or non-linear function of time (e.g., heavy in the beginning with a plateau at the end, or vice

ORCHESTRA ORCHESTRA_D2.1
Optical peRformanCe monitoring enabling dynamic networks using a Holistic cross-layEr, Self-configurable Truly flexible appRoAch
Created on 01.10.2015
D2.1 – ORCHESTRA dynamic optical network, reference scenarios and use cases
www.orchestraproject.eu 40/73
versa). The loss of the span also depends on the existence of connectors and splices. Connectors are typically placed at both ends of a link, while the number of splices depends on the type of network, the failures, etc. Both connector and splice loss can be modeled as functions of time and represented here by closs(t) and sloss(t). Assuming that in the specific span s we have ns connectors and ms splices (these numbers can also be a function of time, e.g., we splice to fix a fiber cut), the total loss As(t) of span s is given by:
( ) ( ) ( ) ( )s s loss s loss s lossA t l a t n c t m s t (1)
This loss is compensated by the EDFA at the end of the span. Thus, the ASE noise power of the EDFA is given by:
Ps,λ(t)= As(t).F.h.λ.B, (2)
where As is the span loss, F is the noise figure of the EDFA, h is the Planck constant, λ the operating frequency, B the equivalent noise bandwidth over which OSNR is evaluated.
Following a similar approach we can model the ageing effect of the OXCs by assuming that the noise power is a function of time, denoted here by Po,λ(t).
So the total noise power Pp accumulated over lightpath (p,λ), which is using path p and wavelength λ, is given by:
, , ,( ) ( ) ( )p s O
s p O p
P t P t P t
(3)
For span s we also assume a span margin Ms(t) that is a function of time to account for the ageing of the EDFA at the end of the span and any other component. The related margin for a lightpath depends on the number of the spans that it traverses and is given by:
( ) ( )p s
s p
M t M t
(4)
We also model the ageing of the transponder with a margin MT(t), which is again taken to be a function of time.
We can use the above relation to calculate the OSNR as a function of time and therefore the feasibility of a lightpath at a given time instance. To be more specific, the OSNR of lightpath (p,λ) with launch-power Τp,λ is computed as follows:
, 10 , 10 ,( ) 10 log ( ) 10 log ( ( ))p p pOSNR t T P t (5)
To decide whether a lightpath’s OSNR at the receiver side is sufficient to accept a lightpath as feasible or not, we take into account the calculated OSNR at time t as done in Eq. (6), the EDFA’s margin Mp(t), the transponder’s margin MT(t) and the OSNR limit (OSNRlimit) which depends on the modulation format and the FEC used. The following condition must be applied to accept a lightpath as feasible:
OSNRp,λ(t)- MT(t)- MT(t)>OSNRlimit (6)
To be more specific, we give some reference values for the symbols introduced above. In the following table we give values for the functions aloss(t), closs(t), sloss(t), Ms(t), for t=begin of life (BOL) and t=end of life (EOL), as were found in the literature. Note that these are the values for the two extreme time instants. To find the values for intermediate time instants we need to identify the exact dependence on time for these functions (linear interpolation being one candidate solution).
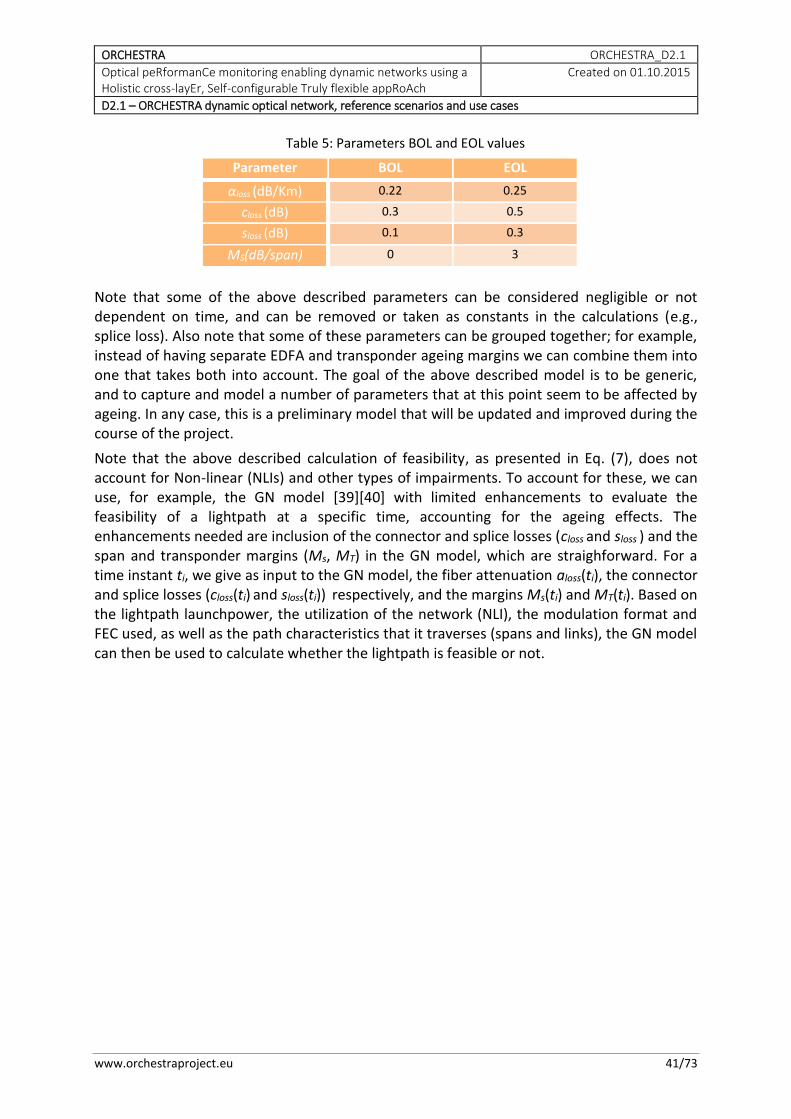
ORCHESTRA ORCHESTRA_D2.1
Optical peRformanCe monitoring enabling dynamic networks using a Holistic cross-layEr, Self-configurable Truly flexible appRoAch
Created on 01.10.2015
D2.1 – ORCHESTRA dynamic optical network, reference scenarios and use cases
www.orchestraproject.eu 41/73
Table 5: Parameters BOL and EOL values
Parameter BOL EOL
αloss (dB/Km) 0.22 0.25
closs (dB) 0.3 0.5
sloss (dB) 0.1 0.3
MS(dB/span) 0 3
Note that some of the above described parameters can be considered negligible or not dependent on time, and can be removed or taken as constants in the calculations (e.g., splice loss). Also note that some of these parameters can be grouped together; for example, instead of having separate EDFA and transponder ageing margins we can combine them into one that takes both into account. The goal of the above described model is to be generic, and to capture and model a number of parameters that at this point seem to be affected by ageing. In any case, this is a preliminary model that will be updated and improved during the course of the project.
Note that the above described calculation of feasibility, as presented in Eq. (7), does not account for Non-linear (NLIs) and other types of impairments. To account for these, we can use, for example, the GN model [39][40] with limited enhancements to evaluate the feasibility of a lightpath at a specific time, accounting for the ageing effects. The enhancements needed are inclusion of the connector and splice losses (closs and sloss ) and the span and transponder margins (Ms, MT) in the GN model, which are straighforward. For a time instant ti, we give as input to the GN model, the fiber attenuation aloss(ti), the connector and splice losses (closs(ti) and sloss(ti)) respectively, and the margins Ms(ti) and MT(ti). Based on the lightpath launchpower, the utilization of the network (NLI), the modulation format and FEC used, as well as the path characteristics that it traverses (spans and links), the GN model can then be used to calculate whether the lightpath is feasible or not.
ORCHESTRA ORCHESTRA_D2.1
Optical peRformanCe monitoring enabling dynamic networks using a Holistic cross-layEr, Self-configurable Truly flexible appRoAch
Created on 01.10.2015
D2.1 – ORCHESTRA dynamic optical network, reference scenarios and use cases
www.orchestraproject.eu 42/73
5. Use cases
In this Section a set of use cases that were identified as means to showcase and validate the benefits of the mechanism/functionalities envisaged by ORCHESTRA and described in Section 2.2. These use cases are:
1. Network planning and provisioning with reduced margins
2. Dynamic network adaptation
3. Hard and soft failure prediction, localization and handling
4. Network updates and network maintenance tasks
5. Alien wavelengths handling
In the following, we present the above listed use cases in more details. For each use case, we start by providing a high level description and then we identify in a table format, (i) the initiating point (offline, central network controller, monitoring plane), (ii) the network and the (iii) type of traffic, (iv) the related ORCHESTRA functionalities, and the (v) benefits expected to be obtained by applying the ORCHESTRA concept. Note that we refer to the ORCHESTRA functionalities that were presented in Section 2.2 using the corresponding numbering format ( A.N, where A= ‘MO’ or ‘CO’ or ‘CP’ or ‘OP’, corresponding to the monitoring, correlation, control plane and optimization set of functionalities, and N is the number of the specific functionality in that set).
5.1. Network planning and provisioning with reduced margins
The traditional provisioning approach for optical channels (lightpaths) requires using abundant margins on the optical reach in order to avoid the need of subsequent interventions in these channels despite ageing or particular events (e.g., maintenance operations during the channel lifetime). These margins often force the deployment of 3R regenerators or more robust transponders that, at the time and under the conditions present during the set-up, are not strictly necessary.
Clearly, provisioning with lower margins would be desirable, as it can postpone or avoid the purchase of equipment. This, however, requires new mechanisms in order to anticipate, identify and remedy the problems that could occur at later times due to such initial choice. ORCHESTRA’s accurate and responsive monitoring and control plane serve exactly these needs.
Traditional lightpath provisioning imposes the consideration of abundant margins, which according to [2] are categorized in 3 types:
unallocated margins, when transponder’s reach exceeds the transmission distance;
design margins, due to unknown parameters of the physical layer;
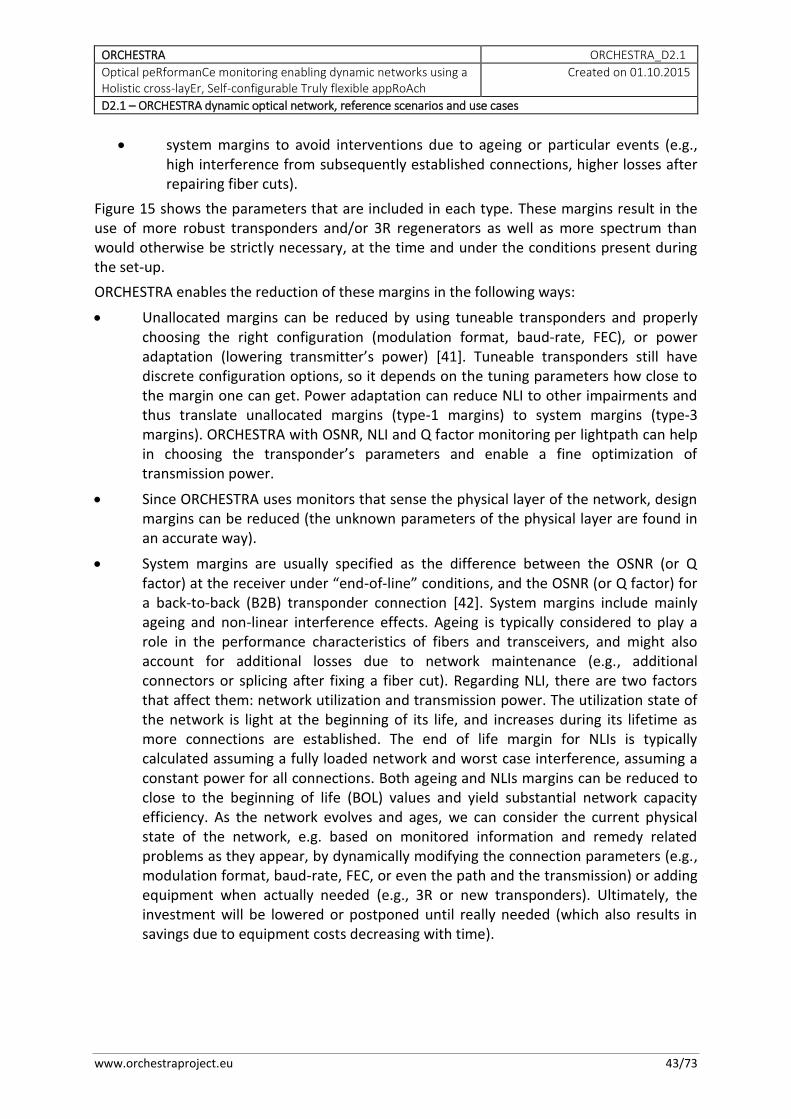
ORCHESTRA ORCHESTRA_D2.1
Optical peRformanCe monitoring enabling dynamic networks using a Holistic cross-layEr, Self-configurable Truly flexible appRoAch
Created on 01.10.2015
D2.1 – ORCHESTRA dynamic optical network, reference scenarios and use cases
www.orchestraproject.eu 43/73
system margins to avoid interventions due to ageing or particular events (e.g., high interference from subsequently established connections, higher losses after repairing fiber cuts).
Figure 15 shows the parameters that are included in each type. These margins result in the use of more robust transponders and/or 3R regenerators as well as more spectrum than would otherwise be strictly necessary, at the time and under the conditions present during the set-up.
ORCHESTRA enables the reduction of these margins in the following ways:
Unallocated margins can be reduced by using tuneable transponders and properly choosing the right configuration (modulation format, baud-rate, FEC), or power adaptation (lowering transmitter’s power) [41]. Tuneable transponders still have discrete configuration options, so it depends on the tuning parameters how close to the margin one can get. Power adaptation can reduce NLI to other impairments and thus translate unallocated margins (type-1 margins) to system margins (type-3 margins). ORCHESTRA with OSNR, NLI and Q factor monitoring per lightpath can help in choosing the transponder’s parameters and enable a fine optimization of transmission power.
Since ORCHESTRA uses monitors that sense the physical layer of the network, design margins can be reduced (the unknown parameters of the physical layer are found in an accurate way).
System margins are usually specified as the difference between the OSNR (or Q factor) at the receiver under “end-of-line” conditions, and the OSNR (or Q factor) for a back-to-back (B2B) transponder connection [42]. System margins include mainly ageing and non-linear interference effects. Ageing is typically considered to play a role in the performance characteristics of fibers and transceivers, and might also account for additional losses due to network maintenance (e.g., additional connectors or splicing after fixing a fiber cut). Regarding NLI, there are two factors that affect them: network utilization and transmission power. The utilization state of the network is light at the beginning of its life, and increases during its lifetime as more connections are established. The end of life margin for NLIs is typically calculated assuming a fully loaded network and worst case interference, assuming a constant power for all connections. Both ageing and NLIs margins can be reduced to close to the beginning of life (BOL) values and yield substantial network capacity efficiency. As the network evolves and ages, we can consider the current physical state of the network, e.g. based on monitored information and remedy related problems as they appear, by dynamically modifying the connection parameters (e.g., modulation format, baud-rate, FEC, or even the path and the transmission) or adding equipment when actually needed (e.g., 3R or new transponders). Ultimately, the investment will be lowered or postponed until really needed (which also results in savings due to equipment costs decreasing with time).
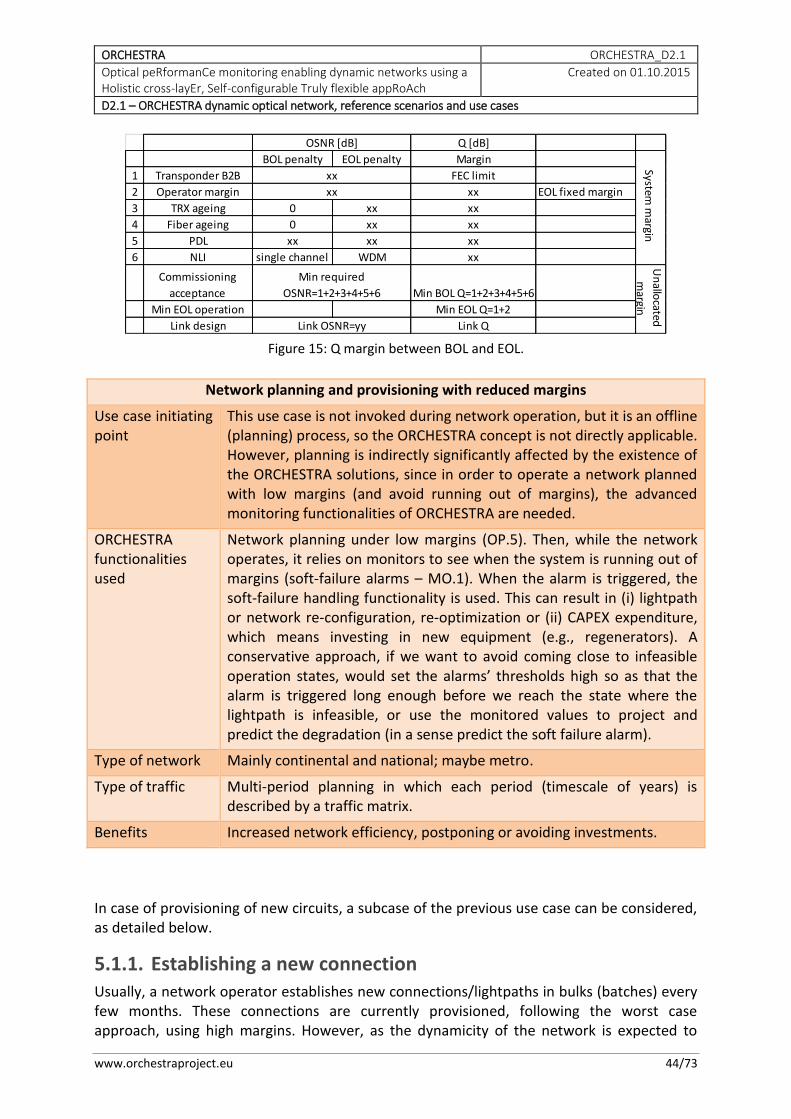
ORCHESTRA ORCHESTRA_D2.1
Optical peRformanCe monitoring enabling dynamic networks using a Holistic cross-layEr, Self-configurable Truly flexible appRoAch
Created on 01.10.2015
D2.1 – ORCHESTRA dynamic optical network, reference scenarios and use cases
www.orchestraproject.eu 44/73
Figure 15: Q margin between BOL and EOL.
Network planning and provisioning with reduced margins
Use case initiating point
This use case is not invoked during network operation, but it is an offline (planning) process, so the ORCHESTRA concept is not directly applicable. However, planning is indirectly significantly affected by the existence of the ORCHESTRA solutions, since in order to operate a network planned with low margins (and avoid running out of margins), the advanced monitoring functionalities of ORCHESTRA are needed.
ORCHESTRA functionalities used
Network planning under low margins (OP.5). Then, while the network operates, it relies on monitors to see when the system is running out of margins (soft-failure alarms – MO.1). When the alarm is triggered, the soft-failure handling functionality is used. This can result in (i) lightpath or network re-configuration, re-optimization or (ii) CAPEX expenditure, which means investing in new equipment (e.g., regenerators). A conservative approach, if we want to avoid coming close to infeasible operation states, would set the alarms’ thresholds high so as that the alarm is triggered long enough before we reach the state where the lightpath is infeasible, or use the monitored values to project and predict the degradation (in a sense predict the soft failure alarm).
Type of network Mainly continental and national; maybe metro.
Type of traffic Multi-period planning in which each period (timescale of years) is described by a traffic matrix.
Benefits Increased network efficiency, postponing or avoiding investments.
In case of provisioning of new circuits, a subcase of the previous use case can be considered, as detailed below.
5.1.1. Establishing a new connection Usually, a network operator establishes new connections/lightpaths in bulks (batches) every few months. These connections are currently provisioned, following the worst case approach, using high margins. However, as the dynamicity of the network is expected to
Q [dB]
BOL penalty EOL penalty Margin
1 Transponder B2B FEC limit
2 Operator margin xx EOL fixed margin
3 TRX ageing 0 xx xx
4 Fiber ageing 0 xx xx
5 PDL xx xx xx
6 NLI single channel WDM xx
Commissioning
acceptance Min BOL Q=1+2+3+4+5+6
Min EOL operation Min EOL Q=1+2
Link design Link Q
System m
arginU
nallo
cated
margin
OSNR [dB]
xx
xx
Min required
OSNR=1+2+3+4+5+6
Link OSNR=yy
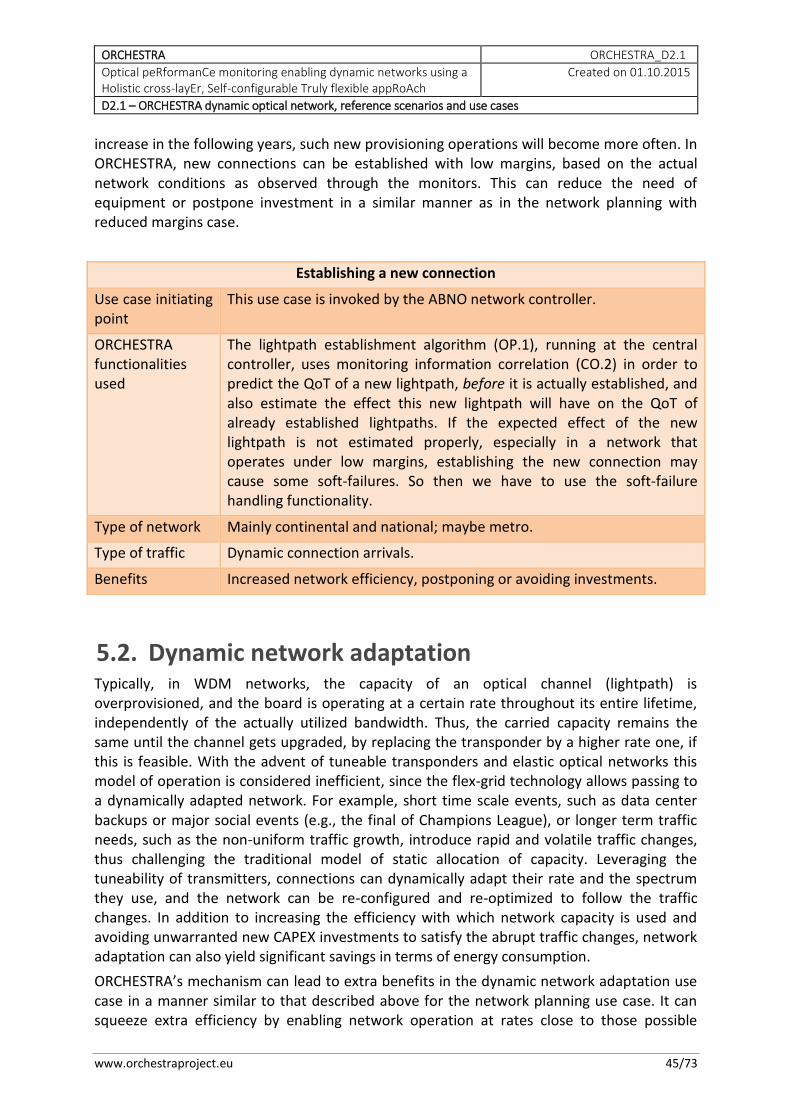
ORCHESTRA ORCHESTRA_D2.1
Optical peRformanCe monitoring enabling dynamic networks using a Holistic cross-layEr, Self-configurable Truly flexible appRoAch
Created on 01.10.2015
D2.1 – ORCHESTRA dynamic optical network, reference scenarios and use cases
www.orchestraproject.eu 45/73
increase in the following years, such new provisioning operations will become more often. In ORCHESTRA, new connections can be established with low margins, based on the actual network conditions as observed through the monitors. This can reduce the need of equipment or postpone investment in a similar manner as in the network planning with reduced margins case.
Establishing a new connection
Use case initiating point
This use case is invoked by the ABNO network controller.
ORCHESTRA functionalities used
The lightpath establishment algorithm (OP.1), running at the central controller, uses monitoring information correlation (CO.2) in order to predict the QoT of a new lightpath, before it is actually established, and also estimate the effect this new lightpath will have on the QoT of already established lightpaths. If the expected effect of the new lightpath is not estimated properly, especially in a network that operates under low margins, establishing the new connection may cause some soft-failures. So then we have to use the soft-failure handling functionality.
Type of network Mainly continental and national; maybe metro.
Type of traffic Dynamic connection arrivals.
Benefits Increased network efficiency, postponing or avoiding investments.
5.2. Dynamic network adaptation Typically, in WDM networks, the capacity of an optical channel (lightpath) is overprovisioned, and the board is operating at a certain rate throughout its entire lifetime, independently of the actually utilized bandwidth. Thus, the carried capacity remains the same until the channel gets upgraded, by replacing the transponder by a higher rate one, if this is feasible. With the advent of tuneable transponders and elastic optical networks this model of operation is considered inefficient, since the flex-grid technology allows passing to a dynamically adapted network. For example, short time scale events, such as data center backups or major social events (e.g., the final of Champions League), or longer term traffic needs, such as the non-uniform traffic growth, introduce rapid and volatile traffic changes, thus challenging the traditional model of static allocation of capacity. Leveraging the tuneability of transmitters, connections can dynamically adapt their rate and the spectrum they use, and the network can be re-configured and re-optimized to follow the traffic changes. In addition to increasing the efficiency with which network capacity is used and avoiding unwarranted new CAPEX investments to satisfy the abrupt traffic changes, network adaptation can also yield significant savings in terms of energy consumption.
ORCHESTRA’s mechanism can lead to extra benefits in the dynamic network adaptation use case in a manner similar to that described above for the network planning use case. It can squeeze extra efficiency by enabling network operation at rates close to those possible
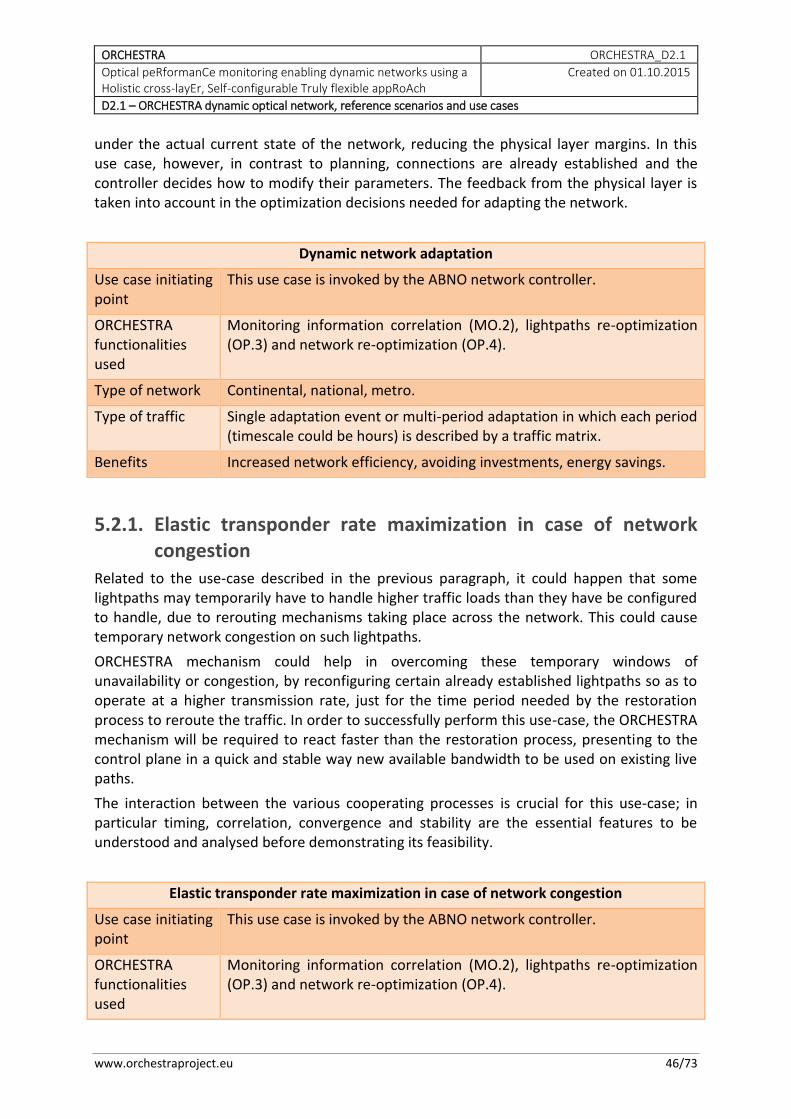
ORCHESTRA ORCHESTRA_D2.1
Optical peRformanCe monitoring enabling dynamic networks using a Holistic cross-layEr, Self-configurable Truly flexible appRoAch
Created on 01.10.2015
D2.1 – ORCHESTRA dynamic optical network, reference scenarios and use cases
www.orchestraproject.eu 46/73
under the actual current state of the network, reducing the physical layer margins. In this use case, however, in contrast to planning, connections are already established and the controller decides how to modify their parameters. The feedback from the physical layer is taken into account in the optimization decisions needed for adapting the network.
Dynamic network adaptation
Use case initiating point
This use case is invoked by the ABNO network controller.
ORCHESTRA functionalities used
Monitoring information correlation (MO.2), lightpaths re-optimization (OP.3) and network re-optimization (OP.4).
Type of network Continental, national, metro.
Type of traffic Single adaptation event or multi-period adaptation in which each period (timescale could be hours) is described by a traffic matrix.
Benefits Increased network efficiency, avoiding investments, energy savings.
5.2.1. Elastic transponder rate maximization in case of network congestion
Related to the use-case described in the previous paragraph, it could happen that some lightpaths may temporarily have to handle higher traffic loads than they have be configured to handle, due to rerouting mechanisms taking place across the network. This could cause temporary network congestion on such lightpaths.
ORCHESTRA mechanism could help in overcoming these temporary windows of unavailability or congestion, by reconfiguring certain already established lightpaths so as to operate at a higher transmission rate, just for the time period needed by the restoration process to reroute the traffic. In order to successfully perform this use-case, the ORCHESTRA mechanism will be required to react faster than the restoration process, presenting to the control plane in a quick and stable way new available bandwidth to be used on existing live paths.
The interaction between the various cooperating processes is crucial for this use-case; in particular timing, correlation, convergence and stability are the essential features to be understood and analysed before demonstrating its feasibility.
Elastic transponder rate maximization in case of network congestion
Use case initiating point
This use case is invoked by the ABNO network controller.
ORCHESTRA functionalities used
Monitoring information correlation (MO.2), lightpaths re-optimization (OP.3) and network re-optimization (OP.4).
ORCHESTRA ORCHESTRA_D2.1
Optical peRformanCe monitoring enabling dynamic networks using a Holistic cross-layEr, Self-configurable Truly flexible appRoAch
Created on 01.10.2015
D2.1 – ORCHESTRA dynamic optical network, reference scenarios and use cases
www.orchestraproject.eu 47/73
Type of network Continental, national, metro.
Type of traffic Protected or restored traffic.
Benefits Increased network efficiency, improvement in restoration time and restoration capabilities.
5.3. Failure prediction, localization and handling Increasing the network availability means reducing the number of QoT degradations and faults in the network. Additionally, it also means improving the efficiency of the maintenance process by forecasting possible degrades and acting to resolve them with controlled, programmed and safe maintenance jobs (see subsection 5.4).
Degrades and faults could be categorized as hard and/or soft failures. A hard failure is a fault on a card, on a node, or on a span, e.g. a fiber cut. Generally, a hard failure often causes the loss of the whole capacity of a link or of multiple links, and generates a complete loss of one or multiple connections. Hard-failures are binary (working or not working) and can be identified through layer-1 OPMs (total power, wavelength power) and a binary check of their output. Today, hard failures in optical networks are typically localized by using the OTN layer alarms that are processed at the network controller.
A soft failure corresponds to a degradation of the QoT (Quality of Transmission) of one or more lightpaths, as opposed to hard failures that result in total loss of one or more connections. A soft failure can be due to the fiber and/or components ageing, malfunction of some of the devices installed, dust, excess noise, excess interference among established lightpaths, etc.
Degradation effects are more relevant and occur mostly if the system is near its transmission limitations and/or is operating with low margin. Transmission limit and optical margin are defined by design rules that are provided by system vendors depending on the deployed technology and the fiber plant.
In case of a failure, and depending on the class of service and the SLA of an affected lightpath, the network management system switches the traffic of the lightpath to another path that is either pre-configured (protection case) or is established when the failure occurs (restoration case). Once the failure is fixed, the traffic is typically reverted back to the initial lightpath.
5.3.1. Hard failure prediction Hard failures, in the form of fiber cuts or equipment failures, are reported to the Network management system and are then appropriately resolved. However, the time between the actual failure and its handling – the service interruption – can be a source of revenue loss, business disruption and many unhappy customers.
ORCHESTRA follows an interesting direction in ensuring business continuity, namely that of using impairment monitoring information to predict hard failures. If a failure is predicted pro-actively (based on the trigger), then protection or restoration operations can be performed before any actual failure and service interruption occur, as opposed to relying on
ORCHESTRA ORCHESTRA_D2.1
Optical peRformanCe monitoring enabling dynamic networks using a Holistic cross-layEr, Self-configurable Truly flexible appRoAch
Created on 01.10.2015
D2.1 – ORCHESTRA dynamic optical network, reference scenarios and use cases
www.orchestraproject.eu 48/73
reactive (upon failure detection) operations. In this way the downtime of the services can be greatly reduced or even eliminated.
According to [8], when the fiber is about to be cut, e.g. due to a digger cutting the buried cable (this corresponds to ~60% of all failures), the vibrations produced cause various effects on the transmission of light that are propagated and can be monitored at the receiver. So for example, monitoring the fluctuation of states of polarization (SOP) is a good indicator for predicting that fiber cut. The method described in [8] needs to obtain SOP measures every 8 ms, keeps a number of past measured values (e.g., 120 values) and processes them using a classifier. Other impairment related parameters, apart from SOP can also be considered towards this purpose. In order to implement the prediction mechanism, a database (DB) is needed at the receiver. Upon an event, a signature is added to the DB (calibration phase) and is used as a reference for comparing/classifying the current link state. The processing is done locally, since transferring related monitoring information via the control plane to some centralized entity seems to incur too much communication overhead and would be slow. So some extra processing power is needed at the receiver to implement the classifier that accesses and compares against the DB. Note that predictions can be wrong (false alarms), and thus we need to analyze the conditions under which gains can be obtained by proactive rerouting when compared to currently used reactive solutions.
The ORCHESTRA concept suits quite well with the failure prediction ideas discussed above, since SOP (along with other parameters that could be examined) can be measured through DSP at the receivers. ORCHESTRA’s virtual monitoring agents can be also involved in the related processing functions (DB maintenance, lookup and classification). An interesting question that can also be examined in ORCHESTRA is related to the degree to which correlation between monitored values can help in the prediction. Correlation can be performed at 2 different levels: (i) at the impairment monitoring/DB level, and (ii) at the alarms’ level. ORCHESTRA will examine whether sharing of impairment monitoring information or the DBs between receivers, e.g. between Rx at the same node, can help the accuracy of the prediction. Moreover, we can correlate failure prediction alarms, in the hierarchical monitoring plane, in order to localize the link at which the failure is about to occur (in multi-hop lightpaths), or implement policies to classify the generated alarms as true or false and improve the accuracy of the predictions, e.g. predicted alarms are false if alarms have not being generated by a certain percentage of lightpaths that pass the link that is predicted to fail.
In case a hard failure is predicted, the control plane performs the corresponding protection/restoration actions. These actions can be based on traditional mechanisms or on ORCHESTRA’s restoration mechanism (next use case). Also, note that if the prediction is true, and after failure is fixed and traffic is reverted back to the original lightpaths, ORCHESTRA can re-optimize these lightpaths (second to next use case).
Hard failure Prediction
Use case initiating point
This use case is invoked by the monitoring plane.
ORCHESTRA functionalities
Hard failure prediction alarms are generated at the receivers (MO.1), alarms correlation (CO.1) and monitoring information correlation (CO.2)
ORCHESTRA ORCHESTRA_D2.1
Optical peRformanCe monitoring enabling dynamic networks using a Holistic cross-layEr, Self-configurable Truly flexible appRoAch
Created on 01.10.2015
D2.1 – ORCHESTRA dynamic optical network, reference scenarios and use cases
www.orchestraproject.eu 49/73
used are used to localize the failure and to implement policies to classify true and false alarms.
Type of network Continental, national, metro.
Type of traffic Traffic matrix, established lightpaths with specific classes of service and a link failure event.
Benefits Increased network availability.
5.3.2. Hard failures localization and fast restoration There are various approaches to localizing and remedying a hard failure. A working (primary) lightpath (W-LP) can have a protecting lightpath (P-LP), which is link/node disjoint from the primary one, relaxing the requirement of exact failure localization. Link protection creates an alternate route between the immediate upstream and downstream nodes of the failure, in order to minimize the signalling effort and recovery time. Preconfigured cycles (p-Cycles) comprise a special class of link/span protection schemes, where spare capacity is allocated and preconfigured in the form of a ring, in order to restore working capacity along the on-cycle links and straddling spans. An important property of p-cycles is that the cycles are fully preconfigured with pre-planned spare capacity and when a span failure happens, only the two end node of the span are reconfigured, but no switching actions are required at any intermediate nodes of the cycles. This is an important speed advantage over restoration schemes and over other protection schemes, where the protection routes are pre-planned but all the switches on the intermediate nodes of these routes need to cross-connect spare capacity in real-time upon a failure. So the above discussed protection and restoration approaches are quite efficient and rely mainly on the alarms generated by the OTN for localizing the failure and initiating the recovery.
It has been observed that a huge number of alarms are generated by OTN in the event of a failure, which can overwhelm the central controller. ORCHESTRA’s monitoring plane will filter and correlate lightpath alarms to localize link failures. These alarms can be better filtered and suppressed in a hierarchical monitoring infrastructure, such as the one developed in ORCHESTRA, than in traditional centralized approaches (NMS or even ABNO controller with a centralized OAM handler). As a part of this filtering process, ORCHESTRA will develop an alternate hard failure localization mechanism that follows the concept of m-trails, where certain lightpaths are established especially for failure localization purposes [43].
Apart from this, ORCHESTRA will study how to develop a mechanism to automate the fault management at local levels and achieve faster failure restoration. The key idea is to avoid relying on processing of the OTN alarms at the central controller, but take decisions that recover from failure at the lower layers of the ORCHESTRA hierarchical monitoring plane. In the basic ORCHESTRA scenario, monitoring agents, at intermediate hierarchy levels, correspond to optical nodes. These agents correlate lightpath alarms, identify a failure on the spot, and perform the necessary switching configurations required to create the backup path, without waiting for any failure notification and path setup request. This is close to the local unambiguous failure localization (L-UFL) concept that is discussed in [44].
ORCHESTRA ORCHESTRA_D2.1
Optical peRformanCe monitoring enabling dynamic networks using a Holistic cross-layEr, Self-configurable Truly flexible appRoAch
Created on 01.10.2015
D2.1 – ORCHESTRA dynamic optical network, reference scenarios and use cases
www.orchestraproject.eu 50/73
Hard failures localization and fast restoration
Use case initiating point
This use case is invoked by the monitoring plane.
ORCHESTRA functionalities used
Hard failure alarms are generated at the receivers (MO.1), alarms correlation (CO.1) is used to filter and localize the failure and to take local recovery decisions.
Type of network Mainly continental and national; maybe metro.
Type of traffic Traffic matrix, established lightpaths and a link failure event.
Benefits Increased network availability.
5.3.3. Soft failures management A soft failure corresponds to a degradation of the QoT (Quality of Transmission) of one or more lightpaths, due to the ageing, malfunctioning of some of the devices installed, excess noise, excess interference among established lightpaths, and other reasons.
The problem of soft-failures localization is more complex than the problem of hard-failures detection. This is because the nature of hard-failures is binary (working or not working) and hard failures can be identified through layer-1 OPMs (total power, wavelength power) and a binary check of their output. Whereas soft failures are not binary (we need to intelligently decide on some related thresholds in order to make them binary), but the main problem is that they fade-out (e.g., a mild OSNR degradation will fade out after a few amplifiers) so that they are hard to identify (hard to define appropriate thresholds) and very hard to localize. Most soft failures require more complicated computations and information provided by layer-2 OPM (PMD, CD, OSNR, NLI, Q-factor etc.) to localize. To the best of our knowledge, the number of papers dealing with soft-failure localization remains quite limited.
Furthermore, we can further differentiate failures into those that are self-reported through the management system (NMS), and those that are not. If some malfunctioning can be detected in a cost-efficient way, the equipment itself will implement a self-diagnostics subsystem and report these types of failures immediately. So the key issue in identifying certain soft-failure cases is to understand how the different optical components (EDFAs, WSSs, ROADMs, transponders) function, the failures that can occur to them, and which of them are and are not reported.
Some examples of not-reported soft failures can be found in [45] and [46] and are listed in the following two paragraphs.
If an EDFA cannot reach its target output power, due to the malfunctioning of the gain control or power loss of the pump laser, this is usually detected and reported to the management system. Similarly, if the output power is too high this will be reported. A “soft-failing” EDFA could generate abnormal ASE noise in comparison to its normal working regime, due to variations of pump laser wavelength, due to ageing, or due to malfunctions of the temperature control system. This additive noise causes a degradation of the OSNR measures. Two factors may prevent an OSNR monitor from capturing the abnormal regime induced by the failing EDFA.
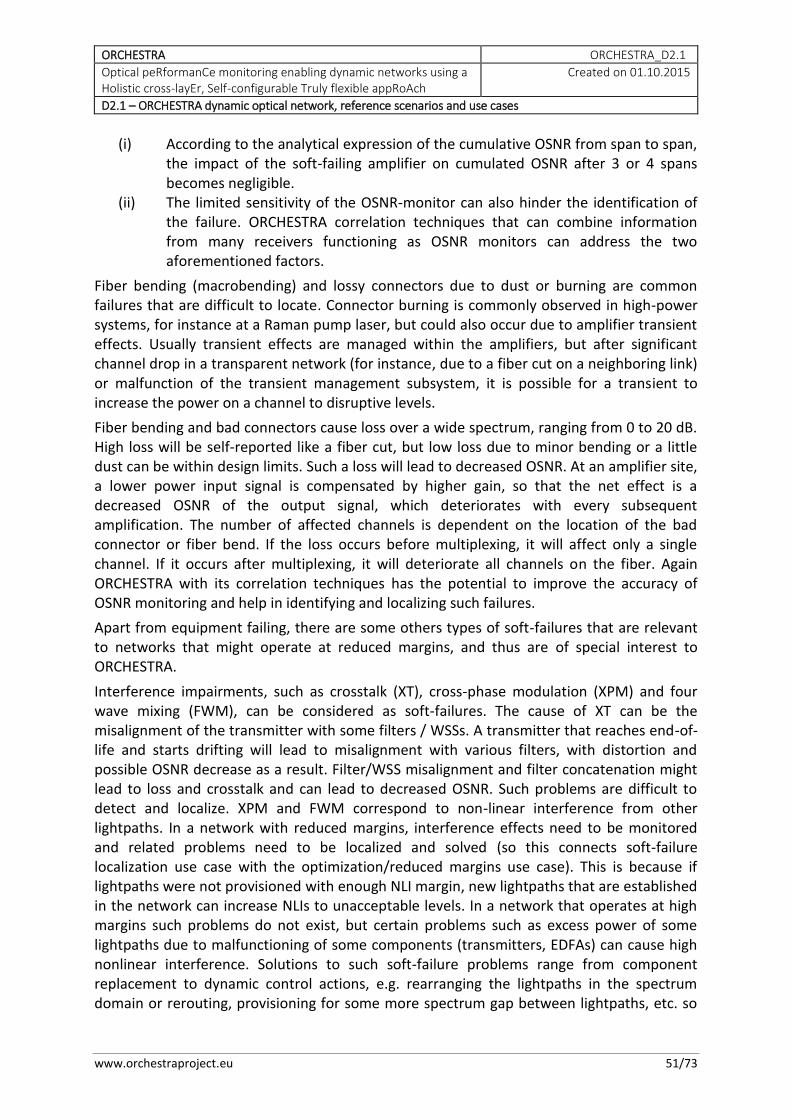
ORCHESTRA ORCHESTRA_D2.1
Optical peRformanCe monitoring enabling dynamic networks using a Holistic cross-layEr, Self-configurable Truly flexible appRoAch
Created on 01.10.2015
D2.1 – ORCHESTRA dynamic optical network, reference scenarios and use cases
www.orchestraproject.eu 51/73
(i) According to the analytical expression of the cumulative OSNR from span to span, the impact of the soft-failing amplifier on cumulated OSNR after 3 or 4 spans becomes negligible.
(ii) The limited sensitivity of the OSNR-monitor can also hinder the identification of the failure. ORCHESTRA correlation techniques that can combine information from many receivers functioning as OSNR monitors can address the two aforementioned factors.
Fiber bending (macrobending) and lossy connectors due to dust or burning are common failures that are difficult to locate. Connector burning is commonly observed in high-power systems, for instance at a Raman pump laser, but could also occur due to amplifier transient effects. Usually transient effects are managed within the amplifiers, but after significant channel drop in a transparent network (for instance, due to a fiber cut on a neighboring link) or malfunction of the transient management subsystem, it is possible for a transient to increase the power on a channel to disruptive levels.
Fiber bending and bad connectors cause loss over a wide spectrum, ranging from 0 to 20 dB. High loss will be self-reported like a fiber cut, but low loss due to minor bending or a little dust can be within design limits. Such a loss will lead to decreased OSNR. At an amplifier site, a lower power input signal is compensated by higher gain, so that the net effect is a decreased OSNR of the output signal, which deteriorates with every subsequent amplification. The number of affected channels is dependent on the location of the bad connector or fiber bend. If the loss occurs before multiplexing, it will affect only a single channel. If it occurs after multiplexing, it will deteriorate all channels on the fiber. Again ORCHESTRA with its correlation techniques has the potential to improve the accuracy of OSNR monitoring and help in identifying and localizing such failures.
Apart from equipment failing, there are some others types of soft-failures that are relevant to networks that might operate at reduced margins, and thus are of special interest to ORCHESTRA.
Interference impairments, such as crosstalk (XT), cross-phase modulation (XPM) and four wave mixing (FWM), can be considered as soft-failures. The cause of XT can be the misalignment of the transmitter with some filters / WSSs. A transmitter that reaches end-of-life and starts drifting will lead to misalignment with various filters, with distortion and possible OSNR decrease as a result. Filter/WSS misalignment and filter concatenation might lead to loss and crosstalk and can lead to decreased OSNR. Such problems are difficult to detect and localize. XPM and FWM correspond to non-linear interference from other lightpaths. In a network with reduced margins, interference effects need to be monitored and related problems need to be localized and solved (so this connects soft-failure localization use case with the optimization/reduced margins use case). This is because if lightpaths were not provisioned with enough NLI margin, new lightpaths that are established in the network can increase NLIs to unacceptable levels. In a network that operates at high margins such problems do not exist, but certain problems such as excess power of some lightpaths due to malfunctioning of some components (transmitters, EDFAs) can cause high nonlinear interference. Solutions to such soft-failure problems range from component replacement to dynamic control actions, e.g. rearranging the lightpaths in the spectrum domain or rerouting, provisioning for some more spectrum gap between lightpaths, etc. so
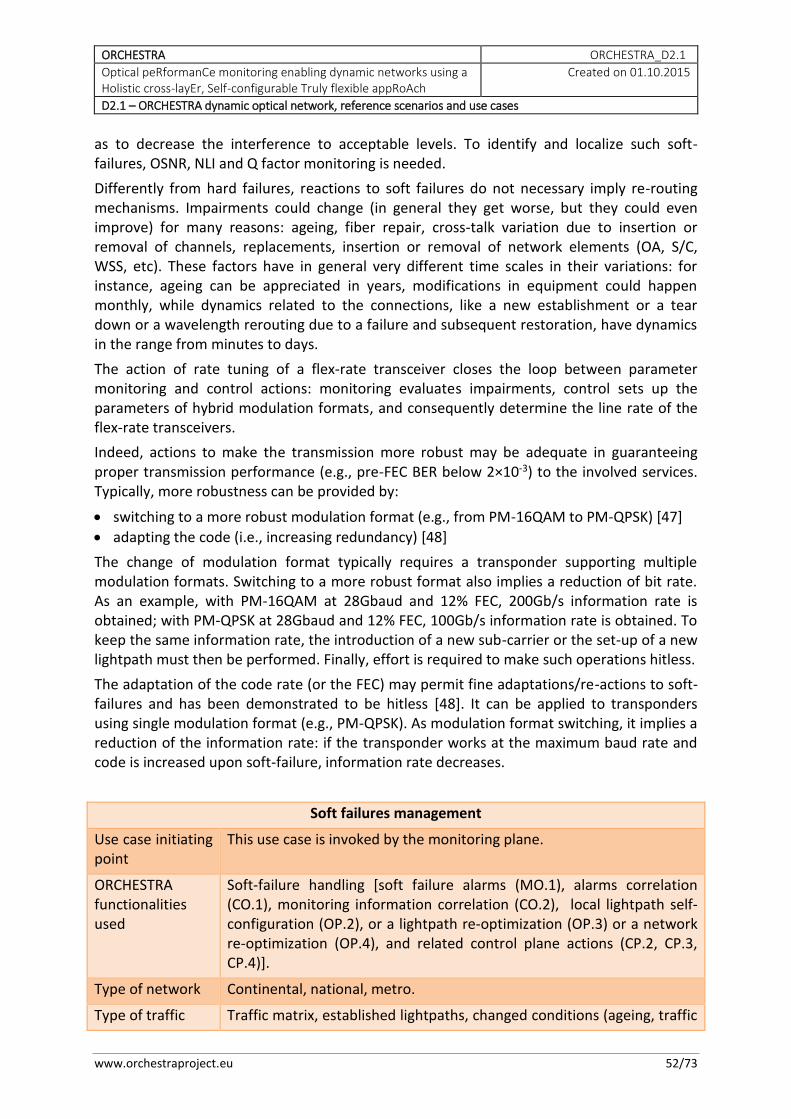
ORCHESTRA ORCHESTRA_D2.1
Optical peRformanCe monitoring enabling dynamic networks using a Holistic cross-layEr, Self-configurable Truly flexible appRoAch
Created on 01.10.2015
D2.1 – ORCHESTRA dynamic optical network, reference scenarios and use cases
www.orchestraproject.eu 52/73
as to decrease the interference to acceptable levels. To identify and localize such soft-failures, OSNR, NLI and Q factor monitoring is needed.
Differently from hard failures, reactions to soft failures do not necessary imply re-routing mechanisms. Impairments could change (in general they get worse, but they could even improve) for many reasons: ageing, fiber repair, cross-talk variation due to insertion or removal of channels, replacements, insertion or removal of network elements (OA, S/C, WSS, etc). These factors have in general very different time scales in their variations: for instance, ageing can be appreciated in years, modifications in equipment could happen monthly, while dynamics related to the connections, like a new establishment or a tear down or a wavelength rerouting due to a failure and subsequent restoration, have dynamics in the range from minutes to days.
The action of rate tuning of a flex-rate transceiver closes the loop between parameter monitoring and control actions: monitoring evaluates impairments, control sets up the parameters of hybrid modulation formats, and consequently determine the line rate of the flex-rate transceivers.
Indeed, actions to make the transmission more robust may be adequate in guaranteeing proper transmission performance (e.g., pre-FEC BER below 2×10⁻³) to the involved services. Typically, more robustness can be provided by:
switching to a more robust modulation format (e.g., from PM-16QAM to PM-QPSK) [47]
adapting the code (i.e., increasing redundancy) [48]
The change of modulation format typically requires a transponder supporting multiple modulation formats. Switching to a more robust format also implies a reduction of bit rate. As an example, with PM-16QAM at 28Gbaud and 12% FEC, 200Gb/s information rate is obtained; with PM-QPSK at 28Gbaud and 12% FEC, 100Gb/s information rate is obtained. To keep the same information rate, the introduction of a new sub-carrier or the set-up of a new lightpath must then be performed. Finally, effort is required to make such operations hitless.
The adaptation of the code rate (or the FEC) may permit fine adaptations/re-actions to soft-failures and has been demonstrated to be hitless [48]. It can be applied to transponders using single modulation format (e.g., PM-QPSK). As modulation format switching, it implies a reduction of the information rate: if the transponder works at the maximum baud rate and code is increased upon soft-failure, information rate decreases.
Soft failures management
Use case initiating point
This use case is invoked by the monitoring plane.
ORCHESTRA functionalities used
Soft-failure handling [soft failure alarms (MO.1), alarms correlation (CO.1), monitoring information correlation (CO.2), local lightpath self-configuration (OP.2), or a lightpath re-optimization (OP.3) or a network re-optimization (OP.4), and related control plane actions (CP.2, CP.3, CP.4)].
Type of network Continental, national, metro.
Type of traffic Traffic matrix, established lightpaths, changed conditions (ageing, traffic
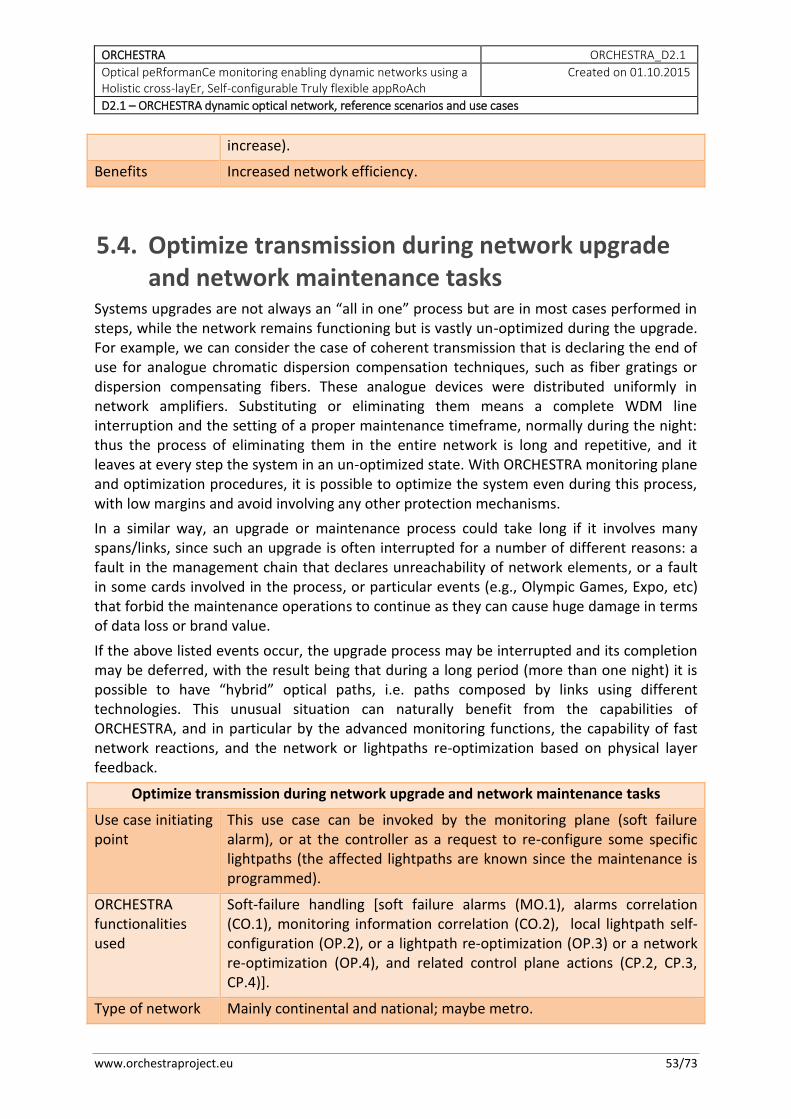
ORCHESTRA ORCHESTRA_D2.1
Optical peRformanCe monitoring enabling dynamic networks using a Holistic cross-layEr, Self-configurable Truly flexible appRoAch
Created on 01.10.2015
D2.1 – ORCHESTRA dynamic optical network, reference scenarios and use cases
www.orchestraproject.eu 53/73
increase).
Benefits Increased network efficiency.
5.4. Optimize transmission during network upgrade and network maintenance tasks
Systems upgrades are not always an “all in one” process but are in most cases performed in steps, while the network remains functioning but is vastly un-optimized during the upgrade. For example, we can consider the case of coherent transmission that is declaring the end of use for analogue chromatic dispersion compensation techniques, such as fiber gratings or dispersion compensating fibers. These analogue devices were distributed uniformly in network amplifiers. Substituting or eliminating them means a complete WDM line interruption and the setting of a proper maintenance timeframe, normally during the night: thus the process of eliminating them in the entire network is long and repetitive, and it leaves at every step the system in an un-optimized state. With ORCHESTRA monitoring plane and optimization procedures, it is possible to optimize the system even during this process, with low margins and avoid involving any other protection mechanisms.
In a similar way, an upgrade or maintenance process could take long if it involves many spans/links, since such an upgrade is often interrupted for a number of different reasons: a fault in the management chain that declares unreachability of network elements, or a fault in some cards involved in the process, or particular events (e.g., Olympic Games, Expo, etc) that forbid the maintenance operations to continue as they can cause huge damage in terms of data loss or brand value.
If the above listed events occur, the upgrade process may be interrupted and its completion may be deferred, with the result being that during a long period (more than one night) it is possible to have “hybrid” optical paths, i.e. paths composed by links using different technologies. This unusual situation can naturally benefit from the capabilities of ORCHESTRA, and in particular by the advanced monitoring functions, the capability of fast network reactions, and the network or lightpaths re-optimization based on physical layer feedback.
Optimize transmission during network upgrade and network maintenance tasks
Use case initiating point
This use case can be invoked by the monitoring plane (soft failure alarm), or at the controller as a request to re-configure some specific lightpaths (the affected lightpaths are known since the maintenance is programmed).
ORCHESTRA functionalities used
Soft-failure handling [soft failure alarms (MO.1), alarms correlation (CO.1), monitoring information correlation (CO.2), local lightpath self-configuration (OP.2), or a lightpath re-optimization (OP.3) or a network re-optimization (OP.4), and related control plane actions (CP.2, CP.3, CP.4)].
Type of network Mainly continental and national; maybe metro.
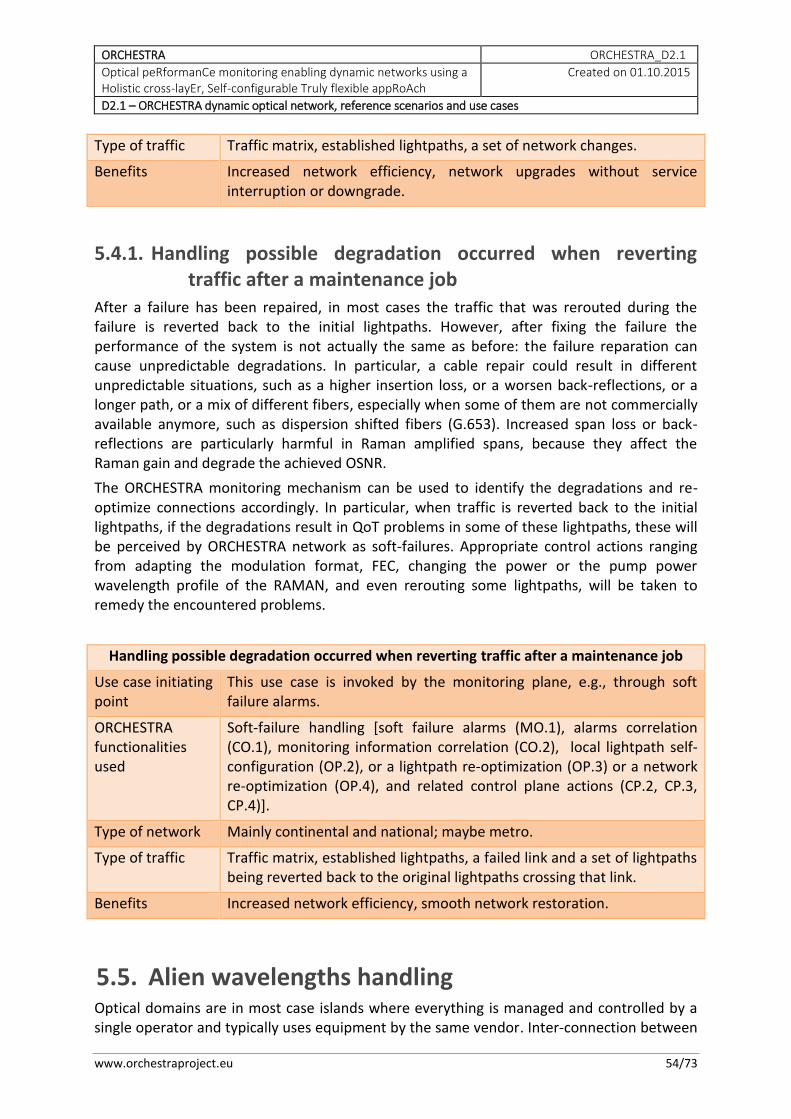
ORCHESTRA ORCHESTRA_D2.1
Optical peRformanCe monitoring enabling dynamic networks using a Holistic cross-layEr, Self-configurable Truly flexible appRoAch
Created on 01.10.2015
D2.1 – ORCHESTRA dynamic optical network, reference scenarios and use cases
www.orchestraproject.eu 54/73
Type of traffic Traffic matrix, established lightpaths, a set of network changes.
Benefits Increased network efficiency, network upgrades without service interruption or downgrade.
5.4.1. Handling possible degradation occurred when reverting traffic after a maintenance job
After a failure has been repaired, in most cases the traffic that was rerouted during the failure is reverted back to the initial lightpaths. However, after fixing the failure the performance of the system is not actually the same as before: the failure reparation can cause unpredictable degradations. In particular, a cable repair could result in different unpredictable situations, such as a higher insertion loss, or a worsen back-reflections, or a longer path, or a mix of different fibers, especially when some of them are not commercially available anymore, such as dispersion shifted fibers (G.653). Increased span loss or back-reflections are particularly harmful in Raman amplified spans, because they affect the Raman gain and degrade the achieved OSNR.
The ORCHESTRA monitoring mechanism can be used to identify the degradations and re-optimize connections accordingly. In particular, when traffic is reverted back to the initial lightpaths, if the degradations result in QoT problems in some of these lightpaths, these will be perceived by ORCHESTRA network as soft-failures. Appropriate control actions ranging from adapting the modulation format, FEC, changing the power or the pump power wavelength profile of the RAMAN, and even rerouting some lightpaths, will be taken to remedy the encountered problems.
Handling possible degradation occurred when reverting traffic after a maintenance job
Use case initiating point
This use case is invoked by the monitoring plane, e.g., through soft failure alarms.
ORCHESTRA functionalities used
Soft-failure handling [soft failure alarms (MO.1), alarms correlation (CO.1), monitoring information correlation (CO.2), local lightpath self-configuration (OP.2), or a lightpath re-optimization (OP.3) or a network re-optimization (OP.4), and related control plane actions (CP.2, CP.3, CP.4)].
Type of network Mainly continental and national; maybe metro.
Type of traffic Traffic matrix, established lightpaths, a failed link and a set of lightpaths being reverted back to the original lightpaths crossing that link.
Benefits Increased network efficiency, smooth network restoration.
5.5. Alien wavelengths handling Optical domains are in most case islands where everything is managed and controlled by a single operator and typically uses equipment by the same vendor. Inter-connection between
ORCHESTRA ORCHESTRA_D2.1
Optical peRformanCe monitoring enabling dynamic networks using a Holistic cross-layEr, Self-configurable Truly flexible appRoAch
Created on 01.10.2015
D2.1 – ORCHESTRA dynamic optical network, reference scenarios and use cases
www.orchestraproject.eu 55/73
client domains and an optical domain was always performed via transponders of the same vendor owned by the operator that converts the client signals to coloured (DWDM) lightpaths. Although, it is possible to use transponders of different vendors or to eliminate the transponders and move the DWDM interface directly into the IP routers at the edges, such practices are not widely followed. In this context, alien lightpaths to a domain are considered those that come from transponders of a different vendor and/or owned by an operator not owning the domain; for example, the alien operator owns the client router with a DWDM interface that connects directly to the DWDM network. The friendly lightpaths (of the operator and specific vendor) can be affected by any sort of misalignment of the alien lightpaths’ technology. It is also hard for the aliens to obtain good QoT/QoS over an unknown domain. And it gets worse with recent technology advancements, in a network where connections use different modulations formats (even worse when formats are dynamically changed), and where the spectrum gap between connections is getting smaller with the adoption of flex-grid technology. So provisioning of aliens looks like a complex feature.
Although aliens are not yet considered as a mature business scenario, in ORCHESTRA we will examine ways to provide efficient solutions to the monitoring problems that arise from alien wavelengths. Following a generic and abstract definition, we will consider an alien as a lightpath for which we do not know its transmission parameters (it has unknown transmission power, modulation format, and uses unknown amount of spectrum) and for which the network has allocated a specific spectrum over a path. Having the alien transmission parameters unknown, ORCHESTRA will rely on monitoring of the friendly lightpaths and correlation algorithms to identify the transmission parameters of the alien and sense whether the alien causes interference problems to the friendly lightpaths.
A way to include alien wavelength in ORCHESTRA use cases is to consider them as causes of soft-failures. In particular, we can assume that an alien is a lightpath that has unknown power and frequency. So it can be considered as a source of interference (XT or NLI) related soft-failures [49].
Alien wavelength handling
Use case initiating point
This use case starts at the monitoring plane, where the presence of an alien wavelength raises a number of soft failure alarms
ORCHESTRA functionalities used
variation of soft-failure handling - we do not know the full characteristics of the alien [soft failure alarms (MO.1), alarms correlation (CO.1), monitoring information correlation (CO.2), local lightpath self-configuration (OP.2), or a lightpath re-optimization (OP.3) or a network re-optimization (OP.4), and related control plane actions (CP.2, CP.3, CP.4)].
Type of network Mainly metro (e.g. connecting two data centers) but can also be continental or national.
Type of traffic Traffic matrix, established lightpaths, an alien wavelength with unknown transmission parameters.
Benefits Increased network efficiency, new business model.
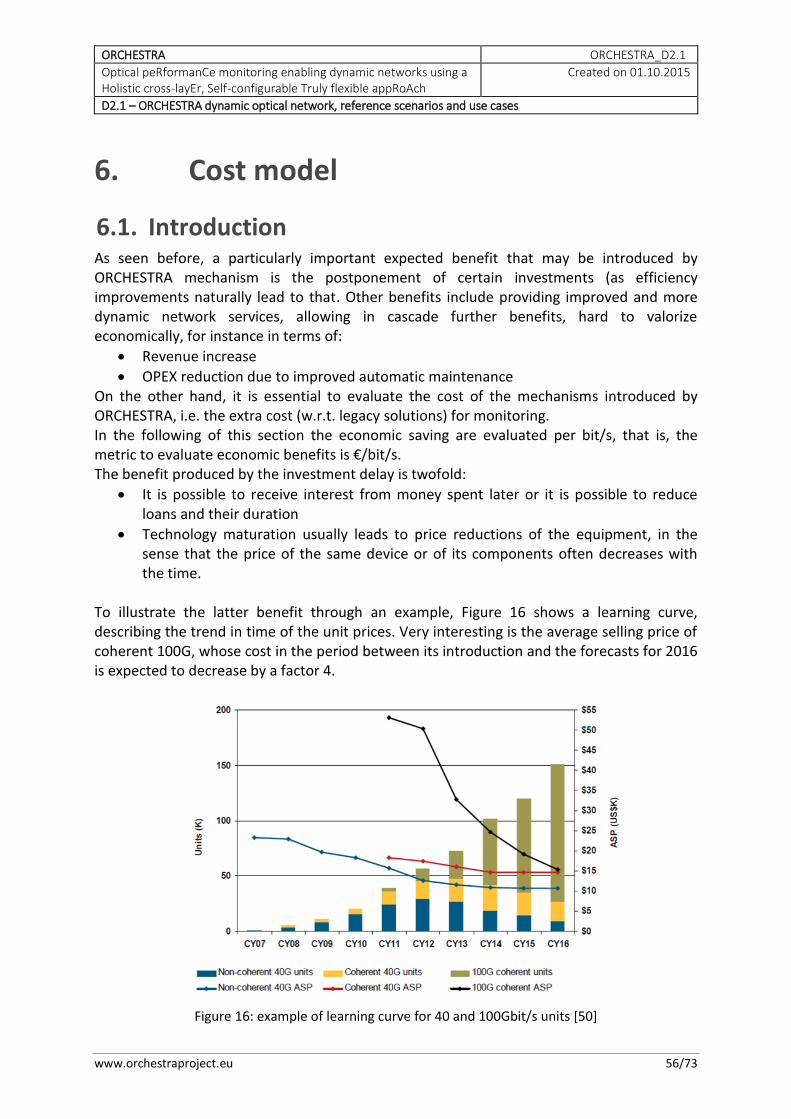
ORCHESTRA ORCHESTRA_D2.1
Optical peRformanCe monitoring enabling dynamic networks using a Holistic cross-layEr, Self-configurable Truly flexible appRoAch
Created on 01.10.2015
D2.1 – ORCHESTRA dynamic optical network, reference scenarios and use cases
www.orchestraproject.eu 56/73
6. Cost model
6.1. Introduction As seen before, a particularly important expected benefit that may be introduced by ORCHESTRA mechanism is the postponement of certain investments (as efficiency improvements naturally lead to that. Other benefits include providing improved and more dynamic network services, allowing in cascade further benefits, hard to valorize economically, for instance in terms of:
Revenue increase
OPEX reduction due to improved automatic maintenance On the other hand, it is essential to evaluate the cost of the mechanisms introduced by ORCHESTRA, i.e. the extra cost (w.r.t. legacy solutions) for monitoring. In the following of this section the economic saving are evaluated per bit/s, that is, the metric to evaluate economic benefits is €/bit/s. The benefit produced by the investment delay is twofold:
It is possible to receive interest from money spent later or it is possible to reduce loans and their duration
Technology maturation usually leads to price reductions of the equipment, in the sense that the price of the same device or of its components often decreases with the time.
To illustrate the latter benefit through an example, Figure 16 shows a learning curve, describing the trend in time of the unit prices. Very interesting is the average selling price of coherent 100G, whose cost in the period between its introduction and the forecasts for 2016 is expected to decrease by a factor 4.
Figure 16: example of learning curve for 40 and 100Gbit/s units [50]
ORCHESTRA ORCHESTRA_D2.1
Optical peRformanCe monitoring enabling dynamic networks using a Holistic cross-layEr, Self-configurable Truly flexible appRoAch
Created on 01.10.2015
D2.1 – ORCHESTRA dynamic optical network, reference scenarios and use cases
www.orchestraproject.eu 57/73
6.2. Methods analysis
6.2.1. Symbols and nomenclature Before going into the details of the method we will use in evaluating the ORCHESTRA benefits, it is essential to describe some notation and nomenclature:
The legacy scenario (without the implementation of the ORCHESTRA mechanism) is identified with the letter A, while the ORCHESTRA scenario with the letter B. For some parameter (e.g., traffic) referring to a particular scenario the corresponding letter will be placed as apex.
Time
o t0 – time when the mechanism studied in this project is installed in the ORCHESTRA network and the observation starts.
o tn ( n ≥1) – observation instants to compare legacy with ORCHESTRA network
Traffic. The traffic is indicated with the letter B (bit/s).
Capex. It refers to the investment necessary to build the network starting from a green field situation, and is indicated with the letter C. It usually refers to a cost per bit/s [€/bit/s]
6.3. Cost evaluation (entire network) The scenario A is considered at t0 in a reference network (nodes and links) with its traffic load B0
A expressed as a traffic matrix, which also accounts for the protection requirements ofr each flow.
After this the process is:
routing (to route each traffic demand in the reference network)
dimensioning (to calculate the equipment for each node and link)
calculate the entire cost of the network (network equipment multiplied by cost of components)
split the entire cost per B (cost per bit/s)
Following this approach, the result is C0A [€/bit/s], representing the cost (per bit/s)
transferred by the (legacy) network that does not adopt ORCHESTRA mechanism at time t0 with traffic load B0 .
Scenario B uses the same reference network and the same traffic matrix B0 used in scenario A, with the main (important) difference being that scenario B adopts the ORCHESTRA mechanism. The money savings that result from this difference is the key in evaluating the OCHESTRA solutions. In fact, in scenario A routing and dimensioning take into account the margins imposed by current Carriers’ provisioning strategies. In the absence of ORCHESTRA mechanisms, these margins are necessary to provide the required robustness of the provisioned circuits to ageing of devices/components, degradation of performance after a repair, etc.
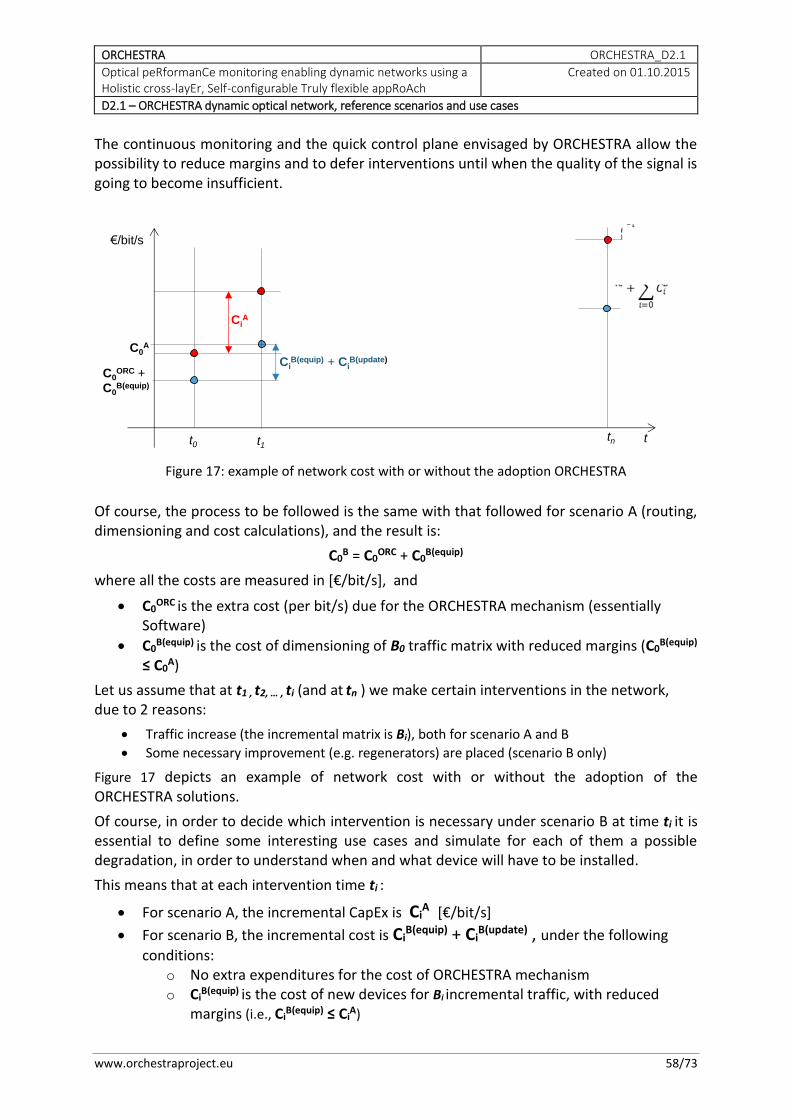
ORCHESTRA ORCHESTRA_D2.1
Optical peRformanCe monitoring enabling dynamic networks using a Holistic cross-layEr, Self-configurable Truly flexible appRoAch
Created on 01.10.2015
D2.1 – ORCHESTRA dynamic optical network, reference scenarios and use cases
www.orchestraproject.eu 58/73
The continuous monitoring and the quick control plane envisaged by ORCHESTRA allow the possibility to reduce margins and to defer interventions until when the quality of the signal is going to become insufficient.
Figure 17: example of network cost with or without the adoption ORCHESTRA
Of course, the process to be followed is the same with that followed for scenario A (routing, dimensioning and cost calculations), and the result is:
C0B = C0
ORC + C0B(equip)
where all the costs are measured in [€/bit/s], and
C0ORC is the extra cost (per bit/s) due for the ORCHESTRA mechanism (essentially
Software)
C0B(equip) is the cost of dimensioning of B0 traffic matrix with reduced margins (C0
B(equip) ≤ C0
A)
Let us assume that at t1 , t2, … , ti (and at tn ) we make certain interventions in the network, due to 2 reasons:
Traffic increase (the incremental matrix is Bi), both for scenario A and B
Some necessary improvement (e.g. regenerators) are placed (scenario B only)
Figure 17 depicts an example of network cost with or without the adoption of the ORCHESTRA solutions.
Of course, in order to decide which intervention is necessary under scenario B at time ti it is essential to define some interesting use cases and simulate for each of them a possible degradation, in order to understand when and what device will have to be installed.
This means that at each intervention time ti :
For scenario A, the incremental CapEx is CiA [€/bit/s]
For scenario B, the incremental cost is CiB(equip) + Ci
B(update) , under the following
conditions: o No extra expenditures for the cost of ORCHESTRA mechanism o Ci
B(equip) is the cost of new devices for Bi incremental traffic, with reduced margins (i.e., Ci
B(equip) ≤ CiA)
€/bit/s
t0
C0A
C0ORC +
C0B(equip)
t1
CiB(equip) + Ci
B(update)
CiA
tn t
ORCHESTRA ORCHESTRA_D2.1
Optical peRformanCe monitoring enabling dynamic networks using a Holistic cross-layEr, Self-configurable Truly flexible appRoAch
Created on 01.10.2015
D2.1 – ORCHESTRA dynamic optical network, reference scenarios and use cases
www.orchestraproject.eu 59/73
o CiB(update) is the cost of the devices/components (e.g., regenerators) necessary
to update previous provisioned circuits with reduced margins that at ti begin to have insufficient quality.
It is important to note that CiB(equip) ≤ Ci
A because, for the same traffic that has to be routed under scenario B, reduced margins are considered. Furthermore, the incremental cost of the devices that will become necessary in the future under scenario B will allow money savings w.r.t. scenario A, because it is possible that (a) these devices (preventively installed in A) will never become necessary or (b) their cost may have decreased by the time they are used (the same device or components will cost less in the future). Furthermore it is important to take into account the revaluation of money that is not-spent.
The conclusion is that
𝐶𝑇𝑂𝑇,𝑛𝐴 = ∑ 𝐶𝑖
𝐴
𝑛
𝑖=0
𝐶𝑇𝑂𝑇,𝑛𝐵 = 𝐶0
𝑂𝑅𝐶 + ∑ 𝐶𝑖𝐵
𝑛
𝑖=0
− 𝑅 ∑(𝐶𝑖+1𝐴 − 𝐶𝑖+1
𝐵 )
𝑛
𝑖=0
where R is the interest rate.
6.4. Alternative method: use cases and statistical projection on the entire network
Under some conditions it might be hard or too time consuming to evaluate the cost per bit/s of the entire network. For this reason, in addition to the method described in the previous section, where a reference network, an evolutionary traffic matrix and a dimensioning tool that is run several times are necessary, it would be useful to adopt an alternative method, which leads to similar results (often more accurate) with less effort.
The steps of the alternative method are the following:
Identify some use cases, similarly to method 1, representing situations that can potentially benefit from ORCHESTRA mechanism
For each use case we will analyze the economic benefits using the same method adopted previously for the entire network. If k is the case study, the benefit corresponding to this use case is:
o 𝐶𝑇𝑂𝑇,𝑛𝐴,𝑘 − 𝐶𝑇𝑂𝑇,𝑛
𝐵,𝑘 = ∑ (𝐶𝑖𝐴,𝑘𝑛
𝑖=0 − 𝐶𝑖𝐵,𝑘) + 𝑅 ∑ (𝐶𝑖+1
𝐴,𝑘 − 𝐶𝑖+1𝐵,𝑘)𝑛
𝑖=0
Furthermore we should estimate (statistically) how many situations similar to the highlighted uses cases we can find in the network and, from there, estimate the benefit for the whole network.
Just for completeness, in order to give a comparison between the two methods, we report the list of data necessary to implement the method where the entire network is dimensioned and evaluated (“method 1”):
Reference network topology (detailed links and nodes location)
Incremental traffic matrix. A traffic matrix (consisting of end-points, bitrate and required QoS) for each ti.
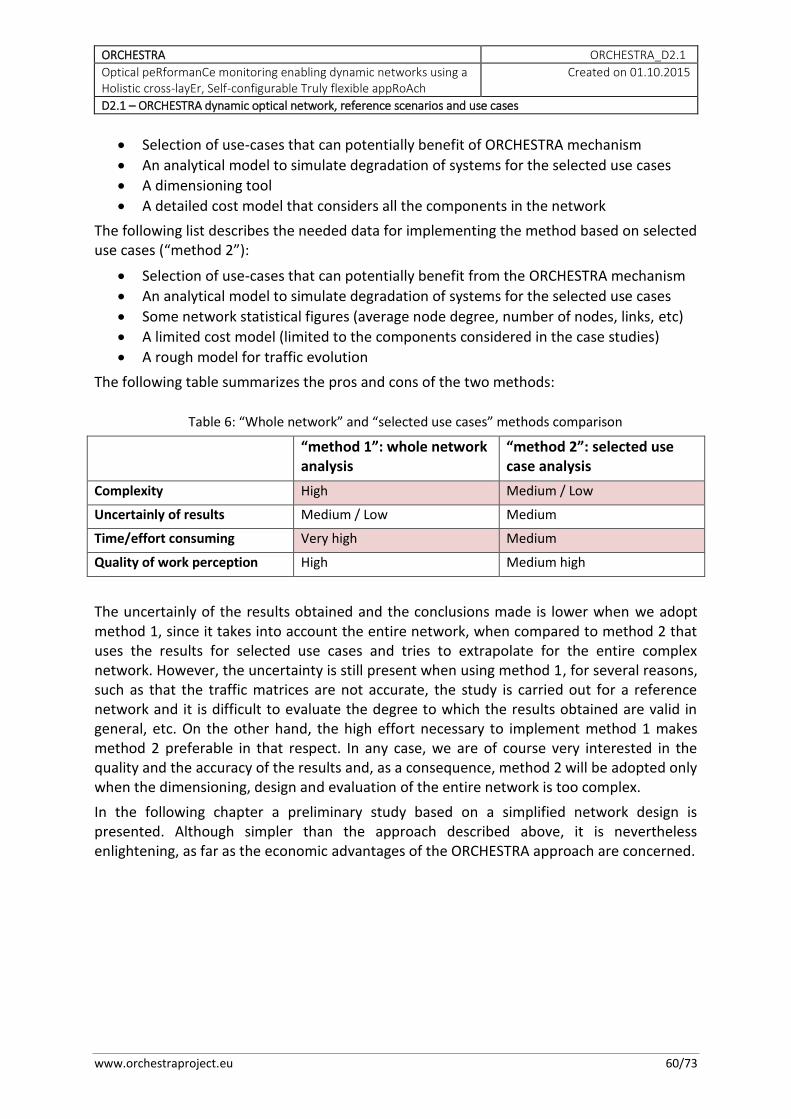
ORCHESTRA ORCHESTRA_D2.1
Optical peRformanCe monitoring enabling dynamic networks using a Holistic cross-layEr, Self-configurable Truly flexible appRoAch
Created on 01.10.2015
D2.1 – ORCHESTRA dynamic optical network, reference scenarios and use cases
www.orchestraproject.eu 60/73
Selection of use-cases that can potentially benefit of ORCHESTRA mechanism
An analytical model to simulate degradation of systems for the selected use cases
A dimensioning tool
A detailed cost model that considers all the components in the network
The following list describes the needed data for implementing the method based on selected use cases (“method 2”):
Selection of use-cases that can potentially benefit from the ORCHESTRA mechanism
An analytical model to simulate degradation of systems for the selected use cases
Some network statistical figures (average node degree, number of nodes, links, etc)
A limited cost model (limited to the components considered in the case studies)
A rough model for traffic evolution
The following table summarizes the pros and cons of the two methods:
Table 6: “Whole network” and “selected use cases” methods comparison
“method 1”: whole network analysis
“method 2”: selected use case analysis
Complexity High Medium / Low
Uncertainly of results Medium / Low Medium
Time/effort consuming Very high Medium
Quality of work perception High Medium high
The uncertainly of the results obtained and the conclusions made is lower when we adopt method 1, since it takes into account the entire network, when compared to method 2 that uses the results for selected use cases and tries to extrapolate for the entire complex network. However, the uncertainty is still present when using method 1, for several reasons, such as that the traffic matrices are not accurate, the study is carried out for a reference network and it is difficult to evaluate the degree to which the results obtained are valid in general, etc. On the other hand, the high effort necessary to implement method 1 makes method 2 preferable in that respect. In any case, we are of course very interested in the quality and the accuracy of the results and, as a consequence, method 2 will be adopted only when the dimensioning, design and evaluation of the entire network is too complex.
In the following chapter a preliminary study based on a simplified network design is presented. Although simpler than the approach described above, it is nevertheless enlightening, as far as the economic advantages of the ORCHESTRA approach are concerned.
ORCHESTRA ORCHESTRA_D2.1
Optical peRformanCe monitoring enabling dynamic networks using a Holistic cross-layEr, Self-configurable Truly flexible appRoAch
Created on 01.10.2015
D2.1 – ORCHESTRA dynamic optical network, reference scenarios and use cases
www.orchestraproject.eu 61/73
7. Multi-period transponder and regenerator placement
In this section we present a preliminary study based on the network planning and provisioning with reduced margins use case (Section 5.1), which as mentioned earlier results in postponing investments. The goal of this study is to show the potential of the ORCHESTRA solution, and to drive and inspire the future studies in the direction of evaluating the expected benefits.
In optical networks, both system parameters and load conditions change with time. The QoT performance of the network (i. e., the resulting OSNR on a given path, which results in a maximum reach for a given Modulation Format and FEC type) is expected to get worse with time, essentially due to system ageing (increase in fiber loss with ageing, repairs after fiber cuts, deterioration of junctions, electronics and optics ageing etc) and load increasing, through increased interaction among channels.
Thus far, the conventional approach in Optical Networks (ON) design has been to introduce high margins (some dBs) targeted at the end of life of the network (5 to 10 years from the start of the network deployment) [2][3].
There are several drawbacks of a conventional approach to ON design, with the main drawback being that the systems are utilized below their actual performance level for a long period of time (years). Thus, some unnecessary investments are anticipated in time, e.g. a number of regenerators are installed although they may not be strictly necessary for a while, equipment with a higher than necessary performance (e.g., with lower sensitivity to OSNR) are installed, more bandwidth than necessary) is allocated in advance (e.g., BPSK instead of QPSK is used for the same client rate), etc.
The proposed ORCHESTRA methodology is to take a multi-period perspective covering the entire Network lifecycle. In the following, we present a preliminary study based on an approach for multi-period transponder selection and regenerator placement in the presence of optical system parameters deterioration. The approach is very simple and based on basic heuristics, and the design of the network relies on a simplified procedure.
The basic idea is that one could perform an initial ON design with a reduced margin calibrated for the first short period (e.g., 1 year) of the network operation. This allows to reduce the number of regenerator points and the use of higher order Modulation Formats (with a higher Spectral Efficiency), assuming that Modulation Format Variable Transponders (MFVT) are availableFigure 18. Figure 18 shows how MFVT could be used in two different configurations to carry 100 Gb/s of client traffic: with one carrier DP-QPSK (top) on a path of 1000 km and with two carriers DP-BPSK (bottom) on a path of 1500 km.
An increased margin to network design would be applied in subsequent years: this increases the total number of regenerators and the possible displacement of the already installed ones, and requires also a change of the modulation format on MFVT (from QPSK to BPSK) on some of the paths.
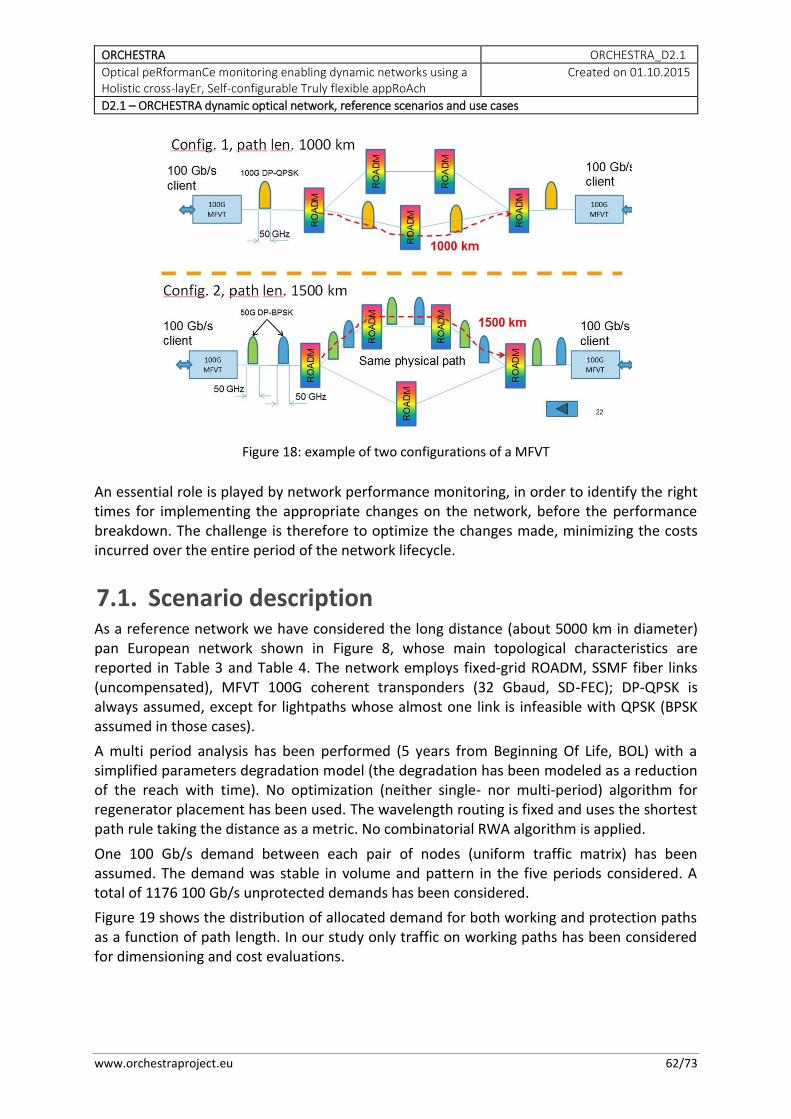
ORCHESTRA ORCHESTRA_D2.1
Optical peRformanCe monitoring enabling dynamic networks using a Holistic cross-layEr, Self-configurable Truly flexible appRoAch
Created on 01.10.2015
D2.1 – ORCHESTRA dynamic optical network, reference scenarios and use cases
www.orchestraproject.eu 62/73
Figure 18: example of two configurations of a MFVT
An essential role is played by network performance monitoring, in order to identify the right times for implementing the appropriate changes on the network, before the performance breakdown. The challenge is therefore to optimize the changes made, minimizing the costs incurred over the entire period of the network lifecycle.
7.1. Scenario description As a reference network we have considered the long distance (about 5000 km in diameter) pan European network shown in Figure 8, whose main topological characteristics are reported in Table 3 and Table 4. The network employs fixed-grid ROADM, SSMF fiber links (uncompensated), MFVT 100G coherent transponders (32 Gbaud, SD-FEC); DP-QPSK is always assumed, except for lightpaths whose almost one link is infeasible with QPSK (BPSK assumed in those cases).
A multi period analysis has been performed (5 years from Beginning Of Life, BOL) with a simplified parameters degradation model (the degradation has been modeled as a reduction of the reach with time). No optimization (neither single- nor multi-period) algorithm for regenerator placement has been used. The wavelength routing is fixed and uses the shortest path rule taking the distance as a metric. No combinatorial RWA algorithm is applied.
One 100 Gb/s demand between each pair of nodes (uniform traffic matrix) has been assumed. The demand was stable in volume and pattern in the five periods considered. A total of 1176 100 Gb/s unprotected demands has been considered.
Figure 19 shows the distribution of allocated demand for both working and protection paths as a function of path length. In our study only traffic on working paths has been considered for dimensioning and cost evaluations.
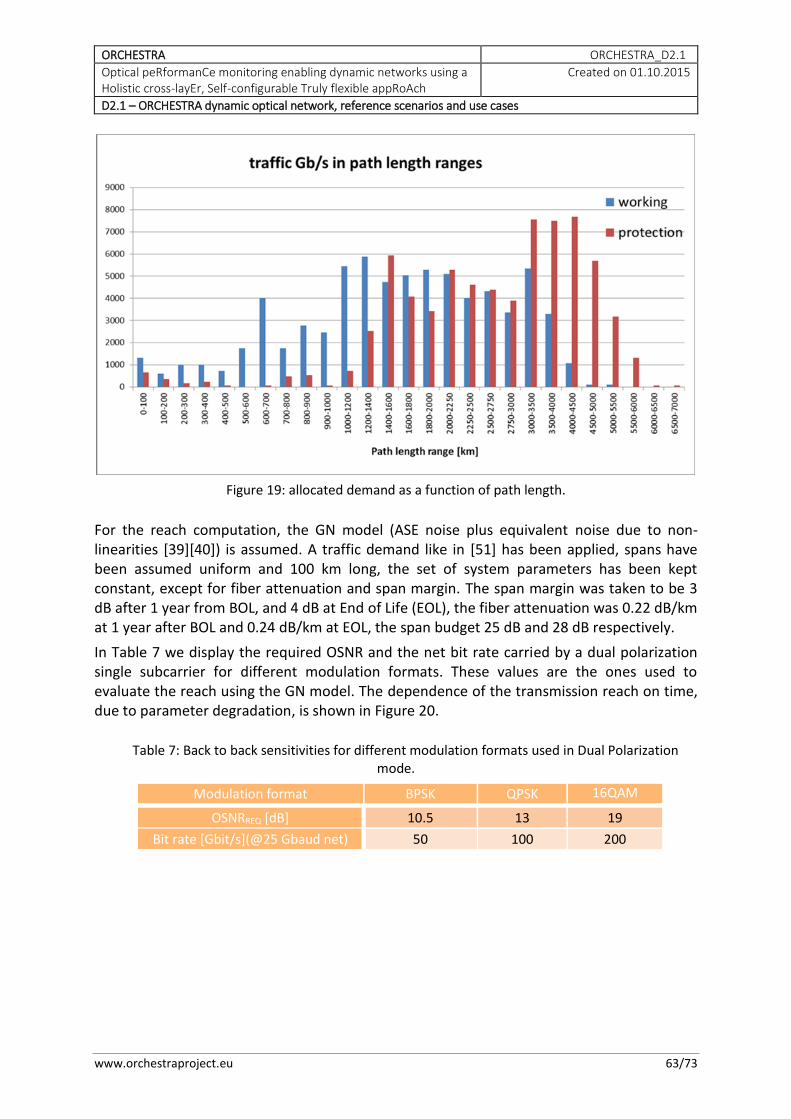
ORCHESTRA ORCHESTRA_D2.1
Optical peRformanCe monitoring enabling dynamic networks using a Holistic cross-layEr, Self-configurable Truly flexible appRoAch
Created on 01.10.2015
D2.1 – ORCHESTRA dynamic optical network, reference scenarios and use cases
www.orchestraproject.eu 63/73
Figure 19: allocated demand as a function of path length.
For the reach computation, the GN model (ASE noise plus equivalent noise due to non-linearities [39][40]) is assumed. A traffic demand like in [51] has been applied, spans have been assumed uniform and 100 km long, the set of system parameters has been kept constant, except for fiber attenuation and span margin. The span margin was taken to be 3 dB after 1 year from BOL, and 4 dB at End of Life (EOL), the fiber attenuation was 0.22 dB/km at 1 year after BOL and 0.24 dB/km at EOL, the span budget 25 dB and 28 dB respectively.
In Table 7 we display the required OSNR and the net bit rate carried by a dual polarization single subcarrier for different modulation formats. These values are the ones used to evaluate the reach using the GN model. The dependence of the transmission reach on time, due to parameter degradation, is shown in Figure 20.
Table 7: Back to back sensitivities for different modulation formats used in Dual Polarization mode.
Modulation format BPSK QPSK 16QAM
OSNRREQ [dB] 10.5 13 19
Bit rate [Gbit/s](@25 Gbaud net) 50 100 200
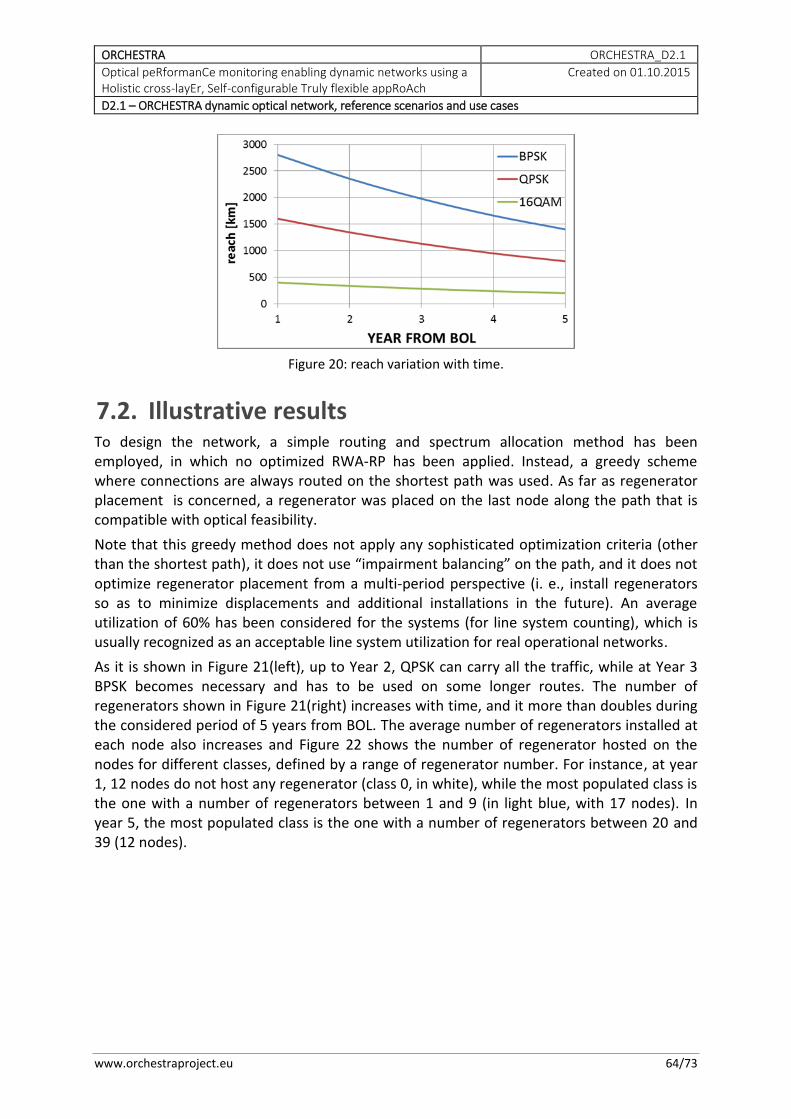
ORCHESTRA ORCHESTRA_D2.1
Optical peRformanCe monitoring enabling dynamic networks using a Holistic cross-layEr, Self-configurable Truly flexible appRoAch
Created on 01.10.2015
D2.1 – ORCHESTRA dynamic optical network, reference scenarios and use cases
www.orchestraproject.eu 64/73
Figure 20: reach variation with time.
7.2. Illustrative results To design the network, a simple routing and spectrum allocation method has been employed, in which no optimized RWA-RP has been applied. Instead, a greedy scheme where connections are always routed on the shortest path was used. As far as regenerator placement is concerned, a regenerator was placed on the last node along the path that is compatible with optical feasibility.
Note that this greedy method does not apply any sophisticated optimization criteria (other than the shortest path), it does not use “impairment balancing” on the path, and it does not optimize regenerator placement from a multi-period perspective (i. e., install regenerators so as to minimize displacements and additional installations in the future). An average utilization of 60% has been considered for the systems (for line system counting), which is usually recognized as an acceptable line system utilization for real operational networks.
As it is shown in Figure 21(left), up to Year 2, QPSK can carry all the traffic, while at Year 3 BPSK becomes necessary and has to be used on some longer routes. The number of regenerators shown in Figure 21(right) increases with time, and it more than doubles during the considered period of 5 years from BOL. The average number of regenerators installed at each node also increases and Figure 22 shows the number of regenerator hosted on the nodes for different classes, defined by a range of regenerator number. For instance, at year 1, 12 nodes do not host any regenerator (class 0, in white), while the most populated class is the one with a number of regenerators between 1 and 9 (in light blue, with 17 nodes). In year 5, the most populated class is the one with a number of regenerators between 20 and 39 (12 nodes).
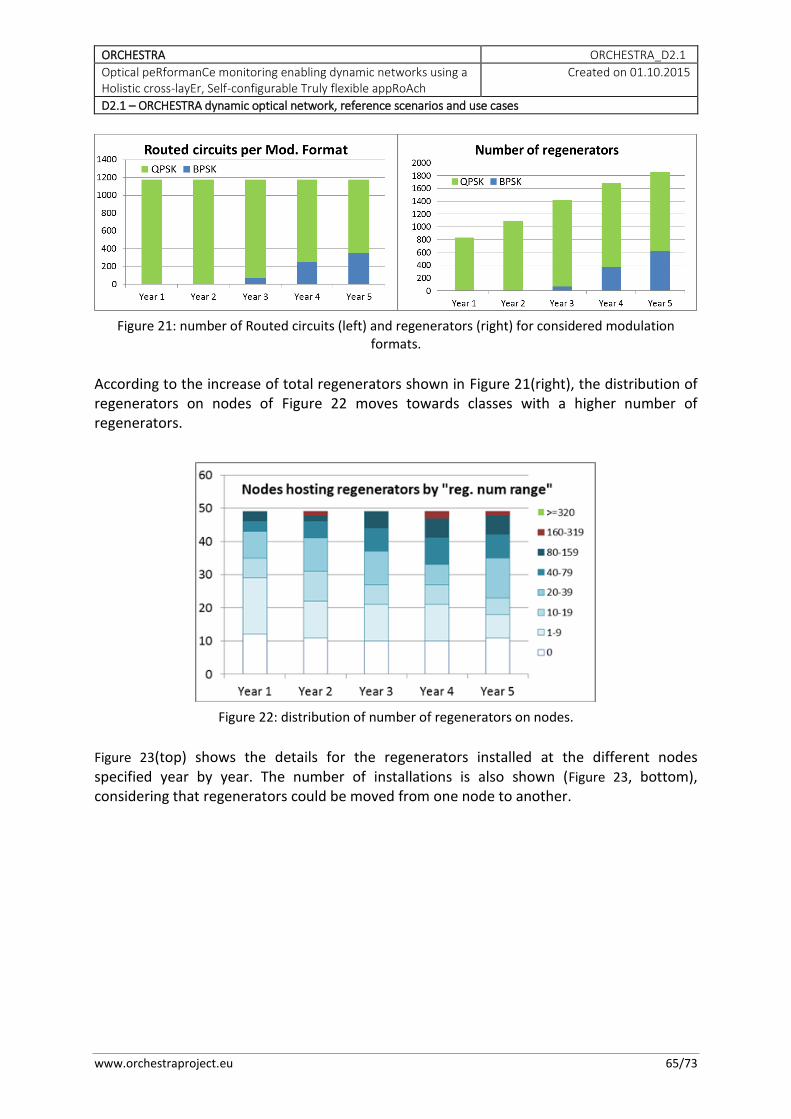
ORCHESTRA ORCHESTRA_D2.1
Optical peRformanCe monitoring enabling dynamic networks using a Holistic cross-layEr, Self-configurable Truly flexible appRoAch
Created on 01.10.2015
D2.1 – ORCHESTRA dynamic optical network, reference scenarios and use cases
www.orchestraproject.eu 65/73
Figure 21: number of Routed circuits (left) and regenerators (right) for considered modulation formats.
According to the increase of total regenerators shown in Figure 21(right), the distribution of regenerators on nodes of Figure 22 moves towards classes with a higher number of regenerators.
Figure 22: distribution of number of regenerators on nodes.
Figure 23(top) shows the details for the regenerators installed at the different nodes specified year by year. The number of installations is also shown (Figure 23, bottom), considering that regenerators could be moved from one node to another.
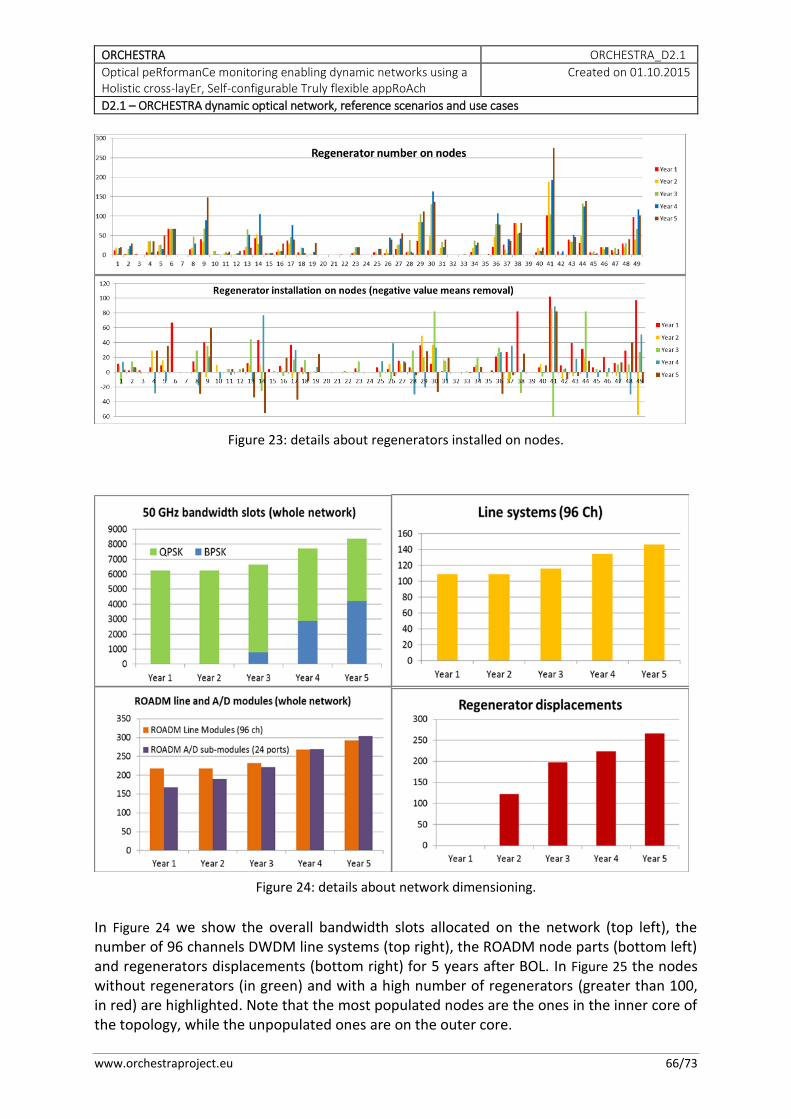
ORCHESTRA ORCHESTRA_D2.1
Optical peRformanCe monitoring enabling dynamic networks using a Holistic cross-layEr, Self-configurable Truly flexible appRoAch
Created on 01.10.2015
D2.1 – ORCHESTRA dynamic optical network, reference scenarios and use cases
www.orchestraproject.eu 66/73
Figure 23: details about regenerators installed on nodes.
Figure 24: details about network dimensioning.
In Figure 24 we show the overall bandwidth slots allocated on the network (top left), the number of 96 channels DWDM line systems (top right), the ROADM node parts (bottom left) and regenerators displacements (bottom right) for 5 years after BOL. In Figure 25 the nodes without regenerators (in green) and with a high number of regenerators (greater than 100, in red) are highlighted. Note that the most populated nodes are the ones in the inner core of the topology, while the unpopulated ones are on the outer core.
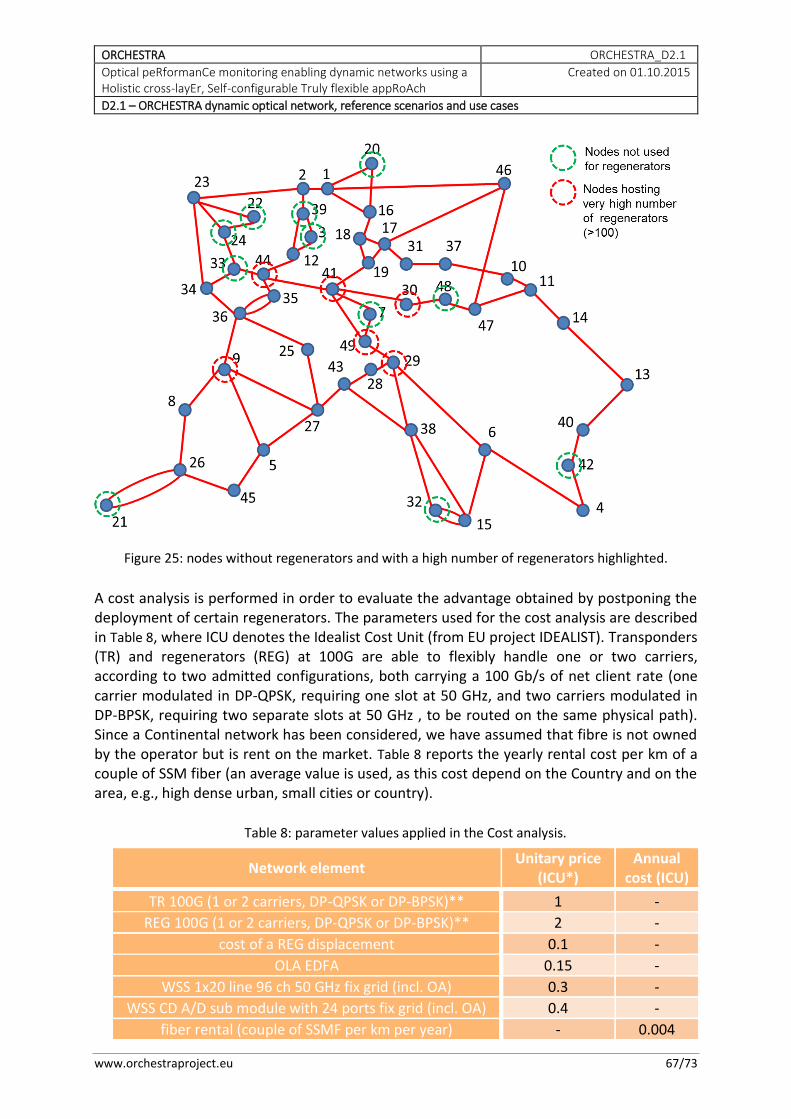
ORCHESTRA ORCHESTRA_D2.1
Optical peRformanCe monitoring enabling dynamic networks using a Holistic cross-layEr, Self-configurable Truly flexible appRoAch
Created on 01.10.2015
D2.1 – ORCHESTRA dynamic optical network, reference scenarios and use cases
www.orchestraproject.eu 67/73
Figure 25: nodes without regenerators and with a high number of regenerators highlighted.
A cost analysis is performed in order to evaluate the advantage obtained by postponing the deployment of certain regenerators. The parameters used for the cost analysis are described in Table 8, where ICU denotes the Idealist Cost Unit (from EU project IDEALIST). Transponders (TR) and regenerators (REG) at 100G are able to flexibly handle one or two carriers, according to two admitted configurations, both carrying a 100 Gb/s of net client rate (one carrier modulated in DP-QPSK, requiring one slot at 50 GHz, and two carriers modulated in DP-BPSK, requiring two separate slots at 50 GHz , to be routed on the same physical path). Since a Continental network has been considered, we have assumed that fibre is not owned by the operator but is rent on the market. Table 8 reports the yearly rental cost per km of a couple of SSM fiber (an average value is used, as this cost depend on the Country and on the area, e.g., high dense urban, small cities or country).
Table 8: parameter values applied in the Cost analysis.
Network element Unitary price
(ICU*) Annual
cost (ICU)
TR 100G (1 or 2 carriers, DP-QPSK or DP-BPSK)** 1 -
REG 100G (1 or 2 carriers, DP-QPSK or DP-BPSK)** 2 -
cost of a REG displacement 0.1 -
OLA EDFA 0.15 -
WSS 1x20 line 96 ch 50 GHz fix grid (incl. OA) 0.3 -
WSS CD A/D sub module with 24 ports fix grid (incl. OA) 0.4 -
fiber rental (couple of SSMF per km per year) - 0.004
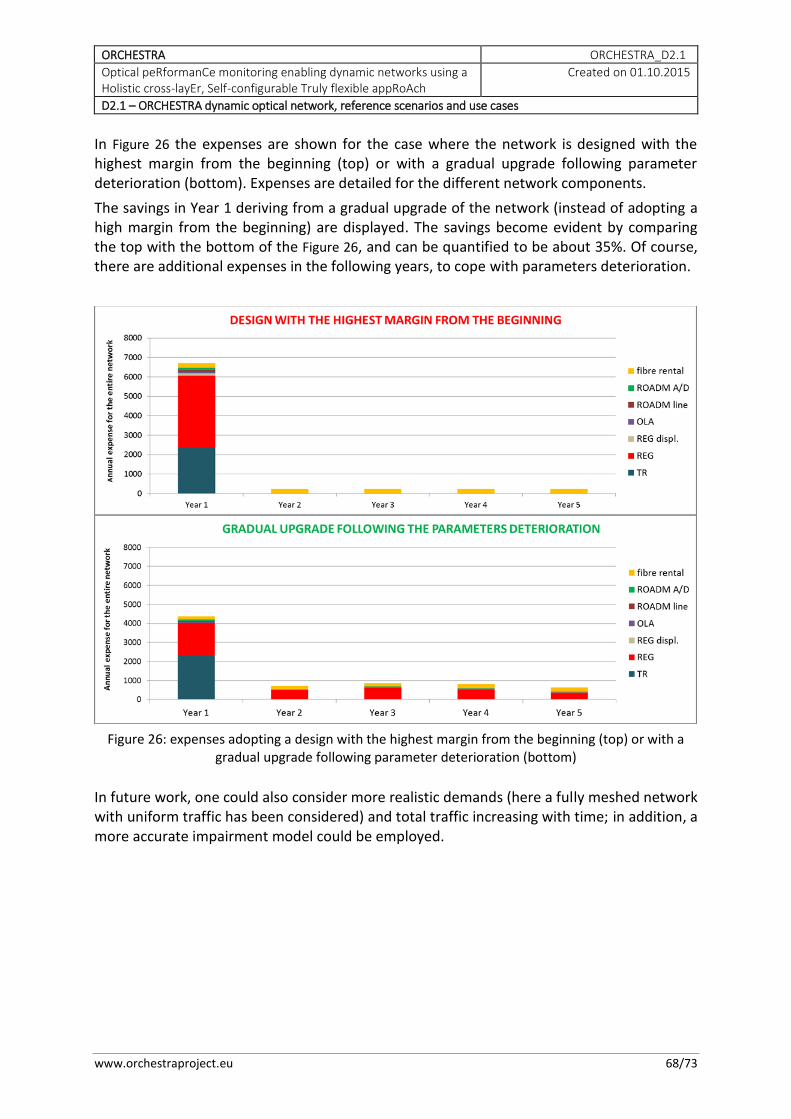
ORCHESTRA ORCHESTRA_D2.1
Optical peRformanCe monitoring enabling dynamic networks using a Holistic cross-layEr, Self-configurable Truly flexible appRoAch
Created on 01.10.2015
D2.1 – ORCHESTRA dynamic optical network, reference scenarios and use cases
www.orchestraproject.eu 68/73
In Figure 26 the expenses are shown for the case where the network is designed with the highest margin from the beginning (top) or with a gradual upgrade following parameter deterioration (bottom). Expenses are detailed for the different network components.
The savings in Year 1 deriving from a gradual upgrade of the network (instead of adopting a high margin from the beginning) are displayed. The savings become evident by comparing the top with the bottom of the Figure 26, and can be quantified to be about 35%. Of course, there are additional expenses in the following years, to cope with parameters deterioration.
Figure 26: expenses adopting a design with the highest margin from the beginning (top) or with a
gradual upgrade following parameter deterioration (bottom)
In future work, one could also consider more realistic demands (here a fully meshed network with uniform traffic has been considered) and total traffic increasing with time; in addition, a more accurate impairment model could be employed.
ORCHESTRA ORCHESTRA_D2.1
Optical peRformanCe monitoring enabling dynamic networks using a Holistic cross-layEr, Self-configurable Truly flexible appRoAch
Created on 01.10.2015
D2.1 – ORCHESTRA dynamic optical network, reference scenarios and use cases
www.orchestraproject.eu 69/73
8. Conclusion ORCHESTRA project promises to close the loop between the physical layer and the control plane, by using the real-time impairment measurement capabilities of coherent optical transceivers in order to identify hard and soft failures, operate the network close to its true capabilities and reduce its costs, and continuously (re)-optimize the network. Towards this purpose, ORCHESTRA envisages a mechanism based on three phases: the acquisition of optical parameters (called OBSERVE), their analysis and correlation, the decision about what to do with them (DECIDE) and finally the choice of actions to run (ACT).
One of the goals of this deliverable was the definition of the basis for evaluating the benefits of the ORCHESTRA solution. To do that, it is essential to understand the Optical Performance Monitors (OPMs), which are the means to acquire information and parameters from the network. OPMs provide data that is collected (OBSERVE), analyzed and correlated to network performance and network events. With the aim of having a comprehensive view of the tools for understanding the status of the optical network this deliverable includes information on the parameters that can be obtained from hardware and software monitors.
Since various performance levels are required, depending on network architecture and traffic scenarios, the second step was the definition of the ORCHESTRA “perimeter”, that is the kind of networks, in terms of technology and size, on which to focus. Towards this end, the deliverable identified an optical network on which are efforts will focus, composed by two segments (metro and core); the technology is flex-grid optical coherent transmission in the core, while in the metro non-coherent and fixed-grid solutions might be considered. A different possible scenario, like geographically distributed data centers and the adoption of alien wavelengths as a disrupting solution has been identified and will also be considered. Furthermore, to define the basis for realistic studies, three network topologies have been reported (pan-European, National wide and metropolitan size). The ABNO controller has been identified as the reference control framework for ORCHESTRA and an ageing model is given that can be used when evaluating the evolution of the network infrastructure over time.
Having identified the means necessary to “observe” the network (OPM) and the reference scenarios, we proceeded to identifying a set of use cases, i.e. situations where the ORCHESTRA mechanism can yield significant benefits. The continuous acquisition and elaboration of physical parameters, combined with a fast and efficient control plane, allows predicting or acting fast upon (soft and hard) failures. The benefits introduced by this feature include increased network availability together with improved maintenance efficiency. Furthermore, it is possible to reduce the (worst-case) margins that Operators currently employ in connection provisioning so as to increase network efficiency, operate the network at each time close to its true capabilities, and postpone or avoid investment. Additional case studies, identified as possible candidate cases that can benefit from the ORCHESTRA mechanism, are the compensation of degradation that occurs when reverting traffic after having fixed a failure, the tuning of non-optimized paths (due in particular to a mix of technologies during update procedure or maintenance jobs), the out of margin max rate operation in case of temporary network congestion, and the efficient handling of alien wavelengths.

ORCHESTRA ORCHESTRA_D2.1
Optical peRformanCe monitoring enabling dynamic networks using a Holistic cross-layEr, Self-configurable Truly flexible appRoAch
Created on 01.10.2015
D2.1 – ORCHESTRA dynamic optical network, reference scenarios and use cases
www.orchestraproject.eu 70/73
We also presented in this deliverable a basic cost evaluation and comparison methodology that can be used to numerically evaluate the benefits of the ORCHESTRA approach under use cases that take into account the evolution of network over time.
Finally, we presented a preliminary study on network provisioning with reduced margins. The study focused on multi-period transponder and regenerator placement and showed that by provisioning in each period with good enough margins investments can be postponed. The findings show the potential of the ORCHESTRA solution and encourage future work on that direction.
ORCHESTRA ORCHESTRA_D2.1
Optical peRformanCe monitoring enabling dynamic networks using a Holistic cross-layEr, Self-configurable Truly flexible appRoAch
Created on 01.10.2015
D2.1 – ORCHESTRA dynamic optical network, reference scenarios and use cases
www.orchestraproject.eu 71/73
9. References
[1] Infonetics Research, “10G/40G/100G Telecom Optics, Biannual Worldwide and Regional Market Size and Forecasts”
[2] L. Augé, “Can we use Flexible Transponders to Reduce Margins?”, OFC 2013, paper OTu2A.1. [3] A. Mitra, A. Lord, S. Kar, P. Wright, “Effect of Link Margin and Frequency Granularity on the
Performance of a Flex-grid Optical Network”, Optics Express, vol. 22, no. 1, pp. 41-46, 2014. [4] N. Sambo, et. al., "Lightpath Establishment Assisted by Offline QoT Estimation in Transparent
Optical Networks", IEEE/OSA Journal of Optical Communications and Networking, vol.2, no.11, pp.928,937, 2010.
[5] D.B. Chua, E.D. Kolaczyk, M, Crovella, “Network kriging” JSAC 2006. [6] N. Sambo, F. Cugini, A. Sgambelluri, P. Castoldi, “Hierarchical monitoring architecture and OAM
Handler”, ECOC 2015. [7] D. King, A. Farrel, “A PCE-Based Architecture for Application-Based Network Operations”, IETF
RFC 7491, March 2015. [8] J. Pesic, E. Le Rouzic, N. Brochier, L. Dupont, “Proactive Restoration of Optical Links Based on the
Classification of Events”, ONDM 2011. [9] K. Christodoulopoulos, K. Manousakis, E. Varvarigos, M. Angelou, “Considering Physical Layer
Impairments in Offline RWA”, IEEE Network Magazine, Vol. 23, Is. 3, pp. 26-33, 2009. [10] F. Cugini, et al., “Push-Pull Defragmentation Without Traffic Disruption in Flexible Grid Optical
Networks”, IEEE/OSA Journal of Lightwave Technology, vol. 31, no. 1, pp. 125-133, 2013. [11] Calvin C. K. Chan, “Optical Performance Monitoring Advanced Techniques for Next-Generation
Photonic Networks,” Academic Press, 1st edition, March 19, 2010. [12] D. Dahan, U. Mahlab, A. Teixeira, I. Zacharopoulos, I. Tomkos, “Optical performance monitoring
for translucent/transparent optical networks,” IET Optoelectron., Vol. 5, Iss. 1, pp. 1–18, 2011. [13] D. C. Kilper, R. Bach, D. J. Blumenthal, D. Einstein, T. Landolsi, L. Ostar, M. Preiss, A. E. Willner,
“Optical Performance Monitoring”, JLT, Vol 22, is. 1, 2004 [14] W. Moench, J. Larikova, “Measuring the optical signal-to-noise ratio in agile optical networks,”
Proc. Optical Fiber Communication Conf. (OFC 2007), paper NWC1, 2007 [15] K. Asahi, M. Yamashita, T. Hosoi, K. Nakaya, C. Konishi, C., Fujita, S., “Optical performance
monitor built into EDFA repeaters for WDM networks,” Proc. Optical Fiber Communication Conf. (OFC 1998), paper Th02, 1998
[16] H. Suzuki, N. Takachio, “Optical signal quality monitoring built into WDM linear repeaters using semiconductor arrayed waveguide grating filter monolithically integrated with eight photodiodes,” Electron. Lett., 1999, 35, pp. 836–837
[17] J.H Lee, D.K. Jung, C.H. Kim, Y.C. Chung, “OSNR monitoring technique using polarization-nulling method,” IEEE Photonics Technol. Lett, 2001, 13, (1), pp. 88–90.
[18] T. B. Anderson, K. Clarke, S.D. Dods, M. Bakaul, “Robust, low cost, in-band optical signal to noise monitoring using polarization diversity,” Proc. Optical Fiber Communication and the National Fiber Optic Engineers Conf. (OFC/NFOEC), paper OMM3, 2007.
[19] X. Liu, Y. Kao, S. Chandrasekhar, I. Kang, S. Cabot, L.L. Buhl, “OSNR monitoring method for OOK and DPSK based on optical delay interferometer,” IEEE Photonics Technol. Lett., 2007, 19, (15), pp. 1172–1174.
[20] C. Zhu et al., “Statistical moments-based OSNR monitoring for coherent optical systems,” Optics Express, Vol. 20, No. 16, 30 July 2012.
[21] F. Pittalà et al., “Joint PDL and in-band OSNR monitoring supported by data-aided channel estimation”, Proc. OFC 2012.
ORCHESTRA ORCHESTRA_D2.1
Optical peRformanCe monitoring enabling dynamic networks using a Holistic cross-layEr, Self-configurable Truly flexible appRoAch
Created on 01.10.2015
D2.1 – ORCHESTRA dynamic optical network, reference scenarios and use cases
www.orchestraproject.eu 72/73
[22] M.N. Petersen, Z. Pan, S. Lee, S.A. Havstad, A.E. Willner, “Online chromatic dispersion monitoring and compensation using a single inband subcarrier tone’, IEEE Photonics Technol. Lett., 2002, 14, (4), pp. 570–572.
[23] R. Corsini et al., “Blind Adaptive Chromatic Dispersion Compensation and Estimation for DSP-Based Coherent Optical Systems,” J. Lightw. Technol., Vol. 31, np. 13, July 1, 2013.
[24] S.M.R.M Nezam, Y.-W. Song, A.B. Sahin, Z. Pan, A.E. Willner, “‘PMD monitoring in WDM systems for NRZ data using a chromatic dispersion-regenerated clock’. Proc. Conf. Optical Fiber Communication Conf. (OFC 2002), paper We5, 2002.
[25] Y.K. Lize, L. Christen, J.Y. Yang, et al., “Independent and simultaneous monitoring of chromatic and polarization-mode dispersion in OOK and DPSK transmission,” IEEE Photonics Technol. Lett., 2007, 19, (1), pp. 3–5.
[26] J.-Y. Yang, et al., “Polarization-mode-dispersion monitoring for phase modulated signals using DGD-generated interferometric filter,” IEEE Photonics Technol. Lett., 2008, 20, (2), pp. 150–152.
[27] S.M.R.M. Nezam, J.E. McGeehan, A.E. Willner, “Theoretical and experimental analysis of the dependence of a signal’s degree of polarization on the optical data spectrum,” J. Lightwave Technol., 2004, 22, (3), pp. 763–772.
[28] “Polarization Dependent Loss Measurement of Passive Optical Components,” Agilent Application Note.
[29] M. Faruk et al, “Multi-Impairments Monitoring from the Equalizer in a Digital Coherent Optical Receiver”, ECOC 2010.
[30] A. Lord, Y.R. Zhou, P. Wright, European Conference on Optical Communications, Tu.6.K.2, Geneva, Switzerland (2011).
[31] D. Ventorini, E. Moura, L. Paraschis, Conference on Optical Fiber Communication/National Fiber Optic Engineers Conference, NME3, San Diego, USA (2008).
[32] White Paper: “Cisco Visual Networking Index: Forecast and Methodology, 2014–2019”, 2015 [33] E. Mannie, “Generalized Multi-Protocol Label Switching (GMPLS) Architecture”, IETF RFC 3945,
October 2004 [34] ONF, “SDN Architecture”, Open Networking Foundation white paper. [35] “OpenFlow Switch Specification”, https://www.opennetworking.org/sdn-resources/openflow,
Open Networking Foundation. [36] R. Enns, “NETCONF Configuration Protocol”, IETF RFC 6241, 2006. [37] J.E. Lopez de Vergara, V. Lopez, O. Gonzalez de Dios, D. King, Z. Ali, “A YANG data model for
WSON and Flexi-Grid Optical Networks”, IETF draft, draft-vergara-flexigrid-yang-00.txt, 2014. [38] http://www.ciscopress.com/articles/article.asp?p=170740&seqNum=12 [39] P. Poggiolini, "The GN Model of Non-Linear Propagation in Uncompensated Coherent Optical
Systems," in Lightwave Technology, Journal of , vol.30, no.24, pp.3857-3879, Dec.15, 2012. [40] A. Carena, V. Curri, G. Bosco, P. Poggiolini, F. Forghieri “Modeling of the Impact of Nonlinear
Propagation Effects in Uncompensated Optical Coherent Transmission Links”, JLT Vol. 30, No. 10, May 15, 2012
[41] D. J. Ives, P. Bayvel, S. J. Savory, “Assessment of Options for Utilizing SNR Margin to Increase Network Data Throughput”, OFC 2015.
[42] F. Fidler, P.J. Winzer, M. K. Thottan, K. Bergman, "Impairment-Aware Optical Networking Using Cross-Layer Communication", IEEE/OSA Journal of Optical Communications and Networking, 2013.
[43] J. Tapolcai, B. Wu, P. H. Ho, “On Monitoring and Failure Localization in Mesh All-Optical Networks”, Infocom 2009.
[44] J. Tapolcai, P.H. Ho, P. Babarczi, L. Rónyai, “On signaling-free failure dependent restoration in all-optical mesh networks, “IEEE/ACM Transactions on Networking (TON) 22 (4), 1067-1078, 2014
[45] D. Staessens, K. Manousakis, D. Colle, U. Mahlab, M. Pickavet, E. Varvarigos, P. Demeester, “Failure Localization in Transparent Optical Networks”, ICUMT 2010.

ORCHESTRA ORCHESTRA_D2.1
Optical peRformanCe monitoring enabling dynamic networks using a Holistic cross-layEr, Self-configurable Truly flexible appRoAch
Created on 01.10.2015
D2.1 – ORCHESTRA dynamic optical network, reference scenarios and use cases
www.orchestraproject.eu 73/73
[46] C. Mas, I. Tomkos, O. K. Tonguz, "Failure Location Algorithm for Transparent Optical Networks", IEEE Journal on Selected Areas in Communications (JSAC), 2005
[47] X. Cai, K. Wen, R. Proietti, Y. Yin, R. Scott, C. Qin, and S. J. B. Yoo, “Ex- perimental demonstration of adaptive combinational QoT failure restora- tion in flexible bandwidth networks,” in Proc. Opt. Fiber Commun. Conf. Expo./Nat. Fiber Opt. Eng. Conf., 2012, pp. 1–3.
[48] G. Meloni, L. Potì, N. Sambo, F. Fresi, F Cavaliere, "Code-adaptive transmission accounting for filtering effects in EON," in Optical Network Design and Modeling (ONDM), 2015 International Conference on , vol., no., pp.222-226, 11-14 May 2015.
[49] M. Furdek, N. Skorin-Kapov, S. Zsigmond, L. Wosinska, “Vulnerabilities and Security Issues in Optical Networks”, ICTON 2014.
[50] A. Schmitt – “Optical transceiver market boostered as 100G arrives in force”, Infonetics 2012 [51] A. Napoli et al, “Next generation sliceable bandwidth variable transponder: the vision of the
European Research Project IDEALIST”, IEEE Communications Magazine 02/2015; 53(2).