Embed Size (px)
Citation preview

Project ID 284860 MSEE – Manufacturing SErvices Ecosystem
Date: 19/10/2012 Deliverable D13.5 – M12 V1.0
D13.5
Service operations monitoring and control
toolset
M12 – V1.0
Document Owner: Christian Zanetti, Mohammadreza Heydari, Alessandra Carosi POLIMI
Contributors: Yves Ducq UniBX1, Mike Freitag FhG-IAO, Ingo Westphal BIBA, Stefan Wiesner BIBA
Dissemination: Public
Contributing to: WP 13
Date: 19/10/2012
Revision: V1.0
Project ID 284860 MSEE – Manufacturing SErvices Ecosystem
Date: 19/10/2012 Deliverable D13.5 – M12 V1.0
MSEE Consortium Dissemination: PUBLIC 2/58
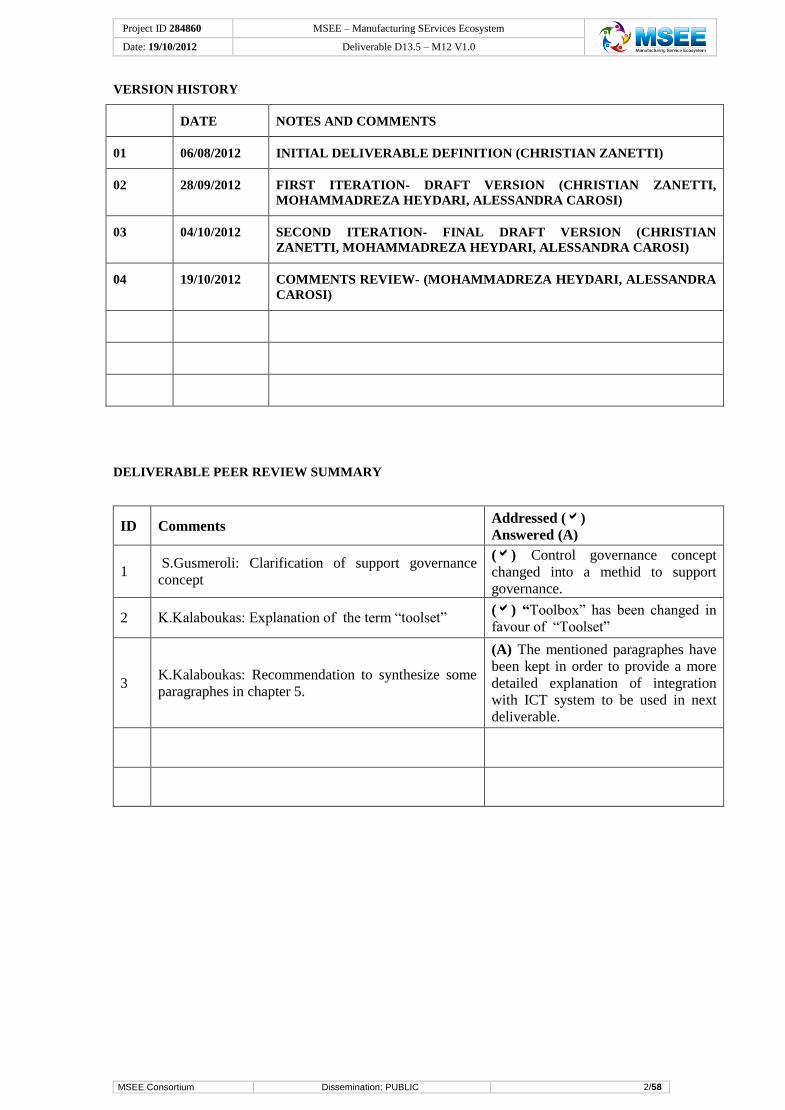
VERSION HISTORY
DATE NOTES AND COMMENTS
01 06/08/2012 INITIAL DELIVERABLE DEFINITION (CHRISTIAN ZANETTI)
02 28/09/2012 FIRST ITERATION- DRAFT VERSION (CHRISTIAN ZANETTI,
MOHAMMADREZA HEYDARI, ALESSANDRA CAROSI)
03 04/10/2012 SECOND ITERATION- FINAL DRAFT VERSION (CHRISTIAN
ZANETTI, MOHAMMADREZA HEYDARI, ALESSANDRA CAROSI)
04 19/10/2012 COMMENTS REVIEW- (MOHAMMADREZA HEYDARI, ALESSANDRA
CAROSI)
DELIVERABLE PEER REVIEW SUMMARY
ID Comments Addressed ()
Answered (A)
1 S.Gusmeroli: Clarification of support governance
concept
() Control governance concept
changed into a methid to support
governance.
2 K.Kalaboukas: Explanation of the term “toolset” () “Toolbox” has been changed in
favour of “Toolset”
3 K.Kalaboukas: Recommendation to synthesize some
paragraphes in chapter 5.
(A) The mentioned paragraphes have
been kept in order to provide a more
detailed explanation of integration
with ICT system to be used in next
deliverable.

Project ID 284860 MSEE – Manufacturing SErvices Ecosystem
Date: 19/10/2012 Deliverable D13.5 – M12 V1.0
MSEE Consortium Dissemination: PUBLIC 3/58
Table of Contents 1. EXECUTIVE SUMMARY 5
2. INTRODUCTION 6
3. MONITORING AND CONTROLLING IN SERVICE SYSTEM 7
3.1. Monitoring and controlling concepts 7 3.2. Governance and Service Governance 8 3.3. Relevant monitoring and controlling methods 9 3.4. Extraction of relevant criteria 13 3.5. Customer perception 18
4. MSEE GOVERNANCE SUPPORT TOOLSET 22
4.1. Elements of the toolset 22 4.2. Toolset Method definition 25 4.3. Governance support toolset proposition 26 4.4. Use Cases Table 41 4.5. Analysis of the data 46 4.6. Advantages 47 4.7. Service System Maturity level visualisation 47 4.8. Conclusion 48
5. INTEGRATION WITH EXISTING ICT SYSTEMS 50
6. CONCLUSION AND FURTHER STEPS 55
7. REFERENCES 56
Project ID 284860 MSEE – Manufacturing SErvices Ecosystem
Date: 19/10/2012 Deliverable D13.5 – M12 V1.0
MSEE Consortium Dissemination: PUBLIC 4/58
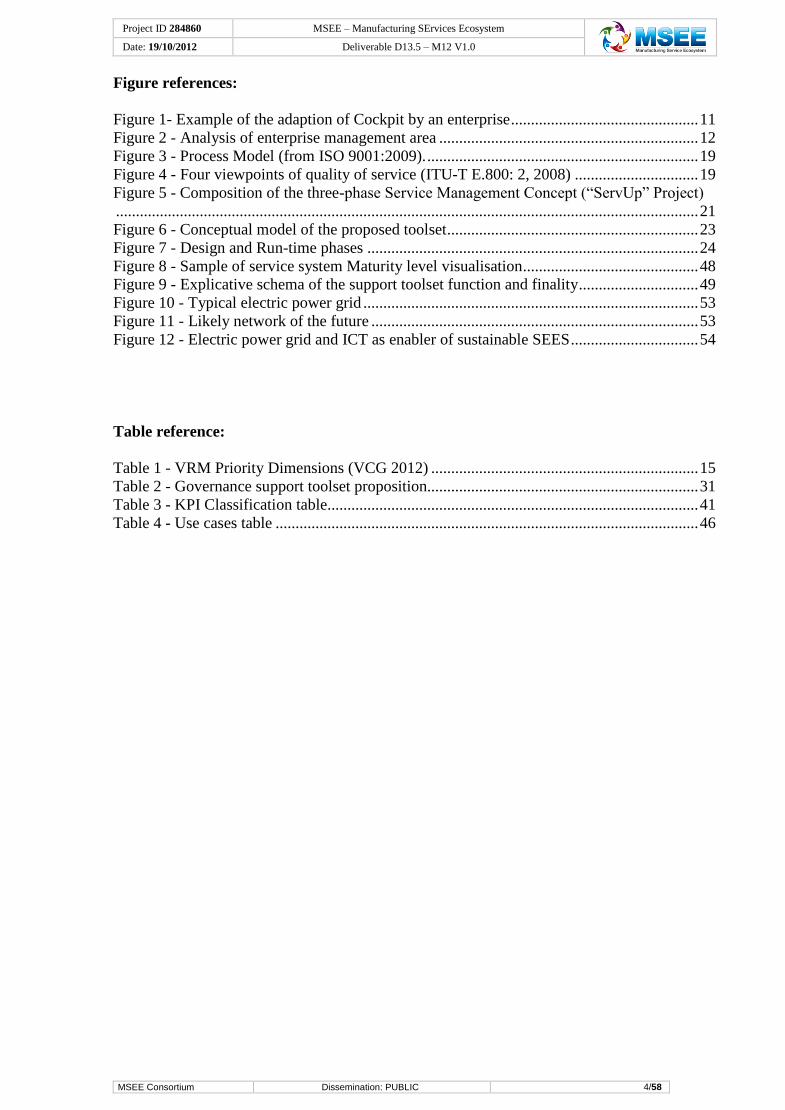
Figure references:
Figure 1- Example of the adaption of Cockpit by an enterprise ............................................... 11 Figure 2 - Analysis of enterprise management area ................................................................. 12 Figure 3 - Process Model (from ISO 9001:2009). .................................................................... 19 Figure 4 - Four viewpoints of quality of service (ITU-T E.800: 2, 2008) ............................... 19 Figure 5 - Composition of the three-phase Service Management Concept (“ServUp” Project)
.................................................................................................................................................. 21 Figure 6 - Conceptual model of the proposed toolset ............................................................... 23 Figure 7 - Design and Run-time phases ................................................................................... 24 Figure 8 - Sample of service system Maturity level visualisation ............................................ 48 Figure 9 - Explicative schema of the support toolset function and finality .............................. 49
Figure 10 - Typical electric power grid .................................................................................... 53 Figure 11 - Likely network of the future .................................................................................. 53
Figure 12 - Electric power grid and ICT as enabler of sustainable SEES ................................ 54
Table reference:
Table 1 - VRM Priority Dimensions (VCG 2012) ................................................................... 15 Table 2 - Governance support toolset proposition.................................................................... 31 Table 3 - KPI Classification table............................................................................................. 41
Table 4 - Use cases table .......................................................................................................... 46

Project ID 284860 MSEE – Manufacturing SErvices Ecosystem
Date: 19/10/2012 Deliverable D13.5 – M12 V1.0
MSEE Consortium Dissemination: PUBLIC 5/58
1. Executive Summary
The main aim of subproject 1 (SP1) is to study the world of frameworks, methodologies and
toolsets to provide the methodological and scientific foundations for the application of the
service paradigm to European Manufacturing Virtual Factories and Enterprises.
It can be stated that as defined in DOW, the main point of the WP13 is to lay the foundations
for a governance framework, creating the condition to share resources between potentially
unknown parties, providing methods to measure and defining performances measurements
and service level agreement in order to create trust relationship and meet customer needs and
priorities.
The main aim of D13.5 is to implement the service operation monitoring and controlling
methodologies and tools that will also be required to dynamically use the relevant KPIs and
SLAs to support enterprises.
In this deliverable we will develop a MSEE method to support governance (i.e. a governance
support toolset OR governance support toolset) through the action of monitoring and
controlling the service system.
Moreover, it will also be considered that the described methodology needs to be implemented
by a dedicated ICT system. Therefore such an IT control toolset will be integrated within the
MSE (Manufacturing Service Ecosystem) governance platform of SP2.
For MSEE Project the goal of deliverable D13.5 is to support service management, exchange
and evaluation within the manufacturing networks.
Control data will be shared within the enterprises ICT systems in order to allow a fast and
easy exchange of information among MSE members. This will be useful to provide the MSE
members with effective solutions for governance.
Within the document we try to set a bridge among useful assessment models and our toolset
proposal.
On the one side, GRAI Model (Graph with Results and activities Interrelated) and MDSEA
Method (Model Driven Service engineering Architecture) which are on the based on the
decomposition by level of decision and decomposition by abstraction level. On the other side,
UGF model (Unified Governance Framework) which tries to aid enterprises in implementing
consistent governance with a certain focus on the use of ICT and ICT-based services, has
been considered too.
In the context of governance model evaluating, we describe management cockpit methods
which have considerable link with performance measurement and ICT tools.
After analysing several controlling methods, relevant elements are highlighted and extracted
in order to use these key pillars as filtering categories in our monitoring and controlling
toolset. Specific KPIs have been identified so to be measured by these filter categories.
The control toolset we have elaborated will be used as a useful method to help enterprise
evaluating their service systems. Apart from analysing service system, the toolset will
provide, collect and share the results of the controlling activities among MSE members. This
means it represents an important strategic tool for MSEE Project.
In the next deliverable (D13.6 at M24) the mentioned toolset shall be tested on the basis of
efficiency through end users pilots for evaluating in real situation.

Project ID 284860 MSEE – Manufacturing SErvices Ecosystem
Date: 19/10/2012 Deliverable D13.5 – M12 V1.0
MSEE Consortium Dissemination: PUBLIC 6/58
2. Introduction
In this deliverable we focus on various issues concerning the monitoring and controlling of
service systems.
To monitor and control generally means to be aware of the state of a system. Monitoring is
the regular observation and recording of activities taking place e.g. in an enterprise while
controlling implies setting standards, measuring actual performance and taking corrective
actions. The results of monitoring and controlling action will be then fundamental for decision
making as well as the criteria which will be adopted to govern a system.
In D13.1 KPIs and SLAs have been defined and analyzed in order to develop a coherent and
comprehensive set of performance indicators, aiming at controlling service, servitization
process, ecosystem governance and innovation within an ecosystem.
Governance, liability, trust and reputation models have been evaluated in D13.3. Upon that,
specific KPIs have been identified so to measure them in order to meet customer requirements
and priorities.
This deliverable has to be considered as the first of two, containing the developments of Task
1.3.3 and that are going to be released in separately: the former (D13.5, this document) at
M12 contains basic principles related to service monitoring and control methodologies, while
D13.6, due at M24, is the sequel of this document, including integration of results deriving
from other WPs and full definition of control toolset.
In this deliverable monitoring and controlling methodologies and relevant tools have been
investigated. Subsequently a toolset has been generated and proposed to control and monitor
service governance.
The implementation with existing ICT systems has been considered too, so to allow a smooth
integration of methods and tools with data and information.
This toolset has been based on both design and runtime phases, to support service
management, exchange and evaluation within manufacturing networks.
In chapter three we define some useful concepts to clarify the role and the aim of monitoring
and controlling. Several methods about controlling and monitoring have been analysed,
collected and explained. Appropriate elements have been selected to be used as key pillars in
monitoring an controlling service quality and performances.
In chapter four a MSEE governance support toolset has been proposed. Components have
been defined and the method the toolset followed has been explained. Service related KPIs
have been generated and classified on the basis of MSDE Architecture, ECOGRAI and UGF
models. Then, according to management cockpits systems, significant categories have been
extracted to give KPIs a coherent structure.
Finally, in chapter five the integration between ICT tools and monitoring system is illustrated
and taken into consideration.

Project ID 284860 MSEE – Manufacturing SErvices Ecosystem
Date: 19/10/2012 Deliverable D13.5 – M12 V1.0
MSEE Consortium Dissemination: PUBLIC 7/58
3. Monitoring and controlling in Service System
In this chapter we are going to define the major definition of control and monitor concepts
which has relevant role within the enterprise and the service system environment.
After the definition of the controlling and monitoring concepts, we are going to extract key
elements and important tools that will be used to create a toolset repository.
A good starting point for monitoring and controlling a service system can be provided by a
useful definition of their related concepts.
Service System
According to Dow, IBM and University of Cambridge (2007) defined service system with the
following “a service system can be defined as a dynamic configuration of resources (people,
technology, organisations and shared information) that creates and delivers value between the
provider and the customer through collaboration. A service is therefore value co-creation.”1
3.1. Monitoring and controlling concepts
Monitoring
As far as the means of monitoring is concerned, monitoring generally means to be aware of
the state of a system. Monitoring is the regular observation and recording of activities taking
place in a enterprise planning and implementation. It is a process of routinely gathering
information on all aspects of the enterprise.
To monitor is to check on how enterprise activities are progressing.
Monitoring involves systematic and purposeful observation. Likewise monitoring is the
systematic, regular collection and occasional analysis of information to identify and measure
changes over a period of time.2
Monitoring also involves giving feedback about the progress of the enterprise activities to the
donors, implementers and beneficiaries.3
Purpose of Monitoring
Monitoring is very important in enterprise planning and implementation.
It is like watching where you are going while riding a bicycle; you can adjust as you go along
and ensure that you are on the right track. Monitoring provides information that will be useful
in:
- Analysing the situation in the enterprise environment;
- Determining whether the inputs are well utilized;
- Identifying problems and finding solutions;
- Ensuring all activities are carried out properly by the right people and in time;
- Using lessons from one project experience on to another;
- Determining whether the way the enterprise was planned is the most appropriate way
of solving the problem at hand.
The process of monitoring requires identifying the enterprise elements which need to be
evaluated. The second step is to collect all the data. Then data will be evaluated refer to the
control system. This process can be articulated in five phases:
- Identification of required elements (data);
Project ID 284860 MSEE – Manufacturing SErvices Ecosystem
Date: 19/10/2012 Deliverable D13.5 – M12 V1.0
MSEE Consortium Dissemination: PUBLIC 8/58
- Insert data in the system, (data input);
- Filling data in the system, (data storage);
- Elaborating the data (data processing);
- Output generation, (conclusion).
Finally, the output generation will be used as a result in the controlling system, so that the
results can be used in making decisions for improving enterprise performance.
Controlling
Controlling is one of the managerial functions like planning, organizing, staffing and
directing. It is an important function because it helps to check the errors and to take the
corrective action so that deviation from standards are minimized and stated goals of the
organization are achieved in a desired manner.
According to modern concepts, control is a foreseeing action whereas earlier concept of
control was used only when errors were detected. Control in management means setting
standards, measuring actual performance and taking corrective action.
The primary requirement of a control system is that it maintains the level and kind of output
necessary to achieve the system's objectives. It is usually impractical to control every feature
and condition associated with the system's output. Therefore, the choice of the controlled item
(and appropriate information about it) is extremely important. There should be a direct
correlation between the controlled item and the system's operation. In other words, control of
the selected characteristic should have a direct relationship to the goal or objective of the
system. The process of controlling can be divided in these phases:
- Setting performance standards;
- Measurement of actual performance;
- Comparing actual performance with standards;
- Analysing deviations;
- Correcting deviations.
It should be emphasized at this point that the term monitoring is used deliberately instead of
evaluating.
In fact evaluation is the analysis of the effectiveness and direction of an activity and involves
making a judgment about progress and impact.
The main differences between monitoring and evaluation are the timing and frequency of
observations and the types of questions asked. However, when monitoring and evaluation are
integrated as a project management tool, the line between the two becomes rather blurred.
3.2. Governance and Service Governance
The governance can be described as a circle which encompasses cultural, technological,
structural, and motivational aspects. Governance concept has many aspects of definition but
in this paragraph we try to define the major aspect of it which was captured by the following
explanation from OECD (Organization for Economic Cooperation and Development):
“Corporate governance is the system by which business corporations are directed and
controlled. The corporate governance structure specifies the distribution of rights and
responsibilities among different participants in the corporation, such as, the board, managers,
shareholders and other stakeholders, and spells out the rules and procedures for making
decisions on corporate affairs. By doing this, it also provides the structure through which the
Project ID 284860 MSEE – Manufacturing SErvices Ecosystem
Date: 19/10/2012 Deliverable D13.5 – M12 V1.0
MSEE Consortium Dissemination: PUBLIC 9/58
company objectives are set, and the means of attaining those objectives and monitoring
performance.
Governance has become a huge topic in the service enterprise. Key pillars are increasing
regulatory pressure, needs for better service management, and the desire of enterprises to
monitor and influence their service performance faster.
Service performance in current commercial competitions and fast-changing environments also
requires new governance structures. Most existing enterprise governance structures are
actually geared towards business performance. This concerns aspects like strategy-making,
planning, measurement of execution, and reward systems. Classically, most of this
governance is done manually and at significant time intervals. For service performance
governance there are some scenarios which we preferred to consider a couple of them: the
first scenario is related to a service-oriented one about the automation systems which control
the service structure; and next scenario try to use an IT-oriented one about access controlling.
By increasing the speed of customer interests changes, automatically IT infrastructure needs
to develop and being more complex. The huge amounts of information in the digital form will
be increased by developing the IT infrastructure. So, the current service governance process
needs to be redesigned.
3.3. Relevant monitoring and controlling methods
In this section some relevant existing control systems which support the decision making
within the enterprise environment will be analysed.
Few tools (recommendations, models, methods, systems and frameworks), proposed by
various researchers and practitioners to control and monitor performances, are going to be
studied. Then this document will focus on defining the specific components and elements
necessary to control and monitor. Each methodology has its own criteria, therefore, in order to
align with the deliverable task, we will select and extract just the components and elements
which are important to monitor and evaluate the enterprise within its internal department and
the ecosystem network by integrating them with ICT tools.
3.3.1. Previous service governance methods
As mentioned in DOW the purpose of WP13 is to lay down the foundation of governance
framework, by using the world of frameworks, methodologies and tool boxes which can
support various levels of performance indicators in service ecosystem. So, referring to
deliverable 13.1 contexts there are two relevant models for enterprise activity classification.
The classification is based on decomposition: decomposition by level of abstraction, i.e.
Model Driven Service Engineering Architecture (MDSEA) and decomposition by level of
decision, i.e. ECOGRAI. ECOGRAI model is generated by university of Boudreaux 1 to
enable a complete model of the enterprise from a structural and a running point of view.
Another useful model we can use for service system governance is Unified Governance
Framework (UGF). This model focus on how IT-related components can support service
governance and it is composed by three decision levels: Strategic, Tactical and Operational.
Finally, refer to the UGF model’s core and regarding ECOGRAI decomposition model by
level of decisions, it should be emphasized that by synthesizing both mentioned models a new
tool to support service ecosystem governance has been generated in this deliverable (MSEE
governance support toolset).
After describing the models we take into consideration for service governance, now we focus
on ICT role and IT environment in monitoring and controlling service systems.

Project ID 284860 MSEE – Manufacturing SErvices Ecosystem
Date: 19/10/2012 Deliverable D13.5 – M12 V1.0
MSEE Consortium Dissemination: PUBLIC 10/58
Information Technology (IT) is embedded in a complex and dynamic environment. Analyses
have shown that IT will develop in line with the increasing globalization of enterprises. One
of the results of IT globalization is that enterprises face an increasing cost pressure as well as
a high demand for quality and flexibility. In order to fulfill this demand, every IT enterprise
requires a well functioning management. Prerequisites for the success of every software
enterprise are good enterprise planning, enterprise monitoring and enterprise steering. The
management of software enterprise connects different business areas with each other. Product
and service related observations should therefore be adaptable to the various perspectives that
are prevalent within organizations. So called “software enterprise control centers” can serve
as compact sources of information and help the management to gain a better overview of the
current project status.
3.3.2. IT based cockpit controlling methods
The cockpit idea originated from aerospace and aeronautics. A flight, for example, could be
considered as a process that is comparable to a development process in IT. Coworkers of
different areas participate in the same process (pilots, air safety, passengers, etc.). Every
participant requires different information about the flight (process) or the plane (product)
respectively. The passenger on the one hand would like to see information about the flight
distance (service) and the time to destination on his private screen. The pilot on the other hand
needs to understand the technology, operational reliability and other characteristics of the
plane. Lastly, the flight safety is provided with information about the airspace and the planes
that are passing through it, in order to be able to coordinate safe routes4.
Cockpit in management field is a methodology designed to improve efficiency of a process,
it’s closed to Balanced Scorecard Method. Balances scorecard supplies information regarding
performance measures, targets and initiatives. Management cockpit represents the fourth
generation of reports (after financial reports, scorecards, and prospective dashboards). This
concept was developed in 1989. The concept of Cockpit is based on 4 principles from which
this methodology is different to its predecessors:
1. Ergonomic presentation: Based on human intelligence sciences, information is
represented with symbols to avoid the perception bias;
2. Operational KPI: Management cockpit integrates operational indicators as well as
strategic ones. It makes people accountable at each level of the organization;
3. Structural approach: Management cockpit proposes an implementation methodology,
through for example « cockpit briefing »;
4. Automation: Data are periodically provided by system or human body to dedicated
software.
Enterprises rely on management cockpits to support the visualization of information, the
decision making and mission definition.
Different tools could support the approach. They have to provide all of the communication
and collaboration required for this kind of controlling. They must be simple, visual, and easy
to understand. Among tools we can mention smartcockpit and balance score card have their
own pros and cons, and it is quite difficult to say which one is the best; nevertheless, in this
chapter we focus on smartcockpit which is a communication and decision tool with clear and
efficient insight. Smartcockpit by collaborating the data can manages links to other

Project ID 284860 MSEE – Manufacturing SErvices Ecosystem
Date: 19/10/2012 Deliverable D13.5 – M12 V1.0
MSEE Consortium Dissemination: PUBLIC 11/58
applications, or to analysis document allowing detailed comprehension of a situation. It has
the ability to decide visualize, follow and share improvement actions plans. Meanwhile, From
ICT updated tools smartcockpit ergonomy was thought to adapt on mobile devices.
In software development, cockpits for the first time allowed for the efficient monitoring of a
variety of project related status information as well as the generation of trend analyses.
Project information can be displayed in a standardized and transparent manner; the evaluation
and assessment of the project is eased significantly resulting in a clear and simple reporting.
Thereby, it is clearly not desirable to create new information domains. Instead, existing
systems, such as customers, software development and project management are integrated
with each other allowing for an enhanced communication between each other. Hence,
cockpits can help to establish a more realistic project planning. The complexity and the cost
of software development can be reduced to a minimum as process and product related risks
can be faster identified.
Several different approaches support the software development process. Tools and tool
infrastructures on the one hand allow for a process planning and controlling that is based on
project related measurement and data management (e.g. knowledge plan, Microsoft Project,
Function Point Workbench, COCOMO II Tool, Rational and Metrics One, SLIM Tool etc.).
The collected data is usually measurement data that reflects the product quality (often based
on so called code metrics) as well as project related data extracted from effort estimation and
process planning activities(resources, timeline, preconditions).
Figure 1- Example of the adaption of Cockpit by an enterprise
Project data for the reporting to the management on the other hand is aggregated and very
often processed manually. The figure above demonstrates an example featuring an Alcatel
product division that introduced a management cockpit in order to support the management
activities.
The analysis of possible representations for process and product data is the starting point for
the development of a cockpit solution. By using the cockpit, the management is provided with
all the information that is required for an optimal controlling and steering of a software
project. In case of a project control center, it is desirable to visualize the individual project

Project ID 284860 MSEE – Manufacturing SErvices Ecosystem
Date: 19/10/2012 Deliverable D13.5 – M12 V1.0
MSEE Consortium Dissemination: PUBLIC 12/58
drivers on separate screens and in different visualization modes. The measurement,
interpretation and representation of the project metrics are realized through tools on the one
hand and internet based web services on the other hand. The individual cockpits provide up-
to-date and consistent data and hence allow for a well structured access to all relevant
information.
In order to evaluate the results that were gained for the control or steering process, complex
aggregation and examination operations are applied. Figure below shows a composition that
is feasible for the application in enterprise management areas. It is shown how such a
composition can be arranged on one screen, whereby only a subset of much more complex
cockpit architecture might be involved.
Figure 2 - Analysis of enterprise management area
It should be emphasized at this point that there are various types of ICT tools which can
support the enterprise refer to their capabilities like:
- Computer Aided Design (CAD);
- Computer-Aided Software Engineering (CASE);
- Enterprise Resource Planning (ERP);
- Material resource Planning (MRP);
- Statistical Process Control (SPC);
- Standard operation Planning (SOP), etc.
Referring to the above mentioned systems they have their own pros and cons, and exploited
for the different types of software cockpit applications for use in various areas, such as
enterprise development, service maintenance as well as quality management etc.
In this document we take into account ERP systems because they are able to cover different
functional areas in the whole enterprises management. In fact, by integrating internal and
external management information across an entire enterprise ERP can facilitate the flow of
information between all business functions inside the boundaries of the organization and
manage the connections to outside stakeholders.

Project ID 284860 MSEE – Manufacturing SErvices Ecosystem
Date: 19/10/2012 Deliverable D13.5 – M12 V1.0
MSEE Consortium Dissemination: PUBLIC 13/58
ERP systems typically include the following characteristics:
An integrated system that operates in real time (or next to real time), without relying
on periodic updates;
A common database, which supports all applications;
A consistent look and feel throughout each module;
Installation of the system without elaborate application/data integration by the
Information Technology (IT) department.
The fundamental advantage of ERP is that it integrates processes by which businesses operate
saves time and expense. Decisions can be made more quickly and with fewer errors. Data
becomes visible across the organization. Tasks that benefit from this integration include:
- Sales forecasting, which allows inventory optimization;
- Order tracking, from acceptance through fulfillment;
- Revenue tracking, from invoice through cash receipt;
- Matching purchase orders (what was ordered), inventory receipts (what arrived), and
costing (what the vendor invoiced).
In next chapter we will try to link deeply ERP systems with service governance. ERP
functional categories have been chosen to be used as the basis for the identification of KPIs
which are related to the service system. Categories helped us to identify the indicators clearly
because they are useful to generate a structure inside the enterprise environment.
Here below we provide a brief list of categories we finally identified, they are going to be
explained with details in the next chapter:
- Administrative;
- Financial;
- Legal;
- Management;
- Service Operation;
- Marketing & Sales;
- Logistics;
- After sale;
- ICT;
- Human Resources;
- Design;
- Customer Management.
In the next deliverable we are going to identify with more details different types of KPIs
which are related to service strategy and service offering; spare parts managements and
customer management.
3.4. Extraction of relevant criteria
After analysing significant measurements methods, in this chapter we are going to identify
relevant elements in the perspective of creating a MSEE toolset for monitoring service
systems.
The measurements are finalized to the achievement of a certain level of performances and
quality. In fact all enterprises have interest in providing their clients/users the exact service
they meant to.

Project ID 284860 MSEE – Manufacturing SErvices Ecosystem
Date: 19/10/2012 Deliverable D13.5 – M12 V1.0
MSEE Consortium Dissemination: PUBLIC 14/58
The quality of service (QoS) implies all the characteristics of a service that relate with its
ability to satisfy and implied stated needs of the service user (ITU-T E.800, 2008). The user
can correspond to a private subject (B2C) or can rely on another enterprise or business
identity (B2B, i.e. another service provider).
Service quality describes a comparison between expectations and performances the service
actually offers. Through the service quality management it is possible to monitor and maintain
the service system.
Governance essentially involves the control of all the decisions an enterprise has to deal with.
It implies strategies and decision making. Therefore, to align with the task of this deliverable,
we are going to define service governance through the control of relevant categories. These
categories correspond to significant elements which define service quality and can be assessed
in the base of specific KPIs.
KPIs are fundamental to measure quality values and performances in order to support
decision making.
Ergo service governance can be defined through the control and monitoring of these elements.
In the below table it is possible to see the priority dimensions identified by Value Reference
Model (VCG 2012).
The VRM model is structured to support the integration of the three domains product
development, the supply chain and customer relation in a reference model for an integrated
value chain. Each dimension represents a different area for optimization of the VRM.
Priority Dimension Description Examples for KPI‘s
Reliability The ability to deliver the correct
product to the correct market and
customers on time.
Delivery Performance,
Request DateProduct
Release VarianceForecast
Accuracy
Velocity The cycle time it takes to deliver
a product or service to the
customer.
Order Fulfillment Lead
TimeProduct Development
Lead Time
Adaptability The capability in responding to
market place changes to gain or
maintain competitive advantage.
Delivery AdaptabilityValue
Chain AgilityIdeation Yield
Cost The cost associated with
operating a value chain.
Cost of QualityDesign Cost
RatioLogistics Cost
RatioManufacturing Cost
RatioSales & Marketing Cost
Ratio
Asset The effectiveness of an
organization in managing assets
of the value chain to support
market and customer satisfaction.
Asset TurnoverCash
Conversion CycleDesign
RealizationInventory Days of
Supply
Innovation The ability to strategically
leverage internal and external
sources of ideas and introduce
them to market through multiple
paths.
Product Innovation
IndexR&D Profit
Contribution
Customer The capability to develop positive
collaborative customer
relationships.
Customer Growth Rate

Project ID 284860 MSEE – Manufacturing SErvices Ecosystem
Date: 19/10/2012 Deliverable D13.5 – M12 V1.0
MSEE Consortium Dissemination: PUBLIC 15/58
Table 1 - VRM Priority Dimensions (VCG 2012)5
This table can be used as a reference in MSEE proposition of relevant elements to measure
governance within the service system environment. Therefore, deriving from the methods
mentioned previously and analysing the quality of service definition, we identified the
following key pillars to be used as a measuring filter or criteria to evaluate and improve the
current level of service quality and performances6:
- Effectiveness;
- Efficiency;
- Confidentiality (security);
- Integrity;
- Availability;
- Compliance;
- Reliability;
- Productivity;
- On time delivery;
- Cost;
- Interoperability;
- Customer satisfaction.
In the next section, we are going to specify each of these key pillars in order to clarity what is
meant for each element.
Effectiveness
Effectiveness relies on the capability of producing a desired result. If something is estimated
as effective, it means it has reached the intended or expected outcome.
It entails the ability of an organization of managing assets of the value chain to support
market and customer satisfaction (VRM Priority Dimensions, VCG 2012).
Efficiency
Efficiency studies traditionally measure the performance of a firm by its ability to transform
inputs into outputs (Frei and Harker, 1996)7.
In general Efficiency describes the extent to which time or effort is well used for the intended
task or purpose. It is often used with the specific purpose of relaying the capability of a
specific application of effort to produce a specific outcome effectively with a minimum
amount or quantity of waste, expense, or unnecessary effort.
Efficiency and Effectiveness
The term "efficient" is often confused with the term "effective". Generally speaking,
efficiency is a measurable concept, quantitatively determined by the ratio of output to input
while effectiveness is a relatively vague, non quantitative concept, mainly concerned with
achieving objectives.
Effectiveness represents the relationship between the planned target cycle and the actual
cycle. The effectiveness can be calculated in short periods and indicates how effective a work
unit will be during the production time.

Project ID 284860 MSEE – Manufacturing SErvices Ecosystem
Date: 19/10/2012 Deliverable D13.5 – M12 V1.0
MSEE Consortium Dissemination: PUBLIC 16/58
Formula: Effectiveness = Planned Run Time per Unit (PRU) * Produced Quantity (PQ) /
Actual Production Time (APT).8
Efficiency is measured as the ratio between the observed output and the maximum output,
under the assumption of fixed input, or, alternatively, as the ratio between the observed input
and the minimum input under the assumption of fixed output.
Generally speaking, a simple way of distinguishing between Efficiency and Effectiveness is
the saying, "Efficiency is doing things right, while Effectiveness is doing the right things."
This is based on the premise that selection of objectives of a process are just as important as
the quality of that process.
Security
Security entails the freedom from risk or doubt. It involves physical safety, financial security
and confidentiality. It involves also the concept of privacy, defined as the right of individuals
to control or influence what information related to them may be collected and stored and by
whom and to whom that information may be disclosed.
Security concerns the sense of minimizing the vulnerabilities of assets and resources. Assets
stand for anything of value while vulnerability consists in any weakness that could be
exploited to violate a system or the information it contains (ITU-T X. 800). Security service is
a service, provided by a layer of communicating open systems, which ensures adequate
security of the systems or of data transfers (ITU-T X.800). Examples of security services are
key management, access control, and authentication.
Integrity
Integrity involves the quality of a service of being complete or whole, presented in a good
condition without any missing parts and errors.
It entails the degree to which a service, once obtained, is provided without excessive
impairment.
Integrity is a concept of consistency, intended as the capability of receiving the same each
time. Integrity has a great role in monitoring the service system. By integrity we can create a
strong relationship among all the departments which compose the enterprise like financial
department, service department, human resources, logistic department, production
department, management department, etc…).
Availability
Availability of an item means this item must be in a state to perform a required function at a
given instant of time or at any instant of time within a given time interval, assuming that the
external resources, if required, are provided (ITU-T E.802). Availability stands for providing
something exactly when it is needed.
Availability stands for accessibility too. Something is available if it is possible to access it, in
its location and with the expected frequency. Availability infers he probability that the user of
a service, after a request (to a network), receives the proceed-to-select signal within specified
conditions. It means the service is available when desired therefore also approachability and
ease of contact are involved.
Compliance
Compliance means conformance with laws, regulations, standards, contracts, policies, or
similar sources of requirements on how enterprises run services9.
Compliance management is the practice of assuring compliance and it has become an
increasingly important concern in today’s companies, since the set of requirements companies

Project ID 284860 MSEE – Manufacturing SErvices Ecosystem
Date: 19/10/2012 Deliverable D13.5 – M12 V1.0
MSEE Consortium Dissemination: PUBLIC 17/58
have to implement grows fast and has relevant effects on the entire enterprise business
practices.
Many new laws concerning enterprises set new paradigms like for example the duty to
document processes and show them to external auditors, or the duty to document events
related to enterprise goals, etc…(one useful example is the United States Sarbanes-Oxley
Act).
Reliability
Reliability stands for the probability an item can perform a required function under stated
conditions for a given time interval. Therefore it involves the possession of the required skills
and knowledge to perform the service, the consistency of performances and dependability.
Reliability entails the ability to deliver the correct product to the correct market and customers
on time (VRM Priority Dimensions, VCG 2012). Therefore it means that the firm performs
the service right at the first time. It also means that the firm honours its promises. Specifically
it involves the following activities: accuracy in billing, keeping records correctly and
performing the service at the designated time.
Productivity
The term of productivity economically is defined as the ratio between output and input
(Mohanty, 1998). On the one hand productivity is related to utilization of resources, on the
other hand productivity is related to the creation of value. Productivity depends on variations
from competitors or other standards at a certain point of time or on changes over time
We can define service productivity at the outset of analysis as the ability of a service
organization to use inputs for providing services with quality matching the expectations of
customers (Järvinen et al., 1996)10
.
On-time delivery
This means the ability to respond to the customer within a reasonable amount of time. The
scheduled date and time is agreed upon between the customer and services provider, and
deviations from this schedule cause service noncompliance. On time delivery also involves
responsiveness.
The response could be related to a question, problem, quote, inquiry, or order change.
Responsiveness concerns the willingness or readiness of employees to provide services and it
involves timeliness of service (like for example posting a transaction slip immediately;
returning a phone call quickly; giving prompt service; setting up appointments quickly).
Organizations that cultivate customer intimacy are usually concerned about how responsive
they are.
Cost
Cost is the monetary valuation of resources, time, risks and utilities consumed in the
production and delivery of a service.
Cost is a key driver to assess service quality. Cost is a key element which affects both service
providers and customers in decision making. Cost implies the monetary meeting between
performances requested and offered quality.
This means cost has to adhere to established budgets and spending plans while meeting
service objectives.
Interoperability
Project ID 284860 MSEE – Manufacturing SErvices Ecosystem
Date: 19/10/2012 Deliverable D13.5 – M12 V1.0
MSEE Consortium Dissemination: PUBLIC 18/58
Interoperability is the ability of diverse systems and organizations to exchange information in
order to work together using the data which have been shared and exchanged11
.
According to the International Standards Organization institute, interoperability can be
defined as "the capability to communicate, execute programs, or transfer data among various
functional units in a manner that requires the user to have little or no knowledge of the unique
characteristics of those units" (ISO/IEC 2382-01, Information Technology Vocabulary,
Fundamental Terms).12
A checklist of functionalities can be proposed to be employed as a interoperable reference
technicality (i.e. the use of technical methods or terms) which can provide a compatible
communication equipment among enterprises.
As the goal of interoperability relies on providing effective and efficient exchange between
computer systems, the checklist will provide a list of tools the Ecosystem partners have to
possess and use in order to interconnect different types of data through networks, computer
systems, operating systems, end-user applications and application software etc...
Customer satisfaction
Customer satisfaction entails the way the service experienced by a customer has been
perceived.
It is a measure of how a service supplied by a company meets or not customer expectations.
Therefore it measures the gap between the customer's expectation of performances and their
real perceived experiences. It is related with the satisfaction goals an enterprise intends to
reach and actually reaches. Customer satisfaction is a driver to purchase intentions and
loyalty. This issue is going to be described deeply in the next section.
3.5. Customer perception
In this section the customer perception is going to be considered with the purpose of
specifying the leading role of the feedback of the market in service systems.
Apart from objective data, it is fundamental to measure the customer perceptions too in order
to monitor service effectiveness. A service needs to fit customer’s expectations: subjective
performance measures are as important as objective ones in monitoring the service system.
On one hand objective parameters correspond to parameters that are measurable with
instruments or through observations; a performance value can be then assigned quantitatively
to classify them.
On the other hand parameters that are expressed by human judgment will be classified as
subjective or qualitative parameters.
Customer perceptions are critical in any service context because the quality of service id
experienced by the user. The quality of the service is influenced by the delivered quality of
service and the psychological factors influencing the perception of the user. Quality issues are
of fundamental importance to optimize revenue and resources of the service provider. In the
world of service delivery for example, they’re especially important due to the personal and
interactive nature of services.
Project ID 284860 MSEE – Manufacturing SErvices Ecosystem
Date: 19/10/2012 Deliverable D13.5 – M12 V1.0
MSEE Consortium Dissemination: PUBLIC 19/58
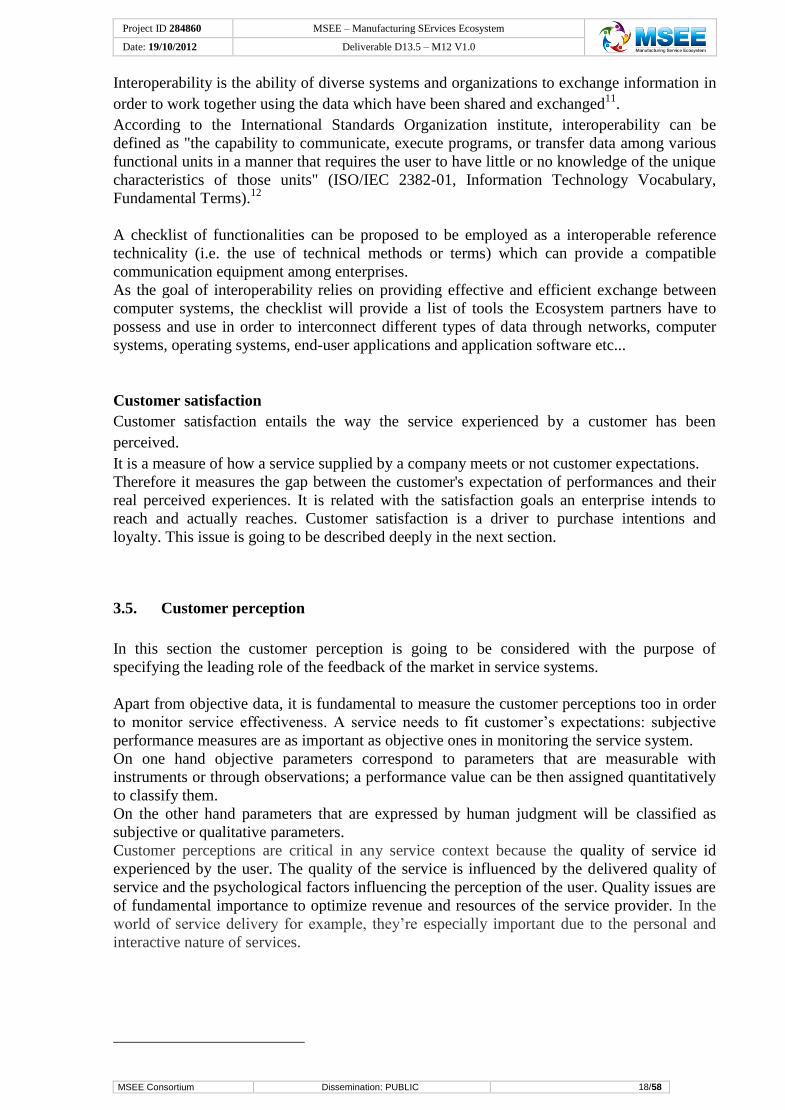
Figure 3 - Process Model (from ISO 9001:2009).
The above figure describes the process model of the continual improvement of the Quality
Management System. As we can notice, customer is a key factor in the quality process model.
Customers are considered from the beginning to the end of the entire quality life cycle system.
Enterprises focus on them as a strategy to continuously improve their quality management
system. Moreover customer satisfaction is another crucial indicator for quality management
too.
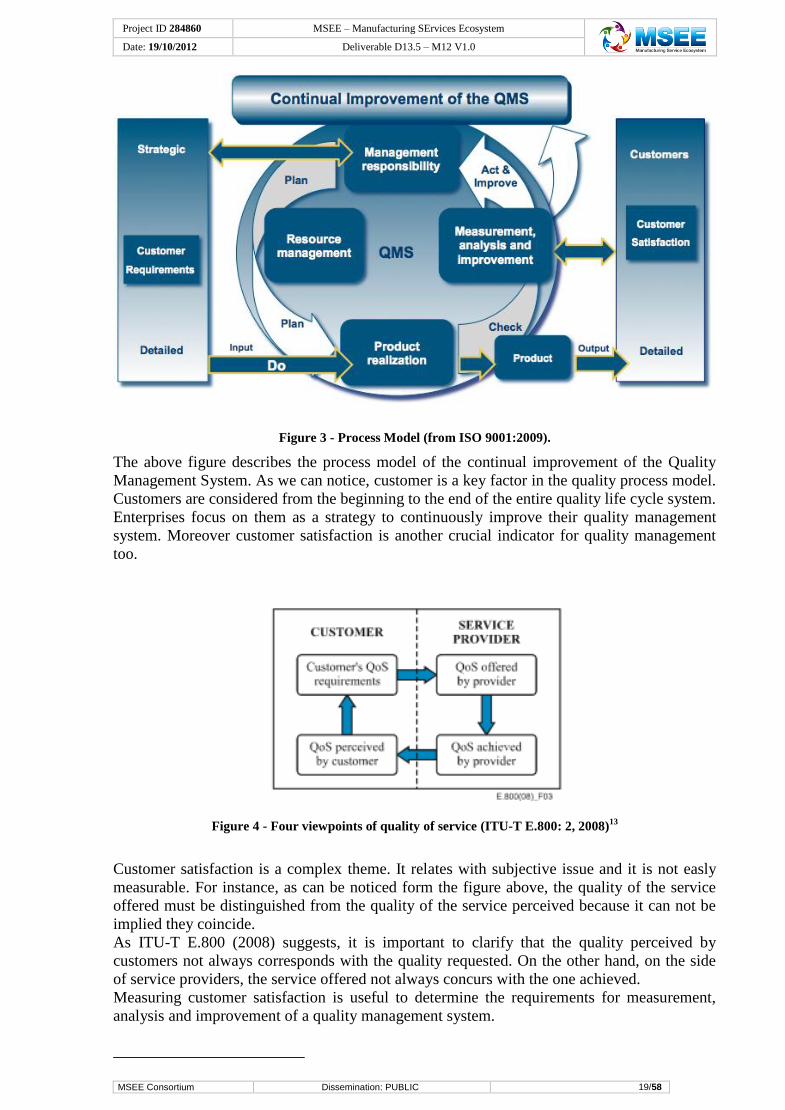
Figure 4 - Four viewpoints of quality of service (ITU-T E.800: 2, 2008)13
Customer satisfaction is a complex theme. It relates with subjective issue and it is not easly
measurable. For instance, as can be noticed form the figure above, the quality of the service
offered must be distinguished from the quality of the service perceived because it can not be
implied they coincide.
As ITU-T E.800 (2008) suggests, it is important to clarify that the quality perceived by
customers not always corresponds with the quality requested. On the other hand, on the side
of service providers, the service offered not always concurs with the one achieved.
Measuring customer satisfaction is useful to determine the requirements for measurement,
analysis and improvement of a quality management system.

Project ID 284860 MSEE – Manufacturing SErvices Ecosystem
Date: 19/10/2012 Deliverable D13.5 – M12 V1.0
MSEE Consortium Dissemination: PUBLIC 20/58
Several tools have been developed to measure customer satisfaction. In fact there are different
ways an enterprise may determine the level of its customers’ satisfaction. Referring to ISO
9001:200814
, among the most used methods and indicators we can list the following:
- Customer survey
In customer surveys two factors are important: what is the firm asking and how. It can be
carried face-to face, by phone, by mail, by questionnaires, etc..
The surveys can be carried out internally or by using external agencies. This is probably one
of the most expensive methods of determining how satisfied customers are.
- Call centers
Call centers can be a good tool to collect data about customers. The customers don’t have to
be the existing, they can be potential ones who can be asked for their needs and expectations
the firm could use to focus on new services or to improve customer satisfaction.
- Turnover of Customers
Customer turnover is the proportion of your customer base at the start of a time period that is
lost and replaced during the time period. It is important to know how many customers leave
the firm to find services of competitors and how many new customers the organization gain.
Customer turnover is a useful measure of how successful the organization is.
- Repeat orders
It means another order from a customer who has ordered the same thing before.
Some salespeople rely on established customers to provide repeat orders rather than actively
seeking new business. Repeat orders denote customers' recognition that the service has been
satisfactory and this provides a high return on investment.
- Sales feedback
The organization may have a sale force process for dealing with feedbacks and acting upon
them. Sales feedbacks are positive and constructive because they help the firm finding out the
needs and expectations of existing and potential customers and understanding the market
response in order to improve their services.
- Accounts data
Accounts departments can hold a huge amount of data relating on clients. These data can be
useful to improve the customer satisfaction because it will help determining what a customers
could need and how would act next.
- Warranty claims
The study of the analysis of claims can supply interesting results to improve the customer
satisfaction level.
- Delivery performance
The presence of a monitoring system specific for the delivery will help keeping high the
quality of the entire service system.

Project ID 284860 MSEE – Manufacturing SErvices Ecosystem
Date: 19/10/2012 Deliverable D13.5 – M12 V1.0
MSEE Consortium Dissemination: PUBLIC 21/58
- Price
Price is not always the main factor in decisions making. Anyway it is important to know if
customers are satisfied with the service fees.
- Service reliability
A firm needs to monitor the reliability a customer has perceived on a service in order to
improve and enhance its delivered reliability from the point of view of its clients.
- Complaints
Logging and analysis of complaints is an important part of any organization control system.
An effective complaints system will be very useful at finding the cause of the problem,
carrying out the analysis of the feedback and ensuring that the results of the analysis would be
used to solve the problem.
In the below figure, we can see a concept model proposed by Kicherer et al. (2011)
concerning the correlation between KPI-based productivity monitoring, process management
and resource allocation.
Figure 5 - Composition of the three-phase Service Management Concept (“ServUp” Project)15
The analysis and tools section includes the monitoring of technology, processes as well as the
customer interaction. Then a dynamic integrated KPI system is applied to help monitoring and
optimizing the service performances and the whole service system quality.
In a similar way we are going to identify specific KPIs to assess the service system in order to
help monitoring and controlling it.
In the next chapter, referred to above cited pillars and following the MSDE Architecture, we
will classify a checklist with relevant elements and indicators which will be a useful toolset
for service monitoring and controlling.

Project ID 284860 MSEE – Manufacturing SErvices Ecosystem
Date: 19/10/2012 Deliverable D13.5 – M12 V1.0
MSEE Consortium Dissemination: PUBLIC 22/58
4. MSEE Governance support toolset
In this chapter we will develop a MSEE method to support governance (i.e. a governance
support toolset) through the action of monitoring and controlling the service systems.
Adequate measures for effectiveness, efficiency, productivity and flexibility have to be
reached in order to offer a satisfactory service system.
The basic idea behind the generation of a toolset is to increase service performances of a firm
in its internal as in external relationships. Therefore the toolset will be integrated within the
MSE platform so to support service management, exchange and evaluation within the
manufacturing networks. Data will be shared within the enterprises ICT systems in order to
allow a fast and easy exchange of information among partners. This will be useful to provide
the partners with effective solutions for governance.
Another important issue is to share resources among parties and provide them a method to
measure performances and customer satisfaction in order to create trust relationships and meet
customer needs.
The toolset is created to improve the efficiency of the service system by reaching the main
goals of the criteria identified in the previous section.
Service management needs to be able to measure and control all players that are involved
within the service system in order to ensure a maximized productivity. Then the requirements
for a KPI driven management are also discussed in this section.
Relevant elements and indicators, which are useful for service monitoring and controlling,
have been classified referring to the MSDE Architecture. We identify specific factors and
generate a Table of KPIs useful to audit the service system. All the findings have been
specified into the three level of decomposition (strategic, tactical, operational) on the basis of
the MSDE Architecture in order to classify quantity and quality KPIs inside one unique
model. The MSDE Architecture has been used, therefore, as a framework to define in detail
which parameter is affecting the monitoring of a service system and at which level within the
enterprise environment. Related KPIs are then presented in three levels, as following the
decomposition of BSM level (i.e. Strategic, Tactical and Operational). It can be stated that the
remain KPIs which are collected in TIM and TSM levels specify the parameters which can be
used as a supporting mean referring to technology implementation.
In the previous chapter we provided some elements able to affect service quality and customer
satisfaction. We defined them to be key pillars in service quality management and in this
section are going to be presented in out toolset as the filter for monitoring and controlling the
service system.
KPIs will therefore be monitored through the use of those criteria as a filter.
4.1. Elements of the toolset
In this toolset we are going to specify which elements bridge the gap between service system
evaluation and controlling methods.
The toolset is presented in the shape of a checklist, a matrix which is able to contain different
elements and monitor them. A list of the specific features is provided below:
- KPIs specific to monitor service system defined at BMS-TIM-TSM level);
- Criteria: elements used as filters to monitor the service system (identified in the
previous chapter);
- Complexity of the aggregation. It specifies the level of complexity aggregation of the
firm according to the MSEE Project: a single enterprise, the configuration of the
VME, The Ecosystem;

Project ID 284860 MSEE – Manufacturing SErvices Ecosystem
Date: 19/10/2012 Deliverable D13.5 – M12 V1.0
MSEE Consortium Dissemination: PUBLIC 23/58
- Weight: the score derived from the monitoring;
- Weighted balance: final result with which the toolset can propose solutions to optimize
the service performances;
In the below figure a conceptual representation of the toolset is presented. As it is possible to
note, the toolset takes the shape of a checklist. It entails a matrix of elements to be assessed
following certain criteria.
Figure 6 - Conceptual model of the proposed toolset
The monitoring and control system will be divided in two different phases: an initial, design
phase and a momentary, run in time phase. Therefore the toolset will differ according to these
phases, it will provide two diverse lists of KPIs to control, due to distinct parameters to
monitor.
The generation of two diverse checklists is due to identify and measure the parameters
necessary to design a service and, subsequently, to monitor them in the moment they will be
in action.
4.1.1. Design and Run time Phase
The service system needs to be monitored during its design phase as well as in its run in time
phase.
Therefore the monitoring and controlling method will have to consider more deeply on the
basis of these following phases.
Service management control may be considered in its fundamental phases where specific
KPIs and SLAs may be applied.

Project ID 284860 MSEE – Manufacturing SErvices Ecosystem
Date: 19/10/2012 Deliverable D13.5 – M12 V1.0
MSEE Consortium Dissemination: PUBLIC 24/58
For example, in the Design phase, a smart editor will be considered, to gather the necessary
information concerning purposes, decisions and KPIs, while the Run-time phase should be
focused on monitoring tools and relevant follow up decisions.
To specify better this issue, as presented in the next figure, Design phase would provide an
input to Run-time phase, to sort out appropriate KPIs and SLAs, in order to monitor and to
govern a manufacturing service ecosystem (MSE).
Alternatively, a feedback to the Design phase would be considered to improve the smart
editor at this stage.
All the data related to service KPIs management will be gathered into a repository, which
should provide an input to further analysis and an updated version of ecosystem governance.
Figure 7 - Design and Run-time phases
The toolset will present two diverse matrix according the two different phases. The design
phase checklist will include indicators which analyse the last three year performances of the
service. This will be useful to assess the credibility of the enterprise and to understand better
the history of each partner of the Ecosystem.
While the run-time checklist will include the momentary monitoring of the service
performance.
4.1.2. Monitoring and controlling at various levels of MSEE
We propose to use the level of complexity of aggregation of the firm as a filter to assess the
service system. Various levels of monitoring can be proposed according to the configuration
complexity of the servitization, as follow:
- Enterprise level;
- VME level;
- MSEE Ecosystem level.
Control and monitoring methods can be applied to each specific layer and differentiate the
controlling proposal.
As already explained, the toolset will be integrated within the MSE platform in order to
support service management, exchange and evaluation within manufacturing networks.
Therefore the role of the enterprise in its internal and external relationships becomes crucial.
The service system will be configured in different ways if it s providing a solution for a single
Design phase
(i.e. smart editor)
Run-time phase
(KPIs monitoring tool)
Repository

Project ID 284860 MSEE – Manufacturing SErvices Ecosystem
Date: 19/10/2012 Deliverable D13.5 – M12 V1.0
MSEE Consortium Dissemination: PUBLIC 25/58
enterprise, a VME configuration or the Ecosystem. As the role of the enterprise changes, the
goals and business tasks change accordingly and imply changes in the service system too.
Further research is needed in this section. In the next deliverable a more detailed specification
will be presented.
4.2. Toolset Method definition
In this section we are going to evidence the method, the rules and the sequence of information
and actions that are needed in order to generate the cited toolset.
We can summarize them as follow:
- Define KPIs, the parameters to assess;
- Define the rules to use to assess the parameters, i.e. identify the categories that will be
used as filters to monitor the indicators (i.e. the filtering elements and the level of
complexity);
- Monitor the indicators (checklist);
- Define the threshold levels, i.e. identify the assessment criteria deriving from the
specific service goal. Threshold levels always change according to the specific service
task;
- After monitoring of all the filters, assess which parameter is acceptable and what is
not;
- Propose an improvement plan or corrective actions according to the monitoring
assessment.
Monitoring the system is due to optimize the resources and support decision making.
Determinate what are the relevant KPIs to monitor the service system is a key issue. Then the
analysis of data helps improving the whole system performance management. Audit results
give fundamental indications about performance trend analysis. Corrections, corrective
actions and follow-up activities can be easy developed according to the results. Audit criteria
score interprets the service goals and responds to the definition of the specific strategic
planning.
Each indicator will be assessed and will get a score defined with the column “weight”. A
criteria system has been identified to measure all the parameters.
A parametric threshold will be defined in line to service tasks. Then, in accordance to this
service target threshold, a weighted balance will be assigned to each indicator. Conforming to
the weighted balance, a model of visualization is provided, in order to support enterprises in
understanding the circumstances and taking strategic decision.
If the threshold is not reached, a proper improvement plan or corrective actions will be
provided.
Results will be used to provide recommendations as the basis for development and change.
A weighted balance will be associated to each indicator in relation to the service goal. The
weighted balance, as well as the threshold level, is parametric; it varies in relation with the
task or the focus the service implies.
In fact, in the basis of different service purposes, the focus of the service will change
accordingly. MSEE members will be able to choose their partners according to the focus of
the service they want to create. Therefore members will be able to cooperate with the more
suitable partner inside the Ecosystem for the very specific goal their service needs.
Partners will be monitored then through the same checklist but following particular
assessment rules defined specifically for their service goal.

Project ID 284860 MSEE – Manufacturing SErvices Ecosystem
Date: 19/10/2012 Deliverable D13.5 – M12 V1.0
MSEE Consortium Dissemination: PUBLIC 26/58
4.3. Governance support toolset proposition
According to the elements identified in the previous paragraphs, in this section we propose
the complete list of parameters identified for the service support toolset which are related to
MSEE toolset for measuring.
KPIs have been selected referring to MDSE Architecture (following the decomposition by
level of abstraction) and taking into account also Deliverable 13.3 in order to integrate the
results about parameters affecting trust and liability too inside the checklist.
As already described, diverse specific tables will be provided for monitoring the design phase
and the run in time phase.
To synthesize and optimize the table, filter elements used as criteria have been presented with
reference numbers. A legend is described as follow:
- Effectiveness;
- Efficiency;
- Security;
- Integrity;
- Availability;
- Compliance;
- Reliability;
- Productivity;
- On time delivery;
- Cost;
- Interoperability;
- Customer satisfaction.
In the same way, we used two letters to synthesize different categories as follows:
- “W” stands for score;
- “WB” stands for scored weight.
Here below you can find our Governance support toolset proposition for service system which
takes the shape of a checklist matrix.
KPIs Criteria Complexity W WB BSM (Business Service Modeling) 1 2 3 4 5 6 7 8 9 10 11 12 En VME Ec
STRATEGICAL Stable service mission regularly/week or month Long-term culture and value referred to the SLA Service Brand value Service capabilities Service guarantee Service Financial capital guarantee Service functionality (resources and industry expertise, human capabilities and knowledge, Skills, Seniority, Reusability of resources, R&D, Design Expertise_ human related field) Service Innovation Service Law and regulation Service Standards ( internal controls and audit systems) and best practices

Project ID 284860 MSEE – Manufacturing SErvices Ecosystem
Date: 19/10/2012 Deliverable D13.5 – M12 V1.0
MSEE Consortium Dissemination: PUBLIC 27/58
Service Responsibility (safety issues, reliability, guarantee, recall campaigns, reliability factor (e.g. 100000 km/car), complaints and service breaches) Cost ( Enterprise Investment, service operation cost, etc…) Service Control Management System Service performance goals feasibility Service Support management tools Service Relationship tools among suppliers/customers Number of incentives Number of new services/introduced services Number of new service requirements added by R&D / total number of requirements Number of project developed in co-design/ total number of project developed Number of people involved in the service process with full access to service data/total number of people involved in the service process Number of service designers/ number of employees Service costs/total costs BEP NPV to analize the profitability of service investment Profits from new services/profits from all services on market Expected number of years of presence on the market Time to market Service Development Lead Time Service DeliveryValue Service Chain Agility Service Cost Ratio/Total cost Marketing Cost Ratio/Total cost Service Asset TurnoverCash/Total turnover Service Innovation Index R&D Profit/Total profit Customer Growth Rate Nr of transactions/partner Nr transaction/industry sector Administrative costs/partner, revenue Organizational (e.g. size and competencies) Financial (P&L, Operational cash flow, turnover related to latest 3 years) ICT Technologies (Interoperability, Platform, Security standards) Number of resources and industry expertise (human capabilities and knowledge, Seniority, Reusability of resources) Health and Safety Issues Price MSE Turnover (Turnover/partner, Turnover/industry sector, SLAs) Number of knowledge exchange events (forum, conferences)/ number of events R&D projects in cooperation with customers/ R&D projects

Project ID 284860 MSEE – Manufacturing SErvices Ecosystem
Date: 19/10/2012 Deliverable D13.5 – M12 V1.0
MSEE Consortium Dissemination: PUBLIC 28/58
Number of new ideas developed in the past years
TACTICAL Customer satisfaction rating Number of customer survey/ month or year Service Employee turnover Service Employee satisfaction level Service Social/Relational (reputation, brand identity, satisfaction level) Service Retention bonds/Total service price Price ICT Technologies related to the Service (Interoperability, Platform, Security standards)_ IT related field Service Information sharing tools Human Resources management tools Services Maintenance Service Investments/profit Service Control Management tools Number of Service Accessibility tools Service Documentary Tools (create database) Service Flexibility, disaster recovery, resources reconfigurability, etc Service Quality Management tools On time Service Delivery Number of new introduced services Cost Ratio for Service Operation//Total cost Cost RatioLogistics/Total cost Number of recruited partners Number of partners by type of organization Reaction to complains Nr of complains/partner Association fees R&D (investments in Technology) Quality and reliability On time delivery Number of applications/industry sector Nr of contracts/industry sector Value of incomes generated per period Mean value of incomes per patent Financial backlog (short, medium, long term) Operational cash flow Turnover Repository Size for Tangible and Intangible assets management Number of Periodical Issuing of MSE KPIs and SLAs Number of communication events (forum, meetings, Advs) Number of tangible and intangible assets available as a service Claiming costs Number of new services implemented/ number of projects generated

Project ID 284860 MSEE – Manufacturing SErvices Ecosystem
Date: 19/10/2012 Deliverable D13.5 – M12 V1.0
MSEE Consortium Dissemination: PUBLIC 29/58
OPERATIONAL Number of adopetd Service International/national quality standards Operational cash flow Number of Service Technological facilities (tools and device) Service maintenance employee/month Service maintenance/month Number of tools for evaluating the service quality (checklists, etc) Number of HW/SW for Controlling service processes Number of Aftersale services/service (number of repair shops, number of customer services, etc) Intangible factors Management tools for Service (to evaluate direct knowledge, long-term relationship, shared values, direct experience) Service On time delivery (Internet base services) Number of entries and exits in the Ecosystem Number of entries and exits by type of organization Number of complains/partner Average time to address the problem Number of established agreements Number of satisfied/unsatisfied agreements Number of conflicts arisen Number of conflicts solved Mean revenue for exploited result Timeframe in which the result is exploited SLA Contract costs/partner revenue Legal costs/partner, revenue Claiming costs Recalls Business hold/partner Number of contracts Number of suppliers Number contracts breached Number of long-term strategic collaboration partnerships Number of partnerships per country Number of approved patents Number of pending patents Patent/partner Patent costs/partner Mean number of partners involved in a patent Number of services copied wthout agreement Number of communication channels ( blogs, platforms, internal mail system, posts) Number of physical and online events organized for service development/year Number of service event attended/partner Number of service events participants/event

Project ID 284860 MSEE – Manufacturing SErvices Ecosystem
Date: 19/10/2012 Deliverable D13.5 – M12 V1.0
MSEE Consortium Dissemination: PUBLIC 30/58
Number of service event unattended/partner Number of customer filled surveys/partner Number of received feedback and suggestions/ partner Number of shared documents Number of enquiries to the knowledge management database/partner/month Number of expert advice Number of upgrading occurrences on the knowledge management database/partner/month Number of services, patents, white papers, percentage of responses to demands for each stakeholder, Number of assets put at MSE’s disposal Number of VME joining/partner Number of VME dissemination actions Number of newsletters Number of press releases, Number of appearance in the media Number of published news/partner/month Number of used communication channel Number of information requests/partner Number of inherited assets/outputs/contacts Number of created spin-offs Number of joint-ventures Mean share capital when creating a spin-off SLA for ICT Uptime MTTR/service MTTF/servce MTBF/service Band width capacity Number of transaction to the repository Number of Failure logs Number of SLAs related to tangible and intangible assets Number of R&D researches Value of new services implemented/turnover
TIM (Technical Independent Modeling) Service guarantee Organizational functionality for service (Number of R&D missions, Customer focus, etc) Customer satisfaction rating Number of Service Communication/Information exchange tools (communication channels, HW/SW facilities, available protocols, etc) Number of R&D missions/partner Subgoals for customer satisfaction Type of standards/partner Number of collaboration activity (internal and external)/partner Upgrading technology/service/year

Project ID 284860 MSEE – Manufacturing SErvices Ecosystem
Date: 19/10/2012 Deliverable D13.5 – M12 V1.0
MSEE Consortium Dissemination: PUBLIC 31/58
Service Performance Management (number business goals attended/proposed, number business subgoals attended/proposed, positive feedbacks, monitoring main outputs, evaluating performances) Service Periodical Control Processes Use and update of service information/partner Anthology of relationships with supplier and customers Sservice order fulfillment time/partner Web ordering downtime/partner Number of tools for evaluating the service quality (checklists, etc) Service Monitoring performance tools (human/automated system monitor, analytic tools, anomaly detections) IT oriented service architecture/ IT infrastructure capability/partner Number of customer or supplier complaints/partner Number of standard tasks for service operation/total number of tasks Number of tested parts/ number of supposed critical parts Number of times that a design had to be reworked Number of projects ongoing at the same time/partner Number of new service/projects/partner Number of alternative solutions to new designs/partenr Customer satisfaction rate/partner Service Delivery Performance/partner
TSM (Technical Specification Modeling) Type of standards/partner (domestic and international certificates issued by original manufacturers) ICT Technologies tools/partner (Platforms, Security standards)_ IT related field Information sharing tools/partner (i.e. network tools like Joinme, Facebook, etc..) Service Performance Management tools/partenr (number service goals attended/proposed, number service subgoals attended/proposed, positive feedbacks, monitoring main outputs, etc) HW and SW for Controlling service processes/ partner Service documentation tools/partner (reports, record retentions, paper based/digital Drawing, technical specifications, cd, external hard/software, etc) Type of IT architecture-IT infrastructure/partner (i.e. C++, Java, etc…)
Table 2 - Governance support toolset proposition
4.3.1. KPIs Classification Table
On the basis of monitoring and controlling methods analysed in the previous chapter,
specially referring to management cockpit and ERP systems, some categories have been
identified to help clarify the structure service management has to relate with.

Project ID 284860 MSEE – Manufacturing SErvices Ecosystem
Date: 19/10/2012 Deliverable D13.5 – M12 V1.0
MSEE Consortium Dissemination: PUBLIC 32/58
These categories have then been used to support the KPIs identification to monitor service
governance inside the enterprise environment. A detailed list is provided here, as follow:
- Administrative (Administrative Issues, Organization, Employing, Security, Execution,
Safety Issues, etc…);
- Financial (Financial Accounting, Cash Management, Purchasing, Selling,
Commercial, Payables, Budgeting, Costing, Receivables, Financial Consolidation,
Bills of materials, Order to cash, Activity Based Costing, Project costing, Billing,
etc…);
- Legal (Contracts, Claim Processing, SLAs, Partners and Customer transaction, etc…);
- Management (Business strategy, Risk Management, Work orders, Scheduling,
Workflow management, Quality control, Project management, Service Life cycle
management, Resource management, Enterprise management, Process control
management, Activity management, Performance governance management, etc…);
- Service Operation (Service processes, Service flow, Service operation, On time
delivery, Service tools, Maintenance, Service accessibility, Service Life cycle
management, etc…);
- Marketing & Sales (Marketing, Advertisement, Communication, Events, etc…);
- Logistics (Storage, Supply chain, Inventory, Service delivery, Packaging,
Warehousing, Transportation, etc…);
- After sale (Support Services, Maintenance, Service training, Assistance, Availability
of service clinics, etc..);
- ICT (ITC tools, Communication, ordering, Service processes, Infrastructures,
Standards, etc…);
- Human Resources (HR process management, Expertise, Seniority, Training,
Separation, Retirement, Recruiting, Payroll, Placement, talent Management, etc…);
- Design (R&D activities, Project planning, Resource planning, Design activities,
Service development activities, etc…);
- Customer Management (Customer services, Customer satisfaction, Customer relation,
Contact information, Support, Customer interfaces, Recalls, Claim, etc…).
In the previous Table specific KPIs which affect service governance have been presented
according to MSDE Architecture. At this moment, after defining the relevant categories
which compose and give structure to the service governance, we try to classify them
accordingly.
KPIs CATEGORIES
BSM (Business
Service Modeling)
ADMINISTRATIVE
FINANCIAL
LEGAL
MGMT
SERVICE OPERATION
MARKETING&SALES
LOGISTICS
AFTER SALE ICT
HUMAN RESOURCES
DESIGN
CUSTOMER MGMT
STRATEGICAL Stable service mission
regularly/week or
month
x Long-term culture
and value referred
to the SLA X Service Brand value X Service capabilities x Service guarantee x Service Financial
capital guarantee x

Project ID 284860 MSEE – Manufacturing SErvices Ecosystem
Date: 19/10/2012 Deliverable D13.5 – M12 V1.0
MSEE Consortium Dissemination: PUBLIC 33/58
Service functionality
(resources and
industry expertise, human capabilities
and knowledge,
Skills, Seniority, Reusability of
resources, R&D,
Design Expertise_ human related field) x x x Service Innovation x Service Law and
regulation X Service Standards ( internal controls and
audit systems) and
best practices X x Service
Responsibility
(safety issues, reliability,
guarantee, recall
campaigns, reliability factor
(e.g. 100000
km/car), complaints and service
breaches) x x Cost ( Enterprise
Investment, service operation cost,
etc…) x X x Service Control Management
System X x Service
performance goals feasibility X x Service Support
management tools X x Service Relationship tools
among suppliers/customers X x x Number of
incentives x X Number of new services/introduced
services X x x Number of new
service requirements added
by R&D / total
number of
requirements x Number of project
developed in co-design/ total number
of project developed x Number of people
involved in the service process with
full access to
service data/total number of people
involved in the
service process x Number of service
designers/ number
of employees x x x Service costs/total
costs x BEP x X NPV to analize the
profitability of service investment x X Profits from new
services/profits x x
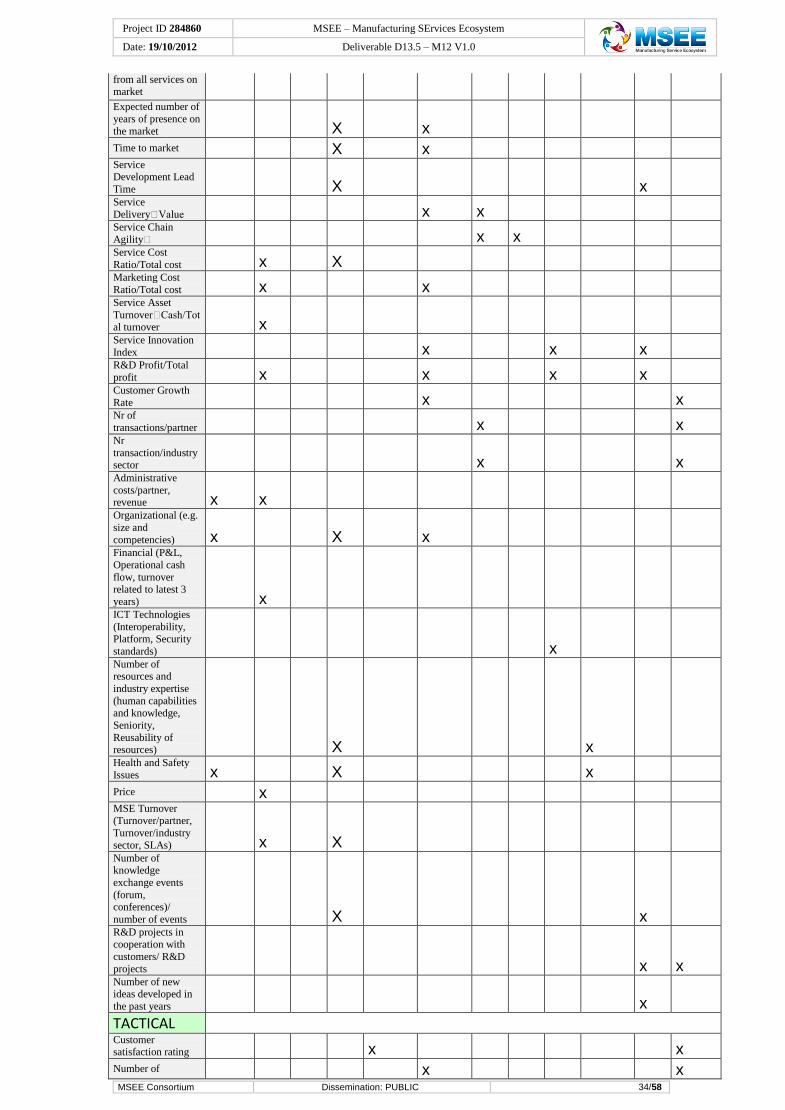
Project ID 284860 MSEE – Manufacturing SErvices Ecosystem
Date: 19/10/2012 Deliverable D13.5 – M12 V1.0
MSEE Consortium Dissemination: PUBLIC 34/58
from all services on market
Expected number of
years of presence on
the market X x Time to market X x Service Development Lead
Time X x Service
DeliveryValue x x Service Chain
Agility x x Service Cost
Ratio/Total cost x X Marketing Cost
Ratio/Total cost x x Service Asset
TurnoverCash/Tot
al turnover x Service Innovation
Index x x x R&D Profit/Total
profit x x x x Customer Growth
Rate x x Nr of
transactions/partner x x Nr
transaction/industry sector x x Administrative
costs/partner, revenue x x Organizational (e.g.
size and
competencies) x X x Financial (P&L,
Operational cash
flow, turnover related to latest 3
years) x ICT Technologies
(Interoperability, Platform, Security
standards) x Number of resources and
industry expertise
(human capabilities and knowledge,
Seniority,
Reusability of resources) X x Health and Safety
Issues x X x Price x MSE Turnover (Turnover/partner,
Turnover/industry
sector, SLAs) x X Number of knowledge
exchange events
(forum, conferences)/
number of events X x R&D projects in cooperation with
customers/ R&D
projects x x Number of new ideas developed in
the past years x
TACTICAL Customer satisfaction rating x x Number of x x

Project ID 284860 MSEE – Manufacturing SErvices Ecosystem
Date: 19/10/2012 Deliverable D13.5 – M12 V1.0
MSEE Consortium Dissemination: PUBLIC 35/58
customer survey/ month or year
Service Employee
turnover x Service Employee satisfaction level x X x Service
Social/Relational (reputation, brand
identity, satisfaction
level) X x x Service Retention bonds/Total service
price x Price x ICT Technologies
related to the Service
(Interoperability, Platform, Security
standards)_ IT
related field x x Service Information sharing tools x x Human Resources
management tools X x x Services Maintenance x x Service
Investments/profit x Service Control Management tools X Number of Service
Accessibility tools x x x Service Documentary Tools
(create database) X x x Service Flexibility, disaster recovery,
resources
reconfigurability, etc X x Service Quality
Management tools X x x On time Service Delivery x x x Number of new
introduced services X x Cost Ratio for Service
Operation//Total
cost x x Cost
RatioLogistics/To
tal cost x x Number of recruited partners x X x Number of partners
by type of organization x X x Reaction to
complains X x x x Nr of complains/partner X x x x Association fees x x R&D (investments
in Technology) x x Quality and
reliability X x x On time delivery x x x x Number of
applications/industr
y sector X x Nr of contracts/industry
sector x X X Value of incomes generated per period x X
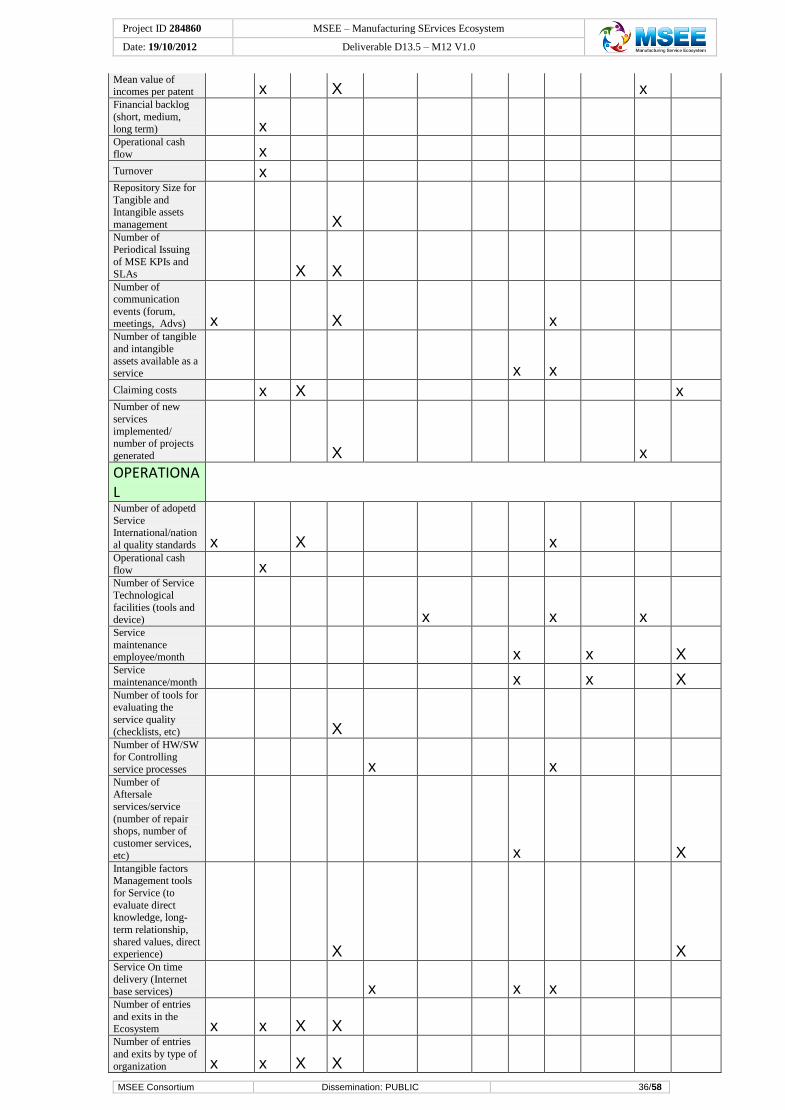
Project ID 284860 MSEE – Manufacturing SErvices Ecosystem
Date: 19/10/2012 Deliverable D13.5 – M12 V1.0
MSEE Consortium Dissemination: PUBLIC 36/58
Mean value of incomes per patent x X x Financial backlog
(short, medium, long term) x Operational cash
flow x Turnover x Repository Size for
Tangible and Intangible assets
management X Number of Periodical Issuing
of MSE KPIs and
SLAs X X Number of communication
events (forum, meetings, Advs) x X x Number of tangible
and intangible
assets available as a service x x Claiming costs x X x Number of new
services
implemented/ number of projects
generated X x
OPERATIONAL Number of adopetd
Service International/nation
al quality standards x X x Operational cash
flow x Number of Service
Technological
facilities (tools and device) x x x Service
maintenance employee/month x x X Service
maintenance/month x x X Number of tools for evaluating the
service quality
(checklists, etc) X Number of HW/SW for Controlling
service processes x x Number of Aftersale
services/service
(number of repair shops, number of
customer services,
etc) x X Intangible factors Management tools
for Service (to
evaluate direct knowledge, long-
term relationship,
shared values, direct experience) X X Service On time
delivery (Internet
base services) x x x Number of entries
and exits in the Ecosystem x x X X Number of entries
and exits by type of
organization x x X X

Project ID 284860 MSEE – Manufacturing SErvices Ecosystem
Date: 19/10/2012 Deliverable D13.5 – M12 V1.0
MSEE Consortium Dissemination: PUBLIC 37/58
Number of complains/partner x X x X Average time to
address the problem X X x Number of established
agreements X X x Number of satisfied/unsatisfied
agreements x X X x X Number of conflicts
arisen X X X Number of conflicts
solved x X X X Mean revenue for
exploited result x X Timeframe in which
the result is
exploited x x X x SLA x x X X x x x X Contract costs/partner
revenue x Legal costs/partner, revenue x X Claiming costs x X X X Recalls x X x x X Business hold/partner x x X X Number of contracts x X X x Number of suppliers x X X x Number contracts
breached x X X X Number of long-
term strategic collaboration
partnerships X x Number of partnerships per
country x x X X x x x X Number of
approved patents x Number of pending
patents x Patent/partner X x Patent costs/partner x x Mean number of
partners involved in
a patent X x Number of services
copied wthout
agreement x X X Number of
communication
channels ( blogs, platforms, internal
mail system, posts) x x X Number of physical
and online events organized for
service
development/year X x X Number of service
event
attended/partner x X x x x Number of service events
participants/event x X x x x Number of service event
unattended/partner x X x x x Number of
customer filled surveys/partner X X x X Number of received
feedback and x x

Project ID 284860 MSEE – Manufacturing SErvices Ecosystem
Date: 19/10/2012 Deliverable D13.5 – M12 V1.0
MSEE Consortium Dissemination: PUBLIC 38/58
suggestions/ partner
Number of shared
documents x x x Number of
enquiries to the
knowledge management
database/partner/mo
nth X x x x Number of expert
advice x Number of
upgrading occurrences on the
knowledge
management database/partner/mo
nth X x x Number of services, patents, white
papers, percentage
of responses to demands for each
stakeholder, X x x x Number of assets put at MSE’s
disposal x X x Number of VME
joining/partner x X X Number of VME
dissemination
actions x X X Number of newsletters x X X x X Number of press
releases, Number of appearance in the
media x X x X Number of
published news/partner/month X X Number of used
communication channel x x X Number of
information requests/partner X x X Number of inherited
assets/outputs/conta
cts x X X Number of created
spin-offs x X X Number of joint-
ventures x X X Mean share capital
when creating a
spin-off x SLA for ICT x x X X x Uptime X x x MTTR/service X x MTTF/servce X x x x X MTBF/service X x x x X Band width capacity x x Number of transaction to the
repository X x x X Number of Failure logs X x x X Number of SLAs
related to tangible
and intangible assets x x X X x x Number of R&D
researches X x x Value of new services x X

Project ID 284860 MSEE – Manufacturing SErvices Ecosystem
Date: 19/10/2012 Deliverable D13.5 – M12 V1.0
MSEE Consortium Dissemination: PUBLIC 39/58
implemented/turnover
TIM (Technical
Independet Modeling) Service guarantee X x x X Organizational
functionality for
service (Number of R&D missions,
Customer focus,
etc) X x X Customer
satisfaction rating X x X Number of Service
Communication/Information exchange
tools
(communication
channels, HW/SW
facilities, available protocols, etc) x x Number of R&D
missions/partner x Subgoals for customer
satisfaction X x x X Type of
standards/partner x Number of
collaboration
activity (internal and
external)/partner x X X x x Upgrading
technology/service/year x X x x Service
Performance Management
(number business
goals attended/proposed,
number business
subgoals attended/proposed,
positive feedbacks,
monitoring main outputs, evaluating
performances) X x x x X Service Periodical Control Processes X x Use and update of
service
information/partner X x x x X Anthology of
relationships with
supplier and customers X x x x X Sservice order
fulfillment
time/partner X x Web ordering
downtime/partner X x Number of tools for
evaluating the service quality
(checklists, etc) X x x x x X Service Monitoring performance tools
(human/automated
system monitor,
analytic tools,
anomaly detections) X X x x x x x X IT oriented service architecture/ IT
infrastructure
capability/partner x Number of X X x x

Project ID 284860 MSEE – Manufacturing SErvices Ecosystem
Date: 19/10/2012 Deliverable D13.5 – M12 V1.0
MSEE Consortium Dissemination: PUBLIC 40/58
customer or supplier complaints/partner
Number of standard
tasks for service operation/total
number of tasks X x x X Number of tested
parts/ number of supposed critical
parts X x x x X Number of times that a design had to
be reworked x Number of projects
ongoing at the same time/partner x X X Number of new
service/projects/partner x X X x x x x x x X Number of
alternative solutions to new
designs/partenr x Customer
satisfaction rate/partner X Service Delivery
Performance/partner X X x x x X
TSM (Technical
Specification Modeling) Type of standards/partner
(domestic and
international certificates issued
by original
manufacturers) X x x ICT Technologies
tools/partner
(Platforms, Security standards)_ IT
related field X X x x x x X Information sharing
tools/partner (i.e. network tools like
Joinme, Facebook, etc..) x x Service
Performance
Management tools/partenr
(number service
goals attended/proposed,
number service
subgoals attended/proposed,
positive feedbacks,
monitoring main outputs, etc) x X X x x x x x x X HW and SW for
Controlling service processes/ partner x x Service
documentation
tools/partner (reports, record
retentions, paper
based/digital Drawing, technical
specifications, cd, external
hard/software, etc) x X X x Type of IT
architecture-IT infrastructure/partne
r (i.e. C++, Java,
etc…) x x

Project ID 284860 MSEE – Manufacturing SErvices Ecosystem
Date: 19/10/2012 Deliverable D13.5 – M12 V1.0
MSEE Consortium Dissemination: PUBLIC 41/58
Table 3 - KPI Classification table
4.4. Use Cases Table
In this section, we present a Use Cases Table in which KPIs have been related with End Users
case studies (i.e. Ibarmia, Indesit, Bivolino and TP Vision).
In the next deliverable we suggest to validate our support toolset proposal within a real
condition enterprise environment.
A list of KPIs, which has been previously identified for the service system, has been here
classified for measuring each case study specifically.
Uses cases represent useful examples to be used to validate the indicators we already
generated. The basic idea behind this validation is to optimize the indicators and the whole
efficiency of the support toolset.
Apart from the end user cases, MSE context has been considered too. The Ecosystem plays a
great role in defining MSEE objectives. Therefore the Ecosystem needs to be monitored as
well as single enterprises. In the below table some KPIs have been addressed to monitor the
Ecosystem but further research is needed in this field in order to create a concrete monitoring
and supporting toolset.
KPIs Use Cases MSE
BSM (Business Service Modeling) Ibarmi
a Indesi
t Bivolin
o TP
Vision
STRATEGICAL
Stable service mission regularly /week or month x x
Long-term culture and value referred to the SLA x x x X
Service Brand value x x x X
Service capabilities x x x x
Service guarantee x x x x
Service Financial capital guarantee x x x x Service functionality (resources and industry expertise, human capabilities and knowledge, Skills, Seniority, Reusability of resources, R&D, Design Expertise_ human related field)
x x x x X
Service Innovation x x x x X
Service Law and regulation x x x x X Service Standards ( internal controls and audit systems) and best practices x x
Service Responsibility (safety issues, reliability, guarantee, recall campaigns, reliability factor (e.g. 100000 km/car), complaints and service breaches)
x x x x X
Cost (Enterprise investment, service operation cost etc.) x x x x X
Service Control Management System x x x x X
Service performance goals feasibility x x x x X
Service Support management tools x x x x X
Service Relationship tools among suppliers/customers x x x x X
Number of incentives x x x X
Number of new services/introduced services x x X

Project ID 284860 MSEE – Manufacturing SErvices Ecosystem
Date: 19/10/2012 Deliverable D13.5 – M12 V1.0
MSEE Consortium Dissemination: PUBLIC 42/58
Number of new service requirements added by R&D / total number of new requirements x x x x X
Number of projects developed in co-design/ total number of projects developed x x x x X
Number of people involved in the service process with full access to service data/total number of people involved in the service process
x x x x X
number of service designers / numebr of employees engineers x x x x X
Service costs/total costs x x x x
BEP x x x x
NPV to analyze the profitability of service investment x x x x X Profits from new services/profits from all services on market x x x x
Expected number of years of presence on the market x x x x X
Time to market x x x x X
service Development Lead Time x x x x X
Service Delivery Value x x x x X
Service Chain Agility x x x X
Service cost ratio / total cost x x x x X
Marketing cost ratio / total cost x x x x X
Servivce Asset TurnoverCash / total turnover x x x x X
Service Innovation Index x x x x X
R&D Profit / total profit x x x x X
Customer Growth Rate x x x x X
Nr of transactions/partner X
Nr transaction/industry sector X
Administrative costs/partner, revenue x x x x X
Organizational (e.g. size and competencies) x x x x X Financial (P&L, Operational cash flow, turnover related to latest 3 years) x x x x X
ICT Technologies (Interoperability, Platform, Security standards) x x x x X
Number of resources and industry expertise (human capabilities and knowledge, Seniority, Reusability of resources)
x x x x
Health and Safety Issues x x
Price x x x x X MSE Turnover (Turnover/partner, Turnover/industry sector, SLAs) x x x x X
Number of knowledge exchange events (forum, conferences) / Number of events x x x x X
R&D projects in cooperation with customers / R&D project x x x x X
Number of new ideas developed in the past years x x x X
TACTICAL
Customer satisfaction rating x x x x
Number of customer survey / month or year x x x x X
Service Employee turnover x x x x
Service Employee satisfaction level x x x x X Service Social/Relational (reputation, brand identity, satisfaction level) x x x X
Service Retention bonds / total service price x x x x X
Price x x x x ICT Technologies related to the Service (Interoperability, Platform, Security standards)_ IT related field x x x x X
Service Information sharing tools x
Human Resources management tools x x x x X
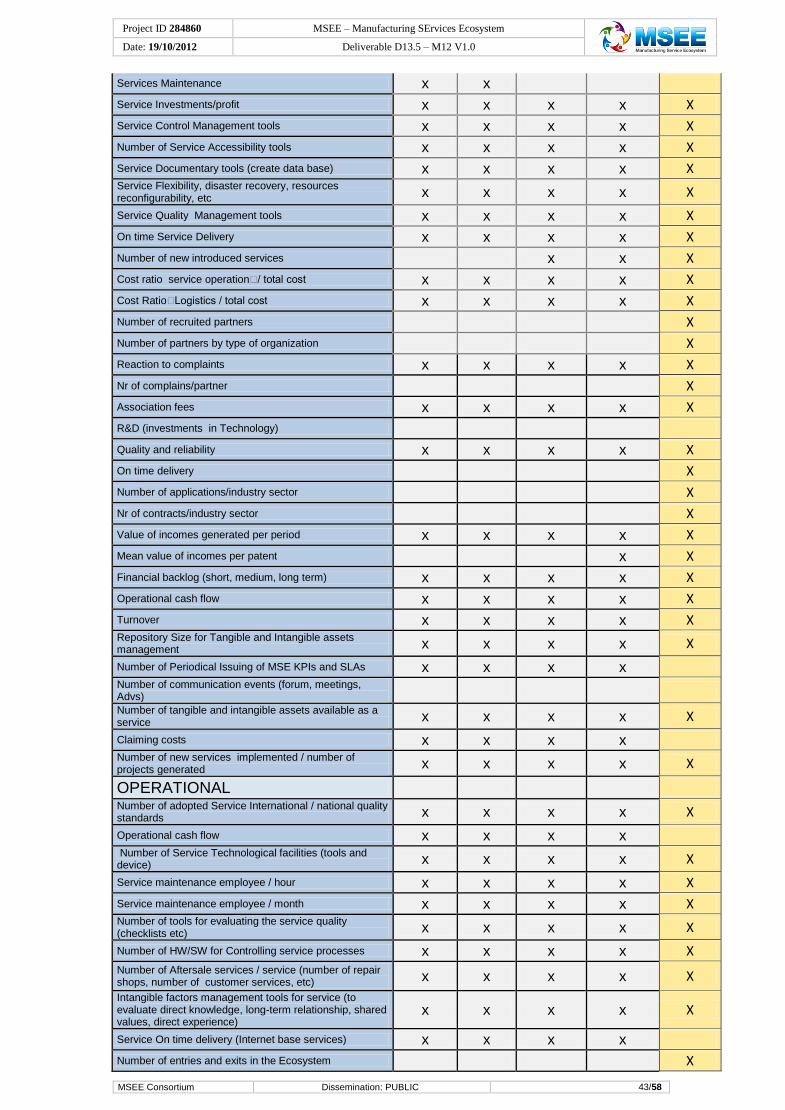
Project ID 284860 MSEE – Manufacturing SErvices Ecosystem
Date: 19/10/2012 Deliverable D13.5 – M12 V1.0
MSEE Consortium Dissemination: PUBLIC 43/58
Services Maintenance x x
Service Investments/profit x x x x X
Service Control Management tools x x x x X
Number of Service Accessibility tools x x x x X
Service Documentary tools (create data base) x x x x X Service Flexibility, disaster recovery, resources reconfigurability, etc x x x x X
Service Quality Management tools x x x x X
On time Service Delivery x x x x X
Number of new introduced services x x X
Cost ratio service operation/ total cost x x x x X
Cost RatioLogistics / total cost x x x x X
Number of recruited partners X
Number of partners by type of organization X
Reaction to complaints x x x x X
Nr of complains/partner X
Association fees x x x x X
R&D (investments in Technology)
Quality and reliability x x x x X
On time delivery X
Number of applications/industry sector X
Nr of contracts/industry sector X
Value of incomes generated per period x x x x X
Mean value of incomes per patent x X
Financial backlog (short, medium, long term) x x x x X
Operational cash flow x x x x X
Turnover x x x x X Repository Size for Tangible and Intangible assets management x x x x X
Number of Periodical Issuing of MSE KPIs and SLAs x x x x Number of communication events (forum, meetings, Advs)
Number of tangible and intangible assets available as a service x x x x X
Claiming costs x x x x Number of new services implemented / number of projects generated x x x x X
OPERATIONAL Number of adopted Service International / national quality standards x x x x X
Operational cash flow x x x x Number of Service Technological facilities (tools and device) x x x x X
Service maintenance employee / hour x x x x X
Service maintenance employee / month x x x x X Number of tools for evaluating the service quality (checklists etc) x x x x X
Number of HW/SW for Controlling service processes x x x x X Number of Aftersale services / service (number of repair shops, number of customer services, etc) x x x x X
Intangible factors management tools for service (to evaluate direct knowledge, long-term relationship, shared values, direct experience)
x x x x X
Service On time delivery (Internet base services) x x x x
Number of entries and exits in the Ecosystem X

Project ID 284860 MSEE – Manufacturing SErvices Ecosystem
Date: 19/10/2012 Deliverable D13.5 – M12 V1.0
MSEE Consortium Dissemination: PUBLIC 44/58
Number of entries and exits by type of organization X
Number of complaints/partner X
Average time to address the problem x x x x
Number of established agreements X
Number of satisfied/unsatisfied agreements X
Number of conflicts arisen X
Number of conflicts solved X
Mean revenue for exploited result X
Timeframe in which the result is exploited X
SLA x x x x X
Contract costs/partner revenue X
Legal costs/partner, revenue X
Claiming costs x x x x
Recalls x x x x X
Business hold/partner X
Number of contracts x x x x X
Number of suppliers x X
Number contracts breached X
Number of long-term strategic collaboration partnerships X
Number of partnerships per country X
Number of approved patents, x x X
Number of pending patents x x X
Patent/partner x X
Patent costs/partner x X
Mean number of partners involved in a patent X
Number of copied services without agreement x x x x X Number of communication channels ( blogs, platforms, internal mail system, posts) x
Number of physical and online events organized for service development / year X
numebr of service events attended/partner X
Number of service events participants/event X
Number of service events unattended/partner X
Number of customer filled surveys/partner x X
Number of received feedback and suggestions/partner x x x x X
Number of shared documents x x x x X Number of enquiries to the knowledge management database/partner/month X
Number of expert advice X Number of upgrading occurrences on the knowledge management database/partner/month X
Number of services, patents, white papers, percentage of responses to demands for each stakeholder, X
Number of assets put at MSE’s disposal X
Number of VME joining/partner X
Number of VME dissemination actions X
Number of newsletters X Number of press releases, Number of appearance in the media X
Number of published news/partner/month X
Number of used communication channel X

Project ID 284860 MSEE – Manufacturing SErvices Ecosystem
Date: 19/10/2012 Deliverable D13.5 – M12 V1.0
MSEE Consortium Dissemination: PUBLIC 45/58
Number of information requests/partner x X
Number of inherited assets/outputs/contacts X
Number of created spin-offs X
Number of joint-ventures x x x X
Mean share capital when creating a spin-off X
SLA for ICT x x x x X
Uptime x x x x X
MTTR/service x x x x X
MTTF/service x x x x X
MTBF/service x x x x X
Band width capacity X
Number of transaction to the repository X
Number of Failure logs X
number SLAs related to tangible and intangible assets x x x x X
Number of R&D researches x x x x X
Value of new services implemented/turnover x x x x X
TIM (Technical Independet Modeling) x x x x X
Service guarantee x x x x X Organizational functionality for service (Number of R&D missions, Customer focus, etc) x x x x X
Customer satisfaction rating x x x x X Number of Service Communication/Information exchange tools (communication channels, HW/SW facilities, available protocols etc)
x x x x X
Number of R&D missions/partner x x X
Subgoals for customer satisfaction x x x x X
Type of standards/partner x x X Number of collaboration activity (internal and external)/partner x x x x X
Upgrading technology/service/year x x x Service Performance Management (number business goals attended/proposed, number business subgoals attended/proposed, positive feedbacks, monitoring main outputs, evaluating performances)
x x x x X
Service Periodical Control Processes X x x x X
Use and update of service information/partner X x x X
Anthology of relationships with supplier and customers X x x x X
ServiceOrder fulfillment time/partner X x x x X
Web ordering downtime/partner X x x x X Number of tools for evaluating the service quality (checklists etc) X x x x X
Service Monitoring performance tools (human/automated system monitor, analytic tools, anomaly detections) X x X
IT oriented service architecture/ IT infrastructure capability/partner X x x x X
Number customer or suppliers complaints/partner X x X Number of standard tasks for service operation/total number of tasks X x X
Number of tested parts/ number of supposed critical parts X X
Number of times that a design had to be reworked X x x x X
Number of projects ongoing at the same time/partner X x x x X
Number of new services/ projects/partner X x X
Number of alternative solutions to new designs X x x x X
Customer satisfaction rate/partner X x x x X

Project ID 284860 MSEE – Manufacturing SErvices Ecosystem
Date: 19/10/2012 Deliverable D13.5 – M12 V1.0
MSEE Consortium Dissemination: PUBLIC 46/58
Service Delivery Performance/partner X x x x X
TSM (Technical Specific Modeling)
Type of standards adopted/partner (domestic and international certificates issued by original manufacturers) X x x x X
ICT Technologies tools/partner (Platform, Security standards)_ IT related field X x x x X
Information sharing tools/partner (i.e. network tools like Joinme, Facebook, etc..) X x x x X
Service Performance Management tools/partner (number service goals attended/proposed, number service subgoals attended/proposed, positive feedbacks, monitoring main outputs, evaluating performances like for example Service delivery softwares)
X x x X
HW/SW for Controlling service processes/partner X x X Service documentation tools/partner (reports , record retentions, paper based/digital Drawing, technical specifications, cd, external hard/software, etc)
X x x x X
type of IT architecture-IT infrastructure/partner (i.e. C++, Java, etc…) X x x x X
Table 4 - Use cases table
4.5. Analysis of the data
An audit result can be provided through the correct use of the toolset. Audit can reveal
whether the service was performed as planned. According to the criteria defined, the toolset
will provide a result identified by the category “weight”; a score will be assigned to each
parameter (i.e. to each KPIs identified at BSM-TIM-TSM level). The toolset will be able to
provide a method to analyse these scores. After the indicators are controlled, the toolset will
assess which parameter is acceptable and which is not. According to that it will propose an
improvement plan. It will assess if a parameter will be acceptable or not according to a
threshold level that will be identified according to the service system specific task. The toolset
will suggest the development and implementation of corrective action plans in case of the
weighted balance coming from the monitoring of the parameters would be negative.
The toolset has the potential to become a learning tool for the organization which adopts it. It
can provide an improved vision on performance and capabilities and help increasing service
maturity level of the organization.
Internal audit
Internal audits are an effective tool to identify the level of compliance of the management
system and it can provide useful information to understand, analyse and improve the service
system performance16
. To have an independent result, audits should be conducted by people
who are not involved in the activity that is being examined. An external approach would be
needed according to a effective audit plan and competent personnel. Internal auditing entails
an effective tool to identify problems or risks as well as monitoring performances and
implementation plans.
Trend analysis
Monitoring the trend analysis consists in the practice of collecting data and information and
using them to identify a trend in action.
By verifying the trends, it will be possible to check service past performances to anticipate
financial growth or loss.
Therefore the support toolset will provide useful information on trend analysis allowing
MSEE partners to verity their service trends and detect service tendencies. This analysis is

Project ID 284860 MSEE – Manufacturing SErvices Ecosystem
Date: 19/10/2012 Deliverable D13.5 – M12 V1.0
MSEE Consortium Dissemination: PUBLIC 47/58
able to identify improvement and innovation opportunities as so the control toolset will entail
strategic and functional tools to be used in service management.
4.6. Advantages
The toolset will help enterprises control and monitoring their performances in order to
improve their level of service quality and, therefore, manage better the service governance.
An effective use of the proposed toolset would bring several advantages to the firm, among
which we can note the followings:
- Monitor service quality and customer satisfaction in order to improve it;
- Improve revenues due to a better service offer;
- Improve fidelity of customers;
- Manage the efficiency in the use of resources;
- Identify and understand the trend of the service offer;
- Manage the trend to be more rapid and flexible in answering the market;
- Create reciprocal benefits for the enterprise as well as for its partners (the Ecosystem
and the various VMEs) so to improve the firm and the system capacity to create value.
The generated toolset can have a strong strategic role inside the MSEE Project because it
represents a clear and open tool to share knowledge and resources among the partners inside
the Ecosystem and the configuration of the VMEs. In fact, from a strategic point of view,
within the MSE environment, the tool will be able to:
- Optimize costs and resources;
- Improve the capacity of the partners to create service added value;
- Create an open communication among partners;
- Provide the sharing of experiences;
- Set development and improving programs combined among partners;
- Monitor and control results and improvements obtained by services;
- Help the firms and the system to be more flexible in creating new services according
to the market instability and customers’ requirements.
4.7. Service System Maturity level visualisation
We propose the MSEE support toolset will be able to provide a visualization method to
present clearly service performances and support service governance.
As management cockpits imply, visualizing data is a strategic tool for process comprehension
and decision making.

Project ID 284860 MSEE – Manufacturing SErvices Ecosystem
Date: 19/10/2012 Deliverable D13.5 – M12 V1.0
MSEE Consortium Dissemination: PUBLIC 48/58
Figure 8 - Sample of service system Maturity level visualisation
Coming from the assessment of the checklist (weighted balance), the toolset can be able to
propose a model of visualization of the level of maturity for the service system. The more
complete service aspects are provided, the more the level of maturity grows.
In the above figure it is possible to note a conceptual sample of the visualization: the red zone
indicates, from left to right, the growing level of the maturity. While in blue it is possible to
see the increase of elements and aspects which are added at each level.
Enterprises can be described following this sample of visualization in order to help enterprises
and the Ecosystem understands better each enterprise role and ability concerning the service
system. In the next deliverable we are going to elaborate with more details the proposed
maturity level visualisation through the specific definition of maturity levels and respective
tasks to be reached.
4.8. Conclusion
The support toolset is an instrument to support service management within the single
enterprise environment, the VMEs configuration and the Ecosystem.
The outputs of the toolset will provide a source of information to be used, visualized and
shared among MSEE partners with already existing ICT tools.
We analysed management cockpits and other models to identify relevant elements and ICT
interfaces to be implemented in our proposal.
In fact, cockpit integrates ICT with management to visualize the result of enterprise
performance.
The support toolset here proposed has to interface with already existing ICT systems in order
to obtain, provide and share informations among partners.

Project ID 284860 MSEE – Manufacturing SErvices Ecosystem
Date: 19/10/2012 Deliverable D13.5 – M12 V1.0
MSEE Consortium Dissemination: PUBLIC 49/58
Figure 9 - Explicative schema of the support toolset function and finality
The finality of the toolset is, apart from monitoring service quality and performances, to
provide an easy assessment method for the service system. This can be reached through the
use of interoperable ICT tools and a easy visualization method. Therefore the toolset needs to
be integrated within both:
- The existing ICT solution adopted by single enterprises;
- MSE platform.
Finally the support toolset will be able to provide, collect and mange necessary information
for helping the enterprise, VMEs and the Ecosystem in the following activities:
- Identify and understand the present future needs and expectations of interested parties;
- Assess strengths, weakness, opportunities and threats;
- Determinate the need for alternative;
- Evaluating current performances;
- Anticipating changes in requirements;
- Understand the customer perception;
- Understand trends relevant to the service activity;
- Help determining new needs;
- Assess current and future organizational and process capabilities of the service;
- Visualize service performances;
- Suggest correction and improvement plans.
This document is a first iteration of the deliverable due at M12 and it will be deeply
considered and defined with more detail in the next iteration.
In the next deliverable a Case study will be used to validate the Matrix of KPIs in order to
define how this toolset would be applied to a case study involved in the MSEE Project (i.e.
Indesit, Bivolino, Philips and Ibarmia).
Project ID 284860 MSEE – Manufacturing SErvices Ecosystem
Date: 19/10/2012 Deliverable D13.5 – M12 V1.0
MSEE Consortium Dissemination: PUBLIC 50/58
5. Integration with existing ICT systems
In this chapter we tried to design the integration of the support toolset into the SP2 MSE
platform to support service system governance within a manufacturing ecosystem.
We describe through meaningful examples how different IT systems solve the issue of
monitoring (i.e. automotive systems, electricity generation systems, etc…).
Networked computer systems play important roles in the operation of many businesses and
organizations. The performance of a computer system providing services management within
manufacturing network or service to a business and/or customers of a business may be
integral to the successful operation in inside and outside of the MSE platform. Network
computer system refers generally to any collection of one or more devices interconnected to
perform a desired function, provide one or more services, and/or to carry out various
operations of an organization, such as a business corporation, service management and service
monitoring etc.
When a computer system supports one or more operations of a business or whole the
enterprise, such as providing the infrastructure for the business itself, providing services to the
business or its customers and totally support enterprise etc., for example; the computer system
is often referred to as an enterprise system17
. An enterprise system may be anywhere from two
or more computers networked locally to tens, hundreds, thousands or any number of devices
either connected locally or widely distributed over multiple locations to support the
enterprises. An enterprise system may operate in part over a local area network (LAN) and/or
other networks that support various operations of an enterprise such as providing various
services to its end users or clients.
In some enterprise, the service system like that supporting operation and maintenance is
delegated to one or more administrators that make up the system's information technology
(IT) organization. The IT organization may set-up a computer system to provide end users
with various application or transactional services, access to data, network access and internal
and external cooperation etc., and establish the environment, security and permissions
landscape and other capabilities of the computer system. As far as the use of IT in
organizations and enterprises to develop the service is concerned, this tool has good
availability of up to date service level and operating level performance data.
The last twenty years, the evolution of Information and Communication Technologies (ICT),
along with the search for management strategies that could take advantage of them, are
pushing organizations and enterprises into a very competitive and changing environment18
.
Rapid market changes such as electronic commerce, deregulation, globalization and increased
competition have led to a business environment that is constantly evolving. Companies
change to better satisfy customer requirements, address increasingly tough competition,
improve internal processes and modify the range of products and services they offer
(Jacobson et al., 1994)19
.
In that sort of environment, only those organizations and enterprises, which can react quickly
to environment demands, are the ones that survive. Obviously, that capacity of quick reaction
is due to their capacity of handling ICT in favour of organizations’ adapting demands.
Specially, Thus, ICT and service system go hand by hand in the way of reacting, adapting and
implanting new ways of doing business in today dynamic environments. Service managerial
transformation supported by ICT became a major issue for today enterprises. Information
systems are thus not just supporting enterprise; they are an integral part of them.

Project ID 284860 MSEE – Manufacturing SErvices Ecosystem
Date: 19/10/2012 Deliverable D13.5 – M12 V1.0
MSEE Consortium Dissemination: PUBLIC 51/58
All these ICT and enterprise changes have imposed serious challenges, which have been made
to traditional business practices. For instance, in a competitive and evolving environment,
quality became a fundamental key to obtain and to keep market share. The Total Quality
Management (TQM) was defined as a management method in inside of the enterprise, which
aims towards long-range success. It is based on collective participation of each member in the
improvement of processes, products, services and organization of the company. Another
important wave in the evolution of management strategies was the Business Process
Reengineering (BPR) (Hammer and Champy, 1993)20
, which consists of a radical remodeling
of the organization around its processes. In all these enterprise managerial challenges, the ICT
and the Enterprise Information Systems (EIS) are becoming a critical aspect of their reacting
strategies. The information system should be continuously adapted to changing business
practices and needs. The ICT act as facilitators of business changes implementation and
standardization. According to (Davenport and Short, 1990)21
, the new industrial engineering
has two statements: “thinking about IT should be in terms of how it supports new or
redesigned business processes; and business processes and process improvements should be
considered in terms of the capabilities that IT can provide”.
Refer to the previous paragraphs which specifically addressed the some benefits of effective
service monitoring and control by ICT system to below mentioned items:
- Minimized service operation impact of incidents and potential incidents;
- Rapid resolution of actual and potential service breaches through the use of automated
corrective actions;
- Availability of up-to-date infrastructure performance data;
- Availability of up-to-date service level and operating level performance data;
- Continued evolution of monitoring to meet service operation and technological
change;
- Early identification of actual and potential service breaches;
- Reduction in actual service operation breaches;
- Continued alignment of the monitoring performed and the business requirements.
The primary goal of service operation monitoring and control integration with ICT is to
observe the health of IT services and initiate remedial actions to minimize the impact of
service incidents and system events. The Service Monitoring tools provide the end-to-end
monitoring processes that can used to monitor services or individual components of MSE
platform.
Service monitoring and control IT-tools also provide data for other service management
functions so that they can optimize the performance of IT services. To achieve this, service
monitoring and control provides core data on component or service trends and performance.
The successful implementation of service monitoring and control achieves the following
objectives:
- Improved overall availability of services;
- An improved understanding of the components within the enterprise that are
responsible for service system;
- Making the generic view on service system rather than enterprise components,
resulting in a reduction in the number of SLA (Service Level agreement) breaches;
- Prompt and more effective reactions to service incidents;
- A reduction or prevention of service incidents through the use of proactive remedial
action.

Project ID 284860 MSEE – Manufacturing SErvices Ecosystem
Date: 19/10/2012 Deliverable D13.5 – M12 V1.0
MSEE Consortium Dissemination: PUBLIC 52/58
The service monitoring and control tools in ICT system will have both reactive and proactive
aspects within manufacturing networks. The reactive aspects deal with incidents as and when
they occur. The proactive aspects deal with potential service outages before they arise.
It’s interesting at this stage to consider an example which explains the links between energy
service framework and ICT system. (reference??)
This example, concerns the role of smart grids comprising man-made electric power networks
and their monitoring and controlling by information communications technology (ICT) as
enablers of sustainable energy services22
. A proposed Socio-Ecological Energy System
(SEES) framework used to characterize the core level subsystems (resources, users, and
governance) in terms of second-level and deeper level variables are motivated by the more
general multilevel nested socio-ecological system (SES) framework. Given vast spatial and
temporal complexities in a typical (SEES), it becomes necessary to enhance the physical
power network with just-in-time (JIT), just-in-place (JIP), and just-in-context (JIC)
functionalities. These, in turn, support sustainable energy services by aligning temporal,
spatial, and contextual characteristics of resources and users. The example refers to the ICT
implementation in support of these functionalities as dynamic monitoring and decision
systems (DYMONDS). The basic idea behind of DYMONDS framework is for designing and
operating the future energy systems. The mentioned functionalities defined the basic
DYMONDS architecture like:
- Adaptive Load Management (ALM);
- Interactive multilayered integration of renewable resources;
- Coordination of transmission and distribution;
- Automatic voltage control (AVC);
- Automatic Flow Control (AFC);
- System-wide storage dynamics and management at value;
- Ancillary services;
- Embedded intelligence for security all become integral parts of the smart grid abilities.
It is proposed that the design of a man-made electric power grid as the energy carrier between
the resources and users within an energy of Socio-Ecological System, as well as the system
governance and the supporting ICT should be all done with the objectives of enhancing the
sustainability of the given SEES.
By considering a typical physical network in the Figure below, we found that the backbone
power network has large power plants connected to it via step-up transformers so that bulk
power gets transferred via extra high voltage/high voltage alternate current (EHV/HV AC)
transmission lines from the locations where power is produced to the large load centers. The
power is delivered to the sub transmission and distribution substations by stepping down the
voltages at the receiving end of step-down transformers.
The transmission, sub transmission, and distribution networks are interconnected by means of
many transformers and form one single system. The boundary between the transmission and
distribution systems is not standardized, and it could be anywhere in between 69 and 13 kV.
The distribution system substations are shown in Fig. 10,
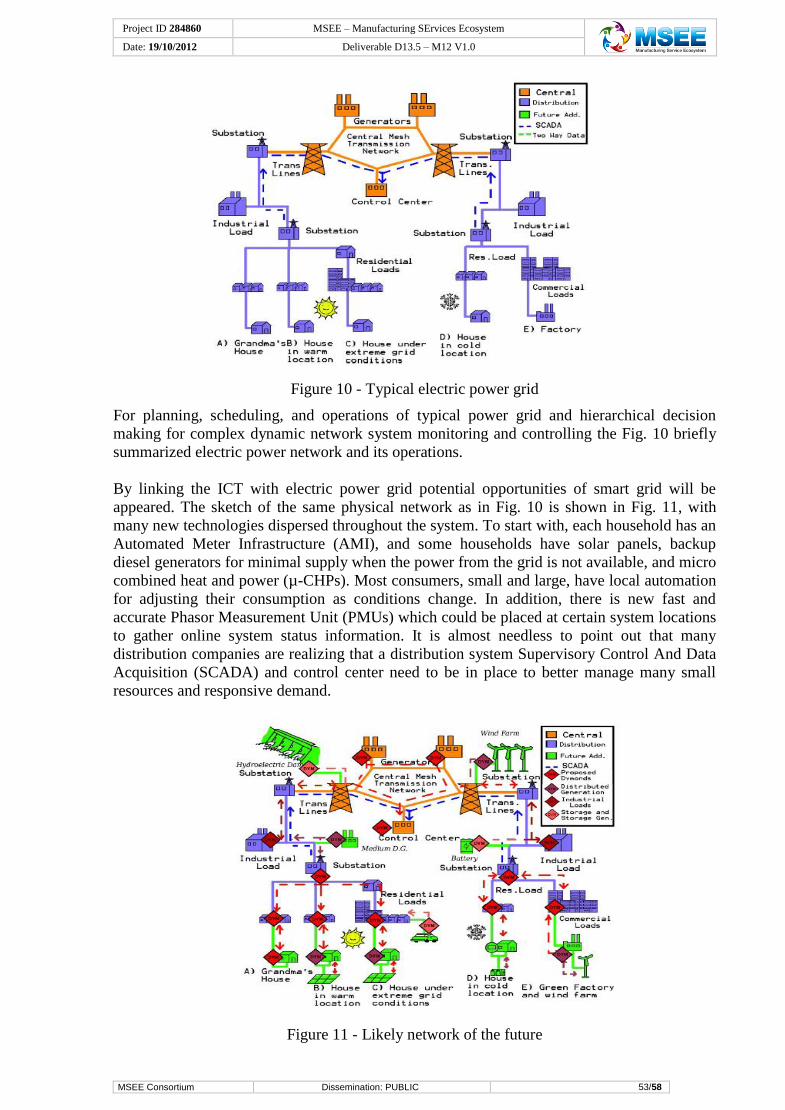
Project ID 284860 MSEE – Manufacturing SErvices Ecosystem
Date: 19/10/2012 Deliverable D13.5 – M12 V1.0
MSEE Consortium Dissemination: PUBLIC 53/58
Figure 10 - Typical electric power grid
For planning, scheduling, and operations of typical power grid and hierarchical decision
making for complex dynamic network system monitoring and controlling the Fig. 10 briefly
summarized electric power network and its operations.
By linking the ICT with electric power grid potential opportunities of smart grid will be
appeared. The sketch of the same physical network as in Fig. 10 is shown in Fig. 11, with
many new technologies dispersed throughout the system. To start with, each household has an
Automated Meter Infrastructure (AMI), and some households have solar panels, backup
diesel generators for minimal supply when the power from the grid is not available, and micro
combined heat and power (µ-CHPs). Most consumers, small and large, have local automation
for adjusting their consumption as conditions change. In addition, there is new fast and
accurate Phasor Measurement Unit (PMUs) which could be placed at certain system locations
to gather online system status information. It is almost needless to point out that many
distribution companies are realizing that a distribution system Supervisory Control And Data
Acquisition (SCADA) and control center need to be in place to better manage many small
resources and responsive demand.
Figure 11 - Likely network of the future

Project ID 284860 MSEE – Manufacturing SErvices Ecosystem
Date: 19/10/2012 Deliverable D13.5 – M12 V1.0
MSEE Consortium Dissemination: PUBLIC 54/58
All these technologies hold the basic promise of enabling even small end users and resources
to actively participate in balancing system-wide supply and demand.
Meanwhile, smart grid becomes consequently a means of implementing the man-made
physical power grid and it’s ICT in support of sustainable energy SES. Specific to the energy
systems, the key core order and second-order variables are shown in Fig. 12 whose
characteristics determine how sustainable a SEES is based on the characteristics of the
resources, the users, and the governance system.
Figure 12 - Electric power grid and ICT as enabler of sustainable SEES
Somewhat unique to the energy systems in which energy is transported via the electric power
grid is the problem of sustainable electric power delivery. The resources are generally not
mobile. An interactive multilayered ICT framework with much embedded intelligence at all
layers (resources and users) with minimal coordination among the layers could enable large
penetration of wind in coordination with responsive demand and other distributed
technologies, without requiring any new large investments in conventional generation or
transmission.
The above example sheds light on how energy service framework used ICT system for
monitoring and controlling the energy network in future by using the sensors and other
devices in resource system, generation and customer devices as end user.
Bearing in mind the nature of this chapter, we found that there are several underlying factors
why effective service monitoring and control is increasingly important, these include:
- Technology complexity. As the ICT infrastructure continues to become larger and
more distributed, it becomes more difficult to understand all the intricate requirements
necessary to keep the ICT infrastructure in good condition;
- Business change. Business-side changes have the potential to cascade to much larger
tactical shifts in ICT infrastructure. With business-side imperatives changing
directions at a much faster pace;
- Business dependency, organizations are increasingly reliant on ICT infrastructure and
ICT services and the ICT roles in business go to expend.
Finally, in the next deliverable the topics addressed in this chapter will be consider more
deeply to make strong link between ICT tool and service management. We will provide
feasible examples of KPIs and a more specified maturity table in order to integrate the MSEE
governance support toolset with ICT environment.

Project ID 284860 MSEE – Manufacturing SErvices Ecosystem
Date: 19/10/2012 Deliverable D13.5 – M12 V1.0
MSEE Consortium Dissemination: PUBLIC 55/58
6. Conclusion and further steps
The main aim of this deliverable was to design the service system monitoring and control
toolset by developing a MSEE method for governance.
Therefore a support toolset for governance has been proposed through the action of
monitoring and controlling service systems quality and performances.
Relevant key pillars have been identified, extracting them from useful assessment
methodologies (i.e. ECOGRAI/MDSEA and UGF) in order to use them as filters in the
monitoring of specific key performance indicators referred to services.
The toolset will help enterprises control and monitoring their performances in order to
improve their level of service quality and manage better the service governance.
A high service quality offer will meet customer needs and priorities while remaining
economically competitive. Improved service quality may increase economic competitiveness
too. The proposed support toolset will be able to achieve this aim by understanding and
improving service processes; identifying problems quickly and systematically; measuring
service performances and customer satisfaction.
Specifically, several advantages will be provided to the firm by using the proposed toolset,
among which we can state the following:
- Monitor service quality and customer satisfaction in order to improve it;
- Improve revenues due to a better service offer;
- Improve fidelity of customers
- Manage the efficiency in the use of resources;
- Identify and understand the trend of the service offer;
- Manage the trend to be more rapid and flexible in answering the market;
- Create reciprocal benefits for the enterprise as well as for its partners (the Ecosystem
and the various VMEs) so to improve the firm and the system capacity to create value.
The generated toolset can have a strong strategic role inside the MSEE Project because it
represents a clear and open tool to share knowledge and resources among the partners inside
the Ecosystem and the configuration of the VMEs.
It has also been considered that the objective methodology needs to interact with ICT system.
Therefore the support toolset has been integrated within the MSE platform to support service
management, exchange and evaluation within the manufacturing networks.
Further steps are needed in order to validate the mentioned toolset. In the next deliverable we
will propose to start testing the listed and categorized KPIs on real conditions at the end-user
enterprises (i.e. Indesit company) in order to evaluate their efficiency and coherence.

Project ID 284860 MSEE – Manufacturing SErvices Ecosystem
Date: 19/10/2012 Deliverable D13.5 – M12 V1.0
MSEE Consortium Dissemination: PUBLIC 56/58
7. References
1 University of Cambridge and IBM, “Succeeding through Service Innovation. A service
perspective for education, research, business and governance”, 2007.
2
Rengasamy Srinivasan, “Project monitoring and Evaluation” (2008) visible at link
http://www.slideshare.net/srengasamy/project-monitoring-evaluation-s-presentation
3 Bartle, Phil, “The nature of monitoring and evaluation. Definition and purpose” (2007),
visible at link http://cec.vcn.bc.ca/cmp/modules/mon-wht.htm
4 Neumann, Robert, Zbrog, Fritz, Dumke, Reiner, ”Cockpit based Management
Architectures”, Magdeburg Universisty, Germany.
5
Tom Mercer, VRM Priority Dimensions, (VCG, 2012) visible at link http://www.value-
chain.org/v/
6 Model by Parasuraman, A., Zeithaml, V.A. and Berry, L.L., “A Conceptual Model of
Service Quality and Its Implications for Future Research”, Journal of Marketing, Vol. 49 No.
4, 1985, pp. 41-50, cited in Dotchin, John A., Oakland, John S., “Total Quality Management
in Services: Part 2: Service Quality", in International Journal of Quality & Reliability
Management, Vol. 11, issue 3, pp. 27 – 42, 1994.
7 Frei, Frances X., Harker, Patrick T., “Measuring the Efficiency of Service Delivery
Processes: With Application to Retail Banking”, 1996.
8
Draft International Standars Iso/DIS 22400-2 (2011).
9 Rodríguez, Carlos, Silveira, Patrícia, Daniel, Florian and Casati, Fabio, “Analyzing
Compliance of Service-Based Business Processes for Root-Cause Analysis and Prediction”,
2010.
10
Rutkauskas, Jonas, Paulavičien, Eimen, “Concept of Productivity in Service Sector”, Kauno
Technology University, Kaunas, 2004.
11
Institute of Electrical and Electronics Engineers, IEEE Standard Computer Dictionary. A
Compilation of IEEE Standard Computer Glossaries, New York, 1990.
12 Federal Communication Commission, ”Tech Topic 1: Interoperability”, visible at link
http://transition.fcc.gov/pshs/techtopics/tech-interop.html
13
International Telecommunication Union, “Series E: overall network operation, telephone
service, service operation and human factors”, ITU-T E.800, pag. 2, September 2008.
14
Section E: ISO 9001:2008, Clause 8
15
Kicherer, Florian, Nägele, Rainer, Rößner, Andrea, “Quality and Service Management.
Processes for improving the productivity of service provisioning”, pag.4, 2011.
16
Section E: ISO 9001:2008, Clause 8.

Project ID 284860 MSEE – Manufacturing SErvices Ecosystem
Date: 19/10/2012 Deliverable D13.5 – M12 V1.0
MSEE Consortium Dissemination: PUBLIC 57/58
17 http://www.freepatentsonline.com/y2006/0064486.html
18 Barrios, Judith, Nurcan, Selmin, ”Model Driven Architectures for Enterprise Information
Systems”, 2004.
19
Jacobson, I., Ericsson, M., Jacobson, A., The object advantage. Business Process
Reengineering with object technology, Addison-Wesley, 1994.
20
Hammer, M., Champy J., Reengineering the Corporation: a Manifesto for Business
Revolution, Harper Collins Publishers, Inc., New York, 1993.
21
Davenport, T.H., Short, J.E, “The new industrial engineering: Information technology and
business process redesign”, in Sloan Management Review, 34(4), 1990.
22
Ilic, Marija D.,“Dynamic Monitoring and Decision Systems for Enabling Sustainable
Energy Services”, Fellow IEEE, Proceedings of the IEEE, vol. 99, no. 1, January 2011.
Bibliography
-Azzone, Giovani, Sistema di controllo di gestione. Metodi, strumenti e applicazioni, Etas,
Milano, 2006.
-Barrios, Judith, Nurcan, Selmin, ”Model Driven Architectures for Enterprise Information
Systems”, 2004.
-Bartle, Phil, “The nature of monitoring and evaluation. Definition and purpose” (2007).
-BSI British Standards, Managing for the sustained success of an organization. A quality
management approach, BS EN ISO 9004:2009.
-Davenport, T.H., Short, J.E, “The new industrial engineering: Information technology and
business process redesign”, in Sloan Management Review, 34(4), 1990.
-D13.1 KPIs and SLAs for ecosystem governance
-D13.3 Liability, trust and reputation models
-Dotchin, John A., Oakland, John S., “Total Quality Management in Services: Part 2: Service
Quality", in International Journal of Quality & Reliability Management, Vol. 11, issue 3,
1994.
-Draft International Standars Iso/DIS 22400-2 (2011).
-Ducq, Y. Definition and aggregation of a performance measurement system in three
Aeronautical work shop using the ECOGRAI Method. Production Planning and control ,
pag.163-177, (2005).
-Frei, Frances X., Harker, Patrick T., “Measuring the Efficiency of Service Delivery
Processes: With Application to Retail Banking”, 1996.
-Hammer, M., Champy J., Reengineering the Corporation: a Manifesto for Business
Revolution, Harper Collins Publishers, Inc., New York, 1993.

Project ID 284860 MSEE – Manufacturing SErvices Ecosystem
Date: 19/10/2012 Deliverable D13.5 – M12 V1.0
MSEE Consortium Dissemination: PUBLIC 58/58
-Ilic, Marija D.,“Dynamic Monitoring and Decision Systems for Enabling Sustainable Energy
Services”, Fellow IEEE, Proceedings of the IEEE, vol. 99, no. 1, January 2011.
-Institute of Electrical and Electronics Engineers, IEEE Standard Computer Dictionary. A
Compilation of IEEE Standard Computer Glossaries, New York, 1990.
-International Telecommunication Union, “Series E: overall network operation, telephone
service, service operation and human factors”, ITU-T E.800, September 2008.
-ISO 9001:2009.
-ISO/IEC 2382-01, Information Technology Vocabulary, Fundamental Terms.
-ITU-T X. 800.
-ITU-T E.802.
-Jacobson, I., Ericsson, M., Jacobson, A., The object advantage. Business Process
Reengineering with object technology, Addison-Wesley, 1994.
-Kicherer, Florian, Nägele, Rainer, Rößner, Andrea, “Quality and Service Management.
Processes for improving the productivity of service provisioning”, 2011.
-Neumann, Robert, Zbrog, Fritz, Dumke, Reiner, ”Cockpit based Management
Architectures”, Magdeburg Universisty, Germany.
-Parasuraman, A., Zeithaml, V.A. and Berry, L.L., “A Conceptual Model of Service Quality
and Its Implications for Future Research”, Journal of Marketing, Vol. 49 No. 4, 1985.
-Rengasamy Srinivasan, “Project monitoring and Evaluation” (2008).
-Rodríguez, Carlos, Silveira, Patrícia, Daniel, Florian and Casati, Fabio, “Analyzing
Compliance of Service-Based Business Processes for Root-Cause Analysis and Prediction”,
2010.
-Rutkauskas, Jonas, Paulavičien, Eimen, “Concept of Productivity in Service Sector”, Kauno
Technology University, Kaunas, 2004.
-Section E: ISO 9001:2008, Clause 8.
-Tom Mercer, VRM Priority Dimensions, VCG, 2012.
-University of Cambridge and IBM, “Succeeding through Service Innovation. A service
perspective for education, research, business and governance”, 2007.