Embed Size (px)
Citation preview

APPENDIX 17
Study on the improved methods for animal‐friendly production, in particular on alternatives to the castration of pigs and on alternatives to
the dehorning of cattle
D.1.3.4. Final Report on attitudes and acceptability with identification
of potential differences among Consumers/country and region
SP1: Alternatives to castration: To develop and promote
alternatives to the surgical castration of pigs
WP1.3: Demand and acceptance of consumers
Due date of deliverable: October 09
Actual submission date: October 09
4 subreports:
- consumer preferences towards castration and boar taint; AHP results
-consumer preferences towards castration and boar taint; CE results
- importance of animal welfare and entire male production by the consumers of different EU
countries
- Consumer acceptance of boar taint and the consequences


ALCASDE, 2009 D.1.3.4
D134 – 1
Table of contents:
Consumer preferences towards castration and boar taint; AHP results.....................................3
Consumer preferences towards castration and boar taint; CE results.......................................37
Importance of animal welfare and entire male production by the consumers of different EU
countries ...................................................................................................................................47
Consumer acceptance of boar taint and the consequences …………………………………..67


ALCASDE, 2009 D.1.3.4
D134 – 3
CONSUMER PREFERENCES TOWARDS
CASTRATION AND BOAR TAINT: AHP
RESULTS


ALCASDE, 2009 D.1.3.4
D134 – 5
INDEX
1. The analytical hierarchy process (AHP) application
2. Relative importance of buying factors for fresh pork meat (AHP ahp results)
2.2. Relative importance of buying factors for united kingdom (AHP results)
2.3. Relative importance of buying factors for spain (AHP results)
2.4. Relative importance of buying factor for the netherlands (AHP results)
2.5. Relative importance of buying factors for germany (AHP results)
2.6. Relative importance of buying factors for france (AHP results)
2.7. Relative importance of buying factors for italy (AHP results)
2.8. Relative importance of “gender of the pig” levels across countries
2.9. AHP results by age and buying decision across countries
3. Conclusions
INDEX OF TABLES
Table 1: Attributes and levels of fresh pork meat preference
Table 2: Aggregated weights for Attributes and levels for all countries (variance)
Table 3.a.: Gender of the animal
Table 3.b.: Taste and odour
Table 3.d.: Pig origin
Table 3.e.: Price
Table 3.f.: Entire male (Non-castrated)
Table 3.g.: Castrated male with anaesthesia
Table 3.h.: Castrated male without anaesthesia
Table 3.i.: Female
Table 3.j.: Taste and odour is Normal
Table 3.k.: Taste and odour could be Unpleasant
Table 3.l.: National origin of pig
Table 3.m.: Imported origin of pig
Table 4.a: Aggregated weights for Attributes and levels for United Kingdom
Table 4.b: Aggregated weights for Attributes and levels for Spain
Table 4.c: Aggregated weights for Attributes and levels for The Netherlands
Table 4.d: Aggregated weights for Attributes and levels for Germany
Table 4.e: Aggregated weights for Attributes and levels for France
Table 4.f: Aggregated weights for Attributes and levels for Italy

D134 – 6
INDEX OF FIGURES
Figure 1: Attributes and levels’ weights: United Kingdom
Figure 2: Attributes and levels’ weights: Spain
Figure 3: Attributes and levels’ weights: The Netherlands
Figure 4: Attributes and levels’ weights: Germany
Figure 6: Attributes and levels’ weights: France
Figure 7: Attributes and levels’ weights: Italy
Figure 8: Levels’ weights for the “gender of the pig” across countries
Figure 9: Global weights for attributes and levels across countries
Figure 10: Relative importance of the “gender of the Pig” across countries
Figure 11: Relative importance of the “Taste and Odor” across countries
Figure 12: Relative importance of the “pig origin” across countries
Figure 13: Relative importance of the “price” across countries
INDEX OF ANNEXES
Annex 1: The Analytical Hierarchy Process (AHP) methodology

ALCASDE, 2009 D.1.3.4
D134 – 7
1. The Analytical Hierarchy Process (AHP) application
To analyze consumers’ preferences toward pig welfare and boar taint and to seek for the
trade-off they make between the different attributes of the fresh pork meat, we have
applied the Analytical Hierarchy Process (AHP) (See Annex 1 for methodological
details of the method). The first step of the application is the determination of attributes
and levels for fresh pork meat preference. We need to clearly define the attributes that
consumers take into consideration. The strategy employed was to identify and specify
the most relevant attributes of fresh pork meat, introducing hypothetical attributes that
describe the pig welfare. This study has identified the following attributes: Gender of
the pig, Origin of the animal, Sensorial quality, and price. These attributes were
subsequently discussed in a focus groups. In the same context, a pilot questionnaire was
applied to confirm the adequacy of attributes and levels. The attributes and levels are
shown in Table 1.
Table 1: Attributes and levels of fresh pork meat preference
Attributes Attributes symbols Levels Levels
symbol Variable symbol
Gender of the Pig (A1)
Female L1.1* CAST0
Entire male (Non-castrated) L1.2 CAST1
Castrated male with anesthesia L1.3 CAST2
Castrated male without anesthesia L1.4 CAST3
Taste and odor (A2) Could be Unpleasant L2.1* TAST0
Normal L2.2* TAST1
Pig origin (A3) Imported L3.1* ORIG0
National L3.2 ORIG1
Price (A4) 6.00 € L4.1*
PRICE 7.00 € L4.2 8.00 € L4.3
9.00 € L4.4 *: Base level
2. Relative importance of buying factors for fresh pork meat (AHP results)
As noted in Annex 1, the AHP allows obtaining the weights assigned by each individual
to the attributes and their levels using the geometric mean criteria. Thus, we have
constructed a hierarchy structure for each country where the weights for each attributes
and level of fresh pork meat can be shown.

D134 – 8
Relative importance of buying factors for United Kingdom
(AHP Results)
As can be seen in Figure 1, Taste and odor attribute have received the highest weight,
followed by Price, origin and Gender of the Pig. Analyzing with more details the
weights of attributes’ levels, we can see in gender attributes that the most important
levels was “ female” followed by “entire male”, “castrated with anaesthesia” and
“castration without anaesthesia” as expected. In this line, the highest relative weight was
for “normal taste” and “national origin” of pork meat.
UNITED KINGDOM (Total sample)‐
Figure 1: Attributes and levels’ weights: United Kingdom
Product attributes
Gender of the PigwA1
0.104
wL1.1
0.278
Entire male(Non-
castrated)
wL1.1
×
wA1
=
wG_L1.1
0.029
wL1.2
0.250
Castrated malewith
anesthesia
wL1.2
×
wA1
=
wG_L1.2
0.026
wL1.3
0.148
Castrated male
without anesthesia
wL1.3
×
wA1
=
wG_L1.3
0.015
wL1.4
0.324
Female
wL1.4
×
wA1
=
wG_L1.4
0.034
Taste and OdorwA2
0.429
wL2.1
0.795
Normal
wL2.1
×
wA2
=
wG_L2.1
0.375
wL2.2
0.205
Unpleasant
wL2.2
×
wA2
=
wG_L2.2
0.054
OriginwA3
0.200
wL3.1
0.744
National
wL3.1
×
wA3
=
wG_L3.1
0.167
wL3.2
0.256
Imported
wL3.2
×
wA3
=
wG_L3.2
0.033
PricewA4
0.267
wA4
=
wG_A4
0.267

ALCASDE, 2009 D.1.3.4
D134 – 9
Relative importance of buying factors for Spain (AHP
Results)
The AHP results for Spain (Figure 2) show the same importance as in United Kingdom
but with different intensity of importance. They give less importance to origin and
gender but more importance to taste and odor. It is worth to mention here the lowest
value that consumers gave to the gender attribute. The relative importance of levels
follows the same importance as in United Kingdom results with the exception that
Female and Entre male have received the same values.
SPAIN (Total sample)
Figure 2: Attributes and levels’ weights: Spain
Product attributes
Gender of the PigwA1
0.059
wL1.1
0.325
Entire male(Non-
castrated)
wL1.1
×
wA1
=
wG_L1.1
0.019
wL1.2
0.212
Castrated malewith
anesthesia
wL1.2
×
wA1
=
wG_L1.2
0.012
wL1.3
0.139
Castrated male
without anesthesia
wL1.3
×
wA1
=
wG_L1.3
0.008
wL1.4
0.325
Female
wL1.4
×
wA1
=
wG_L1.4
0.019
Taste and OdorwA2
0.568
wL2.1
0.865
Normal
wL2.1
×
wA2
=
wG_L2.1
0.491
wL2.2
0.135
Unpleasant
wL2.2
×
wA2
=
wG_L2.2
0.077
OriginwA3
0.164
wL3.1
0.823
National
wL3.1
×
wA3
=
wG_L3.1
0.135
wL3.2
0.177
Imported
wL3.2
×
wA3
=
wG_L3.2
0.029
PricewA4
0.210
wA4
=
wG_A4
0.210

D134 – 10
Relative importance of buying factor for The Netherlands
(AHP Results)
Analyzing results in The Netherlands (Figure 3), we can see that the price attribute have
received the highest relative importance, followed by taste and odor, origin and gender
of the pig. It is worth to mention that the gender seem to be an important attributes
within their decision making if it exist information about it. For levels importance, they
follow approximately the same importance as the previous case with the exception that
the entire male has received the highest relative importance score.
THE NETHERLANDS (Total Sample)
Figure 3: Attributes and levels’ weights: The Netherlands
Product attributes
Gender of the PigwA1
0.102
wL1.1
0.221
Entire male(Non-
castrated)
wL1.1
×
wA1
=
wG_L1.1
0.022
wL1.2
0.341
Castrated malewith
anesthesia
wL1.2
×
wA1
=
wG_L1.2
0.035
wL1.3
0.206
Castrated male
without anesthesia
wL1.3
×
wA1
=
wG_L1.3
0.021
wL1.4
0.232
Female
wL1.4
×
wA1
=
wG_L1.4
0.024
Taste and OdorwA2
0.399
wL2.1
0.841
Normal
wL2.1
×
wA2
=
wG_L2.1
0.336
wL2.2
0.159
Unpleasant
wL2.2
×
wA2
=
wG_L2.2
0.064
OriginwA3
0.174
wL3.1
0.731
National
wL3.1
×
wA3
=
wG_L3.1
0.127
wL3.2
0.269
Imported
wL3.2
×
wA3
=
wG_L3.2
0.047
PricewA4
0.325
wA4
=
wG_A4
0.325

ALCASDE, 2009 D.1.3.4
D134 – 11
Relative importance of buying factors for Germany (AHP
Results)
In the Germany case, we can see in Figure 4 that consumers had revealed a similar
preference as the other countries. It is interesting to mention that the gender receive a
higher importance than the Spanish case. Price attribute seem also to be very important
and came before the origin of the meat.
GERMANY (Total Sample)
Figure 4: Attributes and levels’ weights: Germany
Product attributes
Gender of the PigwA1
0.071
wL1.1
0.301
Entire male(Non-
castrated)
wL1.1
×
wA1
=
wG_L1.1
0.021
wL1.2
0.274
Castrated malewith
anesthesia
wL1.2
×
wA1
=
wG_L1.2
0.019
wL1.3
0.091
Castrated male
without anesthesia
wL1.3
×
wA1
=
wG_L1.3
0.006
wL1.4
0.334
Female
wL1.4
×
wA1
=
wG_L1.4
0.024
Taste and OdorwA2
0.419
wL2.1
0.854
Normal
wL2.1
×
wA2
=
wG_L2.1
0.357
wL2.2
0.146
Unpleasant
wL2.2
×
wA2
=
wG_L2.2
0.061
OriginwA3
0.245
wL3.1
0.808
National
wL3.1
×
wA3
=
wG_L3.1
0.198
wL3.2
0.192
Imported
wL3.2
×
wA3
=
wG_L3.2
0.047
PricewA4
0.266
wA4
=
wG_A4
0.266

D134 – 12
Relative importance of buying factors for France (AHP
Results)
For French consumers, results (Figure 6) show a low relative importance of gender as
the case of Spain. It is important to mention that the origin attribute have received one
of the highest value comparing with all the other countries and it has a value similar to
the relative importance of price. For levels importance results show a similar structure
of preference highlighting a low relative importance for castration without anaesthesia.
FRANCE (Total Sample)
Figure 6: Attributes and levels’ weights: France
Product attributes
Gender of the PigwA1
0.059
wL1.1
0.339
Entire male(Non-
castrated)
wL1.1
×
wA1
=
wG_L1.1
0.020
wL1.2
0.239
Castrated malewith
anesthesia
wL1.2
×
wA1
=
wG_L1.2
0.014
wL1.3
0.110
Castrated male
without anesthesia
wL1.3
×
wA1
=
wG_L1.3
0.007
wL1.4
0.311
Female
wL1.4
×
wA1
=
wG_L1.4
0.018
Taste and OdorwA2
0.395
wL2.1
0.863
Normal
wL2.1
×
wA2
=
wG_L2.1
0.341
wL2.2
0.137
Unpleasant
wL2.2
×
wA2
=
wG_L2.2
0.054
OriginwA3
0.274
wL3.1
0.839
National
wL3.1
×
wA3
=
wG_L3.1
0.230
wL3.2
0.161
Imported
wL3.2
×
wA3
=
wG_L3.2
0.044
PricewA4
0.272
wA4
=
wG_A4
0.272

ALCASDE, 2009 D.1.3.4
D134 – 13
Relative importance of buying factors for Italy (AHP
Results)
For Italy results (Figure 7) we can see that gender attributes have received a higher
value compared with Spain, Germany and France. However, it is worth to mention that
the origin attribute is one of the most important attributes and it received the highest
value compared with the results of the other countries. For level importance, in the
gender attributes female seem to be the most important compared with the other levels.
Price attribute as obtained one of the lowest relative importance compared with other
countries results.
ITALY (Total Sample)
Figure 7: Attributes and levels’ weights: Italy
Product attributes
Gender of the PigwA1
0.080
wL1.1
0.298
Entire male(Non-
castrated)
wL1.1
×
wA1
=
wG_L1.1
0.024
wL1.2
0.219
Castrated malewith
anesthesia
wL1.2
×
wA1
=
wG_L1.2
0.018
wL1.3
0.177
Castrated male
without anesthesia
wL1.3
×
wA1
=
wG_L1.3
0.014
wL1.4
0.306
Female
wL1.4
×
wA1
=
wG_L1.4
0.025
Taste and OdorwA2
0.431
wL2.1
0.861
Normal
wL2.1
×
wA2
=
wG_L2.1
0.372
wL2.2
0.139
Unpleasant
wL2.2
×
wA2
=
wG_L2.2
0.060
OriginwA3
0.305
wL3.1
0.834
National
wL3.1
×
wA3
=
wG_L3.1
0.254
wL3.2
0.166
Imported
wL3.2
×
wA3
=
wG_L3.2
0.050
PricewA4
0.184
wA4
=
wG_A4
0.184

D134 – 14
Table 2: Aggregated weights for Attributes and levels for all countries (variance)
Attributes and level Aggregated weight (Geometric mean)
Spain United Kingdom Italy France The Netherlands Germany
Gender of the
animal
Entire male (Non-castrated)
5.90% (0.56)
32.48% (3.03)
10.42% (1.04)
27.83% (1.83)
8.02% (1.09)
29.83% (2.71)
5.92% (0.35)
33.90% (3.19)
10.17% (1.14)
22.10% (1.37)
7.06% (0.74)
30.08% (2.51)
Castrated male with anesthesia 21.16% (2.76) 25.00% (1.91) 21.88% (1.76) 23.92% (2.82) 34.09% (2.08) 27.42% (2.00)
Castrated male without anesthesia 13.87% (1.83) 14.81% (1.17) 17.71% (2.40) 11.05% (1.42) 20.57% (1.12) 9.18% (0.84)
Female 32.49% (2.72) 32.36% (2.40) 30.58% (2.21) 31.13% (2.50) 23.25% (1.75) 33.31% (2.35)
TOTAL 100.00 100.00 100.00 100.00 100.00 100.00
Taste and odor
Normal
56.76% (3.16)
86.45% (2.74)
42.86% (3.49)
79.51% (5.22)
43.14% (4.07)
86.12% (1.18)
39.49% (4.30)
86.28% (2.58)
39.90% (3.50)
84.08% (3.03)
41.86% (3.84)
85.40% (2.47)
Could be Unpleasant 13.55% (2.74) 20.49% (5.22) 13.88% (1.18) 13.72% (2.58) 15.92% (3.03) 14.60% (2.47)
TOTAL 100.00 100.00 100.00 100.00 100.00 100.00
Pig origin
National
16.38% (2.80)
82.25% (3.22)
20.02% (2.65)
74.40% (5.39)
30.46% (4.56)
83.44% (3.31)
27.40% (4.64)
83.95 % (3.12)
17.40% (2.12)
73.13% (3.69)
24.52% (2.19)
80.64% (3.15)
Imported 17.75% (3.22) 25.60% (5.39) 16.56% (3.31) 16.05% (3.12) 26.87% (3.69) 19.36% (3.15)
TOTAL 100.00 100.00 100.00 100.00 100.00 100.00
Price 20.96% (2.04) 26.69%
(3.07) 18.38% (2.01)
27.19% (2.97)
32.52% (3.27)
26.39% (2.52)
TOTAL 100.00 100.00 100.00 100.00 100.00 100.00

ALCASDE, 2009 D.1.3.4
D134 – 15
Relative importance of “gender of the pig” levels across
countries
To have a whole view of the relative importance of attributes and levels for the gender
of the pig, as mentioned in Annex 1, we have calculated the global weight that allow us
to make a correct comparison. As can be seen in Figure 8, the highest relative
importance for “castrated pig with anesthesia” and for “castrated male without
anesthesia” are for The Netherlands. In contrast, “female” and “entire male” have the
highest weight for United Kingdom. Other aspect to highlight the moderately high
relative importance for “castrated male with anesthesia” in the case of Germany and for
“castrated male without anesthesia in Italy.
Figure 8: Levels’ weights for the “gender of the pig” across countries
The global relative importance of attributes and weights for each country can be shown
in Figure 9, where comparison allow to establish a visual view of the AHP results., we
have
0.00%
1.00%
2.00%
3.00%
4.00%Entire male
Castrated male with anesthesia
Castrated male without anesthesia
Female
United Kingdom
France
Germany
Italy
Spain
The Netherland

D134 – 16
Figure 9: Global weights for attributes and levels across countries
Entire male2.90%
Castrated male with anesthesia2.61%
Castrated male without anesthesia1.54%
Female3.37%
Taste and odor is normal37.51%
Taste and odor could be unpleasant
5.36%
Pig origin is National16.69%
Pig origin is Imported3.34%
Price26.69%
United Kingdom
Entire male2.01%
Castrated male with anesthesia1.42%
Castrated male without anesthesia0.65%
Female1.84%
Taste and odor is normal34.07%
Taste and odor could be unpleasant
5.42%
Pig origin is National23.00%
Pig origin is Imported4.40%
Price27.19%
France
Entire male2.13%
Castrated male with anesthesia1.94%
Castrated male without anesthesia0.64%
Female2.36%
Taste and odor is normal35.73%Taste and
odor could be unpleasant
6.13%
Pig origin is National19.81%
Pig origin is Imported4.70%
Price26.56%
Germany
Entire male2.39%
Castrated male with anesthesia1.75%
Castrated male without anesthesia1.42%
Female2.45%
Taste and odor is normal
37.16%Taste and
odor could be unpleasant
5.99%
Pig origin is National25.41%
Pig origin is Imported5.04%
Price18.38%
Italy
Entire male1.92%
Castrated male with anesthesia1.25%
Castrated male without anesthesia0.82%
Female1.92%
Taste and odor is normal49.07%
Taste and odor could be unpleasant
7.69%
Pig origin is National13.48%
Pig origin is Imported2.91%
Price20.96%
Spain
Entire male2.25%
Castrated male with anesthesia3.47%
Castrated male without anesthesia2.09%
Female2.37%
Taste and odor is normal33.55%
Taste and odor could be unpleasant
6.35%
Pig origin is National12.72%
Pig origin is Imported4.68% Price
32.52%
The Netherlands

ALCASDE, 2009 D.1.3.4
D134 – 17
In order to interpret correctly the difference between countries, we have realized the t
test analysis. Results are shown in Table 2a to the Table 2m.
In the first part (Table 2a to table 2d) we can see the difference between attributes’
weights across countries. Results show the presence of preference heterogeneity across
countries. From the Table 2.a.we can identify three different groups on the basis of the
weight of “Gender of the animal”. The first group consists of Spain and France with the
lowest relative importance (5.90% and 5.92% respectively). The second group consists
of Italy and Germany with a moderate relative importance of animal gender (8.025 and
7.06%, respectively). The third group is formed by United Kingdom and The
Netherlandss with highest value form animal gender (10.42% and 10.17% respectively).
Figure 10 show a visual representation of the results.
Figure 10: Relative importance of the “gender of the Pig” across countries

D134 – 18
For the taste and odor attribute, Spain is shown to have the highest value (56.76%)
compared with the other countries with a statistically significant difference. Figure 11
show a visual representation of results.
Figure 11: Relative importance of the “Taste and Odor” across countries

ALCASDE, 2009 D.1.3.4
D134 – 19
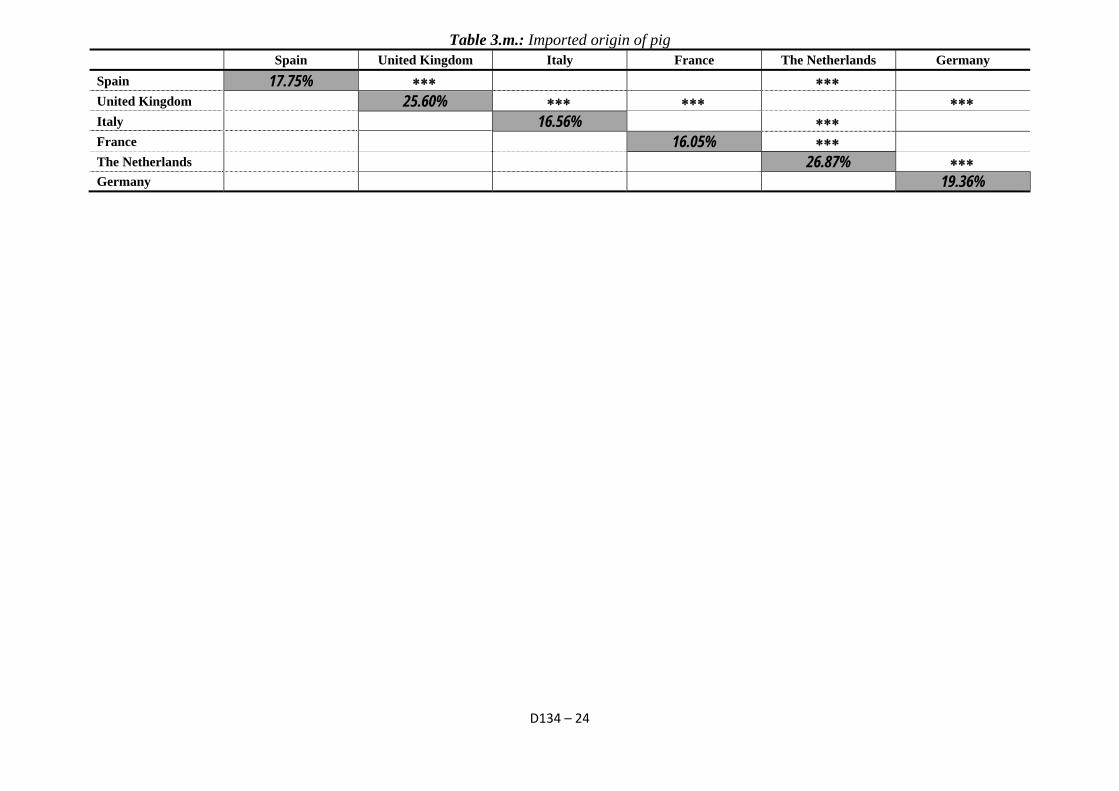
For “pig origin” attribute we can identify two different groups. The first one is formed
by Spain, United Kingdom and The Netherlands (16.38%, 20.02% and 17.40%
respectively), showing a low relative importance. The second group is formed by Italy,
France and Germany (30.46%, 27.40% and 24.52% respectively) showing the highest
value of pig origin importance. Figure 12 show the results graphically.
Figure 12: Relative importance of the “pig origin” across countries

D134 – 20
Analyzing the price relative importance, results in Table 2.e. show Spain and Italy
(20.96% and 18.38% respectively) with the lowest value of weights. United Kingdom,
France, Germany (26.69%, 27.19% and 26.39%) has a moderate relative importance,
while The Netherlands (32.52%) have the highest value. Figure 13 show a visual
presentation of the results.
Figure 13: Relative importance of the “price” across countries

ALCASDE, 2009 D.1.3.4
D134 – 21
Table 3.a.: Gender of the animal (Significance levels: ***p < 0.01; **p < 0.05; *p < 0.10) Spain United Kingdom Italy France The Netherlands Germany
Spain 5.90% ∗∗∗ ∗∗ ∗∗∗ ∗ United Kingdom 10.42% ∗∗ ∗∗∗ ∗∗∗ Italy 8.02% ∗∗∗ ∗∗ France 5.92% ∗∗∗ ∗∗∗ The Netherlands 10.17% Germany 7.06%
Table 3.b.: Taste and odor
Spain United Kingdom Italy France The Netherlands Germany Spain 56.76% ∗∗∗ ∗∗∗ ∗∗∗ ∗∗∗ ∗∗∗ United Kingdom 42.86% Italy 43.14% France 39.49% The Netherlands 39.90% Germany 41.86%
Table 3.d.: Pig origin
Spain United Kingdom Italy France The Netherlands Germany Spain 16.38% ∗∗∗ ∗∗∗ ∗∗∗ United Kingdom 20.02% ∗∗∗ ∗∗∗ ∗ Italy 30.46% ∗∗∗ ∗∗∗ France 27.40% ∗∗∗ ∗∗ The Netherlands 17.40% ∗∗∗ Germany 24.52%
Table 3.e.: Price
Spain United Kingdom Italy France The Netherlands Germany Spain 20.96% ∗∗∗ ∗ ∗∗ ∗∗∗ ∗∗ United Kingdom 26.69% ∗∗∗ ∗∗ Italy 18.38% ∗∗∗ ∗∗∗ ∗∗∗

D134 – 22
France 27.19% ∗∗ The Netherlands 32.52% ∗∗ Germany 26.39%
Table 3.f.: Entire male (Non-castrated) Spain United Kingdom Italy France The Netherlands Germany
Spain 32.48% ∗∗ ∗∗∗ United Kingdom 27.83% ∗∗∗ ∗∗∗ Italy 29.83% ∗ ∗∗∗ France 33.90% ∗∗∗ The Netherlands 22.10% ∗∗∗ Germany 30.08%
Table 3.g.: Castrated male with anesthesia
Spain United Kingdom Italy France The Netherlands Germany Spain 21.16% ∗∗∗ ∗∗ United Kingdom 25.00% ∗∗∗ Italy 21.88% ∗∗∗ ∗∗∗ France 23.92% ∗∗∗ The Netherlands 34.09% ∗∗∗ Germany 27.42%
Table 3.h.: Castrated male without anesthesia
Spain United Kingdom Italy France The Netherlands Germany Spain 13.87% ∗∗ ∗∗ ∗∗∗ ∗∗∗ United Kingdom 14.81% ∗∗ ∗∗∗ ∗∗∗ ∗∗∗ Italy 17.71% ∗∗∗ ∗∗∗ France 11.05% ∗∗∗ ∗ The Netherlands 20.57% ∗∗∗ Germany 9.18%
Table 3.i.: Female
Spain United Kingdom Italy France The Netherlands Germany Spain 32.49% ∗∗∗ United Kingdom 32.36% ∗∗∗

ALCASDE, 2009 D.1.3.4
D134 – 23
Italy 30.58% ∗∗ ∗ France 31.13% ∗∗∗ The Netherlands 23.25% ∗∗∗ Germany 33.31%
Table 3.j.: Taste and odor is Normal (Significance levels: ***p < 0.01; **p < 0.05; *p < 0.10) Spain United Kingdom Italy France The Netherlands Germany
Spain 86.45% ∗∗∗ United Kingdom 79.51% ∗∗∗ ∗∗∗ ∗∗ ∗∗∗ Italy 86.12% ∗ France 86.28% The Netherlands 84.08% Germany 85.40%
Table 3.k.: Taste and odor could be Unpleasant
Spain United Kingdom Italy France The Netherlands Germany Spain 13.55% ∗∗∗ United Kingdom 20.49% ∗∗∗ ∗∗∗ ∗∗ ∗∗∗ Italy 13.88% ∗ France 13.72% The Netherlands 15.92% Germany 14.60%
Table 3.l.: National origin of pig
Spain United Kingdom Italy France The Netherlands Germany Spain 82.25% ∗∗∗ ∗∗∗ United Kingdom 74.40% ∗∗∗ ∗∗∗ ∗∗∗ Italy 83.44% ∗∗∗ France 83.95 % ∗∗∗ The Netherlands 73.13% ∗∗∗ Germany 80.64%
D134 – 24
Table 3.m.: Imported origin of pig Spain United Kingdom Italy France The Netherlands Germany
Spain 17.75% ∗∗∗ ∗∗∗ United Kingdom 25.60% ∗∗∗ ∗∗∗ ∗∗∗ Italy 16.56% ∗∗∗ France 16.05% ∗∗∗ The Netherlands 26.87% ∗∗∗ Germany 19.36%

ALCASDE, 2009 D.1.3.4
D134 – 25
AHP results by age and buying decision across countries
We have chosen simultaneously consumers who are responsible of shopping and aged
between 25 and 39 years and between 40 and 54. We have estimated the AHP results
for these groups across countries. Results can be shown from Table 3.a. to Table 3.f.
For United Kingdom (Table 4.a.), significant difference can be shown for “taste and
odor” attributes in both groups identified with a higher relative importance for this
attribute given by consumers aged between 25 and 39 years.
For the Spanish case (Table 4.b.) only a small significant difference are found between
attribute. Specifically, the group with consumers aged between 25 and 39 years have a
higher relative importance for “female” and less importance for “castrated pig with
anesthesia” compared with the mean.
For the The Netherlands case (Table 4.c.) there is no statistically significant difference
between attributes and levels with the exception of consumer aged between 40 and 54
who give a low relative importance for “castrated pig without anesthesia” (17.96%).
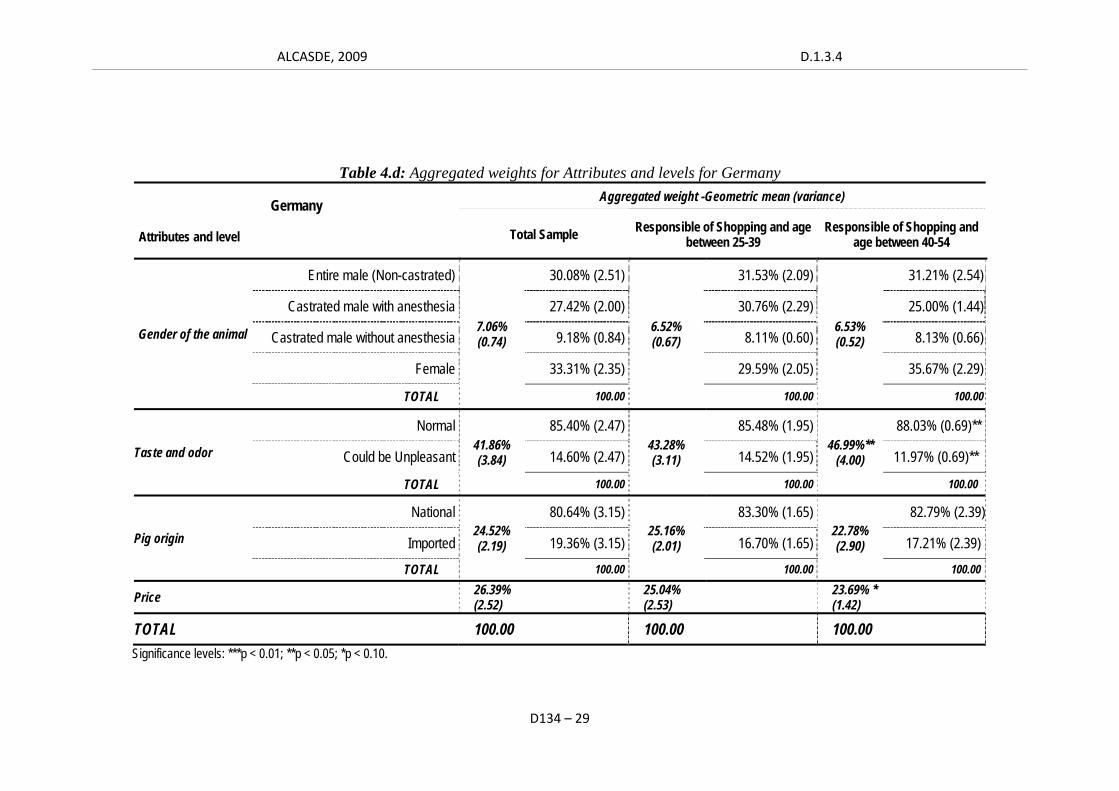
In the German case (Table 4.d.), we highlight a significant difference for “taste and
odor” attribute and “price” levels. Specifically, consumers with age between 40 and 54
give less importance for “price” (3.69%) and high relative importance for “taste and
odor” (46.99%) compared with the mean.
For France, the AHP results (Table 4.e.) show low statistically significant differences.
In this context, we highlight consumers with age between 25 and 39 years with the
highest relative importance of “price” (35.92%) and the lowest relative importance of
“animal gender” (4.51%).
AHP results for Italy (Table 4.f.) reveal a low relative importance for “animal gender”
for consumers with age between 40 and 54 years (9.30%) and a high relative importance
for “taste and odor” attribute for consumers between 25 and 39 years (51.69%).

D134 – 26
Table 4.a: Aggregated weights for Attributes and levels for United Kingdom
United Kingdom
Attributes and level
Aggregated weight -Geometric mean (variance)
Total Sample Responsible of Shopping and age between 25-39
Responsible of Shopping and age between 40-54
Gender of the animal
Entire male (Non-castrated)
10.42% (1.04)
27.83% (1.83)
9.47% (0.83)
28.34% (2.51)
12.56%* (1.41)
28.27% (2.12)
Castrated male with anesthesia 25.00% (1.91) 20.10% (1.47)* 23.86% (2.13)
Castrated male without anesthesia 14.81% (1.17) 13.70% (1.00) 14.98% (0.80)
Female 32.36% (2.40) 37.85% (2.95) 32.89% (2.47)
TOTAL 100.00 100.00 100.00
Taste and odor
Normal 42.86% (3.49)
79.51% (5.22) 46.98% (2.97)
85.76% (1.21)* 42.12% (3.09)
73.90% (6.83)**
Could be Unpleasant 20.49% (5.22) 14.24% (1.21)* 26.10% (6.83)**
TOTAL 100.00 100.00 100.00
Pig origin
National 20.02% (2.65)
74.40% (5.39) 17.52% (2.70)
75.20% (3.20) 20.41% (2.31)
75.68% (4.56)
Imported 25.60% (5.39) 24.80%(3.20) 24.32% (4.56)
TOTAL 100.00 100.00 100.00
Price 26.69% (3.07)
26.04% (2.29)
24.91% (2.95)
TOTAL 100.00 100.00 100.00 Significance levels: ***p < 0.01; **p < 0.05; *p < 0.10.

ALCASDE, 2009 D.1.3.4
D134 – 27
Table 4.b: Aggregated weights for Attributes and levels for Spain
Spain
Attributes and level
Aggregated weight -Geometric mean (variance)
Total Sample Responsible of Shopping and age between 25-39
Responsible of Shopping and age between 40-54
Gender of the animal
Entire male (Non-castrated)
5.90% (0.56)
32.48% (3.03)
5.54% (0.08)
32.70% (2.30)
5.55% (0.38)
32.16% (3.52)
Castrated male with anesthesia 21.16% (2.76) 17.53% (1.41)* 21.41% (4.02)
Castrated male without anesthesia 13.87% (1.83) 11.84% (1.01) 13.83% (1.25)
Female 32.49% (2.72) 37.92% (2.28**) 32.60% (3.08)
TOTAL 100.00 100.00 100.00
Taste and odor
Normal 56.76% (3.16)
86.45% (2.74) 53.80% (3.57)
87.76% (1.93) 57.61% (2.96)
86.40% (2.31)
Could be Unpleasant 13.55% (2.74) 12.24% (1.93) 13.60% (2.31)
TOTAL 100.00 100.00 100.00
Pig origin
National 16.38% (2.80)
82.25% (3.22) 18.85% (3.85)
83.28% (3.34) 15.82% (2.01)
83.19% (2.89)
Imported 17.75% (3.22) 16.72% (3.34) 16.81% (2.89) TOTAL 100.00 100.00 100.00
Price 20.96% (2.04)
21.81% (2.26)
21.02% (2.22)
TOTAL 100.00 100.00 100.00 Significance levels: ***p < 0.01; **p < 0.05; *p < 0.10.

D134 – 28
Table 4.c: Aggregated weights for Attributes and levels for The Netherlands
The Netherlands
Attributes and level
Aggregated weight -Geometric mean (variance)
Total Sample Responsible of Shopping and age between 25-39
Responsible of Shopping and age between 40-54
Gender of the animal
Entire male (Non-castrated)
10.17% (1.14)
22.10% (1.37)
8.05%** (0.41)
22.23% (1.30)
8.82% (0.91)
24.28% (1.63)
Castrated male with anesthesia 34.09% (2.08) 33.31% (1.72) 34.52%(1.88)
Castrated male without anesthesia 20.57% (1.12) 22.61% (1.58)* 17.69%(0.69)*
Female 23.25% (1.75) 21.85% (1.41) 23.51%(1.51)
TOTAL 100.00 100.00 100.00
Taste and odor
Normal 39.90% (3.50)
84.08% (3.03) 44.73% (3.14)
85.73% (1.35) 43.90% (3.81)
85.40%(2.66)
Could be Unpleasant 15.92% (3.03) 14.27% (1.35) 14.60%(2.66)
TOTAL 100.00 100.00 100.00
Pig origin
National 17.40% (2.12)
73.13% (3.69) 13.35% (2.13)
70.86% (2.91) 16.20%
2.07
73.93%(3.53)
Imported 26.87% (3.69) 29.14% (2.91) 26.07%(3.53)
TOTAL 100.00 100.00 100.00
Price 32.52% (3.27)
33.86% (3.04)
31.08 (2.98)
TOTAL 100.00 100.00 100.00 Significance levels: ***p < 0.01; **p < 0.05; *p < 0.10.
ALCASDE, 2009 D.1.3.4
D134 – 29
Table 4.d: Aggregated weights for Attributes and levels for Germany
Germany
Attributes and level
Aggregated weight -Geometric mean (variance)
Total Sample Responsible of Shopping and age between 25-39
Responsible of Shopping and age between 40-54
Gender of the animal
Entire male (Non-castrated)
7.06% (0.74)
30.08% (2.51)
6.52% (0.67)
31.53% (2.09)
6.53% (0.52)
31.21% (2.54)
Castrated male with anesthesia 27.42% (2.00) 30.76% (2.29) 25.00% (1.44)
Castrated male without anesthesia 9.18% (0.84) 8.11% (0.60) 8.13% (0.66)
Female 33.31% (2.35) 29.59% (2.05) 35.67% (2.29)
TOTAL 100.00 100.00 100.00
Taste and odor
Normal 41.86% (3.84)
85.40% (2.47) 43.28% (3.11)
85.48% (1.95) 46.99%**
(4.00)
88.03% (0.69)**
Could be Unpleasant 14.60% (2.47) 14.52% (1.95) 11.97% (0.69)**
TOTAL 100.00 100.00 100.00
Pig origin
National 24.52% (2.19)
80.64% (3.15) 25.16% (2.01)
83.30% (1.65) 22.78% (2.90)
82.79% (2.39)
Imported 19.36% (3.15) 16.70% (1.65) 17.21% (2.39)
TOTAL 100.00 100.00 100.00
Price 26.39% (2.52)
25.04% (2.53)
23.69% * (1.42)
TOTAL 100.00 100.00 100.00 Significance levels: ***p < 0.01; **p < 0.05; *p < 0.10.

D134 – 30
Table 4.e: Aggregated weights for Attributes and levels for France
France
Attributes and level
Aggregated weight -Geometric mean (variance)
Total Sample Responsible of Shopping and age between 25-39
Responsible of Shopping and age between 40-54
Gender of the animal
Entire male (Non-castrated)
5.92% (0.35)
33.90 (3.19)
4.51%*** (0.02)
28.62% (2.46)*
7.07%** (0.67)
36.71% (2.62)
Castrated male with anesthesia 23.92 (2.82) 24.40% (2.44) 23.07% (2.26)
Castrated male without anesthesia 11.05 (1.42) 14.45% (1.31)* 9.57% (1.14)
Female 31.13 (2.50) 32.53% (2.98) 30.65% (1.32)
TOTAL 100.00 100.00 100.00
Taste and odor
Normal 39.49% (4.30)
86.28 (2.58) 39.82% (3.69)
87.88% (1.59) 40.24% (4.40)
84.09% (2.98)
Could be Unpleasant 13.72 (2.58) 12.12% (1.59) 15.91% (2.98)
TOTAL 100.00 100.00 100.00
Pig origin
National 27.40% (4.64)
83.95 (3.12) 19.75%**
(2.98)
84.32% (2.21) 29.44% (4.20)
81.92% (3.46)
Imported 16.05 (3.12) 15.68% (2.21) 18.08% (3.46)
TOTAL 100.00 100.00 100.00
Price 27.19% (2.97)
35.92%*** (2.59)
23.25%* (2.15)
TOTAL 100.00 100.00 100.00 Significance levels: ***p < 0.01; **p < 0.05; *p < 0.10.

ALCASDE, 2009 D.1.3.4
D134 – 31
Table 4.f: Aggregated weights for Attributes and levels for Italy
Italy
Attributes and level
Aggregated weight -Geometric mean (variance)
Total Sample Responsible of Shopping and age between 25-39
Responsible of Shopping and age between 40-54
Gender of the animal
Entire male (Non-castrated)
8.02% (1.09)
29.83 (2.71)
6.33%* (0.23)
32.00% (2.58)
9.30%* (1.85)
26.65% (2.46)**
Castrated male with anesthesia 21.88 (1.76) 26.08% (2.59)** 18.64% (1.22)***
Castrated male without anesthesia 17.71 (2.40) 14.78% (1.77) 19.53% (2.72)**
Female 30.58 (2.21) 27.14% (1.16)** 35.19% (3.00)***
TOTAL 100.00 100.00 100.00
Taste and odor
Normal 43.14% (4.07)
86.12 (1.18) 51.69%***
(2.65)
88.25% (0.15)** 40.14%**
(4.35)
85.72% (1.35)
Could be Unpleasant 13.88 (1.18) 11.75% (0.15)** 14.28% (1.35)
TOTAL 100.00 100.00 100.00
Pig origin
National 30.46% (4.56)
83.44 (3.31) 24.72% (2.94)
86.21% (0.76)** 30.93% (5.82)
82.25% (4.08)*
Imported 16.56 (3.31) 13.79% (0.76)** 17.75% (4.08)*
TOTAL 100.00 100.00 100.00
Price 18.38% (2.01)
17.26% (0.95)
19.64% (3.13)
TOTAL 100.00 100.00 100.00 Significance levels: ***p < 0.01; **p < 0.05; *p < 0.10.

D134 – 32
3. Conclusions
Our results demonstrate that consumers’ preference towards pig castration and boar
taint is heterogeneous across the studies countries. The preliminary results show the
presence of three basic groups on the basis of the relative importance of animal gender
attribute.
United Kingdom and The Netherlands are in the first position with the highest weight.
Italy and Germany with a middle position with a moderate weight. Finally, Spain and
France represent the groups with the lowest weight of “animal gender” importance.
“Taste and odor” attribute show heterogeneous preference between consumers across
countries, showing Spain with the highest value of relative importance compared to all
other countries.
Our results show also that consumers’ heterogeneity does not depend on age and
shopping responsibility. In this context, results show a majority non-statistically
difference between these groups across countries. However, it is worth to highlight that
in United Kingdom and Italy the higher relative importance of “taste and odor” is for
consumers responsible for shopping and aged between 25 and 39 years. Moreover, In
Spain this same group reveals a high relative importance for “female”. In Germany
consumers aged between 40 and 54 years give higher relative importance to “taste and
odor”. Finally, while young consumers (25-39 years) show low relative importance of
“animal gender”, in Italy elder ones (40-44) show the same results.
Our results show a lag of information about “gender of the animal” and as a
consequence about pig castration. Across all countries, the aggregated weight of this
attribute goes from 5.90% to 10.42% only. This low representation of this attribute in

ALCASDE, 2009 D.1.3.4
D134 – 33
the consumers’ decision making show a need to establish an information campaign
about castration where consumers should be informed about the type of meat they eat.
Such promotion should be redirected more towards country where the relative
importance of this attributes is the lowest (Spain and France).
In all case, further analysis should be done in order to identify the source of
heterogeneity. In this context, heterogeneity should be studied two way; first across
consumers in each country and later across countries. By doing so, we would be able to
identify and target a specific segment of consumers where the relative importance of
this attribute is insignificant compared with the other attributes.

D134 – 34
Annex 1: The Analytical Hierarchy Process (AHP) methodology
The AHP methodology in our case aims to cope with individuals’ preference in order to
measures and determines the relative importance or weights of products’ attributes and
levels. The AHP is a technique to support multicriteria decision-making in discrete
environments. AHP allows eliciting weights for each attributes and levels taking them
into consideration to explain individuals’ behaviour in choosing their preferred product.
In order to implement the AHP, one needs to carry out a survey where individuals are
asked to value different attributes that follow a hierarchical structure (Figure 14).
Figure 14: Hierarchical structure used to value product attributes and levels.
The relative importance or weights (w) of attributes (An) and levels (Ln.p), where; n (1,
... , N) is the number of attributes and p (=1, ... , P) is the number of levels, are obtained
from a pair-wise comparisons. In order to make these comparisons and determine the
intensity of preferences for each option, Saaty (1980) proposed and justified the use of 9
points scale. The relative importance of each attributes is obtained by comparing this
attribute with all other attributes. From the answers provided, a matrix with the
following structure is generated for each individual k (1, ... , K) known as Saaty matrix.
In the case of attributes pair-wise comparison the matrix is:
⎥⎥⎥⎥
⎦
⎤
⎢⎢⎢⎢
⎣
⎡
=
NNkkiki
ijk
jkkk
jkkk
k
aaaa
aaaaaa
S
............
...
...
21
22221
11211
(6)
Produtct attributes
Atribute 1(A1)
L1.1 L1.2 L1.3
Atribute 2(A2)
L2.1 L2.2 L2.3
Atribute 3 (A3)
L3.1 L3.2 L3.3

ALCASDE, 2009 D.1.3.4
D134 – 35
where aijk represents the value obtained from the comparison between attribute/level i
(i∈N / i∈P) and attribute/level j; (j∈N / j∈P) for each individual k. This square matrix
has two fundamental properties: (a) all elements of its main diagonal take a value of one
(aiik=1 ∀ i), and (b) all other elements maintain that pair-wise comparisons are
reciprocal (if aijk=x then ajik=1/x). If perfect consistency in preferences holds for each
decision-maker, it should also hold that aihk × ahjk = aijk for all i, j and h (h∈N / h∈P).
This condition implies that values given for pair-wise comparisons represent weights
given to each objective by a perfectly rational decision-maker aijk= wik/wjk for all i and j.
Therefore, the Saaty matrix can also be expressed as follows:
⎥⎥⎥⎥⎥⎥⎥⎥⎥
⎦
⎤
⎢⎢⎢⎢⎢⎢⎢⎢⎢
⎣
⎡
=
Nk
Nk
k
Nk
k
Nk
jk
ik
Nk
k
k
k
k
k
Nk
k
k
k
k
k
k
ww
ww
ww
ww
ww
ww
ww
ww
ww
ww
S
...
.........
...
...
21
2
2
2
1
2
1
2
1
1
1
(7)
Under such circumstances, K weights (wNk) for each attributes and K weights (wPk) for
each levels can be easily determined from the N(N-1)/2 values and P(P-1)/2 values for
aijk. respectively. However, perfect consistency is seldom present in reality, where
personal subjectivity plays an important role in doing the pair-wise comparison. In
Saaty matrixes (Sk=aijk) in which some degree of inconsistency is present, alternative
approaches have been proposed to estimate the weight vector that better is able to
represent the decision-maker’s real weight vector. Saaty proposed two options as the
best estimate of real weights: the geometric mean and the main eigenvector. Other
authors have proposed alternatives based on regression analysis or goal programming.
No consensus has been reached regarding what alternative outperforms the others. As
all criteria meet the requirements to estimate the above-mentioned weights, we choose
the geometric mean. Using this approach, weights assigned by subject to each attribute
and levels are obtained using the following expression:
PN PNi
i ijkik aw , ,
1∏=
== ∀ i, k (8)
D134 – 36
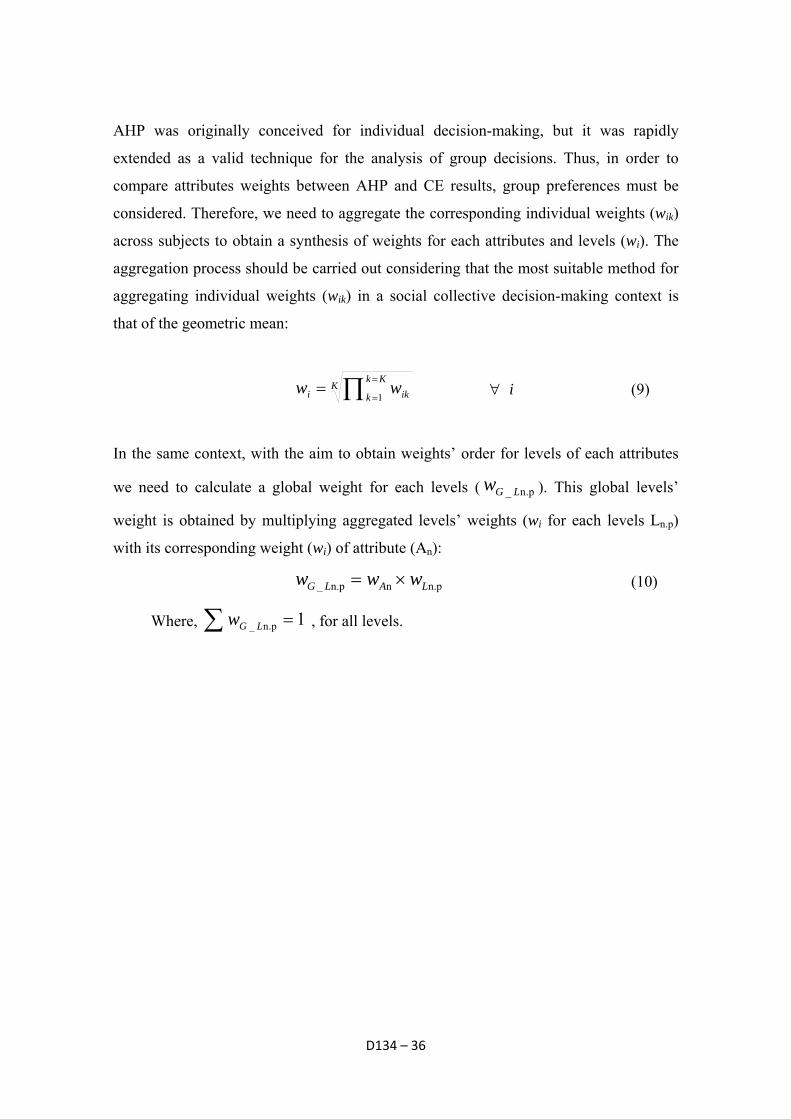
AHP was originally conceived for individual decision-making, but it was rapidly
extended as a valid technique for the analysis of group decisions. Thus, in order to
compare attributes weights between AHP and CE results, group preferences must be
considered. Therefore, we need to aggregate the corresponding individual weights (wik)
across subjects to obtain a synthesis of weights for each attributes and levels (wi). The
aggregation process should be carried out considering that the most suitable method for
aggregating individual weights (wik) in a social collective decision-making context is
that of the geometric mean:
KKk
k iki ww ∏ =
==
1 ∀ i (9)
In the same context, with the aim to obtain weights’ order for levels of each attributes
we need to calculate a global weight for each levels ( _ n.pG Lw ). This global levels’
weight is obtained by multiplying aggregated levels’ weights (wi for each levels Ln.p)
with its corresponding weight (wi) of attribute (An):
_ n.p n n.pG L A Lw w w= ×
(10)
Where, _ n.p 1G Lw =∑
, for all levels.

ALCASDE, 2009 D.1.3.4
D134 – 37
CONSUMER PREFERENCES TOWARDS CASTRATION AND BOAR TAINT: CE RESULTS

D134 – 38
ALCASDE, 2009 D.1.3.4
D134 – 39
Table of contents :
1. CHOICE EXPERIMENTS APPLICATION
2. RESULTS OF THE CHOICE EXPERIMENTS
3. CONCLUSIONS

D134 – 40
ALCASDE, 2009 D.1.3.4
D134 – 41
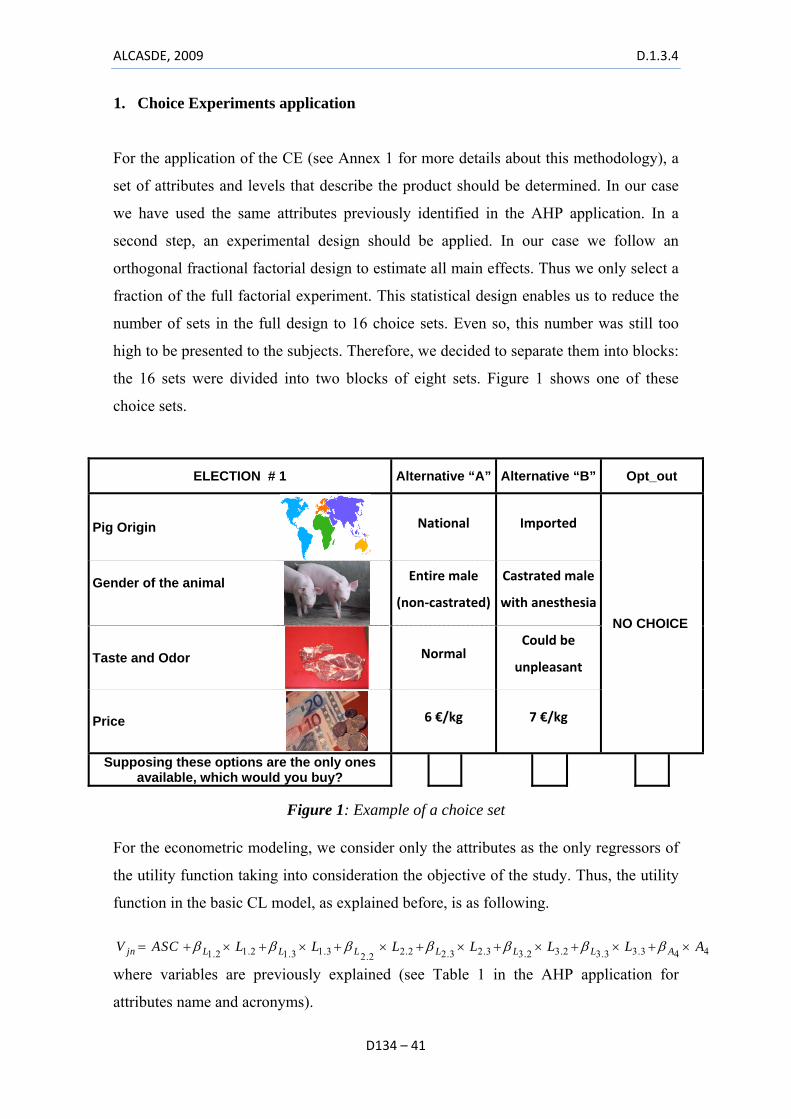
1. Choice Experiments application
For the application of the CE (see Annex 1 for more details about this methodology), a
set of attributes and levels that describe the product should be determined. In our case
we have used the same attributes previously identified in the AHP application. In a
second step, an experimental design should be applied. In our case we follow an
orthogonal fractional factorial design to estimate all main effects. Thus we only select a
fraction of the full factorial experiment. This statistical design enables us to reduce the
number of sets in the full design to 16 choice sets. Even so, this number was still too
high to be presented to the subjects. Therefore, we decided to separate them into blocks:
the 16 sets were divided into two blocks of eight sets. Figure 1 shows one of these
choice sets.
ELECTION # 1 Alternative “A” Alternative “B” Opt_out
Pig Origin National Imported
NO CHOICE
Gender of the animal Entire male
(non‐castrated)
Castrated male
with anesthesia
Taste and Odor Normal Could be
unpleasant
Price 6 €/kg 7 €/kg
Supposing these options are the only ones available, which would you buy?
Figure 1: Example of a choice set For the econometric modeling, we consider only the attributes as the only regressors of
the utility function taking into consideration the objective of the study. Thus, the utility
function in the basic CL model, as explained before, is as following.
1.2 1.3 2.2 2.3 3.2 3.3 41.2 1.3 2.3 3.2 3.3 42.2jn L L L L L L AV ASC L L L L L L Aβ β β β β β β= + × + × + × + × + × + × + ×
where variables are previously explained (see Table 1 in the AHP application for
attributes name and acronyms).

D134 – 42
2. Results of the Choice Experiments
Modelling results of the utility function derived from the pork meat preference
Table 1 shows the results of the basic Conditional Logit model applied for pre and post
preferences test. As can be seen, at a 99% confidence level, we can reject the null
hypothesis that all coefficients are jointly or simultaneously equal to zero. We thus do
not reject the overall significance of the model. The goodness of fit of model can be
assessed through the McFadden’s pseudo-R2 which is acceptable in all models.
In this table the coefficients represent the contribution of each level into the utility
function derived from the fresh pork meat preferences. The positive sign of coefficients
implies higher levels of utility associated to these attributes’ levels. The negative sign
implies that an increase in the levels of the attribute (price) decrease utility of
alternatives. We should to bear in mind that levels are codified using the effect coding.
In this type of codification the reference point is defined as the negative sum of the
estimated coefficients of the remaining levels. Thus, the utility of the reference level is
equals to: 1 2 1( 1) ( 1) ( 1)Lβ β β −× − + × − + + × −L .
From our models we highlight the following statistically significant results:
The attribute “Castration without anesthesia” have a negative sign and therefore
this level reduce consumers’ utility in all countries.
The “national origin” of pork meat increase utility of consumers in all countries.
The coefficient of the “no election alternative” that captures the utility of the
base alternative is statistically significant for all countries, showing a decrease in
consumers’ utility.
.

ALCASDE, 2009 D.1.3.4
Table 1: Results of the Conditional Logit model for the Pre and Post Test
Variables Spain United Kingdom Italy France The Netherlands Germany
Pre Coeff.
Post Coeff.
Pre Coeff.
Post Coeff.
Pre Coeff.
Post Coeff.
Pre Coeff.
Post Coeff.
Pre Coeff.
Post Coeff.
Pre Coeff.
Post Coeff.
Entire male (Non-castrated) -0,013 0,222** 0,191* 0,193* 0,078 0,144 0,326*** 0,057 -0,058 -0,076 -0,087 0,063
Castrated male with anesthesia 0,005 0,018 0,104 0,109 0,012 0,020 0,390** 0,300 0,046 0,794*** -0,133 -0,235
Castrated male without anesthesia -0,149* -0,418*** -0,357*** -0,569*** -0,130 -0,422* -0,693*** -0,556*** -0,304*** -0,344*** -0,226** -0,442
National 0,094** 0,119** 0,107** 0,158*** 0,260*** 0,351*** 0,238*** 0,253*** -0,110*** -0,107*** -0,078* -0,084
Normal 0,083 -0,029 0,033 0,024 0,283* 0,827 0,170 0,084 -0,138 0,215 -0,053 -0,137
Price -0,066 -0,085 -0,054 -0,098* -0,056 0,055 -0,096 -0,095 -0,145*** -0,172*** -0,163*** -0,170
No Election -2,009*** -1,964*** -1,255*** -1,336*** -0,966 0,477 -1,457*** -1,648*** -2,847*** -2,936*** -2,884*** -3,060
Summary Statistics
LL(0) -521,496 -524,793 -611,141 -626,845 -280,251 -230,024 -601,339 -585,812 -744,721 -737,048 -747,810 -737,048
LL (θ) -514,698 -536,276 -603,521 -607,790 -266,023 -287,040 -568,934 -557,006 -729,213 -716,058 -736,119 -716,058
LL ratio 13,59** 22,96*** 15,24*** 38,11*** 28,45*** 114,03*** 64,81*** 57,61*** 31,01*** 41,97*** 23,38*** 41,97***
D134 – 44
3. Conclusions
Results demonstrate the importance of information in affecting consumers’ preference toward
animal welfare. Thus, female and entire male were the both type most preferred by consumers
showing a higher contribution to consumers’ utility (higher coefficient values among levels)
in almost all analyzed countries. In this same line, results show a “desutility” for meat that
proceed from “castrated pig without anesthesia”. Results show also an increase in animal
welfare perception after the post test. Information about castration given in the post test reveal
an increase in “utility” for female and entire male and simultaneously an increase in the
“desutility” of “castrated male without anesthesia”.
National origin of pig is shown to be relevant for consumers in their decision across all the
analyzed countries. However, in the post test there was no significant difference affecting the
intensity of this preference. Results show also the irrelevance of the “Taste and Odor” in
consumer preference. This could be understood due to the hypothetical characteristic of the
study where products are shown in different cards or choice sets. In this line, more studies
should be applied using Discrete Choice modeling offering real product with monetary
incentive as are the “experimental auctions”.
The obtained results should be analyzed introducing heterogeneity both across countries and
across consumers in order to identify consumer segment with the lowest willingness to pay
trying to understand the reason of this hypothetical behavior. Analyzing preferences
introducing socio-demographic variables could be of high interest since it allows us to
understand with more details consumers’ preferences and their variability. In all case, results
of each country should be commented carefully due to the relatively small sample employed
in estimating the econometric models.

ALCASDE, 2009 D.1.3.4
D134 – 45
Annex 1: The Choice Experiment (CE) methodology
The CE is based on the characterization of the analyzed product through a series of
attributes that can be combined to create hypothetical scenarios that will be evaluated by
the subject. The number of scenarios shown to the interviewee is usually three and one
of the scenarios is a fixed comparator. The fixed comparator is usually named “no
election” option. This alternative may have also other labels as “null-option” or “opt-out
option”. The conceptual foundations of CE rely on two main theories a) Lancaster’s
Theory of Value, which proposes that utilities for goods can be decomposed into
separable utilities for their characteristics or attributes, and b) Random Utility Theory,
which explains the dominance judgments made between pairs of offerings. Based on
this theoretical framework, subjects choose among alternatives according to a utility
function with two components: a systematic (i.e. observable) component plus a random
term (non-observable by the researcher). Mathematically:
( , )in in i n inU V Z S ε= +
(1)
where inU is the utility provided by alternative i to subject n, inV is the systematic
component of the utility, iZ is the vector of attributes of alternative i, nS is the vector of
socio-economic characteristics of the respondent n, and inε is the random term.
Among the probabilistic choice models, the conditional logit (CL) model is the most
employed model for dealing with CE-sampled data. Under this specification, the
condition of independent and identically distributed (IID) error must be met according
to a Gumbel (or Weibull) distribution. According to the CL model, the probability that
an individual n will choose alternative i ( inP ) among other alternatives (i = 1 to I) of a
set nC is formulated as follows (McFadden, 1974):
1
in
in
V
in ni IV
i
eP i Ce
μ
μ=
=
= ∀ ∈
∑ (2)

D134 – 46
where inV is the systematic component of the utility provided by alternative i, and μ is a
scale parameter which is inversely proportional to the standard deviation of the error
terms and is usually assumed to be equal to one.
Equation 2 enables the probability of choice of an alternative to be linked to its utility.
To determine the relative importance of the attributes within the alternatives, the
functional form of inV must be defined. The most common assumption of this function is
that it is separable, additive and linear following this expression:
in k k ik
V ASC Xβ= + ∑ (3)
Where;
ASC =Alternative Specific Constant, representing the utility of the fixed comparator
i = 1…I, representing the selected alternative i within the set of alternatives ( nC );
k = 1…K, representing the attributes which characterize alternative j;
kβ = model parameter of attribute k;
kiX
= value of attribute k in alternative i;
From (3) the basic CL model is given by:
1
k k ik
k k ik
ASC X
in i I ASC X
i
ePe
β
β
+ ∑
= + ∑
=
=
∑ (4)
By estimating the basic CL model (4), implicit prices (IP) can be obtained for each
attributes and levels (5). These average values for the individuals in the sample can be
set in ranking structure determining the preferences of attributes and levels.
Product_attributeProduct _ attribute
monetary_attribute
IPββ
⎛ ⎞= −⎜ ⎟⎜ ⎟
⎝ ⎠ (5)

ALCASDE, 2009 D.1.3.4
D134 – 47
IMPORTANCE OF ANIMAL WELFARE AND ENTIRE MALE PRODUCTION BY THE
CONSUMERS OF DIFFERENT EU COUNTRIES


ALCASDE, 2009 D.1.3.4
D134 – 49
Table of contents: 1. Introduction 2. Materials and methods 3. Results and discussion 3.1. Relative importance of animal welfare 3.1.1. Animal welfare with respect to the other purchasing aspects 3.1.2. Animal welfare vs information about animal welfare 3.1.3. Animal welfare vs level of welfare and protection 3.1.4. Animal welfare vs more needs to improve welfare by regulation 3.2. Relative importance of do not castrate for the animal welfare 3.2.1. Do not castrate with respect to the other animal welfare aspects 3.2.2. Do not castrate vs information about animal welfare 3.2.3. Do not castrate vs level of welfare and protection 3.2.4. Do not castrate vs more needs to improve welfare by regulation 3.2.5. Do not castrate vs label meat from castrated pigs 3.2.6. Do not castrate vs non-castrated pork more expensive than castrated pork 3.2.7. Do not castrate vs justified castration to improve the sensory quality of the meat 3.2.8. Do not castrate vs belief that males should not be castrated to not change the state of the animal 3.2.9. Do not castrate vs belief that castration of male pigs should not be done because it is painful 4. Conclusions 5. References
D134 – 50
INDEX OF FIGURES Figure 1: Relative importance of animal welfare with respect to the other purchasing attributes evaluated (different letters within groups indicated significant differences between countries). Figure 2: Relative importance of animal welfare vs level of information about animal welfare depending on the country and group interest. Figure 3: Relative importance of animal welfare vs beliefs about the level of animal welfare and protection of pigs depending on the country and group interest. Figure 4: Relative importance of animal welfare vs beliefs that there are more needs to be done by regulations to improve the level of welfare and protection of pigs depending on the country and group interest. Figure 5: Relative importance of animal welfare with respect to the other purchasing attributes evaluated (different letters within groups indicated significant differences between countries). Figure 6: Relative importance of do not castrate vs level of information about animal welfare depending on the country and group interest. Figure 7: Relative importance of do not castrate vs beliefs about the level of animal welfare and protection of pigs depending on the country and group of interest. Figure 8: Relative importance of do not castrate vs beliefs that there are more needs to be done by regulations to improve the level of welfare and protection of pigs depending on the country and group interest. Figure 9: Relative importance of do not castrate vs preferences for labelled meat from castrated pigs depending on the country and group interest. Figure 10: Relative importance of do not castrate vs price of non castrated pork higher than those from castrated one depending on the country and group interest. Figure 11: Relative importance of do not castrate vs justification of castration to improve the sensory quality of the meat depending on the country and group interest. Figure 12: Relative importance of do not castrate vs belief that males should not be castrated to not change the state of the animal depending on the country and group interest. Figure 13: Relative importance of do not castrate vs belief that castration of male pigs should not be done because it is painful depending on the country and group interest. INDEX OF TABLES Table 1: Number of consumers globally and by group of age.

ALCASDE, 2009 D.1.3.4
D134 – 51
1. Introduction The aim of this chapter is to study:
- The relative importance of the animal welfare by the consumers of different EU countries with respect to other aspects related with purchase fresh pork meat
- The relative importance of entire male production (do not castrate) by the consumers of different EU countries with respect to other pig production preferences and pig castration statements.
2. Materials and methods Results were considered by all the consumers together and by two subgroups of consumers:
- Between 25 and 29 years old and who are responsible for doing the shopping of fresh pork in their household
- Between 40 and 54 years old and who are responsible for doing the shopping of fresh pork in their household
These two groups of consumers were selected and studied separately because they are the responsibles for doing the shopping, which is of interest because they are those who decided if they will buy or not a product. Furthermore the groups of age were done according to the Eurobarometer group of ages. The total number of consumers studied in overall and by group in each country are showed in Table 1. It can be seen that in all the countries except in UK the percentage of consumers from the two studied groups is higher than 50%. The highest percentage is for Italy (76%) followed by Germany, the Netherlands and Spain (67, 62 and 60%, respectively). In France this percentage is slightly over the average (53%). Table 1: Number of consumers globally and by group of age.
Total 25-39 40-54
% purchase purchase DE 132 43 45 67 ES 138 33 50 60 FR 144 39 37 53 IT 140 40 66 76 NL 134 38 45 62 UK 147 24 42 45 217 285
Total 835 502 60 The relative importance of animal welfare with respect to other purchase aspects were obtained from Question 8. The average of the importance of animal welfare claims was obtained for each country. Moreover, for each country, the average of the scores given by the consumers to the other different aspects studies (convenience, brand, package type, origin, freshness, shelf life, odour, colour, fat content, price, nutritional claims, health, free range and others) was obtained. The difference between the two averages is the relative importance of animal welfare with respect to the other aspects.

D134 – 52
The same procedure was applied to obtain the relative importance of do not castrate or entire males production with respect to the other issues related to animal welfare considered in Question 12 (housing/living conditions, medical treatment, clean environment, healthy conditions, natural living conditions, less transportation, slaughtering, feed quality, space and outside access). To test for significance between countries or groups of age a GLM procedure of SAS (SAS Inst. Inc., Cary, NC, USA) was carried out with country or group of age as fixed effect. Tukey test was applied to test for significant differences between countries or groups of age. The relative importance of animal welfare and do not castrate (entire male production) was studied together with the opinion of the consumers about:
- How informed they are about animal welfare, especially in the production of pigs (Question 9) – translated to a scale from -4 (very informed) to -4 (nothing informed).
- If they believe that the level of animal welfare and protection of pigs within their country is poor of good (Question 10) – translated to a scale from -4 (very poor) to +4 (very good).
- If they believe that there are more needs to be done by regulations to improve the level of welfare and protection of pigs within their country (Question 11) – translated to a scale from -2 (no, certainly not) to +2 (yes, certainly).
Moreover the relative importance of do not castrate was studied together with the opinion of the consumers about different statements related to pig castration (Question 13) scores from -4 (not important) to +4 (very important):
- If consumers would like to see that meat from castrated pigs is labelled - If consumers considered that it is acceptable that pig meat from non-castrated pigs is
more expensive than the castrated one - If consumers think that castration of male piglets is justified because it improves
sensory quality of pig meat (taste and odour) - If consumers think pig males should not be castrated, because they believe that we
should not change the state of the animal - If consumers think that castration of male pigs is so painful that it shouldn’t be done

ALCASDE, 2009 D.1.3.4
D134 – 53
3. Results and discussion
3.1. Relative importance of animal welfare 3.1.1. Animal welfare with respect to the other purchasing aspects
The relative importance of animal welfare with respect to the other purchasing aspects by the overall group of consumers and by the two groups of consumers of interest is shown in Figure 1. It can be seen that in all the countries and for the two groups of interest animal welfare is less important than the average of other aspects considered. No significant differences (P>0.05) were found between countries when all the consumers were considered together and for purchasers consumers that belong in the older group. Nevertheless, for purchasers of the younger group, French consumers gave significantly (P<0.05) less importance to animal welfare than Spanish and German, and Dutch consumers gave less importance to animal welfare than the German ones. The group of younger purchasers gave less importance to animal welfare the older purchasers in all the countries except in Germany, although in Spain the difference between groups is very low. Nevertheless only in France and Italy these differences between groups of interest were significant (p<0.05).
Figure 1: Relative importance of animal welfare with respect to the other purchasing attributes evaluated (different letters within groups of age indicated significant differences between countries).

D134 – 54
3.1.2. Animal welfare vs information about animal welfare The relative importance of animal welfare (Question 8) compared with the level of information consumers think they have about animal welfare (Question 9) for the countries and groups of interest is shown in Figure 2. It can be seen that consumers from all the countries, except Germany, considered that they are poor informed about animal welfare issues. Although France presented a big difference in the relative importance of animal welfare by groups of interest, both groups considered to have a similar level of information about this issue, as well as in Germany. Even though young purchasers consumers from Italy and the Netherlands gave lower importance to animal welfare than the older ones, the level they considered have of information about this issue is similar in both groups of age. British consumers groups of interest presented the greatest difference about the level of information they have about animal welfare, the younger ones being less informed than the older ones. Spanish younger and older purchaser consumers had similar opinion in the level information they have and the importance they gave to animal welfare.
Figure 2: Relative importance of animal welfare vs level of information about animal welfare depending on the country and group interest.

ALCASDE, 2009 D.1.3.4
D134 – 55
3.1.3. Animal welfare vs level of welfare and protection The comparison between the importance of animal welfare (Question 8) with respect to the level of animal welfare and protection consumers think it exits in their own country (Question 10) can be seen in Figure 3. Except for French, older Spanish and younger Dutch consumers, there are beliefs that the level of animal welfare and pig protection is good. The Netherlands and Spain presented differences in the direction of the beliefs between younger and older purchaser consumers. In the Netherlands and Italy there were difference between groups of interest both, in the importance of welfare and the beliefs of level of welfare and protection. In France, United Kingdom and Germany there were differences between groups in the importance they gave to animal welfare but not in their belief of the level of welfare and protection. Finally, in Spain, there were few differences between groups in the importance they gave to animal welfare and the differences were more important when the beliefs of the level of animal welfare and protection of pigs were considered.
Figure 3: Relative importance of animal welfare vs beliefs about the level of animal welfare and protection of pigs depending on the country and group interest.
DE
ES
FR
IT
NL
UK
‐3.0
‐2.5
‐2.0
‐1.5
‐1.0
‐0.5
0.0
0.5
1.0
‐4 ‐3 ‐2 ‐1 0 1 2 3 4
Relative im
portan
ce of a
nimal welfare
Believe that the level of animal welfare and protection of pigs within country is very poor (‐4) to very good (+4)

D134 – 56
3.1.4. Animal welfare vs more needs to improve welfare by regulation The relative importance of animal welfare (Question 8) with respect to the belief of more needs to improve welfare by regulation (Question 11) is presented in Figure 4. Even all the consumers from all the countries gave low importance to animal welfare, all of them believe that there are more needs to be done by regulations to improve the level of welfare and protection of pigs. France is the country in which there are more differences between groups of consumers in the beliefs of more needs to be done by regulation. In the other countries, even in some of them the different group of consumers gave different importance to animal welfare, they did not believe differently about the needs to improve welfare by regulation.
Figure 4: Relative importance of animal welfare vs beliefs that there are more needs to be done by regulations to improve the level of welfare and protection of pigs depending on the country and group interest.
DEES
FR
IT
NLUK
‐3.0
‐2.5
‐2.0
‐1.5
‐1.0
‐0.5
0.0
0.5
1.0
‐2 ‐1 0 1 2
Relative im
portan
ce of a
nimal welfare
Believe that more needs to be done by regulations to improve the level of welfare and protection of pigs
(positive =yes and negative=no)
No, certainly not Not, probably not I don't know Yes, probably Yes, certainly
ALCASDE, 2009 D.1.3.4
D134 – 57
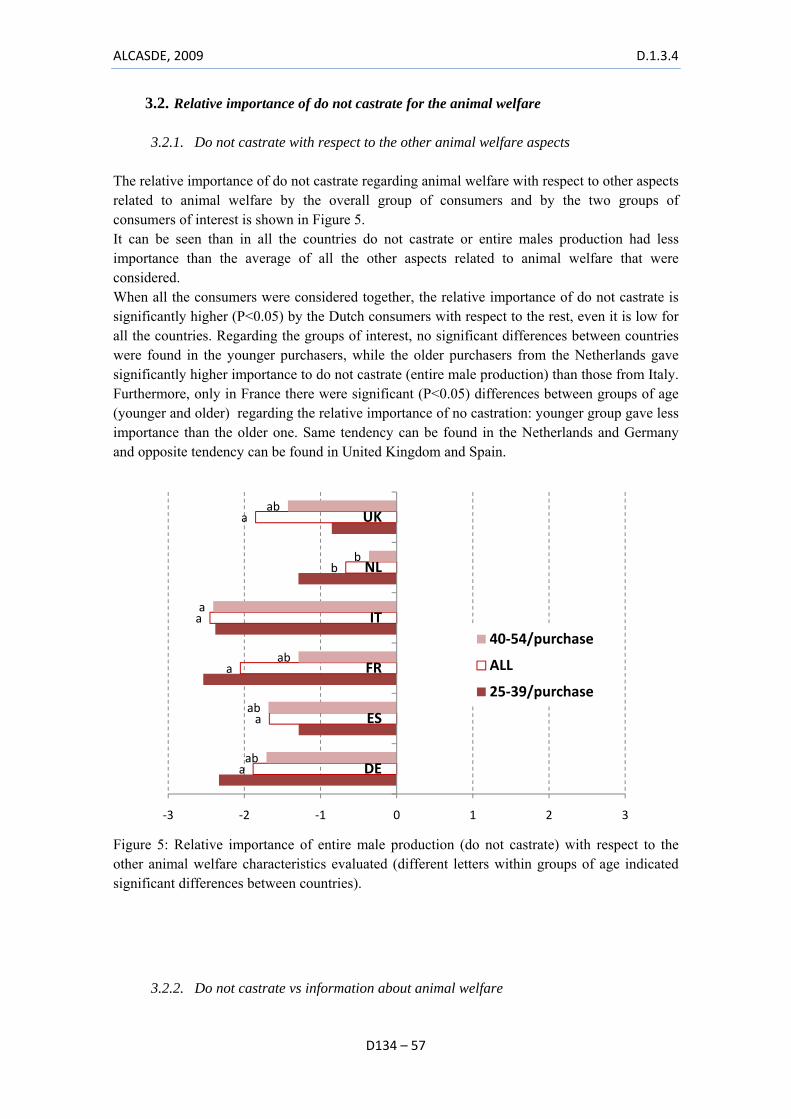
3.2. Relative importance of do not castrate for the animal welfare
3.2.1. Do not castrate with respect to the other animal welfare aspects The relative importance of do not castrate regarding animal welfare with respect to other aspects related to animal welfare by the overall group of consumers and by the two groups of consumers of interest is shown in Figure 5. It can be seen than in all the countries do not castrate or entire males production had less importance than the average of all the other aspects related to animal welfare that were considered. When all the consumers were considered together, the relative importance of do not castrate is significantly higher (P<0.05) by the Dutch consumers with respect to the rest, even it is low for all the countries. Regarding the groups of interest, no significant differences between countries were found in the younger purchasers, while the older purchasers from the Netherlands gave significantly higher importance to do not castrate (entire male production) than those from Italy. Furthermore, only in France there were significant (P<0.05) differences between groups of age (younger and older) regarding the relative importance of no castration: younger group gave less importance than the older one. Same tendency can be found in the Netherlands and Germany and opposite tendency can be found in United Kingdom and Spain.
Figure 5: Relative importance of entire male production (do not castrate) with respect to the other animal welfare characteristics evaluated (different letters within groups of age indicated significant differences between countries).
3.2.2. Do not castrate vs information about animal welfare
a
a
a
a
b
a
ab
ab
ab
a
b
ab
‐3 ‐2 ‐1 0 1 2 3
DE
ES
FR
IT
NL
UK
40‐54/purchase
ALL
25‐39/purchase

D134 – 58
The relative importance of do not castrate (Question 12) compared with the level of information consumers think they have about animal welfare (Question 9), translated to a scale from -4 to +4, for the countries and groups of interest can be seen in Figure 6. The importance of do not castrate (entire male production) is lower by all the consumers, although only some of them (the German ones) considered to be informed about animal welfare issues. Not big differences can be found between groups of ages regarding the level of information they had about animal welfare, even in some countries there are differences about the importance of entire male production between groups of age. It can be seen that, except for France, where the different group of consumers are mixed with the Spanish and Italian ones, in all the other countries all the groups of consumers are place together and it is easy to separate perfectly the countries in the different areas of the plot.
Figure 6: Relative importance of do not castrate vs level of information about animal welfare depending on the country and group interest.
DE
ES
FR
IT
NL
UK
‐3.0
‐2.5
‐2.0
‐1.5
‐1.0
‐0.5
0.0
0.5
1.0
‐4 ‐3 ‐2 ‐1 0 1 2 3 4
Relative im
portan
ce of e
ntire male prod
uc tion
How informed are you about animals welfare, especially in the production of pigs (‐4: nothing to +4: very informed)
ALCASDE, 2009 D.1.3.4
D134 – 59
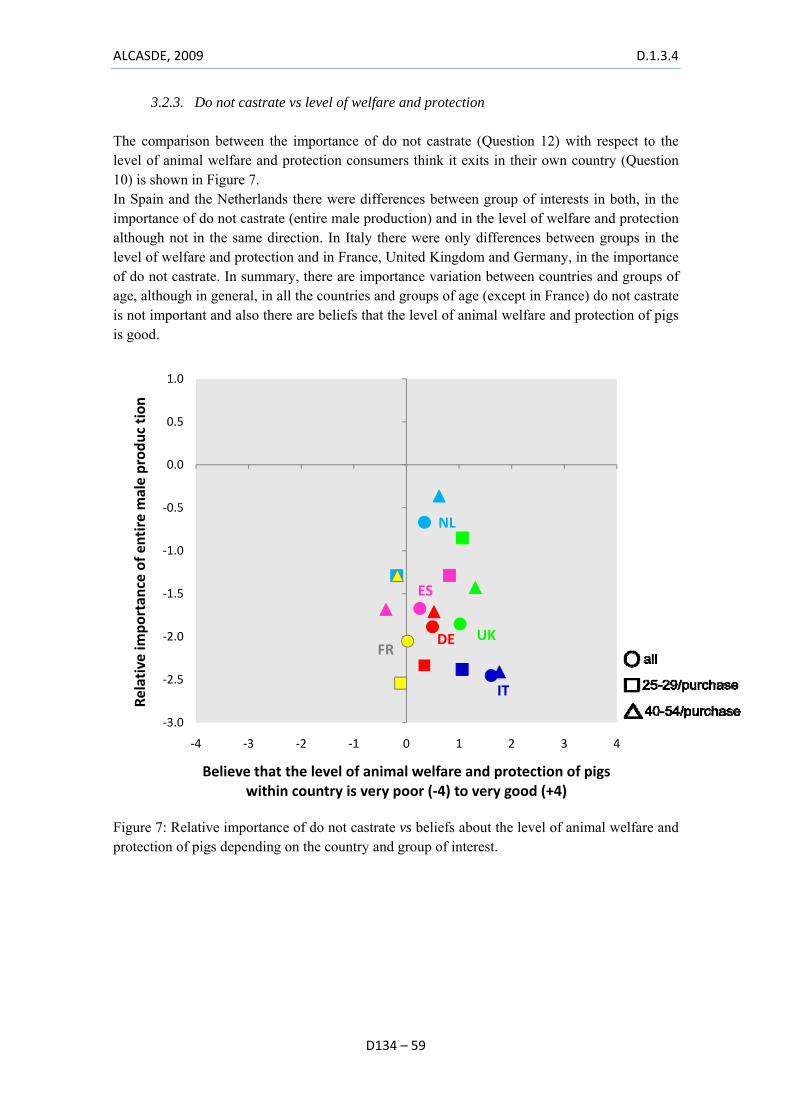
3.2.3. Do not castrate vs level of welfare and protection The comparison between the importance of do not castrate (Question 12) with respect to the level of animal welfare and protection consumers think it exits in their own country (Question 10) is shown in Figure 7. In Spain and the Netherlands there were differences between group of interests in both, in the importance of do not castrate (entire male production) and in the level of welfare and protection although not in the same direction. In Italy there were only differences between groups in the level of welfare and protection and in France, United Kingdom and Germany, in the importance of do not castrate. In summary, there are importance variation between countries and groups of age, although in general, in all the countries and groups of age (except in France) do not castrate is not important and also there are beliefs that the level of animal welfare and protection of pigs is good.
Figure 7: Relative importance of do not castrate vs beliefs about the level of animal welfare and protection of pigs depending on the country and group of interest.
DE
ES
FR
IT
NL
UK
‐3.0
‐2.5
‐2.0
‐1.5
‐1.0
‐0.5
0.0
0.5
1.0
‐4 ‐3 ‐2 ‐1 0 1 2 3 4
Relative im
portan
ce of e
ntire male prod
uc tion
Believe that the level of animal welfare and protection of pigs within country is very poor (‐4) to very good (+4)

D134 – 60
3.2.4. Do not castrate vs more needs to improve welfare by regulation The relative importance of do not castrate (Question 12) with respect to the belief of more needs to improve welfare by regulation (Question 11) is presented in Figure 4. The differences between the two groups of interest are bigger when the importance of entire male production than when the beliefs of more needs to improve welfare by regulation was considered in all the countries except in Italy were there were no differences between groups in any of the two aspects considered.
Figure 8: Relative importance of do not castrate vs beliefs that there are more needs to be done by regulations to improve the level of welfare and protection of pigs depending on the country and group interest.
DE
ES
FR
IT
NL
UK
‐3.0
‐2.5
‐2.0
‐1.5
‐1.0
‐0.5
0.0
0.5
1.0
‐2 ‐1 0 1 2
Relative im
portan
ce of e
ntire male prod
uction
Believe that more needs to be done by regulations to improve the level of welfare and protection of pigs
(positive =yes and negative=no)
No, certainly not Not, probably not I don't know Yes, probably Yes, certainly

ALCASDE, 2009 D.1.3.4
D134 – 61
3.2.5. Do not castrate vs label meat from castrated pigs Figure 9 shows the relation between the relative importance of do not castrate (Question 12) and the beliefs of the consumers that meat from castrated pigs is labeled (Question 13_2). It can be seen than the two Dutch groups of interest are the most different considering both aspects together with respect to the other countries. In Italy, France, Germany and the Netherlands the difference between the two groups, related to the labeling of meat from castrated pigs is important. Older purchaser consumers prefer more to have meat from castrated labeled than the younger purchaser ones. In United Kingdom and Spain these differences are less important.
Figure 9: Relative importance of do not castrate vs preferences for labelled meat from castrated pigs depending on the country and group interest.
DE
ESFR
IT
NL
UK
‐3.0
‐2.5
‐2.0
‐1.5
‐1.0
‐0.5
0.0
0.5
1.0
‐4 ‐3 ‐2 ‐1 0 1 2 3 4
Relative im
portan
ce of e
ntire male prod
uction
I would like to see that meat from castrated pigs is labelled(‐4: strongly disagree to +4: strongly agree)

D134 – 62
3.2.6. Do not castrate vs non-castrated pork more expensive than castrated pork The relationship between the relative importance of do not castrate (Question 12) with respect to if consumers found acceptable that pig meat from non-castrated pigs is more expensive than the castrated one (Question 13_4) is shown in Figure 10. It can be seen that even consumers do not give a big importance to do not castrate, they do not have a clear opinion about if it is acceptable that pig meat from entire males is more expensive than those from castrated. There is the exception of France, where consumers, specially the younger ones would not find acceptable to pay more for non-castrated pig meat and the younger German and older British consumers who would find acceptable to pay more for non-castrated pork.
Figure 10: Relative importance of do not castrate vs price of non castrated pork higher than those from castrated one depending on the country and group interest.
DE
ES
FR
IT
NL
UK
‐3.0
‐2.5
‐2.0
‐1.5
‐1.0
‐0.5
0.0
0.5
1.0
‐4 ‐3 ‐2 ‐1 0 1 2 3 4
Relative im
portan
ce of e
ntire male prod
uction
It is acceptable that pig meat from non castrated pigs is more expensive than the castrated one
(‐4: strongly disagree to +4: strongly agree)

ALCASDE, 2009 D.1.3.4
D134 – 63
3.2.7. Do not castrate vs justified castration to improve the sensory quality of the meat Figure 11 showed the relation between the relative importance of do not castrate (Question 12) and the fact that castration of male piglets is justified because it improves sensory quality of pork (Question 13_5). All the consumers in United Kingdom, the older purchasers in Spain, and the younger and all in France, even considered do not castrated as not important, they would not find it justified to improve sensory quality. In United Kingdom almost all the male pigs are entire and in Spain around 67% of the pigs are entire (Frederiksen et al., 2009) and this could explain, in part, this results. Most of the other consumers and group of consumers considered castration is justified to improve sensory quality of pig meat, although they gave low importance to do not castrate. In Italy is where the difference between the older and younger consumers is more important regarding the belief that castration is justified to improve sensory quality of pigs, even no differences in the two groups of age can be found in the importance they gave to do not castrate with respect to animal welfare production issues.
Figure 11: Relative importance of do not castrate vs justification of castration to improve the sensory quality of the meat depending on the country and group interest.
DE
ES
FR
IT
NL
UK
‐3.0
‐2.5
‐2.0
‐1.5
‐1.0
‐0.5
0.0
0.5
1.0
‐4 ‐3 ‐2 ‐1 0 1 2 3 4Relative im
portan
ce of e
ntire male prod
uction
Castration of male piglets is justified because it improves sensory quality of pig meat
(‐4: strongly disagree to +4: strongly agree)

D134 – 64
3.2.8. Do not castrate vs belief that males should not be castrated to not change the state of the animal
The relationship between the relative importance of do not castrate (Question 12) with respect to if consumers think pig males should not be castrated, because they believe that we should not change the state of the animal (Question 13_6) is shown in Figure 12. Even all the consumers in all the countries gave low importance to the fact that pigs are not castrated; all of them considered that they should not be castrated to not change the state of the animal. Regarding the last aspect, the biggest differences between the two groups of interest can be found in the Netherlands: the older ones agree more in let the males’ entire than younger one to avoid change the state of the animal. It can be seen a tendency that the more importance to do not castrate the most agree to the fact that we should not castrated to not change the state of the animal.
Figure 12: Relative importance of do not castrate vs belief that males should not be castrated to not change the state of the animal depending on the country and group interest.
DE
ES
FR
IT
NL
UK
‐3.0
‐2.5
‐2.0
‐1.5
‐1.0
‐0.5
0.0
0.5
1.0
‐4 ‐3 ‐2 ‐1 0 1 2 3 4
Relative im
portan
ce of e
ntire male prod
uction
I think pig males should not be castrated, because I believe that we should not change the state of the animal
(‐4: strongly disagree to +4: strongly agree)

ALCASDE, 2009 D.1.3.4
D134 – 65
3.2.9. Do not castrate vs belief that castration of male pigs should not be done because it is painful
The relationship between the relative importance of do not castrate (Question 12) with respect to if consumers think pig males should not be castrated, because they believe that castration is so painful (Question 13_7) is shown in Figure 13. It can be seen than even with a low level, older purchaser Italian consumer and all the Italian consumers considered in overall are the only ones that disagree in the fact that castration is painful and should not be done. Looking at the plot a tendency can be seen, as more importance consumer gave to entire male production, more agree in the fact that castration is so painful as should not be done. With respect to the groups of interest, older ones agree more to the fact that castration is painful and should be avoided than younger ones except in Italy were the result is the opposite and in United Kingdom were the opinion was more or less the same between groups of interest.
Figure 13: Relative importance of do not castrate vs belief that castration of male pigs should not be done because it is painful depending on the country and group interest.
DEES
FR
IT
NL
UK
‐3.0
‐2.5
‐2.0
‐1.5
‐1.0
‐0.5
0.0
0.5
1.0
‐4 ‐3 ‐2 ‐1 0 1 2 3 4
Relative im
portan
ce of e
ntire male prod
uction
Castration of male pig is so painful that I think it shouldn't be done (‐4: strongly disagree to +4: strongly agree)

D134 – 66
4. Conclusions The aim of the work was to study the attitudes of the consumers of the different countries towards animal welfare and entire male production (do not castrate). In the conditions of the experiment it can be concluded that:
- Animal welfare is less important from the consumer’s point of view when compared with other purchasing fresh pork aspects related mainly with meat characteristics. - Do not castrate is less important for the animal welfare than other aspects related mainly on management of the pigs. - Consumers consider having little information about different aspects related to animal welfare but although in general they think that there are good levels of animal welfare in their country they consider that regulations should be improved. - Younger and older purchasers do not have the same preferences or beliefs in the different countries and a pattern cannot be seen. However, more research is needed. - In general consumers agree in avoiding castration for different reasons such as not change the natural state of the animal and painfulness. In contrast with this, they would find castration justified to improve the sensory quality of the meat (except in United Kingdom). - Consumers would like meat from castrate to be labelled. - Consumers do not know if pork from non-castrated should be more expensive.
5. References Frederiksen, B., Font i Furnols, M., Lundström, K., Migdal, W., Prunier, A., Tuyttens, F., Bonneau, M. (2009). Practice and castration of piglets in Europe. Animal 3(11):1480-1487.

ALCASDE, 2009 D.1.3.4
D134 – 67
CONSUMER ACCEPTANCE OF BOAR TAINT AND THE CONSEQUENCES


ALCASDE, 2009 D.1.3.4
69
Table of contents: 1. Introduction 2. Materials and Methods 2.1 Selection Meat samples 2.2 Selection of consumers 2.3 Description Phase 2; Sensory test 2.4 Description Phase 3; Kitchen session 3. Results 3.1 Sample consumers 3.2 Sample meat 3.3 Sensory test 3.4 Kitchen session 4. Conclusion 5. Discussion on Phase 2 and 3 and Sensitivity test Appendixes Appendix 1 Meat sampling and detection protocol for Phase 2 and 3 Appendix 2 Cooking protocol Phase 2 Appendix 3 Questionnaire Sensory test Appendix 4 Questionnaire Kitchen session


ALCASDE, 2009 D.1.3.4
D134 – 71
1. Introduction Castration of pig meat is from society viewpoint no longer acceptable in some countries in the EU. Non-castration has however the risk of meat with boar taint, unless presales testing of the meat is confidential. At this moment meat testing is only partly confidential. Therefore the risk that consumers buy meat with boar taint is still existing. Therefore the aim of this part of the study was to gain insight into:
- consumer acceptance of meat with boar taint and - the potential impact of this acceptance on the purchasing behaviour of pork of the
European consumer. This aim was made operational by a sensory test and a kitchen session. In the sensory test the acceptability of the taste and odour of prepared pig meat was measured for three types of meat: tainted boar meat, boar meat without boar taint and gilt meat. Since this was done in six participating countries (the Netherlands (NL), Germany (DE), United Kingdom (UK), France (FR), Italy (IT), Spain (ES)) differences between consumer acceptance among consumers in these countries was measured as well. Consumers assessed in a blind test the taste and odour of tainted boar meat, boar meat without boar taint and gilt meat. All the samples were chemically tested on androstenone and skatole levels before the test, so that the consumer perception would be related to the skatole and androstenone levels of the meat. In the kitchen session the cooking experience of meat with boar taint was approached by inviting people in the kitchen while a cook was preparing tainted boar meat. After this exposure, consumers were asked their perceptions of the quality of the meat and the consequences on serving and purchasing pig meat and revisiting the shop were the meat was bought. This report gives the results of the two above mentioned research activities. 2. Materials and Methods 2.1 Selection Meat samples For the sensory test meat from boars detected for boar taint (in short detection+ meat), boars not detected for taint (detection– meat) and gilts was used. For the kitchen session meat from boar detection+ was used. All samples used were tested chemically in a reputable lab before the consumer test. The meat used for the tests in the Netherlands, Germany (Dutch meat), Spain and the United Kingdom was tested by CCL in the Netherlands. The meat used for France and Italy (French meat) was tested by ALP in Switzerland. On basis of the chemical tests meat was selected as tainted meat and meat without boar taint. After the chemical tests the methods used in both labs were made comparable, so that the results of the tests could be matched. The following selection criteria for boar taint was used:
• The borders of detection + boar meat were: a) Androstenone > 1 µg/g melted fat b) Skatole > 0.2 µg/g melted fat c) Androstenone > 0.5 µg/g melted fat and skatole > 0.15 µg/g melted fat

D134 – 72
• The borders of detection –boar meat were: a) Androstenone < 0.5 µg/g melted fat and skatole < 0.15 µg/g melted fat
For all meat samples the following additional qualifications were used:
- farms where the animals were not castrated; - animals used have to be an a select selection of the breedings used in the specific
countries and/or the meat that was normally exported to the country of research; - animals used have to be an a select selection of what was normally available in the
supermarket, i.e. within the usual weight class and quality available in retail outlets; - as many farms as practically possible in order to ensure as much diversity as possible in
the supply. The exact sampling and detection methods were described in the meat sampling and detection protocol in Appendix 1. 2.2 Selection of consumers For this study, a group of consumers was selected which was representative for the population in the research country as a whole in order to enable practical extrapolation of the results. The sample consisted of 130 consumers per country, who were subjected to a complete series of tests (Phase 1 till Phase 4) as follows: The aim was to be to realize a 50/50 ratio between men and women. However, as men are less sensitive, in terms of their ability to detect the odour of boar taint, a slight overrepresentation of women was considered acceptable. Although the percentage of men was tried to be equal to at least 25% of the overall sample. The research was done in an urban and a more suburban environment, if possible. In each environment at least 50 respondents have to be reached. All of the respondents should eat pork at least once a month, have to be (partly) responsible for cooking in their household and (partly) responsible for the groceries in their household. All results from the tests in Phase 1 to 4 and the lab results on androstenone and skatole levels in meat were to be connected on respondent level. 2.3 Description Phase 2; Sensory test Cooking protocol The meat was cooked to ensure food safety was guaranteed and the protocol was followed professionally. The meat pieces were cut in two samples, which were of equal size. The meat was salted after cooking with 1 gram salt per 200 gram meat. See for the exact protocol and desired appearance of the meat presented in Appendix 2 Cooking protocol Phase 2. Sensory evaluation conditions The consumers sit in a sensory perception area, each in his or her individual cabin, and 3 different pieces of meat (via a hatch) were given, each of which they are asked to evaluate separately. In case it was not possible to do this in cabins, consumers were given separate tables. During the testing the room was completely silent. The duration of the test was 30 minutes.

ALCASDE, 2009 D.1.3.4
D134 – 73
In this phase, blade pork chops loin of 3 types were submitted and evaluated in terms in general, on taste, odour and mouth feeling:
1) boar meat detection+ 2) boar meat detection– and 3) gilt meat
The order of presentation was randomised. Questionnaire Appendix 3 contains the list of questions consumers had to answer for each of the three pieces of meat. Consumers indicated their perception of the 11 quality aspects on a 9-points scale, without the 5. The 5 was left out to make sure that consumers made a decision either in positive or in negative way about the meat. 2.4 Description Phase 3; Kitchen session Cooking protocol and sensory evaluation conditions The respondents were taken into a kitchen where two samples detection+ meat were prepared of two different animals. The cooking procedure for this part of the test was the same as for the sensory test. The consumers were asked only to watch the preparation and the meat was not served to the respondents the respondents. So it was only the goal to get insights in the odour perception of the meat and not of the taste of the meat. During preparation the respondents were not allowed to make any comments while they were smelling and evaluating the odour of the meat and looking at it. After the preparation the respondents were asked to return to their individual cabins and to complete a questionnaire in which they were asked to give their opinion regarding the meat that was being prepared and to explain what they would do if they were at home preparing the same kind of meat. Questionnaire See Appendix 4 for details of the questionnaire. Consumers were to indicate their perception of the 5 quality aspects on a 9-points scale (without a 5). If consumers indicated that the odour was ‘abnormal’, they had to explain why. Questions on serving, purchasing the meat and revisiting the shop were yes/no questions. 3. Results 3.1 Sample consumers The consumer sample was identical to the sample of the attitude test and reported in that part of the report. 3.2 Sample meat The chemical qualifications for the meat used for the tests in the different countries are described in table 1.

D134 – 74
Tabel 1 Mean androstenone and skatole levels and standard deviation in pure/melted fat (µg/g) Country Level Gilt Dect + Dect - FR and IT Androstenone <0.2 2.39 ± 1.07 <0.2 Skatole <0.03 0.11 ± 0.07 <0.03 ES and UK Androstenone <0.01 1.07 ± 0.401 0.20 ± 0.069
Skatole
0.04 ± 0.018 0.18 ± 0.071 0.06 ± 0.020
NL(2) and DE
Androstenone <0.04
GE 2.39 +/- 1.54 NL 2.68 +/- 1.35
GE 0.19 +/- 0.17 NL 0.26 +/- 0.14
Skatole
0.03 +/- 0.009
GE 0.26 +/- 0.17 NL 0.16 +/- 0.16
GE 0.05 +/- 0.02 NL 0.07 +/- 0.02
As the table shows in ES and the UK meat with a relative low average androstenone level was used for the test. The meat in Germany is relatively high on skatole. The animals used are however representative for the Dutch meat that is exported from the Netherlands to Germany. 3.3 Sensory test The samples with the above mentioned chemical characteristics were rated by the respondents. Consumers were randomised and received meat in the order:
- Detection -, Detection+, Gilt - Detection -, Gilt, Detection+ - Gilt, Detection -, Detection+
Detection+ was never served at first. Figure 1 shows the results on the ratings on:
- how delicious the meat was - how the odour of the meat was perceived - how the taste of the meat was perceived - whether they perceived an abnormal odour - whether they perceived an abnormal taste.
All other questions were asked as possible explanation of these base perceptions.
Germany differences
60708090
100110120130140150
Delicious Odour Taste Abnormalodour
Abnormaltaste
Question
Differen
ce to Gilt in
%
Gilt
Detection+
Detection‐
Netherlands differences
60708090
100110120130140150
Delicious Odour Taste Abnormalodour
Abnormaltaste
Question
Differen
ce to Gilt in
%
Gilt
Detection+
Detection‐

ALCASDE, 2009 D.1.3.4
D134 – 75
Figure 1 Differences in terms of percentage with respect to the gilt scores (100%) in the different countries. In the analysis the qualification of gilt meat, was used as benchmark and stated as 100. This approach was used since earlier research shows that the perception of gilt meat determines the perception of detection+ meat. E.g. if a consumer rates gilt meat with a 9-score, detection+ meat is rated some points lower on average. Since that is the case, averages on boar meat ratings do not give a proper indication of the satisfaction level of consumers with the meat. Figure 1 shows the deviations in rating from detection+ and detection- meat from the ratings of gilt meat. In nearly all countries detection+ meat was rated lower than gilt meat on deliciousness, odour and taste. Next to that detection+ meat had on average a more abnormal taste and odour in most countries. Figure 1 shows additionally that in ES and UK detection+ meat was rated on average nearly the same as gilt meat. This could be explained by the lower androstenone levels of the meat used in ES and UK. The meat in DE had a high androstenone and skatole level, but hardly any differences were perceived. More research is needed however with a continuous scale of androstenone to define whether the baseline for detection of androstenone by consumers is really between 1 and 2 (µg/g melted fat). Next to that there seemed to be differences in acceptance of boar taint among countries. In DE meat with the highest androstenone levels and relatively the highest skatole levels was tested, while the differences with gilt meat were relatively low, in relation to other countries. In FR and IT samples from the same animals were tested, while the detection+ samples in IT were rated lower in relation to gilts than in FR. Therefore the Italian consumers seemed to be more sensible for boar taint than French consumers. The same goes for ES and UK. In these countries samples from the same animals were tested and in UK they were rated differently than in ES. The differences were however not as large as between IT and FR. Do consumers perceive the quality of gilt, detection+, detection- and gilt meat as different?
France differences
60708090
100110120130140150
Delicious Odour Taste Abnormalodour
Abnormaltaste
Question
Differen
ce to Gilt in
%
Gilt
Detection+
Detection‐
Italy differences
60708090
100110120130140150
Delicious Odour Taste Abnormalodour
Abnormaltaste
Question
Differen
ce to Gilt in
%
Gilt
Detection+
Detection‐
Spain differences
60708090
100110120130140150
Delicious Odour Taste Abnormalodour
Abnormaltaste
Question
Differen
ce to Gilt in
%
Gilt
Detection+
Detection‐
UK differences
60708090
100110120130140150
Delicious Odour Taste Abnormalodour
Abnormaltaste
Question
Differen
ce to Gilt in
%
Gilt
Detection+
Detection‐

D134 – 76
To answer this question, it was tested if the differences in the appreciation of the meat types were significant per country. Results to questions items 1, 2, and 3 were added up to create one overall item for the appreciation of the meat quality. Table 2 shows the results. Table2 Do consumers appreciate the overall quality differently? Det+ and Gilt Det- and Gilt Det+ and Det- FR Yes No Yes IT Yes No Yes GE No Yes Yes NL Yes Yes No SP No Yes Yes UK No Yes Yes Test: Paired sample t-test, sign differences (p < 0.1) This table shows that only in FR, IT and NL significant differences were found between the consumer perception of tainted boar meat and gilt meat. This can be explained by the fact that in ES and UK tainted boar meat with relatively low androstenone and skatole levels was used. Despite high values of androstenone and skatole, the DE rates showed no significant differences. Only in NL no significant differences were found between tainted boar meat and boar meat without boar taint. This implicates that in most countries with high androstenone and skatole levels (respectively >2 µg/g melted fat and >0,15 µg/g melted fat), consumers perceived differences. Explaining the perceived quality of the detection+ pork In first instance several OLS regressions were conducted to understand which variables could explain the differences in overall quality perception, abnormal taste and abnormal odour between the different types of meat. However, these outcomes resulted in adjusted R squares which were too low to be of any value to present here. This implicates that there were no valid relations to be found between the scores of the consumers and the androstenone levels, skatole levels and personal characteristics of the consumers. In addition a model was developed for explaining the perceived quality of detection+ pork. The model was developed using the different sets of available variables. This model helps to understand which consumer and pork characteristics affect the perceived quality of the detection+ meat. The following sets of variables were considered: Domain specific consumer differences, which included the perceived quality dimension of gilt meat. We found an underlying quality dimension in the first test. The perceived quality of gilt for this dimension was assumed to be a baseline quality perception. Earlier tests showed that if consumers who perceive gilt meat as being of higher quality in comparison with other consumers, would also perceive detection+ meat as of higher quality. In addition to this baseline measure, the consumers’ attitudes towards health and price importance were included into the models. General consumer differences, which included gender, age, and low SES. The latter was operationalized by including low education and low income into the models.

ALCASDE, 2009 D.1.3.4
D134 – 77
Meat differences, which included the strength of the odour, the abnormality of the odour, taste strength; scores on salty taste, meaty taste, fatty taste, and abnormal taste the strength of the taste, the salty perception of the taste, fatness of the taste; Pork differences, which included the levels of on indole, skatole, and androstenone. We used OLS-regressions to see which explanatory information helped to understand the consumers quality perception of detection+ meat. The following model-building strategy was used: first the full models for each country was estimated, after which variables that showed an t-statistic value of 1.65 or lower (this correspond to the 10% significance level) were discarded. Then, re-estimates of the models were made and compare the outcomes among all European countries. Consequently a new model was built that contains all the variables which were significant in at least 2 of the 6 datasets. For cross-country comparisons it was important that the same model structure was used for each country, but not every variable may be of equal importance for each country. Finally, the new and consistent model was estimated over all six datasets. Given the large number of intermediate models, not all of them are presented. The results of the final and consistent model is given in Table 3. Table 3. What contributes to the quality perception of detection+ meat? FR DE IT NL ES UK Intercept 5.037 8.103 5.518 6.656 4.700 6.117 Baseline quality perception .261 .012 .144 .124 .404 .116 Abnormal taste -.226 -.430 -.236 -.508 -.205 -.325 Abnormal odour -.231 -.247 -.138 -.020 -.024 .102 Adjusted R-square .31 .49 .18 .35 .23 .09 Note: All bold figures significant at the 10% level. The adjusted R-squares indicated that there was an excellent fit among most of the countries. It was interesting to see that the only variable of relevance from the set of domain-specific consumer differences was the baseline quality perception (for gilt). From the set of meat differences the items ‘abnormal odour’ (question item 6) and ‘abnormal taste’ (question item 11), were of relevance for the quality perception. Both lead to a lower quality score, meaning that the higher more abnormal the odour and taste the lower the quality. 3.4Kitchen session While two samples of meat detection+ were prepared in the test room kitchen, consumers were invited to watch the preparation. They were invited to smell the meat and look at the meat during preparation. Afterwards some questions were asked about the perception of the meat just prepared. The consumers were asked to rate the meat on expected deliciousness and odour on a 9-point scale, where 9 was very good and 1 was bad. Figure 2 presents the results on these aspects.

D134 – 78
Figure 2. Average consumer judgment per question in the kitchen session in the different countries. Figure 2 shows that the expectations of the taste of the meat were just acceptable on average in IT, DE and NL. In FR, ES and UK the expected taste of the meat was rated slightly higher. Since in all countries the same meat was used as in the sensory test, one must notice that the androstenone levels of the meat were relatively low in UK and ES. In DE and NL an odour was perceptible, while in other countries the odour was not so strong. In FR and NL an unpleasant odour was detected, while in all other countries the pleasantness of the odour was just acceptable or normally. For DE this was striking, since the respondents state that they detect a relatively strong odour. In ES and UK the odour of the meat was rated as normal, while in other countries they smelt deviations from a normal odour. This could be related to the number of consumers who perceived something abnormal on the meat.
4567
Consum
er kitchen
judgmen
t
France
4567
Consum
er kitchen
judgmen
t
Italy
4
5
6
7
Consum
er kitchen
judgmen
t
Germany Netherlands
4
4.5
5
5.5
6
6.5
7
Delicioustaste
Pleasantodour
Odourstrenght
Pork odour Normalodour
Cons
umer
kitch
en ju
dgm
ent
44.55
5.56
6.57
Consum
er kitchen
judgmen
t
Spain
44.55
5.56
6.57
Consum
er kitchen
judgmen
t
UK
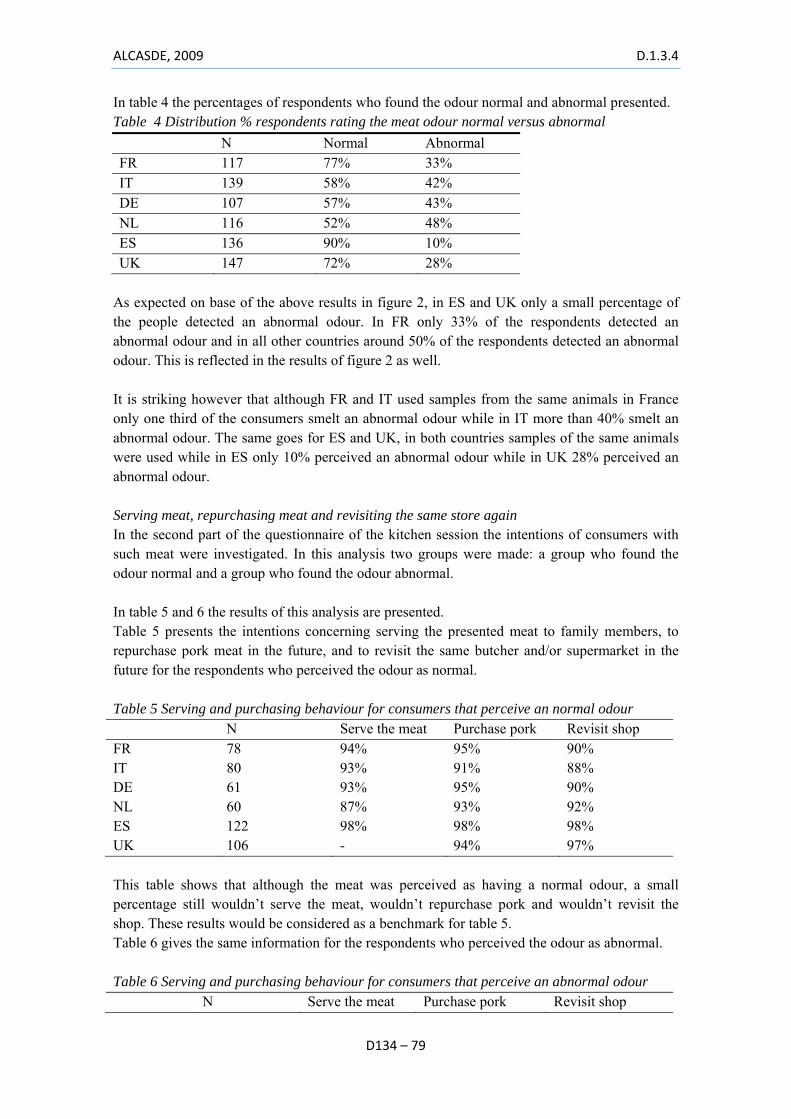
ALCASDE, 2009 D.1.3.4
D134 – 79
In table 4 the percentages of respondents who found the odour normal and abnormal presented. Table 4 Distribution % respondents rating the meat odour normal versus abnormal N Normal Abnormal FR 117 77% 33% IT 139 58% 42% DE 107 57% 43% NL 116 52% 48% ES 136 90% 10% UK 147 72% 28%
As expected on base of the above results in figure 2, in ES and UK only a small percentage of the people detected an abnormal odour. In FR only 33% of the respondents detected an abnormal odour and in all other countries around 50% of the respondents detected an abnormal odour. This is reflected in the results of figure 2 as well. It is striking however that although FR and IT used samples from the same animals in France only one third of the consumers smelt an abnormal odour while in IT more than 40% smelt an abnormal odour. The same goes for ES and UK, in both countries samples of the same animals were used while in ES only 10% perceived an abnormal odour while in UK 28% perceived an abnormal odour. Serving meat, repurchasing meat and revisiting the same store again In the second part of the questionnaire of the kitchen session the intentions of consumers with such meat were investigated. In this analysis two groups were made: a group who found the odour normal and a group who found the odour abnormal. In table 5 and 6 the results of this analysis are presented. Table 5 presents the intentions concerning serving the presented meat to family members, to repurchase pork meat in the future, and to revisit the same butcher and/or supermarket in the future for the respondents who perceived the odour as normal. Table 5 Serving and purchasing behaviour for consumers that perceive an normal odour N Serve the meat Purchase pork Revisit shop FR 78 94% 95% 90% IT 80 93% 91% 88% DE 61 93% 95% 90% NL 60 87% 93% 92% ES 122 98% 98% 98% UK 106 - 94% 97% This table shows that although the meat was perceived as having a normal odour, a small percentage still wouldn’t serve the meat, wouldn’t repurchase pork and wouldn’t revisit the shop. These results would be considered as a benchmark for table 5. Table 6 gives the same information for the respondents who perceived the odour as abnormal. Table 6 Serving and purchasing behaviour for consumers that perceive an abnormal odour N Serve the meat Purchase pork Revisit shop
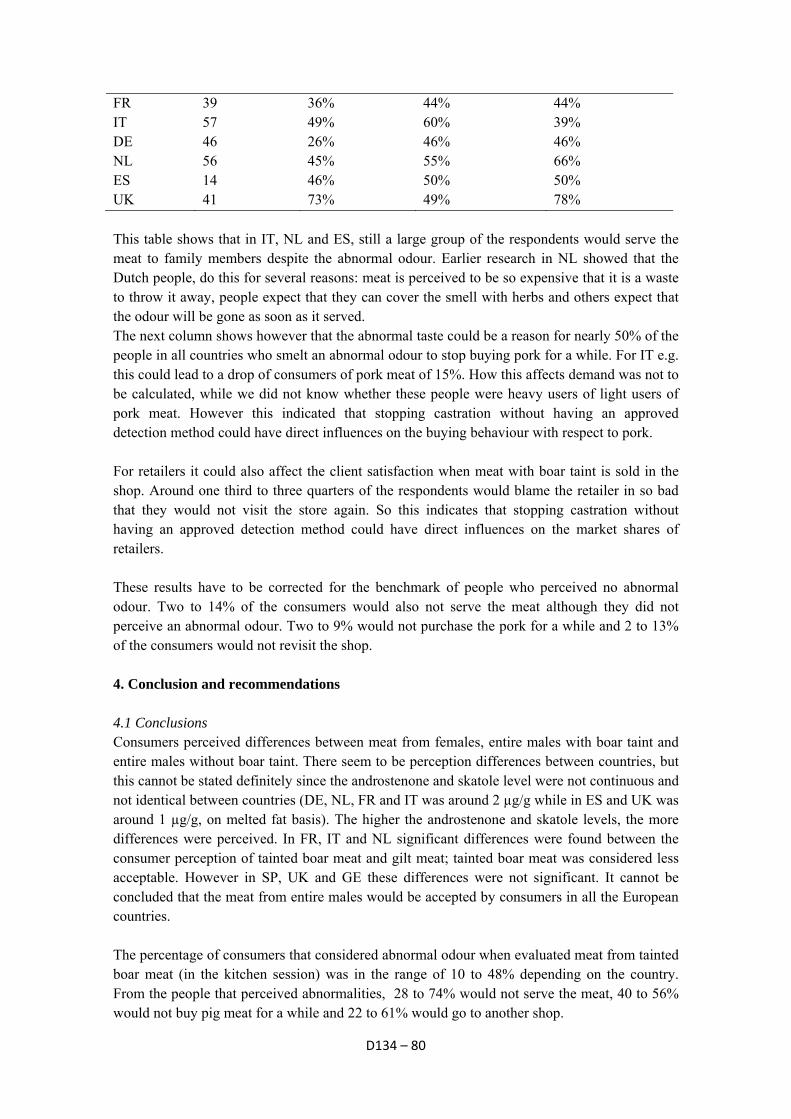
D134 – 80
FR 39 36% 44% 44% IT 57 49% 60% 39% DE 46 26% 46% 46% NL 56 45% 55% 66% ES 14 46% 50% 50% UK 41 73% 49% 78% This table shows that in IT, NL and ES, still a large group of the respondents would serve the meat to family members despite the abnormal odour. Earlier research in NL showed that the Dutch people, do this for several reasons: meat is perceived to be so expensive that it is a waste to throw it away, people expect that they can cover the smell with herbs and others expect that the odour will be gone as soon as it served. The next column shows however that the abnormal taste could be a reason for nearly 50% of the people in all countries who smelt an abnormal odour to stop buying pork for a while. For IT e.g. this could lead to a drop of consumers of pork meat of 15%. How this affects demand was not to be calculated, while we did not know whether these people were heavy users of light users of pork meat. However this indicated that stopping castration without having an approved detection method could have direct influences on the buying behaviour with respect to pork. For retailers it could also affect the client satisfaction when meat with boar taint is sold in the shop. Around one third to three quarters of the respondents would blame the retailer in so bad that they would not visit the store again. So this indicates that stopping castration without having an approved detection method could have direct influences on the market shares of retailers. These results have to be corrected for the benchmark of people who perceived no abnormal odour. Two to 14% of the consumers would also not serve the meat although they did not perceive an abnormal odour. Two to 9% would not purchase the pork for a while and 2 to 13% of the consumers would not revisit the shop. 4. Conclusion and recommendations 4.1 Conclusions Consumers perceived differences between meat from females, entire males with boar taint and entire males without boar taint. There seem to be perception differences between countries, but this cannot be stated definitely since the androstenone and skatole level were not continuous and not identical between countries (DE, NL, FR and IT was around 2 µg/g while in ES and UK was around 1 µg/g, on melted fat basis). The higher the androstenone and skatole levels, the more differences were perceived. In FR, IT and NL significant differences were found between the consumer perception of tainted boar meat and gilt meat; tainted boar meat was considered less acceptable. However in SP, UK and GE these differences were not significant. It cannot be concluded that the meat from entire males would be accepted by consumers in all the European countries. The percentage of consumers that considered abnormal odour when evaluated meat from tainted boar meat (in the kitchen session) was in the range of 10 to 48% depending on the country. From the people that perceived abnormalities, 28 to 74% would not serve the meat, 40 to 56% would not buy pig meat for a while and 22 to 61% would go to another shop.

ALCASDE, 2009 D.1.3.4
D134 – 81
4.2 Recommendations Meat with boar taint is detected by consumers. Given the consequences in case of detection of an abnormal odour, the chain consequences of stopping with castration can be drastically in case castration will be forbidden before a good detection method is developed. Therefore more research is necessary on the following points: -To develop harmonization studies to determine precisely the threshold levels for boar taint detected for consumers in different countries (EU and possible markets- importing countries). - Large scale study of preferences and behaviour of European consumers in relation to fresh pig meat products (in addition to the loin) and cured or smoked products from entire males and females. This study should be performed in collaboration of end-users like Consumer associations and retailers of different Eastern, Southern, Western and Northern countries. 5. Discussion This research project is fulfilled in a very short time span. Therefore it was necessary to use meat from the Netherlands in Germany, from Spain in the United Kingdom and from France in Italy. In reality consumers in those countries only partly consume foreign meat from those countries. A mix of local and foreign meat would have given a more realistic viewpoint. However the selected animals were from breedings which normally are exported to these countries. Due to the short time span, there was no time to do a qualitative test of the questionnaire in all countries, to check whether all questions were interpreted exactly the same in all countries. The protocol was identical however and the researcher involved in the project attended all sessions to explain the questions identically in case of clarity questions.


ALCASDE, 2009 D.1.3.4
D134 – 83
Appendix 1 Meat sampling and detection protocol For the sensory testing (taste) and the kitchen session (odour testing) meat is used from boars detection+, boars detection– and gilts. The boar meat used for the sensory investigation must come from:
- farms where the animals are not castrated; - animals which are representative of what is normally available in the supermarket, i.e.
within the usual weight class and quality available in retail outlets; - as many farms as practically possible in order to ensure as much diversity as possible in
the supply. The boar meat must be from conventional crossing (genetics) in the test country. This means that if possible local meat has to used. This type of meat comes from animals in a weight category which is in line with the weight of animals commonly slaughtered in [country of test], and there are enough of these animals in stock that have not been castrated from a sufficient number of farms. In case foreign meat is used, there has to be a good reason for doing so. For the Italian market, with a self sufficiency of 59%, French meat is used since that is commonly in the Italian fresh meat market. The typical Italian meat is mainly used for processed products and the age of the males is much higher than would be normal for fresh meat. In the UK Spanish meat is used. In all other markets (Spain, France, the Netherlands and Germany) local meat is used. As all the meat should be commercially available, it can be bought from a slaughterhouse or be controlled slaughtered. If meat from a slaughterhouse is used, at least the cutting procedure has to be as described by the slaughterhouse protocol from IRTA. The selected animals have a carcass weight and classification as common in the country for fresh meat. In order to obtain sufficient statistical variation at supply side, at least 20 boars detection+, 20 boars detection– and 20 gilts have to be used in each country. This corresponded 1 roast of meat per animal. The roast will divided in slices which have a thickness of at least 0,5 cm. The skin needs to be taken off from the roast sample. A minimum of 0.5 cm of external fat need to be preserve on the slice of meat before cooking.
The meat has to be collected over a period of 2 to 4 weeks to ensure sufficient variation over the various farms. The meat must come from at least 3 farms.

D134 – 84
A normal loin is divided in two for the test, so that samples as shown result. picture Method for selecting meat samples In the slaughterhouse, animals were carved up which met the requirements described above. The remaining detection+ pieces are used for the kitchen session (phase 3). Whether meat is detection + will be determined by testing neck fat samples. Whether meat is detection + will be determined by testing concentration of androstenone and scatol level in the fat samples. Human testing was proposed first, but could not be equalized between four countries of origin. The borders of detection + boar meat are:
d) Androstenone > 1 µg/g melted fat e) Skatole > 0.2 µg/g melted fat f) Androstenone > 0.5 µg/g melted fat and skatole > 0.15 µg/g melted fat
The borders of detection –boar meat are:
b) Androstenone < 0.5 µg/g melted fat and skatole < 0.15 µg/g melted fat These borders will be checked with experts, by everybody. Working procedure at the slaughterhouse As soon as the animals are transported from the storage area to the carving area the slaughterhouse hook number is noted and researchers present check whether the meat is of the correct type. No more than a single animal would be present in the carving area. For each slaughterhouse hook number used, the UBN number and the earmark number are also checked. This is done for the next carving day. All of the meat carved out is labelled according to the following codes:
ORIGIN COUNTRY
DATE
ANIMAL
PART “A” OF THE LOIN
?
female+ boar taint +- boar taint -

ALCASDE, 2009 D.1.3.4
D134 – 85
The codes are built as follows: Country telephone code Date of slaughtering period Number of carcass Neck A fat sample is cut from the neck, and the samples are supplied to a laboratory at the end of the carving period. These samples are used to determine the concentrations of androstenone, indole and skatole in the meat. Blade pork chops
- from each animal, a number of blade pork chops are carved out; - all the blade pork chops have a similar thickness; - per animal, the test pieces are separately packed in the deep freeze bags provided and
stickered with the code number described above; - the researchers present will help with the packaging and sorting for distribution.


ALCASDE, 2009 D.1.3.4
D134 – 87
Appendix 2 Cooking protocol The meat is cooked to ensure food safety is guaranteed and the protocol is followed professionally. Oil: Maïs-oil (oil with the less smell) Cooking plate (with an straight surface) of: ± 180°C Cut the meat pieces in two samples, which are of equal size. Start cooking with “x” minutes on one side and “x” minutes on the other side on an electric baking plate as in the picture, dependent on the thickness of the meat that is regular in the country. Change regularly. The meat is ready as the inside temperature is at least 80°C The meat is salted after cooking with 1 gram salt per 200 gram meat.
The meat has to be presented on colour as indicated on this picture

D134 – 88
Test situation:
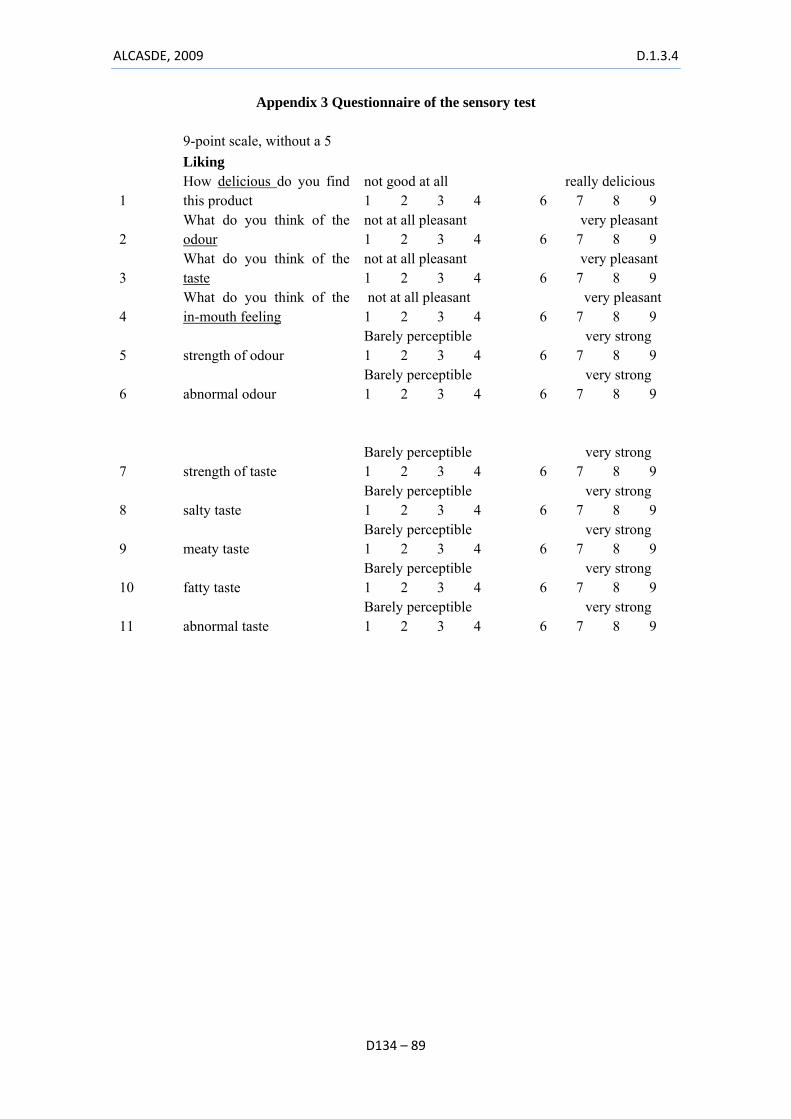
ALCASDE, 2009 D.1.3.4
D134 – 89
Appendix 3 Questionnaire of the sensory test 9-point scale, without a 5 Liking
1 How delicious do you find this product
not good at all really delicious 1 2 3 4 6 7 8 9
2 What do you think of the odour
not at all pleasant very pleasant 1 2 3 4 6 7 8 9
3 What do you think of the taste
not at all pleasant very pleasant 1 2 3 4 6 7 8 9
4 What do you think of the in-mouth feeling
not at all pleasant very pleasant 1 2 3 4 6 7 8 9
5 strength of odour Barely perceptible very strong 1 2 3 4 6 7 8 9
6 abnormal odour Barely perceptible very strong 1 2 3 4 6 7 8 9
7 strength of taste Barely perceptible very strong 1 2 3 4 6 7 8 9
8 salty taste Barely perceptible very strong 1 2 3 4 6 7 8 9
9 meaty taste Barely perceptible very strong 1 2 3 4 6 7 8 9
10 fatty taste Barely perceptible very strong 1 2 3 4 6 7 8 9
11 abnormal taste Barely perceptible very strong 1 2 3 4 6 7 8 9

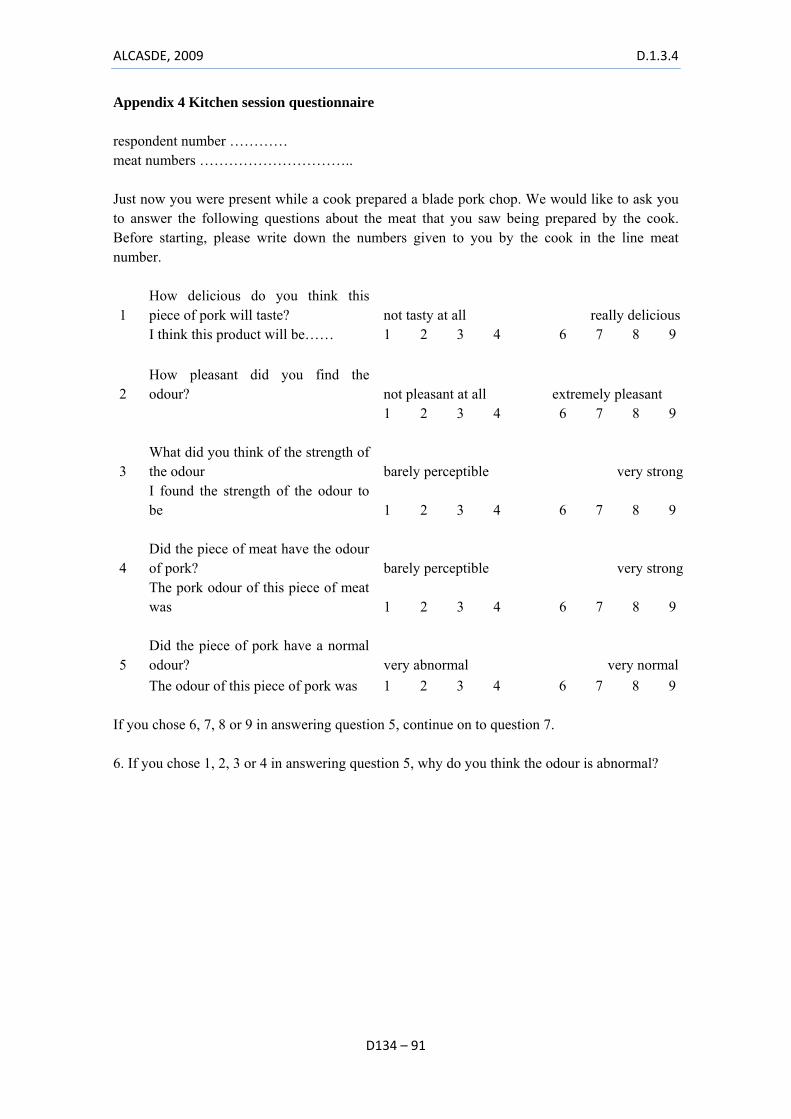
ALCASDE, 2009 D.1.3.4
D134 – 91
Appendix 4 Kitchen session questionnaire respondent number ………… meat numbers ………………………….. Just now you were present while a cook prepared a blade pork chop. We would like to ask you to answer the following questions about the meat that you saw being prepared by the cook. Before starting, please write down the numbers given to you by the cook in the line meat number.
1 How delicious do you think this piece of pork will taste? not tasty at all really delicious
I think this product will be…… 1 2 3 4 6 7 8 9
2 How pleasant did you find the odour? not pleasant at all extremely pleasant
1 2 3 4 6 7 8 9
3 What did you think of the strength of the odour barely perceptible very strong
I found the strength of the odour to be 1 2 3 4 6 7 8 9
4 Did the piece of meat have the odour of pork? barely perceptible very strong
The pork odour of this piece of meat was 1 2 3 4 6 7 8 9
5 Did the piece of pork have a normal odour? very abnormal very normal
The odour of this piece of pork was 1 2 3 4 6 7 8 9 If you chose 6, 7, 8 or 9 in answering question 5, continue on to question 7. 6. If you chose 1, 2, 3 or 4 in answering question 5, why do you think the odour is abnormal?

D134 – 92
7. Imagine that you purchased pork from your regular butcher or the supermarket and noticed exactly the same odour while preparing it in the kitchen. Would you then serve the meat to your family members?
□ Yes □ No
8. Imagine that you purchased pork from your regular butcher or the supermarket and noticed exactly the same odour while preparing it in the kitchen. Would you buy pork again?
□ Yes □ No
9. Imagine that you purchased pork from your regular butcher or the supermarket and noticed exactly the same odour while preparing it in the kitchen. Would you go the same store again?
□ Yes □ No