Embed Size (px)
Citation preview

INTEROPERABILITY SOLUTIONS FOR EUROPEAN PUBLIC ADMINISTRATIONS
MONITORING AND EVALUATION
D06.01. Perceived Utility Monitoring Report
ISA Action 4.2.5 Sharing and Re-use
Framework Contract n° DI/07173-00
5 April 2017

Page 2 of 35
Monitoring and Evaluation – Sharing and Reuse Perceived Utility Report April 2017
DISCLAIMER
The information and views set out in this publication are those of the author(s) and do not necessarily reflect
the official opinion of the Commission. The Commission does not guarantee the accuracy of the data included
in this document. Neither the Commission nor any person acting on the Commission’s behalf may be held
responsible for the use which may be made of the information contained therein.
© European Commission, 2017

Page 3 of 35
Monitoring and Evaluation – Sharing and Reuse Perceived Utility Report April 2017
EXECUTIVE SUMMARY The purpose of this section is to provide an overview of the key findings of the Perceived Utility assessment of
the ISA Action 4.2.5 – Sharing and Reuse. The objective of the survey is to measure the action’s Perceived Utility,
which is defined as the extent to which the effects (impact) of an ISA action correspond with the needs, problems
and issues to be addressed by the ISA programme1.
The respondents were asked to evaluate the following Sharing and Re-use publications:
Report on Policies and Initiatives on Sharing and Re-use,
Business Models for Sharing and Re-use,
Governance Models for Sharing and Re-use,
Standard "Sharing and Re-using" Clauses for Contracts,
Guidelines on Procuring IT solutions,
Sharing and Re-use Framework.
The survey was designed in the EUSurvey tool and distributed by e-mail. The Project officer was responsible for
sending out the reminders to the survey respondents. Over the duration of almost three months2, eleven
stakeholders have responded.
Table 1 gives an overview of the main results of the survey. The detailed score calculation process is described
in section 5.4.4.
TABLE 1 – ACTION 4.2.5 SURVEY PERCEIVED UTILITY MAIN RESULTS
1 Papadomichelaki, X. and Mentzas, G. (2012), “e-GovQual: A multiple-item scale for assessing e-government service quality” 2 The survey was launched on the 23rd of November 2016 and was active until the 17th of February 2017.
Score Explanation of the score scale
Usefulness Score 5.59 Average value on a scale from 1 (Not Useful at All) to 7 (Very Useful).
Value Score 3.93 Average value of all the statement means in the range from 1
(Disagree) to 5 (Agree).
User Satisfaction Score
71.28 User Satisfaction Score from 0 (none of the respondents are satisfied) to 100 (all respondents are satisfied with the work performed by the
Action).
Net Promoter Score
-18 Net Promoter Score from -100 (every customer is a Detractor) to 100
(every customer is a Promoter).
OVERALL PERCEIVED
UTILITY SCORE 3.62
The Overall Perceived Utility Score is the average value of the Usefulness Score, the Value Score, the User Satisfaction Score, and
the Net Promoter Score reduced to a five-point scale in range from 1 (lowest score) to 5 (highest score).

Page 4 of 35
Monitoring and Evaluation – Sharing and Reuse Perceived Utility Report April 2017
Main findings:
The survey results demonstrate that Sharing and Re-use publications comply with the ISA programme’s
objectives and action specific objectives;
Respondents are most familiar with the “Report on policies and initiatives on sharing and re-use” and
the “Sharing and re-use framework”;
Respondents are interested in the publications they did not know before the survey;
Both dimensions assessed in the survey are considered important.
Recommendations:
To keep promoting Sharing and Re-use within the European Commission and Member States to increase the
awareness of the publications, as all of the respondents find them useful.
Additional further investigation should be done on how the publications are promoted, because based on the
survey results, respondents are not fully familiar with all of the publications available.
.

Page 5 of 35
Monitoring and Evaluation – Sharing and Reuse Perceived Utility Report April 2017
REVISION HISTORY Date Version Description Authors Approved by
01/03/2017 0.10 Initial version CGI - Accenture
03/03/2017 1.00 Final version CGI - Accenture
27/03/2017 2.00 Updated according to the feedback
received from PO
CGI - Accenture
05/04/2017 3.00 Updated according to the feedback
received from PO
CGI - Accenture
Page 6 of 35
Monitoring and Evaluation – Sharing and Reuse Perceived Utility Report April 2017
TABLE OF CONTENTS 1 INTRODUCTION ............................................................................................................................................... 8
2 OVERVIEW OF THE ACTION 4.2.5 – SHARING AND REUSE .............................................................................. 9
3 SURVEY METHODOLOGY ............................................................................................................................... 11
3.1 PERCEIVED UTILITY ..................................................................................................................................... 11
3.2 SURVEY MEASUREMENTS ............................................................................................................................. 12
3.3 SURVEY ARCHITECTURE ............................................................................................................................... 13
4 SURVEY DATA SUMMARY .............................................................................................................................. 14
5 SURVEY RESULTS AND ANALYSIS ................................................................................................................... 15
5.1 DEMOGRAPHIC PROFILE OF RESPONDENTS ..................................................................................................... 15
5.2 USAGE OF THE ACTION ............................................................................................................................... 16
5.3 USEFULNESS SCORE .................................................................................................................................... 17
5.4 PERCEIVED UTILITY MEASUREMENTS .............................................................................................................. 19
5.4.1 Value Score ................................................................................................................................... 19
5.4.1.1 Dimensions Importance ............................................................................................................ 19
5.4.1.2 Dimensions Conformity ............................................................................................................ 20
Statement Mapping to Dimensions ..................................................................................... 20
Dimensions Conformity Results ........................................................................................... 21
5.4.2 User Satisfaction Score ................................................................................................................. 23
5.4.3 Net Promoter Score ...................................................................................................................... 24
5.4.4 Overall Score ................................................................................................................................. 26
5.5 ACTION STRENGTHS, WEAKNESSES, INSIGNIFICANCE AND COMPLEMENTS .............................................................. 28
5.6 STATEMENTS BASED ON ACTION OBJECTIVES .................................................................................................... 30
5.7 RESPONDENT RECOMMENDATIONS AND OPINIONS .......................................................................................... 32
6 SURVEY CONCLUSION AND RECOMMENDATIONS ........................................................................................ 33
7 APPENDIX ....................................................................................................................................................... 34
7.1 RAW DATA EXPORT .................................................................................................................................... 34
7.2 GLOSSARY ................................................................................................................................................ 35
Page 7 of 35
Monitoring and Evaluation – Sharing and Reuse Perceived Utility Report April 2017
TABLE OF FIGURES FIGURE 1 – ACTION 4.2.5 USEFULNESS SCORE ............................................................................................................. 17
FIGURE 2 – ACTION 4.2.5 PERCEIVED UTILITY DIMENSIONS IMPORTANCE RESULTS ............................................................. 20
FIGURE 3 – ACTION 4.2.5 PERCEIVED UTILITY DIMENSIONS CONFORMITY RESULTS ............................................................. 22
FIGURE 4 – ACTION 4.2.5 PERCEIVED UTILITY USER SATISFACTION SCORE ......................................................................... 23
FIGURE 5 – ACTION 4.2.5 NET PROMOTER ASSESSMENT ............................................................................................... 25
FIGURE 6 – ACTION 4.2.5 NET PROMOTER SCORE ........................................................................................................ 25
FIGURE 7 – ACTION 4.2.5 PERCEIVED UTILITY ACTION STRENGTHS, WEAKNESSES, INSIGNIFICANCE AND COMPLEMENTS ............ 29
FIGURE 8 – ACTION 4.2.5 STATEMENTS BASED ON ACTION OBJECTIVES ............................................................................ 31
TABLE OF TABLES TABLE 1 – ACTION 4.2.5 SURVEY PERCEIVED UTILITY MAIN RESULTS .................................................................................. 3
TABLE 2 – ACTION 4.2.5 SURVEY TECHNICAL INFORMATION ABOUT THE FIELDWORK ........................................................... 14
TABLE 3 – ACTION 4.2.5 DEMOGRAPHIC PROFILE OF RESPONDENTS ................................................................................. 15
TABLE 4 – ACTION 4.2.5 FAMILIARITY OF SHARING AND REUSE PUBLICATIONS ................................................................... 16
TABLE 5 – ACTION 4.2.5 STATEMENT MAPPING TO DIMENSIONS ..................................................................................... 21
TABLE 6 – ACTION 4.2.5 AVERAGE RATING PER PERCEVIED UTILITY DIMENSION ................................................................. 22
TABLE 7 – ACTION 4.2.5 OVERALL PERCEIVED UTILITY SCORE CALCULATION ...................................................................... 27
TABLE 8 – ACTION 4.2.5 RECOMMENDATIONS AND BENEFITS ......................................................................................... 32

Page 8 of 35
Monitoring and Evaluation – Sharing and Reuse Perceived Utility Report April 2017
1 INTRODUCTION
CGI-Accenture has been requested to deliver Perceived Quality and Perceived Utility Monitoring and Evaluation
Reports as part of the execution of the ISA programme monitoring (Technical Annex for Specific Contract SC 333
under Framework contract n° DI/07173-00).
This report covers the Perceived Utility measurements for Action 4.2.5 – Sharing and Re-use.
This document is divided into the following sections:
- Section 1: provides an overview of the structure of the report;
- Section 2: provides an overview of the action and its objectives;
- Section 3: explains the methodology used to measure the Perceived Utility;
- Section 4: summarises the collected data;
- Section 5: focuses on the survey results and the data analysis:
The demographic profile of respondents;
Usage frequency of Sharing and Reuse;
Usefulness Score;
Perceived Utility measurements;
Action strengths, weaknesses, insignificance and complements;
Statement based on action objectives;
Respondent recommendations and main benefits;
- Section 6: provides the survey conclusion and recommendations;
- Section 7: appendix includes:
Raw data export;
Glossary.
Page 9 of 35
Monitoring and Evaluation – Sharing and Reuse Perceived Utility Report April 2017
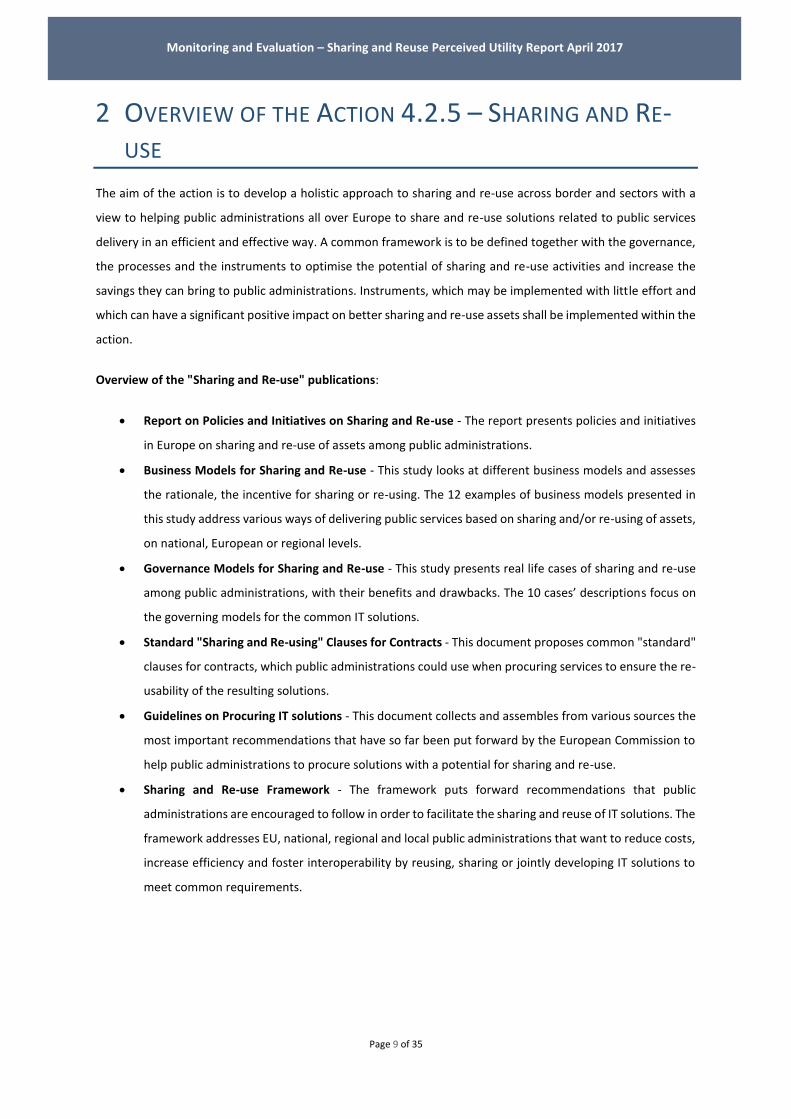
2 OVERVIEW OF THE ACTION 4.2.5 – SHARING AND RE-USE
The aim of the action is to develop a holistic approach to sharing and re-use across border and sectors with a
view to helping public administrations all over Europe to share and re-use solutions related to public services
delivery in an efficient and effective way. A common framework is to be defined together with the governance,
the processes and the instruments to optimise the potential of sharing and re-use activities and increase the
savings they can bring to public administrations. Instruments, which may be implemented with little effort and
which can have a significant positive impact on better sharing and re-use assets shall be implemented within the
action.
Overview of the "Sharing and Re-use" publications:
Report on Policies and Initiatives on Sharing and Re-use - The report presents policies and initiatives
in Europe on sharing and re-use of assets among public administrations.
Business Models for Sharing and Re-use - This study looks at different business models and assesses
the rationale, the incentive for sharing or re-using. The 12 examples of business models presented in
this study address various ways of delivering public services based on sharing and/or re-using of assets,
on national, European or regional levels.
Governance Models for Sharing and Re-use - This study presents real life cases of sharing and re-use
among public administrations, with their benefits and drawbacks. The 10 cases’ descriptions focus on
the governing models for the common IT solutions.
Standard "Sharing and Re-using" Clauses for Contracts - This document proposes common "standard"
clauses for contracts, which public administrations could use when procuring services to ensure the re-
usability of the resulting solutions.
Guidelines on Procuring IT solutions - This document collects and assembles from various sources the
most important recommendations that have so far been put forward by the European Commission to
help public administrations to procure solutions with a potential for sharing and re-use.
Sharing and Re-use Framework - The framework puts forward recommendations that public
administrations are encouraged to follow in order to facilitate the sharing and reuse of IT solutions. The
framework addresses EU, national, regional and local public administrations that want to reduce costs,
increase efficiency and foster interoperability by reusing, sharing or jointly developing IT solutions to
meet common requirements.

Page 10 of 35
Monitoring and Evaluation – Sharing and Reuse Perceived Utility Report April 2017
Objectives of the Action:
To define a framework and publish additional guidelines and recommendations addressing the following areas:
Kinds of solutions that can be shared;
Organisation of reuse and sharing at a European level;
Contribution of other ISA actions and their links to sharing and reuse practices;
Identification of main barriers for sharing and reusing;
How to develop reusable solutions;
Leverage of existing national initiatives;
Promoting reusable solutions at a European level;
Ensuring reuse at all government levels.

Page 11 of 35
Monitoring and Evaluation – Sharing and Reuse Perceived Utility Report April 2017
3 SURVEY METHODOLOGY
A common methodology was developed by the CGI-Accenture team for all the surveys included in the Perceived
Quality and Perceived Utility Monitoring and Evaluation Reports. The common methodology enables a
comparison between the different action results. The first section explains how the Perceived Utility is measured
and which dimensions are covered. The next section gives an overview of the main survey measurements. The
last section describes the architecture of the survey.
3.1 PERCEIVED UTILITY Perceived Utility is defined as the extent to which the effects (impact) of an ISA action correspond with the
needs, problems and issues to be addressed by the ISA programme3 and the action’s specific objectives.
Regarding the Perceived Utility measurement, several statements are derived from the objectives of the ISA
programme. These statements are grouped into three dimensions which are defined as the criteria for
measuring the Perceived Utility:
Potential Re-usability: the degree to which the action's outcome(s) can be reused by Public
Administrations (PAs);
Sustainability: to what extent the financial, technical and operational sustainability of solutions is
ensured4;
Collaboration: the degree to which the action promotes/facilitates collaboration/cooperation between
PAs5;
The survey statements for the dimensions listed above were developed according to:
The ISA programme’s main objectives: “To support cooperation between European Public
Administrations by facilitating the efficient and effective electronic cross-border and cross-sectorial
interaction between such administrations, including bodies performing public functions on their behalf,
enabling the delivery of electronic public services supporting the implementation of Community
policies and activities6 and actions’ specific objectives.” The Perceived Utility statements were tailored
to reflect these objectives and were based on the ESOMAR 7 (World Association of Opinion and
Marketing Research Professionals) standards.
3 Papadomichelaki, X. and Mentzas, G. (2012), “e-GovQual: A multiple-item scale for assessing e-government service quality” 4 European Commission (2013), Interim evaluation of the ISA programme, “Report from the Commission to the European Parliament and Council COM (2013) 5 final”. 5 CRN (2015), Collaboration http://research.crn.com/technology/knowledge_management/collaboration 6 Decision No 922/2009/EC of the European Parliament and of the Council of 16 September 2009 on interoperability solutions for European Public Administrations (ISA) (2009) 7 ESOMAR, edited by Hamersveld. M., Bont C. (2007), Market Research, Handbook, 5th Edition

Page 12 of 35
Monitoring and Evaluation – Sharing and Reuse Perceived Utility Report April 2017
The developed Perceived Utility dimensions enable the comparison between different actions and will also
provide the opportunity to see if the ISA programme objectives have been met (from the user point of view).
Due to the non-applicability of the Sustainability dimension, it was excluded from the evaluation of Action 4.2.5
– Sharing and Reuse upon the request of the Project Officer.
3.2 SURVEY MEASUREMENTS In the data analysis, the core types of measurements which are performed include the Value Score, the User
Satisfaction Score, The usefulness Score, the Net Promoter Score and the Overall Score for Perceived Utility. The
survey measurements are divided into two groups: action level measurements and Perceived Utility level
measurements.
Action level measurements:
The Usefulness Score indicates the respondents’ evaluation of how useful the action is. The Usefulness
Score is calculated taking into account the mean values from the question: “Overall, how useful
are/would be the below publications to your work?”
Action strengths, weaknesses, insignificance and complements: statements are located in quadrants
based on the calculated mean values of the dimensions’ conformity and dimensions’ importance. The
quadrants highlight the weak and strong aspects of the action, as well as insignificance and
complements.
Statements based on action objectives show the respondents’ evaluation to what extent the action’s
objectives have been achieved.
Perceived Utility level measurements:
The Value Score shows the action’s compliance to the dimensions defined above (see section Error!
eference source not found.). Two aspects are considered for each dimension. On one side, the
importance of the dimension for the users is assessed. On the other side we measure if the action is
compliant with the dimension. This section includes statement mapping to dimensions, dimensions’
conformity results, criterion score and aggregation.
The User Satisfaction Score shows how satisfied the respondents are with the action. The User
Satisfaction Score is assessed with reference to the results of the dimensions’ importance and
dimensions’ conformity evaluation. The User Satisfaction Score is measured at the individual level for
each of the survey respondents via the identification of the important dimensions for that particular
respondent.
Page 13 of 35
Monitoring and Evaluation – Sharing and Reuse Perceived Utility Report April 2017
The Net Promoter Score® (NPS) is a widely used management tool that helps evaluate the loyalty of a
customer relationship. In order to evaluate the NPS, the question “How likely the respondent would
recommend the particular action’s output to others” is asked.
The Overall Score is used to get a single score that describes the overall Perceived Utility of the action.
In order to determine the Overall Score, the average value of the Usefulness Score, the Value Score,
the User Satisfaction Score and the Net Promoter Score is calculated. To calculate the Overall Score, all
measurements are reduced to a five-point scale.
3.3 SURVEY ARCHITECTURE
The survey is divided into several sections which are outlined below:
The demographic profile: for the purpose of identifying the respondents’ demographic profile,
respondents are asked to answer several questions. The demographic profile illustrates the diversity of
the respondents who have participated in the survey.
Usage of Action: for the purpose of identifying the usage rate of the action outputs.
The action’s Usefulness: for the measurement of the action’s Usefulness, the respondents are asked to
evaluate a single question using a 7-point Likert grading scale8.
The Perceived Utility Measurement: in order to measure the Perceived Utility, the respondents are
asked to grade dimensions and statements based on their level of importance and agreement using a
5-point Likert grading scale8. Responses to these questions are used to determine the Value Score,
action strengths, weaknesses, insignificance and complements and the User Satisfaction Score.
The Net Promoter Score: there is a single question that measures the Net Promoter Score. By answering
this question, the respondents indicate their likelihood of recommending the action’s outputs to
colleagues or other PAs.
Action strengths, weaknesses, insignificance and complements show the location of the action
statements based on dimensions’ conformity and dimensions’ importance results.
Statements based on action objectives: in order to evaluate the extent to which these objectives
conform to the action, the respondents are asked to grade statements based on their level of
agreement. A 5-point Likert scale8 is used as a grading scale.
The recommendations: the last section includes several open questions for recommendations and
opinions regarding the action and the survey.
8 A Likert Scale is a widely used scaling method developed by Rensis Likert. Likert scale refers to the use of an ordinal 4- or 5-point rating scale with each point anchored or labeled.
Page 14 of 35
Monitoring and Evaluation – Sharing and Reuse Perceived Utility Report April 2017
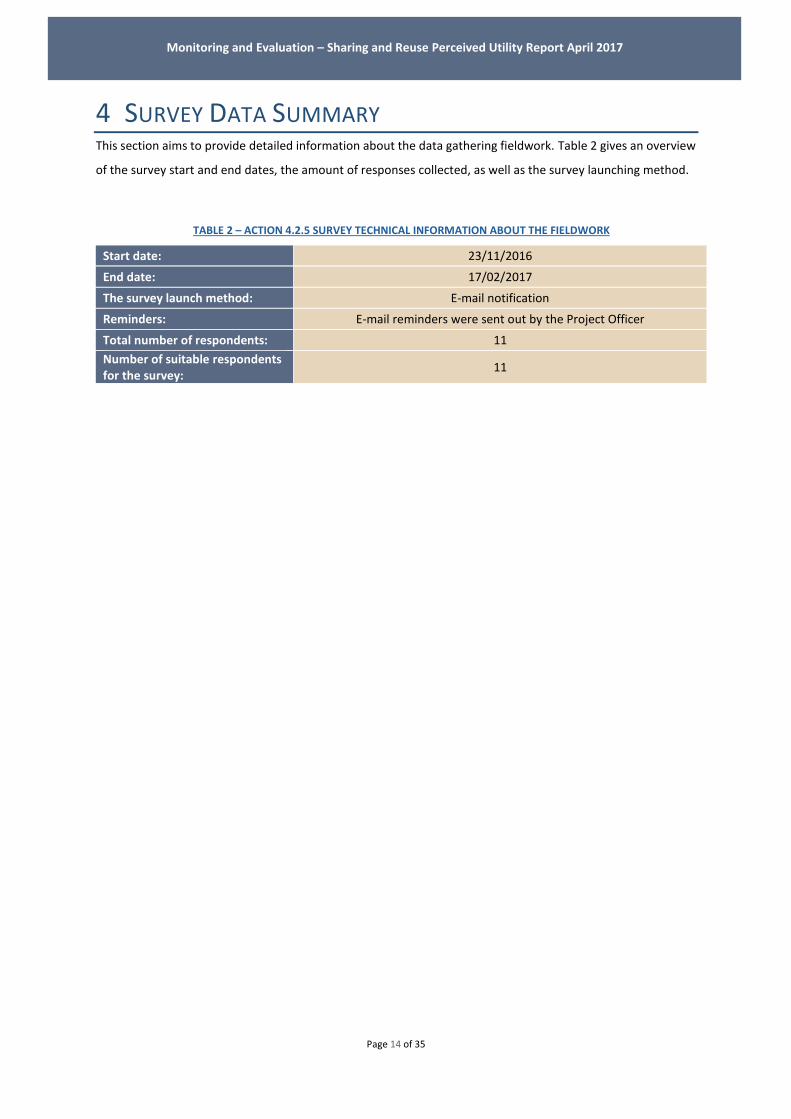
4 SURVEY DATA SUMMARY This section aims to provide detailed information about the data gathering fieldwork. Table 2 gives an overview
of the survey start and end dates, the amount of responses collected, as well as the survey launching method.
TABLE 2 – ACTION 4.2.5 SURVEY TECHNICAL INFORMATION ABOUT THE FIELDWORK
Start date: 23/11/2016
End date: 17/02/2017
The survey launch method: E-mail notification
Reminders: E-mail reminders were sent out by the Project Officer
Total number of respondents: 11
Number of suitable respondents for the survey:
11
Page 15 of 35
Monitoring and Evaluation – Sharing and Reuse Perceived Utility Report April 2017
5 SURVEY RESULTS AND ANALYSIS This section aims to provide the detailed survey analysis and to present the results.
5.1 DEMOGRAPHIC PROFILE OF RESPONDENTS
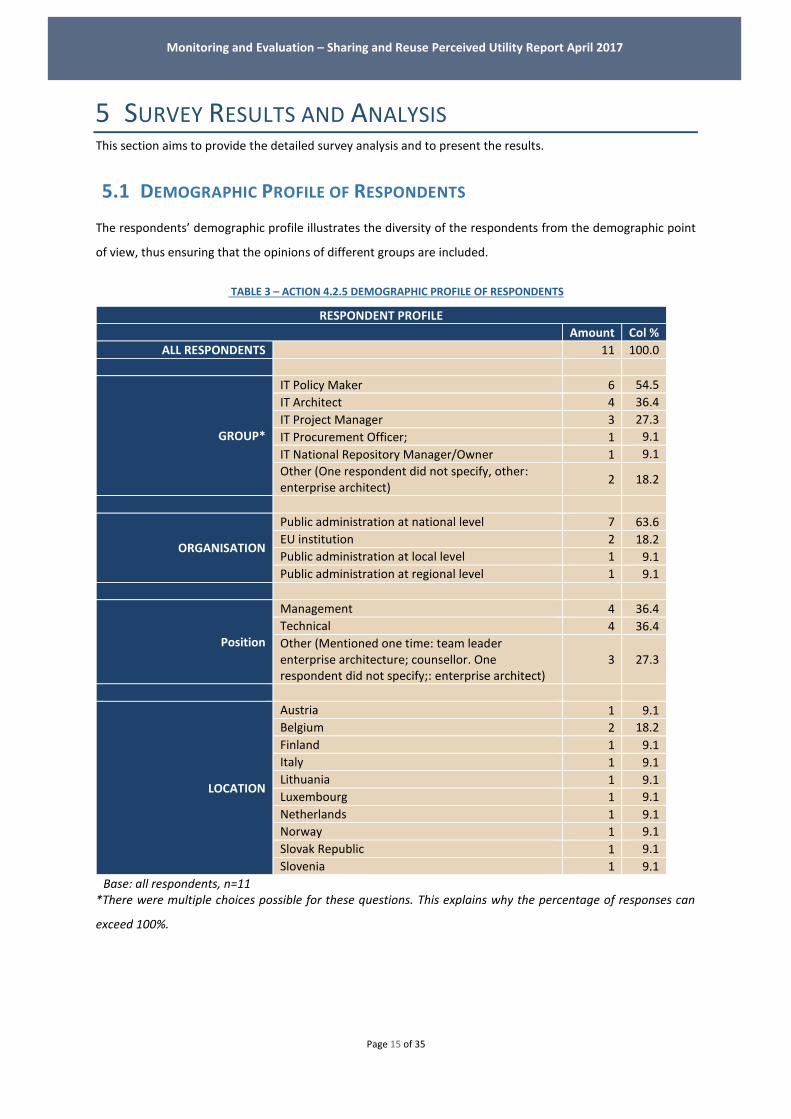
The respondents’ demographic profile illustrates the diversity of the respondents from the demographic point
of view, thus ensuring that the opinions of different groups are included.
TABLE 3 – ACTION 4.2.5 DEMOGRAPHIC PROFILE OF RESPONDENTS
RESPONDENT PROFILE
Amount Col %
ALL RESPONDENTS 11 100.0
GROUP*
IT Policy Maker 6 54.5
IT Architect 4 36.4
IT Project Manager 3 27.3
IT Procurement Officer; 1 9.1
IT National Repository Manager/Owner 1 9.1
Other (One respondent did not specify, other: enterprise architect)
2 18.2
ORGANISATION
Public administration at national level 7 63.6
EU institution 2 18.2
Public administration at local level 1 9.1
Public administration at regional level 1 9.1
Position
Management 4 36.4
Technical 4 36.4
Other (Mentioned one time: team leader enterprise architecture; counsellor. One respondent did not specify;: enterprise architect)
3 27.3
LOCATION
Austria 1 9.1
Belgium 2 18.2
Finland 1 9.1
Italy 1 9.1
Lithuania 1 9.1
Luxembourg 1 9.1
Netherlands 1 9.1
Norway 1 9.1
Slovak Republic 1 9.1
Slovenia 1 9.1
Base: all respondents, n=11 *There were multiple choices possible for these questions. This explains why the percentage of responses can
exceed 100%.

Page 16 of 35
Monitoring and Evaluation – Sharing and Reuse Perceived Utility Report April 2017
5.2 USAGE OF THE ACTION
The usage profile provides an overview of the familiarity of the Sharing and Re-use publications.
TABLE 4 – ACTION 4.2.5 FAMILIARITY OF THE SHARING AND REUSE PUBLICATIONS
USAGE PROFILE
Amount Col %
ALL RESPONDENTS 11 100.0
REPORT ON POLICIES AND INITIATIVES ON
SHARING AND RE-USE
Utilised parts of it 2 18.2
Read, but did not utilise 5 45.5
Have heard of it, but did not read it 2 18.2
Never heard of it, but would like to read it 2 18.2
BUSINESS MODELS FOR SHARING AND RE-
USE
Read, but did not utilise 2 18.2
Have heard of it, but did not read it 5 45.5
Never heard of it, but would like to read it 4 36.4
GOVERNANCE MODELS FOR
SHARING AND RE-USE
Utilised parts of it 2 18.2
Read, but did not utilise 1 9.1
Have heard of it, but did not read it 4 36.4
Never heard of it, but would like to read it 4 36.4
STANDARD "SHARING AND RE-USING"
CLAUSES FOR CONTRACTS
Utilised parts of it 1 9.1
Read, but did not utilise 1 9.1
Have heard of it, but did not read it 5 45.5
Never heard of it, but would like to read it 3 27.3
Never heard of it and not interested in it 1 9.1
GUIDELINES ON PROCURING IT
SOLUTIONS
Utilised parts of it 2 18.2
Read, but did not utilise 2 18.2
Have heard of it, but did not read it 3 27.3
Never heard of it, but would like to read it 3 27.3
Never heard of it and not interested in it 1 9.1
SHARING AND RE-USE FRAMEWORK
Utilised parts of it 2 18.2
Read, but did not utilise 4 36.4
Have heard of it, but did not read it 3 27.3
Never heard of it, but would like to read it 2 18.2
Base: all respondents, n=11

Page 17 of 35
Monitoring and Evaluation – Sharing and Reuse Perceived Utility Report April 2017
5.3 USEFULNESS SCORE
The Usefulness Score is calculated taking into account the mean values of question: “Overall, how useful
are/would be the below publications to your work?”.
The survey respondent is asked to provide his/her opinion using the 7-point Likert grading scale. For the
evaluation of Usefulness, a grading scale is used with values ranging from ‘Very Useful’ to ‘Not Useful at All’. An
additional ‘Hard to Say’ option is provided; however, this score is excluded from the score calculations. Before
performing the survey data calculations, the 7-point Likert scale values are interpreted as numeric values:
7 – Very Useful;
6 – Useful;
5 – Rather Useful;
4 – Neither Useful nor Not Useful;
3 – Rather Not Useful;
2 – Not Useful;
1 – Not Useful at All;
0 – Hard to Say (is not considered for the calculation).
In order to have an overview of the positive (‘Rather Useful’, ‘Useful’ and ‘Very Useful’) and negative (‘Rather
Not Useful’, ‘Not Useful’ and ‘Not Useful at All’) attitude proportions, the bars in blue represent the negative
attitude (yet none of the respondents had negative attitude), whereas the bars in pink and red represent the
positive one. In addition, a neutral ‘Neither Useful nor Not Useful’ answer (the bar in white) and ‘Hard to Say’
answer (the bar in grey) are presented separately on the right. An explanatory legend with colour codes
represents the data which is available. The average mean values are presented on the right side of the figure.
FIGURE 1 – ACTION 4.2.5 USEFULNESS SCORE
Page 18 of 35
Monitoring and Evaluation – Sharing and Reuse Perceived Utility Report April 2017
The survey results show that Sharing and Reuse publications overall have been evaluated with mean values
between 5 – ‘Rather Useful’ and 6 – ‘Useful’. None of the respondents provided a negative evaluation. However,
the data also shows that at least one respondent in each case could not provide a specific evaluation and that is
because not all of the respondents have utilised or at least read the specific publication, meaning that they could
only provide a theoretical evaluation based on the overview of the specific publication which was available to
respondents at the beginning of the survey.
Page 19 of 35
Monitoring and Evaluation – Sharing and Reuse Perceived Utility Report April 2017
5.4 PERCEIVED UTILITY MEASUREMENTS This section aims to provide a detailed Perceived Utility measurement analysis and to present the results.
5.4.1 Value Score
This section includes the analysis and results of Perceived Utility Value Scores. It is structured into two main
sections: the dimensions’ importance and dimensions’ conformity via statements.
5.4.1.1 DIMENSIONS IMPORTANCE
Prior to the evaluation of the dimensions’ conformity to the outputs of the action, it is essential to initially
ascertain whether these dimensions are important to the respondents while working with the action. If a specific
dimension is important to the respondents, then it is essential that its conformity assessment is positive.
However, if a dimension is not important to the respondents, then it should not be considered as the action’s
weakness because of non-compliance with the outputs of the action.
Two Perceived Utility dimensions (Potential Re-usability and Collaboration) are evaluated in the survey. This
section describes the respondents’ answers regarding the importance of the dimensions.
Each respondent is requested to provide his/her opinion using the 5-point Likert grading scale. For the
dimensions’ importance evaluation, a grading scale with values ranging from ‘Important’ to ‘Not important’ is
used. An additional ‘Hard to Say/Not Applicable’ option is provided; however, this choice is excluded from the
score calculations. Before performing the survey data calculations, the 5-point Likert scale values are interpreted
as numeric values:
5 – Important;
4 – Rather Important;
3 – Neither Important nor Unimportant;
2 – Rather not Important;
1 – Not Important;
0 – Hard to Say/Not Applicable (is not considered for the calculation).
In order to have an overview of the positive and negative attitude proportions, the bars in blue represent the
negative attitude (answers ‘Not Important’ and ‘Rather not Important’ yet none of the respondents had a
negative attitude), whereas the bars in pink/red represent the positive attitude (answers ‘Rather important’ and
‘Important’). In addition, a neutral opinion (the bars in white) is presented separately on the right. An
explanatory legend with colour codes represents the available data. The average mean value for each of the
dimensions is presented on the right side of the figure.

Page 20 of 35
Monitoring and Evaluation – Sharing and Reuse Perceived Utility Report April 2017
FIGURE 2 – ACTION 4.2.5 PERCEIVED UTILITY DIMENSIONS IMPORTANCE RESULTS
"How important to you are/would be these factors when consulting the “Sharing and Reuse” publications?”
The survey results indicate that both Perceived Utility dimensions (Collaboration and Potential Re-usability) are
important to the respondents and are evaluated with a mean value between 4 – ‘Rather Important’ and 5 –
‘Important’. The Potential Re-usability dimension has a slightly lower mean value if compared to the
Collaboration dimension, because one respondent had a neutral attitude towards the importance of Potential
Re-usability, while the importance of Collaboration was evaluated with positive attitude by all of the
respondents.
5.4.1.2 DIMENSIONS CONFORMITY
In order to measure the Perceived Utility dimensions’ conformity to the action, a set of descriptive statements
was developed for each dimension. By evaluating the statement conformity to the action, the extent to which
the dimensions correspond to the ISA programme’s objectives is measured.
This section provides an analysis of the statements. It starts with statement mapping to dimensions, which is
followed by the analysis of the Perceived Utility dimension conformity statements. Finally, the last section
provides an overview of the statement conformity scores, which are summarised in groups according to the
dimensions.
STATEMENT MAPPING TO DIMENSIONS
In total, Action 4.2.5 has seven Perceived Utility statements regarding the dimensions’ conformity. Table 5 gives
an overview of the statements representing each dimension. The Potential Re-usability dimension is represented
by four statements, while the Collaboration dimension is represented by three statements.

Page 21 of 35
Monitoring and Evaluation – Sharing and Reuse Perceived Utility Report April 2017
TABLE 5 – ACTION 4.2.5 STATEMENT MAPPING TO DIMENSIONS
Perceived Utility Statements Dimension
1 Overall, the above publications help administrations save costs when
developing public services Potential Re-usability
2 Overall, the above publications help administrations save time when
developing public services Potential Re-usability
3 Overall, the above publications are effective in supporting the re-use of IT
solutions in the public sector Potential Re-usability
4 I plan to utilise some of the above publications in my organisation in the
future Potential Re-usability
5 The above publications help public administrations cooperate with each
other Collaboration
6 Overall, the above publications contribute to the effective electronic cross-
border and cross-sector interaction of public administrations Collaboration
7 The above publications contribute to the implementation of European
community policies and activities Collaboration
DIMENSIONS CONFORMITY RESULTS
For the purpose of describing dimensions’ conformity to the action, seven Perceived Utility statements were
designed for the survey. The respondents are asked to evaluate the extent to which these statements conform
to this particular action.
Each respondent is requested to provide his/her opinion using the 5-point Likert grading scale. For the
dimensions’ conformity evaluation, a grading scale with values ranging from ‘Agree’ to ‘Disagree’ is applied. An
additional ‘Hard to Say/Not Applicable’ option is provided; however, this score is excluded from the score
calculations. Before performing the survey data calculations, the 5-point Likert scale values are interpreted as
numeric values:
5 – Agree;
4 – Rather Agree;
3 – Neither Agree nor Disagree;
2 – Rather Disagree;
1 – Disagree;
0 – Hard to Say/Not Applicable (is not considered for the calculation).
In order to have an overview of the positive and negative attitude proportions, the bar in blue represents the
negative attitude (answers ‘Disagree’ and ‘Rather Disagree’), whereas the bars in pink/red represent the positive
attitude (answers ‘Agree’ and ‘Rather Agree’). In addition, a neutral opinion (the bars in white) and the answer
‘Hard to say’ (the bars in grey) are presented separately on the right. An explanatory legend with colour codes
represents the available data. The average mean value for each of the dimensions is presented on the right side
of the figure.

Page 22 of 35
Monitoring and Evaluation – Sharing and Reuse Perceived Utility Report April 2017
FIGURE 3 – ACTION 4.2.5 PERCEIVED UTILITY DIMENSIONS CONFORMITY RESULTS
Figure 3 shows that all of the statements have been evaluated as conformable as the mean values are higher
than the neutral value 3 – ‘Neither Agree nor Disagree’. The mean values for all of the statements are in the
range of the statistical error, meaning that because of the low response rate and the fact that one to three
respondents evaluated each statement with the answer ‘Hard to say’, no statistically meaningful comparison
can be made between the statements.
Table 6 provides an overview of the statement conformity scores, which are summarised per dimension. To
calculate these scores, the average values of all the conformable dimension statements are taken into account.
The additional statistical calculations9 - mode, standard deviation and standard error are excluded from the data
analysis due to a low number of respondents. With reference to the theory used in business research methods,10
it is concluded that for statistically meaningful calculations the minimum respondent number should be equal
to or greater than ten per statement, yet all of the statements except for one were evaluated with an answer
‘Hard to Say’ by at least two respondents.
TABLE 6 – ACTION 4.2.5 AVERAGE RATING PER PERCEVIED UTILITY DIMENSION
9 Dictionary of statistics & methodology: a nontechnical guide for the social sciences (page 226). 10 Cooper D. R., Schindler P. S. (2013), Business Research Methods, 12th Edition
Per dimension
Dimension MEAN
Potential Re-usability 3.97
Collaboration 3.88
Total Criterion Score
3.93

Page 23 of 35
Monitoring and Evaluation – Sharing and Reuse Perceived Utility Report April 2017
The survey results show that both Perceived Utility dimensions (Collaboration and Potential Re-usability) are
evaluated as relevant to the Sharing and Re-use publications as their mean values are higher than the neutral
value 3 and very close to the value 4 – ‘Agree’.
5.4.2 User Satisfaction Score
The User Satisfaction Score shows how satisfied and happy the respondents are with the performance of a
specific action. The User Satisfaction Score is expressed as a percentage from 0 to 100, where 0 signifies that
there are no satisfied and happy respondents, whereas 100 signifies all respondents are satisfied and happy with
the work performed by the action.
The User Satisfaction Score is assessed with reference to the results of the dimensions’ importance and
dimensions’ conformity evaluation. The User Satisfaction Score is measured at the individual level for each of
the survey respondents via identification of the important dimensions for that particular respondent.
To increase the accuracy of the calculation, a specific weight coefficient is applied to the dimensions. To those
dimensions which were evaluated as “Important”, a weight coefficient of 1 was applied, while a coefficient of
0.5 was applied to the dimensions which were evaluated as “Rather Important”. A coefficient of 0 is applied to
all the other dimensions. Finally, all the individual values are summed.
As the next step, an analysis of the statements which represent these identified dimensions is performed. If a
respondent claimed that a particular statement fully corresponded to the specific dimension (value 5 – ‘Agree’),
then a coefficient of 100 (100% eligibility) is assigned. If evaluated with 4 – ‘Rather Agree’, a coefficient of 75
applies, if evaluated with 3 – ‘Neither Agree nor Disagree’, a coefficient of 50 applies, if evaluated with 2 –
‘Rather Disagree’, a coefficient of 25 applies, and in the case it was evaluated with 1 – ‘Disagree’, the coefficient
is 0.
FIGURE 4 – ACTION 4.2.5 PERCEIVED UTILITY USER SATISFACTION SCORE
Figure 4 shows that the User Satisfaction Score is 71.28.
The result indicates a good level of respondent
satisfaction with the Perceived Utility of Sharing and Re-
use publications, meaning that those Perceived Utility
dimensions which are important to respondents are also
relevant.

Page 24 of 35
Monitoring and Evaluation – Sharing and Reuse Perceived Utility Report April 2017
5.4.3 Net Promoter Score
The Net Promoter Score® (NPS) is a widely used management tool that helps evaluate the loyalty of a customer
relationship11. This management tool has been adapted to suit the ISA programme’s Evaluation and Monitoring
activities and measures the overall respondents’/stakeholders’ experience and loyalty to a specific ISA action.
In order to evaluate the NPS, the question “how likely the respondent would recommend the particular action’s
output to others” is asked. The assessment is done on a scale from 0 to 10, where 0 represents the answer “Not
likely at all” and 10 – “Extremely likely”12. After the data analysis, the respondents are classified as follows:
Promoters (numeric values from 9 - 10) - loyal users who will keep using the action’s final outcome
and refer others, promoting the usage of the action's outcomes;
Passives (numeric values from 7 - 8) - satisfied but unenthusiastic users who will most probably not
recommend the action's outcomes to others;
Detractors (numeric values from 0 - 6) - unhappy users who can damage the image and decrease the
usage of the action's outcomes.
The NPS final score calculation is done based on the following formula:
The result can range from a low of -100 (every customer is a Detractor) to a high of +100 (every customer is a
Promoter).
11 Official webpage of Net Promoter Score ® community http://www.netpromoter.com/home. 12 Markey, R. and Reichheld, F. (2011), “The Ultimate Question 2.0: How Net Promoter Companies Thrive in a Customer-Driven World”
NPS = % of Promoters - % of Detractors12

Page 25 of 35
Monitoring and Evaluation – Sharing and Reuse Perceived Utility Report April 2017
FIGURE 5 – ACTION 4.2.5 NET PROMOTER ASSESSMENT
FIGURE 6 – ACTION 4.2.5 NET PROMOTER SCORE
Figure 5 shows that all of the publications have a high proportion of Passive users among respondents, meaning
that they are satisfied but unenthusiastic users who will most probably not recommend the publication to
others. The fact that a lot respondents have not utilised the specific publications (see section 5.2) explains the
high amount of Passive users. Figure 6 shows the Net Promoter Score for each publication. ‘Guidelines on
Procuring IT solutions’ is the only publication with a positive Net Promoter Score; however, based on the fact
that many of the respondents are Passive users, the Net Promoter Score is calculated on a very low respondent
Page 26 of 35
Monitoring and Evaluation – Sharing and Reuse Perceived Utility Report April 2017
base, so the difference between Promoters and Detractors is only a couple of respondents, yet the negative
values indicate, that respondents aren’t willing to promote these publications.
5.4.4 Overall Score
Referring to the performed measurements described earlier, namely the Usefulness Score, the Value Score, the
User Satisfaction Score and the NPS, an overall Perceived Utility Score is calculated.
To calculate the Overall Perceived Utility Score, all measurements are reduced to a five-point scale (the
statements used to calculate the Value Score are already expressed using a scale from 1 to 5, the Usefulness
Score had values from 1 to 7, NPS - from -100 to +100, and the User Satisfaction Score - from 0 to 100). In order
to determine the Overall Perceived Utility score, the average value of these four measurements is calculated. To
reduce any linear scale to a different linear scale the following formula13 is used:
Y = (B - A) * (x - a) / (b - a) + A
Y = Value after reducing to a five-point scale
x = Value in the initial scale
B = The highest value of the new scale (in this case it is 5, as we are reducing other scales to a five-point
scale)
A = The lowest value of the new scale (in this case it is 1, as we are reducing other scales to a five-point
scale)
b = The highest value of the original scale (for Net Promoter Score and User Satisfaction Score it is +
100, for Usefulness Score it is 7)
a = The lowest value of the original scale (for the Net Promoter Score it is 100, for the User Satisfaction
Score it is 0 and for the Usefulness Score it is 1)
Example of reducing User Satisfaction Score to a five-point scale:
(5-1) * (71.28 - 0) / (100 - 0) + 1 = 4 * 71.28 / 100 +1 = 285.12 / 100 + 1 = 2.85 + 1 = 3.85
13 Transforming different Likert scales to a common scale. IBM. Retrieved February 04. 2016., from http://www-01.ibm.com/support/docview.wss?uid=swg21482329
Page 27 of 35
Monitoring and Evaluation – Sharing and Reuse Perceived Utility Report April 2017
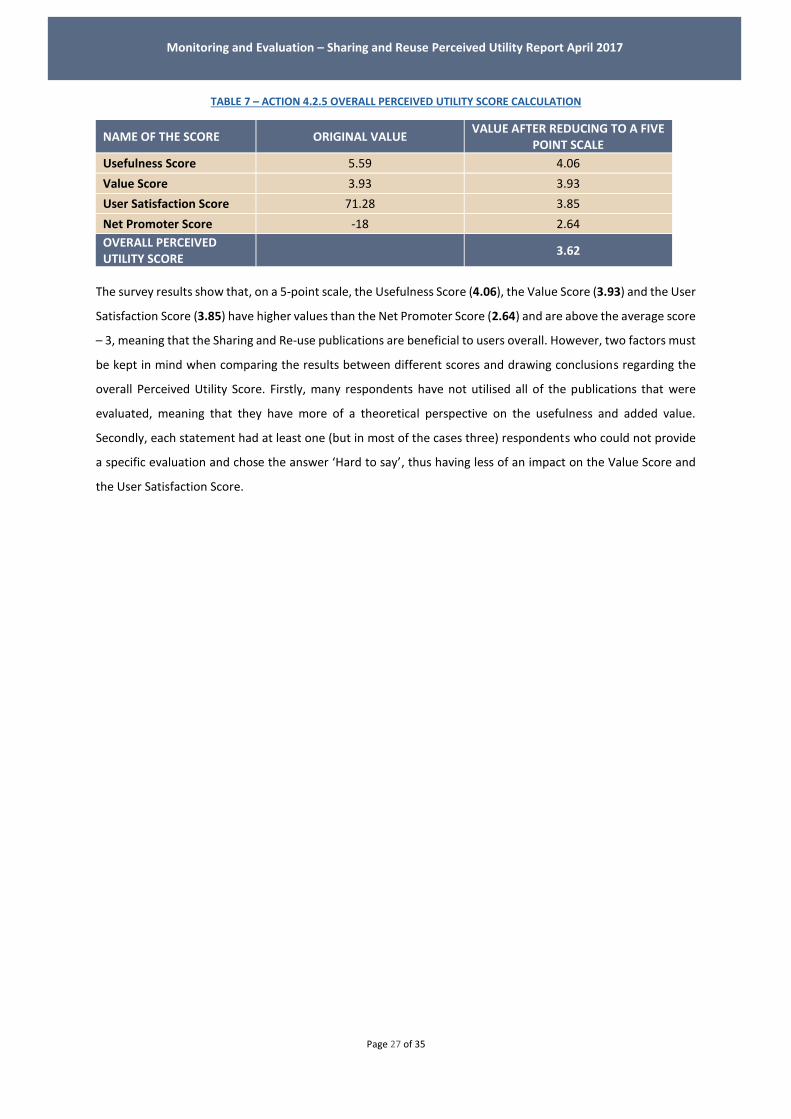
TABLE 7 – ACTION 4.2.5 OVERALL PERCEIVED UTILITY SCORE CALCULATION
The survey results show that, on a 5-point scale, the Usefulness Score (4.06), the Value Score (3.93) and the User
Satisfaction Score (3.85) have higher values than the Net Promoter Score (2.64) and are above the average score
– 3, meaning that the Sharing and Re-use publications are beneficial to users overall. However, two factors must
be kept in mind when comparing the results between different scores and drawing conclusions regarding the
overall Perceived Utility Score. Firstly, many respondents have not utilised all of the publications that were
evaluated, meaning that they have more of a theoretical perspective on the usefulness and added value.
Secondly, each statement had at least one (but in most of the cases three) respondents who could not provide
a specific evaluation and chose the answer ‘Hard to say’, thus having less of an impact on the Value Score and
the User Satisfaction Score.
NAME OF THE SCORE ORIGINAL VALUE VALUE AFTER REDUCING TO A FIVE
POINT SCALE
Usefulness Score 5.59 4.06
Value Score 3.93 3.93
User Satisfaction Score 71.28 3.85
Net Promoter Score -18 2.64
OVERALL PERCEIVED UTILITY SCORE
3.62
Page 28 of 35
Monitoring and Evaluation – Sharing and Reuse Perceived Utility Report April 2017
5.5 ACTION STRENGTHS, WEAKNESSES, INSIGNIFICANCE AND COMPLEMENTS
When analysing the data results of the dimensions’ conformity versus the dimensions’ importance, the action’s
strengths, weaknesses, insignificance and threats can be identified.
Statements are located in quadrants, based on the dimensions’ conformity statements and dimensions’
importance calculated mean values. The quadrants highlight the weak and strong aspects of the action, as well
as insignificance and complements.
In general, all the statements that are attributed to the action can be grouped into four categories:
Strengths – Essential to respondents and relevant to the action (1st quadrant);
Weaknesses – Essential to respondents but not relevant to the action (2nd quadrant);
Insignificance – Not essential to respondents and not relevant to the action (3rd quadrant);
Complements – Not essential to respondents but relevant to the action (4th quadrant).
Two colours are used to identify Perceived Utility dimensions in Figure 7:
Dark blue: Potential Re-usability;
Red: Collaboration.
Page 29 of 35
Monitoring and Evaluation – Sharing and Reuse Perceived Utility Report April 2017
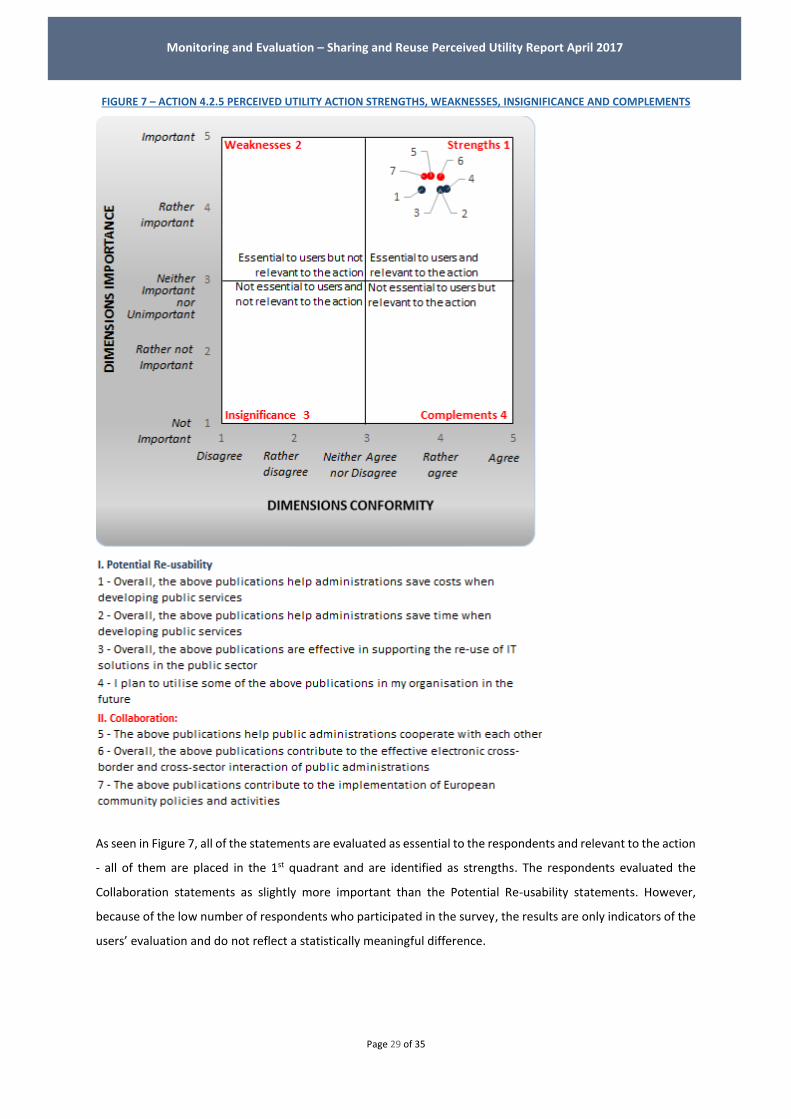
FIGURE 7 – ACTION 4.2.5 PERCEIVED UTILITY ACTION STRENGTHS, WEAKNESSES, INSIGNIFICANCE AND COMPLEMENTS
As seen in Figure 7, all of the statements are evaluated as essential to the respondents and relevant to the action
- all of them are placed in the 1st quadrant and are identified as strengths. The respondents evaluated the
Collaboration statements as slightly more important than the Potential Re-usability statements. However,
because of the low number of respondents who participated in the survey, the results are only indicators of the
users’ evaluation and do not reflect a statistically meaningful difference.
Page 30 of 35
Monitoring and Evaluation – Sharing and Reuse Perceived Utility Report April 2017
5.6 STATEMENTS BASED ON ACTION OBJECTIVES
For the purpose of describing the action’s objectives, statements based on action objectives were designed for
this survey. The respondents were asked to evaluate the extent to which these statements conform to the
particular action, namely, if the action’s objectives have been achieved.
The respondent is asked to provide his/her opinion using the 5-point Likert grading scale. For the dimensions’
conformity evaluation, a grading scale with values ranging from ‘Agree’ to ‘Disagree’ is applied. An additional
‘Hard to Say/Not Applicable’ option is provided; however, this score is excluded from the score calculations.
Before performing the survey data calculations, the 5-point Likert scale values are interpreted as numeric values:
5 – Agree;
4 – Rather Agree;
3 – Neither Agree nor Disagree;
2 – Rather Disagree;
1 – Disagree;
0 – Hard to Say/Not Applicable (is not considered for the calculation).
In order to have an overview of the positive and negative attitude proportions, the bar in blue represents the
negative attitude (answers ‘Disagree’ and ‘Rather Disagree’), whereas the bars in pink/red represent the positive
attitude (answers ‘Agree’ and ‘Rather Agree’). In addition, a neutral opinion (the bars in white) and the answer
‘Hard to say’ (the bars in grey) are presented separately on the right. An explanatory legend with colour codes
represents the available data. The average mean values are presented on the right side of the figure.

Page 31 of 35
Monitoring and Evaluation – Sharing and Reuse Perceived Utility Report April 2017
FIGURE 8 – ACTION 4.2.5 STATEMENTS BASED ON ACTION OBJECTIVES
The survey results demonstrate that both of the statements which are based on action objectives have been
evaluated as somewhat relevant to the action. Both of the statements have a higher mean value than the value
3 - 'Neither Agree nor Disagree'. However, in each case three respondents could not evaluate them and chose
the answer ‘Hard to Say’, meaning that the mean value was calculated based on the opinion of eight
respondents. From these eight respondents, one provided a negative answer in each case, while three
respondents chose a neutral answer. It means that from those respondents who provided a specific evaluation,
half had a positive attitude.

Page 32 of 35
Monitoring and Evaluation – Sharing and Reuse Perceived Utility Report April 2017
5.7 RESPONDENT RECOMMENDATIONS AND OPINIONS
This section provides an overview of the feedback received on Sharing and Re-use project as a whole with its
publications. It should be noted that each response is given by a single survey respondent, which means that
the number of different answers to each question is the same as the number of respondents who had an opinion
or a recommendation to the specific question.
TABLE 8 – ACTION 4.2.5 RECOMMENDATIONS AND BENEFITS
“Do you have any recommendations to improve the “Sharing and Re-use”, taking into consideration the project as a whole with its publications?”
More visibility inside the Commission
To help national administrations to promote at national level
"What are the main benefits or the most valuable things about the “Sharing and Re-use” publications?"
They would contribute to the electronic cross-border interaction of public administrations
Provide practical statements that can be directly used (e.g. clauses for contracts)

Page 33 of 35
Monitoring and Evaluation – Sharing and Reuse Perceived Utility Report April 2017
6 SURVEY CONCLUSION AND RECOMMENDATIONS
The objective of the survey was to evaluate the Perceived Utility of Action 4.2.5 – Sharing and Re-use. The
following conclusions have been drawn based on the analysis performed:
o The ISA Action 4.2.5 – Sharing and Reuse received a good Perceived Utility assessment with an Overall
Perceived Utility Score of 3.62 out of 5. The Overall Perceived Utility Scores and the positive values of
the individual parameters (except the Net Promoter Score) indicate that, overall, the respondents
consider Sharing and Re-use beneficial.
o Respondents are most familiar with the “Report on policies and initiatives on sharing and re-use” and
the “Sharing and re-use framework” publications as more than half of the respondents have read or
utilised them, while other publications are less known by the respondents.
o Respondents who had not heard about a specific publication before the survey would like to read about
them.
o Potential Re-usability and Collaboration of Sharing and re-use publications are important to the
respondents.
o Half of the respondents who did provide a specific answer (four out of eight) regarding the Statements
based on action objectives think that Sharing and Re-use is meeting its objectives. Three respondents
out of eight had a neutral evaluation.
o Two respondents recommended to promote Sharing and Re-use publications: within the European
Commission and on a national level as well.
Based on the conclusions drawn, CGI-Accenture adduces the following recommendations:
o To continue promoting Sharing and Re-use within the European Commission and Member States to
increase the usage of the publications as all of the respondents find them useful.
o Additional further investigation should be done on how the publications are promoted, because based
on the survey results, respondents are not fully familiar with all of the publications available.

Page 34 of 35
Monitoring and Evaluation – Sharing and Reuse Perceived Utility Report April 2017
7 APPENDIX
7.1 RAW DATA EXPORT The attached file contains the survey result export.
Raw Data.xls

Page 35 of 35
Monitoring and Evaluation – Sharing and Reuse Perceived Utility Report April 2017
7.2 GLOSSARY
A Likert Scale is a widely used scaling method
developed by Rensis Likert. Likert scale refers to
the use of an ordinal 4- or 5- point rating scale
with each point anchored or labelled.
The mean9 (average) is the most popular measure
of location or central tendency; has the desirable
mathematical property of minimizing the
variance. To get the mean, you add up the values9
for each case and divide that sum by the total
number of cases;
Mode9 refers to the most frequent, repeated or
common value in the quantitative or qualitative
data. In some cases it is possible that there are
several modes or none;
The Net Promoter Score® (NPS) is a widely used
management tool that helps evaluate the loyalty
of a customer relationship. Customers are
classified as Promoters, Passive and Detractors.
‘Perceived Quality’ is defined as the extent to
which the outputs of an ISA action are meeting its
direct beneficiaries’ expectations;
Standard deviation9 shows the spread, variability
or dispersion of scores in a distribution of scores.
It is a measure of the average amount the scores
in a distribution deviate from the mean. The more
widely the scores are spread out, the larger the
standard deviation;
Standard error9 is the standard deviation of the
sampling distribution of a statistic. It is a measure
of sampling error; it refers to error in estimates
due to random fluctuations in samples. It goes
down as the number of cases goes up. The smaller
the standard error, the better the sample statistic
is as an estimate of the population parameter – at
least under most conditions;
‘Perceived Utility’ is defined as the extent to which
the effects (impact) of an ISA action correspond
with the needs, problems and issues to be
addressed by the ISA programme;