Embed Size (px)
Citation preview
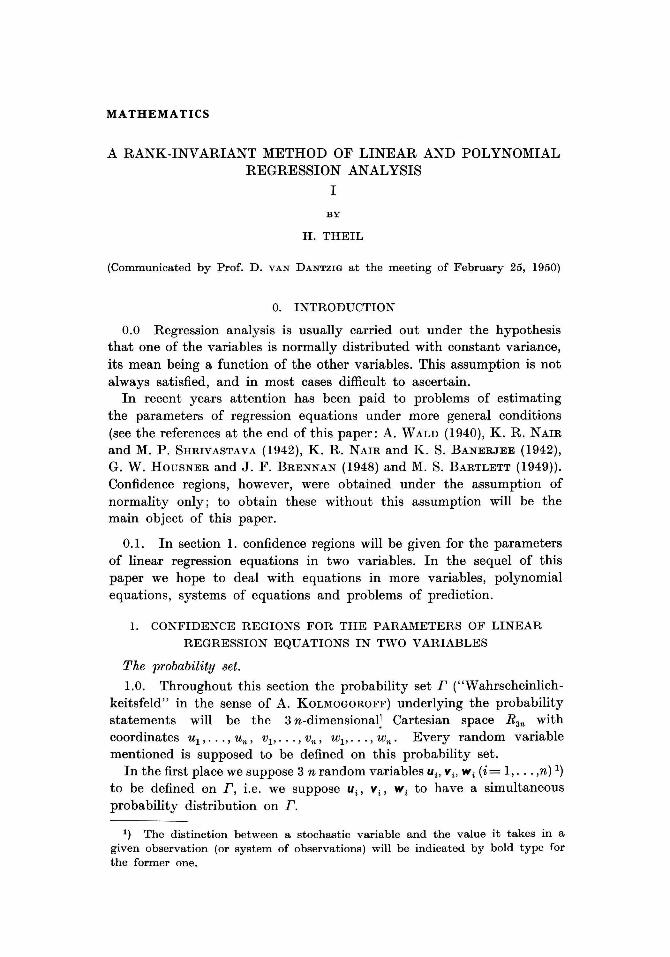
MATHEMA TICS
A RANK-INVARIANT METHOD OF LINEAR AND POLYNOMIAL REGRESSION ANALYSIS
I
BY
H. TREIL
(Communicated by Prof. D. VAN DANTZIG at the meeting of February 25, 1950)
O. INTRODUCTION
0.0 Regression analysis is usually carried out under the hypo thesis that one of the variables is normally distributed with constant variance, its mean being a function of the other variables. This assumption is not always satisfied, and in most cases difficult to ascertain.
In recent years attention has been paid to problems of estimating the parameters of regression equations under more general conditions (see the references at the end of th is paper: A. WALD (1940), K. R. NAIR and M. P. SHRIVASTAVA (1942), K. R. NAIR and K. S. BANERJEE (1942), G. W. HOUSNER and J. F. BRENNAN (1948) and M. S. BARTLETT (1949)). Confidence regions, however, were obtained under the assumption of normality only; to obtain these without th is assumption will be the main object of th is paper.
0.1. In section 1. confidence regions will be given for the parameters of linear regression equations in two variables. In the sequel of this paper we hope to deal with equations in more variables, polynomial equations, systems of equations and problems of prediction.
1. CONFIDENCE REGIONS FOR TRE PARAMETERS OF LINEAR
REGRESSION EQUATIONS IN TWO VARIABLES
The probability set.
l.O. Throughout this section the probability set r ("Wahrscheinlichkeitsfeld" in the sen se of A. KOLMOGOROFF) underlying the probability statements will be the 3 n-dimensional: Cartesian space R3n with coordinates UI " '" U ,. , VI>"" V,., W 1, ... , w,. . Every random variabie mentioned is supposed to be defined on this probability set.
In the first place we suppose 3 n random variables Ui' V i ' W i (i= 1, ... ,n) 1) to be defined on r, i.e. we suppose Ui ' V i ' W i to have a simultaneous probability distribution on r.
1) The distinction bet ween a stochast ie variabie and the value it takes in a given observation (or system of observations) will be indicated by bold type for the former one.
387
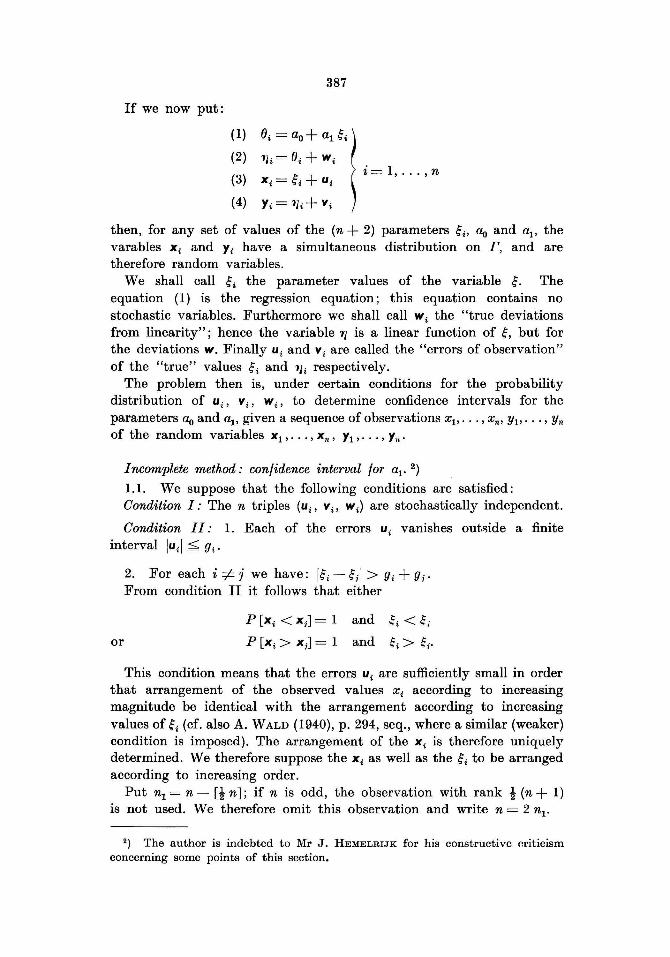
If we now put:
(1) ()i = ao+ al~'
(2) 1li= ()i + w i
(3) x i = $i + Ui i= 1, ... , n
(4) Yi= 11i+ Vi
then, for any set of values of the (n + 2) parameters $i' ao and al> the varables Xi and Yi have a simultaneous distribution on r, and are therefore random variables.
We shall eaU $. the parameter values of the variabie $. The equation (1) is the regression equation; this equation eontains no stoehastie variables. Furthermore we shaU eaU w i the "true deviations from linearity"; henee the variabie 1] is a linear funetion of $, but for the deviations w. Finally Ui and Vi are ealled the "errors of observation" of the "true" values $i and 11i respeetively.
The problem then is, under eertain eonditions for the probability distribution of Ui' Vi' W i , to determine eonfidenee intervals for the parameters ao and al' given a sequenee of observations Xl>' •. , Xn , Yl" .. , y" of the random variables Xl" .. , X n , Yl"'" y".
Incomplete method,' contidence interval tor al' 2)
1.1. We suppose that the foUowing eonditions are satisfied: Oondition 1: The n triples (Ui' Vi' W i ) are stochastieally independent.
Oondition 11,' 1. Eaeh of the errors Ui vanishes outflide a finite intervaliuil < gi'
or
2. For eaeh i =I=- j we have: I$i - $il > gi + gi' From eondition II it follows that either
P[X i <xi ]=1 and ~i<~j
P [Xi> Xi] = 1 and ~i > ~i'
This eondition means that the errors Ui are suffieiently small in order that arrangement of the observed va lues Xi aecording to inereasing magnitude be identieal with the arrangement aeeording to inereasing values of $i (ef. also A. WALD (1940), p. 294, seq., where a similar (weaker) eondition is imposed). The arrangement of the Xi is therefore uniquely determined. We therefore suppose the Xi as well as the $i to be arranged aecording to inereasing order.
Put n l = n - [t n]; if n is odd, the observation with rank i (n + 1) is not used. We therefore omit this observation and write n = 2 nl'
2) The author is indebted to MI' J. HEMELRIJK for his constructive p.l'iticism concerning some points of th is section.
388
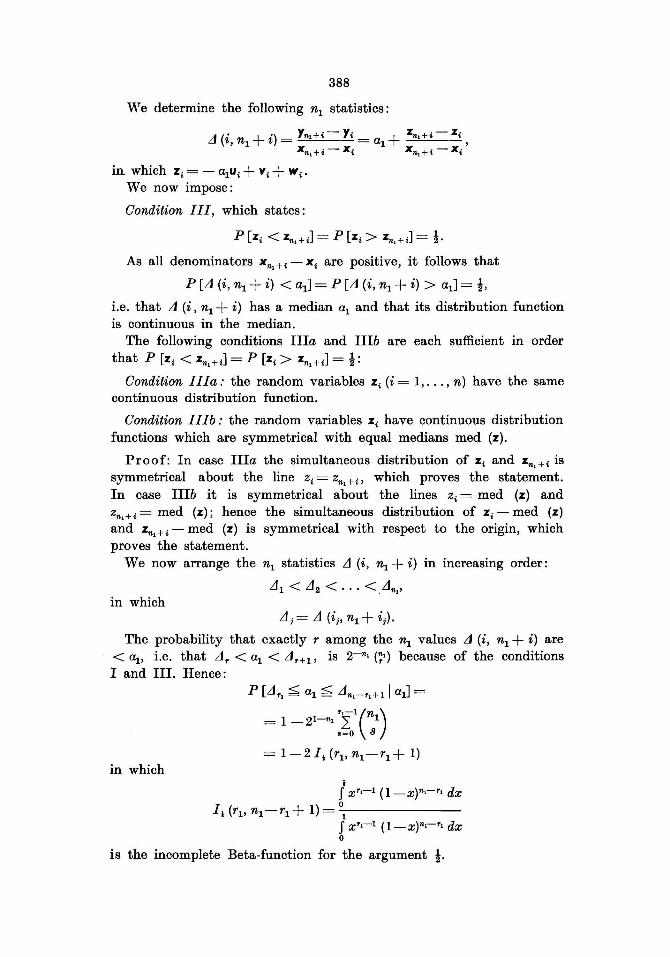
'We determine the following nl statistics :
A (i n + i) - Yn,+< - Yi _ a + zn,+i - Z, '1 - - 1 ,
Xn,+i-Xi X",+i-Xi
in which Zi = - alu i + Vi + w i •
We now impose:
Corulition lIl, which states:
P [Zi < zn,+i] = P [Zi > Zn,+i] = i. As all denominators x n , +i - Xi are positive, it follows that
P [A (i, nl + i) < al] = P [A (i, n l + i) > al] = i, i.e. that A (i, nl + i) has a median al and that its distribution function is continuo us in the median.
The following conditions IIIa and IIIb are each sufficient in order
that P [Zi < Zn,+i] = P [Zi> Zn,+i] = i: Condition lIla: the random variables Zi (i = 1, ... , n) have the same
continuous distribution function.
Condition IIIb: the random variables Zi have continuous distribution functions which are symmetrical with equal medians med (z).
Proof: In case IIIa the simultaneous distribution of Zi and zn, +i is symmetrical about the line Zi = zn, + i' which proves the statement. In case IIIb it is symmetrical about the lines Zi = med (z) and zn, +i = med (z); hen ce the simultaneous distribution of Zi - med (z) and zn,+i - med (z) is symmetrical with respect to the origin, which proves the statement.
We now arrange the nl statistics .1 (i, nl + i) in increasing order:
.1 1 < .1 2 < ... < ,.1n"
in which .1 j = .1 (ij, n l + ij).
The probability that exactIy r among the nl values A (i, nl + i) are < al> i.e. that .1. < al < AT+l' is 2-n, (~,) because of the conditions land IIl. Hence:
in which
= 1 _21-n, 2: 1 "-I(n) 8- 0 8
= 1-2I,(r1,nl -rl + 1)
, J XT,-1 (1- x)n.-T, dx
I, (rl' nI-rl + 1) = -°1-------J x·,-1 (l_x)n,-T, dx
° is the incomplete Beta-function for the argument i.
389
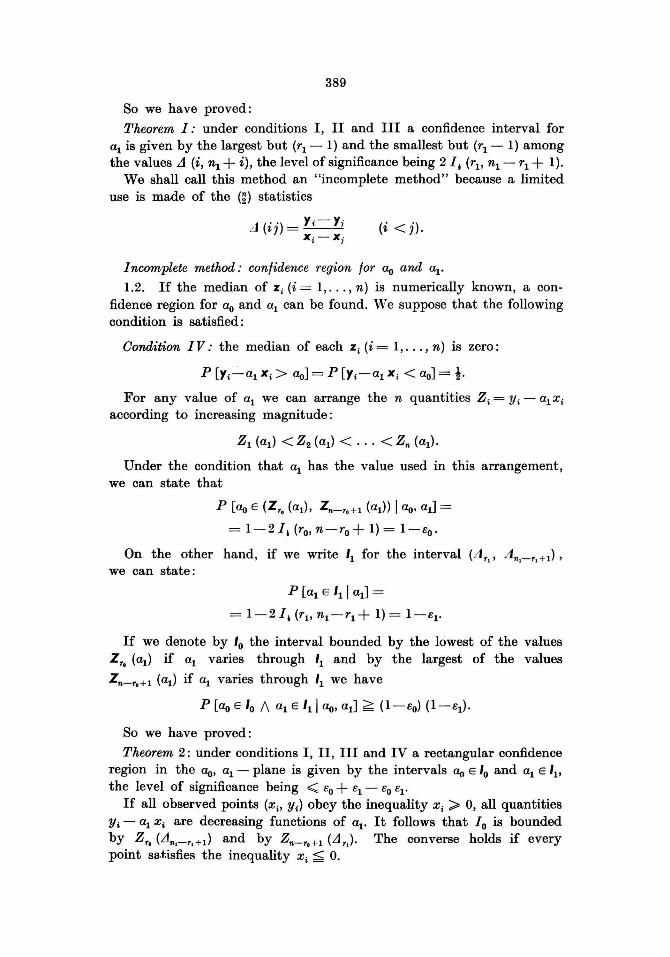
80 we have proved:
Theorem I.' under conditions I, 11 and 111 a confidence interval for al is given by the largest but (rl - 1) and the smallest but (rl - 1) among the values LI (i, n l + i), the level ofsignificance being 211 (rl> n l - r l + 1).
We shall call this method an "incomplete method" because a limited use is made of the m statistics
.4(") Yi-Yi LI ~7 =---
Xi-Xi (i < j).
Incomplete method.' contidence region tor ao and UI'
1.2. If the median of Z i (i = 1, ... , n) is numerically known, a confidence region for ao and al can be found. We suppose that the following condition is satisfied:
Condition I V.' the median of each Zi (i = 1, ... , n) is zero:
P [YC:'-al X i > ao] = P [Yi-al Xi < aD] = !. For any value of al we can arrange the n quantities Zi = Y i - al Xi
according to increasing magnitude:
Zl (al) < Z2 (al) < ... < Zn (al)'
Under the condition that al has the value used in this arrangement, we can state that
P [ao E (Zr. (al)' Zn-r. +l (al)) I ao. al] =
= I-2I.(ro,n-ro+ 1)= I-Eo'
On the other hand, if we write 'I for the interval (.J rl , AnI-rl +1) , we can state:
P [al E '11 al] = = 1-211 (rl,nl-rl + 1)= I-El'
If we denote by '0 the interval bounded by the lowest of the values Zr, (al) if al varies through 'I and by the largest of the values
Zn-r.+1 (al) if al varies through 'I we have
80 we have proved:
Theorem 2: under conditions I, 11, 111 and IV a rectangular confidence region in the <Io, al - plane is given by the intervals Uo E '0 and al E 'I' the level of significance being ,,;;;;; Eo + El - EO El'
If all observed points (Xi' Yi) obey the inequality Xi > 0, all quantities Yi - al Xi are decreasing functions of al' It follows that 10 is bounded by Zr, (Llnl-rl+l) and by Zn-r,+l (Llr). The converse holds if every point sa.t.isfies the inequality Xi ~ 0.
390
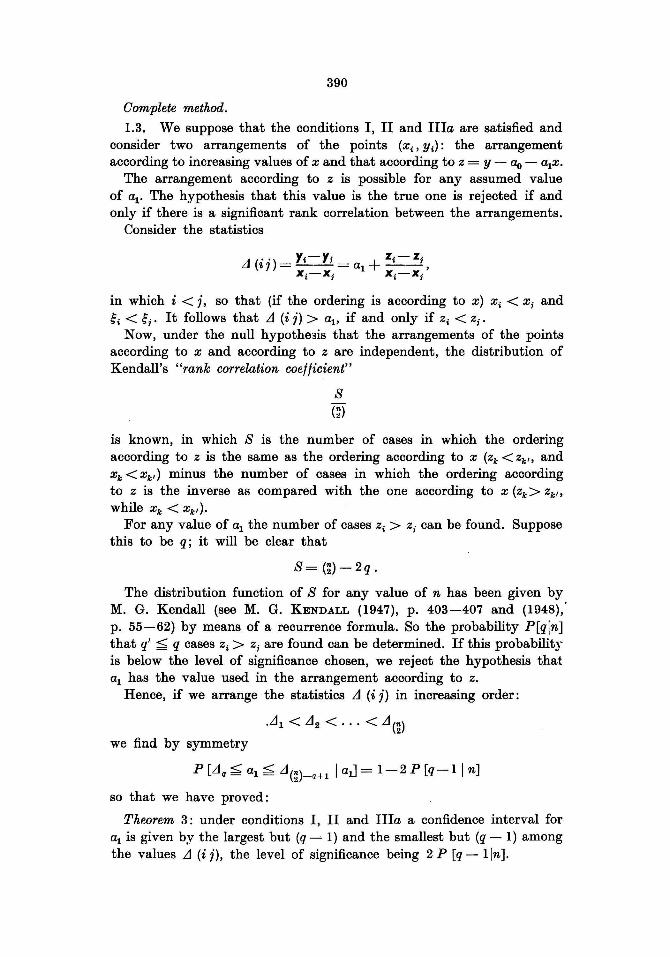
Complete method.
1.3. We suppose that the conditions I, U and UIa are satisfied and consider two arrangements of the points (Xi' Yi): the arrangement according to increasing values of X and that according to Z = Y - Clo - alx.
The arrangement according to Z is possible for any assumed value of al' The hypothesis that this value is the true one is rejected if and only if there is a significant rank correlation between the arrangements.
Consider the statistics
in which i < j, so that (if the ordering is according to x) Xi < Xi and ;i < ~i' It follows that ,1 (i j) > al> if and only if Zi < Zi'
Now, under the null hypothe3is that the arrangements of the points according to x and according to Z are independent, the distribution of Kendall's "rank correlation coe.flicient"
s m
is known, in which S is the number of cases in which the ordering according to Z is the same as the ordering according to x (Zk < Zkf, and Xk < Xkf) minus the number of cases in which the ordering according to Z is the inverse as compared with the one according to x (Zk> Zkf,
while Xk < Xkf).
For any value of al the number of cases Zi > Zj can be found. Suppose this to be q; it will be clear that
S= (~)-2q.
The distribution function of S for any value of n has been given by M. G. KendalI (see M. G. KENDALL (1947), p. 403-407 and (1948)'p. 55-62) by means of a recurrence formula. So the probability P[qln] that q' ~ q cases Zi > zi are found can be determined. If this probability is below the level of significance chosen, we reject the hypothesis that al has the value used in the arrangement according to z.
Rence, if we arrange the statistics ,1 (i j) in increasing order:
.,11 < ,12 < ... < L1(~)
we find by symmetry
P [LI q ~ al ~ LI m-H 1 I al] = 1-2 P [q - 1 In]
so that we have proved:
Theorem 3: under conditions I, U and lIla a confidence interval for al is given by the largest but (q ~ 1) and the smallest but (q - 1) among the values ,1 (i j), the level of significance being 2 P [q - 1 In].
391
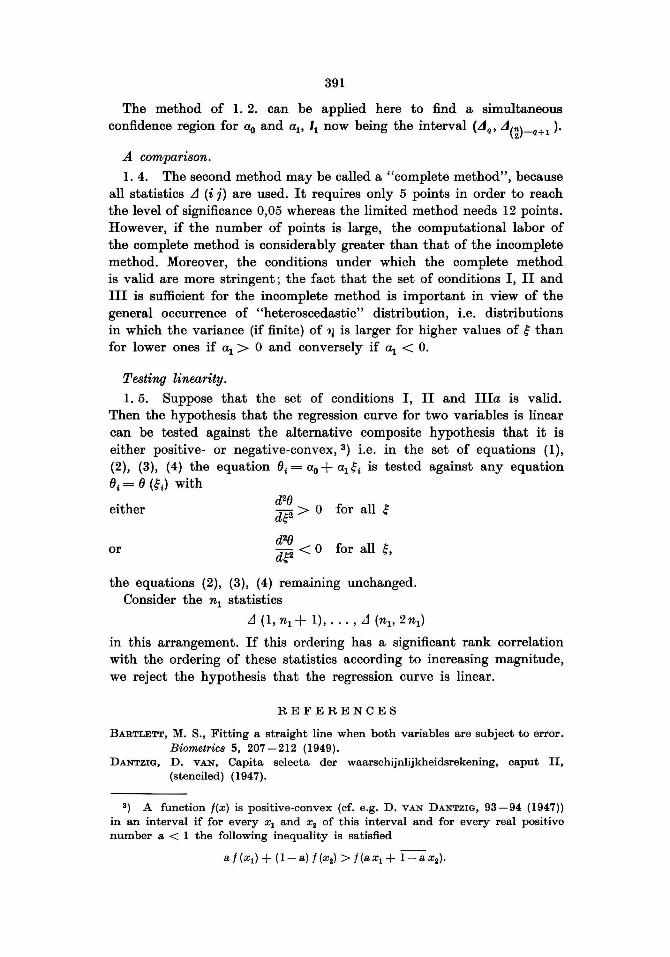
The method of 1. 2. can be applied here to find a simultaneous confidence region for ao and al' '1 now being the interval (A q , Am-Hl ).
A comparison.
1. 4. The second method may be called a "complete method", because all statistics L1 (i j) are used. It requires only 5 points in order to reach the level of significance 0,05 whereas the limited method needs 12 points. However, if the number of points is large, the computational labor of the complete method is considerably greater than that of the incomplete method. Moreover, the conditions under which the complete method is valid are more stringent; the fact that the set of conditions I, II and III is sufficient for the incomplete method is important in view of the general occurrence of "heteroscedastic" distribution, i.e. distributions in which the variance (if finite) of 1/ is larger for higher values of ~ than for lower ones if al> 0 and conversely if al < o.
Testing linearity.
1. 5. Suppose that the set of conditions l, II and lIla is valid. Then the hypothesis that the regression curve for two variables is linear can be tested against the alternative composite hypothesis that it is either positive- or negative-convex,3) i.e. in the set of equations (1), (2), (3), (4) the equation (Ji = ao + al ~i is tested against any equation (Ji = (J (~i) with
either d2(J
d~2 > 0 for all ~
d2(J for all ~, or d~<O
the equations (2), (3), (4) remaining unchanged. Consider the n l statistics
L1 (1, n l + 1), ... , J (nI' 2n l )
in this arrangement. If this ordering has a significant rank correlation with the ordering of these statistics according to increasing magnitude, we reject the hypothesis that the regression curve is linear.
REFERENCES
BARTLETT, M. S., Fitting a straight !ine when both variables are subject to error. Biometric8 5, 207 -212 (1949).
DANTZIG, D. VAN, Capita selecta der waarschijnlijkheidsrekening, caput Il, (stenciled) (1947).
3) A function f(x) is positive-convex (cf_ e.g. D. VAN DANTZIG, 93-94 (1947)) in an interval if for every Xl and Xa of this interval and for every real posit.ive number a < 1 the following inequality is satisfied
a f (Xl) + (1- a) f (x2) > f (a Xl + 1- a x 2).
392
HOUSNER, G. W. and J. F. BRENNAN, The estimation of linear trends. Annala of Mathematical Statistica, 19, 380-388 (1948).
KENDALL, M. G., The advanced theory of statistics, London, 1, 3rd edition (1947).
----, Rank correlation methods, London (1948). NAIR, K. R. and K. ·S. BANERJEE, A note on fitting of straight lines if both
variables are subject to error. Sankhya, 6, 331 (1942). and M. P. SHRIVASTAVA, On a simple method of curve fitting. Sankhya, 6, 121-132 (1942).
WALD, A., The fitting of straight lines if both variables are subject to error. Annals of mathematical statistics, 11, 284-300 (1940).
Publication of the Statistical Department of the "Mathematisch Centrum", Amsterdam.

![Dantzig Wolfe Decomposition - Université catholique … · Contents 1 Algorithm Description [Infanger, Bertsimas] 2 Examples [Bertsimas] 3 Application of Dantzig-Wolfe in Stochastic](https://img.pdfslide.us/doc/110x75/5b90f7ac09d3f2e6728d1f69/dantzig-wolfe-decomposition-universite-catholique-contents-1-algorithm-description.jpg)