Embed Size (px)
DESCRIPTION
D iabetes RE duction A ssessment with ramipril and rosiglitazone M edication (DREAM) trial. Worldwide prevalence of diabetes expected to increase. World Health Organization, 2000 vs 2030. Diabetes prevalence ~171 million in 2000 ~ 366 million in 2030. 140. 155%. 120. 100. 99%. - PowerPoint PPT Presentation
Citation preview
Diabetes REduction Assessment with ramipril and rosiglitazone Medication (DREAM) trial
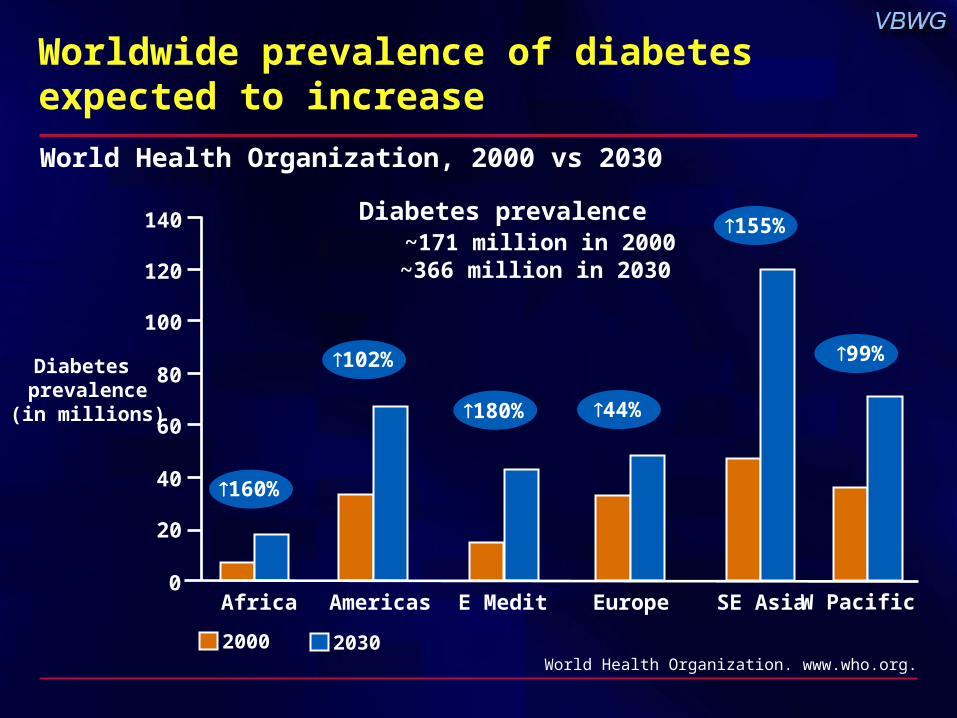
Worldwide prevalence of diabetes expected to increase
Diabetes prevalence ~171 million in 2000 ~366 million in 2030
World Health Organization, 2000 vs 2030
World Health Organization. www.who.org.
0
20
40
60
80
100
120
140
Africa Americas E Medit Europe SE Asia W Pacific
Diabetes prevalence(in millions)
2000 2030
102%
160%
180% 44%
155%
99%
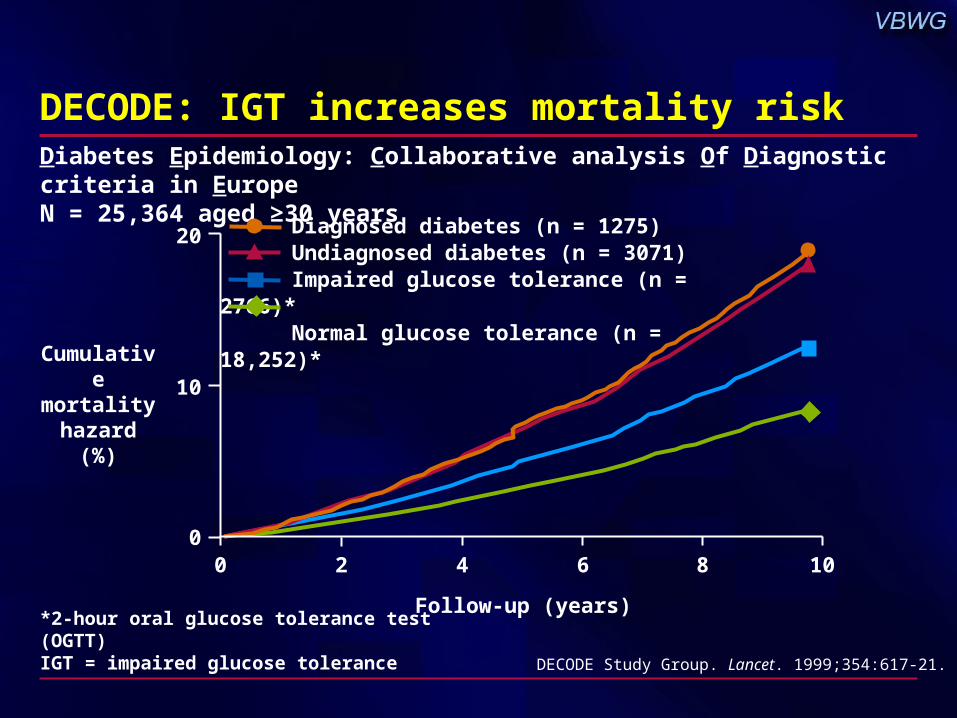
DECODE: IGT increases mortality risk
Diagnosed diabetes (n = 1275)Undiagnosed diabetes (n = 3071)Impaired glucose tolerance (n = 2766)*Normal glucose tolerance (n = 18,252)*
Follow-up (years)
Cumulative mortalityhazard
(%)
DECODE Study Group. Lancet. 1999;354:617-21.
*2-hour oral glucose tolerance test (OGTT)IGT = impaired glucose tolerance
Diabetes Epidemiology: Collaborative analysis Of Diagnostic criteria in EuropeN = 25,364 aged ≥30 years
20
10
00 2 4 6 8 10
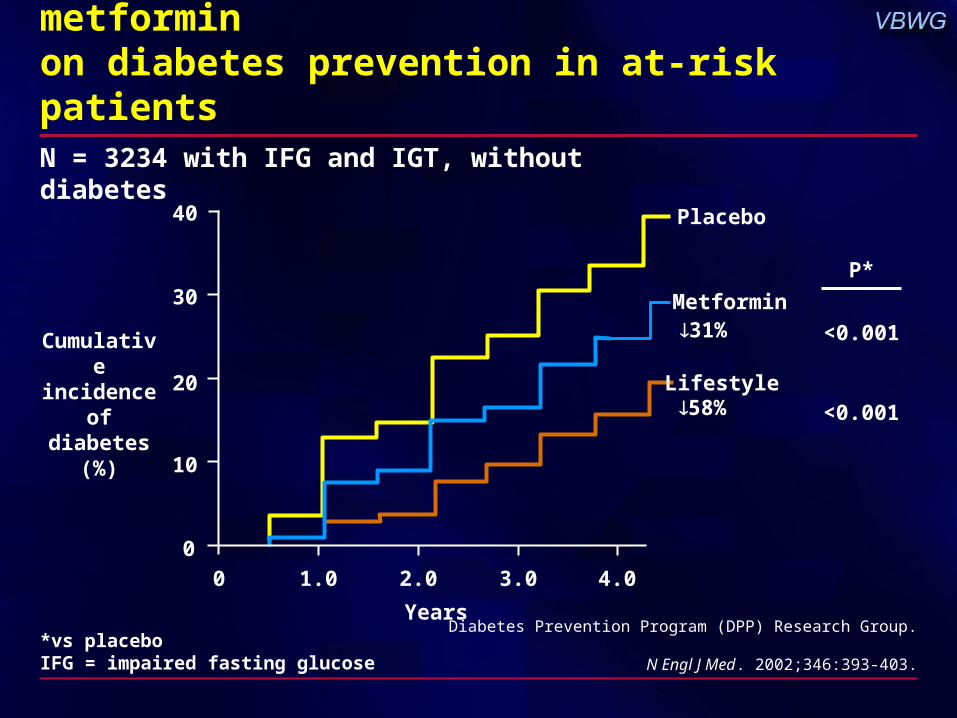
DPP: Benefit of diet + exercise or metformin on diabetes prevention in at-risk patients
Diabetes Prevention Program (DPP) Research Group. N Engl J Med. 2002;346:393-403.
Years
N = 3234 with IFG and IGT, without diabetes
0
0
10
20
30
40
1.0 2.0 3.0 4.0
Placebo
Metformin
Lifestyle
Cumulativeincidence
of diabetes(%)
31%
58%
P*
<0.001
<0.001
*vs placeboIFG = impaired fasting glucose
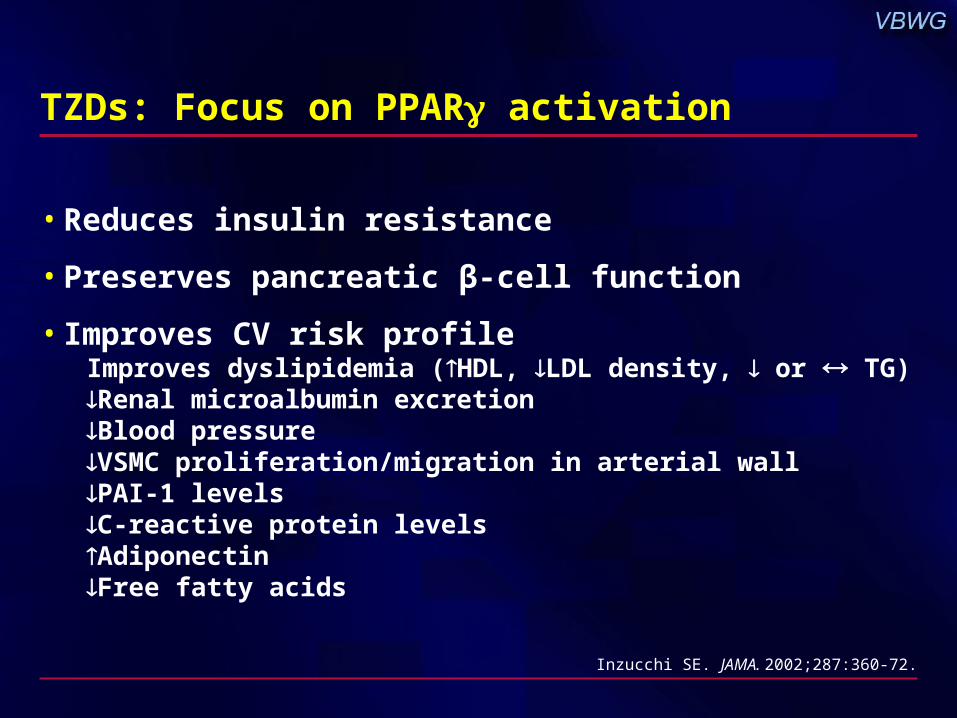
TZDs: Focus on PPAR activation
• Reduces insulin resistance
• Preserves pancreatic β-cell function
• Improves CV risk profileImproves dyslipidemia (HDL, LDL density, or TG)Renal microalbumin excretionBlood pressureVSMC proliferation/migration in arterial wallPAI-1 levelsC-reactive protein levelsAdiponectinFree fatty acids
Inzucchi SE. JAMA. 2002;287:360-72.
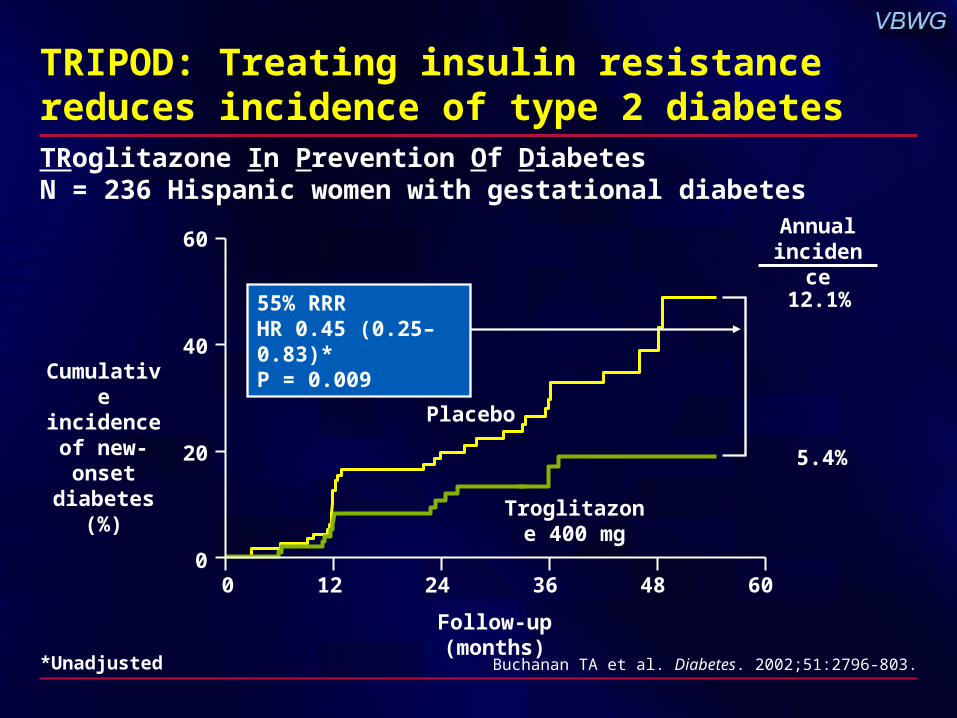
TRIPOD: Treating insulin resistance reduces incidence of type 2 diabetesTRoglitazone In Prevention Of DiabetesN = 236 Hispanic women with gestational diabetes
60
40
20
0
Cumulative incidence of new-onset
diabetes (%)
Follow-up (months)
0 12 24 36 48 60
Buchanan TA et al. Diabetes. 2002;51:2796-803.
Placebo
Troglitazone 400 mg
12.1%
5.4%
Annual incidence
55% RRRHR 0.45 (0.25–0.83)*P = 0.009
*Unadjusted
0
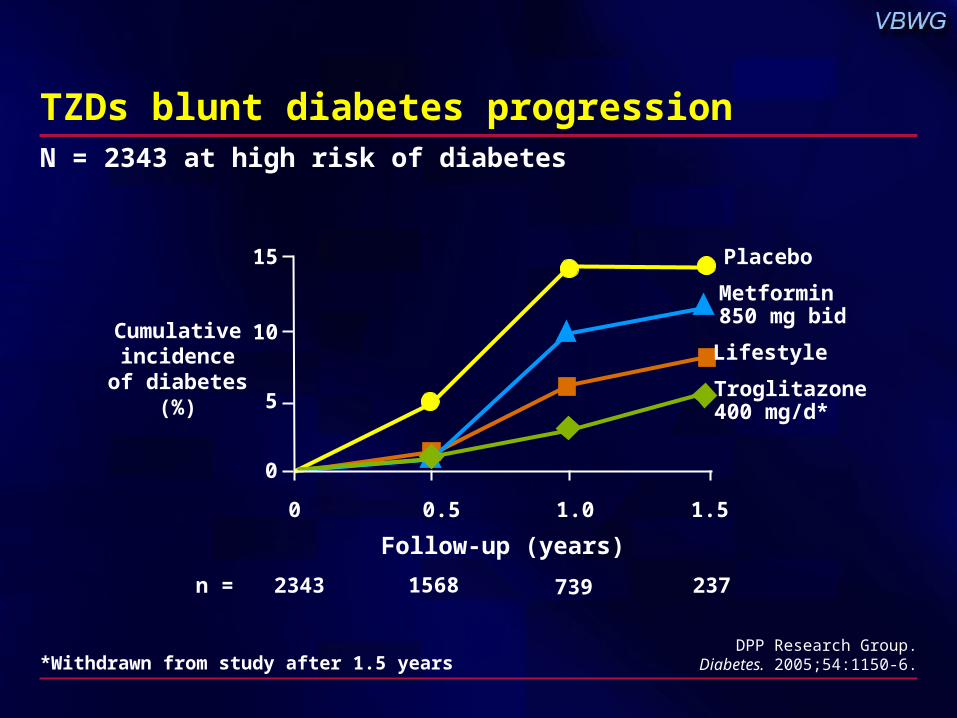
TZDs blunt diabetes progression
DPP Research Group.Diabetes. 2005;54:1150-6.*Withdrawn from study after 1.5 years
10
15
5
1.5
Cumulativeincidence
of diabetes(%)
Follow-up (years)
1.00.50
Placebo
Metformin850 mg bid
Lifestyle
Troglitazone400 mg/d*
23773915682343n =
N = 2343 at high risk of diabetes
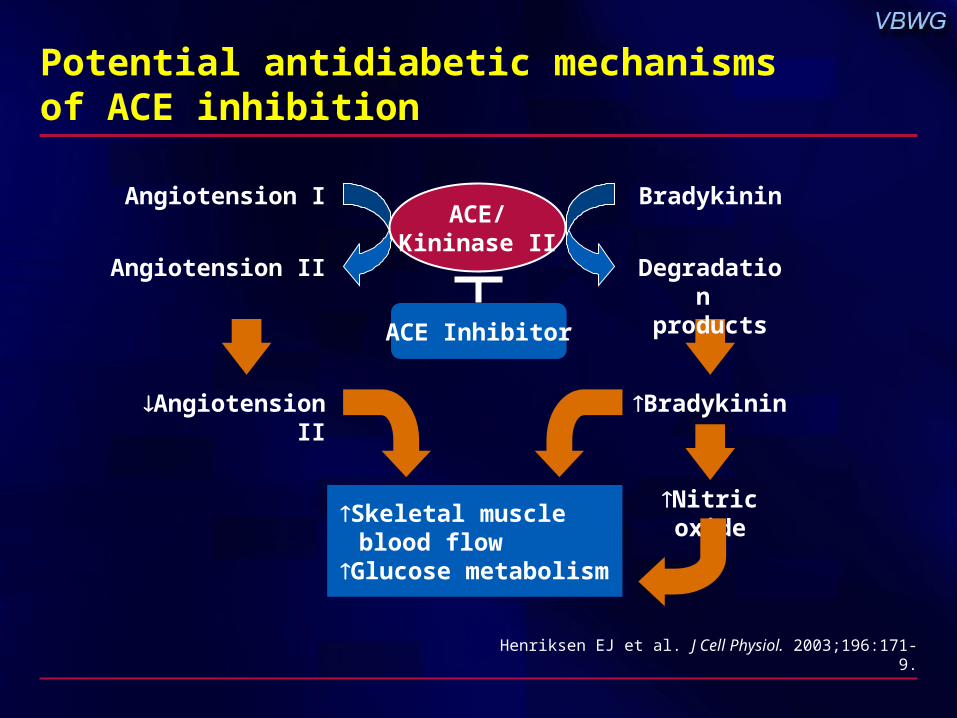
Potential antidiabetic mechanisms of ACE inhibition
Henriksen EJ et al. J Cell Physiol. 2003;196:171-9.
ACE/Kininase II
ACE Inhibitor
Angiotension I
Angiotension II
Bradykinin
Degradation products
BradykininAngiotension II
Nitric oxideSkeletal muscle blood flow
Glucose metabolism

HOPE, EUROPA, PEACE: Reduction in new-onset diabetes (placebo-controlled trials)
0
2
4
6
8
10
12
14
HOPE EUROPA PEACE Pooled data
New-onset diabetes
(%)
Placebo ACEI
Dagenais GR et al. Lancet. 2006;368:581-8.
n = 23,340 free from diabetes* at baseline
Ramipril 10 mg
Perindopril 8 mg
Trandolapril 4 mg
Overall 14% RRRHR 0.86 (0.78–0.95)P = 0.0023
(all trials)
*Not a prespecified end point
DREAM Trial Investigators. Diabetologia. 2004;47:1519-27.
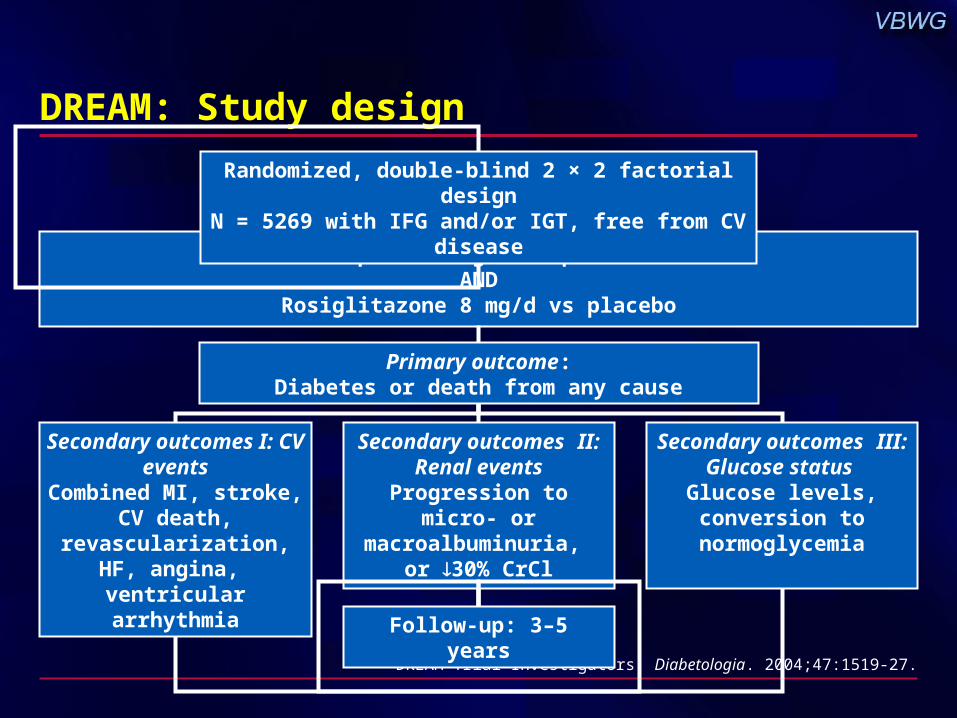
DREAM: Study design
Primary outcome:Diabetes or death from any cause
Secondary outcomes I: CV events
Combined MI, stroke, CV death, revascularization,
HF, angina, ventricular arrhythmia
Secondary outcomes II: Renal events
Progression to micro- or macroalbuminuria,
or 30% CrCl
Ramipril 15 mg/d vs placeboAND
Rosiglitazone 8 mg/d vs placebo
Randomized, double-blind 2 × 2 factorial designN = 5269 with IFG and/or IGT, free from CV disease
Follow-up: 3–5 years
Secondary outcomes III: Glucose status Glucose levels,conversion to
normoglycemia
Ramipril + Rosiglitazone
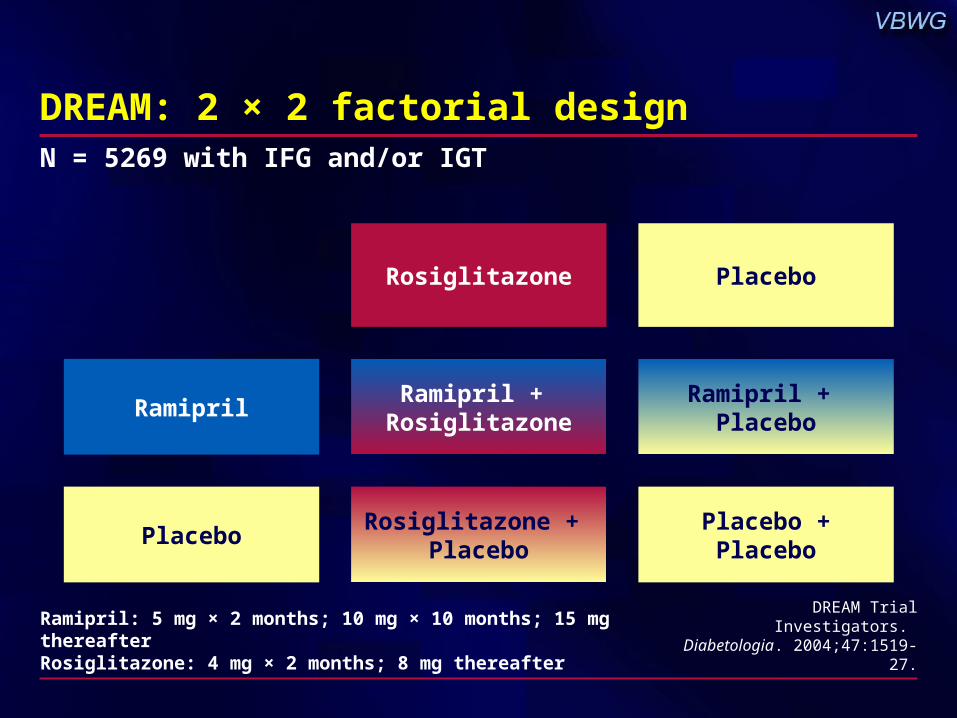
DREAM: 2 × 2 factorial design
DREAM Trial Investigators. Diabetologia. 2004;47:1519-27.
N = 5269 with IFG and/or IGT
Ramipril
Rosiglitazone Placebo
Ramipril + Placebo
PlaceboRosiglitazone +
PlaceboPlacebo +Placebo
Ramipril: 5 mg × 2 months; 10 mg × 10 months; 15 mg thereafterRosiglitazone: 4 mg × 2 months; 8 mg thereafter
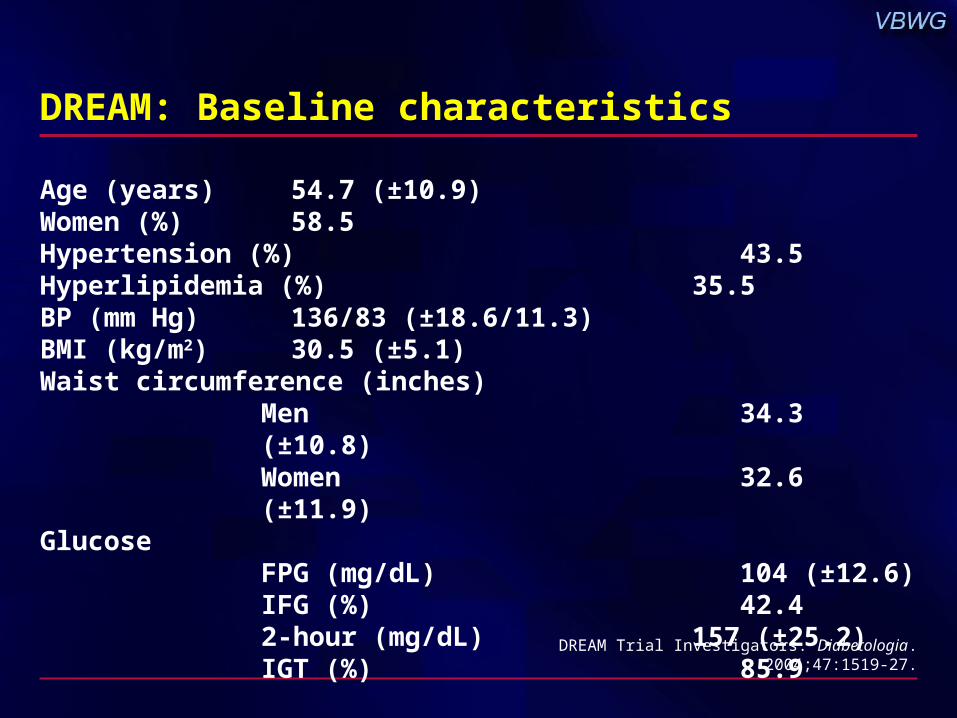
DREAM: Baseline characteristics
Age (years) 54.7 (±10.9)Women (%) 58.5Hypertension (%) 43.5Hyperlipidemia (%) 35.5BP (mm Hg) 136/83 (±18.6/11.3)BMI (kg/m2) 30.5 (±5.1) Waist circumference (inches)
Men 34.3 (±10.8)Women 32.6 (±11.9)
GlucoseFPG (mg/dL) 104 (±12.6)IFG (%) 42.42-hour (mg/dL) 157 (±25.2)IGT (%) 85.9
DREAM Trial Investigators. Diabetologia. 2004;47:1519-27.

DREAM: Rosiglitazone effect on primary outcome
No. at riskPlaceboRosiglitazone
DREAM Trial Investigators. Lancet. 2006;368:1096-1105.
26342635
24702538
21502414
11481310
177217
0.6
0.5
0 1 2 3 4
Follow-up (years)
0.4
0.3
0.2
0.1
0.0
Rosiglitazone
Placebo60% RRR HR 0.40 (0.35–0.46) P < 0.0001
Cumulative hazard rate

DREAM: Rosiglitazone decreases new-onset diabetes or death
Rosiglitazone group(n) (%)
Placebo group(n) (%)
Primary outcome composite 306 (11.6) 686 (26.0)
Diabetes* 280 (10.6) 658 (25.0)
Death* 30 (1.1) 33 (1.3)
0.25 1 1.75
P
<0.0001
0.70
<0.0001
DREAM Trial Investigators. Lancet. 2006;368:1096-1105.
N = 5269
*Participants may appear in both categories
Hazard ratio
Favorsrosiglitazone
Favorsplacebo

DREAM: Effect of rosiglitazone on primary outcome in key subgroups
GenderMaleFemale
Age (years)<5060+50–59
LocationNorth AmericaSouth AmericaEuropeIndiaAustralia
Glycemic abnormalityIFG onlyIGT onlyIFG + IGT
0.6 9.97.6
8.49.57.7
8.88.08.68.77.2
7.06.1
14.0
0.09
0.09
0.14
P*Placebo
(% per year)
0.2 0.4 0.6 0.8 1.0 1.2Hazard ratio (95% CI)
Favors rosiglitazone
Favors placebo
DREAM Trial Investigators. Lancet. 2006;368:1096-1105.*for heterogeneity
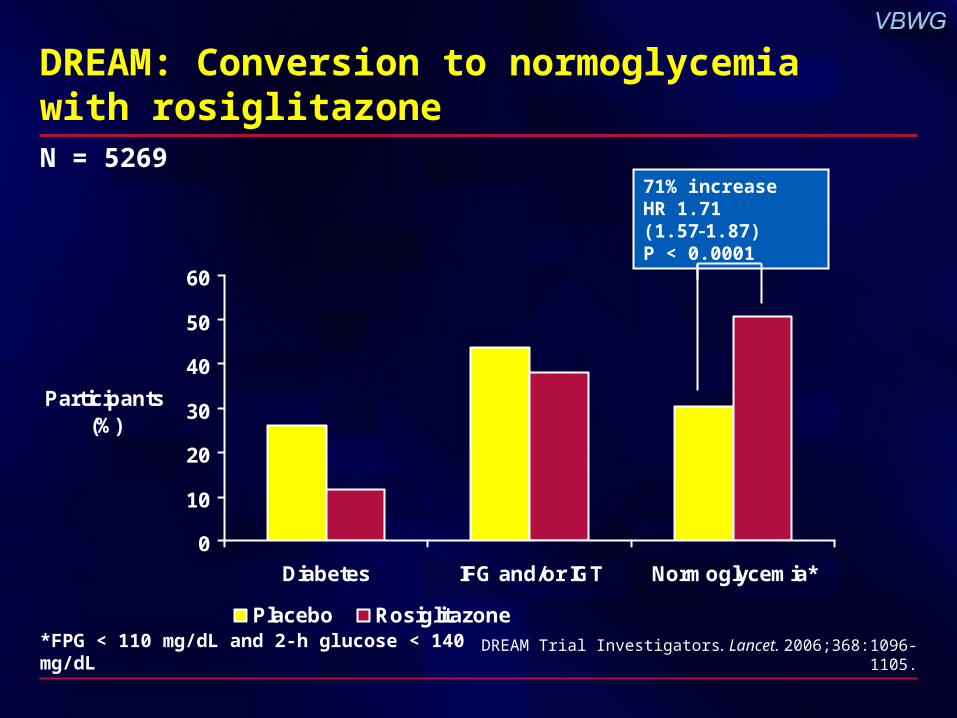
DREAM: Conversion to normoglycemia with rosiglitazone
0
10
20
30
40
50
60
Diabetes IFG and/or IGT Normoglycemia*
Participants (%)
Placebo Rosiglitazone
*FPG < 110 mg/dL and 2-h glucose < 140 mg/dL DREAM Trial Investigators. Lancet. 2006;368:1096-1105.
71% increaseHR 1.71 (1.571.87)P < 0.0001
N = 5269
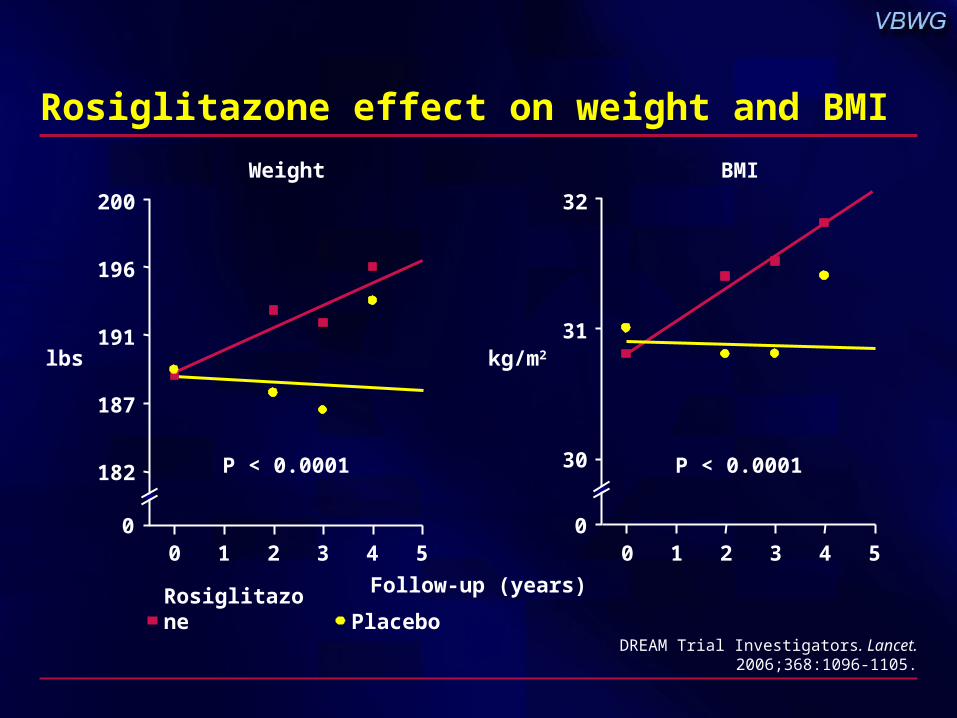
Rosiglitazone effect on weight and BMI
200
196
191
187
182
0
32
31
30
00 01 12 23 34 45 5
Follow-up (years)
lbs kg/m2
Weight BMI
DREAM Trial Investigators. Lancet. 2006;368:1096-1105.
Rosiglitazone Placebo
P < 0.0001 P < 0.0001
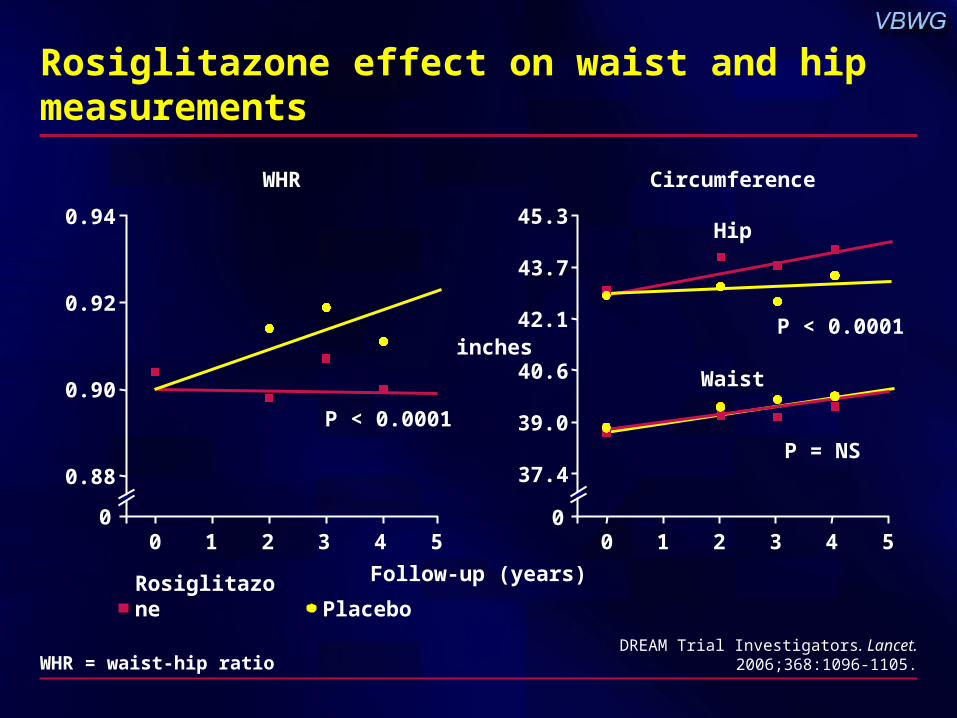
0.94
0.92
0.90
0.88
0
45.3
42.1
39.0
00 01 12 23 34 45 5
inches
WHR Circumference
Rosiglitazone effect on waist and hip measurements
43.7
40.6
37.4
P < 0.0001
P = NS
P < 0.0001
Waist
Hip
Follow-up (years)
DREAM Trial Investigators. Lancet. 2006;368:1096-1105.WHR = waist-hip ratio
Rosiglitazone Placebo
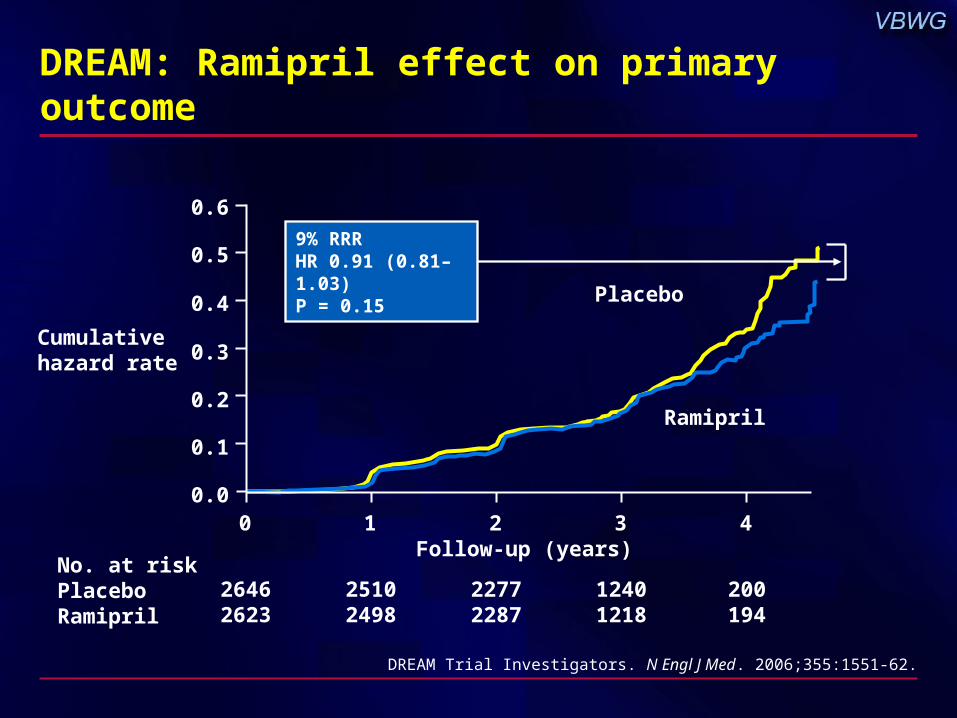
DREAM: Ramipril effect on primary outcome
DREAM Trial Investigators. N Engl J Med. 2006;355:1551-62.
Placebo
Ramipril
No. at riskPlaceboRamipril
Follow-up (years)
0.6
0.5
0.4
0.3
0.2
0.1
0.00 1 2 3 4
26462623
25102498
22772287
12401218
200194
9% RRRHR 0.91 (0.81–1.03)
P = 0.15
Cumulative hazard rate
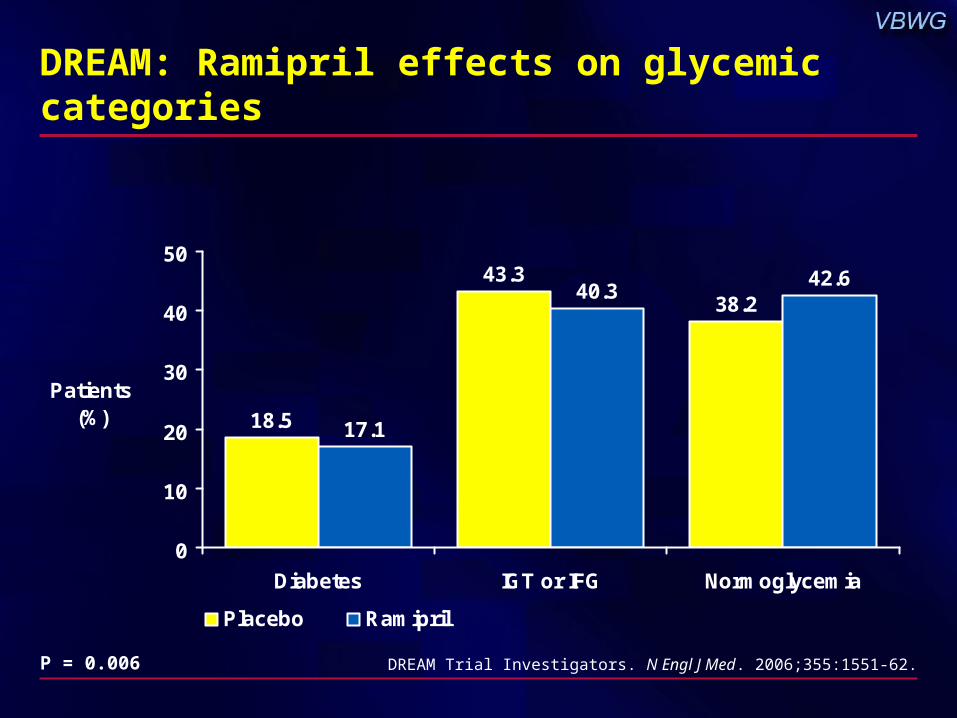
DREAM: Ramipril effects on glycemic categories
18.5
43.3
38.2
17.1
40.342.6
0
10
20
30
40
50
Diabetes IGT or IFG Normoglycemia
Patients (%)
Placebo Ramipril
P = 0.006 DREAM Trial Investigators. N Engl J Med. 2006;355:1551-62.

DREAM: SafetyRosiglitazone vs placebo• Increased incidence of HF* (0.5% vs 0.1%, P = 0.01)
– No cases of fatal HF– No difference for other CV events
• Increased incidence of peripheral edema(6.8% vs 4.9%, P = 0.003)
• 4.9-lb weight gain (P < 0.0001)– Increased hip circumference (0.71 in, P < 0.0001)– No difference in waist circumference – Decreased waist-hip ratio (P < 0.0001)
• No adverse hepatic effects – Alanine aminotransferase (ALT) levels 4.2 U/L at 1 year (P < 0.0001)
Ramipril vs placebo• No adverse hepatic effects
– ALT levels 1.1 U/L at 1 year (P = 0.004)
DREAM Trial Investigators. Lancet. 2006;368:1096-1105;
N Engl J Med. 2006;355:1551-62.*Adjudicated
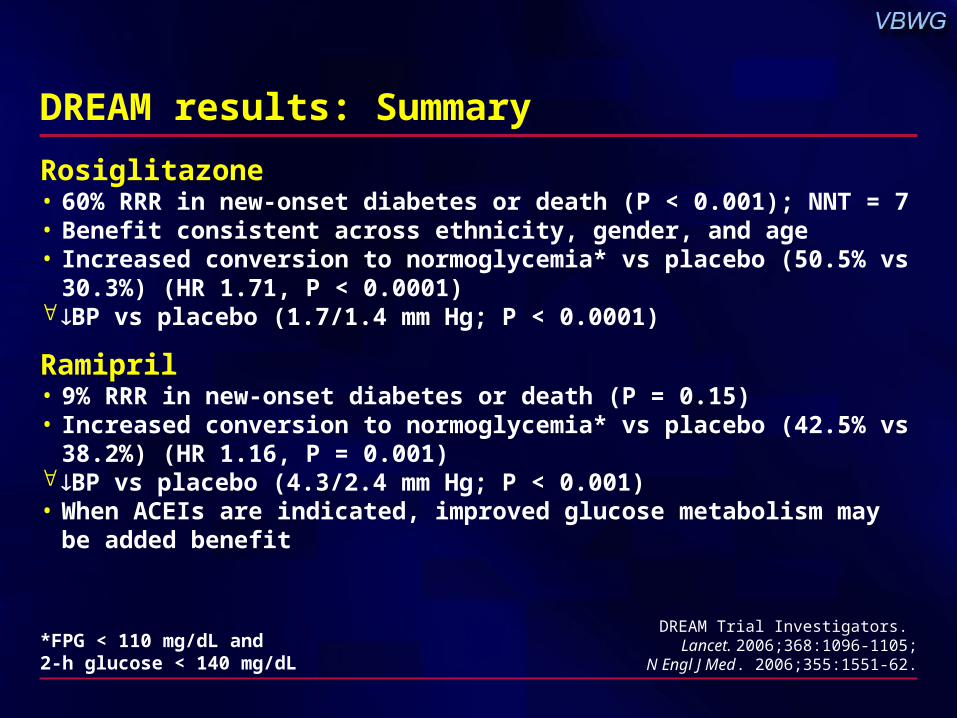
DREAM results: Summary
Rosiglitazone• 60% RRR in new-onset diabetes or death (P < 0.001); NNT = 7• Benefit consistent across ethnicity, gender, and age• Increased conversion to normoglycemia* vs placebo (50.5% vs
30.3%) (HR 1.71, P < 0.0001) BP vs placebo (1.7/1.4 mm Hg; P < 0.0001)
Ramipril• 9% RRR in new-onset diabetes or death (P = 0.15)• Increased conversion to normoglycemia* vs placebo (42.5% vs
38.2%) (HR 1.16, P = 0.001) BP vs placebo (4.3/2.4 mm Hg; P < 0.001)• When ACEIs are indicated, improved glucose metabolism may be
added benefit
DREAM Trial Investigators. Lancet. 2006;368:1096-1105;
N Engl J Med. 2006;355:1551-62.
*FPG < 110 mg/dL and 2-h glucose < 140 mg/dL


![Accaddeem iicc SSci ennccess Inn t teerrnnaatiioo nn aal l ...accelerated stability studies for the simultaneous determination of ramipril/moexipril[6], ramipril/ telmisartan[7], and](https://img.pdfslide.us/doc/110x75/60879e59da1a0a784b2d4102/accaddeem-iicc-ssci-ennccess-inn-t-teerrnnaatiioo-nn-aal-l-accelerated-stability.jpg)