Embed Size (px)
Citation preview

Battery Modeling for Electric Vehicle Applications Using Neural Networks
D. H. Swan, M. P. Arikara, k D. Patton Texas Engineering Experiment Station
Teras A&M University System College Station, Texas
David K Swan, PhD. Assistant Director Center for Electrochemical Systems and Hydrogen Research Texas Engineering Experiment Station Texas A M University System College Station, Texas
Muralidharan Arjkara &aduateStudent Center for Electrochemical Systems and Hydrogen Research Texas Engineexkg Experiment Station Texas A M University System college Station, Texas
Altm D. Patton, PbD Professor of Electrid Engineering Texas A&M University System College Station, Texas


Battery Modeling for Electric Vehicle Applications using Neural Networks
Abstract
D. H. Swan, M. P. Arikara, A. D. Patton Texas Engineering Experiment Station
Texas A&M University System College Station, Texas
Neural necHlorking is a new approach to modeling b d e s for electric vehicle applications. This modeling technique is much less complex then a fust principles model but can consider more parameten then classic empirical modeling- Test data indicates that individual cell size and geometry and operating conditions Sed a battery pedormance (energy density, power density and life). Given sufficient battery data, system parameters and operating conditions a neural network model could be used to interpolate and perhaps even extrapdate battery performance under wide variety of operating conditions. As a results the method could be a valuable design tool for electric vehicle battery design and applikation This paper descn'bes the on going modeling method at'rexas A&M University and presents preliminary results of a tubdar lead acid battery model. The ultimate goal of this modeling effort is to develop the values necessary to be able to predict performance for batteries as wide ranging as sodium sulfur to zinc bromine.
Introduction
Modeling a battery involves looking into the effect of a large number of parameters for which many relationship are unknown. Synthetic neural networks are particularly suitable to solving obscure problems. The model is not technology specific but can be used with any battery technology such as lead acid, sodium sulfur, and nickel metal hydride- Given the cell dimensions, mass, opting temperature range and rate of discharge, the network can estimates the perfonnance of a battexy in terms of energy density, power density and efficiency.
density with no change in energy density. The following table compares the performance of two difkrent sodium sulfur cells, A04 fiom Brown BoverVABB in Germany and the PB cell &om CSPL in England'.
As an example the change in the geometry of cell can significantiy effect power
DISCLAIMER
This report was prepared as an account of work sponsored by an agency of the United States Government. Neither the United States Government nor any agency therwf, nor any of their employees, makes any warranty, express or implied, or assumes any legal liability or responsi- bility for the accuracy, completeness, or usefulness of any information, apparatus, product, or process disclosed, or represents that its use would not infringe privately owned rights. Refer- ence herein to any specific commercial product, process, or service by trade name, trademark, manufacturer, or otherwise does not necessarily constitute or imply its endorsement, recom- mendation, or favoring by the United States Government or any agency thereof. The views and opinions of authors expressed herein do not necessarily state or reflect those of the United States Government or any agency thereof. -
L Table 1 Comparison of Sodium Sulfur cell Characteristics i
\ Activation / Function
NET c Multiple Inputs &
Table 1 shows that tbe two sodium sulfur cell $eometries are significantly difTerent, their specific energies are esseatially the same but the specific power is not. Given dlicient cxpeheatal data as a fuactian of geometry and opqatbg conditiofls a neural netwwk model could be used to 0Pt;nize the cell design for a d e s i i performana charadenst&.
training and 3) the modeling technique applied to a lead acid batteay application.
. . The following sections discuss 1) the neural modeling technique 2) network
\ output
Neural Networking - A Back Propagation Moddmg Technique:
An artificial neural network is a parallel, distributed information processing technique. The mtwork consists of processing elements which are biologically inspired*. As in a biological system each element or neuron has a limited processing capability. Every neural network model is characten 'zed by its interconnection of the processing eIement (neuron)3.
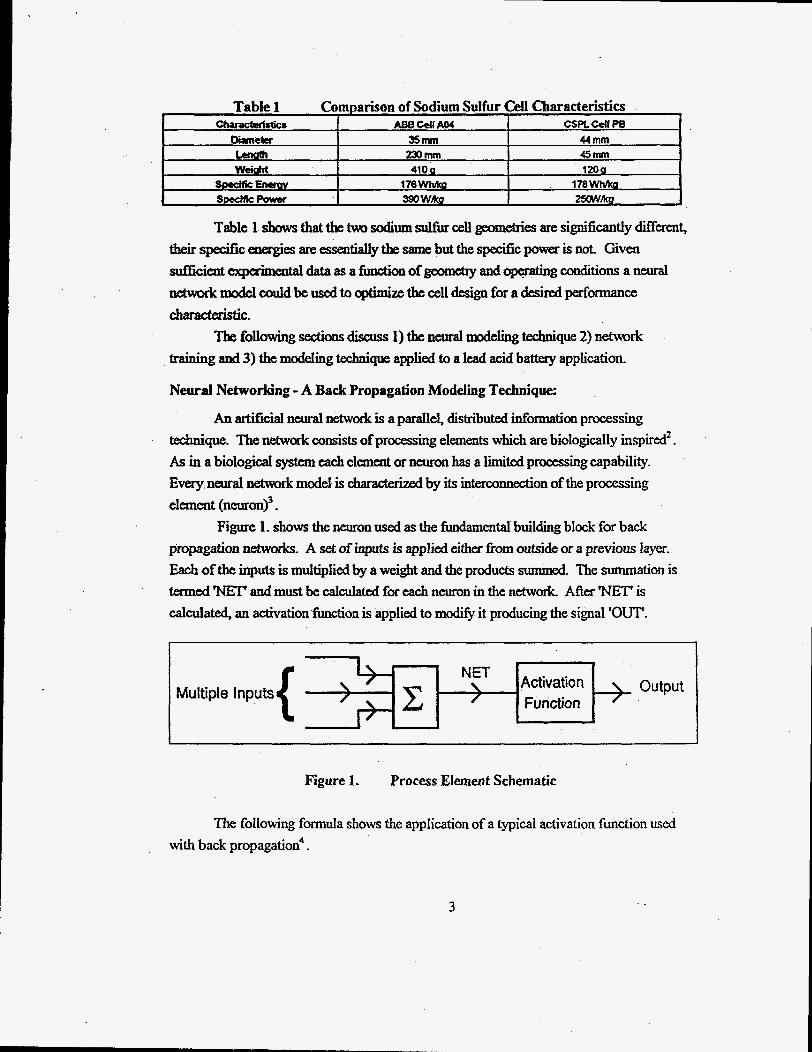
Figure 1. shows the neuron used as the fundamental building block for back propagation networks. A set of inputs is applied either from outside or a previouS layer. Each of the inputs is multiplied by a weight and the products summed. The summation is termed 'NET' and must be calculated for each neuron in the network. ARer 'NET' is calculated, an activation function is applied to modify it producing the signal 'OW.
Figure 1. Process Element Schematic
The following formda shows the application of a typical activation function used with back propagation4.
3

1 '
Neural Networking - Training Technique:
To train the network (initialize all values) back propagation based on experimental results is used. This traininp; method is based on proposing an error function that penalizes misclassification and attempts to mhhke this error using a gradient descent of values. The following Figure 2 shows a multilayer network with back propagation (the figure has been simplified for clarity). The first set of neurons serve distributia points, they perform aoiDputsummatl 'on. The input si@ is passed through to the first layer of the network through the weighted links. The present figure consists of two layers a hidden layer and an olltput layer, the input layer is designated layer 0. It is possible to have a network with a greater number of hidden layers but most realitions are possible with just two.
Hidden Layer (1) Output Layer (2) Comparison Layer (Training S t q Ody)
Figure 2. MuItitayer Network With Training
The weight of the links between elements decide the value of the output from the neurons, thus training the network develops the relationships that wiIl be used to predict battery performance under different conditions During training the experimental obtained input (current rate, temperature, geometry etc.) and output values (energy density, power density, efficiency) are referred to as training pairs. The more training pairs used and the more parameters in each training pair will result in a more comprehensive and accurate network, however this is at the expensive of computer time.
4

The weights of the links are to begin with initialized to small random numbers. Training the network by back propagation requires the foliowing steps' :
I. Select the next training pair fiom the training set; apply the input vector to the input of the network
2. Calcvlate output of the I.l&Work.
3. Calculate the enor beeween the network output and the experimental result (target vedorfiomthetrainingpair).
4. Adjust the weights ofthe network in a way that minimizes the error ( the weight adjustment procedure is desaibed below).
5. Repeat the steps for e a c h v m in the training set until the mor for the entire set is acceptably low.
Weight A&uhnent Using the activation function described by equation 1 the link weight is adjusted as follows (quatiun notnenclature appeats at the end of this section):
At the output layer a 6 value is calculated at the compartoc 8=Out(l-W)(Target-Out) 2
3 4
For the hidden layer to adjust the weights we use the following:
Using this value of adjusted- Equation No mnclature;
Wbqk)(n) =
6, = hqpj)(l-- ~t@j))(C(6(&7&)qJJq$))) 5
and equations 3 and 4 the wights of ail the other layers are
the weight of the link from neuron p in the hidden layer to a neuron q in the output layer at step n(before adjustment); note the subscript k indicates that weight is associated with its destination layer- value of the weight at step n+l (after adjustment). the value of &(&om 2.) for a neuron q in the output layer k. the value of OUT for neuron p in the hidden layer j.
Wbak)(n+l) =
%Jc) =
OUTbj) =
ll = learning rate (typically 0.01 to 1.0)
5

Neural Network Modeling of Lead Acid Batteries:
The primary use of the modeling technique is to design batteries for different applications depending upon the relative importance of the design parameters. A two layer neural network containing a hidden layer and an output layer along with the input layer was simulated by a software programwritten in FORTRAN. It is possible to make a hardwired circuit for this purpose but since speed of execution of the program is of no major concern we used the software approach.
A Chloride EV Systems lead acid bauery (model ET-205) was used to generate the data required for the study. The ET-205 is a three cell module with a mass 32.8 kg. and is used in the EPRI/Coxqtor G-Van vehicle. The cells use a tubular positive electrodes and a conventional negative el&.
. The battery data for the neural network model was collected at Texas A&M University by a computer controlled batttxy cycler. The battery was charged by a three step constant current charge sequence (36/24/12 A) followed by a constant voltage of 7.9 volts. The three charge rates wcfe applied untiI module voltages of 72.75 and 7.9 volts were reached. The fmal charge rate was held at 7.9 volts and terminated when the amperage fell to 6. The battery discharge profile was varied to get the performance at different operating conditions. Since the data obtained experimentally was of sets having different orders of magnitude, Le., temperature was of the order of 20 to 40 degrees Celsius while efficiencies were of the order of 0.7 to 0.9 the data had to be conditioned for training the network. In the present case the temperature was divided by 100 to ensure the magnitude of the temperatme was comparable to the magnitude of the efficiency.
The mural network model had the input vector elements as measures of the
0 Lowest temperature seen during the chargddwharge cycle. 0 Highest temperature seen during the chargehiischarge cycle. 0 Rate of discharge used.
Mass of the battery (32.8 kg) . The output vector elements as measures of
0 Energy density. 0 Voltaic efficiency 0 Coulombic effciency. Selected data from the experimental set up and modeling is provided in the
following battery module data:
following Tables. Table 2. presents the experimental data used to train the network. The inputs include specific current over the discharge, and the beginning and ending temperature. The listed target values are the experimental results in Wh/kg. The
6

Current rate has a primary influence on the target values while the temperature is secondary. End of discharge for the module was based on a voltage of 5.25. The input values were chosen to represent a large change in current and change in temperature at a specific currat. Increasing current resulted in lower values of energy density, increasing temperature increased energy density.
values compared to the experimental values. The diffetence is presented in the error column.
After training the network the same inputs were used and the network predicted
The fact that there is an error in the predicted values when the same inputs were used for network training is the result of incomplete convergence and the fact a limited number of parameters have been provided (incomplete model). Note that in the case of the temperature variation at 90 amps the error is both positive and negative.
Given the now trained network, a new set of experimental input data for which the experimental performance results were known were submitted to the network. The input values, measured result, and predicted result are presented in Table 3 and figure 3. The input data was selected to be an interpolation of the trainiig data
7

~~ ~~~
Figure 3. Comparison of Experimental and Neural Network Predicted Energy Density
The above figure indicates that the trained neurd network accurately modeled the battery energy density. The predicted results are lower then the actual results. The accuracy of the prediction could probably be improved if the final error value during training had been very low or more parameters had been used e.g. a mid discharge temperature.
parameters in more detail it will become a general design tool for a specific battery couple. This effort is now on going at Texas A&M university to develop comprehensive neural network models for lead acid, zinc bromine and sodium sulfur batteries.
It is conceivable that as the model versatility is increased by training with more
Conclusion
The rechargeable battery is very complex electrochemical system The large number of battery couples, performance parameters, and operating conditions make it extremely difficult for a designer to analysis or even specify a batteq for an electric vehicle
A newd network is a general modeling technique that given sufficient experimental application
can interpolate and perhaps even extrapolate battery pedormance under a wide variety of conditions. The technique is not limited in the number of parameters that can be modeled. The development of neural network models for specific electric vehicle batteries is now on going at Texas A&M University. This paper presented the modeling technique, the model training and an actual comparison of experimental and predicted results. The method
8

shows promise in that given development it could become a general purpose design tool for electric vehicle batteries as finite element programs have for stress analysis. It is Conceivable, that in its developed fonn the neural network could predict in vehicle perfbrmance, and even life cycle cost give a battery type, =mew and appIication conditions.
References
' W. Auxer. Oveaviw Status of Sodium/sulfer and S o d i d Metal Chloride Batteries for Electric VehicIes Applications. BetaPower, Inc.. 1991.
' P.D. Wassermas Neamd Chnphg: 'Iheory and Practics, Van Nostrant Reinhold, New York, QA 76.5 W353 (Resave) 1989. R W e and T. Jacksos Neural Computing: An Introduction, Adam HiIger, BristoI, Philadelphia. and New York. Q 335.E342 @ m e ) 1990. crmplex BP alp. TK 5981 .E. IEEE on Sig. Pnxessing, 39: 2 10, September 4.1992. R EchmiIler. Advanced Newal camputers, North-HoIland, 1990. V. Raja Automated Intelligent Training of Backpropagation Neural Networks. Master Thesis in Computer Science. Texas A&M University, 1991.
*
9