Embed Size (px)
Citation preview

EMERGENCY MANAGEMENT SECTOR OVERVIEW D.1
D Emergency management sector
overview
CONTENTS
D.1 Introduction D.1
D.2 Sector performance indicator framework D.13
D.3 Cross-cutting and interface issues D.30
D.4 Future directions in performance reporting D.31
D.5 List of attachment tables D.32
D.6 References D.33
Attachment tables
Attachment tables are identified in references throughout this sector overview by a ‘DA’ prefix
(for example, table DA.1). A full list of attachment tables is provided at the end of this sector
overview, and the attachment tables are available from the website at
www.pc.gov.au/rogs/2016.
D.1 Introduction
This sector overview provides an introduction to and the policy context for government
services reported in ‘Fire and ambulance services’ (chapter 9). It provides an overview of
the emergency management sector, presenting both contextual information and high level
performance information.
All abbreviations used in this Report are available in a complete list in Volume A:
Approach to performance reporting.

D.2 REPORT ON GOVERNMENT SERVICES 2016
Policy context
The Natural Disaster Resilience Statement (COAG 2009) highlights that a national,
coordinated and cooperative effort is needed to enhance Australia’s capacity to withstand
and recover from emergencies and disasters. In 2011, the Council of Australian
Governments (COAG) adopted the National Strategy for Disaster Resilience
(COAG 2011) which promotes a ‘resilience’ based approach to natural disaster policy and
programs. The strategy recognises that disaster resilience is a shared responsibility for
individuals, businesses and communities, and involves activities as diverse as risk
assessment, legislation, community development, emergency response, urban development
and land use management, and community recovery. In 2014, the Law, Crime and
Community Safety Council (LCCSC) tasked the Australia-New Zealand Emergency
Management Committee (ANZEMC) to review the implementation of the strategy
including to conduct a critical evaluation of progress and to identify future priority areas of
focus (COAG 2015).
ANZEMC is Australia's national consultative emergency management forum and reports to
the LCCSC (LCCSC 2014). ANZEMC works to strengthen disaster resilience by providing
strategic leadership on emergency management policy and supporting related capability
and capacity development activities.
Sector scope
Emergency management is the practice of managing the impact from emergency events
(box D.1) to individuals, communities and the environment (EMA 1998).

EMERGENCY MANAGEMENT SECTOR OVERVIEW D.3
Box D.1 Emergency events
An emergency event is an event that endangers or threatens to endanger life, property and/or
the environment, and which requires a significant and coordinated response (EMA 1998). It
encompasses:
structure fires
rescues — including road crash rescues and marine rescues
medical emergencies and transport
natural disaster events — bushfire (landscape fire), earthquake, flood, storm, cyclone, storm
surge, landslide, tsunami, meteorite strike, and tornado
consequences of acts of terrorism
other natural events — such as drought, frost, heatwave, or epidemic
disaster events resulting from poor environmental planning, commercial development, or
personal intervention
technological and hazardous material incidents — such as chemical spills, harmful gas
leaks, radiological contamination, explosions, and spills of petroleum products
quarantine and control of diseases and biological contaminants.
Source: AEM (2015a).
Emergency management organisations in Australia have adopted an approach that aims to
be:
comprehensive — encompassing all hazards and recognising that dealing with the risks
to community safety requires a range of activities to prevent, prepare for, respond to
and recover from any emergency
integrated — ensuring the involvement of governments, all relevant agencies and
organisations, private sector and the community.
Emergency events vary in size and intensity, affecting individuals (such as in medical
emergencies), household/business assets (such as in building fires), or community,
economy and the environment (such as in natural disasters).
Events of considerable magnitude or duration, such as earthquakes, cyclones and bushfires,
can involve international, interstate and other cooperation and support. Jurisdictions are
increasingly contributing to operational responses across Australia and to a number of
significant emergency events around the Pacific and Indian Ocean rim.
State and Territory governments
State and Territory governments are responsible for regulatory arrangements that protect
life, property and the environment. They have primary responsibility for delivering
emergency services directly to the community through emergency service organisations.

D.4 REPORT ON GOVERNMENT SERVICES 2016
Emergency service organisations include government departments, statutory authorities,
and smaller branches, agencies or services within larger departments or authorities
(table DA.1). They also include non-government organisations, supported by State and
Territory government funding and legislation, which provide emergency management
services on behalf of the state, such as St John Ambulance in WA and the NT.
The range of emergency service organisations encompasses:
Fire service organisations — work to minimise the impact of fire and other
emergencies on the community, in cooperation with other government departments and
agencies (SES, police, ambulance services and community service organisations)
(chapter 9)
Ambulance service organisations — work within the health system providing
emergency and non-emergency patient care and transport. Ambulance services provide
a critical link between health care and disaster management systems (CAA 2013). They
are responsible for providing responsive, high quality specialised medical care in
emergencies. This includes working with other emergency services organisations to
provide pre-hospital care, rescue, retrieval, and medical transport to tertiary health care
facilities by road, air and water
State and Territory Emergency Service organisations (SES) — help communities
prepare for, respond to, and recover from unexpected events and play a major role in
each State and Territory for hazards as diverse as:
– road crash rescue incidents and extrications (other than in the ACT, where ACT
Fire and Rescue is responsible for all road crash rescue services)
– flood, earthquake, tsunami, tropical cyclone and marine search and rescue
– search and rescue services (table DA.14)
Marine rescue and coast guard organisations — marine rescue and boating safety and
communication services
Lifesaving organisations — water safety, drowning prevention and rescue services.
Australian Government
The primary role of the Australian Government is to support the development, through
State and Territory governments, of a national emergency management capability.
Australian Government assistance takes the form of:
financial, physical and technical assistance in large scale emergency events
financial assistance for natural disaster resilience, mitigation and preparedness
support for emergency relief and community recovery
support for risk management and comprehensive risk assessment programs

EMERGENCY MANAGEMENT SECTOR OVERVIEW D.5
contracting Telstra to provide the national Triple zero (000) emergency call operator
service, and regulating the provision of this service
support for community awareness activities.
Australian Government agencies also have specific emergency management
responsibilities, including: the control of exotic animal and plant diseases; aviation and
maritime search and rescue; the management of major marine pollution (beyond coastal
waters); the prediction of meteorological and geological hazards; the provision of
firefighting services at some airports and some defence installations; human quarantine;
and research and development. The Australian Government also manages the Crisis
Coordination Centre, which maintains a 24-hour a day situational awareness, analysis and
reporting capability and an emergency management planning capability.
The Australian Government is also responsible for reporting against Australia’s progress in
implementing the United Nations’ Sendai Framework for Disaster Risk Reduction
2015-2030 (UNISDR 2015).
State and Territory governments may seek non-financial assistance for response and
recovery activities. This assistance is usually provided under the Defence Assistance to the
Civil Community (DACC) program. Under the DACC, the Department of Defence may be
called upon to provide personnel, equipment and expertise to assist in the civil response to
an emergency event. DACC recorded 275 emergency tasks from 2005-06 to 2012-13
(ANAO 2014).
Local governments
Local governments in some states and territories are involved to varying degrees in
emergency management. Their roles and responsibilities may include:
considering community safety in regional and urban planning by assessing risks, and
developing emergency event mitigation measures and prevention plans
improving community preparedness through local emergency planning
issuing hazard reduction notices to private land holders and clearing vegetation in high
risk public areas
collecting statutory levies to fund fire and other emergency services
allocating resources for response and recovery activities
providing financial and operational assistance to voluntary emergency services.
Profile of the emergency management sector
Detailed profiles for fire events and ambulance events within the emergency management
sector are reported in chapter 9, including size and scope of the individual service types

D.6 REPORT ON GOVERNMENT SERVICES 2016
and associated expenditure. Descriptive statistics for SES organisations are presented, by
jurisdiction, in tables DA.14–DA.19.
Emergency service organisation costs
Nationally in 2014-15, total expenditure across ambulance, fire and emergency service
organisations was $6.7 billion, or $283.82 per person in the population, although some
caution should be taken when comparing these data across service areas and jurisdictions
(figure D.1 and table DA.3).
Figure D.1 Expenditure of emergency service organisations, per person
in the population 2014-15a
ASO = Ambulance service organisation; FSO = Fire service organisation; SES = State/Territory
emergency service organisation. a See table DA.3 for detailed footnotes and caveats.
Source: State and Territory governments; table DA.3.
The cross-cutting and interface issues section of this overview (section D.3) highlights that
a range of other government agencies, such as police and health services, also fund
emergency management. In addition, governments also incur costs for government disaster
coordination agencies and volunteer marine rescue and lifesaving organisations (these
costs are not available for this Report).
Funding emergency service organisations
The funding of emergency services organisations varies by service and jurisdiction
(figure D.2). Funding occurs through a mix of:
0
50
100
150
200
250
300
350
NSW Vic Qld WA SA Tas ACT NT Aust
$/p
ers
on
ASO FSO and SES

EMERGENCY MANAGEMENT SECTOR OVERVIEW D.7
government grants — provided to emergency services organisations from State and
Territory governments
fire and emergency service levies — governments usually provide the legislative
framework for the imposition of levies on property owners or, in some jurisdictions,
from levies on both insurance companies and property owners
ambulance user/transport charges — from government, hospitals, private citizens and
insurance companies
subscriptions and other revenue — subscriptions, other fees, donations and
miscellaneous revenue.
Figure D.2 Emergency service organisations funding sources, 2014-15a, b
a See table DA.2 for detailed footnotes and caveats. b Total levies in the ACT and the NT are nil.
Source: State and Territory governments; table DA.2.
Australian Government funding
The Australian Government provides emergency management funding to State and
Territory governments through a range of programs.
The Natural Disaster Relief and Recovery Arrangements provide financial assistance to
support State and Territory governments with relief and recovery efforts following an
eligible natural disaster event. The Australian Government calculated that it contributed
$521.8 million to the States and Territories for natural disaster events in 2014-15.
Allocations to State and Territory governments vary across jurisdictions and over time
depending on the timing and nature of natural disaster events (figure D.3 and table DA.6).
0
20
40
60
80
100
NSW Vic Qld WA SA Tas ACT NT Aust
Pe
r c
en
t
Government grants/contributions Total levies
User/transport charges Subscriptions and other revenue

D.8 REPORT ON GOVERNMENT SERVICES 2016
Under the National Bushfire Mitigation Programme, the Australian Government is
providing $15 million from 2015-16 to 2017-18 in support of state and territory efforts to
reduce long term bushfire risks. The programme is aimed at strengthening community
resilience, as well as building the ability to prevent bushfires. Examples of state-based
bushfire mitigation work supported under the programme include improved bushfire risk
mapping, extending fire trails and better coordinated prescribed burns with private
landholders. The programme also includes $2.2 million in support for the National Burning
Project and a $1.5 million mechanical fuel load reduction trial.
Figure D.3 Natural Disaster Relief and Recovery Arrangements expenses (2014-15 dollars)a
a See table DA.6 for detailed footnotes and caveats.
Source: Australian Government (unpublished); table DA.6, table DA.20.
The Natural Disaster Resilience Program provides funding to the State and Territory
governments to strengthen community resilience to natural disasters, consistent with the
National Strategy for Disaster Resilience. In 2014-15, funding was $25.7 million
(table DA.5). Allocations to State and Territory government are included in table DA.5.
Other initiatives include the National Emergency Management Projects program
($3.7 million in 2014-15) (AEM 2015b).
The Australian Government also provides financial support to eligible individuals affected
by a disaster. In 2014-15, the Australian Government made payments of $107.6 million in
financial assistance via programs such as the Australian Government Disaster Recovery
Payment (table DA.7).
A Productivity Commission report into Natural Disaster Funding Arrangements published
in 2015 included a recommendation that funding arrangements be examined by
0
1 000
2 000
3 000
4 000
5 000
6 000
7 000
2009-10 2010-11 2011-12 2012-13 2013-14 2014-15
$m
illio
n

EMERGENCY MANAGEMENT SECTOR OVERVIEW D.9
governments with a view to ensuring a better balance between mitigation and recovery
(Productivity Commission 2015). At its November 2015 meeting, the LCCSC agreed to
continue to investigate a new model where the Australian Government would provide
recovery funding to states for the reconstruction of essential public assets based on upfront
damage assessments and pre-determined reconstruction costs (LCCSC 2015).
Emergency service organisations human resources
Nationally in 2014-15, 35 406 full time equivalent (FTE) people were employed by
emergency service organisations. Over half (54.9 per cent) were employed in fire and
emergency service organisations, while the remainder were employed by ambulance
service organisations (table D.1).
Table D.1 Full time equivalent salaried personnel in ambulance, fire and
SES organisations, 2014-15a
NSW Vic Qld WA SA Tas ACT NT Aust Total ambulance, fire and emergency service organisations
Ambulance service organisations
4 481 4 030 4 029 1 392 1 276 367 240 161 15 976
Fire and emergency service organisations (FSO and SES)
FSOs 5 368 6 625 3 044 1 505 1 066 482 456 307 18 853
SES 297 184 na na 44 25 8 19 na
Total 5 665 6 809 3 044 1 505 1 110 507 464 326 19 430
Total 10 146 10 839 7 073 2 897 2 386 874 704 487 35 406
a See tables DA.4 and DA.17 for detailed footnotes and caveats. na Not available.
Source: State and Territory governments (unpublished); table DA.4.
In 2014-15, 256 655 fire, ambulance and emergency service volunteers (and another 1122
community first response ambulance volunteers) were on the records of emergency service
organisations (table DA.4). Emergency services volunteers play a significant role in the
provision of emergency services in Australia, particularly in rural and remote areas, by
providing:
response services in the event of an emergency
community education, cadet schemes and national accredited emergency training
emergency event support and administrative roles
community prevention, preparedness and recovery programs.
Although volunteers are not paid wages and salaries, they provide a valuable service to
communities (box D.2). However, the government and community do bear some costs of
this service, including:

D.10 REPORT ON GOVERNMENT SERVICES 2016
This page has been changed since an earlier version of the Report. See errata at
http://www.pc.gov.au/research/ongoing/report-on-government-services/2016/emergency-management#errata
governments — who provide funds and support through infrastructure, training,
uniforms, personal protective equipment, operational equipment and support for other
operating costs
employers of volunteers — particularly self-employed volunteers, who incur costs in
supporting volunteer services such as in-kind contributions, lost wages and
productivity, and provision of equipment.
Volunteer activity has implications for the interpretation of financial and non-financial
performance indicators. Notional wage costs for volunteers are not reflected in monetary
estimates of inputs or outputs, which means that data for some performance indicators may
be misleading where the input of volunteers is not counted but affects outputs and
outcomes.
A study by the Australian Council of State Emergency Services for selected jurisdictions
estimated the value of volunteer time for community preparedness services, operational
response, training and unit management (without stand by time) from 1994-95 to 2004-05
averaged around $52 million (NSW), $19 million (Victoria) and $12 million (SA) per year.
The total time volunteers made available including stand by time is estimated to be more
than $86 million and $41 million a year to NSW and Victoria respectively (Ganewatta and
Handmer 2007).
Emergency service organisations’ activity
Nationally in 2014-15, emergency service organisations attended a wide range of
emergency events, including:
3.4 million emergency incidents attended by ambulance service organisations.
Ambulance service organisations also attended approximately 1 032 190 urgent
incidents and 916 643 non-emergency incidents (chapter 9 and table D.2)
385 118 emergency incidents attended by fire service organisations to a range of
emergency events, including structure fires, landscape fires and road crash rescue
events (chapter 9 and table D.2)
82 382 emergency incidents attended by SES organisations to a range of emergency
events, predominantly storm and cyclone events (67 430 incidents), followed by flood
events (3759 incidents) and road crash rescue events (2411 incidents) (table DA.18).
SES staff and volunteers contributed 354 515 hours of service (table DA.19).

EMERGENCY MANAGEMENT SECTOR OVERVIEW D.11
This page has been changed since an earlier version of the Report. See errata at
http://www.pc.gov.au/research/ongoing/report-on-government-services/2016/emergency-management#errata
Table D.2 Emergency incidents that emergency service organisations attended, 2014-15a
NSW Vic Qld WA SA Tas ACT NT Aust
Ambulance service organisations
‘000 894.1 833.4 946.4 262.7 274.1 74.1 47.0 38.1 3 369.8
Fire service organisations
‘000 148.0 77.0 71.5 30.8 29.2 10.8 10.3 7.4 385.1
SES organisations
‘000 40.1 21.7 12.7 0.5 5.2 1.2 0.7 0.2 82.4
a See tables DA.3 and DA.18 for detailed footnotes and caveats. na Not available.
Source: State and Territory governments; table 9A.13; table 9A.33; table DA.18.
Social and economic factors affecting demand for services
The size, severity, timing, location and impacts of emergencies are difficult to predict.
However, many known factors increase vulnerability to emergency events (COAG 2011).
Work-life patterns, lifestyle expectations, demographic changes, domestic migration, and
community fragmentation are increasing community susceptibility and demand for
emergency management services (COAG 2009).
Within individual communities, certain members may be more vulnerable or become
vulnerable over time and may need tailored advice and support. Factors that can influence
vulnerability include:
socioeconomic status — research shows socially-disadvantaged communities are more
heavily impacted by emergency events. For example, the fire death and injury rates of
Australia’s most disadvantaged areas (as defined by the 2001 Socio-Economic Indexes
for Areas) are 3.6 times that of the least disadvantaged areas respectively (Dawson and
Morris 2008)
English as a second language — research in WA has been found that culturally and
linguistically diverse communities are more vulnerable to fire events (FESA 2010)
remoteness and population density — population growth has been experienced across
Australian regional centres, coastal areas, rural areas around major cities, alpine areas
and along inland river systems. Such areas are more susceptible to emergency events
and require greater resources when an emergency event occurs (Victorian Bushfires
Royal Commission 2010)

D.12 REPORT ON GOVERNMENT SERVICES 2016
ageing populations — population change is expected to lead to an increased proportion
of older Australians living in the community (Australian Government 2010). As more
people fall into the older age groups their need to call for assistance in an emergency
generally increases — such as individual medical emergencies requiring an ambulance,
or assistance in preparing for and/or responding to a community wide emergency (for
example, a natural disaster)
population mobility and access to services.
Service-sector objectives
The framework of performance indicators in this sector overview is based on objectives for
emergency management established in the National Strategy for Disaster Resilience and
are common to all Australian emergency services organisations (box D.2).
Box D.2 Objectives for emergency management
Emergency management services aim to build disaster resilient communities that work together
to understand and manage the risks that they confront. Emergency management services
provide highly effective, efficient and accessible services that:
reduce the adverse effects of emergencies and disasters on the community (including
people, property, infrastructure, economy and environment)
contribute to the management of risks to the community
contribute to community recovery
enhance public safety.
To meet the objectives of emergency management, emergency service organisations
classify their key functions in managing emergency events to the prevention/mitigation,
preparedness, response and recovery framework. The framework uses the following widely
accepted ‘comprehensive approach’.
Prevention/mitigation — the results of measures taken in advance of an emergency
aimed at decreasing or eliminating its impact on the community and the environment.
Activities that contribute to prevention and mitigation include: advice on land
management practice and planning; the inspection of property and buildings for
hazards, compliance with standards and building codes, and levels of safe practices; the
preparation of risk assessment and emergency management plans; risk categorisation
for public information campaigns; and public information campaigns and educational
programs to promote safe practices in the community
Preparedness — the results of activities to ensure, if an emergency occurs, that
communities, resources and services are capable of responding to, and coping with, the
effects. Activities that contribute to preparedness include: public education and
training; emergency detection and response planning (including the installation of

EMERGENCY MANAGEMENT SECTOR OVERVIEW D.13
smoke alarms and/or sprinklers); hazardous chemicals and material certification, and
the inspection of storage and handling arrangements; exercising, training and testing
emergency service personnel; and standby and resource deployment and maintenance.
Preparedness also involves establishing equipment standards and monitoring adherence
to those standards
Response — The results of strategies and services to control, limit or modify the
emergency to reduce its consequences. Activities that contribute to response include:
implementing emergency plans and procedures; issuing emergency warnings;
mobilisation of resources in response to emergency incidents; suppression of hazards
(for example, fire containment); provision of immediate medical assistance and relief;
and search and rescue
Recovery (community) — The results of strategies and services to support affected
individuals and communities in their reconstruction of physical infrastructure and their
restoration of emotional, social, economic and physical wellbeing within their changed
environment. Activities that contribute to community recovery include: restoring
essential services; counselling programs; temporary housing; long-term medical care;
restoration of community confidence and economic viability; and public health and
safety information
Recovery (emergency services organisations) — The results of strategies and services
to return agencies to a state of preparedness after emergency situations. Activities that
contribute to emergency services recovery include: critical incident stress debriefing;
and the return of emergency services organisations resources to the state of readiness
specified in response plans.
D.2 Sector performance indicator framework
This sector overview is based on a sector performance indicator framework (figure D.4).
This framework is made up of the following elements:
sector objectives — five sector objectives reflect the key objectives of emergency
management (box D.3)
sector-wide indicators — three sector-wide indicators relate to the overarching service
sector objectives identified (box D.3)
information from the service-specific performance indicator frameworks that relate to
emergency services. Discussed in more detail in chapter 9, the service-specific
frameworks provide comprehensive information on the equity, effectiveness and
efficiency of these services.
This sector overview provides an overview of relevant performance information. Chapter 9
and its associated attachment tables provide more detailed information.

D.14 REPORT ON GOVERNMENT SERVICES 2016
Figure D.4 Emergency management sector performance indicator framework
Sector-wide indicators
This section includes high level indicators of emergency management outcomes. Many
factors are likely to influence these outcomes — not just the performance of government
services. However, these outcomes inform the development of appropriate policies and the
delivery of government services.
Data quality information (DQI) is being progressively introduced for all indicators in the
Report. The purpose of DQI is to provide structured and consistent information about
quality aspects of data used to report on performance indicators, in addition to material in
the chapter or sector overview and attachment tables. All DQI for the 2016 Report can be
found at www.pc.gov.au/rogs/2016.
Total asset loss
from emergency
events
Sector objectives
Sector-wide indicators
Service-specific performance indicator frameworks
Chapter 9 – Fire and ambulance services
Governments, business, NGOs and individuals strengthen the
nation’s resilience to disasters and emergency events
Prevention/mitigation –
prevent or mitigate against
the severity of emergency
events
Preparedness – prepare
the community to cope
with the effect
Response – to ensure the
effects of an emergency event
are minimised
Recovery – the restoration of
emotional, social, economic
and physical wellbeing
Deaths from
emergency events
Community
preparedness for
emergency events
Ambulance events p. 9.45Fire events p. 9.6
EMERGENCY MANAGEMENT SECTOR OVERVIEW D.15
Community preparedness for emergency events
‘Community preparedness for emergency events’ is an indicator of the objectives of
governments to reduce the adverse effects of emergencies and disasters on the community
(including people, property, infrastructure, economy and environment) and to contribute to
the management of risks to the community (box D.3).
Box D.3 Community preparedness for emergency events
‘Community preparedness for emergency events’ is defined as the number of people who know
what to do to prepare for an emergency and/or have developed an emergency plan
(evacuations/meeting places, etc), divided by the total population.
The higher the proportion of the population with emergency management practices followed,
the more likely the impact of emergency events will be minimised.
Data reported for this measure are:
comparable (subject to caveats) across jurisdictions but are only available for one reporting
period
complete (subject to caveats) for the 2011-12 reporting period. All required 2011-12 data are
available for all jurisdictions.
Data quality information for this indicator is at www.pc.gov.au/rogs/2016.
In 2011-12, the Australian Research Council Centre of Excellence in Policing and Security
(CEPS) and the Institute for Social Science Research (ISSR) conducted the National Security
and Preparedness Survey (NSPS). The NSPS found that nationally in 2011-12,
30.7 per cent of respondents reported that they had developed emergency plans in the event
of a natural disaster, while 29.9 per cent of respondents stated that they had ‘a fair bit’ or ‘a
lot’ of knowledge of what to do to prepare for natural disasters (table DA.8).
The NSPS results indicate that people were more likely to feel personally prepared for
future disasters, where:
people reported that they perceived it was more likely a natural disaster would affect
their home or community. Across jurisdictions in 2011-12, people were more likely to
have developed an emergency plan where they perceived that a natural disaster was
likely to occur in their community (40.5 per cent nationally) or if they perceived that a
natural disaster was likely to affect their home (51.6 per cent nationally) (figure D.5)
people reported they had a more cohesive community
people had been present in a previous natural disaster (Ramirez et al. 2013).

D.16 REPORT ON GOVERNMENT SERVICES 2016
Figure D.5 Proportion of people that have developed emergency plans in the event of a natural disaster, 2011-12a
a See table DA.8 for detailed footnotes and caveats.
Source: Western, M., Mazerolle, L., and Boreham, P. (2012), National Security and Preparedness Survey
2011-12; table DA.8.
Total asset loss from emergency events
‘Total asset loss from emergency events’ is an indicator of the objectives of governments
to reduce the adverse effects of emergencies and disasters on the community (including
people, property, infrastructure, economy and environment) and to contribute to the
management of risks to the community (box D.4).
0
20
40
60
80
100
NSW Vic Qld WA SA Tas ACT NT Aust
Pe
r c
en
t
All respondents
Respondents that think a natural disaster will affect their local community
Respondents that think a natural disaster will affect their home
EMERGENCY MANAGEMENT SECTOR OVERVIEW D.17
Box D.4 Total asset loss from emergency events
‘Total asset loss from emergency events’ is defined as the insured asset losses incurred by the
community following disaster events divided by the total population. Insured asset losses are
derived from the submissions of general insurance companies following large events incurring
cost to the community and insurers. It does not represent the entire cost of the event. Events
are only recorded where there is a potential for the insured loss to exceed $10 million.
Additionally, many large single losses occur on a day to day basis in Australia that are not part
of a larger emergency event. Costs not currently taken into account include the expenses of:
emergency response by emergency services
for all levels of government — uninsurable assets such as roads, bridges, and recreational
facilities are not considered. This is of greatest significance in rural and remote areas
non-government organisations
local government clean-up
remedial and environmental damage costs (including pollution of foreshores and riverbanks
and beach erosion)
community dislocation; loss of jobs; rehabilitation/recovery services
basic medical and funeral costs associated with injuries and deaths.
The prevention/mitigation, preparedness, and response activities of government contribute to
reduce the value of total asset loss from emergency events. A low or decreasing value of total
asset loss from emergency events is desirable.
Data for these measures are:
comparable (subject to caveats) across jurisdictions and over time
complete (subject to caveats) for the current reporting period. All required 2014-15 data are
available for all jurisdictions.
Data quality information for this indicator is at www.pc.gov.au/rogs/2016.
Source: ICA (2014); AEM (2014a).
Nationally in 2014-15, the insured asset loss from emergency events was $3.6 billion,
equating to $151.85 per person in the population (tables DA.9-10).
Annual insured asset losses need to be interpreted with caution. They can be particularly
volatile over time because of the influence of large irregular emergency events such as
bushfires (chapter 9) and extreme weather events (box D.5). For most jurisdictions, the
value of asset losses can be very low (or zero) in most years, punctuated by large natural
disaster events (table DA.10).
In real terms, insured asset losses in 2014-15 were the highest since 2010-11 (table DA.9-
10 and figure D.6). Other than in 2008-09 — the year of the Victorian bushfires — insured
asset losses are mostly related to flood and storm damage (table DA.9).

D.18 REPORT ON GOVERNMENT SERVICES 2016
Box D.5 Extreme weather events
In Australia, extreme weather events can bring high winds and coastal storm surges (such as
cyclones), torrential rain, frosts and hail storms. The Commonwealth Scientific and Industrial
Research Organisation (CSIRO) predicts that weather events in Australia are likely to be more
intense resulting in more severe flooding as a result of climate change (CSIRO 2012).
Natural disasters can have a substantial social and economic cost. Recent examples of
extreme weather events leading to insured damages greater than $1 billion include:
Cyclone Oswald — Tropical Cyclone Oswald formed in the Gulf of Carpentaria on
21 January 2013 and brought with it a heavy monsoonal rainfall system that lasted for
approximately one week. Over the course of the week, six people were killed, thousands
evacuated, 2000 people were isolated by floodwaters for days (requiring emergency supply
drops) and around 40 water rescues took place. The Insurance Council of Australia (ICA)
estimated the January 2013 cost at $119 million for NSW and $971 million for Queensland.
Queensland floods — Extensive rainfall over large areas of Queensland, led to flooding of
historic proportions during December 2010-January 2011. Thirty-three people died in these
floods; three remain missing. Some 29 000 homes and businesses suffered some form of
inundation. The Queensland Reconstruction Authority has estimated that the cost of flooding
events will be in excess of $5 billion. (The ICA reports insured asset losses of $2.4 billion.)
WA severe thunderstorms — Severe thunderstorms occurred on 22 March 2010 in the
south-west regions of WA. Heavy rain, severe winds and hail, caused considerable damage.
The ICA estimated the damage at $1.1 billion.
Source: CSIRO (2012); AEM (2015a); Queensland Government (unpublished).
Figure D.6 Asset loss from emergency events (2014-15 dollars)a
a See table DA.9 for detailed footnotes and caveats.
Source: ICA (2014), AEM (2014a); table DA.9.
0
1
2
3
4
5
19
85
-86
19
86
-87
19
87
-88
19
88
-89
19
89
-90
19
90
-91
19
91
-92
19
92
-93
19
93
-94
19
94
-95
19
95
-96
19
96
-97
19
97
-98
19
98
-99
19
99
-00
20
00
-01
20
01
-02
20
02
-03
20
03
-04
20
04
-05
20
05
-06
20
06
-07
20
07
-08
20
08
-09
20
09
-10
20
10
-11
20
11
-12
20
12
-13
20
13
-14
20
14
-15
$ b
illio
n
Fire Storm Flood Other

EMERGENCY MANAGEMENT SECTOR OVERVIEW D.19
Deaths from emergency events
‘Deaths from emergency events’ is an indicator of governments’ objectives to reduce the
adverse effects of emergencies and disasters on the community (including people,
property, infrastructure, economy and environment) and to enhance public safety
(box D.7).
Box D.6 Deaths from emergency events
‘Deaths from emergency events’ is defined as the number of deaths from emergency events per
million people in a calendar year. Three categories are presented:
road traffic deaths — deaths primarily caused by accidents involving road transport vehicles
fire deaths — deaths primarily caused by exposure to smoke, fire or flames
deaths from exposure to forces of nature — including exposure to excessive natural heat or
cold, exposure to sunlight, victim of lightning, victim of earthquake, victim of volcanic
eruption, victim of avalanche, landslide and other earth movements, victim of cataclysmic
storm, and victim of flood.
A low or decreasing number of deaths from emergency events is desirable.
Data for these measures are:
comparable (subject to caveats) across jurisdictions and over time
complete (subject to caveats) for the current reporting period. All required 2013 data are
available for all jurisdictions.
Data quality information for this indicator is under development.
Nationally in 2013, there were 57.9 deaths per million people from emergency events, a
decrease from 64.3 deaths per million people in 2012 (table DA.13).
Road traffic deaths
Road crash incidents are the single largest contributor to deaths from emergency events
reported, making up over 90 per cent of these deaths (tables DA.11 and DA.13).
A primary aim of governments is to reduce death and injury and the personal suffering and
economic costs of road crashes (box D.8). Nationally, over 20 emergency service
organisations contribute to this through the provision of effective and efficient medical and
road crash rescue services (table DA.1).
From 1984 to 2013, road traffic deaths declined from 172.8 to
52.3 deaths per million people (figure D.7). Road safety gains have been achieved through
a range of community and government efforts including: road infrastructure improvements;
safer vehicles; lower speed limits; graduated licensing; and behavioural programs targeting
drink driving, seatbelt usage and speeding (ATC 2011).

D.20 REPORT ON GOVERNMENT SERVICES 2016
Figure D.7 Road traffic deaths, by State and Territory, 1984 to 2013a
a See table DA.11 for detailed footnotes and caveats..
Source: ABS (2015) Causes of Death, Australia, Cat. no. 3303.0; table DA.11.
This sector overview provides data on the number of road traffic deaths only, with 1228
deaths recorded in 2013. However, the impact of over 40 000 traffic injuries and traumas
in 2013-14 is both ongoing and costly (box D.7 and chapter 6). Information on the role of
police services in maximising road safety is provided in the Police services chapter
(chapter 6). The number of road crash rescue incidents attended to by emergency service
organisations is presented in the Fire and ambulance services chapter (chapter 9).
Box D.7 Road safety in Australia
The cost of road crashes
An evaluation report from the Bureau of Infrastructure, Transport and Regional Economics
estimated the cost of road crashes in 2006 at $17.9 billion (1.7 per cent of GDP). This was a
real decrease of 7.5 per cent compared to 1996 (2006 dollars). Estimated human losses were
approximately $2.4 million per fatality, losses for a hospitalised injury were approximately
$214 000 per injury, and losses for non-hospitalised injury were approximately $2200 per injury.
National Road Safety Strategy 2011–2020
On 20 May 2011, the Standing Council on Transport and Infrastructure released an updated
National Road Safety Strategy 2011–2020. This strategy aims to elevate Australia’s road safety
ambitions through the coming decade and beyond. It is based on Safe System principles and is
framed by the guiding vision that no person should be killed or seriously injured on Australia’s
roads.
(continued next page)
0
100
200
300
400
500
600
198
4
199
8
201
3
198
4
199
8
201
3
198
4
199
8
201
3
198
4
199
8
201
3
198
4
199
8
201
3
198
4
199
8
201
3
198
4
199
8
201
3
198
4
199
8
201
3
198
4
199
8
201
3
NSW Vic Qld WA SA Tas ACT NT Aust
De
ath
s/m
illio
n p
eo
ple

EMERGENCY MANAGEMENT SECTOR OVERVIEW D.21
Box D.7 (continued)
The framework includes 10-year targets for governments to reduce the annual number of road
crash fatalities and reduce the annual number of serious road crash injuries by at least
30 per cent in each jurisdiction.
Achieving this aim requires a range of activities, including design and maintenance of vehicles
and roads, driver training, road user education, enforcement of road rules, emergency response
and health care in the event of an incident.
Source: BITRE (2009); ATC (2011).
Deaths from exposure to forces of nature
Relatively few deaths (34 deaths in 2013 nationally, or 1.4 deaths per million people in the
population) are recorded as being caused by exposure to forces of nature (table DA.12 and
figure D.8). Of these deaths:
15 people died from exposure to excessive natural cold
14 people died from exposure to excessive natural heat (ABS 2015).
(Caution should be taken when interpreting these results as the ABS have randomly
assigned values in categories where the number of deaths are low, to protect
confidentiality).
Figure D.8 Deaths from exposure to forces of nature, 2004 to 2013a
a See table DA.12 for detailed footnotes and caveats..
Source: ABS (2015) Causes of Death, Australia, Cat. no. 3303.0; table DA.12.
0
8
16
24
32
NSW Vic Qld WA SA Tas ACT NT Aust
De
ath
s/m
illio
n
pe
op
le
2004-12 2013

D.22 REPORT ON GOVERNMENT SERVICES 2016
Research indicates that extremely cold weather conditions and intense and long heatwaves
can exceed the capacity of some sections of the community to cope. The impact of these
events are likely to be understated in the ABS cause of death statistics, as heat related
deaths tend to exacerbate existing medical conditions, particularly in the frail and elderly
(Nairn and Fawcett 2013) (box D.8).
Box D.8 Heatwaves in Australia
The Centre for Australian Weather and Climate Research has defined a heatwave as:
A period of at least three days where the combined effect of excess heat and heat stress is unusual
with respect to the local climate. Both maximum and minimum temperatures are used in this
assessment (Nairn and Fawcett 2013).
Recent heatwave events include:
January 2014 — In the second week of January 2014, the extreme heat in WA that saw
record breaking temperatures of up to 48°C, moved eastwards into SA and Victoria.
– The Victorian Government estimated that there were 167 deaths in excess of the average
expected between 12 and 18 January (AEM 2014a). In Melbourne, 8359 ambulances
were dispatched and 621 people presented to emergency departments with heat-related
symptoms
– In SA, the heatwave resulted in 275 people being admitted to hospital for heat-related
conditions.
January 2009 — From 27 January until 8 February a heatwave affected parts of
south-eastern Australia.
– The Victorian Government estimated that there were 374 excess deaths during the week
of the heatwave (DHS 2009). Ambulance Victoria metropolitan emergency case load
recorded a 25 per cent increase in emergency cases and a 2.8 fold increase in cardiac
arrest cases
– SA similarly recorded increased demand during the heatwave where SA Ambulance
Service daily call-outs increased by 16 per cent when compared to previous heatwaves
(Nitschke et al. 2011).
Source: AEM (2014a); DHS (2009); Nairn and Fawcett (2013); Nitschke et al. (2011).
Fire deaths
The number of fire deaths varies from year to year, often impacted by large bushfires.
In 2013 there were 99 fire deaths nationally (details in chapter 9).
Service-specific performance indicator frameworks
This section summarises information from the ‘fire events’ and ‘ambulance events’
service-specific indicator frameworks in chapter 9. At present it is not possible to report on
government services for ‘all-hazards’ (box D.9).

EMERGENCY MANAGEMENT SECTOR OVERVIEW D.23
Box D.9 Reporting on all-hazards
While the sector covers a broader array of events, data on all hazards are limited. Many
hazards are sporadic in nature (for example floods, cyclones and acts of terrorism) and do not
lend themselves to annual, comparative reporting. Resource constraints and data availability
also restrict reporting.
Jurisdictions have held inquiries to review and compare government performance following
significant emergency events. A review by the Monash Injury Research Institute (2012) of
recent disaster inquiries recognised knowledge management (databases, research and
evaluation) as a key theme identified in these reports. Recent inquiries include the Tasmanian
Bushfires Inquiry (2013), Victorian Bushfires Royal Commission (2009), Perth Hills Bushfire February
2011 Review (Keelty 2011), and the Queensland Floods Commission of Inquiry (2012).
Source: Monash Injury Research Institute (2012).
Each performance indicator framework provides comprehensive information on the equity,
effectiveness and efficiency of specific government services.
Additional information is available in each chapter and associated attachment tables to
assist the interpretation of these results.
Fire events
The performance indicator framework for fire events is presented in figure D.9. An
overview of the fire events indicator results are presented in table D.3.

D.24 REPORT ON GOVERNMENT SERVICES 2016
Figure D.9 Fire events performance indicator framework

EMERGENCY MANAGEMENT SECTOR OVERVIEW D.25
This page has been changed since an earlier version of the Report. See errata at
http://www.pc.gov.au/research/ongoing/report-on-government-services/2016/emergency-management#errata
Table D.3 Performance indicator results for fire eventsa, b
NSW Vic Qld WA SA Tas ACT NT Aust
Equity and effectiveness — prevention/mitigation indicators
Fire incidents
Fire incidents attended by fire service organisations per 100 000 people, 2014-15
Most recent data for this measure are comparable and complete, subject to caveats (chapter 9)
no. 408 373 400 443 422 669 220 1 154 413
Source: Attachment table 9A.14
Accidental residential structure fires per 100 000 households, 2014-15
Most recent data for this measure are comparable and complete, subject to caveats (chapter 9)
no. 95.2 113.4 46.9 60.2 73.6 112.9 89.1 51.4 84.5
Source: Attachment table 9A.15
Level of safe fire practices in the community
Estimated percentage of households with a smoke alarm/detector, 2014-15
Most recent data for this measure are comparable and complete, subject to caveats (chapter 9)
% 94.4 97.2 94.9 na na na na 80.0 na
Source: Attachment table 9A.23
Equity and effectiveness — preparedness indicators
Firefighter workforce
Number of firefighting personnel (FTE) per 100 000 people, 2014-15
Most recent data for this measure are comparable and complete, subject to caveats (chapter 9)
no. 54.4 80.4 52.9 42.7 52.3 59.4 90.5 115.9 60.5
Source: Attachment table 9A.24
Equity and effectiveness — response indicators
Response times to structure fires
State-wide response times to structure fires, 2014-15
Most recent data for this measure are comparable and complete, subject to caveats (chapter 9)
Including call taking time, 90th percentile
min. 14.1 10.9 12.3 15.2 11.7 17.7 11.0 23.2 na
Excluding call taking time, 90th percentile
min. 13.2 9.5 11.6 13.6 14.0 16.3 9.0 15.1 na
Source: Attachment tables 9A.27
Efficiency indicators
Fire services expenditure per person
Fire service organisations' expenditure per person, 2014-15
Most recent data for this measure are comparable and complete, subject to caveats (chapter 9)
$ 131.63 214.31 129.96 145.61 134.85 157.24 211.64 220.13 156.42
Source: Attachment table 9A.29
(continued next page)

D.26 REPORT ON GOVERNMENT SERVICES 2016
Table D.3 (continued)
NSW Vic Qld WA SA Tas ACT NT Aust
Outcome indicators
Fire death rate
Fire death rate, per million people, 2013
Most recent data for this measure are comparable and complete, subject to caveats (chapter 9)
no. 4.5 4.0 4.9 2.8 4.8 – 2.6 4.2 4.3
Source: Attachment table 9A.6
Fire injury rate
Rate of hospital admissions due to fire injury, per 100 000 people, 2013-14
Most recent data for this measure are comparable and complete, subject to caveats (chapter 9)
no. 15.1 12.0 19.2 19.3 28.6 15.4 9.6 78.3 17.2
Source: Attachment table 9A.9
Confinement to room/object of origin
Proportion of building fires confined to room of origin, all ignition types, 2014-15
Most recent data for this measure are comparable and complete, subject to caveats (chapter 9)
% 68.3 71.8 69.5 65.9 66.2 60.4 73.4 94.0 na
Source: Attachment table 9A.10
Proportion of building and other structure fires confined to room of origin, all ignition types, 2014-15
Most recent data for this measure are comparable and complete, subject to caveats (chapter 9)
% 80.4 78.8 83.9 73.6 72.7 72.2 85.7 94.0 na
Source: Attachment table 9A.11
Value of property losses from fire events
Value of fire event household insurance claims per person, 2014-15
Most recent data for this measure are comparable and complete, subject to caveats (chapter 9)
$ 17.44 20.21 21.52 13.27 31.41 63.11 12.21 15.73 20.38
Source: Attachment table 9A.12
a Caveats for these data are available in chapter 9 and attachment 9A. Refer to the indicator interpretation boxes in chapter 9 for information to assist with the interpretation of data presented in this
table. b Some data are derived from detailed data in chapter 9 and attachment 9A. na Not available. – Nil or rounded to zero.
Source: Chapter 9 and attachment 9A.
Ambulance events
The performance indicator framework for ambulance events is presented in figure D.10.
An overview of the ambulance events indicator results are presented in table D.4.

EMERGENCY MANAGEMENT SECTOR OVERVIEW D.27
Figure D.10 Ambulance events performance indicator framework
D.28 REPORT ON GOVERNMENT SERVICES 2016
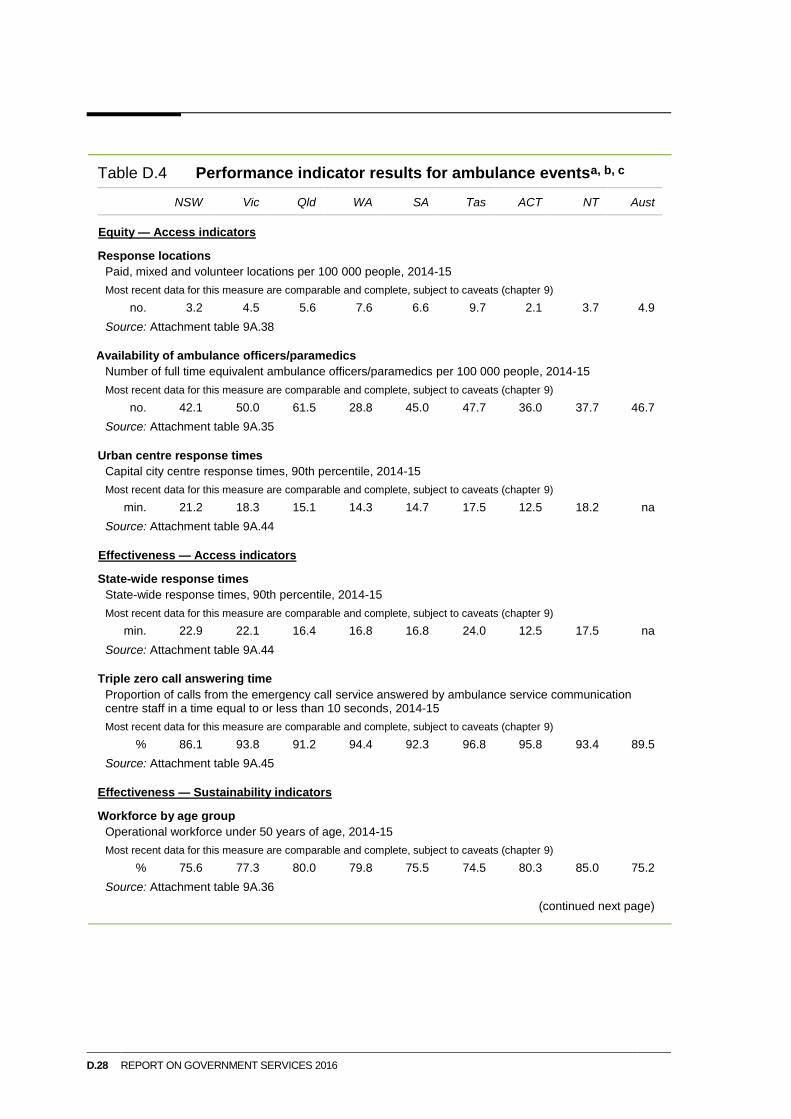
Table D.4 Performance indicator results for ambulance eventsa, b, c
NSW Vic Qld WA SA Tas ACT NT Aust
Equity — Access indicators
Response locations
Paid, mixed and volunteer locations per 100 000 people, 2014-15
Most recent data for this measure are comparable and complete, subject to caveats (chapter 9)
no. 3.2 4.5 5.6 7.6 6.6 9.7 2.1 3.7 4.9
Source: Attachment table 9A.38
Availability of ambulance officers/paramedics
Number of full time equivalent ambulance officers/paramedics per 100 000 people, 2014-15
Most recent data for this measure are comparable and complete, subject to caveats (chapter 9)
no. 42.1 50.0 61.5 28.8 45.0 47.7 36.0 37.7 46.7
Source: Attachment table 9A.35
Urban centre response times
Capital city centre response times, 90th percentile, 2014-15
Most recent data for this measure are comparable and complete, subject to caveats (chapter 9)
min. 21.2 18.3 15.1 14.3 14.7 17.5 12.5 18.2 na
Source: Attachment table 9A.44
Effectiveness — Access indicators
State-wide response times
State-wide response times, 90th percentile, 2014-15
Most recent data for this measure are comparable and complete, subject to caveats (chapter 9)
min. 22.9 22.1 16.4 16.8 16.8 24.0 12.5 17.5 na
Source: Attachment table 9A.44
Triple zero call answering time
Proportion of calls from the emergency call service answered by ambulance service communication centre staff in a time equal to or less than 10 seconds, 2014-15
Most recent data for this measure are comparable and complete, subject to caveats (chapter 9)
% 86.1 93.8 91.2 94.4 92.3 96.8 95.8 93.4 89.5
Source: Attachment table 9A.45
Effectiveness — Sustainability indicators
Workforce by age group
Operational workforce under 50 years of age, 2014-15
Most recent data for this measure are comparable and complete, subject to caveats (chapter 9)
% 75.6 77.3 80.0 79.8 75.5 74.5 80.3 85.0 75.2
Source: Attachment table 9A.36
(continued next page)

This page has been changed since an earlier version of the Report. See errata at
http://www.pc.gov.au/research/ongoing/report-on-government-services/2016/emergency-management#errata
EMERGENCY MANAGEMENT SECTOR OVERVIEW D.29
Table D.4 (continued)
NSW Vic Qld WA SA Tas ACT NT Aust
Effectiveness — Sustainability indicators
Staff attrition
Staff attrition rate, 2014-15
Most recent data for this measure are comparable and complete, subject to caveats (chapter 9)
% 4.0 4.3 2.6 3.3 2.6 6.2 2.8 na 3.6
Source: Attachment table 9A.36
Paramedics in training
Enrolments in accredited paramedic training courses, per million people, 2014
Most recent data for this measure are comparable and complete, subject to caveats (chapter 9)
no. 106.9 381.6 419.1 295.7 207.0 174.8 414.5 .. 271.3
Source: Attachment table 9A.37
Efficiency indicators
Expenditure per person
Ambulance services expenditure per person, 2014-15
Most recent data for this measure are comparable and complete, subject to caveats (chapter 9)
$ 115.47 123.26 129.84 86.41 145.65 127.27 114.94 108.90 119.45
Source: Attachment table 9A.47
Outcome indicators
Cardiac arrest survived event
Adult cardiac arrest survival rate — where resuscitation attempted (excluding paramedic witnessed), 2014-15
Most recent data for this measure are comparable and complete, subject to caveats (chapter 9)
% 31.1 29.8 25.0 24.5 23.4 29.1 36.9 26.1 28.4
Source: Attachment table 9A.41
Pain management
Proportion of patients who report a clinically meaningful pain reduction, 2014-15
Most recent data for this measure are comparable and complete, subject to caveats (chapter 9)
% 86.4 90.3 88.7 82.3 64.6 88.3 93.4 86.7 86.5
Source: Attachment table 9A.42
Level of patient satisfaction cOverall satisfaction rate, 2015
Most recent data for this measure are comparable and complete, subject to caveats (chapter 9)
99 97 98 97 98 98 98 97 98 %
± 1.1 ± 1.4 ± 1.3 ± 1.7 ± 1.3 ± 1.3 ± 1.3 ± 2.6 ± 0.5
Source: Attachment table 9A.43
a Caveats for these data are available in chapter 9 and attachment 9A. Refer to the indicator interpretation boxes in chapter 9 for information to assist with the interpretation of data presented in this
b ctable. Some data are derived from detailed data in chapter 9 and attachment 9A. The percentages reported for this indicator include 95 per cent confidence intervals. na Not available. .. Not applicable.
Source: Chapter 9 and attachment 9A.

D.30 REPORT ON GOVERNMENT SERVICES 2016
D.3 Cross-cutting and interface issues
The effective development of a ‘resilient community’ — one that works together to
understand and manage the risks that it confronts (COAG 2011) — requires the support
and input of a range of community stakeholders, including from other government
services:
Police services have a critical role in effective emergency management within each
jurisdiction. They generally assume critical roles in a jurisdiction’s disaster
management plans and coordination authorities (Victorian Bushfires Royal
Commission 2010; Queensland Floods Commission of Inquiry 2012).
Police services (and the justice system) have a critical role in implementing the
prevention strategies of a jurisdiction — such as enforcing road laws.
Health services, in particular emergency departments of public hospitals, have an
important role in the preparation and response to emergency events.
Similarly, ambulance services are an integral part of a jurisdiction’s health service
providing emergency as well as non-emergency patient care and transport.
In large scale emergencies, a range of agencies may be called upon to provide
assistance. For example, through Australian Government arrangements for the
provision of assistance to states and territories, the Australian Defence Force has been
called upon to assist emergency services organisations in responding to emergencies
such as the 2011 Queensland floods (Queensland Floods Commission of Inquiry 2012).
Emergency services, police and public hospitals are also key services involved in
preventing and dealing with acts of terrorism as set out in Australia’s National Counter
Terrorism Plan (NCTC 2012). While this Report does not explicitly include the details of
these government activities, such activities need to be kept in mind when interpreting
performance results.
Emergency management policies need to consider how government services address
populations and communities with special needs. The National Strategy for Disaster
Resilience recognises that the needs of vulnerable communities should be considered in
developing emergency management plans and programmes. ANZEMC has also identified
the resilience of vulnerable sections of society (including Aboriginal and Torres Strait
Islander Australians, culturally and linguistically diverse communities, children and youth,
the elderly and people with disability) as a priority area for action (COAG 2012).
Remote Indigenous communities face complex emergency management risks and
challenges. The 2007 Keeping Our Mob Safe: The National Emergency Management
Strategy For Remote Indigenous Communities provides a framework for coordinated and
cooperative approaches to emergency management in remote indigenous communities
(AEM 2007). The strategy is currently under review to ensure that it remains up-to-date
and continues to meet the needs of Indigenous communities. The capacity of remote
Indigenous communities to improve their disaster resilience is also supported by a pilot of

EMERGENCY MANAGEMENT SECTOR OVERVIEW D.31
community based and community led emergency management training across central,
northern and north-west Australia. This training will build local capacity, help
communities refine local emergency management plans and improve service delivery by
emergency management organisations.
D.4 Future directions in performance reporting
This emergency management sector overview will continue to be developed in future
reports. There are several important national initiatives currently underway. These include:
development of risk registers that assess the likelihood and potential impacts of
particular emergency events
development of a database and report on the economic costs of natural disasters
development of measures and indicators to assess communities’ resilience to natural
disasters
development of a national reporting framework against the UN Sendai Framework for
Disaster Risk Reduction, 2015-2030, once indicators are agreed at the international
level.
The Fire and ambulance services chapter (chapter 9) contains a service-specific section on
future directions in performance reporting.

D.32 REPORT ON GOVERNMENT SERVICES 2016
D.5 List of attachment tables
Attachment tables are identified in references throughout this sector overview by a ‘DA’
prefix (for example, table DA.1). Attachment tables are available on the website
(www.pc.gov.au/rogs/2016).
Emergency management
Table DA.1 Summary of emergency management organisations by event type
Table DA.2 Major sources of emergency service organisations' revenue, 2014-15
Table DA.3 Emergency service organisations' costs, 2014-15
Table DA.4 Emergency services human resources, 2014-15
Table DA.5 Australian Government Natural Disaster Resilience Program, funding to State
and Territory governments ($ million) (2014-15 dollars)
Table DA.6 Australian Government Natural Disaster Relief and Recovery Arrangements
expenses, funding to State and Territory governments ($ million)
(2014-15 dollars)
Table DA.7 Australian Government disaster recovery payments to eligible communities,
business, families and individuals by state or territory of the declared natural
disaster event ($ million) (2014-15 dollars)
Table DA.8 National security and preparedness survey, 2011-12
Table DA.9 Asset loss from emergency events ($ million) (2014-15 dollars)
Table DA.10 Asset loss from emergency events, per person (2014-15 dollars)
Table DA.11 Road traffic death rate
Table DA.12 Exposure to forces of nature death rate
Table DA.13 Total selected emergency events death rate
State and Territory Emergency Services
Table DA.14 All activities of State and Territory Emergency Services
Table DA.15 Major sources of State and Territory Emergency Service organisations' revenue
(2014-15 dollars)
Table DA.16 State and Territory Emergency Service organisations' costs ($'000)
(2014-15 dollars)
Table DA.17 State and Territory Emergency Service organisations' human resources
Table DA.18 State and Territory Emergency Service incidents
Table DA.19 State and Territory Emergency Service hours in attendance

EMERGENCY MANAGEMENT SECTOR OVERVIEW D.33
D.6 References
ABS (Australian Bureau of Statistics) 2015, Causes of Death Australia, 2013,
Cat. no. 3303.0, Canberra.
AEM (Australian Emergency Management) 2015a, Australian Emergency Management
Knowledge Hub, www.emknowledge.gov.au/disaster-information (accessed
12 October 2015).
—— 2015b, National Emergency Management Projects 2014-2015, www.ag.gov.au/
EmergencyManagement/National-Emergency-Management-Projects/Pages/National-
Emergency-Management-Projects-2014-2015.aspx (accessed 14 October 2015)
—— 2007, Keeping Our Mob Safe: The National Emergency Management Strategy
For Remote Indigenous Communities https://www.ag.gov.au/EmergencyManagement/
Community/Documents/keeping-our-mob-safe.aspx (accessed 16 November 2015).
ANAO (Australian National Audit Office) 2014, Emergency Defence Assistance to the
Civil Community, The Auditor-General Audit Report No. 24 2013–14,
www.anao.gov.au/Publications/Audit-Reports/2013-2014/Emergency-Defence-
Assistance-to-the-Civil-Community (accessed 12 September 2014).
Australian Government 2010, Australia to 2050: future challenges — 2010 Intergenerational
Report, Canberra.
ATC (Australian Transport Council) 2011, National Road Safety Strategy
2011–2020, Australian Government, Canberra.
Bureau of Infrastructure, Transport and Regional Economics (BITRE) 2009, Road Crash Costs
in Australia 2006, Canberra.
CAA (Council of Ambulance Authorities) 2013, Disaster and Emergency Management — The
Ambulance Role, www.caa.net.au/publications/disaster-and-emergency-management
(accessed 13 October 2014).
COAG (Council of Australian Governments) 2015, National Strategy for Disaster
Resilience: Implementation Review Progress to Date, https://www.ag.gov.au/
EmergencyManagement/About-us-emergency-management/Documents/NSDR-
Progress-to-date (accessed 7 December 2015).
—— 2011, National Strategy for Disaster Resilience, Australian Government, Council of
Australian Governments, Canberra
—— 2012, Standing Council on Police and Emergency Management: Terms of Reference,
www.ag.gov.au/Committeesandcouncils/Ministerialcouncils/Pages/StandingCouncilon
PoliceandEmergencyManagement.aspx (cited 1 Nov 2012)
—— 2009, National Disaster Resilience Statement, Excerpt from Communiqué, Council
of Australian Governments, Brisbane, 7 December 2009.
CSIRO (Commonwealth Scientific and Industrial Research Organisation) 2012, Extreme
weather events — what can we expect, www.csiro.au/Outcomes/Climate/adapt-extreme-
weather.aspx (accessed 1 October 2012).

D.34 REPORT ON GOVERNMENT SERVICES 2016
Dawson M. and Morris S., 2008, ‘Modelling community vulnerability to fires using
socio-economic indexes’, Modelling, Monitoring and Management of Forest Fires, ed. J. de
la Heras, C.A. Brebbia, D. Viegas and V. Leone, WIT Press, pp. 277–285.
DHS (Victorian Department of Human Services) 2009, January 2009 Heatwave in
Victoria: an Assessment of Health Impacts, Melbourne, www.health.vic.gov.au
/chiefhealthofficer/publications/heatwave.htm (accessed 1 October 2014).
EMA (Emergency Management Australia) 1998, Australian Emergency Terms Thesaurus,
Australian Emergency Manuals Series, Australian Government, Canberra.
FESA (Fire and Emergency Services Authority of Western Australia) 2010, Fatal Fires in
Western Australia 2001–2006, www.fesa.wa.gov.au/publications/GeneralReports/
FESA_Report-FatalFiresinWA2001–2006.pdf (accessed 31 August 2011).
Ganewatta, G. and Handmer, J. 2007, The Value of Volunteers in State Emergency Services,
prepared for ACSES and AFAC.
ICA (Insurance Council of Australia) 2014, Historical & current disaster statistics,
www.insurancecouncil.com.au/statistics (accessed 10 October 2014).
Keelty M.J. 2011, A Shared Responsibility: The Report of the Perth Hills Bushfire
February 2011 Review, Government of Western Australia, Perth.
LCCSC (Law, Crime and Community Safety Council) 2015, Draft Communiqué: Law, Crime
and Community Safety Council, 5 November 2015
http://www.ag.gov.au/About/CommitteesandCouncils/Law-Crime-and-Community-Safety-
Council/Documents/5-November-2015-LCCSC-Communique.pdf (accessed 16
November 2015).
—— 2014, Procedures for the law, crime and community safety council, www.lccsc.gov.au
(accessed 5 October 2014).
Monash Injury Research Institute 2012, Review of recent Australian disaster inquiries, by
Goode N., Spencer C., Archer F., McArdle D., Salmon P. and McClure R. funded by
Attorney-General’s Department, Monash University, Melbourne.
Nairn, J. and Fawcett, R. 2013, Defining heatwaves: heatwave defined as a heat-impact
event servicing all community and business sectors in Australia, Kent Town, South
Australia Centre for Australian Weather and Climate Research.
NCTC (National Counter-Terrorism Committee) 2012, National counter-terrorism plan,
3rd edition 2012, Australian Government, Canberra.
Nitschke M., Tucker G., Hansen A., Williams S., Zhang Y. and Bi P. 2011, ‘Impact of two
recent extreme heat episodes on morbidity and mortality in Adelaide, South Australia: a
case-series analysis’, Environmental Health, 10:42.
Productivity Commission 2015, Natural Disaster Funding Arrangements, Inquiry Report
no. 74, Canberra.

EMERGENCY MANAGEMENT SECTOR OVERVIEW D.35
Queensland Floods Commission of Inquiry 2012, Queensland Floods Commission of
Inquiry: Final Report, by Commissioner Holmes C.E., Queensland Floods Commission
of Inquiry, Brisbane.
Ramirez, S., Western, M., Mazerolle, L., and Wiedlitzka, S. 2013, ‘2011-2012 National Security
and Preparedness Survey: Technical Report’, Institute for Social Science Research and the
Australian Research Council Centre of Excellence in Policing and Security, The University
of Queensland: Brisbane, unpublished.
RICAC (Remote Indigenous Communities Advisory Committee) 2007, Keeping our mob safe:
National emergency management strategy for remote Indigenous communities,
Commonwealth of Australia, Canberra.
Tasmanian Bushfires Inquiry 2013, 2013 Tasmanian Bushfire Inquiry Report, by Malcolm
Hyde, Tasmanian Government, Hobart.
Victorian Bushfires Royal Commission 2010, 2009 Victorian Bushfires Royal Commission:
Final Report, by Commissioner Teague B., McLeod R., and Pascoe S., Parliament of
Victoria, Melbourne.
Western, M., Mazerolle, L., and Boreham, P. 2012, National Security and Preparedness Survey
2011-2012, Institute for Social Science Research and the Australian Research Council Centre
of Excellence in Policing and Security, The University of Queensland, Brisbane, 2012.
UNISDR (United Nations Office for Disaster Risk Reduction) 2015, Sendai Framework for
Disaster Risk Reduction, adopted by United Nations Member States in March 2015 at the
Third United Nations World Conference on Disaster Risk Reduction in Sendai, Japan,
http://www.unisdr.org/we/coordinate/sendai-framework (accessed 16 November 2015).

DA Emergency management —
attachment
Unsourced information was obtained from the Australian, State and Territory governments, with
the assistance of the Australasian Fire and Emergency Service Authorities Council and the Council
of Ambulance Authorities.
Data in this Report are examined by the Emergency Management Working Group, but have not
been formally audited by the Secretariat.
Data reported in the attachment tables are the most accurate available at the time of data
collection. Historical data may have been updated since the last edition of RoGS.
This file is available on the Review web page (www.pc.gov.au/gsp).
REPORT ON
GOVERNMENT
SERVICES 2016
EMERGENCY MANAGEMENT
SECTOR OVERVIEW

CONTENTS
Attachment contents
Emergency management
Table DA.1 Summary of emergency management organisations by event type
Table DA.2 Major sources of emergency service organisations revenue, 2014-15
Table DA.3 Emergency service organisations costs, 2014-15
Table DA.4 Emergency services human resources, 2014-15
Table DA.5 Australian Government National Partnership Agreement on Natural Disaster Resilience,
funding to State and Territory governments ($ million) (2014-15 dollars)
Table DA.6 Australian Government Natural Disaster Relief and Recovery Arrangements, funding to
State and Territory governments ($ million) (2014-15 dollars)
Table DA.7 Australian Government disaster recovery payments to eligible individuals by State or
Territory of the declared major disaster ($ million) (2014-15 dollars)
Table DA.8 National security and preparedness survey, 2011-12
Table DA.9 Asset loss from emergency events ($ million) (2014-15 dollars)
Table DA.10 Asset loss from emergency events, per person (2014-15 dollars)
Table DA.11 Road traffic death rate
Table DA.12 Exposure to forces of nature death rate
Table DA.13 Total selected emergency events death rate
State Emergency Services
Table DA.14 All activities of State and Territory Emergency Services
Table DA.15 Major sources of State and Territory Emergency Service organisations' revenue (2014-15
dollars)
Table DA.16 State and Territory Emergency Service organisations' costs ($'000) (2014-15 dollars)
Table DA.17 State and Territory Emergency Service organisations' human resources
Table DA.18 State and Territory Emergency Service incidents
Table DA.19 State and Territory Emergency Service hours in attendance
Table DA.20 Deflators
REPORT ON
GOVERNMENT
SERVICES 2016
EMERGENCY MANAGEMENT
SECTOR OVERVIEW
PAGE 1 of CONTENTS

EMERGENCY MANAGEMENT
All jurisdictions — Emergency
management
REPORT ON
GOVERNMENT
SERVICES 2016
EMERGENCY MANAGEMENT
SECTOR OVERVIEW
PAGE 1 of EMERGENCY MANAGEMENT

TABLE DA.1
Table DA.1
Vic Qld WA SA Tas ACT NT Aus Gov (c)
Metropolitan Fire
Brigade
Queensland Fire and
Emergency Services
Country Fire Service Tasmania Fire
Service
ACT Emergency
Services Agency
Qld Police Service
Bushfires NT
Parks and Wildlife
Forest Products
Commission
ACT Rural Fire
Service
Attorney-General’s
Department
Parks Victoria
Local government WA Police Service
Qld Ambulance Service
Local governments
Bureau of
Meteorology
Parks and Wildlife
Canberra Urban
Parks and Places
Gas distribution
companies
Department of National
Parks, Recreation, Sport
and Racing
Department of
Agriculture, Fisheries and
Forestry
Airport Rescue
and Firefighting
ServiceTerritory and
Municipal Services
Directorate
Australian Building
Codes Board
Summary of emergency management organisations by event type (a), (b)
Airservices Australia
(Rescue and Fire
Fighting Service)
Department of Fire and
Emergency Services
Fires
Department for Child
Protection and Family
Support
Metropolitan Fire
Service
ACT Fire and
Rescue Department of Parks
and Wildlife
Aviation Rescue
and Fire Fighting
Authority
NSW Rural Fire
Service
Country Fire
Authority
Department of
Environment Land
Water & Planning
Department of Natural
Resources and Mines
Office of
Environment and
Heritage
NSW
NT Fire and
Rescue Service
Fire and Rescue
NSW
NSW Police Force
NSW Ambulance
Department of
Defence
Department of
Infrastructure and
Regional
Development
Forestry Tasmania
Queensland Government
Air rescue service
(QGAir), Public Safety
Business Agency (PSBA)
REPORT ON
GOVERNMENT
SERVICES 2016
EMERGENCY MANAGEMENT
SECTOR OVERVIEW
PAGE 1 of TABLE DA.1

TABLE DA.1
Table DA.1
Vic Qld WA SA Tas ACT NT Aus Gov (c)
Summary of emergency management organisations by event type (a), (b)
NSW
Ambulance attendances/services
Qld Ambulance Service St John Ambulance
Department of Health
Royal Flying Doctor
Service
Road crash rescues
Metropolitan Fire
Brigade
Queensland Fire and
Emergency Services
WA Police Service State Emergency
Service
Tasmania Fire
Service
NT Fire and
Rescue Service
Qld SES
Country Fire
Authority
Qld Ambulance Service
Victoria SES Qld Police Service St John Ambulance
Royal Flying
Doctor Service
Department of Health
— National Incident
Room
NT Emergency
Services
Helicopter Rescue
Services (under
ambulance control)
NSW Ambulance Ambulance
Victoria
SA Ambulance
Service
Ambulance
Tasmania
ACT Emergency
Services Agency
St John
AmbulanceDepartment of Fire and
Emergency ServicesNSW Health
Department of Fire and
Emergency Services/St
John Ambulance -
Rescue Helicopter
Service
Metropolitan Fire
Brigade
Royal Flying Doctor
Service
Attorney-General’s
Department
(Australian Medical
Transport
Coordination Group)
Territory Health
Service
ACT Ambulance
Service
Metropolitan Fire
Service
State Emergency
Service
Fire and Rescue
NSW
NSW Police Force
NSW Ambulance
NSW SES
Volunteer Rescue
Association
Queensland Government
Air rescue service
(QGAir), Public Safety
Business Agency (PSBA)
ACT Fire and
Rescue
Department of Fire and
Emergency Services
Country Fire Service
REPORT ON
GOVERNMENT
SERVICES 2016
EMERGENCY MANAGEMENT
SECTOR OVERVIEW
PAGE 2 of TABLE DA.1

TABLE DA.1
Table DA.1
Vic Qld WA SA Tas ACT NT Aus Gov (c)
Summary of emergency management organisations by event type (a), (b)
NSW
Rescues (other)
Metropolitan Fire
Brigade
Queensland Fire and
Emergency Services
WA Police Service State Emergency
Service
Tasmania Police ACT Emergency
Services Agency
NT Fire and
Rescue Service
Australian Maritime
Safety Authority
Country Fire
Authority
Qld SES Metropolitan Fire
Service
State Emergency
Service
ACT Fire and
Rescue
NT Emergency
Services
Department of
Defence
Victoria SES Qld Ambulance Service Country Fire Service Tasmania Fire
Service
Australian Federal
Police
NT Police
Victoria Police Qld Police Service St John Ambulance SA Police
Ambulance
Victoria
SA Ambulance
Service
Ambulance
Tasmania
Municipal councils State Rescue
Helicopter Service
Victorian Building
Authority
Natural events
Local government
Qld Police Service
Victoria Police Qld SES NT Police
WA Police Service
Qld Ambulance Service Parks and Wildlife
Local Councils
ACT Emergency
Service
Ambulance
Tasmania
Department of Mineral
and Petroleum
Resources
Local government
authorities
Department of the
Premier and Cabinet
Department of Natural
Resources and Mines
Geoscience Australia
NT Fire and
Rescue Service
Attorney-General’s
Department
NT Emergency
Service
Australian Customs
and Border
Protection Service
Department of Fire and
Emergency Services/St
John Ambulance -
Rescue Helicopter
Service
Bureau of
Meteorology
Department of Fire and
Emergency Services
ACT State
Emergency Service
Department of
Police and Public
Safety
ACT State
Emergency Service
Department of
Infrastructure and
Regional
Development
Territory and
Municipal Services
ACT Fire and
Rescue
Department for Child
Protection and Family
Support
Australian Federal
Police
State Emergency
Service
Marine Rescue NSW
NSW Police Force
NSW Police Force
NSW Ambulance
NSW SES
Volunteer Rescue
Association
Fire and Rescue
NSW
Municipal councilsNSW Ambulance
Department of
Agriculture
Mines Rescue
Service
Victoria State
Emergency
Service
Functional Services
and Hazard Leader’s
as per State
Emergency
Management Plan
Department of Fire and
Emergency Services
Queensland Fire and
Emergency Services
Fire and Rescue
NSW
Metropolitan Fire
Brigade
State Emergency
Service
Tasmania Fire
ServiceCountry Fire
Authority
NSW Rural Fire
Service
Queensland Government
Air rescue service
(QGAir), Public Safety
Business Agency (PSBA)
Department of
Defence
REPORT ON
GOVERNMENT
SERVICES 2016
EMERGENCY MANAGEMENT
SECTOR OVERVIEW
PAGE 3 of TABLE DA.1

TABLE DA.1
Table DA.1
Vic Qld WA SA Tas ACT NT Aus Gov (c)
Summary of emergency management organisations by event type (a), (b)
NSW
Natural events (continued)
Department of Health ACT Ambulance
Service
Australian Building
Codes Board
Department of Water
Department of Health Water Corporation
Tasmania Police
Local governments
Main Roads WA
Port Authorities
Department of Housing
and Public Works
Department of
Primary Industries,
Water and
Environment
Department of
Communities, Child
Safety and Disability
Services
Department of
Environment and
Heritage Protection
Department of Parks
and WildlifeDepartment of
Family and
Community Services
Department of State
Development,
Infrastructure and
Planning
Bureau of MeteorologyTransport for NSW
Department of
Premier and Cabinet
NSW Environment
Protection Authority
Mines Rescue
Service
Department of Energy
and Water Supply
NSW Treasury
Department for
Planning and
Infrastructure
Department of
Health and Human
Services
NSW Health
Local government
authorities
Ministry for Police
and Emergency
Services
Department of
Finance and
ServicesAll Australian
Government
Agencies under the
Australian
Government Crisis
Management
Framework
ACT Rural Fire
Service
Department of
Primary Industry Department of Transport
and Main Roads
Department of
Agriculture, Fisheries and
Forestry
Department of
Premier and
Cabinet
Volunteer Rescue
Association
REPORT ON
GOVERNMENT
SERVICES 2016
EMERGENCY MANAGEMENT
SECTOR OVERVIEW
PAGE 4 of TABLE DA.1

TABLE DA.1
Table DA.1
Vic Qld WA SA Tas ACT NT Aus Gov (c)
Summary of emergency management organisations by event type (a), (b)
NSW
Technological and hazardous material incidents
NT Police
WA Police Service
Victoria Police Department of Health Tasmania SES
Health Directorate
Department of Health
MBT
Qld Police Service
St John Ambulance
Water Corporation
Alinta Gas
Port Authorities
Tasmania Police
Parks Victoria
Metropolitan Fire
Brigade
Australian Customs
and Border
Protection Service
Department of
Agriculture
Airservices Australia
Civil Aviation Safety
Authority
Department of Transport
and Main Roads
Department of Mineral
and Petroleum
Resources
Environment
Protection Authority
Functional Services
and Hazard Leader’s
as per State
Emergency
Management Plan
Queensland Fire and
Emergency Services
Australian Maritime
Safety Authority
Department of Justice
and Attorney-General,
Hazardous Industries and
Chemicals Branch
WorkSafe NT
Marine Board (Vic
Channels, Local
Ports Operators)
Ambulance
Tasmania
Department of
Infrastructure and
Regional
Development
Australian Federal
PoliceDepartment of
Health
SA Ambulance
Service
Department for
Planning and
Infrastructure
Department of
Health and Human
Services
Northern Territory
Emergency
Service
Department of
Defence
Department of Health
Australian Radiation
Protection and
Nuclear Safety
Agency
Qld Ambulance Service
Department of
Agriculture, Fisheries and
Forestry
Vic Workcover
Authority
Tasmania Fire
Service
National Oil Spill
Committee
Department of
Environment Land
Water & Planning
Department of
Environment Regulation
Department of
Infrastructure,
Energy and
Resources
Local government
authorities
Industry Emergency
Response Groups
Department of Fire and
Emergency Services
ACT Fire and
Rescue
Environmental
Protection
Authority
Department of
Environment and
Heritage Protection
Department of
Health and Human
Services
Ambulance
Victoria
NSW Health
NSW Ambulance
Port Corporations
Oil Companies
Department of
Environment and
Climate Change
NSW
St John
Ambulance
NSW Environment
Protection Authority
Department of
Primary Industries,
Water and
Environment
Department of
Police and Public
Safety
NSW Police Force
Australian Transport
Safety Bureau
Country Fire
Authority
Fire and Rescue
NSW
NSW Rural Fire
Service
NT Fire and
Rescue Service
Attorney-General’s
Department
REPORT ON
GOVERNMENT
SERVICES 2016
EMERGENCY MANAGEMENT
SECTOR OVERVIEW
PAGE 5 of TABLE DA.1

TABLE DA.1
Table DA.1
Vic Qld WA SA Tas ACT NT Aus Gov (c)
Summary of emergency management organisations by event type (a), (b)
NSW
Quarantine and disease control
Department of Health Department of Health Health Directorate
Environment ACT
Water Corporation
NT Police
Local government
Department of
Environment and
Heritage Protection
Qld Police Service
Department of
Agriculture
Attorney-General’s
Department
Department
Primary Industry
and Fisheries
Department of National
Parks, Recreation, Sport
and Racing
Department of
Foreign Affairs and
Trade
Department of
Agriculture
Department of
Health & Human
Services (Public
Health)
Department of
Primary Industry
NSW Environment
Protection Authority
(Water Agencies
and Agriculture)
Municipal councils Transport and
Works Department
NT Emergency
Service
Department of Health
Biosecurity Australia
Australian Customs
and Border
Protection Service
ACT Electricity and
Water
Territory Health
Service
Queensland Fire and
Emergency Services
Department of Transport
and Main Roads
Department of Energy
and Water Supply
Department of
Health and Human
Services
Department of
Primary Industries,
Water and
Environment
(Quarantine)
Functional Services
and Hazard Leader’s
as per State
Emergency
Management Plan
Department of
Agriculture
Department of Fire and
Emergency Services
Department of
Environment Land
Water & Planning
NSW Health
Water Authorities
NSW Police Force
Fire and Rescue
NSW
REPORT ON
GOVERNMENT
SERVICES 2016
EMERGENCY MANAGEMENT
SECTOR OVERVIEW
PAGE 6 of TABLE DA.1

TABLE DA.1
Table DA.1
Vic Qld WA SA Tas ACT NT Aus Gov (c)
Summary of emergency management organisations by event type (a), (b)
NSW
Emergency relief and recovery
Local government
Utility agencies Centrelink
Department of Health
Victoria SES Local governments
Victoria PoliceLocal government
Tasmania SES
Tasmania Police
Vic Roads
Utility companies Department of Water
Attorney-General’s
Department
Department of
Environment Land
Water & Planning
Department of State
Development,
Infrastructure and
Planning
Department of
Agriculture, Fisheries and
Forestry
Department of
Health and Human
Services
(Community and
Rural Health)
Department of
Infrastructure
Energy and
Resources
Insurance Council of
Australia
Department Agriculture
and Food
Department of Transport
and Main Roads
Municipal councils
Department of Treasury
Department of Housing
and Public Works
Department of Social
Services
Department of
Infrastructure and
Regional
Development
NSW Health
Department of
Health
Government
departments
ACT Emergency
Services Agency
Northern Territory
Emergency
Service
Department of
Education and
Communities
Department of Energy
and Water Supply
Department of
Environment and
Heritage Protection
Department of
Communities, Child
Safety and Disability
Services
Functional Services
and Hazard Leader’s
as per State
Emergency
Management Plan
Department for Child
Protection and Family
Support
Department Mineral and
Petroleum Resources
Church/ charitable
organisationsTerritory and
Municipal Services
Directorate
Community
Services
Directorate
ACT State
Emergency Service
Department of the
Premier and Cabinet
Department of
Health & Human
Services (Public
Health)
Queensland
Reconstruction Authority
NSW Treasury
State Emergency
Management
Committee
NSW Police Force
Department of
Finance and
Services
Department of
Family and
Community Services
Department of
Premier and Cabinet
Ministry for Police
and Emergency
Services
Department of
Primary Industry
Department of
Premier and
Cabinet
Department of
Primary Industries,
Parks, Water and
Environment
Department of
Economic
Development
Department of
Transport
Department for
Planning and
Infrastructure
REPORT ON
GOVERNMENT
SERVICES 2016
EMERGENCY MANAGEMENT
SECTOR OVERVIEW
PAGE 7 of TABLE DA.1

TABLE DA.1
Table DA.1
Vic Qld WA SA Tas ACT NT Aus Gov (c)
Summary of emergency management organisations by event type (a), (b)
NSW
Queensland Fire and
Emergency Services
Emergency relief and recovery (continued)
Qld SES
Department of Health
Utility agencies
(a)
(b)
(c)
Source: Australian, State and Territory governments (unpublished).
Community
Relations
Commission
The scope of this table is primary response agency or agencies (that is government agencies with legislative responsibility). Non-government agencies that
provide support, but do not have a direct legislative responsibility, are not included.
Queensland Police
Service
Local government
authorities
Ministry for Police
and Emergency
Services
Organisations are ordered by level of involvement in each event type, except for the column under the heading of Australian Government. That is, the first
mentioned organisation for each jurisdiction under each event type is the most involved combating organisation, the second mentioned is the second main
combating organisation, through to the last mentioned, which is the most minor combating organisation listed (and there may be other organisations with a role,
more minor again which are not listed).
Emergency Management Australia, within the Attorney-Generals Department, is the central coordinating Australian Government agency for any hazard, at the
request of the jurisdictions. Deployment of interstate SES volunteers is managed by the Australian Council of SES (ACSES).
REPORT ON
GOVERNMENT
SERVICES 2016
EMERGENCY MANAGEMENT
SECTOR OVERVIEW
PAGE 8 of TABLE DA.1

TABLE DA.2
Table DA.2
Unit NSW Vic Qld WA SA Tas ACT NT Aust
Total ambulance, fire and emergency service organisations
Revenue
Government grants/contributions (c) $m 903.8 990.0 561.3 182.9 133.1 55.0 102.1 64.9 2 993.1
Total levies $m 719.6 590.0 435.5 289.7 212.9 53.9 – – 2 301.6
User/Transport charges $m 263.7 238.2 167.9 109.8 91.7 20.4 5.5 2.8 900.0
Subscriptions and other income (d) $m 75.9 100.3 62.3 34.2 34.3 7.5 5.8 1.2 321.5
Total $m 1 963.0 1 918.5 1 227.0 616.6 472.0 136.7 113.5 68.9 6 516.3
Total revenue per person $ 259.47 325.91 258.30 238.89 279.06 265.32 292.81 281.99 275.82
Ambulance service organisations
Revenue
Government grants/contributions (c) $m 590.7 475.9 471.5 120.8 127.2 48.0 36.8 23.3 1 894.2
Total levies $m – – – – – – – – –
User/Transport charges $m 223.1 170.8 114.2 100.4 86.0 9.3 5.5 2.8 712.2
Subscriptions and other income (d) $m 24.3 78.5 10.0 30.3 30.9 – 0.8 1.2 175.9
Total $m 838.1 725.1 595.7 251.5 244.1 57.3 43.2 27.3 2 782.3
Total revenue per person $ 110.77 123.19 125.40 97.42 144.32 111.23 111.40 111.94 117.77
Fire and emergency service organisations (Fire and SES)
Revenue
Government grants/contributions (c) $m 313.1 514.1 89.8 62.2 5.9 7.0 65.3 41.5 1 098.9
Total levies $m 719.6 590.0 435.5 289.7 212.9 53.9 – – 2 301.6
User/Transport charges $m 40.6 67.4 53.7 9.4 5.6 11.1 – – 187.8
Subscriptions and other income (d) $m 51.6 21.8 52.4 3.9 3.4 7.5 5.0 – 145.6
Total $m 1 124.9 1 193.3 631.3 365.2 227.9 79.4 70.3 41.5 3 733.9
Total revenue per person $ 148.69 202.73 132.89 141.48 134.74 154.09 181.41 170.05 158.05
State/Territory emergency service (SES) organisations (e)
Major sources of emergency service organisations revenue, 2014-15 (a), (b)
REPORT ON
GOVERNMENT
SERVICES 2016
EMERGENCY MANAGEMENT
SECTOR OVERVIEW
PAGE 1 of TABLE DA.2
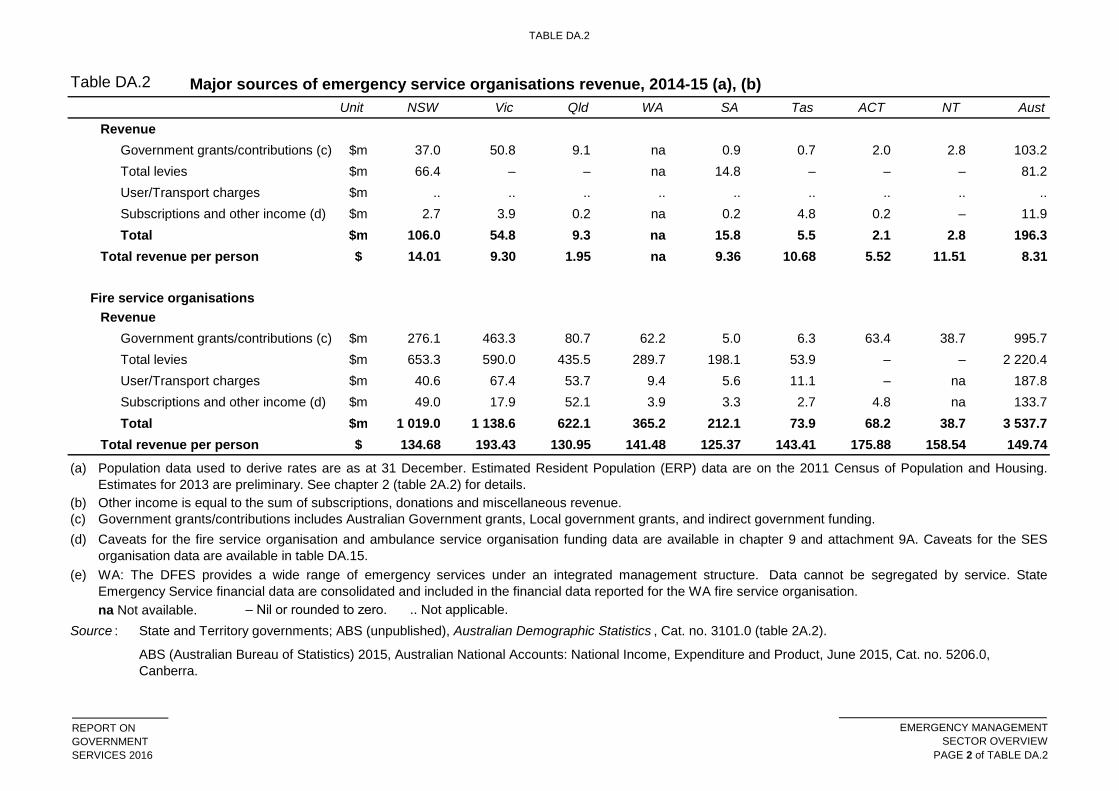
TABLE DA.2
Table DA.2
Unit NSW Vic Qld WA SA Tas ACT NT Aust
Major sources of emergency service organisations revenue, 2014-15 (a), (b)
Revenue
Government grants/contributions (c) $m 37.0 50.8 9.1 na 0.9 0.7 2.0 2.8 103.2
Total levies $m 66.4 – – na 14.8 – – – 81.2
User/Transport charges $m .. .. .. .. .. .. .. .. ..
Subscriptions and other income (d) $m 2.7 3.9 0.2 na 0.2 4.8 0.2 – 11.9
Total $m 106.0 54.8 9.3 na 15.8 5.5 2.1 2.8 196.3
Total revenue per person $ 14.01 9.30 1.95 na 9.36 10.68 5.52 11.51 8.31
Fire service organisations
Revenue
Government grants/contributions (c) $m 276.1 463.3 80.7 62.2 5.0 6.3 63.4 38.7 995.7
Total levies $m 653.3 590.0 435.5 289.7 198.1 53.9 – – 2 220.4
User/Transport charges $m 40.6 67.4 53.7 9.4 5.6 11.1 – na 187.8
Subscriptions and other income (d) $m 49.0 17.9 52.1 3.9 3.3 2.7 4.8 na 133.7
Total $m 1 019.0 1 138.6 622.1 365.2 212.1 73.9 68.2 38.7 3 537.7
Total revenue per person $ 134.68 193.43 130.95 141.48 125.37 143.41 175.88 158.54 149.74
(a)
(b)
(c)
(d)
(e)
na Not available. – Nil or rounded to zero. . .. Not applicable.
Source :
ABS (Australian Bureau of Statistics) 2015, Australian National Accounts: National Income, Expenditure and Product, June 2015, Cat. no. 5206.0,
Canberra.
State and Territory governments; ABS (unpublished), Australian Demographic Statistics , Cat. no. 3101.0 (table 2A.2).
Population data used to derive rates are as at 31 December. Estimated Resident Population (ERP) data are on the 2011 Census of Population and Housing.
Estimates for 2013 are preliminary. See chapter 2 (table 2A.2) for details.
Other income is equal to the sum of subscriptions, donations and miscellaneous revenue.
Government grants/contributions includes Australian Government grants, Local government grants, and indirect government funding.
Caveats for the fire service organisation and ambulance service organisation funding data are available in chapter 9 and attachment 9A. Caveats for the SES
organisation data are available in table DA.15.
WA: The DFES provides a wide range of emergency services under an integrated management structure. Data cannot be segregated by service. State
Emergency Service financial data are consolidated and included in the financial data reported for the WA fire service organisation.
REPORT ON
GOVERNMENT
SERVICES 2016
EMERGENCY MANAGEMENT
SECTOR OVERVIEW
PAGE 2 of TABLE DA.2

TABLE DA.3
Table DA.3
Unit NSW Vic Qld WA SA Tas ACT NT Total
Total ambulance, fire and emergency service organisations
$m 1 232.7 1 052.5 752.7 321.2 297.0 93.0 81.8 51.8 3 882.8
Capital costs (d)
Depreciation $m 70.7 107.6 37.6 29.9 27.7 9.2 6.9 5.2 294.8
User cost of capital - Other $m 57.3 209.6 27.1 27.9 31.3 8.8 7.2 6.0 375.3
Other costs (e) $m 604.9 671.1 426.0 219.9 134.1 40.8 33.7 21.1 2 151.7
Total costs (f) $m 1 965.6 2 040.8 1 243.4 598.9 490.2 151.9 129.5 84.2 6 704.5
Total costs per person $ 259.81 346.70 261.74 232.03 289.81 294.78 334.16 344.71 283.82
Other expenses
Labour costs - Payroll tax $m 30.2 27.0 – – 6.0 2.6 – 1.6 67.4
User cost of capital - Land $m 22.3 127.3 8.4 10.4 6.5 2.0 1.9 0.7 179.4
Interest on borrowings $m – – – 2.9 – – – – 3.4
Ambulance service organisations
$m 599.2 465.0 425.1 136.6 166.8 45.3 29.0 19.0 1 885.9
Capital costs (d)
Depreciation $m 18.0 25.9 32.8 14.3 9.2 2.7 1.3 1.4 105.7
User cost of capital - Other $m 15.8 19.5 25.5 9.0 4.6 2.0 0.9 – 77.5
Other costs (e) $m 240.5 215.2 133.4 63.2 65.8 15.6 13.4 6.0 753.1
Total costs (f) $m 873.6 725.6 616.8 223.1 246.4 65.6 44.6 26.6 2 822.1
Total costs per person $ 115.47 123.26 129.84 86.41 145.65 127.27 114.94 108.90 119.47
Other costs
Labour costs - Payroll tax $m – – – – – – – – –
User cost of capital - Land $m 9.9 6.2 8.4 2.6 1.4 0.6 0.6 – 29.6
Interest on borrowings $m – – – – – – – – –
Emergency service organisations costs, 2014-15 (a), (b), (c)
Labour costs - Salaries and payments
in the nature of salaries
Labour costs - Salaries and payments
in the nature of salaries
REPORT ON
GOVERNMENT
SERVICES 2016
EMERGENCY MANAGEMENT
SECTOR OVERVIEW
PAGE 1 of TABLE DA.3
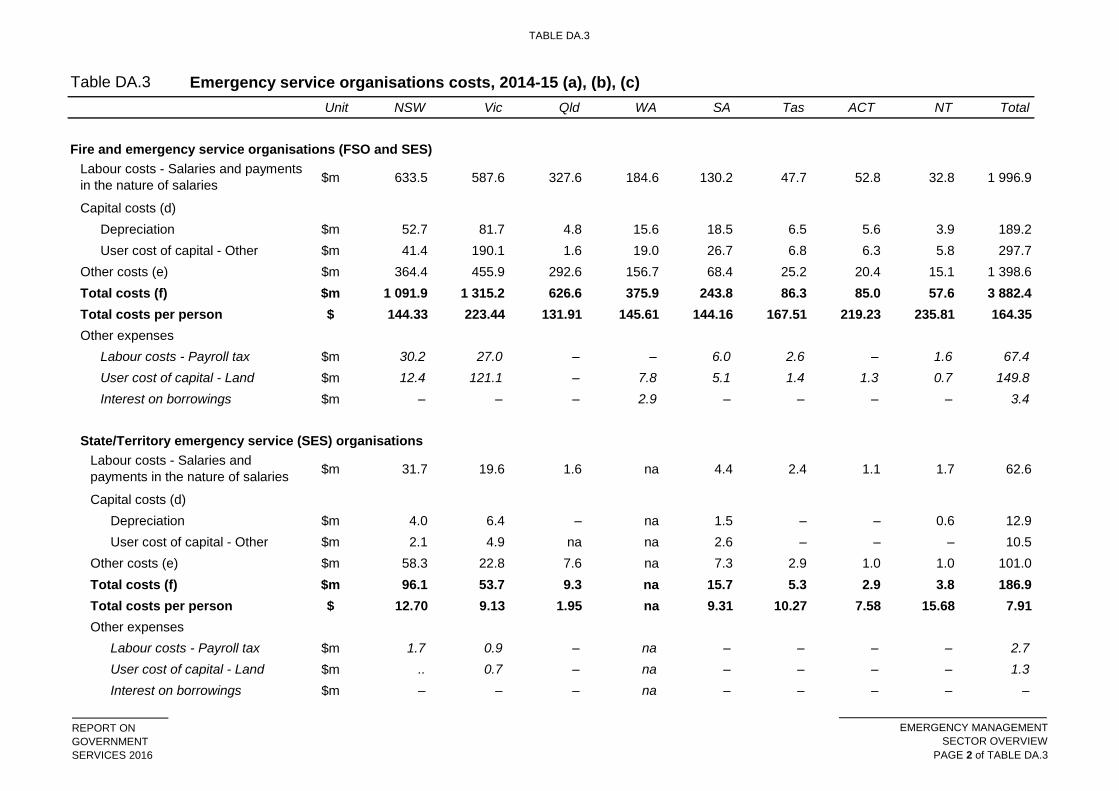
TABLE DA.3
Table DA.3
Unit NSW Vic Qld WA SA Tas ACT NT Total
Emergency service organisations costs, 2014-15 (a), (b), (c)
Fire and emergency service organisations (FSO and SES)
$m 633.5 587.6 327.6 184.6 130.2 47.7 52.8 32.8 1 996.9
Capital costs (d)
Depreciation $m 52.7 81.7 4.8 15.6 18.5 6.5 5.6 3.9 189.2
User cost of capital - Other $m 41.4 190.1 1.6 19.0 26.7 6.8 6.3 5.8 297.7
Other costs (e) $m 364.4 455.9 292.6 156.7 68.4 25.2 20.4 15.1 1 398.6
Total costs (f) $m 1 091.9 1 315.2 626.6 375.9 243.8 86.3 85.0 57.6 3 882.4
Total costs per person $ 144.33 223.44 131.91 145.61 144.16 167.51 219.23 235.81 164.35
Other expenses
Labour costs - Payroll tax $m 30.2 27.0 – – 6.0 2.6 – 1.6 67.4
User cost of capital - Land $m 12.4 121.1 – 7.8 5.1 1.4 1.3 0.7 149.8
Interest on borrowings $m – – – 2.9 – – – – 3.4
State/Territory emergency service (SES) organisations
$m 31.7 19.6 1.6 na 4.4 2.4 1.1 1.7 62.6
Capital costs (d)
Depreciation $m 4.0 6.4 – na 1.5 – – 0.6 12.9
User cost of capital - Other $m 2.1 4.9 na na 2.6 – – – 10.5
Other costs (e) $m 58.3 22.8 7.6 na 7.3 2.9 1.0 1.0 101.0
Total costs (f) $m 96.1 53.7 9.3 na 15.7 5.3 2.9 3.8 186.9
Total costs per person $ 12.70 9.13 1.95 na 9.31 10.27 7.58 15.68 7.91
Other expenses
Labour costs - Payroll tax $m 1.7 0.9 – na – – – – 2.7
User cost of capital - Land $m .. 0.7 – na – – – – 1.3
Interest on borrowings $m – – – na – – – – –
Labour costs - Salaries and
payments in the nature of salaries
Labour costs - Salaries and payments
in the nature of salaries
REPORT ON
GOVERNMENT
SERVICES 2016
EMERGENCY MANAGEMENT
SECTOR OVERVIEW
PAGE 2 of TABLE DA.3
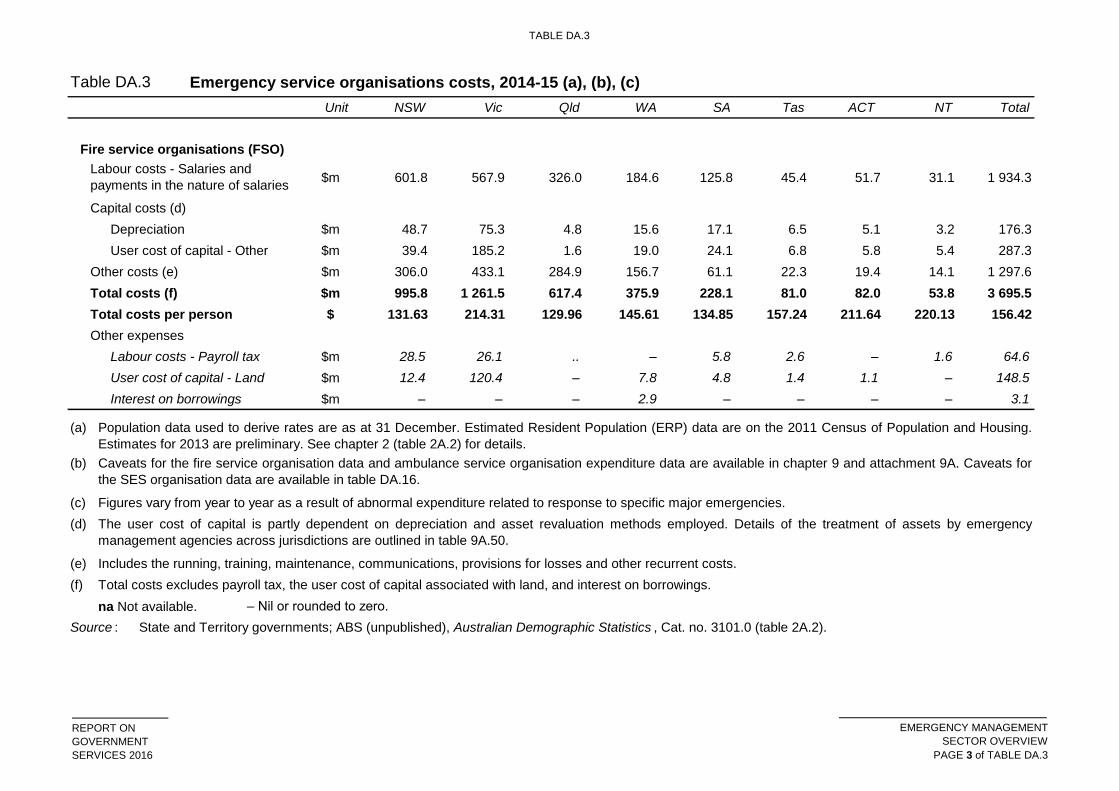
TABLE DA.3
Table DA.3
Unit NSW Vic Qld WA SA Tas ACT NT Total
Emergency service organisations costs, 2014-15 (a), (b), (c)
Fire service organisations (FSO)
$m 601.8 567.9 326.0 184.6 125.8 45.4 51.7 31.1 1 934.3
Capital costs (d)
Depreciation $m 48.7 75.3 4.8 15.6 17.1 6.5 5.1 3.2 176.3
User cost of capital - Other $m 39.4 185.2 1.6 19.0 24.1 6.8 5.8 5.4 287.3
Other costs (e) $m 306.0 433.1 284.9 156.7 61.1 22.3 19.4 14.1 1 297.6
Total costs (f) $m 995.8 1 261.5 617.4 375.9 228.1 81.0 82.0 53.8 3 695.5
Total costs per person $ 131.63 214.31 129.96 145.61 134.85 157.24 211.64 220.13 156.42
Other expenses
Labour costs - Payroll tax $m 28.5 26.1 .. – 5.8 2.6 – 1.6 64.6
User cost of capital - Land $m 12.4 120.4 – 7.8 4.8 1.4 1.1 – 148.5
Interest on borrowings $m – – – 2.9 – – – – 3.1
(a)
(b)
(c)
(d)
(e)
(f)
na Not available. – Nil or rounded to zero.
Source : State and Territory governments; ABS (unpublished), Australian Demographic Statistics , Cat. no. 3101.0 (table 2A.2).
Figures vary from year to year as a result of abnormal expenditure related to response to specific major emergencies.
The user cost of capital is partly dependent on depreciation and asset revaluation methods employed. Details of the treatment of assets by emergency
management agencies across jurisdictions are outlined in table 9A.50.
Includes the running, training, maintenance, communications, provisions for losses and other recurrent costs.
Total costs excludes payroll tax, the user cost of capital associated with land, and interest on borrowings.
Caveats for the fire service organisation data and ambulance service organisation expenditure data are available in chapter 9 and attachment 9A. Caveats for
the SES organisation data are available in table DA.16.
Population data used to derive rates are as at 31 December. Estimated Resident Population (ERP) data are on the 2011 Census of Population and Housing.
Estimates for 2013 are preliminary. See chapter 2 (table 2A.2) for details.
Labour costs - Salaries and
payments in the nature of salaries
REPORT ON
GOVERNMENT
SERVICES 2016
EMERGENCY MANAGEMENT
SECTOR OVERVIEW
PAGE 3 of TABLE DA.3

TABLE DA.4
Table DA.4 Emergency services human resources, 2014-15 (a), (b), (c), (d)
NSW Vic Qld WA SA Tas ACT NT Aust
Total ambulance, fire and emergency service organisations
Salaried personnel
Operational FTE na 7 881 6 052 2 034 1 887 608 538 417 na
Support personnel FTE na 2 958 1 021 863 499 267 166 70 na
Total FTE 10 146 10 839 7 073 2 897 2 386 874 704 487 35 406
Per 100 000 people 134.1 184.1 148.9 112.2 141.1 169.7 181.5 199.4 149.9
Volunteers
Operational no. 122 41 102 176 32 790 1 251 568 1 817 537 5 990
Support volunteers no. 28 21 265 1 1 152 192 – – 859 221
Total no. 92 648 62 367 41 077 33 942 16 947 6 142 1 817 1 715 256 655
no. 256 404 171 200 44 47 – – 1 122
Ambulance service organisations
Salaried personnel
Operational FTE 3 809 3 092 3 540 932 970 292 179 121 12 935
Support personnel FTE 672 938 489 460 306 76 61 40 3 041
Total FTE 4 481 4 030 4 029 1 392 1 276 367 240 161 15 976
Per 100 000 people 59.2 68.5 84.8 53.9 75.4 71.3 61.8 65.9 67.6
Volunteers
Operational no. 122 905 176 2 968 1 251 568 – – 5 990
Support volunteers no. 28 – 1 na 192 na na na 221
Total no. 150 905 177 2 968 1 443 568 – – 6 211
Community first responders no. 256 404 171 200 44 47 na na 1 122
Fire and emergency service organisations (Fire and SES)
Salaried personnel
Operational FTE na 4 789 2 512 1 102 917 316 359 296 na
Community first responders
(ambulance)
REPORT ON
GOVERNMENT
SERVICES 2016
EMERGENCY MANAGEMENT
SECTOR OVERVIEW
PAGE 1 of TABLE DA.4

TABLE DA.4
Table DA.4 Emergency services human resources, 2014-15 (a), (b), (c), (d)
NSW Vic Qld WA SA Tas ACT NT Aust
Support personnel FTE na 2 020 532 403 193 191 105 30 na
Total FTE 5 665 6 809 3 044 1 505 1 110 507 464 326 19 430
Per 100 000 people 74.9 115.7 64.1 58.3 65.6 98.4 119.7 133.5 82.2
Volunteers
Operational no. na 40 197 na 29 822 na na 1 817 537 na
Support volunteers no. na 21 265 na 1 152 na na – 859 na
Total no. 92 498 61 462 40 900 30 974 15 504 5 574 1 817 1 715 250 444
State/Territory emergency service (SES) organisations
Salaried personnel
Operational FTE na 57 na na 33 10 8 13 na
Support personnel FTE na 127 na na 11 15 – 6 na
Total FTE 297 184 na na 44 25 8 19 na
Per 100 000 people 3.9 3.1 na na 2.6 4.9 2.1 7.8 na
Volunteers
Operational no. na 3 374 na 1 977 na na 279 na na
Support volunteers no. na 627 na 56 na na – na na
Total no. 9 663 4 001 5 900 2 033 1 668 529 279 319 24 392
Fire service organisations
Salaried personnel
Operational FTE 4 114 4 732 2 512 1 102 884 306 351 283 14 284
Support personnel FTE 1 254 1 893 532 403 182 176 105 24 4 569
Total FTE 5 368 6 625 3 044 1 505 1 066 482 456 307 18 853
Per 100 000 people 71.0 112.5 64.1 58.3 63.0 93.5 117.6 125.7 79.8
Volunteers
Operational no. 72 511 36 823 na 27 845 10 734 4 003 1 538 537 na
Support volunteers no. 10 324 20 638 na 1 096 3 102 1 042 – 859 na
REPORT ON
GOVERNMENT
SERVICES 2016
EMERGENCY MANAGEMENT
SECTOR OVERVIEW
PAGE 2 of TABLE DA.4

TABLE DA.4
Table DA.4 Emergency services human resources, 2014-15 (a), (b), (c), (d)
NSW Vic Qld WA SA Tas ACT NT Aust
Total no. 82 835 57 461 35 000 28 941 13 836 5 045 1 538 1 396 226 052
(a)
(b)
(c)
(d)
na Not available. – Nil or rounded to zero.
Source : State and Territory governments; ABS (unpublished), Australian Demographic Statistics , Cat. no. 3101.0 (table 2A.2); Chapter 9.
Population data used to derive rates are as at 31 December. Estimated Resident Population (ERP) data are on the 2011 Census of Population and Housing.
Estimates for 2013 are preliminary. See chapter 2 (table 2A.2) for details.
Caveats for the fire service organisation data and ambulance service organisation human resource data are available in chapter 9 and attachment 9A. Caveats
for the SES organisation data are available in table DA.17.
In Qld and WA fire and emergency service salaried personnel have cross hazard responsibilities and are not broken down between fire and SES roles. For
Australian totals, salaried personnel is provided for Fire and emergency services, but not for fire service organisations and SES organisations separately.
NSW, Qld, SA and the NT report total volunteers, but are unable to separately identify operational and support volunteers. For Australian totals, data are not
available for operational and support volunteers.
REPORT ON
GOVERNMENT
SERVICES 2016
EMERGENCY MANAGEMENT
SECTOR OVERVIEW
PAGE 3 of TABLE DA.4
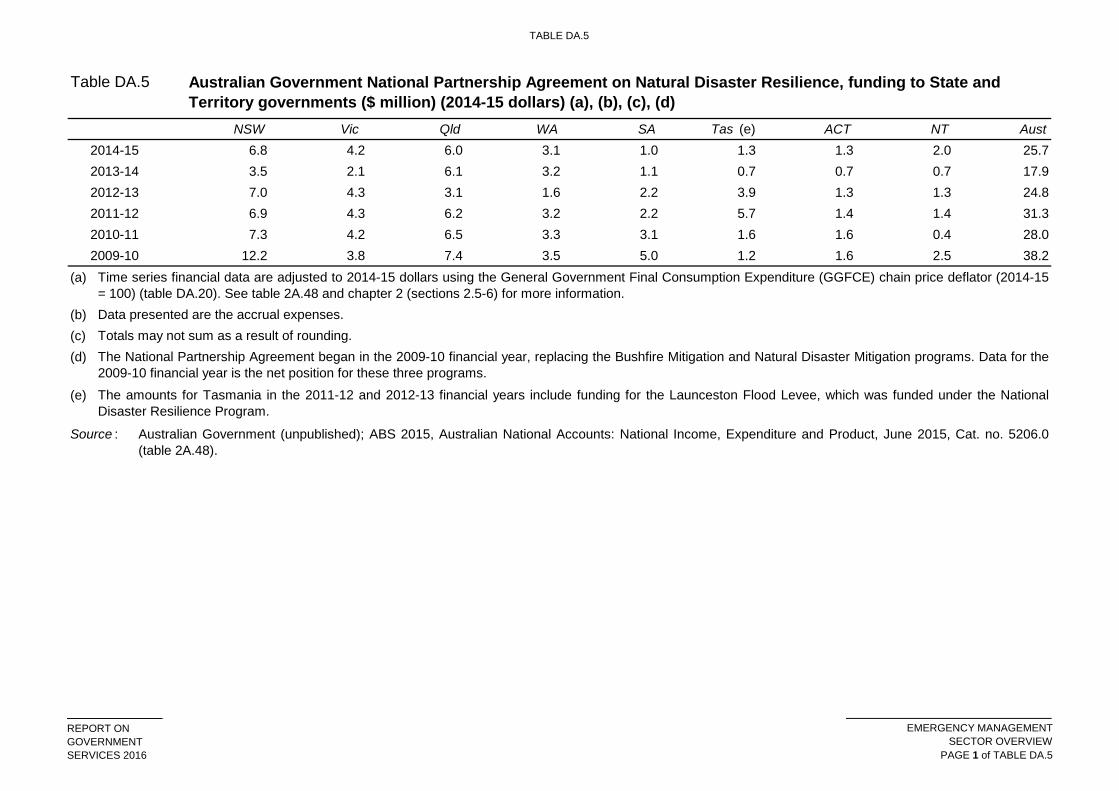
TABLE DA.5
Table DA.5
NSW Vic Qld WA SA Tas (e) ACT NT Aust
2014-15 6.8 4.2 6.0 3.1 1.0 1.3 1.3 2.0 25.7
2013-14 3.5 2.1 6.1 3.2 1.1 0.7 0.7 0.7 17.9
2012-13 7.0 4.3 3.1 1.6 2.2 3.9 1.3 1.3 24.8
2011-12 6.9 4.3 6.2 3.2 2.2 5.7 1.4 1.4 31.3
2010-11 7.3 4.2 6.5 3.3 3.1 1.6 1.6 0.4 28.0
2009-10 12.2 3.8 7.4 3.5 5.0 1.2 1.6 2.5 38.2
(a)
(b)
(c)
(d)
(e)
Source :
Australian Government National Partnership Agreement on Natural Disaster Resilience, funding to State and
Territory governments ($ million) (2014-15 dollars) (a), (b), (c), (d)
Australian Government (unpublished); ABS 2015, Australian National Accounts: National Income, Expenditure and Product, June 2015, Cat. no. 5206.0
(table 2A.48).
Data presented are the accrual expenses.
The National Partnership Agreement began in the 2009-10 financial year, replacing the Bushfire Mitigation and Natural Disaster Mitigation programs. Data for the
2009-10 financial year is the net position for these three programs.
Time series financial data are adjusted to 2014-15 dollars using the General Government Final Consumption Expenditure (GGFCE) chain price deflator (2014-15
= 100) (table DA.20). See table 2A.48 and chapter 2 (sections 2.5-6) for more information.
The amounts for Tasmania in the 2011-12 and 2012-13 financial years include funding for the Launceston Flood Levee, which was funded under the National
Disaster Resilience Program.
Totals may not sum as a result of rounding.
REPORT ON
GOVERNMENT
SERVICES 2016
EMERGENCY MANAGEMENT
SECTOR OVERVIEW
PAGE 1 of TABLE DA.5

TABLE DA.6
Table DA.6
NSW Vic Qld WA SA Tas ACT NT Aust
2014-15 5.2 3.4 422.8 3.3 0.5 – – 86.7 521.8
2013-14 58.9 5.3 315.7 2.2 0.2 0.3 – 1.3 383.9
2012-13 108.5 50.7 1 780.9 2.8 0.1 7.6 – 0.5 1 951.0
2011-12 56.1 47.7 1 432.3 12.0 – 0.2 – 4.8 1 553.1
2010-11 243.9 288.0 5 778.0 157.8 3.3 3.7 – 17.6 6 492.3
2009-10 6.9 4.8 103.1 – – 0.7 – 3.0 178.7
(a)
(b)
(c)
(d)
– Nil or rounded to zero.
Source : Australian Government (2014 and previous), Final budget outcome, Commonwealth of Australia, Canberra; ABS 2015, Australian National Accounts:
National Income, Expenditure and Product, June 2015, Cat. no. 5206.0 (table 2A.48).
Australian Government Natural Disaster Relief and Recovery Arrangements, funding to State and Territory
governments ($ million) (2014-15 dollars) (a), (b), (c), (d)
State and Territory expenditure on eligible events under the Natural Disaster Relief and Recovery Arrangements can be made within 24 months after the end of
the financial year in which the relevant disaster occurred unless an extension is granted. Therefore, costs reported for any given financial year may include
payments for events that occurred in the previous years. Costs for specific events are not finalised until the claim period has passed. For accounting purposes,
the Australian Government budget paper calculates expenditure as the present value of future payments expected to be made to the States and Territories
governments under the Natural Disaster Relief and Recovery Arrangements.
Time series financial data are adjusted to 2014-15 dollars using the General Government Final Consumption Expenditure (GGFCE) chain price deflator (2014-15
= 100) (table DA.20). See table 2A.48 and chapter 2 (sections 2.5-6) for more information.
Data from 2011–12 are accrual figures sourced from Final Budget Outcome papers.
Totals may not sum as a result of rounding.
REPORT ON
GOVERNMENT
SERVICES 2016
EMERGENCY MANAGEMENT
SECTOR OVERVIEW
PAGE 1 of TABLE DA.6

TABLE DA.7
Table DA.7
NSW Vic Qld WA SA Tas ACT NT Aust
2014-15 93.6 – 10.5 0.3 0.5 – – 2.8 107.6
2013-14 1.1 – – 0.4 – – – – 1.6
2012-13 19.1 – 151.4 – – 8.4 – – 179.0
2011-12 54.3 9.0 13.3 – – – – – 76.5
2010-11 16.5 45.3 921.8 9.5 – – – – 993.1
2009-10 – 5.0 12.0 0.5 – – – – 17.5
(a)
(b)
(c)
(d)
(e)
(f)
(g)
(h)
(i)
– Nil or rounded to zero.
Source :
Australian Government disaster recovery payments to eligible individuals by State or Territory of the declared
major disaster ($ million) (2014-15 dollars) (a), (b), (c), (d), (e), (f), (g), (h), (i)
Australian Government (unpublished); ABS 2015, Australian National Accounts: National Income, Expenditure and Product, June 2015, Cat. no. 5206.0
(table 2A.48).
Time series financial data are adjusted to 2014-15 dollars using the General Government Final Consumption Expenditure (GGFCE) chain price deflator (2014-15
= 100) (table DA.20). See table 2A.48 and chapter 2 (sections 2.5-6) for more information.
Data presented are the total cash payments.
Payments relate to the overall administered expenditure for a disaster event from 2008-09 to 2013-14. Included are payments under the Australian Government
disaster recovery payment (AGDRP), New Zealand ex gratia payment (ex gratia), the Disaster Income Recovery Subsidy (DIRS), and the Disaster Recovery
Allowance (DRA). For a summary of eligible disaster events see www.disasterassist.gov.au.
Data have been allocated to the state/territory where the disaster event occurred. This may differ from the state of residence of the recipients.
Data exclude events where there are fewer than 20 claimants or where there is less that $20 000 of total claims paid.
Figures are based on the 2008-09 to 2009-10 data that have been extracted from the end of financial year report and the summary of AGDRP and Ex-Gratia
Assistance, 2010-11 data have been extracted from the end of financial year report, the Summary of AGDRP and Ex-Gratia Assistance table and Closed events
summary due to appeal payments for 2008-09 & 2009-10 events, 2011-12, 2012-13, 2013-14 has been extracted from the end of financial year reports provided
by the Department of Human Services.
Prior to 2010 disaster assistance payments were administered by FaHCSIA (now known as DSS).
The appropriation for DRA was administered by DSS until March 2014.
Data have been allocated to the financial year in which the disaster event occurred. This may differ from the financial year in which payment were made.
REPORT ON
GOVERNMENT
SERVICES 2016
EMERGENCY MANAGEMENT
SECTOR OVERVIEW
PAGE 1 of TABLE DA.7

TABLE DA.8
Table DA.8 National security and preparedness survey, 2011-12 (a), (b), (c)
Unit NSW Vic Qld WA SA Tas ACT NT Aust
Number of respondents no. 1 122 885 791 390 431 159 378 50 4 257
Proportion of people that think that a natural disaster is likely to occur in the next 6 months:
Somewhere in the local community % 49.2 47.1 63.5 55.6 43.4 45.3 41.3 66.0 50.7
That will affect their own home % 18.7 20.8 30.6 25.4 18.8 18.2 15.1 52.0 22.1
Precautions in the event of a natural disaster
Proportion of people that have undertaken the following precautions in the event of a natural disaster:
Developed emergency plans (evacuations/meeting places) % 23.7 32.4 36.3 25.9 33.2 35.2 31.7 66.0 30.7
95% confidence interval (d) ± 2.5 3.1 3.4 4.3 4.4 7.4 4.7 13.1 1.4
Stockpiled supplies % 11.9 12.4 42.7 16.7 12.3 15.1 13.8 54.0 19.0
Purchased things to make you (or your home) safer % 11.1 12.5 28.3 14.6 11.4 13.2 19.6 50.0 16.2
At least one of the above % 31.2 37.2 56.3 34.1 37.1 42.1 39.9 74.0 39.6
Proportion of people that have developed emergency plans and think that a natural disaster is likely to occur in the next six months:
Somewhere in the local community % 31.2 46.5 43.6 33.0 44.9 50.0 42.3 69.7 40.5
That will affect their own home % 40.5 56.5 56.2 43.4 51.9 69.0 49.1 80.8 51.6
Knowledge of what to do in the event of a natural disaster
Proportion of people that have 'a fair bit' or 'a lot' of knowledge of:
The different kinds of natural disasters in Australia % 50.6 52.9 58.2 47.7 48.0 47.8 57.1 70.0 52.4
% 13.3 15.3 20.0 13.1 13.0 11.9 18.3 30.0 15.5
What to do to prepare for natural disasters % 25.0 29.4 41.0 26.2 25.8 23.3 31.2 58.0 29.9
% 20.7 25.8 33.2 20.8 21.8 16.4 32.5 52.0 25.3
% 23.8 29.0 41.8 25.4 24.8 27.0 35.2 64.0 30.0
% 17.3 23.1 35.5 16.2 19.3 22.0 30.2 54.0 23.6
What the government has done to prepare for natural
disasters
Where to get information about preparing for natural disasters
What the government recommends you do to protect yourself
against a natural disaster
Where to get information when a warning is issued for a
natural disaster
Proportion of people that have 'a fair bit' or 'a lot' of knowledge what to do to prepare for a natural disasters and think that a natural disaster is likely
to occur in the next six months:
REPORT ON
GOVERNMENT
SERVICES 2016
EMERGENCY MANAGEMENT
SECTOR OVERVIEW
PAGE 1 of TABLE DA.8

TABLE DA.8
Table DA.8 National security and preparedness survey, 2011-12 (a), (b), (c)
Unit NSW Vic Qld WA SA Tas ACT NT Aust
Somewhere in the local community % 30.6 37.4 46.6 31.8 31.6 23.6 39.1 66.7 36.7
That will affect their own home % 31.4 39.1 54.1 28.3 37.0 24.1 40.4 76.9 40.2
(a)
(b)
(c)
(d)
Source :
The survey was designed to produce descriptive statistics and these may not be representative of the population.
Western, M., Mazerolle, L., & Boreham, P. (2012), National Security and Preparedness Survey 2011-2012, Brisbane: Institute for Social Science
Research and the Australian Research Council Centre of Excellence in Policing and Security, The University of Queensland, 2012.
The NSPS was conducted between November 2011 and May 2012. A series of floods in northern New South Wales and southern Queensland in January and
February 2012 may have influenced respondent perceptions about, and/or actions around, disaster preparedness.
The percentages reported for the Proportion of people that have developed emergency plans (evacuations/meeting places) include 95 per cent confidence
intervals (for example, 40.0 per cent ± 2.7 per cent) (in the form of error bars in figures and percentages in tables). Confidence intervals have been calculated
for this Report on the assumption that a random sample of the population was selected.
The National Security and Preparedness Survey (NSPS) aims to benchmark attitudes and perceptions of Australians towards national security policy and seeks
to better understand citizen preparedness for potential terrorist and natural disasters.
REPORT ON
GOVERNMENT
SERVICES 2016
EMERGENCY MANAGEMENT
SECTOR OVERVIEW
PAGE 2 of TABLE DA.8

TABLE DA.9
Table DA.9
NSW Vic Qld WA SA Tas ACT NT Aust
2014-15
Fire – – – – 36.6 – – – 36.6
Storm 1 689.0 – 1 862.0 – – – – – 3 551.0
Flood – – – – – – – – –
Other – – – – – – – – –
Total 1 689.0 – 1 862.0 – 36.6 – – – 3 587.6
2013-14
Fire 186.6 – – 15.3 – – – – 201.9
Storm – – – – – – – – –
Flood – – – – – – – – –
Other – – – – – – – – –
Total 186.6 – – 15.3 – – – – 201.9
2012-13
Fire 36.5 – – – – 92.7 – – 129.2
Storm 126.4 – 1 018.0 – – – – – 1 144.4
Flood – – – – – – – – –
Other – – – – – – – – –
Total 162.9 – 1 018.0 – – 92.7 – – 1 273.6
2011-12
Fire – – – 56.9 – – – – 56.9
Storm – 774.7 – – – – – – 774.7
Flood 120.4 19.8 139.7 – – – – – 280.0
Other – – – – – – – – –
Total 120.4 794.5 139.7 56.9 – – – – 1 111.6
2010-11
Fire – – – 37.9 – – – – 37.9
Storm – 526.5 1 524.9 – – – – – 2 051.4
Flood – 136.6 2 578.1 – – – – – 2 714.7
Other – – – – – – – – –
Total – 663.1 4 103.1 37.9 – – – – 4 804.1
2009-10
Fire – – – – – – – – –
Storm – 1 149.9 – 1 159.9 – – – – 2 309.8
Flood – – 51.4 – – – – – 51.4
Other – – – – – – – – –
Total – 1 149.9 51.4 1 159.9 – – – – 2 361.2
2008-09
Fire – 1 198.9 – – – – – – 1 198.9
Storm – – 346.2 – – – – – 346.2
Flood 95.2 – 21.3 – – – – – 116.5
Other – – – – – – – – –
Total 95.2 1 198.9 367.5 – – – – – 1 661.6
2007-08
Fire – – – – – – – – –
Asset loss from emergency events ($ million) (2014-15 dollars) (a), (b),
(c)
REPORT ON
GOVERNMENT
SERVICES 2016
EMERGENCY MANAGEMENT
SECTOR OVERVIEW
PAGE 1 of TABLE DA.9
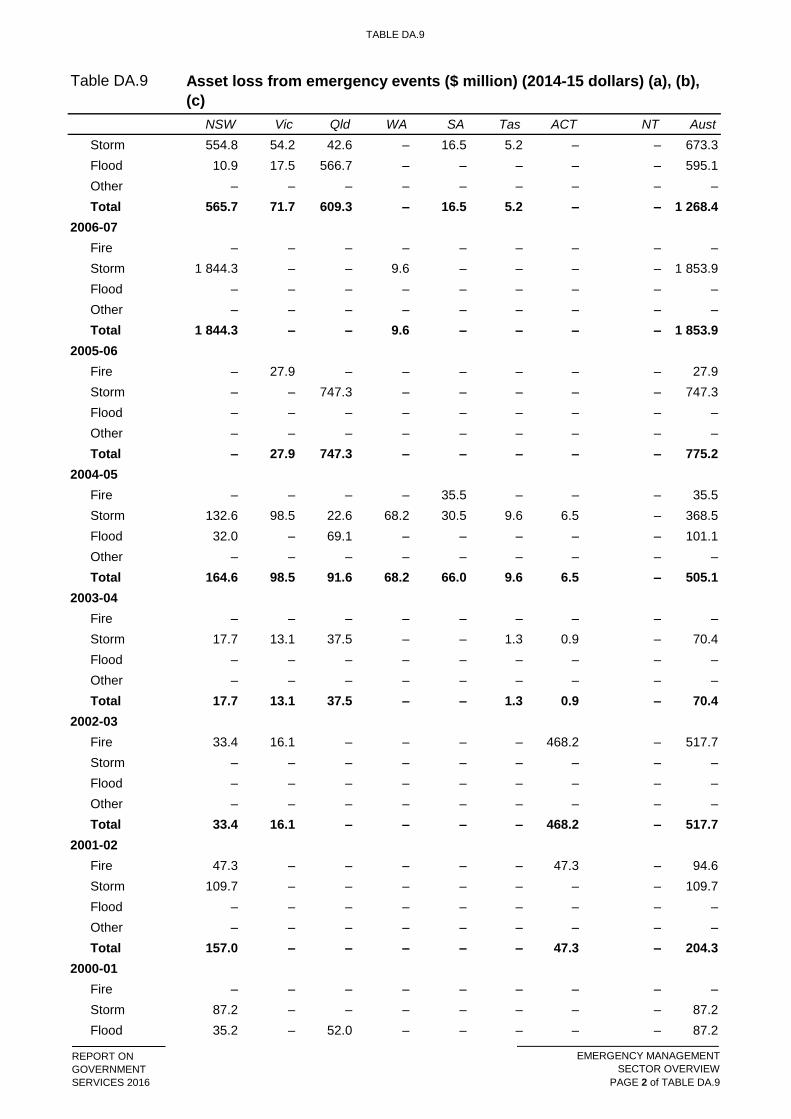
TABLE DA.9
Table DA.9
NSW Vic Qld WA SA Tas ACT NT Aust
Asset loss from emergency events ($ million) (2014-15 dollars) (a), (b),
(c)
Storm 554.8 54.2 42.6 – 16.5 5.2 – – 673.3
Flood 10.9 17.5 566.7 – – – – – 595.1
Other – – – – – – – – –
Total 565.7 71.7 609.3 – 16.5 5.2 – – 1 268.4
2006-07
Fire – – – – – – – – –
Storm 1 844.3 – – 9.6 – – – – 1 853.9
Flood – – – – – – – – –
Other – – – – – – – – –
Total 1 844.3 – – 9.6 – – – – 1 853.9
2005-06
Fire – 27.9 – – – – – – 27.9
Storm – – 747.3 – – – – – 747.3
Flood – – – – – – – – –
Other – – – – – – – – –
Total – 27.9 747.3 – – – – – 775.2
2004-05
Fire – – – – 35.5 – – – 35.5
Storm 132.6 98.5 22.6 68.2 30.5 9.6 6.5 – 368.5
Flood 32.0 – 69.1 – – – – – 101.1
Other – – – – – – – – –
Total 164.6 98.5 91.6 68.2 66.0 9.6 6.5 – 505.1
2003-04
Fire – – – – – – – – –
Storm 17.7 13.1 37.5 – – 1.3 0.9 – 70.4
Flood – – – – – – – – –
Other – – – – – – – – –
Total 17.7 13.1 37.5 – – 1.3 0.9 – 70.4
2002-03
Fire 33.4 16.1 – – – – 468.2 – 517.7
Storm – – – – – – – – –
Flood – – – – – – – – –
Other – – – – – – – – –
Total 33.4 16.1 – – – – 468.2 – 517.7
2001-02
Fire 47.3 – – – – – 47.3 – 94.6
Storm 109.7 – – – – – – – 109.7
Flood – – – – – – – – –
Other – – – – – – – – –
Total 157.0 – – – – – 47.3 – 204.3
2000-01
Fire – – – – – – – – –
Storm 87.2 – – – – – – – 87.2
Flood 35.2 – 52.0 – – – – – 87.2
REPORT ON
GOVERNMENT
SERVICES 2016
EMERGENCY MANAGEMENT
SECTOR OVERVIEW
PAGE 2 of TABLE DA.9

TABLE DA.9
Table DA.9
NSW Vic Qld WA SA Tas ACT NT Aust
Asset loss from emergency events ($ million) (2014-15 dollars) (a), (b),
(c)
Other – – – – – – – – –
Total 122.3 – 52.0 – – – – – 174.4
1999-00
Fire – – – – – – – – –
Storm 66.3 – 38.3 – – – – – 104.6
Flood – 14.7 17.7 – – – – – 32.4
Other – – – – – – – – –
Total 66.3 14.7 56.0 – – – – – 137.1
1998-99
Fire – – – – – – – – –
Storm 2 541.5 – 148.0 52.3 – – – – 2 741.8
Flood 59.8 – – – – – – – 59.8
Other – – – – – – – – –
Total 2 601.3 – 148.0 52.3 – – – – 2 801.6
1997-98
Fire – – – – – – – – –
Storm 69.9 – – – – – – – 69.9
Flood – – 107.8 – – – – 106.3 214.2
Other – – – – – – – – –
Total 69.9 – 107.8 – – – – 106.3 284.0
1996-97
Fire – 15.4 – – – – – – 15.4
Storm 297.1 – – – – – – – 297.1
Flood – – – – – – – – –
Other – – – – – – – – –
Total 297.1 15.4 – – – – – – 312.4
1995-96
Fire – – – – – – – – –
Storm 15.5 – 62.0 – – – – – 77.5
Flood 24.0 – 24.0 – – – – – 48.1
Other – – – – – – – – –
Total 39.5 – 86.1 – – – – – 125.6
1994-95
Fire – – 93.6 – – – – – 93.6
Storm 45.9 – – 17.4 – – – – 63.3
Flood – – – – – – – – –
Other 58.9 – – – – – – – 58.9
Total 104.8 – 93.6 17.4 – – – – 215.8
1993-94
Fire 94.9 – – – – – – – 94.9
Storm – – – 59.5 – – – – 59.5
Flood – 19.3 – – – – – – 19.3
Other – – – – – – – – –
Total 94.9 19.3 – 59.5 – – – – 173.7
REPORT ON
GOVERNMENT
SERVICES 2016
EMERGENCY MANAGEMENT
SECTOR OVERVIEW
PAGE 3 of TABLE DA.9

TABLE DA.9
Table DA.9
NSW Vic Qld WA SA Tas ACT NT Aust
Asset loss from emergency events ($ million) (2014-15 dollars) (a), (b),
(c)
1992-93
Fire – – – – – – – – –
Storm – – – – – – – – –
Flood – – – – – – – – –
Other – – – – – – – – –
Total – – – – – – – – –
1991-92
Fire 19.9 – – – – – – – 19.9
Storm 195.8 – – – – – – – 195.8
Flood – 39.8 – – – – – – 39.8
Other – – – – – – – – –
Total 215.7 39.8 – – – – – – 255.5
1990-91
Fire – – – – – – – – –
Storm 234.5 20.3 – – 50.8 – – – 305.7
Flood – – 54.2 – – – – – 54.2
Other – – – – – – – – –
Total 234.5 20.3 54.2 – 50.8 – – – 359.9
1989-90
Fire – – – – – – – – –
Storm 563.4 35.3 58.3 – – – – – 657.0
Flood 17.7 17.7 70.6 – – – – – 106.0
Other 1 522.4 – – – – – – – 1 522.4
Total 2 103.4 53.0 128.9 – – – – – 2 285.3
1988-89
Fire – – – – – – – – –
Storm 4.9 – 43.9 – – – – – 48.7
Flood – – – – – – – – –
Other – – – – – – – – –
Total 4.9 – 43.9 – – – – – 48.7
1987-88
Fire – – – – – – – – –
Storm – – – 39.9 – – – – 39.9
Flood 49.9 – – – – – – 20.0 69.9
Other – – – – – – – – –
Total 49.9 – – 39.9 – – – 20.0 109.8
1986-87
Fire – – – – – – – – –
Storm 219.8 – – – 21.1 – – – 240.9
Flood 74.0 – – – – – – – 74.0
Other – – – – – – – – –
Total 293.8 – – – 21.1 – – – 314.9
1985-86
Fire – – – – – – – – –
REPORT ON
GOVERNMENT
SERVICES 2016
EMERGENCY MANAGEMENT
SECTOR OVERVIEW
PAGE 4 of TABLE DA.9

TABLE DA.9
Table DA.9
NSW Vic Qld WA SA Tas ACT NT Aust
Asset loss from emergency events ($ million) (2014-15 dollars) (a), (b),
(c)
Storm 57.1 – 91.4 – – – – – 148.5
Flood – – – – – – – – –
Other – – – – – – – – –
Total 57.1 – 91.4 – – – – – 148.5
(a)
(b)
(c)
– Nil or rounded to zero.
Source : Insurance Council of Australia 2015, Historical & current disaster statistics ,
http://http://www.insurancecouncil.com.au/statistics (accessed 14 October 2015); Australian
Emergency Management 2015, Knowledge Hub , http://www.emknowledge.gov.au/ (accessed 14
October 2015); ABS 2015, Australian National Accounts: National Income, Expenditure and Product,
June 2015 , Cat. no. 5206.0.
Costs not taken into account: emergency response by emergency services; local, State, Territory and
Commonwealth governments; non-government organisations; local government clean-up; remedial and
environmental damage costs (including pollution of foreshores and riverbanks and beach erosion);
community dislocation; loss of jobs; rehabilitation/recovery services; and basic medical and funeral costs
associated with injuries and deaths.
Total Asset Loss: all insurance losses (claims by policy holders, based on figures from the Insurance
Council of Australia). The data are derived from the submissions of general insurance companies following
large events incurring cost to the community and insurers. Events are only recorded where there is a
potential for the insured loss to exceed $10 million.
Time series financial data are adjusted to 2014-15 dollars using the Domestic Final Demand (DFD) deflator
(2014-15 = 100) (table DA.20). The DFD deflator is preferred to the General Government Final Consumption
Expenditure deflator for this table, as asset losses are more closely aligned to the range of consumption and
capital goods rather than general government consumption. (The index has been modelled for 1984-85 and
1985-86 using the DFD implicit price deflator.)
REPORT ON
GOVERNMENT
SERVICES 2016
EMERGENCY MANAGEMENT
SECTOR OVERVIEW
PAGE 5 of TABLE DA.9

TABLE DA.10
Table DA.10
NSW Vic Qld WA SA Tas ACT NT Aus
Annual rate
2014-15 223.25 – 391.96 – 21.64 – – – 151.85
2013-14 25.00 – – 5.98 – – – – 8.66
2012-13 22.16 – 220.79 – – 180.98 – – 55.60
2011-12 16.62 142.53 30.97 23.83 – – – – 49.44
2010-11 – 120.66 924.76 16.36 – – – – 216.67
2009-10 – 212.20 11.78 512.36 – – – – 107.99
2008-09 13.60 225.63 85.95 – – – – – 77.37
2007-08 82.18 13.79 146.47 – 10.43 10.43 – – 60.35
2006-07 271.77 – – 4.64 – – – – 89.88
2005-06 – 5.54 188.51 – – – – – 38.16
2004-05 24.68 19.88 23.67 34.19 43.04 19.88 19.88 – 25.20
2003-04 2.66 2.66 9.90 – – 2.66 2.66 – 3.55
2002-03 5.07 3.31 – – – – 1 436.31 – 26.40
2001-02 23.94 – – – – – 146.50 – 10.54
2000-01 18.86 – 14.71 – – – – – 9.11
1999-00 10.35 3.15 16.09 – – – – – 7.24
1998-99 410.37 – 43.18 28.44 – – – – 149.77
1997-98 11.13 – 31.90 – – – – 555.93 15.35
1996-97 47.80 3.38 – – – – – – 17.05
1995-96 6.44 – 26.30 – – – – – 6.93
1994-95 17.27 – 29.26 10.14 – – – – 12.06
1993-94 15.76 4.32 – 35.20 – – – – 9.80
1992-93 – – – – – – – – –
1991-92 36.39 8.98 – – – – – – 14.70
1990-91 40.00 4.62 18.51 – 35.33 – – – 20.96
Asset loss from emergency events, per person (2014-15 dollars) (a), (b), (c), (d)
REPORT ON
GOVERNMENT
SERVICES 2016
EMERGENCY MANAGEMENT
SECTOR OVERVIEW
PAGE 1 of TABLE DA.10
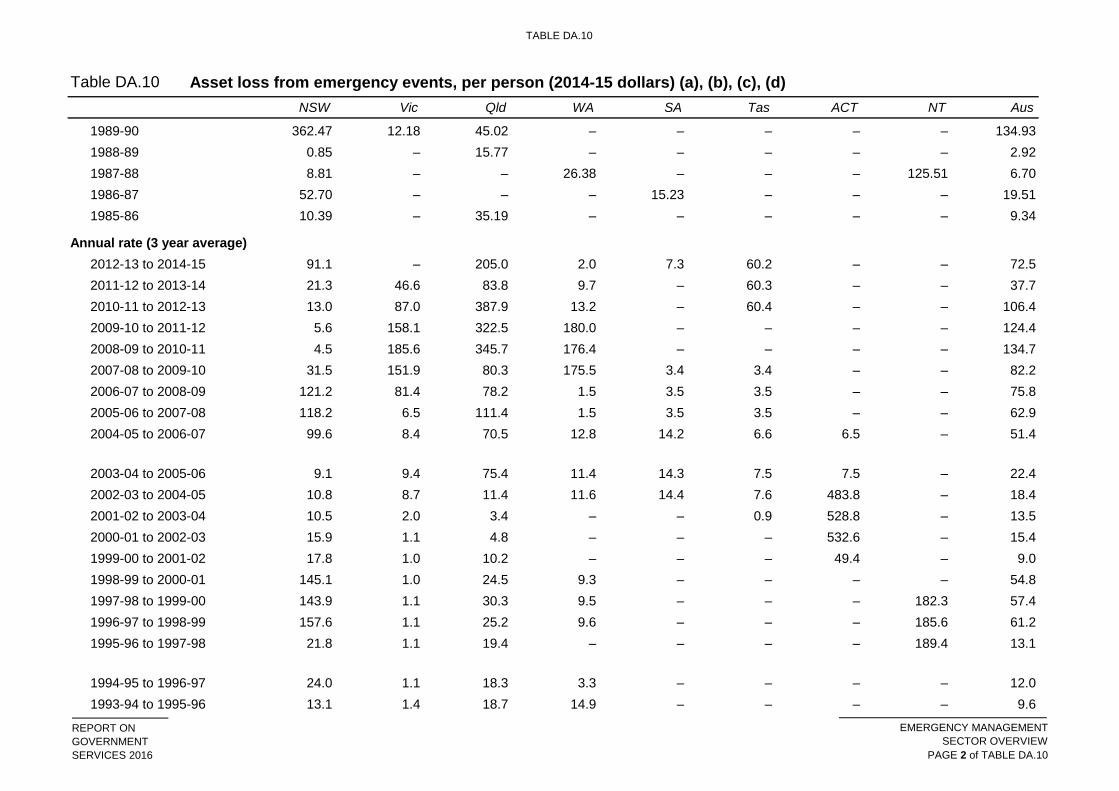
TABLE DA.10
Table DA.10
NSW Vic Qld WA SA Tas ACT NT Aus
Asset loss from emergency events, per person (2014-15 dollars) (a), (b), (c), (d)
1989-90 362.47 12.18 45.02 – – – – – 134.93
1988-89 0.85 – 15.77 – – – – – 2.92
1987-88 8.81 – – 26.38 – – – 125.51 6.70
1986-87 52.70 – – – 15.23 – – – 19.51
1985-86 10.39 – 35.19 – – – – – 9.34
Annual rate (3 year average)
2012-13 to 2014-15 91.1 – 205.0 2.0 7.3 60.2 – – 72.5
2011-12 to 2013-14 21.3 46.6 83.8 9.7 – 60.3 – – 37.7
2010-11 to 2012-13 13.0 87.0 387.9 13.2 – 60.4 – – 106.4
2009-10 to 2011-12 5.6 158.1 322.5 180.0 – – – – 124.4
2008-09 to 2010-11 4.5 185.6 345.7 176.4 – – – – 134.7
2007-08 to 2009-10 31.5 151.9 80.3 175.5 3.4 3.4 – – 82.2
2006-07 to 2008-09 121.2 81.4 78.2 1.5 3.5 3.5 – – 75.8
2005-06 to 2007-08 118.2 6.5 111.4 1.5 3.5 3.5 – – 62.9
2004-05 to 2006-07 99.6 8.4 70.5 12.8 14.2 6.6 6.5 – 51.4
2003-04 to 2005-06 9.1 9.4 75.4 11.4 14.3 7.5 7.5 – 22.4
2002-03 to 2004-05 10.8 8.7 11.4 11.6 14.4 7.6 483.8 – 18.4
2001-02 to 2003-04 10.5 2.0 3.4 – – 0.9 528.8 – 13.5
2000-01 to 2002-03 15.9 1.1 4.8 – – – 532.6 – 15.4
1999-00 to 2001-02 17.8 1.0 10.2 – – – 49.4 – 9.0
1998-99 to 2000-01 145.1 1.0 24.5 9.3 – – – – 54.8
1997-98 to 1999-00 143.9 1.1 30.3 9.5 – – – 182.3 57.4
1996-97 to 1998-99 157.6 1.1 25.2 9.6 – – – 185.6 61.2
1995-96 to 1997-98 21.8 1.1 19.4 – – – – 189.4 13.1
1994-95 to 1996-97 24.0 1.1 18.3 3.3 – – – – 12.0
1993-94 to 1995-96 13.1 1.4 18.7 14.9 – – – – 9.6
REPORT ON
GOVERNMENT
SERVICES 2016
EMERGENCY MANAGEMENT
SECTOR OVERVIEW
PAGE 2 of TABLE DA.10

TABLE DA.10
Table DA.10
NSW Vic Qld WA SA Tas ACT NT Aus
Asset loss from emergency events, per person (2014-15 dollars) (a), (b), (c), (d)
1992-93 to 1994-95 11.1 1.4 10.0 15.1 – – – – 7.3
1991-92 to 1993-94 17.3 4.4 – 11.9 – – – – 8.2
1990-91 to 1992-93 25.3 4.5 6.0 – 11.7 – – – 11.8
1989-90 to 1991-92 145.1 8.6 20.9 – 11.8 – – – 56.3
1988-89 to 1990-91 134.5 5.6 26.5 – 11.9 – – – 53.0
1987-88 to 1989-90 125.3 4.1 20.7 8.6 – – – 41.4 48.9
1986-87 to 1988-89 20.5 – 5.4 8.8 5.0 – – 41.9 9.6
1985-86 to 1987-88 23.9 – 11.5 9.0 5.1 – – 42.7 11.8
(a)
(b)
(c)
(d)
– Nil or rounded to zero.
Source :
Total Asset Loss: all insurance losses (claims by policy holders, based on figures from the Insurance Council of Australia). The data are derived from the
submissions of general insurance companies following large events incurring cost to the community and insurers. Events are only recorded where there is a
potential for the insured loss to exceed $10 million.
Insurance Council of Australia 2015, Historical & current disaster statistics , http://http://www.insurancecouncil.com.au/statistics (accessed 14 October
2015); Australian Emergency Management 2015, Knowledge Hub , http://www.emknowledge.gov.au/ (accessed 14 October 2015); ABS 2015, Australian
National Accounts: National Income, Expenditure and Product, June 2015 , Cat. no. 5206.0; ABS (unpublished), Australian Demographic Statistics , Cat.
no. 3101.0 (table 2A.2)
Time series financial data are adjusted to 2014-15 dollars using the Domestic Final Demand (DFD) deflator (2014-15 = 100) (table DA.20). The DFD deflator is
preferred to the General Government Final Consumption Expenditure deflator for this table, as asset losses are more closely aligned to the range of
consumption and capital goods rather than general government consumption. (The index has been modelled for 1984-85 and 1985-86 using the DFD implicit
price deflator.)
Costs not taken into account: emergency response by emergency services; local, State, Territory and Commonwealth governments; non-government
organisations; local government clean-up; remedial and environmental damage costs (including pollution of foreshores and riverbanks and beach erosion);
community dislocation; loss of jobs; rehabilitation/recovery services; and basic medical and funeral costs associated with injuries and deaths.
Population data used to derive rates are as at 31 December. Estimated Resident Population (ERP) data for 1984 to 2010 are final, based on the 2011 Census
of Population and Housing. Estimates for 2012 onwards are preliminary. See chapter 2 (table 2A.2) for details.
REPORT ON
GOVERNMENT
SERVICES 2016
EMERGENCY MANAGEMENT
SECTOR OVERVIEW
PAGE 3 of TABLE DA.10
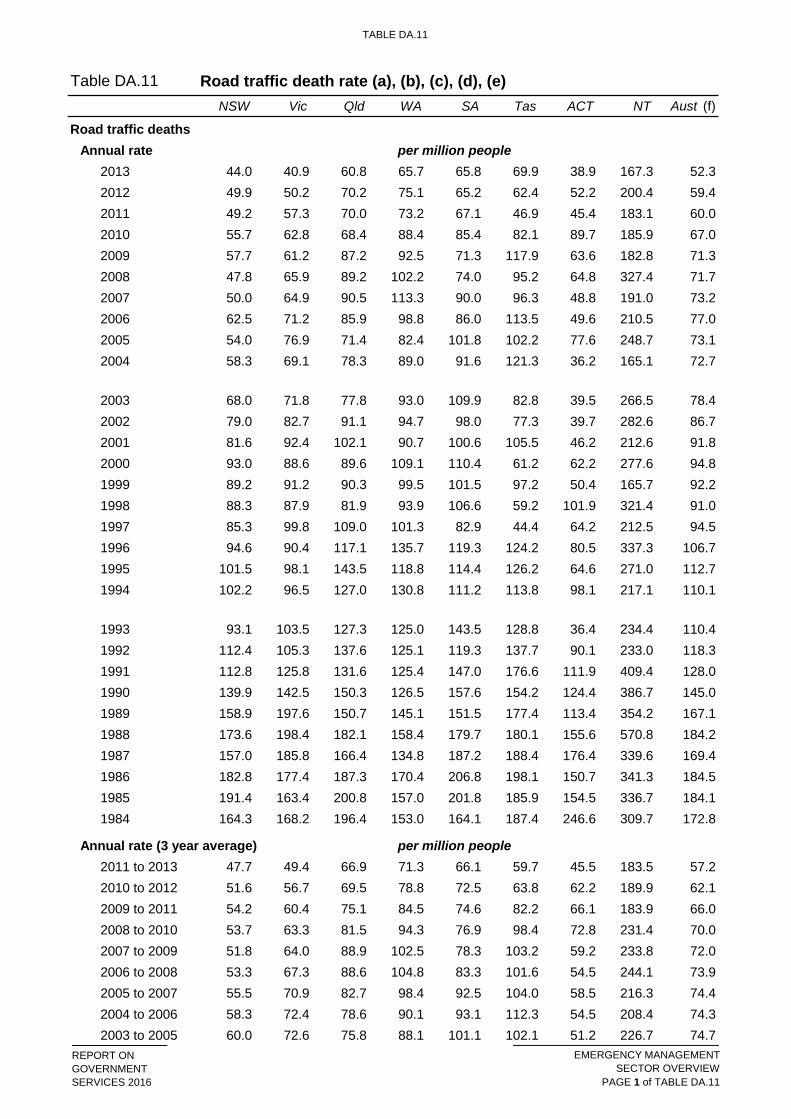
TABLE DA.11
Table DA.11 Road traffic death rate (a), (b), (c), (d), (e)
NSW Vic Qld WA SA Tas ACT NT Aust (f)
Road traffic deaths
Annual rate per million people
44.0 40.9 60.8 65.7 65.8 69.9 38.9 167.3 52.3
49.9 50.2 70.2 75.1 65.2 62.4 52.2 200.4 59.4
49.2 57.3 70.0 73.2 67.1 46.9 45.4 183.1 60.0
55.7 62.8 68.4 88.4 85.4 82.1 89.7 185.9 67.0
57.7 61.2 87.2 92.5 71.3 117.9 63.6 182.8 71.3
47.8 65.9 89.2 102.2 74.0 95.2 64.8 327.4 71.7
50.0 64.9 90.5 113.3 90.0 96.3 48.8 191.0 73.2
62.5 71.2 85.9 98.8 86.0 113.5 49.6 210.5 77.0
54.0 76.9 71.4 82.4 101.8 102.2 77.6 248.7 73.1
58.3 69.1 78.3 89.0 91.6 121.3 36.2 165.1 72.7
68.0 71.8 77.8 93.0 109.9 82.8 39.5 266.5 78.4
79.0 82.7 91.1 94.7 98.0 77.3 39.7 282.6 86.7
81.6 92.4 102.1 90.7 100.6 105.5 46.2 212.6 91.8
93.0 88.6 89.6 109.1 110.4 61.2 62.2 277.6 94.8
89.2 91.2 90.3 99.5 101.5 97.2 50.4 165.7 92.2
88.3 87.9 81.9 93.9 106.6 59.2 101.9 321.4 91.0
85.3 99.8 109.0 101.3 82.9 44.4 64.2 212.5 94.5
94.6 90.4 117.1 135.7 119.3 124.2 80.5 337.3 106.7
101.5 98.1 143.5 118.8 114.4 126.2 64.6 271.0 112.7
102.2 96.5 127.0 130.8 111.2 113.8 98.1 217.1 110.1
93.1 103.5 127.3 125.0 143.5 128.8 36.4 234.4 110.4
112.4 105.3 137.6 125.1 119.3 137.7 90.1 233.0 118.3
112.8 125.8 131.6 125.4 147.0 176.6 111.9 409.4 128.0
139.9 142.5 150.3 126.5 157.6 154.2 124.4 386.7 145.0
158.9 197.6 150.7 145.1 151.5 177.4 113.4 354.2 167.1
173.6 198.4 182.1 158.4 179.7 180.1 155.6 570.8 184.2
157.0 185.8 166.4 134.8 187.2 188.4 176.4 339.6 169.4
182.8 177.4 187.3 170.4 206.8 198.1 150.7 341.3 184.5
191.4 163.4 200.8 157.0 201.8 185.9 154.5 336.7 184.1
164.3 168.2 196.4 153.0 164.1 187.4 246.6 309.7 172.8
Annual rate (3 year average) per million people
2011 to 2013 47.7 49.4 66.9 71.3 66.1 59.7 45.5 183.5 57.2
2010 to 2012 51.6 56.7 69.5 78.8 72.5 63.8 62.2 189.9 62.1
2009 to 2011 54.2 60.4 75.1 84.5 74.6 82.2 66.1 183.9 66.0
2008 to 2010 53.7 63.3 81.5 94.3 76.9 98.4 72.8 231.4 70.0
2007 to 2009 51.8 64.0 88.9 102.5 78.3 103.2 59.2 233.8 72.0
2006 to 2008 53.3 67.3 88.6 104.8 83.3 101.6 54.5 244.1 73.9
2005 to 2007 55.5 70.9 82.7 98.4 92.5 104.0 58.5 216.3 74.4
2004 to 2006 58.3 72.4 78.6 90.1 93.1 112.3 54.5 208.4 74.3
2003 to 2005 60.0 72.6 75.8 88.1 101.1 102.1 51.2 226.7 74.7
1995
1994
1993
1992
1991
1990
1989
1988
1987
1986
1985
1984
1996
2007
2006
2005
2004
2003
2002
2001
2000
1999
1998
1997
2008
2013
2012
2011
2010
2009
REPORT ON
GOVERNMENT
SERVICES 2016
EMERGENCY MANAGEMENT
SECTOR OVERVIEW
PAGE 1 of TABLE DA.11

TABLE DA.11
Table DA.11 Road traffic death rate (a), (b), (c), (d), (e)
NSW Vic Qld WA SA Tas ACT NT Aust (f)
2002 to 2004 68.4 74.5 82.3 92.2 99.8 93.9 38.5 237.6 79.2
2001 to 2003 76.2 82.2 90.1 92.8 102.8 88.4 41.8 253.9 85.6
2000 to 2002 84.5 87.9 94.3 98.1 103.0 81.3 49.3 257.5 91.1
1999 to 2001 87.9 90.7 94.1 99.8 104.2 88.0 52.9 218.9 93.0
1998 to 2000 90.2 89.2 87.3 100.9 106.2 72.5 71.4 254.6 92.7
1997 to 1999 87.6 93.0 93.7 98.2 97.1 66.9 72.1 233.0 92.6
1996 to 1998 89.4 92.7 102.5 110.1 102.9 76.0 82.2 290.3 97.3
1995 to 1997 93.8 96.1 123.0 118.5 105.5 98.3 69.8 273.3 104.6
1994 to 1996 99.4 95.0 129.1 128.4 115.0 121.4 81.0 276.2 109.8
1993 to 1995 99.0 99.4 132.7 124.8 123.0 122.9 66.5 241.2 111.1
1992 to 1994 102.6 101.8 130.5 127.0 124.7 126.8 74.9 228.0 112.9
1991 to 1993 106.1 111.5 132.1 125.2 136.6 147.7 79.2 291.2 118.8
1990 to 1992 121.6 124.5 139.8 125.7 141.3 156.2 108.6 342.1 130.3
1989 to 1991 137.0 155.1 144.1 132.2 152.1 169.4 116.6 383.7 146.6
1988 to 1990 157.3 179.3 160.8 143.1 162.9 170.5 130.9 436.4 165.3
1987 to 1989 163.2 194.0 166.3 146.2 172.7 181.9 148.1 421.5 173.6
1986 to 1988 171.1 187.3 178.6 154.5 191.1 188.8 160.9 418.1 179.4
1985 to 1987 176.9 175.6 184.6 153.9 198.6 190.8 160.7 339.2 179.3
1984 to 1986 179.6 169.7 194.8 160.3 191.0 190.5 183.0 329.6 180.5
Annual road traffic deaths number
331 239 287 169 111 36 15 41 1 228
370 288 327 189 109 32 20 48 1 375
359 322 319 178 111 24 17 43 1 361
402 348 306 208 140 42 33 43 1 497
412 334 384 212 116 60 23 42 1 571
337 354 386 229 119 48 23 74 1 555
347 341 382 246 143 48 17 42 1 555
427 367 353 208 135 56 17 45 1 603
364 389 286 169 158 50 26 52 1 494
390 345 307 179 141 59 12 34 1 467
452 354 298 184 168 40 13 54 1 563
523 403 341 185 149 37 13 57 1 709
537 445 373 175 152 50 15 43 1 790
607 422 320 208 166 29 20 56 1 828
575 429 317 187 152 46 16 33 1 755
563 409 283 174 159 28 32 63 1 711
538 460 371 185 123 21 20 41 1 759
591 413 393 244 176 59 25 64 1 966
627 445 474 210 168 60 20 50 2 054
624 434 411 227 163 54 30 39 1 983
2000
1999
1998
1997
1996
1995
1994
2001
2012
2011
2010
2009
2008
2007
2006
2005
2004
2003
2002
2013
REPORT ON
GOVERNMENT
SERVICES 2016
EMERGENCY MANAGEMENT
SECTOR OVERVIEW
PAGE 2 of TABLE DA.11

TABLE DA.11
Table DA.11 Road traffic death rate (a), (b), (c), (d), (e)
NSW Vic Qld WA SA Tas ACT NT Aust (f)
563 463 403 213 210 61 11 41 1 966
674 470 426 210 174 65 27 40 2 086
672 560 398 208 214 83 33 69 2 237
825 630 445 207 228 72 36 64 2 507
927 865 437 234 217 82 32 58 2 852
1 003 857 515 250 255 82 43 92 3 097
896 792 456 207 263 85 48 54 2 801
1 027 747 501 255 288 89 40 54 3 001
1 059 680 527 229 279 83 40 52 2 949
898 693 505 217 225 83 62 46 2 729
(a)
(b)
(c)
(d)
(e)
(f)
Source :
1988
1987
1986
1985
1984
Data for 2013 are preliminary and subject to a revisions process. Data for 2012 and 2011 have been
subject to revisions. See Causes of Death, Australia (Cat. no. 3303.0) Technical Note: Causes of Death
Revisions. Cells in this table have been randomly adjusted to avoid the release of confidential data.
Where necessary, totals have been adjusted separately to the component cells and totals are not
necessarily the sum of the component cells.
Road traffic deaths include ICD codes Road traffic accidents (V01-V79), Intentional self-harm by crashing
of motor vehicle (X82), Assault by crashing of motor vehicle (Y03), and Crashing of motor vehicle,
undetermined intent (Y32). Deaths data are reported by the State or Territory of the deceased's usual
residence, and by the year the death was registered.
The small number of deaths means it is difficult to establish patterns and provide detailed analysis.
Includes Other Territories.
ABS 2015, Causes of Death, Australia, Cat. no. 3303.0; ABS 2015, Australian Demographic
Statistics, Cat. no. 3101.0 (table 2A.1).
The number of road traffic deaths provided in Causes of Death (ABS Cat. no. 3303.0) is different to the
number of ‘Road fatalities’ presented in chapter 9. ABS data are sourced from death registrations. ‘Road
fatalities’ in chapter 9 provides more recent data sourced by the Australian Road Deaths Database as
reported by the police each month to road safety authorities.
Population data used to derive rates are as at 30 June. Estimated Resident Population (ERP) data for
1983 to 2011 are final, based on the 2011 Census of Population and Housing. Estimates for 2012
onwards are preliminary. See chapter 2 (table 2A.1) for details.
1989
1993
1992
1991
1990
REPORT ON
GOVERNMENT
SERVICES 2016
EMERGENCY MANAGEMENT
SECTOR OVERVIEW
PAGE 3 of TABLE DA.11

TABLE DA.12
Table DA.12 Exposure to forces of nature death rate (a), (b), (c), (d)
NSW Vic Qld WA SA Tas ACT NT Aust (e)
Exposure to forces of nature deaths
Annual rate per million people
0.8 1.5 1.7 0.4 3.6 – 2.6 8.2 1.4
1.2 1.2 1.3 1.6 2.4 7.8 10.4 4.2 1.5
3.4 1.4 6.8 0.8 0.6 2.0 – 8.5 3.4
1.9 1.3 1.6 0.8 4.3 3.9 5.4 21.6 2.1
1.5 5.5 1.1 2.6 17.8 – – 13.1 3.9
3.5 1.3 0.9 3.6 5.0 5.9 – 31.0 2.8
3.3 1.3 1.4 4.6 5.0 6.0 – – 2.6
2.6 1.4 1.0 0.5 7.6 12.2 – 4.7 2.4
1.8 0.8 1.2 1.0 9.7 8.2 – 4.8 2.0
2.4 2.6 6.1 – 6.5 2.1 – 19.4 3.2
1.5 1.4 1.0 0.5 3.3 8.3 – – 1.4
1.4 0.2 1.6 2.0 2.0 – – – 1.2
1.7 0.4 0.8 0.5 0.7 2.1 – – 1.2
1.4 3.6 2.0 1.0 4.0 – – 19.8 2.3
1.7 1.1 2.8 1.6 1.3 – 12.6 – 1.6
1.3 1.3 0.3 1.1 3.4 – 3.2 20.4 1.3
3.6 2.2 2.1 1.1 3.4 – – – 2.5
1.0 2.8 1.8 2.2 2.7 – – – 1.9
2.6 0.9 2.4 3.4 2.7 – – 16.3 2.2
2.5 1.1 0.9 1.7 3.4 – 9.8 16.7 1.9
1.3 1.8 0.9 – 14.4 – – 17.2 2.5
1.8 1.3 2.3 1.8 4.8 – – – 2.0
1.0 1.1 4.3 2.4 4.8 – – 29.7 2.3
5.6 1.4 1.4 2.4 3.5 6.4 – – 3.2
2.6 0.7 3.1 4.3 4.2 – – – 2.4
2.1 0.7 3.5 – – – – – 1.7
0.9 0.7 2.9 – 2.8 6.6 – – 1.6
0.9 – 2.6 – 3.6 – – – 1.2
2.0 1.4 2.3 – 2.2 – – 19.4 1.9
0.5 1.0 1.6 2.1 3.6 – – 20.2 1.4
Annual rate (3 year average) per million people
2011 to 2013 1.8 1.4 3.2 0.9 2.2 3.2 4.4 7.0 2.1
2010 to 2012 2.2 1.3 3.2 1.1 2.4 4.6 5.3 11.3 2.3
2009 to 2011 2.3 2.7 3.2 1.4 7.5 2.0 1.8 14.4 3.1
2008 to 2010 2.3 2.7 1.2 2.3 9.0 3.3 1.8 21.8 2.9
2007 to 2009 2.8 2.7 1.2 3.6 9.3 4.0 – 14.8 3.1
2006 to 2008 3.2 1.3 1.1 2.9 5.9 8.0 – 12.1 2.6
2005 to 2007 2.6 1.2 1.2 2.1 7.4 8.8 – 3.1 2.3
2004 to 2006 2.3 1.6 2.7 0.5 7.9 7.5 – 9.5 2.5
1995
1994
1993
1992
1991
1990
1989
1988
1987
1986
1985
1984
1996
2007
2006
2005
2004
2003
2002
2001
2000
1999
1998
1997
2008
2013
2012
2011
2010
2009
REPORT ON
GOVERNMENT
SERVICES 2016
EMERGENCY MANAGEMENT
SECTOR OVERVIEW
PAGE 1 of TABLE DA.12

TABLE DA.12
Table DA.12 Exposure to forces of nature death rate (a), (b), (c), (d)
NSW Vic Qld WA SA Tas ACT NT Aust (e)
2003 to 2005 1.9 1.6 2.8 0.5 6.5 6.2 – 8.1 2.2
2002 to 2004 1.8 1.4 3.0 0.8 3.9 3.5 – 6.6 1.9
2001 to 2003 1.5 0.7 1.2 1.0 2.0 3.5 – – 1.3
2000 to 2002 1.5 1.4 1.5 1.2 2.2 0.7 – 6.6 1.5
1999 to 2001 1.6 1.7 1.9 1.1 2.0 0.7 4.2 6.6 1.7
1998 to 2000 1.4 2.0 1.7 1.2 2.9 – 5.2 13.4 1.8
1997 to 1999 2.2 1.5 1.7 1.3 2.7 – 5.3 6.8 1.8
1996 to 1998 2.0 2.1 1.4 1.5 3.1 – 1.1 6.9 1.9
1995 to 1997 2.4 2.0 2.1 2.2 2.9 – – 5.3 2.2
1994 to 1996 2.0 1.6 1.7 2.5 2.9 – 3.2 10.8 2.0
1993 to 1995 2.1 1.3 1.4 1.7 6.8 – 3.3 16.7 2.2
1992 to 1994 1.9 1.4 1.4 1.2 7.5 – 3.3 11.4 2.2
1991 to 1993 1.4 1.4 2.5 1.4 8.0 – – 15.5 2.3
1990 to 1992 2.8 1.3 2.6 2.2 4.4 2.1 – 9.9 2.5
1989 to 1991 3.1 1.1 2.9 3.1 4.2 2.1 – 10.0 2.6
1988 to 1990 3.4 0.9 2.6 2.3 2.6 2.2 – – 2.5
1987 to 1989 1.8 0.7 3.2 1.5 2.3 2.2 – – 1.9
1986 to 1988 1.3 0.5 3.0 – 2.1 2.2 – – 1.5
1985 to 1987 1.2 0.7 2.6 – 2.9 2.2 – 6.4 1.5
1984 to 1986 1.1 0.8 2.2 0.7 3.1 – – 13.0 1.5
Annual exposure to forces of nature deaths number
6 9 8 1 6 – 1 2 34
9 7 6 4 4 4 4 1 34
25 8 31 2 1 1 – 2 77
14 7 7 2 7 2 2 5 46
11 30 5 6 29 – – 3 85
25 7 4 8 8 3 – 7 60
23 7 6 10 8 3 – – 55
18 7 4 1 12 6 – 1 50
12 4 5 2 15 4 – 1 40
16 13 24 – 10 1 – 4 65
10 7 4 1 5 4 – – 28
9 1 6 4 3 – – – 23
11 2 3 1 1 1 – – 23
9 17 7 2 6 – – 4 44
11 5 10 3 2 – 4 – 31
8 6 1 2 5 – 1 4 25
23 10 7 2 5 – – – 47
6 13 6 4 4 – – – 35
16 4 8 6 4 – – 3 41
2000
1999
1998
1997
1996
1995
2001
2012
2011
2010
2009
2008
2007
2006
2005
2004
2003
2002
2013
REPORT ON
GOVERNMENT
SERVICES 2016
EMERGENCY MANAGEMENT
SECTOR OVERVIEW
PAGE 2 of TABLE DA.12

TABLE DA.12
Table DA.12 Exposure to forces of nature death rate (a), (b), (c), (d)
NSW Vic Qld WA SA Tas ACT NT Aust (e)
15 5 3 3 5 – 3 3 35
8 8 3 – 21 – – 3 45
11 6 7 3 7 – – – 35
6 5 13 4 7 – – 5 40
33 6 4 4 5 3 – – 56
15 3 9 7 6 – – – 41
12 3 10 – – – – – 29
5 3 8 – 4 3 – – 26
5 – 7 – 5 – – – 19
11 6 6 – 3 – – 3 30
3 4 4 3 5 – – 3 22
(a)
(b)
(c)
(d)
(e)
– Nil or rounded to zero.
Source :
Exposure to forces of nature includes ICD codes X30-X39. Deaths data are reported by the State or
Territory of the deceased's usual residence, and by the year the death was registered.
The small number of deaths means it is difficult to establish patterns and provide detailed analysis.
Includes Other Territories.
ABS 2015, Causes of Death, Australia, Cat. no. 3303.0; ABS 2015, Australian Demographic
Statistics, Cat. no. 3101.0 (table 2A.1).
1988
1987
1986
1985
1984
Data for 2013 are preliminary and subject to a revisions process. Data for 2012 and 2011 have been
subject to revisions. See Causes of Death, Australia (Cat. no. 3303.0) Technical Note: Causes of Death
Revisions. Cells in this table have been randomly adjusted to avoid the release of confidential data.
Where necessary, totals have been adjusted separately to the component cells and totals are not
necessarily the sum of the component cells.
Population data used to derive rates are as at 30 June. Estimated Resident Population (ERP) data for
1983 to 2011 are final, based on the 2011 Census of Population and Housing. Estimates for 2012
onwards are preliminary. See chapter 2 (table 2A.1) for details.
1989
1994
1993
1992
1991
1990
REPORT ON
GOVERNMENT
SERVICES 2016
EMERGENCY MANAGEMENT
SECTOR OVERVIEW
PAGE 3 of TABLE DA.12

TABLE DA.13
Table DA.13 Total selected emergency events death rate (a), (b), (c), (d)
NSW Vic Qld WA SA Tas ACT NT Aust (e)
Total emergency event deaths
Annual rate per million people
49.2 46.4 67.3 68.8 74.2 69.9 44.0 179.5 57.9
52.8 55.1 74.5 85.8 74.8 81.9 60.0 246.3 64.3
56.1 63.0 80.0 80.2 71.9 62.5 56.1 238.5 68.2
62.3 68.8 74.2 94.8 91.5 88.0 95.1 224.8 73.5
64.0 102.7 91.9 100.0 97.7 137.6 74.6 213.2 87.4
55.6 73.7 94.9 113.4 88.3 119.0 64.8 362.8 80.0
56.7 71.9 97.9 123.9 102.0 110.3 54.5 222.9 81.1
70.1 77.8 92.4 104.5 105.1 127.7 52.5 215.2 84.4
65.0 83.0 77.1 86.8 119.8 120.6 86.5 263.1 81.8
66.5 76.4 88.3 92.0 105.9 146.0 39.2 189.4 81.4
76.4 79.2 83.6 103.6 123.7 105.6 42.6 271.4 87.0
87.8 89.9 99.1 101.9 107.9 94.0 42.8 292.5 95.0
87.4 96.1 107.6 98.0 111.8 126.5 55.4 217.6 98.3
102.8 98.5 101.1 113.8 120.4 63.3 74.6 302.4 104.7
96.6 97.8 102.6 103.8 113.5 103.6 72.5 185.8 100.4
98.4 95.9 90.3 101.9 117.4 84.6 105.0 346.9 100.5
95.3 108.7 120.4 111.7 97.8 61.3 73.8 233.3 105.0
106.8 102.0 125.5 142.4 132.1 130.6 80.5 358.4 117.5
113.5 107.2 158.6 128.4 131.4 138.8 64.6 287.2 124.7
112.8 106.7 138.7 138.2 129.7 128.6 127.5 233.9 121.6
104.7 114.0 134.8 132.0 168.1 135.2 46.3 268.7 121.7
124.3 117.9 145.7 131.1 141.9 152.5 90.1 262.1 130.2
127.2 137.3 143.6 132.0 166.3 187.2 111.9 456.8 140.7
151.4 152.0 158.4 140.6 170.1 171.4 124.4 404.9 155.9
172.1 208.3 166.6 152.5 167.6 183.9 131.1 354.2 179.8
185.2 210.2 191.3 165.4 191.7 193.3 155.6 589.4 195.3
170.5 198.5 175.2 141.4 196.5 201.7 176.4 358.4 181.0
195.1 188.4 199.6 179.1 219.0 209.2 150.7 360.3 196.1
206.5 178.1 213.7 164.5 215.5 185.9 166.1 356.2 197.7
174.8 177.9 208.1 169.9 175.8 201.0 246.6 329.9 184.1
Annual rate (3 year average) per million people
2011 to 2013 52.7 54.7 73.9 78.2 73.6 71.4 53.3 221.0 63.4
2010 to 2012 57.0 62.2 76.2 86.8 79.4 77.4 70.2 236.7 68.6
2009 to 2011 60.8 78.0 82.0 91.5 87.0 95.9 75.2 225.6 76.2
2008 to 2010 60.7 81.7 86.9 102.5 92.5 114.8 78.4 266.3 80.2
2007 to 2009 58.8 83.0 94.9 112.2 96.0 122.4 64.8 266.4 82.9
2006 to 2008 60.7 74.5 95.1 114.0 98.4 119.0 57.4 268.3 81.8
2005 to 2007 63.9 77.5 89.3 105.4 108.9 119.5 64.3 233.4 82.4
2004 to 2006 67.2 79.1 86.0 94.5 110.3 131.4 59.5 222.7 82.5
1995
1994
1993
1992
1991
1990
1989
1988
1987
1986
1985
1984
1996
2007
2006
2005
2004
2003
2002
2001
2000
1999
1998
1997
2008
2013
2012
2011
2010
2009
REPORT ON
GOVERNMENT
SERVICES 2016
EMERGENCY MANAGEMENT
SECTOR OVERVIEW
PAGE 1 of TABLE DA.13

TABLE DA.13
Table DA.13 Total selected emergency events death rate (a), (b), (c), (d)
NSW Vic Qld WA SA Tas ACT NT Aust (e)
2003 to 2005 69.3 79.5 82.9 94.0 116.5 124.1 56.3 241.2 83.4
2002 to 2004 76.8 81.7 90.2 99.1 112.5 115.3 41.5 250.7 87.7
2001 to 2003 83.8 88.3 96.6 101.2 114.5 108.6 46.9 260.5 93.4
2000 to 2002 92.6 94.8 102.6 104.5 113.3 94.6 57.5 270.8 99.3
1999 to 2001 95.6 97.4 103.8 105.2 115.2 97.8 67.5 235.4 101.1
1998 to 2000 99.3 97.4 98.1 106.6 117.1 83.8 84.0 278.1 101.9
1997 to 1999 96.8 100.8 104.4 105.8 109.6 83.1 83.8 255.1 102.0
1996 to 1998 100.1 102.2 111.9 118.5 115.7 92.2 86.5 312.8 107.6
1995 to 1997 105.1 106.0 134.7 127.4 120.4 110.3 73.0 292.7 115.6
1994 to 1996 111.0 105.3 140.9 136.3 131.1 132.6 90.7 294.3 121.3
1993 to 1995 110.4 109.3 144.2 132.8 143.0 134.2 79.6 263.4 122.7
1992 to 1994 113.9 112.9 139.7 133.8 146.6 138.7 88.1 254.6 124.5
1991 to 1993 118.7 123.0 141.3 131.7 158.8 158.3 82.5 328.1 130.8
1990 to 1992 134.2 135.7 149.1 134.5 159.4 170.4 108.6 373.7 142.2
1989 to 1991 150.1 165.7 156.0 141.6 168.0 180.8 122.3 405.8 158.7
1988 to 1990 169.5 190.0 171.8 152.7 176.4 182.8 136.8 448.6 176.8
1987 to 1989 175.9 205.7 177.6 153.2 185.2 192.9 154.1 433.9 185.4
1986 to 1988 183.6 199.1 188.7 161.8 202.3 201.4 160.9 436.9 190.8
1985 to 1987 190.5 188.4 195.9 161.5 210.3 199.0 164.5 358.3 191.5
1984 to 1986 192.2 181.5 207.1 171.2 203.5 198.7 186.9 349.1 192.7
Annual emergency event deaths number
370 271 318 177 125 36 17 44 1 361
391 316 347 216 125 42 23 59 1 487
409 354 365 195 119 32 21 56 1 546
450 381 332 223 150 45 35 52 1 641
457 561 405 229 159 70 27 49 1 925
392 396 411 254 142 60 23 82 1 735
394 378 413 269 162 55 19 49 1 723
479 401 380 220 165 63 18 46 1 757
438 420 309 178 186 59 29 55 1 672
445 381 346 185 163 71 13 39 1 642
508 390 320 205 189 51 14 55 1 734
581 438 371 199 164 45 14 59 1 873
575 463 393 189 169 60 18 44 1 917
671 469 361 217 181 30 24 61 2 018
623 460 360 195 170 49 23 37 1 911
627 446 312 189 175 40 33 68 1 891
601 501 410 204 145 29 23 45 1 953
667 466 421 256 195 62 25 68 2 164
701 486 524 227 193 66 20 53 2 273
2000
1999
1998
1997
1996
1995
2001
2012
2011
2010
2009
2008
2007
2006
2005
2004
2003
2002
2013
REPORT ON
GOVERNMENT
SERVICES 2016
EMERGENCY MANAGEMENT
SECTOR OVERVIEW
PAGE 2 of TABLE DA.13

TABLE DA.13
Table DA.13 Total selected emergency events death rate (a), (b), (c), (d)
NSW Vic Qld WA SA Tas ACT NT Aust (e)
689 480 449 240 190 61 39 42 2 190
633 510 427 225 246 64 14 47 2 167
745 526 451 220 207 72 27 45 2 296
758 611 434 219 242 88 33 77 2 460
893 672 469 230 246 80 36 67 2 695
1 004 912 483 246 240 85 37 58 3 068
1 070 908 541 261 272 88 43 95 3 284
973 846 480 217 276 91 48 57 2 992
1 096 793 534 268 305 94 40 57 3 190
1 142 741 561 240 298 83 43 55 3 167
955 733 535 241 241 89 62 49 2 906
(a)
(b)
(c)
(c)
(d)
(e)
Source :
Deaths are coded according to the ICD and Related Health Problems Revision 10 (ICD-10). Deaths data
are reported by the year the death was registered. Road traffic deaths includes ICD codes V01-V79,
X82, Y03 and Y32. Exposure to forces of nature includes ICD codes X30-X39. Fire deaths include ICD
fire death codes X00-X09 plus X76, X97 and Y26. Data are reported by the State or Territory of the
deceased's usual residence, and by the year the death was registered.
The small number of deaths means it is difficult to establish patterns and provide detailed analysis.
Includes Other Territories.
ABS 2015, Causes of Death, Australia, Cat. no. 3303.0; ABS 2015, Australian Demographic
Statistics, Cat. no. 3101.0 (table 2A.1); table 9A.6; tables DA.8-9.
1988
1987
1986
1985
1984
Data for 2013 are preliminary and subject to a revisions process. Data for 2012 and 2011 have been
subject to revisions. See Causes of Death, Australia (Cat. no. 3303.0) Technical Note: Causes of Death
Revisions. Cells in this table have been randomly adjusted to avoid the release of confidential data.
Where necessary, totals have been adjusted separately to the component cells and totals are not
necessarily the sum of the component cells.
See chapter 9 for fire deaths data.
Population data used to derive rates are as at 30 June. Estimated Resident Population (ERP) data for
1983 to 2011 are final, based on the 2011 Census of Population and Housing. Estimates for 2012
onwards are preliminary. See chapter 2 (table 2A.1) for details.
1989
1994
1993
1992
1991
1990
REPORT ON
GOVERNMENT
SERVICES 2016
EMERGENCY MANAGEMENT
SECTOR OVERVIEW
PAGE 3 of TABLE DA.13

STATE EMERGENCY SERVICES
All jurisdictions — State and
Territory emergency services
REPORT ON
GOVERNMENT
SERVICES 2016
EMERGENCY MANAGEMENT
SECTOR OVERVIEW
PAGE 1 of STATE EMERGENCY SERVICES

TABLE DA.14
Table DA.14
NSW Vic Qld WA SA Tas ACT NT
Floods, storm and tempest and other natural disasters
Tropical cyclone response
Storm damage
Flood response
Earthquakes (a) (a)
Tsunami response (a)
Search and rescue and emergency medical service
Road crash rescue
Vertical rescue (a)
Land search and rescue (a) (a) (a) (a) (a) (a)
Urban search and rescue (a) (a) (a) (a) (a) (a)
Inland marine search and rescue (a) (a) (a) (a) (a)
Offshore marine search and rescue (a) (b) (b)
Other emergency incidents
Hazardous conditions
Civil defence O
National security support (a) (a) (a) (a)
Support services
Public safety awareness and education
Assistance for municipal planning
Air observer (b) (a) (a) (a) (a) (a)
(a)
(b)
Source : State and Territory governments (unpublished).
WASES and ACTSES undertake air observer duties only, offshore. They do not participate in sea rescue.
All activities of State and Territory Emergency Services
Support to emergency service organisations
Conduct of emergency management courses
This role is to provide support to another agency in this activity.
REPORT ON
GOVERNMENT
SERVICES 2016
EMERGENCY MANAGEMENT
SECTOR OVERVIEW
PAGE 1 of TABLE DA.14
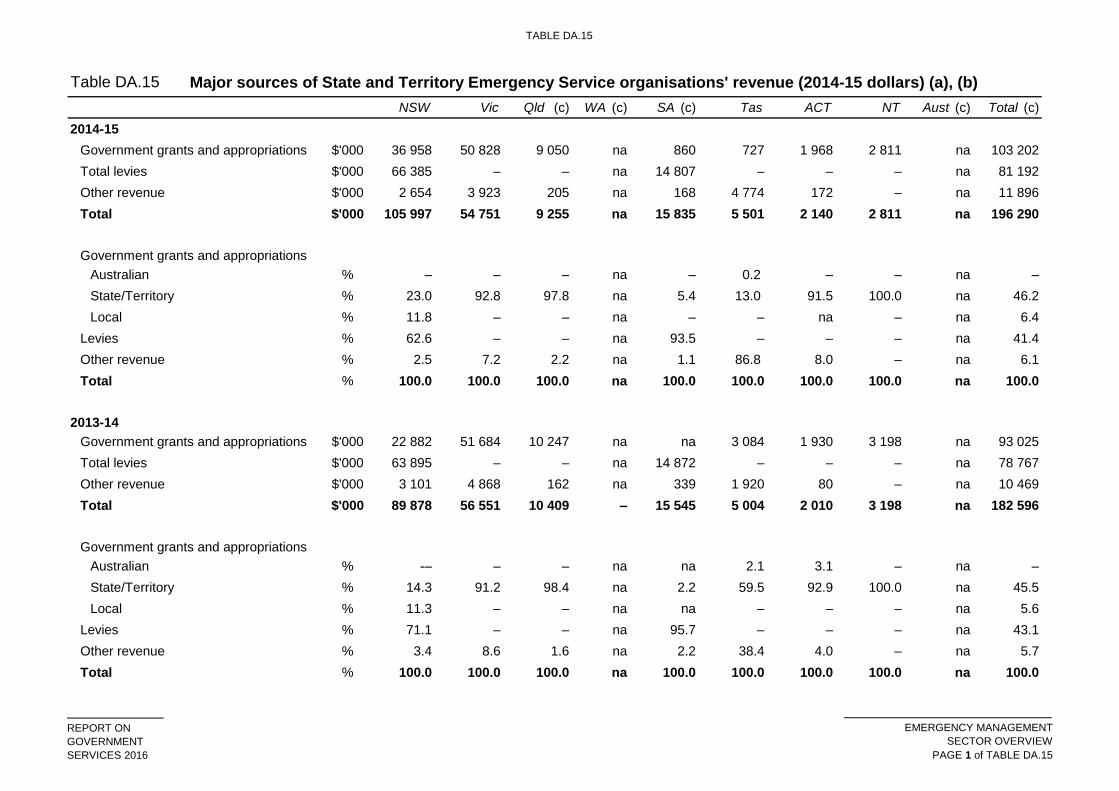
TABLE DA.15
Table DA.15
NSW Vic Qld (c) WA (c) SA (c) Tas ACT NT Aust (c) Total (c)
2014-15
Government grants and appropriations $'000 36 958 50 828 9 050 na 860 727 1 968 2 811 na 103 202
Total levies $'000 66 385 – – na 14 807 – – – na 81 192
Other revenue $'000 2 654 3 923 205 na 168 4 774 172 – na 11 896
Total $'000 105 997 54 751 9 255 na 15 835 5 501 2 140 2 811 na 196 290
Government grants and appropriations
Australian % – – – na – 0.2 – – na –
State/Territory % 23.0 92.8 97.8 na 5.4 13.0 91.5 100.0 na 46.2
Local % 11.8 – – na – – na – na 6.4
Levies % 62.6 – – na 93.5 – – – na 41.4
Other revenue % 2.5 7.2 2.2 na 1.1 86.8 8.0 – na 6.1
Total % 100.0 100.0 100.0 na 100.0 100.0 100.0 100.0 na 100.0
2013-14
Government grants and appropriations $'000 22 882 51 684 10 247 na na 3 084 1 930 3 198 na 93 025
Total levies $'000 63 895 – – na 14 872 – – – na 78 767
Other revenue $'000 3 101 4 868 162 na 339 1 920 80 – na 10 469
Total $'000 89 878 56 551 10 409 – 15 545 5 004 2 010 3 198 na 182 596
Government grants and appropriations
Australian % -– – – na na 2.1 3.1 – na –
State/Territory % 14.3 91.2 98.4 na 2.2 59.5 92.9 100.0 na 45.5
Local % 11.3 – – na na – – – na 5.6
Levies % 71.1 – – na 95.7 – – – na 43.1
Other revenue % 3.4 8.6 1.6 na 2.2 38.4 4.0 – na 5.7
Total % 100.0 100.0 100.0 na 100.0 100.0 100.0 100.0 na 100.0
Major sources of State and Territory Emergency Service organisations' revenue (2014-15 dollars) (a), (b)
REPORT ON
GOVERNMENT
SERVICES 2016
EMERGENCY MANAGEMENT
SECTOR OVERVIEW
PAGE 1 of TABLE DA.15

TABLE DA.15
Table DA.15
NSW Vic Qld (c) WA (c) SA (c) Tas ACT NT Aust (c) Total (c)
Major sources of State and Territory Emergency Service organisations' revenue (2014-15 dollars) (a), (b)
2012-13
Government grants and appropriations $'000 31 120 54 226 12 482 na – 3 093 2 136 3 636 na 106 693
Total levies $'000 62 487 – na na 15 411 – – – na 77 898
Other revenue $'000 3 364 4 561 na na 319 2 809 90 1 na 11 143
Total $'000 96 970 58 787 na na 15 730 5 902 2 226 3 637 na 183 252
Government grants and appropriations
Australian % 9.7 0.3 na na – 1.8 7.4 – na 5.4
State/Territory % 12.3 92.0 100.0 na – 50.6 88.6 100.0 na 47.5
Local % 10.1 – na na – – – – na 5.4
Levies % 64.4 – na na 98.0 – – – na 42.5
Other revenue % 3.5 7.8 na na 2.0 47.6 4.0 0.0 na 6.1
Total % 100.0 100.0 na na 100.0 100.0 100.0 100.0 na 106.8
2011-12
Total government grants $'000 14 285 46 495 na na – 3 241 1 859 3 729 na 69 610
Total levies $'000 55 200 – na na 14 040 – – – na 69 239
Other revenue $'000 3 599 7 054 na na 2 246 3 945 15 2 na 16 860
Total $'000 73 084 53 550 na na 16 285 7 186 1 874 3 731 na 155 710
Government grants %
Australian % 0.3 – na na – – 0.9 – na –
State/Territory % 8.5 86.8 na na – 45.1 98.3 99.9 na 39.5
Local % 10.7 – na na – – – – na 5.0
Levies % 75.5 – na na 86.2 – – – na 44.5
Other revenue % 4.9 13.2 na na 13.8 54.9 0.8 0.1 na 10.8
Total % 100.0 100.0 na na 100.0 100.0 100.0 100.0 na 100.0
REPORT ON
GOVERNMENT
SERVICES 2016
EMERGENCY MANAGEMENT
SECTOR OVERVIEW
PAGE 2 of TABLE DA.15

TABLE DA.15
Table DA.15
NSW Vic Qld (c) WA (c) SA (c) Tas ACT NT Aust (c) Total (c)
Major sources of State and Territory Emergency Service organisations' revenue (2014-15 dollars) (a), (b)
(a)
(b)
(c)
Qld:
WA:
SA:
Tas:
Aust:
Total:
na Not available. – Nil or rounded to zero.
Source :
Other revenue includes revenue from fees and charges, interest income, donations and volunteer unit fundraising income. The significant decrease from
2011-12 is partly due to property transferred into the control of the Minister, which was recognised as resources received free of charge in 2011-12 ($0.644
million). Also contributing to the significant variance is the gain on revaluation of property, plant and equipment in 2011-12 ($1.402 million).
SES totals for financial data exclude WA.
Jurisdiction notes:
The 2013-14 revenue represents State Emergency Service costs for the former Emergency Management Queensland (EMQ) for the period 1 July 2013 to 31
October 2013 and Queensland Fire and Emergency Services (QFES) for the period 1 November 2013 to 30 June 2014. In addition, some functions and
assets previously held by the former EMQ were transferred to the Public Safety Business Agency on 1 November 2013. The 2013-14 results are therefore
not comparable to prior years.
Tasmania SES financial data have been subject to revisions in all years.
State and Territory Governments (unpublished); ABS 2015, Australian National Accounts: National Income, Expenditure and Product, June 2015, Cat. no.
5206.0, Canberra (table 2A.48).
Total of jurisdictions where data are available. In 2011-12, SES total excludes Queensland and WA.
Time series financial data are adjusted to 2014-15 dollars using the General Government Final Consumption Expenditure (GGFCE) chain price deflator (2014-
15 = 100) (table DA.20). See table 2A.48 and chapter 2 (sections 2.5-6) for more information.
Figures vary from year to year as a result of abnormal expenditure related to the response to specific major emergencies.
DFES provides a wide range of emergency services under an integrated management structure. Data cannot be segregated for the the State Emergency
Service. Financial data for the fire service organisation include data related to the fire service agency, SES and volunteer marine rescue — see chapter 9.
REPORT ON
GOVERNMENT
SERVICES 2016
EMERGENCY MANAGEMENT
SECTOR OVERVIEW
PAGE 3 of TABLE DA.15

TABLE DA.16
Table DA.16
NSW Vic Qld WA SA Tas ACT NT Aust Total
(f) (f) (f) (f) (f) (f) (f) (f)
2014-15
31 729 19 627 1 620 na 4 420 2 384 1 082 1 727 na 62 589
Capital costs (c)
Depreciation 3 971 6 382 14 na 1 450 – 431 629 na 12 877
User cost of capital - Other 2 059 4 906 na na 2 623 – 429 452 na 10 468
Other costs (d) 58 337 22 831 7 622 na 7 250 2 909 998 1 023 na 100 970
Total costs (e) 96 096 53 746 9 255 na 15 743 5 293 2 940 3 831 na 186 904
Other expenses
Labour costs - Payroll tax 1 655 869 – na 188 – – na na 2 712
User cost of capital - Land .. 704 – na 284 – 192 160 na 1 340
Interest on borrowings na 284 – na – – – na na 284
2013-14
31 889 19 267 1 953 na 4 583 2 459 1 017 1 813 na 62 981
Capital costs (c)
Depreciation 5 032 5 915 118 na 2 252 – 467 435 na 14 219
User cost of capital - Other 4 070 4 927 na na 2 482 – 486 506 na 12 471
Other costs (d) 47 485 25 721 8 338 na 8 148 2 255 916 998 na 93 861
Total costs (e) 88 476 55 829 10 409 na 17 465 4 714 2 886 3 752 na 183 531
Other expenses
Payroll tax 1 624 917 90 na 189 – – 90 na 2 909
User cost of capital - Land .. 746 na na 289 – 196 163 na 1 393
Interest on borrowings – 332 na na – – – – na 332
2012-13
28 699 18 323 2 164 na 3 176 2 290 1 063 1 778 na 57 493
State and Territory Emergency Service organisations' costs ($'000) (2014-15 dollars) (a), (b)
Labour costs - Salaries and
payments in the nature of salaries
Labour costs - Salaries and
payments in the nature of salaries
Labour costs - Salaries and
payments in the nature of salaries
REPORT ON
GOVERNMENT
SERVICES 2016
EMERGENCY MANAGEMENT
SECTOR OVERVIEW
PAGE 1 of TABLE DA.16

TABLE DA.16
Table DA.16
NSW Vic Qld WA SA Tas ACT NT Aust Total
(f) (f) (f) (f) (f) (f) (f) (f)
State and Territory Emergency Service organisations' costs ($'000) (2014-15 dollars) (a), (b)
Capital costs (c)
Depreciation 4 224 5 695 269 na 2 330 – 520 627 na 13 663
User cost of capital - Other 3 625 4 553 na na 2 660 – 543 502 na 11 883
Other costs (d) 56 281 26 476 10 051 na 7 334 2 704 875 1 107 na 104 829
Total costs (e) 92 830 55 047 12 483 na 15 500 4 994 3 001 4 014 na 187 868
Other expenses
Payroll tax 1 454 749 137 na 137 – – 96 na 2 573
User cost of capital - Land – 756 na na 232 – 198 210 na 1 396
Interest on borrowings – 371 – na – – – – na 371
2011-12
27 506 17 683 na na 3 667 2 226 1 100 2 032 na 54 214
Capital costs (c)
Depreciation 4 499 4 653 na na 2 043 na 315 466 na 11 976
User cost of capital - Other 2 853 4 337 na na 2 741 na 520 507 na 10 958
Other costs (d) 66 162 28 803 na na 7 496 6 186 719 1 433 na 110 798
Total costs (e) 101 020 55 476 na na 15 947 8 412 2 654 4 438 na 187 946
Other
Payroll tax 7 100 740 na na 154 6 – 96 na 8 096
User cost of capital - Land 173 9 582 na na 2 933 na 2 511 2 665 na 17 864
Interest on borrowings – - 393 na na – – – – na - 393
(a)
(b)
(c)
(d)
Time series financial data are adjusted to 2014-15 dollars using the General Government Final Consumption Expenditure (GGFCE) chain price deflator (2014-
15 = 100) (table DA.20). See table 2A.48 and chapter 2 (sections 2.5-6) for more information.
Labour costs - Salaries and
payments in the nature of salaries
Figures vary from year to year as a result of abnormal expenditure related to response to specific major emergencies.
The user cost of capital is partly dependent on depreciation and asset revaluation methods employed. Details of the treatment of assets by emergency
management agencies across jurisdictions are outlined in table 9A.51.
Includes the running, training, maintenance, communications, provisions for losses and other recurrent costs.
REPORT ON
GOVERNMENT
SERVICES 2016
EMERGENCY MANAGEMENT
SECTOR OVERVIEW
PAGE 2 of TABLE DA.16

TABLE DA.16
Table DA.16
NSW Vic Qld WA SA Tas ACT NT Aust Total
(f) (f) (f) (f) (f) (f) (f) (f)
State and Territory Emergency Service organisations' costs ($'000) (2014-15 dollars) (a), (b)
(e)
(f)
Qld:
WA:
Tas:
SA:
Aust:
Total:
na Not available. – Nil or rounded to zero.
Source :
Jurisdiction notes:
The operating costs represents State Emergency Service costs following the transfer of some functions and assets to the Public Safety Business Agency on
1 November 2013. The 2014-15 results reflect the first full year following the transfers and are therefore not comparable to prior years.
The user cost of capital is unable to be calculated as many State Emergency Service (SES) non-current physical assets are owned by local governments
therefore Queensland Fire and Emergency Services (QFES) is not able to provide asset values required to calculate cost of capital.
State and Territory Governments (unpublished); ABS 2015, Australian National Accounts: National Income, Expenditure and Product, June 2015, Cat.
no. 5206.0, Canberra (table 2A.48).
Many SES non-physical assets are owned by Local Governments therefore Tasmania is not able to provide asset values required to calculate cost of
capital.
Total of jurisdictions where data are available.
Total costs excludes payroll tax, the user cost of capital associated with land, and interest on borrowings.
Australian totals for SES financial data exclude WA.
DFES provides a wide range of emergency services under an integrated management structure. Data cannot be segregated for the the State Emergency
Service. Financial data for the fire service organisation include data related to the fire service agency, SES and volunteer marine rescue — see chapter 9.
Tasmania SES financial data have been subject to revisions in all years.
Other costs include the Government Radio Network, repairs and maintenance, and travel and training.
REPORT ON
GOVERNMENT
SERVICES 2016
EMERGENCY MANAGEMENT
SECTOR OVERVIEW
PAGE 3 of TABLE DA.16

TABLE DA.17
Table DA.17
NSW Vic
(b)
Qld
(b)
WA
(b)
SA
(b)
Tas ACT NT
(b)
Aust Total
2014-15
Paid staff
Operational FTE na 57 na na 33 10 8 13 na na
Support personnel FTE na 127 na na 11 15 – 6 na na
Total FTE 297 184 na na 44 25 8 19 na 577
Volunteers
Operational no. na 3 374 na 1 977 1 668 na 279 na na na
Support personnel no. na 627 na 56 na na – na na na
Total no. 9 663 4 001 5 900 2 033 1 668 529 279 319 24 392 24 392
2013-14
Paid staff
Operational FTE na 57 na na 33 10 8 13 na na
Support personnel FTE na 124 na na 10 16 – 6 na na
Total FTE 292 181 na na 43 26 8 19 na 569
Volunteers
Operational no. na 3 377 na 1 986 na na na 344 na na
Support personnel no. na 626 na 57 na na na – na na
Total no. 7 282 4 003 5 700 2 043 1 711 548 257 344 21 888 21 888
2012-13
Paid staff
Operational FTE 254 42 na na 31 10 8 13 na na
Support personnel FTE – 131 na na 10 16 – 6 na na
Total FTE 254 173 na na 41 26 8 19 na 521
Volunteers
Operational no. 7 454 3 317 na 1 971 na na 243 na na na
Support personnel no. – 367 na 53 na na – na na na
Total no. 7 454 3 684 6 000 2 024 1 617 531 243 324 21 877 21 877
State and Territory Emergency Service organisations' human resources (a)
REPORT ON
GOVERNMENT
SERVICES 2016
EMERGENCY MANAGEMENT
SECTOR OVERVIEW
PAGE 1 of TABLE DA.17

TABLE DA.17
Table DA.17
NSW Vic
(b)
Qld
(b)
WA
(b)
SA
(b)
Tas ACT NT
(b)
Aust Total
State and Territory Emergency Service organisations' human resources (a)
2011-12
Paid staff FTE 311 210 na na 44 24 8 19 na na
Operational FTE na 48 na na 21 14 8 18 na na
Support personnel FTE na 162 na na 23 10 – 1 na na
Total FTE 311 210 na na 44 24 8 19 na na
Volunteers
Operational no. na 4 730 na 1 881 na na 262 309 na na
Support personnel no. na 770 na 46 na na – 35 na na
Total no. 7 312 5 500 5 400 1 927 1 674 559 262 344 22 978 22 978
2010-11
Paid staff FTE 273 na na na na 24 na na na 297
Operational FTE 273 na na na na 14 na na na 287
Support personnel FTE na na na na na 10 na na na 10
Total FTE 273 na na na na 24 na na na 297
Volunteers
Operational no. na 3 273 na 1 950 na na na na na na
Support personnel no. na 1 898 na 44 na na na na na na
Total no. 10 828 5 171 7 000 1 994 1 701 615 240 377 27 926 27 926
2009-10
Paid staff FTE na na na na na na na na na na
Operational FTE na na na na na na na na na na
Support personnel FTE na na na na na na na na na –
Total FTE na na na na na na na na na na
Volunteers
Operational no. na 4 028 na 1 898 na na na na na na
Support personnel no. na 1 193 na 16 na na na na na na
Total no. 10 356 5 221 6 800 1 914 1 532 537 229 335 26 924 26 924
REPORT ON
GOVERNMENT
SERVICES 2016
EMERGENCY MANAGEMENT
SECTOR OVERVIEW
PAGE 2 of TABLE DA.17

TABLE DA.17
Table DA.17
NSW Vic
(b)
Qld
(b)
WA
(b)
SA
(b)
Tas ACT NT
(b)
Aust Total
State and Territory Emergency Service organisations' human resources (a)
2008-09
Paid staff FTE na na na na na na na na na na
Operational FTE na na na na na na na na na na
Support personnel FTE na na na na na na na na na –
Total FTE na na na na na na na na na na
Volunteers
Operational no. na 3 691 na 1 886 na 552 na na na na
Support personnel no. na 1 809 na 14 na 32 na na na na
Total no. 10 954 5 500 6 300 1 900 1 613 584 247 299 27 397 27 397
REPORT ON
GOVERNMENT
SERVICES 2016
EMERGENCY MANAGEMENT
SECTOR OVERVIEW
PAGE 3 of TABLE DA.17

TABLE DA.17
Table DA.17
NSW Vic
(b)
Qld
(b)
WA
(b)
SA
(b)
Tas ACT NT
(b)
Aust Total
State and Territory Emergency Service organisations' human resources (a)
2007-08
Paid staff FTE na na na na na na na na na na
Operational FTE na na na na na na na na na na
Support personnel FTE na na na na na na na na na –
Total FTE na na na na na na na na na na
Volunteers
Operational no. na 3 691 na na na 530 na na na na
Support personnel no. na 1 142 na na na 30 na na na na
Total no. 10 114 4 833 6 430 1 827 1 828 560 205 293 26 090 26 090
2006-07
Paid staff FTE na na na na na na na na na na
Operational FTE na na na na na na na na na na
Support personnel FTE na na na na na na na na na –
Total FTE na na na na na na na na na na
Volunteers
Operational no. na 3 101 na na na na na na na na
Support personnel no. na 1 310 na na na na na na na na
Total no. 10 331 4 411 7 000 1 854 1 821 525 191 347 26 480 26 480
2005-06
Paid staff FTE na na na na na na na na na na
Operational FTE na na na na na na na na na na
Support personnel FTE na na na na na na na na na –
Total FTE na na na na na na na na na na
Volunteers
Operational no. na na na na na na na na na na
Support personnel no. na na na na na na na na na na
Total no. 10 302 4 437 9 394 1 863 1 896 577 168 392 29 029 29 029
REPORT ON
GOVERNMENT
SERVICES 2016
EMERGENCY MANAGEMENT
SECTOR OVERVIEW
PAGE 4 of TABLE DA.17

TABLE DA.17
Table DA.17
NSW Vic
(b)
Qld
(b)
WA
(b)
SA
(b)
Tas ACT NT
(b)
Aust Total
State and Territory Emergency Service organisations' human resources (a)
(a)
(b)
Vic:
Qld:
WA:
SA:
NT:
na Not available. – Nil or rounded to zero.
Source : State and Territory governments (unpublished).
2012-13 volunteer numbers are less due to cleansing of volunteer records. Data exclude volunteers on leave and associates.
Volunteer numbers may fluctuate as members leave the service, new members are recruited and data cleansing occurs.
Prior to 2013-14, the SES formed part of Emergency Management Queensland within the former Department of Community Safety. Effective 1 November
2013, Queensland Fire and Emergency Services (QFES) was established as an independent department encompassing fire and rescue, emergency
management, SES and the Rural Fire Service.
Data exclude volunteer emergency service members who may also undertake an SES role (560 in 2014-15).
Data refer to active, operational members.
Transient people in the NT result in fluctuations in the numbers of volunteers.
For 2013-14, paid staff who contribute to the SES function have been included within fire service organisation data (chapter 9).
Salaried personnel of the Department of Fire and Emergency Services have cross hazard responsibilities and are not broken down by service.
Jurisdiction notes:
Data on SES paid staff were not collected prior to 2011-12.
REPORT ON
GOVERNMENT
SERVICES 2016
EMERGENCY MANAGEMENT
SECTOR OVERVIEW
PAGE 5 of TABLE DA.17

TABLE DA.18
Table DA.18
NSW Vic Qld (e) WA SA Tas ACT NT Aust Total
2014-15
Floods, storm and tempest and other natural disasters
Storms and cyclones 35 488 17 587 9 591 150 3 201 721 642 50 67 430 67 430
Flood 2 365 970 – 5 276 37 32 74 3 759 3 759
Other natural disasters (a) na 1 – 14 4 – – – na 19
Total 37 853 18 558 9 591 169 3 481 758 674 124 71 208 71 208
Search and rescue and emergency medical service
Road crash rescue 431 993 137 69 402 371 – 8 2 411 2 411
Vertical rescue 30 30 38 13 28 – – 5 144 144
Other search and rescue (b) 616 480 1 667 112 1 012 35 8 49 3 979 3 979
Community first response (c) 414 .. 1 226 69 14 – – na na 1 723
Total 1 491 1 503 3 068 263 1 456 406 8 62 8 257 8 257
Other emergency incidents (d) 722 1 627 – 104 299 52 49 64 2 917 2 917
Total 40 066 21 688 12 659 536 5 236 1 216 731 250 82 382 82 382
2013-14
Floods, storm and tempest and other natural disasters
Storms and cyclones 16 618 26 349 na 151 6 734 358 1 398 15 na 51 623
Flood 109 851 na 22 1 012 344 19 5 na 2 362
Other natural disasters (a) 870 – na 1 1 391 – – – na 2 262
Total 17 597 27 200 na 174 9 137 702 1 417 20 na 56 247
Search and rescue and emergency medical service
Road crash rescue 597 1 032 na 20 791 421 .. 10 na 2 871
Vertical rescue 26 40 na 10 23 – .. 6 na 105
Other search and rescue (b) 624 472 na 101 338 25 9 16 na 1 585
Community first response (c) 430 .. na .. 7 .. .. .. na 437
Total 1 677 1 544 na 131 1 159 446 9 32 na 4 998
Other emergency incidents (d) 34 na na 224 .. 63 64 90 na 475
State and Territory Emergency Service incidents
REPORT ON
GOVERNMENT
SERVICES 2016
EMERGENCY MANAGEMENT
SECTOR OVERVIEW
PAGE 1 of TABLE DA.18
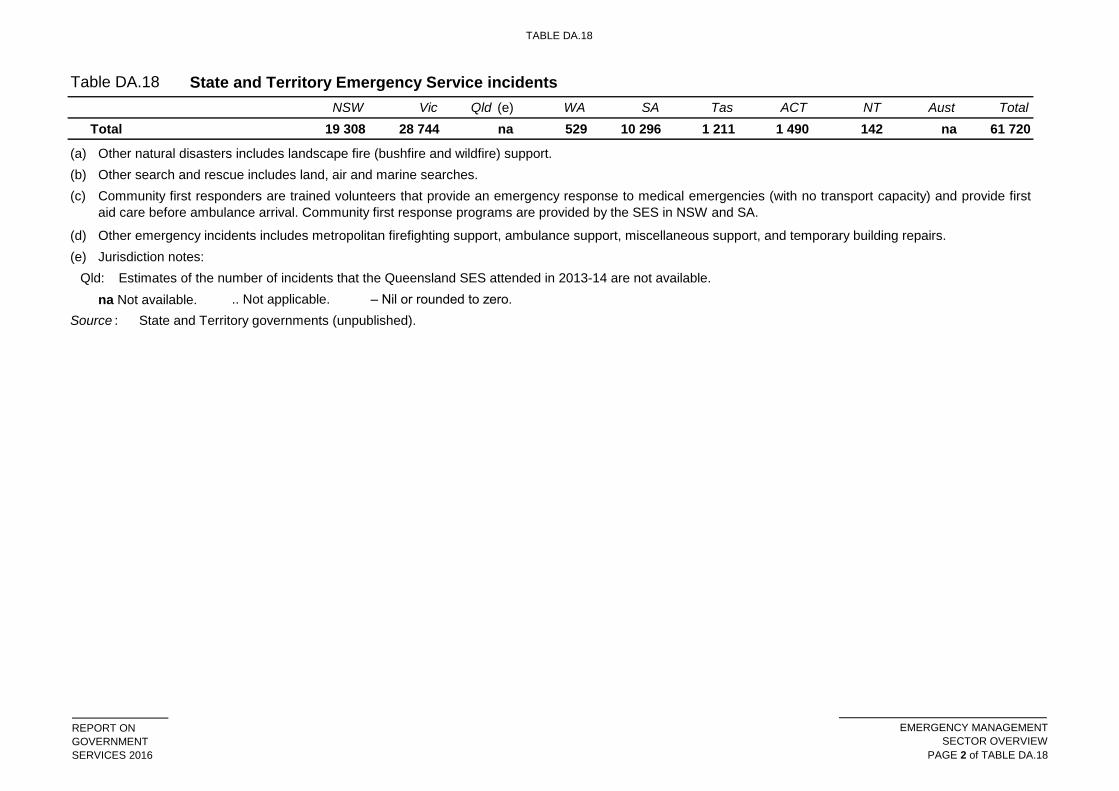
TABLE DA.18
Table DA.18
NSW Vic Qld (e) WA SA Tas ACT NT Aust Total
State and Territory Emergency Service incidents
Total 19 308 28 744 na 529 10 296 1 211 1 490 142 na 61 720
(a)
(b)
(c)
(d)
(e)
Qld:
na Not available. .. Not applicable. – Nil or rounded to zero.
Source : State and Territory governments (unpublished).
Jurisdiction notes:
Estimates of the number of incidents that the Queensland SES attended in 2013-14 are not available.
Community first responders are trained volunteers that provide an emergency response to medical emergencies (with no transport capacity) and provide first
aid care before ambulance arrival. Community first response programs are provided by the SES in NSW and SA.
Other search and rescue includes land, air and marine searches.
Other natural disasters includes landscape fire (bushfire and wildfire) support.
Other emergency incidents includes metropolitan firefighting support, ambulance support, miscellaneous support, and temporary building repairs.
REPORT ON
GOVERNMENT
SERVICES 2016
EMERGENCY MANAGEMENT
SECTOR OVERVIEW
PAGE 2 of TABLE DA.18

TABLE DA.19
Table DA.19
NSW Vic Qld WA SA Tas ACT NT Aust
2014-15
Floods, storm and tempest and other natural disasters
Storms and cyclones na 98 744 66 451 15 197 26 408 3 621 2 965 3 388 na
Flood na 4 999 – – 1 352 385 136 389 na
Other natural disasters (b) na 1 – 1 129 – – – 131
Total na 103 744 66 451 15 198 27 889 4 006 3 101 3 777 na
Search and rescue and emergency medical service
Road crash rescue na 10 692 526 349 4 402 2 315 – 144 na
Vertical rescue na 444 240 147 416 – – 391 na
Other search and rescue (c) na 2 171 12 288 5 801 33 380 1 319 702 1 057 na
Community first response (d) na – 7 499 324 251 – – na na
Total na 13 307 20 553 6 621 38 449 3 634 702 1 592 na
Other emergency incidents (e) na 25 852 – 10 063 5 980 587 1 923 1 086 45 491
Total na 142 903 87 004 31 882 72 318 8 227 5 726 6 455 354 515
2013-14
Floods, storm and tempest and other natural disasters
Storms and cyclones 173 960 168 041 17 848 6 476 55 610 1 706 6 990 133 430 764
Flood 1 282 3 486 1 031 112 4 966 1 538 95 16 12 526
Other natural disasters (b) 19 190 – na – 34 423 – – – 53 613
Total 194 432 171 527 18 879 6 588 94 999 3 244 7 085 148 496 902
Search and rescue and emergency medical service
Road crash rescue 3 920 11 889 1 047 299 8 665 2 702 .. 111 28 633
Vertical rescue 349 859 101 210 342 – .. 220 2 081
Other search and rescue (c) 14 872 2 103 26 042 7 072 10 268 687 998 644 62 686
Community first response (d) 1 315 .. .. .. 136 .. .. .. 1 451
Total 20 456 14 851 27 190 7 581 19 411 3 389 998 975 94 851
Other emergency incidents (e) 153 na 21 957 3 318 na 860 1 807 1 000 29 095
State and Territory Emergency Service hours in attendance (a)
REPORT ON
GOVERNMENT
SERVICES 2016
EMERGENCY MANAGEMENT
SECTOR OVERVIEW
PAGE 1 of TABLE DA.19

TABLE DA.19
Table DA.19
NSW Vic Qld WA SA Tas ACT NT Aust
State and Territory Emergency Service hours in attendance (a)
Total 215 041 186 378 68 026 17 487 114 410 7 493 9 890 2 123 620 848
(a)
(b)
(c)
(d)
(e)
na Not available. .. Not applicable. – Nil or rounded to zero.
Source : State and Territory governments (unpublished).
Other natural disasters includes landscape fire (bushfire and wildfire) support.
Other search and rescue includes land, air and marine searches.
Community first responders are trained volunteers that provide an emergency response to medical emergencies (with no transport capacity) and provide first aid
care before ambulance arrival. Community first response programs are provided by the SES in NSW and SA.
Other emergency incidents includes metropolitan firefighting support, ambulance support, miscellaneous support, and temporary building repairs.
Totals may not sum due to rounding.
REPORT ON
GOVERNMENT
SERVICES 2016
EMERGENCY MANAGEMENT
SECTOR OVERVIEW
PAGE 2 of TABLE DA.19
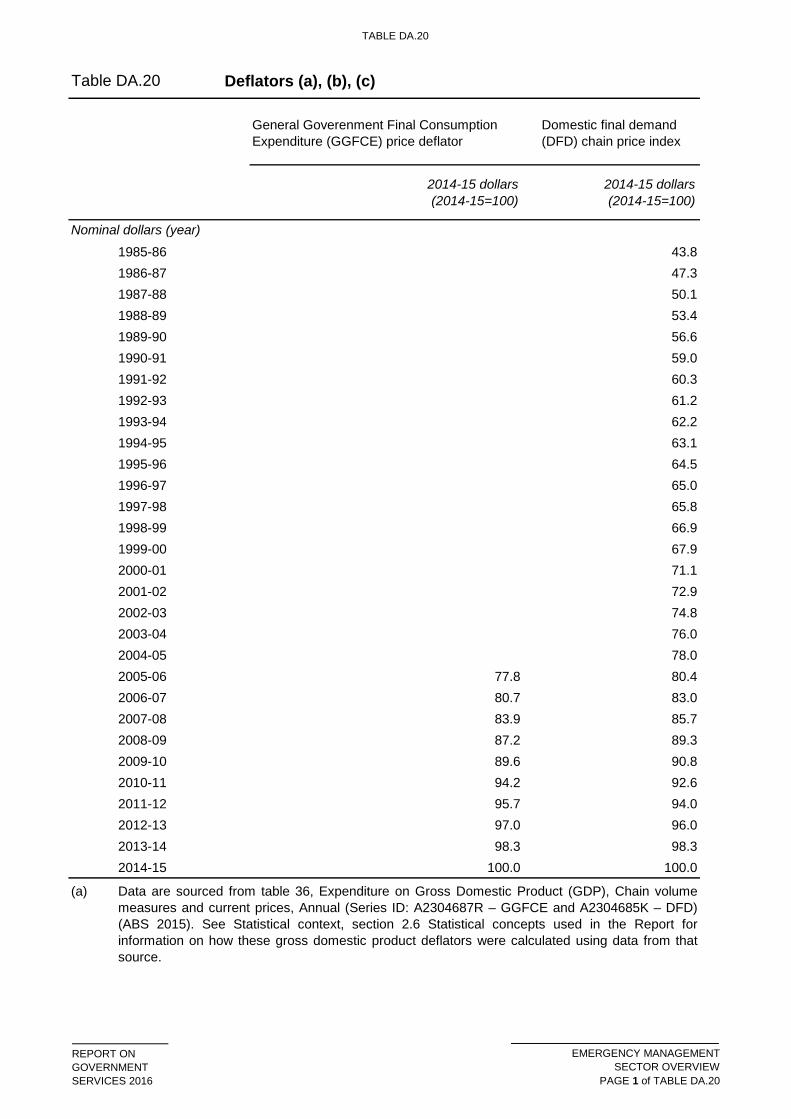
TABLE DA.20
Table DA.20
2014-15 dollars
(2014-15=100)
2014-15 dollars
(2014-15=100)
1985-86 43.8
1986-87 47.3
1987-88 50.1
1988-89 53.4
1989-90 56.6
1990-91 59.0
1991-92 60.3
1992-93 61.2
1993-94 62.2
1994-95 63.1
1995-96 64.5
1996-97 65.0
1997-98 65.8
1998-99 66.9
1999-00 67.9
2000-01 71.1
2001-02 72.9
2002-03 74.8
2003-04 76.0
2004-05 78.0
2005-06 77.8 80.4
2006-07 80.7 83.0
2007-08 83.9 85.7
2008-09 87.2 89.3
2009-10 89.6 90.8
2010-11 94.2 92.6
2011-12 95.7 94.0
2012-13 97.0 96.0
2013-14 98.3 98.3
2014-15 100.0 100.0
(a)
Deflators (a), (b), (c)
General Goverenment Final Consumption
Expenditure (GGFCE) price deflator
Domestic final demand
(DFD) chain price index
Nominal dollars (year)
Data are sourced from table 36, Expenditure on Gross Domestic Product (GDP), Chain volume
measures and current prices, Annual (Series ID: A2304687R – GGFCE and A2304685K – DFD)
(ABS 2015). See Statistical context, section 2.6 Statistical concepts used in the Report for
information on how these gross domestic product deflators were calculated using data from that
source.
REPORT ON
GOVERNMENT
SERVICES 2016
EMERGENCY MANAGEMENT
SECTOR OVERVIEW
PAGE 1 of TABLE DA.20

TABLE DA.20
Table DA.20
2014-15 dollars
(2014-15=100)
2014-15 dollars
(2014-15=100)
Deflators (a), (b), (c)
General Goverenment Final Consumption
Expenditure (GGFCE) price deflator
Domestic final demand
(DFD) chain price index
(b)
(c)
Source :
Estimates used to calculate the GGFCE Chain price indexes are subject to annual re-referencing
by the Australian Bureau of Statistics (ABS) and also reflect any revisions inherent in source data
which are aggregated up to the GGFCE level. These processes can cause volatility in deflator
values from year to year. In addition to changes caused by re-referencing and source data
revisions, starting from the 2013-14 deflator, the deflator in this table will differ in future reports due
to the introduction by the ABS of updated supply-use benchmarks, which will be backcast, causing
revisions throughout the time series.
To convert nominal dollars to real dollars, divide the amount in nominal dollars by the GGFCE
Chain price indexes for the applicable financial year and multiply by 100. For example: to convert
2005-06 dollars to 2014-15 dollars, divide by 77.8 and multiply by 100; to convert 2008-09 dollars
to 2013-14 dollars, divide by 88.7 and multiply by 100. For further information, see Statistical
context, table 2.2, p. 2.14.
Review calculations based on ABS (2015) Australian National Accounts: National Income,
Expenditure and Product, June 2015, Cat. no. 5206.0, Canberra.
REPORT ON
GOVERNMENT
SERVICES 2016
EMERGENCY MANAGEMENT
SECTOR OVERVIEW
PAGE 2 of TABLE DA.20

EMERGENCY MANAGEMENT DQI 1
Data quality information — Emergency management sector overview (sector overview D)
Data quality information Data quality information (DQI) provides information against the seven ABS data quality framework dimensions, for performance indicators and/or measures in the Emergency management sector overview.
Technical DQI has been supplied or agreed by relevant data providers. Additional Steering Committee commentary does not necessarily reflect the views of data providers.
CONTENTS
Community preparedness for emergency events 2
Deaths from emergency events 4
Total asset from emergency events 7

2 REPORT ON GOVERNMENT SERVICES 2016
Community preparedness for emergency events Data quality information for this indicator has been drafted by the Emergency Management Working Group in consultation with the Emergency Management Working Group (EMWG), with additional Steering Committee comments.
Indicator definition and description Element Emergency management sector performance indicator framework – Sector wide indicators
Indicator Total asset loss from emergency events
Measure (computation)
‘Proportion of Australians that have developed emergency plans for natural disasters’ is defined as the proportion of Australians that developed emergency plans (evacuations/meeting places) for natural disasters.
Data source Western, M., Mazerolle, L., & Boreham, P. (2012), National Security and Preparedness Survey 2011-2012. Brisbane: Institute for Social Science Research and the Australian Research Council Centre of Excellence in Policing and Security, The University of Queensland, 2012.
Data Quality Framework dimensions Institutional environment
The study is funded by: • the Australian Research Council Centre of Excellence in Policing and Security (CEPS)
— CEPS is a complex research enterprise consisting of multiple collaborating researchers, and university and partner organisations. CEPS is administered by Griffith University in Brisbane and operates across four University Nodes
• the University of Queensland — the study is led by researchers from the Institute for Social Science Research (ISSR) at the University of Queensland. ISSR is a division of The University of Queensland. The institute provides research and postgraduate research training for the social sciences.
• the Queensland Government.
In kind support to the study is provided by the University of Queensland, the Queensland Government, and the Australian Institute of Criminology.
Relevance Data are available nationally and by state and territory for the 2011-12 financial year.
The questionnaire covers a range of issues, including the following topics: • confidence and attitudes towards national security and policing measures • confidence and attitudes towards policing and national security agencies • relationships and interactions with national security and policing agencies • perceptions of personal security and national security • self-reported impact on individual behaviours • emergency preparedness • community resilience.
Timeliness The project gathered cross-sectional indicators of economic, social and cultural wellbeing to assess community perceptions of community preparedness, resilience, vulnerability and their attitudes to key policing and security policies, laws and programs. Future surveys will also collect panel and longitudinal information.
The National Security and Preparedness Survey (NSPS) began survey recruitment in November 2011 and concluded in May 2012.
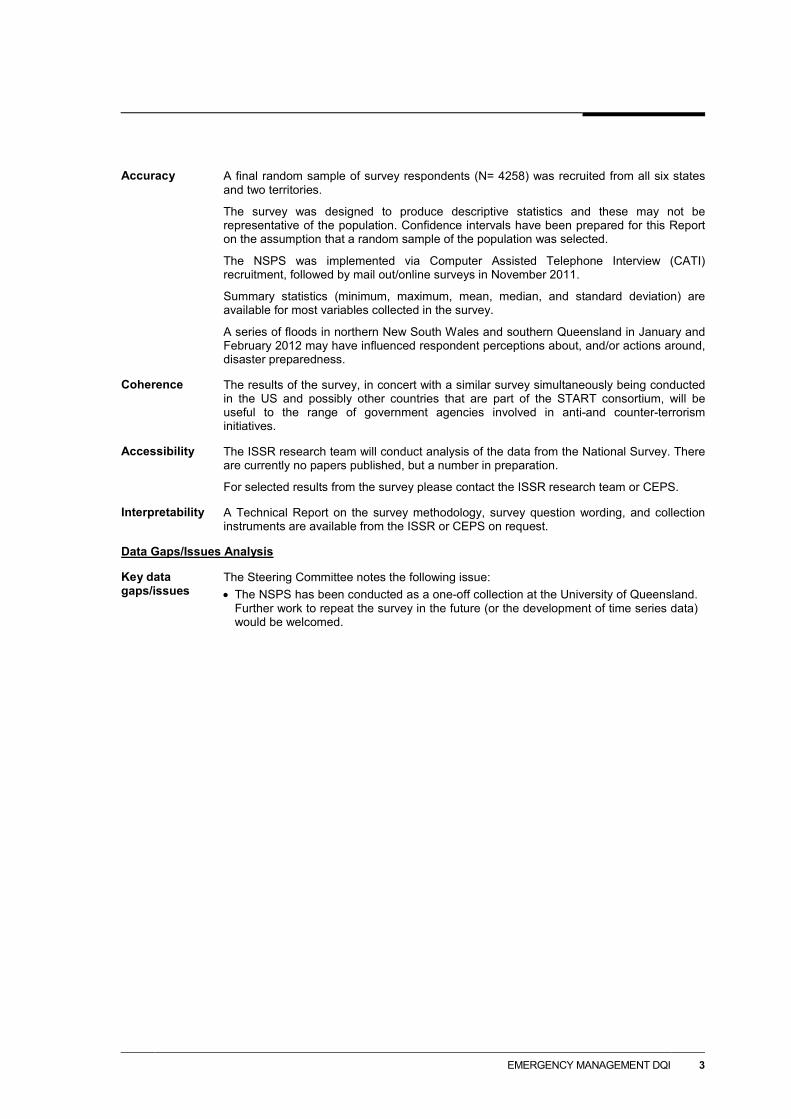
EMERGENCY MANAGEMENT DQI 3
Accuracy A final random sample of survey respondents (N= 4258) was recruited from all six states and two territories.
The survey was designed to produce descriptive statistics and these may not be representative of the population. Confidence intervals have been prepared for this Report on the assumption that a random sample of the population was selected.
The NSPS was implemented via Computer Assisted Telephone Interview (CATI) recruitment, followed by mail out/online surveys in November 2011.
Summary statistics (minimum, maximum, mean, median, and standard deviation) are available for most variables collected in the survey.
A series of floods in northern New South Wales and southern Queensland in January and February 2012 may have influenced respondent perceptions about, and/or actions around, disaster preparedness.
Coherence The results of the survey, in concert with a similar survey simultaneously being conducted in the US and possibly other countries that are part of the START consortium, will be useful to the range of government agencies involved in anti-and counter-terrorism initiatives.
Accessibility
The ISSR research team will conduct analysis of the data from the National Survey. There are currently no papers published, but a number in preparation.
For selected results from the survey please contact the ISSR research team or CEPS.
Interpretability A Technical Report on the survey methodology, survey question wording, and collection instruments are available from the ISSR or CEPS on request.
Data Gaps/Issues Analysis
Key data gaps/issues
The Steering Committee notes the following issue: • The NSPS has been conducted as a one-off collection at the University of Queensland.
Further work to repeat the survey in the future (or the development of time series data) would be welcomed.

4 REPORT ON GOVERNMENT SERVICES 2016
Deaths from emergency events Data quality information for this indicator has been drafted by the Secretariat in consultation with the ABS, with additional Steering Committee comments. Indicator definition and description
Element Emergency management sector performance indicator framework – Sector wide indicators
Indicator Deaths from emergency events
Measure/s (computation)
Deaths from emergency events’ is defined as the number of deaths per calendar year in three categories: • Road traffic deaths — deaths primarily caused by accidents involving transport
vehicles (mainly cars) • Fire deaths — deaths primarily caused by exposure to smoke, fire or flames • Deaths from exposure to forces of nature — deaths primarily caused by exposure to
forces of nature, such as natural disasters, or extreme climatic or weather conditions.
Numerator/s The following International Classification of Diseases (ICD) codes are aggregated to define the data set: • Road traffic deaths — include ICD codes Road traffic accidents
(V01–V79), Intentional self-harm by crashing of motor vehicle (X82), Assault by crashing of motor vehicle (Y03), and Crashing of motor vehicle, undetermined intent (Y32).
• Fire deaths — include ICD codes Exposure to smoke, fire and flames (X00–X09), Intentional self-harm by smoke, fire and flames (X76), Assault by smoke, fire and flames (X97), and Exposure to smoke, fire and flames, undetermined intent (Y26).
• Deaths from exposure to forces of nature — includes ICD codes Exposure to excessive natural heat (X30), Exposure to excessive natural cold (X31), Exposure to sunlight (X32), Victim of lightning (X33), Victim of earthquake (X34), Victim of volcanic eruption (X35), Victim of avalanche, landslide and other earth movements (X36), Victim of cataclysmic storm (X37), Victim of flood (X38), and Exposure to other and unspecified forces of nature (X39).
Denominator Population by State and Territory and Australian total
The measure is expressed by State and Territory and Australian total, by ICD code detail and total, as an annual, and a three year rolling weighted average rate per million people.
Data source/s Numerator ABS Causes of Death, Australia, Cat. no. 3303.0 (Underlying causes of death, State and Territory tables, published and unpublished data).
Denominator ABS Estimated Residential Population, Cat. no. 3101.0 (for more detail about the population data used in the Report see RoGS Statistical context (chapter 2)).
Data Quality Framework Dimensions
Institutional environment
The Causes of Death collection is published by the Australian Bureau of Statistics (ABS), with data sourced from deaths registrations administered by the various State and Territory Registrars of Births, Deaths and Marriages. It is a legal requirement of each State and Territory that all deaths are registered.
The ABS operates within a framework of the Census and Statistics Act 1905 and the Australian Bureau of Statistics Act 1975. These Acts ensure the confidentiality of respondents and ABS’ independence and impartiality from political influence. For more information on the institutional environment of the ABS, including the legislative obligations of the ABS, financing and governance arrangements, and mechanisms for scrutiny of ABS operations, please see ABS Institutional Environment.

EMERGENCY MANAGEMENT DQI 5
Relevance The ABS Causes of Death collection includes all deaths that occurred and were registered in Australia, including deaths of persons whose usual residence is overseas. Deaths of Australian residents that occurred outside Australia may be registered by individual Registrars, but are not included in ABS deaths or causes of death statistics.
Data in the Causes of Death collection include demographic items, as well as Causes of Death information coded according to the International Classification of Diseases (ICD). The ICD is the international standard classification for epidemiological purposes and is designed to promote international comparability in the collection, processing, classification, and presentation of cause of death statistics. The classification is used to classify diseases and causes of disease or injury as recorded on many types of medical records as well as death records. The ICD has been revised periodically to incorporate changes in the medical field. The 10th revision of ICD (ICD-10) has been used since 1997.
Timeliness Causes of Death data are published on an annual basis.
Death records are provided electronically to the ABS by individual Registrars on a monthly basis for compilation into aggregate statistics on a quarterly and annual basis. One dimension of timeliness in death registrations data is the interval between the occurrence and registration of a death. As a result, a small number of deaths occurring in one year are not registered until the following year or later.
Preliminary Estimated Residential Population (ERP) data are compiled and published quarterly and are generally made available five to six months after the end of each reference quarter. Commencing with data for September quarter 2006, revised estimates are released annually and made available 21 months after the end of the reference period for the previous financial year, once more accurate births, deaths and net overseas migration data becomes available. In the case of births and deaths, the revised data are compiled on a date of occurrence basis. In the case of net overseas migration, final data are based on actual traveller behaviour. Final estimates are made available every 5 years after a census and revisions are made to the previous inter-censal period. ERP data are not changed once finalised. Releasing preliminary, revised and final ERP involves a balance between timeliness and accuracy.
Accuracy All ERP data sources are subject to non-sampling error. Non-sampling error can arise from inaccuracies in collecting, recording and processing the data. In the case of Census and Post Enumeration Survey (PES) data, every effort is made to minimise reporting error by the careful design of questionnaires, intensive training and supervision of interviewers, and efficient data processing procedures.
For the Causes of Death collection, which constitutes a complete census of the population, non-sample errors are most likely to influence accuracy. Non-sample error arises from inaccuracies in collecting, recording and processing the data. The most significant of these errors are: misreported data items; deficiencies in coverage; incomplete records; and processing errors. Every effort is made to minimise non-sample error by working closely with data providers, running quality checks throughout the data processing cycle, training of processing staff, and efficient data processing procedures.
The ABS has implemented a new revisions process that applies to all coroner certified deaths registered after 1 January 2006. This is a change from previous years where all ABS processing of causes of death data for a particular reference period was finalised approximately 13 months after the end of the reference period. The revisions process enables the use of additional information relating to coroner certified deaths as it becomes available over time, resulting in increased specificity of the assigned ICD-10 codes. See Explanatory Notes 29-33 and Technical Notes, Causes of Death Revisions, 2006 in Causes of Death, Australia, 2010 (cat. no. 3303.0) and Causes of Death Revisions, 2010 and 2011 in Causes of Death, Australia, 2012 (cat. no. 3303.0), for further information on the revision process.
Some rates are unreliable due to small numbers of deaths over the reference period. All rates in this indicator must be used with caution.
Coherence The ABS provide source data for the numerator and denominator for this indicator.
The number of road traffic deaths provided in Causes of Death (ABS Cat. no. 3303.0) is different to the number of ‘Road fatalities’ presented in Police services (chapter 6). The ABS source their data from death registrations recorded by the State and Territory

6 REPORT ON GOVERNMENT SERVICES 2016
Registrars of Births, Deaths and Marriages (where each death must be certified by either a doctor using the Medical Certificate of Cause of Death, or by a coroner). ‘Road fatalities’ in chapter 6 provides more recent data sourced by the Australian Road Deaths Databases reported by the police each month to the State and Territory road safety authorities.
Accessibility Causes of Death data are available in a variety of formats on the ABS website, www.abs.gov.au, under Causes of Death, Australia (Cat. no 3303.0).
ERP data are available in a variety of formats on the ABS website, www.abs.gov.au, under the 3101.0 and 3201.0 product families.
Further information on deaths and mortality may be available on request. The ABS observes strict confidentiality protocols as required by the Census and Statistics Act (1905). This may restrict access to data at a very detailed level.
Interpretability Data for this indicator are presented as crude rates, per million estimated resident population, and as three year rolling averages due to volatility of the small numbers involved.
Information on how to interpret and use the cause of death data is available from the Explanatory Notes in Causes of Death, Australia (Cat. no 3303.0).
Small value data are randomly adjusted to avoid the release of confidential data.
Causes of death statistics for states and territories have been compiled in respect of the state or territory of usual residence of the deceased, regardless of where in Australia the death occurred and was registered.
The ERP is Australia’s population reported by state and territory and by place of usual residence.
Data Gaps/Issues Analysis
Key data gaps /issues
The Steering Committee notes the following key data gaps/issues: • Timeliness — data available for the Report on Government Services are delayed by
one reference year. This is due to a tradeoff between accuracy and timeliness. • Volatility — due to the small numbers of emergency event deaths annually, there is a
high level of volatility in reported indicator rates. It is important therefore to assess longer term trends where data are available.

EMERGENCY MANAGEMENT DQI 7
Total asset loss from emergency events Data quality information for this indicator has been drafted by the Secretariat in consultation with the Australian Government, with additional Steering Committee comments.
Indicator definition and description
Element Emergency management sector performance indicator framework – Sector wide indicators
Indicator Total asset loss from emergency events
Measure/s (computation)
Insured losses from disaster events
‘Insured losses from disaster events’ data are defined as the insured asset losses incurred by the community following disaster event.
Estimates of asset losses are derived from the submissions of general insurance companies following large events incurring cost to the community and insurers.
To be included as a disaster event, natural, technological and human-caused events must meet at least one of the following criteria: • three or more deaths • 20 injuries or illnesses • significant damage to property, infrastructure, agriculture or the environment; or
disruption to essential services, commerce or industry; or trauma or dislocation of the community at an estimated total cost of $10 million or more at the time the event occurred.
For the Report on Government Services the following event types are in scope: • Bushfire • Cyclone • Earthquake • Environmental • Flood • Hail
• Landslide • Severe Storm • Tornado • Tsunami • Urban fire.
Deflator
Time series financial data are adjusted to real dollars using the General Government Final Consumption Expenditure (GGFCE) chain price deflator.
Data source/s Numerator
Australian Government 2013, Australian Emergency Management: Knowledge Hub, maintained by the Australian Emergency Management Institute, http://www.emknowledge.gov.au (accessed 23 April 2013
Denominator
ABS 2013, Australian National Accounts: National Income, Expenditure and Product, June 2013, Cat. no. 5206.0
Data Quality Framework Dimensions
Institutional environment
Data Collector: Insurance Council of Australia (ICA)
Collection authority: Data are derived from the submissions of ICA member general insurance companies following large events incurring cost to the community and insurers.
The Insurance Council of Australia is the representative body of the general insurance industry in Australia. Its members represent more than 90 per cent of total premium income written by private sector general insurers.
Data Compiler: The Australian Emergency Management Institute (AEMI)
The AEMI hosts the Australian Emergency Management Knowledge Hub. The Knowledge Hub provides research, resources and news relevant to emergency

8 REPORT ON GOVERNMENT SERVICES 2016
management and includes statistics and information, photos, video and media about past disaster events.
The AEMI is a centre of excellence for knowledge and skills development in the national emergency management sector. As a part of the Attorney-General’s Department, AEMI provides a range of education, training, professional development, information, research and community awareness services to the nation and our region.
Relevance Data topic: Estimates of asset losses are derived from the submissions of general insurance companies following large events incurring cost to the community and insurers.
Level of geography: The incurred cost of claims is available for each declared emergency event can be coded to state/territory locations.
Key Data Items: The incurred cost of claims is available for each declared emergency event by disaster/event type, Catastrophe Number (if declared), date, location, state, original cost and normalised cost.
Additional information: Value of asset loss is a measure of the economic cost of emergency events. The prevention/mitigation, preparedness, and response activities of government contribute to reduce the value of total asset loss from emergency events. A low or decreasing value of total asset loss from emergency events is desirable.
Timeliness Data collected: Data are available for individual emergency events, allowing for the creation of financial year and/or calendar year data.
Data available: Reports are available approximately four months after the reference period.
Additional information: The final loss figure for an event can take many years to resolve.
Accuracy The asset loss data do not represent the entire cost of the event, it is only an approximation of the insured loss based upon reported data. • The final loss figure for an event can take many years to resolve. • Events are only recorded where there is a potential for the insured loss to exceed
$10 million. Many large single losses occur on a day to day basis in Australia that are not part of a larger catastrophe event.
• Other costs not taken into account include: – the losses of insurance companies that are not a member of the Insurance
Council. – costs incurred by emergency services; local, State, Territory and Commonwealth
governments; non-government organisations; and by local governments during clean-up
– remedial and environmental damage costs (including pollution of foreshores and riverbanks and beach erosion)
– costs associated with community dislocation – costs associated with job losses – costs associated with rehabilitation/recovery – medical and funeral costs associated with injuries and deaths.
Coherence Insurance companies must adhere to common accounting practices for insurance companies, and provide data according to an agreed classification system.
Accessibility The Attorney-General’s Department aims to make information on the Knowledge Hub website accessible to all users. Data are available in a variety of formats on the website, www.emknowledge.gov.au.
Interpretability Insurance Statistics Australia publishes an Operations Guidebook, which documents the key collection processes, standards and classifications. The guidebook is available at: • http://www.insurancestats.com.au/objectives.html
Data Gaps/Issues Analysis
Key data gaps /issues
The Steering Committee notes the following key data gaps/issues: • Volatility — due to the sporadic nature of emergency events, there is a high level of
volatility in reported asset loss data. It is important therefore to assess longer term trends where data are available.