Embed Size (px)
Citation preview
DEBT SUSTAINABILITYMYTHS AND FALLACIES
VARDAN ARAMYAN
DEPUTY MINISTER OF FINANCE
ARMENIA
MINISTRY OF FINANCE
2013
1
OUTLINE
1. Stylized Facts2. Debt Dynamics3. Debt Sustainability Analysis (DSA)4. Concluding Remark
2
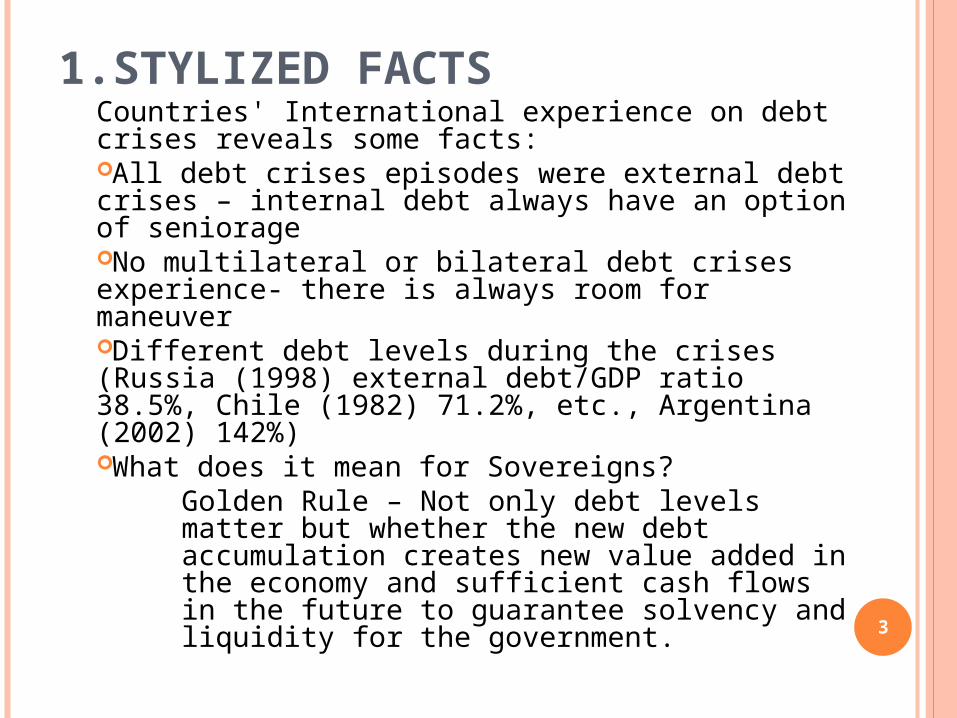
1. STYLIZED FACTSCountries' International experience on debt crises reveals some facts:All debt crises episodes were external debt crises – internal debt always have an option of seniorageNo multilateral or bilateral debt crises experience- there is always room for maneuverDifferent debt levels during the crises (Russia (1998) external debt/GDP ratio 38.5%, Chile (1982) 71.2%, etc., Argentina (2002) 142%) What does it mean for Sovereigns?
Golden Rule – Not only debt levels matter but whether the new debt accumulation creates new value added in the economy and sufficient cash flows in the future to guarantee solvency and liquidity for the government.
3
DEBT DYNAMICS
4
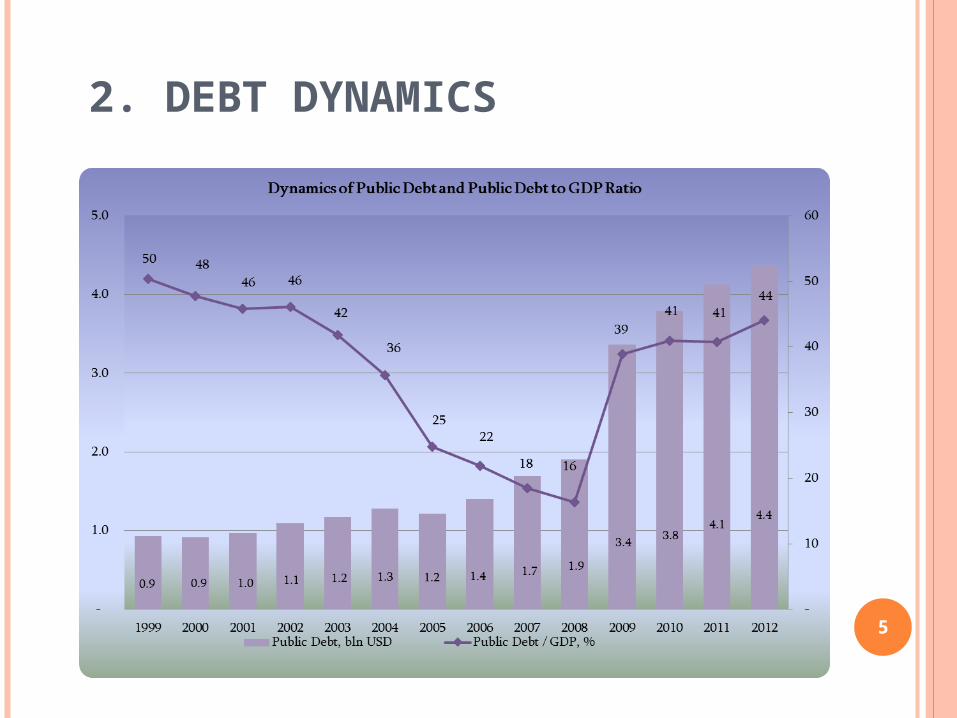
2. DEBT DYNAMICS
5
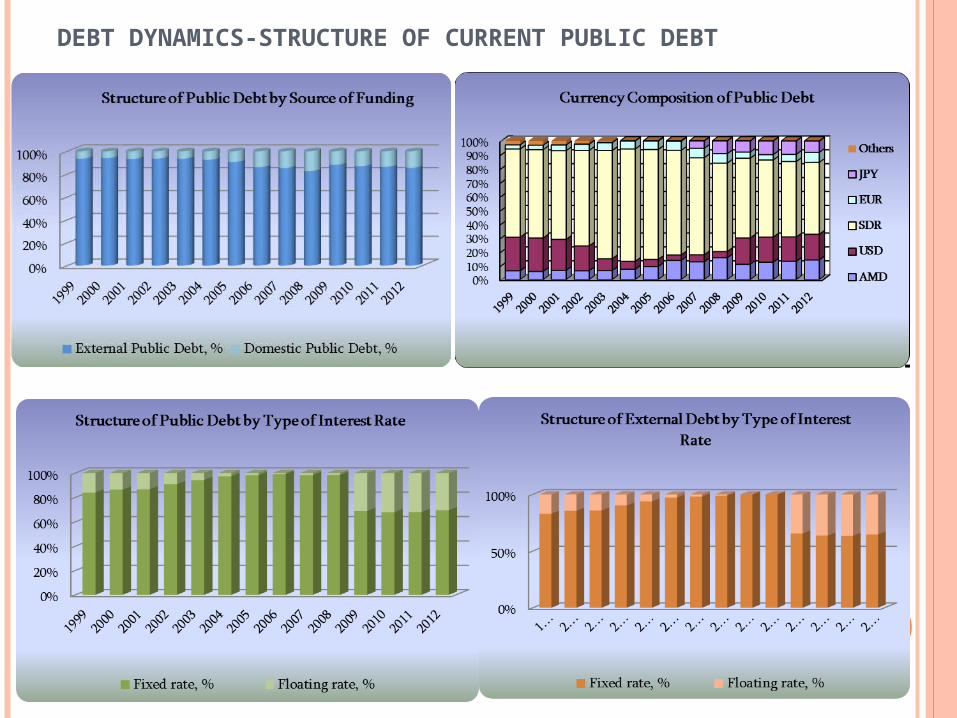
DEBT DYNAMICS-STRUCTURE OF CURRENT PUBLIC DEBT
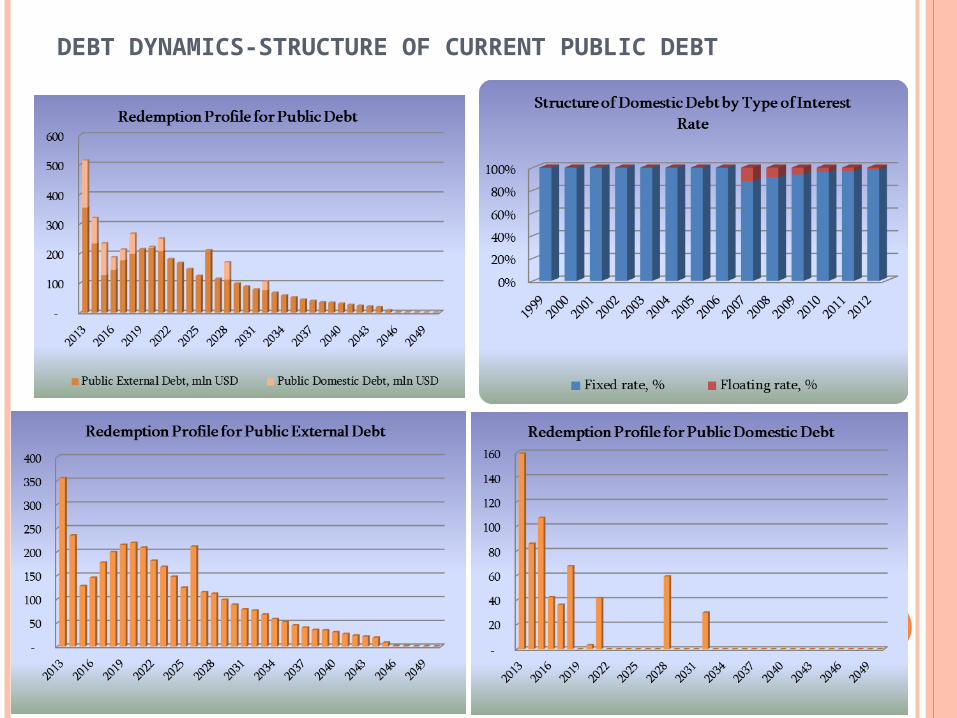
DEBT DYNAMICS-STRUCTURE OF CURRENT PUBLIC DEBT
DSA FRAMEWORK
8
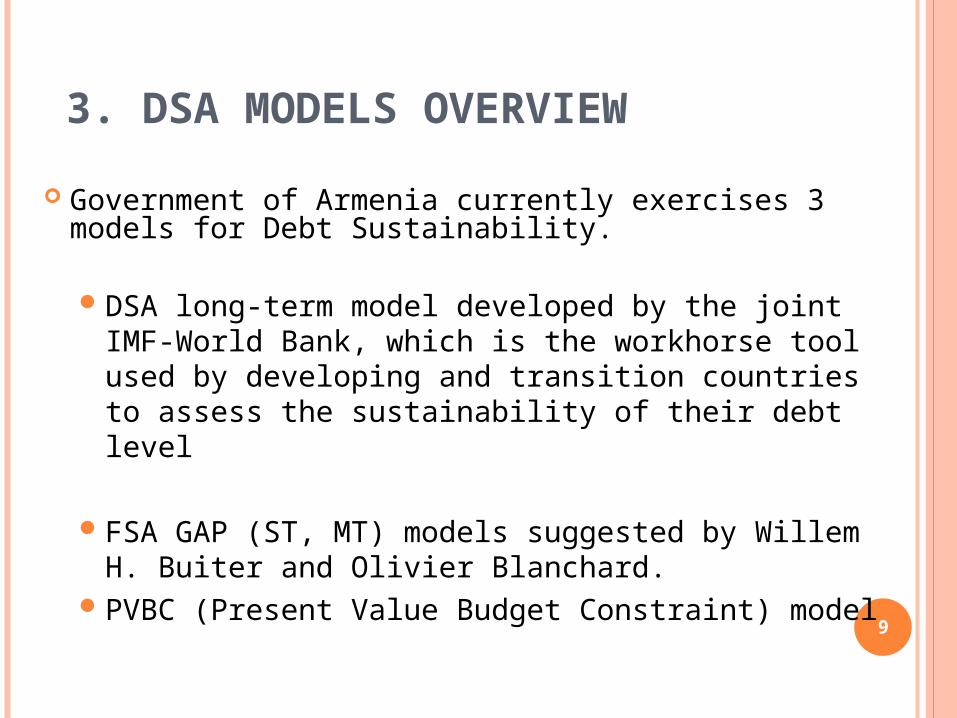
3. DSA MODELS OVERVIEW
Government of Armenia currently exercises 3 models for Debt Sustainability.
DSA long-term model developed by the joint IMF-World Bank, which is the workhorse tool used by developing and transition countries to assess the sustainability of their debt level
FSA GAP (ST, MT) models suggested by Willem H. Buiter and Olivier Blanchard.
PVBC (Present Value Budget Constraint) model9
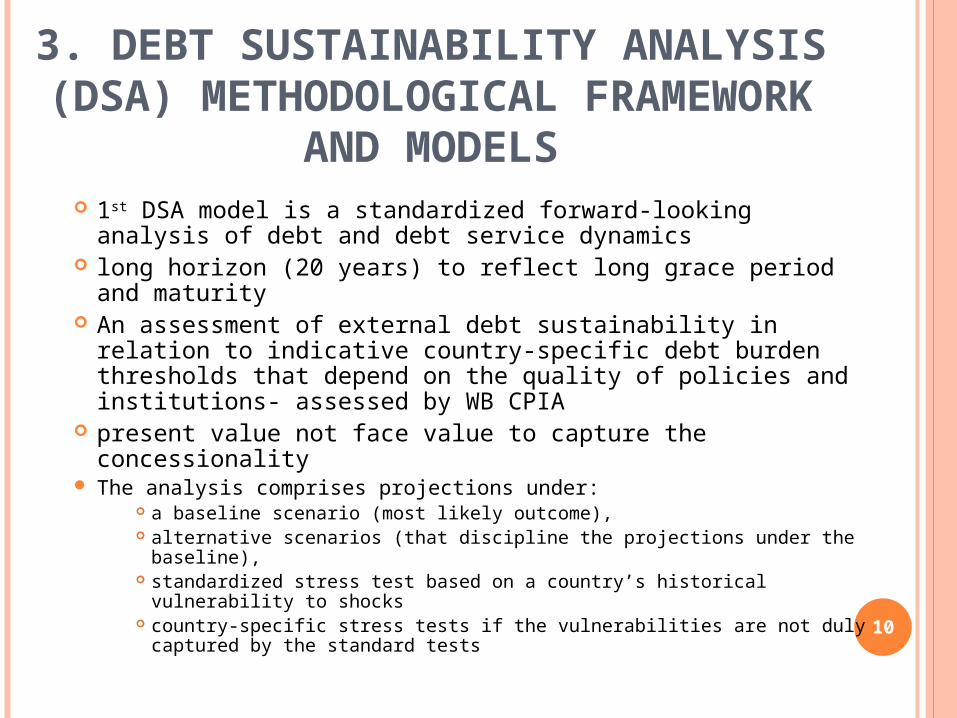
3. DEBT SUSTAINABILITY ANALYSIS (DSA) METHODOLOGICAL FRAMEWORK AND
MODELS 1st DSA model is a standardized forward-looking analysis of debt
and debt service dynamics long horizon (20 years) to reflect long grace period and maturity An assessment of external debt sustainability in relation to
indicative country-specific debt burden thresholds that depend on the quality of policies and institutions- assessed by WB CPIA
present value not face value to capture the concessionality The analysis comprises projections under:
a baseline scenario (most likely outcome), alternative scenarios (that discipline the projections under the baseline), standardized stress test based on a country’s historical vulnerability to
shocks country-specific stress tests if the vulnerabilities are not duly captured by
the standard tests 10
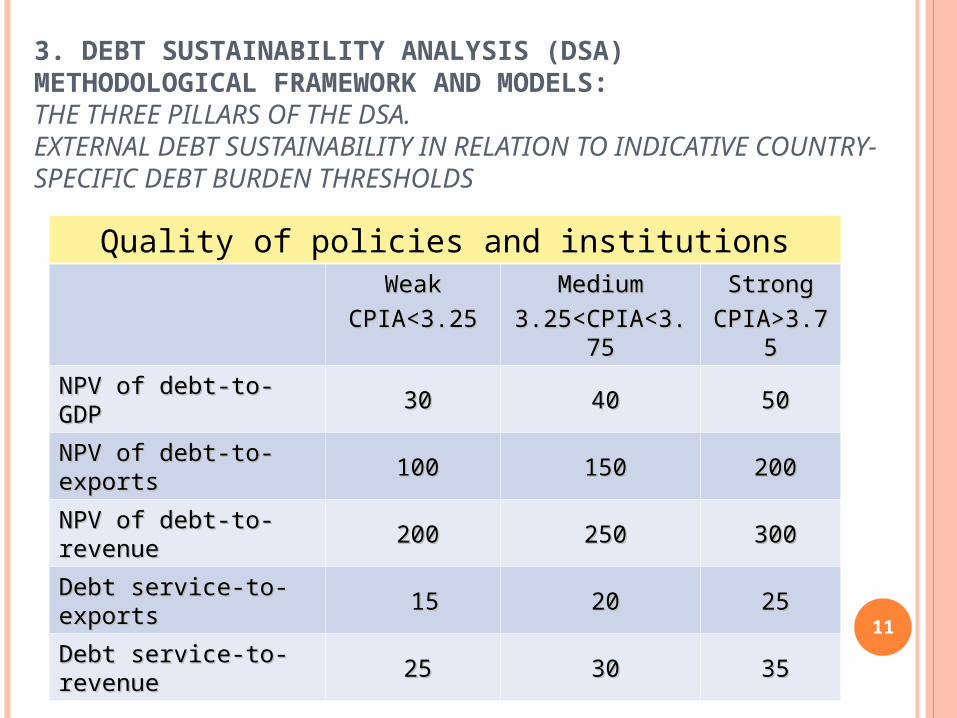
3. DEBT SUSTAINABILITY ANALYSIS (DSA) METHODOLOGICAL FRAMEWORK AND MODELS: THE THREE PILLARS OF THE DSA. EXTERNAL DEBT SUSTAINABILITY IN RELATION TO INDICATIVE COUNTRY-SPECIFIC DEBT BURDEN THRESHOLDS
Quality of policies and institutionsWeakWeak
CPIA<3.25CPIA<3.25MediumMedium
3.25<CPIA<3.753.25<CPIA<3.75StrongStrong
CPIA>3.75CPIA>3.75
NPV of debt-to-GDPNPV of debt-to-GDP 3030 4040 5050
NPV of debt-to-exportsNPV of debt-to-exports 100100 150150 200200
NPV of debt-to-revenue NPV of debt-to-revenue 200200 250250 300300
Debt service-to-exportsDebt service-to-exports 1515 2020 2525
Debt service-to-revenueDebt service-to-revenue 2525 3030 3535
11
3. DEBT SUSTAINABILITY ANALYSIS (DSA) METHODOLOGICAL FRAMEWORK AND MODELS
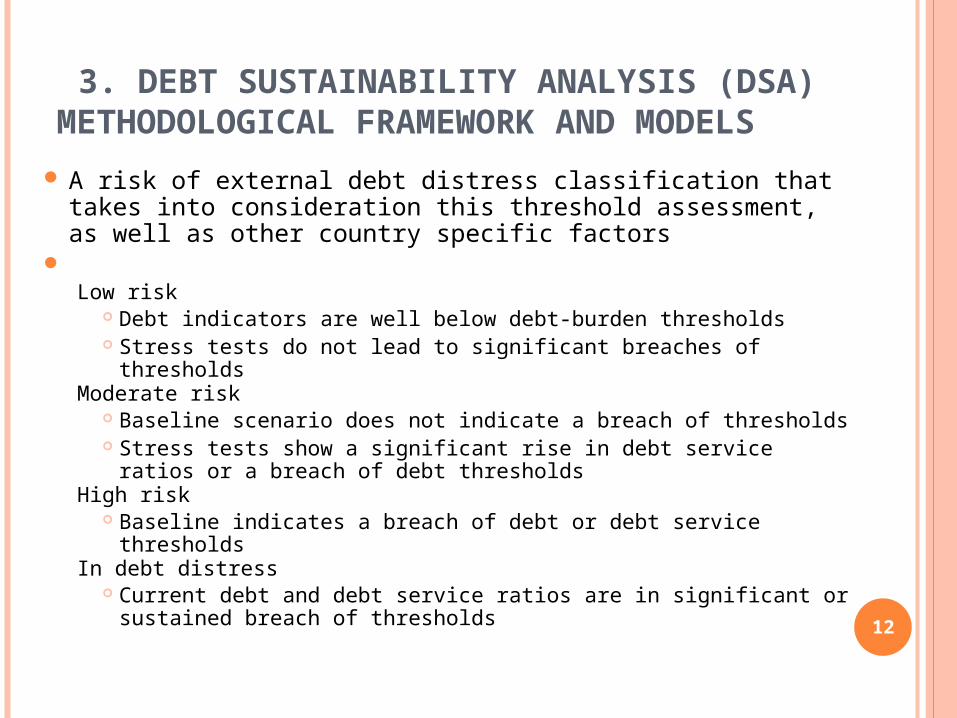
A risk of external debt distress classification that takes into consideration this threshold assessment, as well as other country specific factors
Low risk
Debt indicators are well below debt-burden thresholds Stress tests do not lead to significant breaches of thresholds
Moderate risk Baseline scenario does not indicate a breach of thresholds Stress tests show a significant rise in debt service ratios or a breach of
debt thresholdsHigh risk
Baseline indicates a breach of debt or debt service thresholdsIn debt distress
Current debt and debt service ratios are in significant or sustained breach of thresholds 12
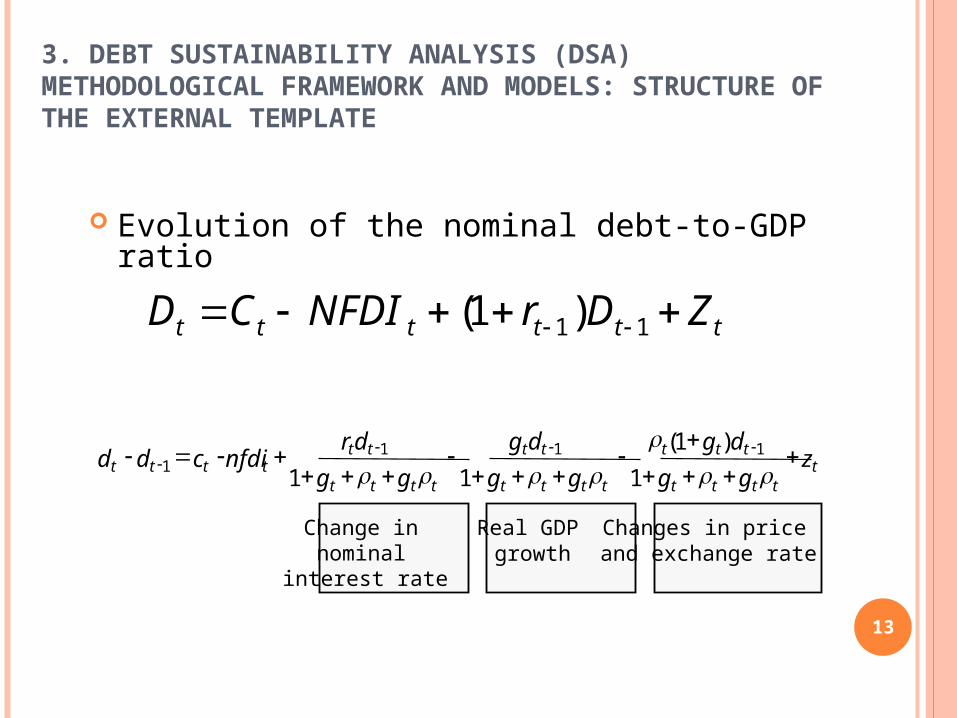
3. DEBT SUSTAINABILITY ANALYSIS (DSA) METHODOLOGICAL FRAMEWORK AND MODELS: STRUCTURE OF THE EXTERNAL TEMPLATE
Evolution of the nominal debt-to-GDP ratio
ttttt
ttt
tttt
tt
tttt
tttttt z
gg
dg
gg
dg
gg
drnfdicdd
1
)1(
11111
1
Change in nominal
interest rate
Real GDP growth
Changes in price and exchange rate
tttttt ZDrNFDICD 11)1(
13
3. DEBT SUSTAINABILITY ANALYSIS (DSA) METHODOLOGICAL FRAMEWORK AND MODELS:
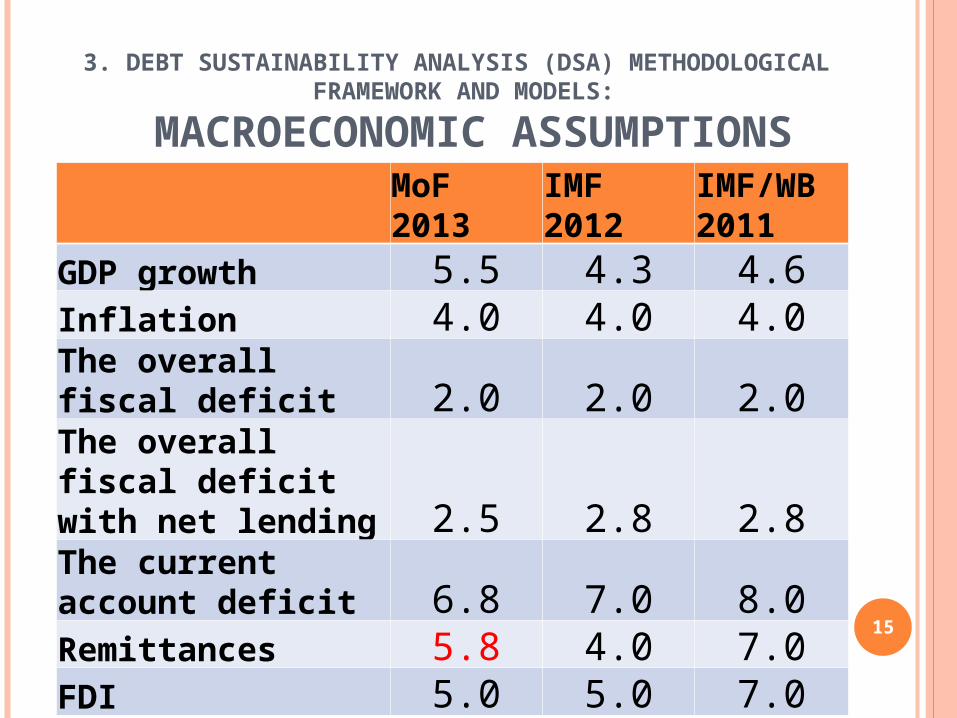
MACROECONOMIC ASSUMPTIONS
MoF 2013 IMF 2012IMF/WB 2011
GDP growth 5.5 4.3 4.6Inflation 4.0 4.0 4.0The overall fiscal deficit 2.0 2.0 2.0The overall fiscal deficit with net lending 2.5 2.8 2.8The current account deficit 6.8 7.0 8.0Remittances 5.8 4.0 7.0FDI 5.0 5.0 7.0 15
16
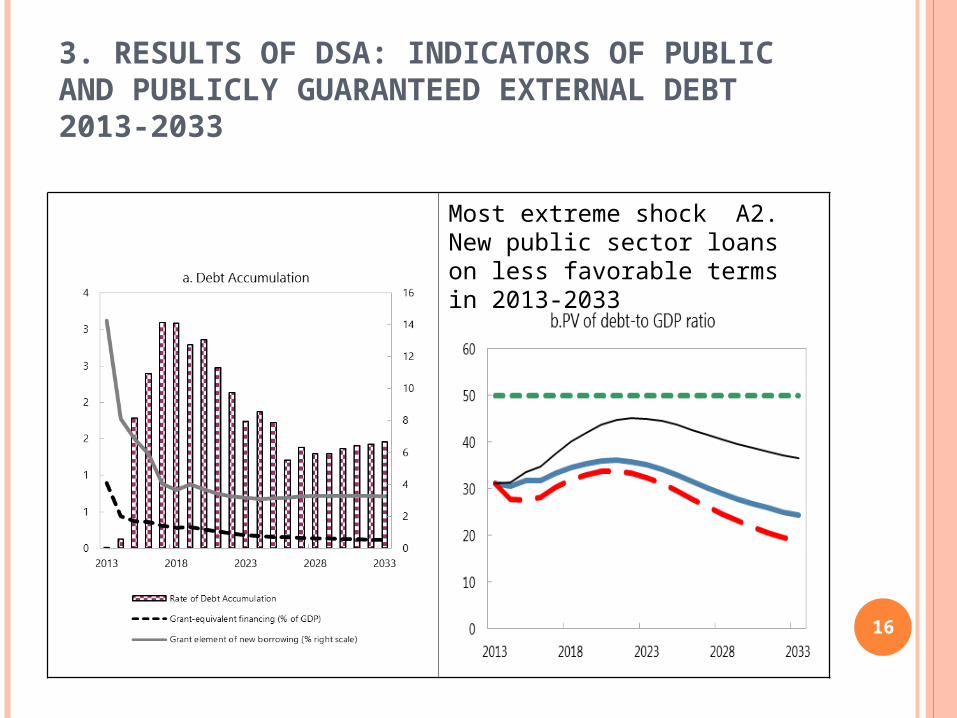
3. RESULTS OF DSA: INDICATORS OF PUBLIC AND PUBLICLY GUARANTEED EXTERNAL DEBT 2013-2033
Most extreme shock A2. New public sector loans on less favorable terms in 2013-2033
17
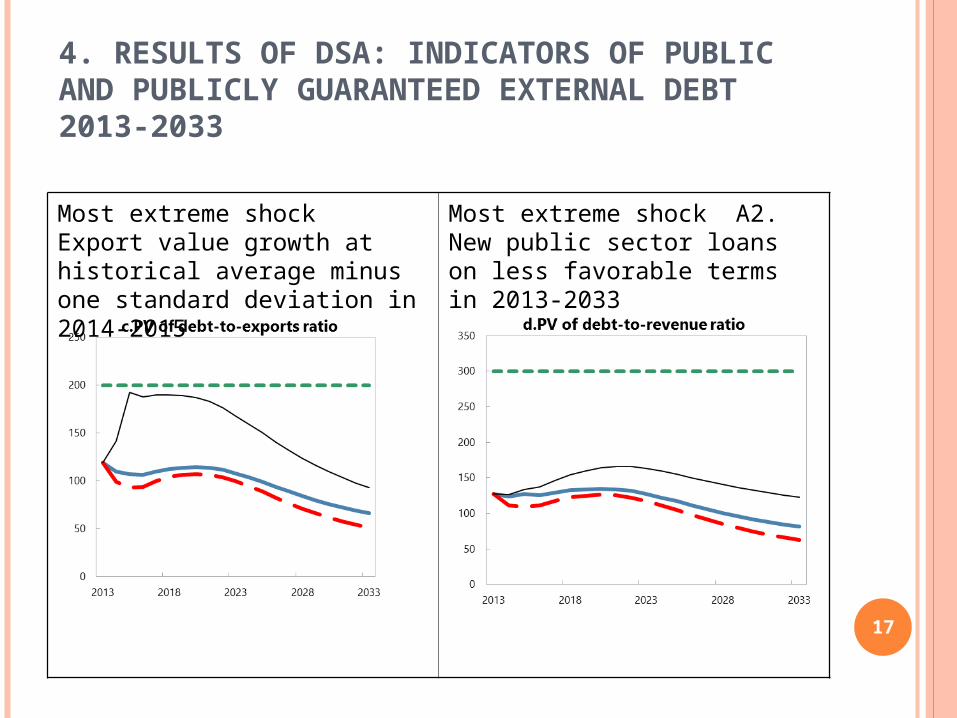
4. RESULTS OF DSA: INDICATORS OF PUBLIC AND PUBLICLY GUARANTEED EXTERNAL DEBT 2013-2033
Most extreme shock Export value growth at historical average minus one standard deviation in 2014-2015
Most extreme shock A2. New public sector loans on less favorable terms in 2013-2033
18
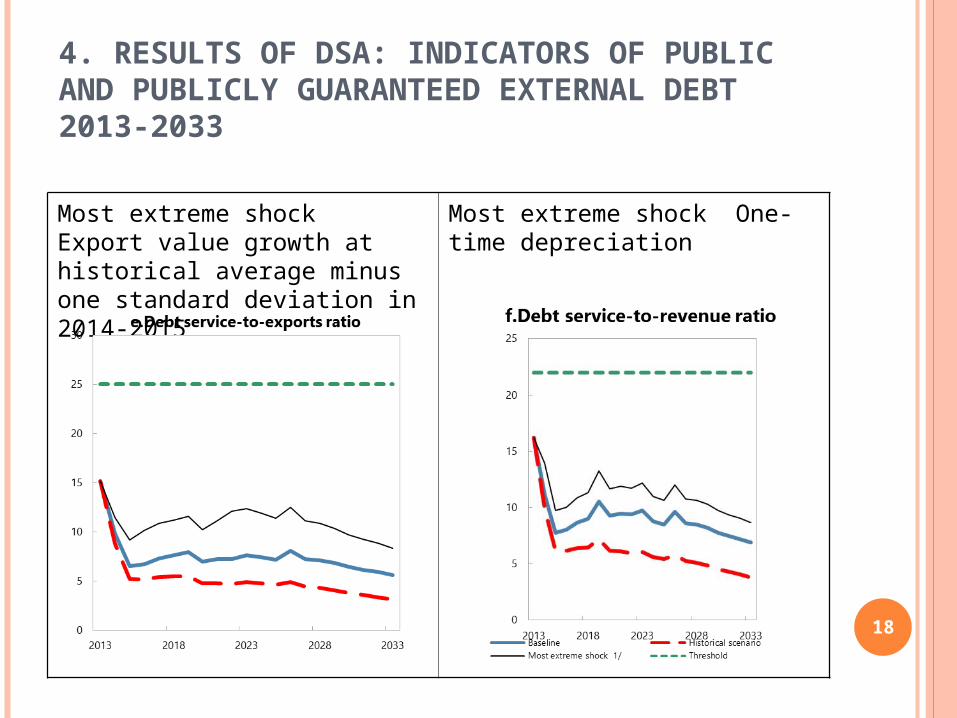
4. RESULTS OF DSA: INDICATORS OF PUBLIC AND PUBLICLY GUARANTEED EXTERNAL DEBT 2013-2033
Most extreme shock Export value growth at historical average minus one standard deviation in 2014-2015
Most extreme shock One-time depreciation
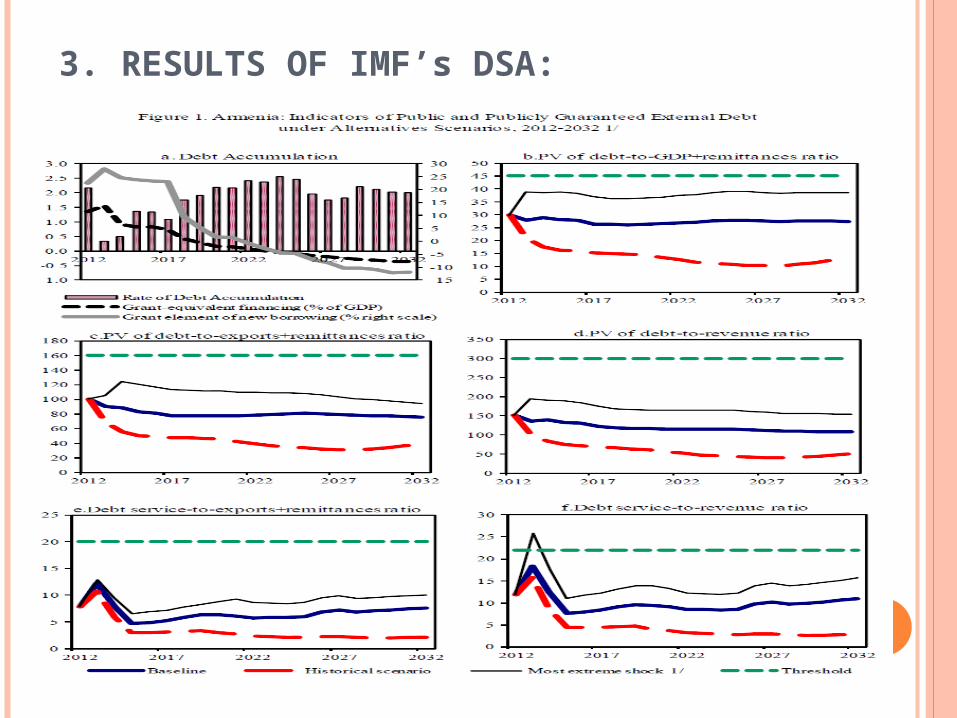
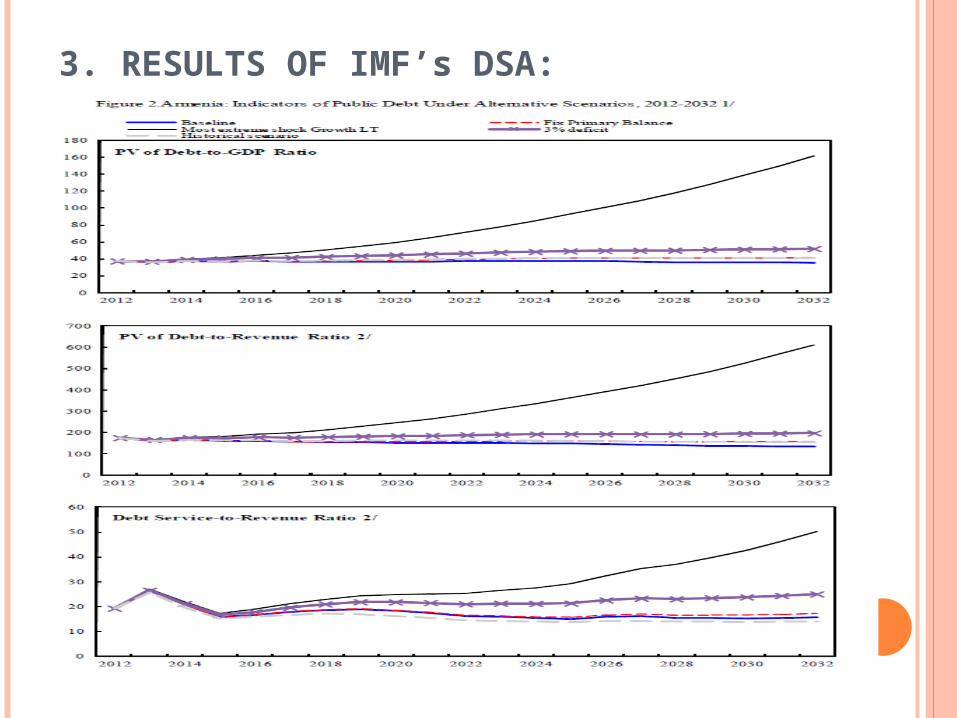
3. RESULTS OF IMF’s DSA:
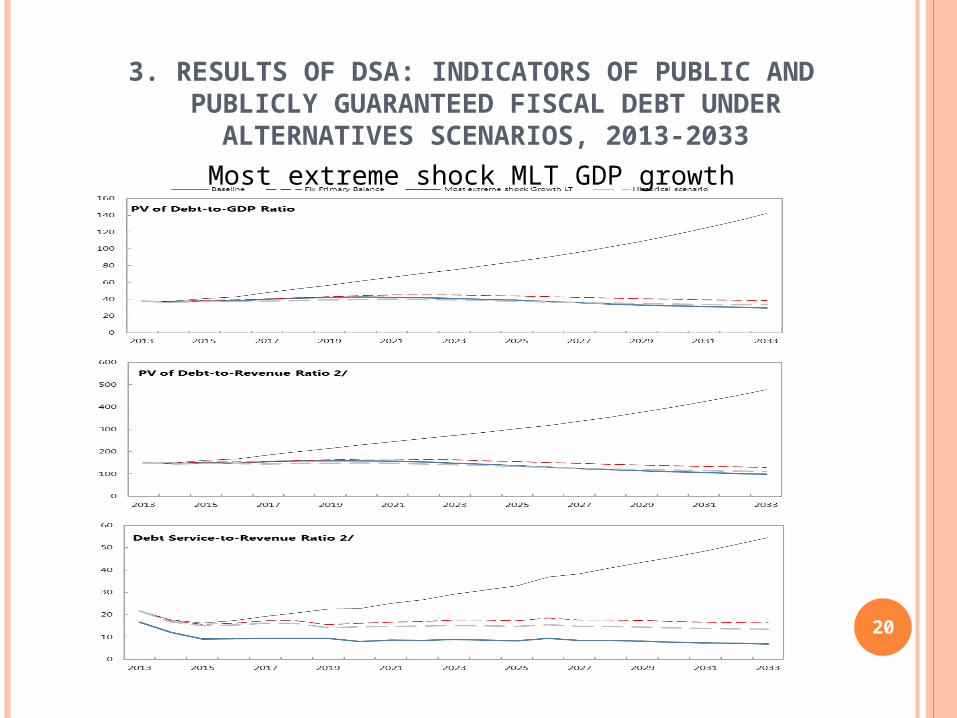
3. RESULTS OF DSA: INDICATORS OF PUBLIC AND PUBLICLY GUARANTEED FISCAL DEBT UNDER ALTERNATIVES
SCENARIOS, 2013-2033
Most extreme shock MLT GDP growth
20
3. RESULTS OF IMF’s DSA:
3. RESULTS OF DSA
Based on the model 1 DSA, Armenia is assessed to be at a low risk of debt distress, with all indicators below the country specific indicative thresholds under the baseline scenario. The public sector DSA suggests sustainability.
Armenia is considered at low level of debt distress, based on external debt burden indicators. The public sector DSA suggests that Armenia’s overall public sector debt dynamics are sustainable in light of the current size of the debt stock.
22
3. RESULTS OF DSA: (CONTINUED)
External sustainability analyses highlight for PV of debt-to-GDP ratio and PV of debt-to-revenue ratios the most extreme shock is under less favorable terms of new public sector loans.
Fiscal sustainability analyses highlight for all fiscal sustainability the most extreme shock is permanently lower GDP growth.
-IMF WB findings coincide with MOF findings (better revenue performance, 30% depreciation most extreme scenario for debt to GDP ratio….) 23
FISCAL SUSTAINABILITY MODELS (2 AND 3)
24
FISCAL SUSTAINABILITY
“Fiscal sustainability is defined as non increasing debt-to-GDP ratio. The models calculate primary deficit and/or
tax revenues needed to keep debt-to-GDP ratio constant /stabilize/”
Primary GapTax (Revenue) GapPVBC –Present Value Budget Constrain
25
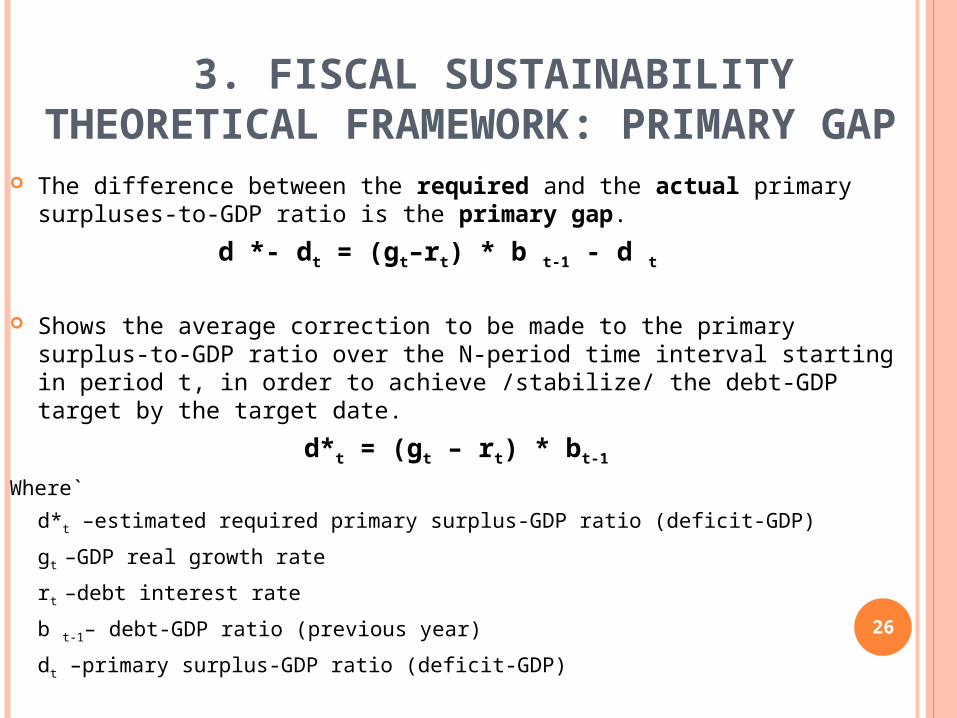
3. FISCAL SUSTAINABILITY THEORETICAL FRAMEWORK: PRIMARY
GAP The difference between the required and the actual primary surpluses-to-GDP ratio is
the primary gap.
d *- dt = (gt–rt) * b t-1 - d t
Shows the average correction to be made to the primary surplus-to-GDP ratio over the N-period time interval starting in period t, in order to achieve /stabilize/ the debt-GDP target by the target date.
d*t = (gt – rt) * bt-1
Where`
d*t –estimated required primary surplus-GDP ratio (deficit-GDP)
gt –GDP real growth rate
rt –debt interest rate
b t-1– debt-GDP ratio (previous year)
dt –primary surplus-GDP ratio (deficit-GDP)
26
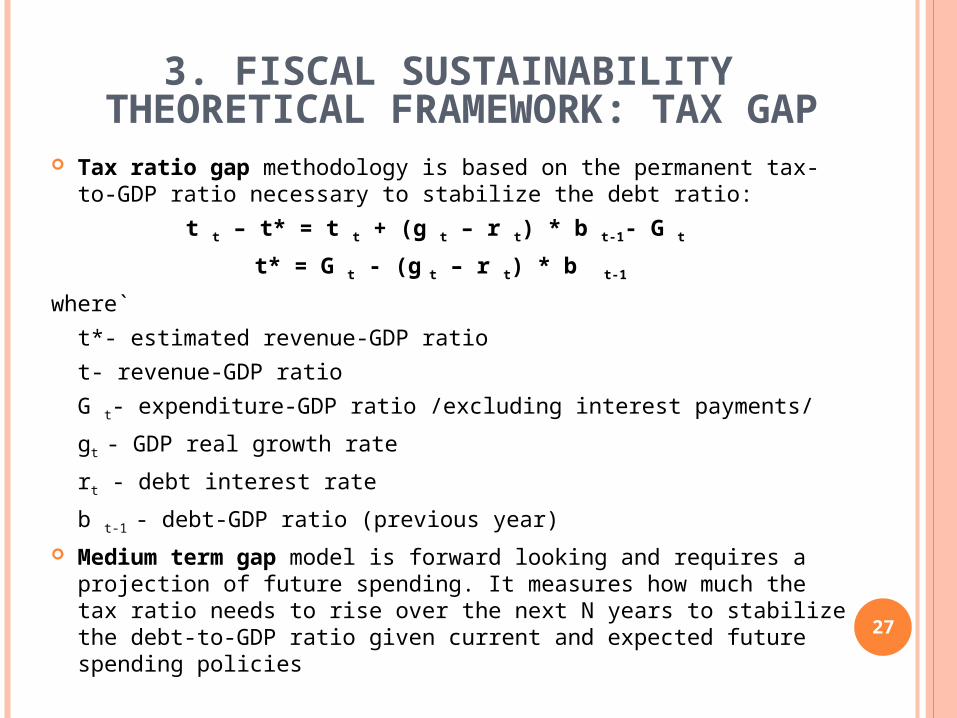
3. FISCAL SUSTAINABILITY THEORETICAL FRAMEWORK: TAX
GAP Tax ratio gap methodology is based on the permanent tax-to-GDP ratio necessary
to stabilize the debt ratio:
t t – t* = t t + (g t – r t) * b t-1- G t
t* = G t - (g t – r t) * b t-1
where`
t*- estimated revenue-GDP ratio
t- revenue-GDP ratio
G t- expenditure-GDP ratio /excluding interest payments/
gt - GDP real growth rate
rt - debt interest rate
b t-1 - debt-GDP ratio (previous year) Medium term gap model is forward looking and requires a projection of future
spending. It measures how much the tax ratio needs to rise over the next N years to stabilize the debt-to-GDP ratio given current and expected future spending policies
27
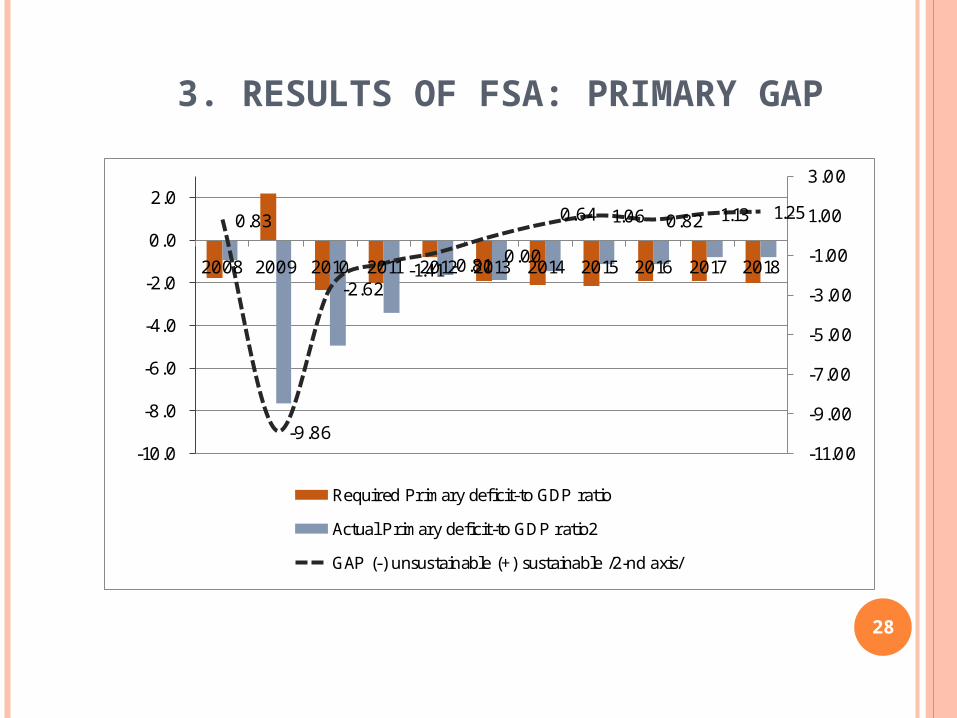
3. RESULTS OF FSA: PRIMARY GAP
0.83
-9.86
-2.62-1.41 -0.81 0.00
0.64 1.06 0.82 1.13 1.25
-11.00
-9.00
-7.00
-5.00
-3.00
-1.00
1.00
3.00
-10.0
-8.0
-6.0
-4.0
-2.0
0.0
2.0
2008 2009 2010 2011 2012 2013 2014 2015 2016 2017 2018
Required Primary deficit-to GDP ratio
Actual Primary deficit-to GDP ratio2
GAP (-) unsustainable (+) sustainable /2-nd axis/
28
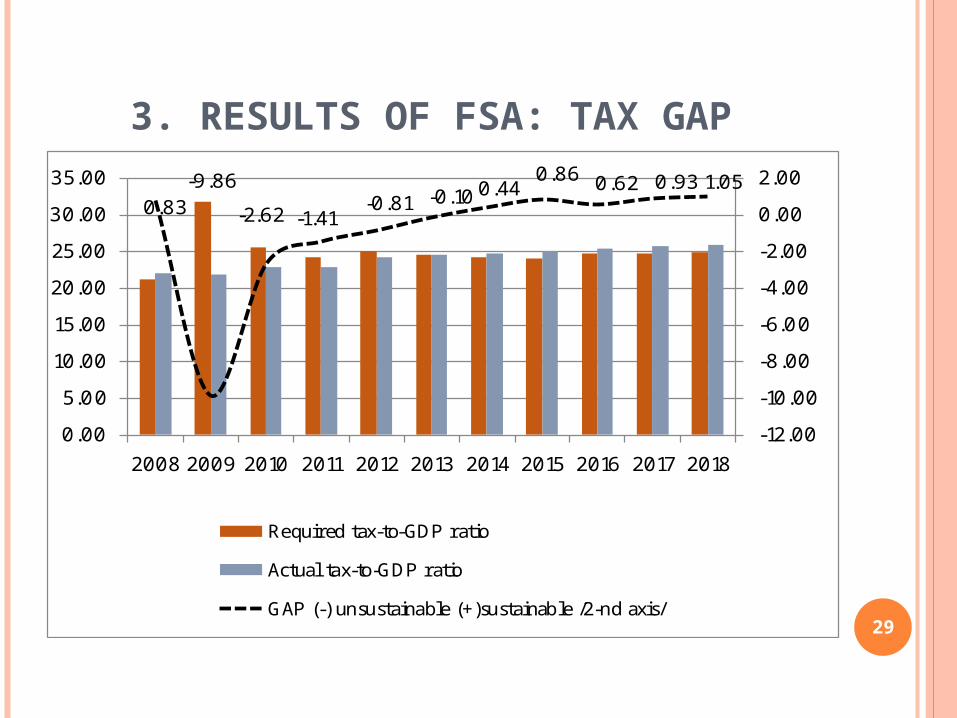
3. RESULTS OF FSA: TAX GAP
0.83-9.86
-2.62 -1.41-0.81 -0.10 0.44
0.86 0.62 0.93 1.05
-12.00
-10.00
-8.00
-6.00
-4.00
-2.00
0.00
2.00
0.00
5.00
10.00
15.00
20.00
25.00
30.00
35.00
2008 2009 2010 2011 2012 2013 2014 2015 2016 2017 2018
Required tax-to-GDP ratio
Actual tax-to-GDP ratio
GAP (-) unsustainable (+)sustainable /2-nd axis/29
30
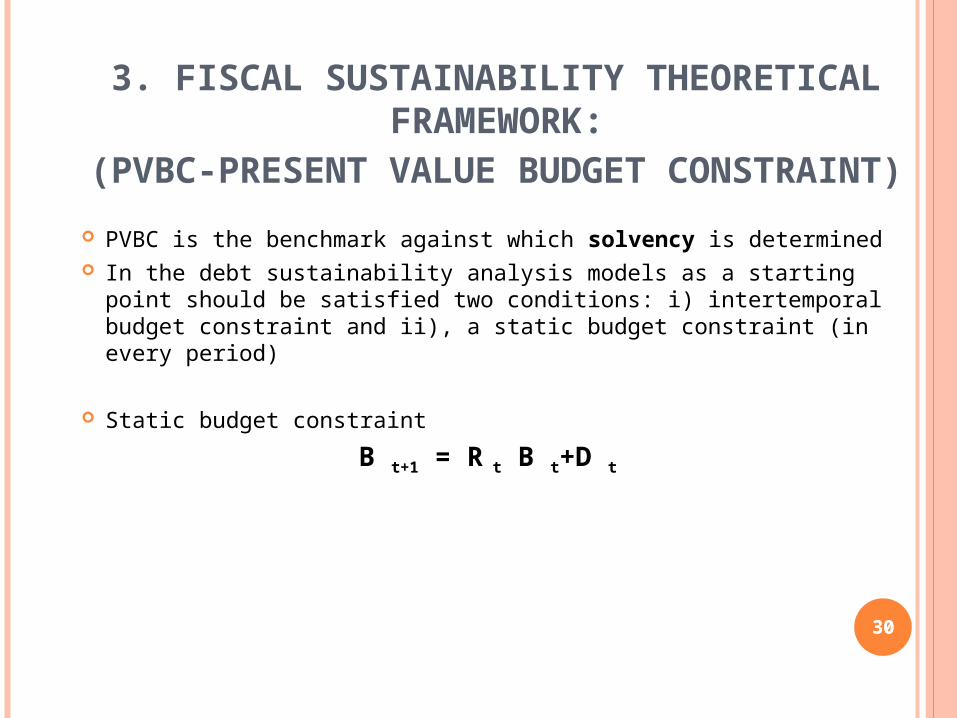
3. FISCAL SUSTAINABILITY THEORETICAL FRAMEWORK:
(PVBC-PRESENT VALUE BUDGET CONSTRAINT)
PVBC is the benchmark against which solvency is determined In the debt sustainability analysis models as a starting point should be satisfied
two conditions: i) intertemporal budget constraint and ii), a static budget constraint (in every period)
Static budget constraint
B t+1 = R t B t+D t
30
31
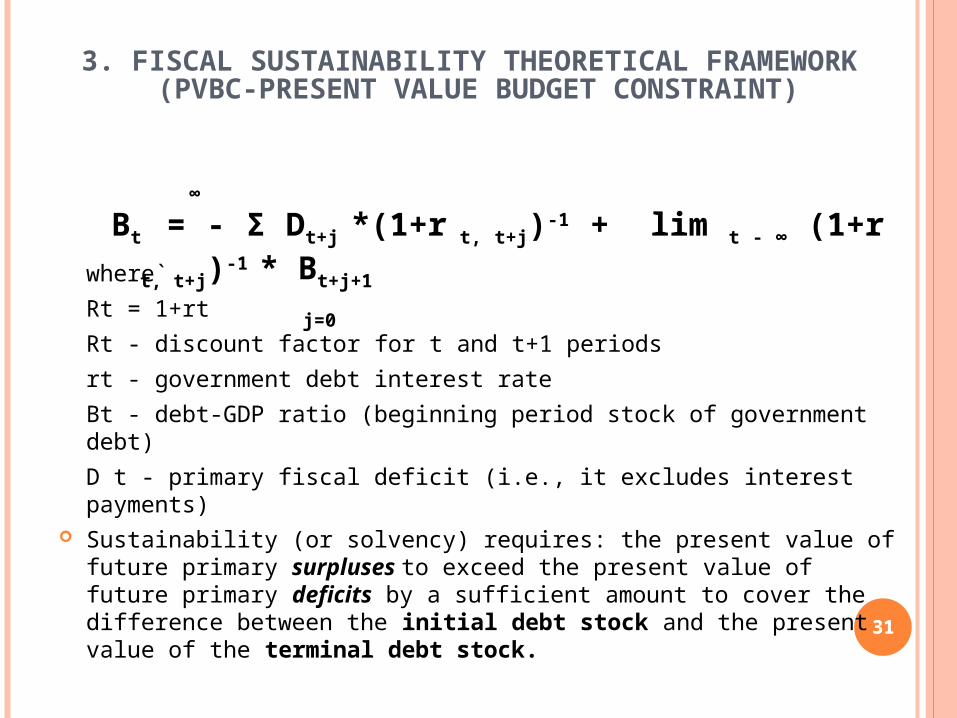
3. FISCAL SUSTAINABILITY THEORETICAL FRAMEWORK (PVBC-PRESENT VALUE BUDGET CONSTRAINT)
where`
Rt = 1+rt
Rt - discount factor for t and t+1 periods
rt - government debt interest rate
Bt - debt-GDP ratio (beginning period stock of government debt)
D t - primary fiscal deficit (i.e., it excludes interest payments) Sustainability (or solvency) requires: the present value of future primary surpluses
to exceed the present value of future primary deficits by a sufficient amount to cover the difference between the initial debt stock and the present value of the terminal debt stock.
∞
Bt = - Σ Dt+j *(1+r t, t+j)-1 + lim t - ∞ (1+r t, t+j)-1 * Bt+j+1
j=0
31
32
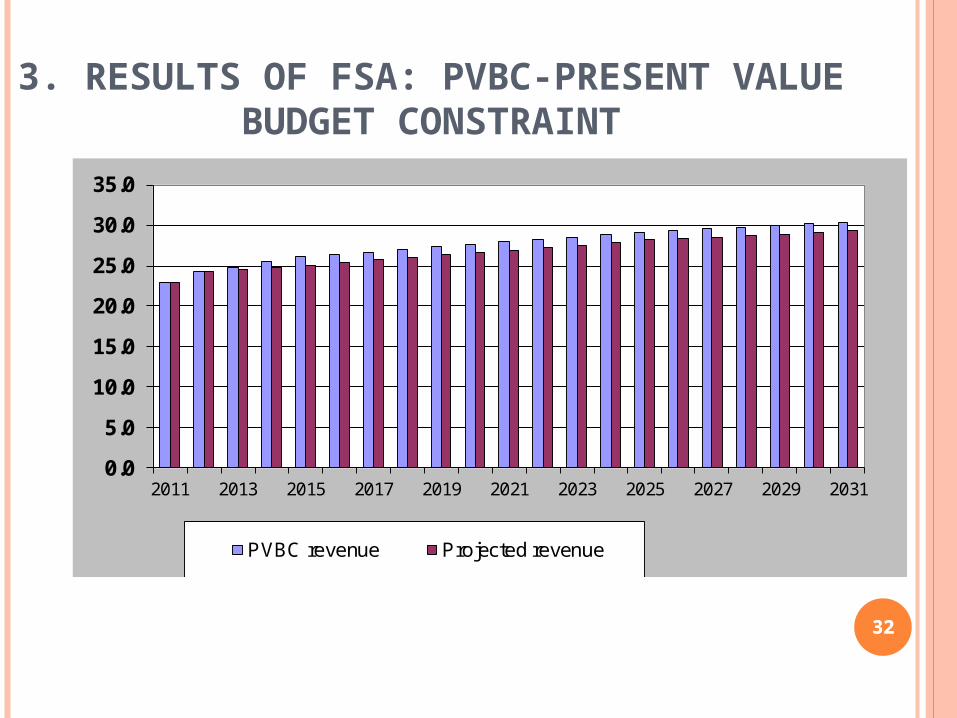
3. RESULTS OF FSA: PVBC-PRESENT VALUE BUDGET CONSTRAINT
0.0
5.0
10.0
15.0
20.0
25.0
30.0
35.0
2011 2013 2015 2017 2019 2021 2023 2025 2027 2029 2031
PVBC revenue Projected revenue
32
3. RESULTS OF FSA: GAP AND PVBC Gap models show that current sustainability indicators
are in place after 2012 In terms of PVBC, fiscal sustainability requires that for
future debt services more emphasis on revenue performance must be put.
The PVBC considers additional increase of revenue to GDP ratio on average 0.8 percentage points more for 2013-2023 period.
33
34
- Debt Sustainability indicators show that Armenia is low risk country in terms of meeting future debt obligations.
- Debt sustainability is sensitive the level of economic growth and new borrowing conditions
- If deterioration of new borrowing conditions is inevitable than more emphasizes must be paid to the debt management capacities in terms of well managing future cash flows.
- Issuance of 5-10 years Eurobonds that will allow bullet payment will ease cash flow needs for upcoming 5-10 years, conditioned that Russian loan will be repaid not allowing deterioration of debt profile.
- More emphasis on revenue performance is needed
4. CONCLUDING REMARK

35
THANK YOU