Embed Size (px)
Citation preview

JUNE 1994 E.B.94-15
>D: <C
:E:E D::E !CC:::JU-en >enD:en <c W
ZC en :::J DJ
EASTERN PLATEAU REGION
1993
Cortland
Chemung Broome
Robert A. Milligan Linda D. Putnam John S. Carlson Carl A. Crispell -Gerald A. LeClar ,.
Department of Agricultural, Resource and Managerial Economics College of Agriculture and Life Sciences
Cornell University, Ithaca, New York 14853-7801

It Is the policy of Cornell University actively to support equality of educational and employment opportunity. No person shall be denied admission to any educational program or activity or be denied efT1)loyment on the basis of any legally prohibited discrimination Involving, but not limited to, such factors as race, color, creed, religion, national or ethnic origin, sex, age or handicap. The University is committed to the maintenance of affirmative action programs which will ~sure the continuation of such equality of opportunity.

1993 DAIRY FARM BUSINESS SUMMARY EASTERN PLATEAU REGION
Table of Contents
~
1
Program Objectives 1
INTRODUCTION .
Format Features .. 1
SUMMARY AND ANALYSIS OF THE FARM BUSINESS 2
Business Characteristics 2
Income Statement .... 2
Profitability Analysis 4
Farm and Family Financial Status 7
Statement of Owner Equity. 11
Cash Flow Statement 12
Repayment Analysis 14
Cropping Analysis 16
Dairy Analysis 18
Capital and Labor Efficiency Analysis 20
COMPARATIVE ANALYSIS OF THE FARM BUSINESS 21
Progress of the Farm Business 21
Regional Farm Business Chart .' 22
New York State Farm Business Chart 23
Financial Analysis Chart . 25
Comparisons by Type of Barn and Herd Size 26
26Herd Size Comparisons IDENTIFY AND SET GOALS 32
GLOSSARY AND LOCATION OF COMMON TERMS 34
37INDEX .
1993 DAIRY FARM BUSINESS SUMMARY EASTERN PLATEAU REGION*
:INTRODUCT:ION
Dairy farmers throughout New York State have been participating in Cornell Cooperative Extension's farm business summary and analysis program since the early 1950's. Managers of each participating farm business receive a comprehensive summary and analysis of the farm business. The information in this report represents an average of the data submitted from dairy farms in the Eastern Plateau Region for 1993.
Program Objective
The primary objective of the dairy farm business summary, DFBS, is to help farm managers improve the business and financial management of their business through appropriate use of historical farm data and the application of modern farm business analysis techniques. This information can also be used to establish goals that will enable the business to better meet its objectives. In short, DFBS identifies business and financial information needed in identifying and evaluating strengths and weaknesses of the farm business.
FOrmat Feature.
This regional report follows the same general format as in the 1993 DFBS printout received by all participating dairy farmers. The analysis tables have an open column or section labeled My Farm. It may be used by any dairy farm manager who wants to compare his or her business with the average data of this region. A DFBS Data Check-in Form can be used by nonDFBS participants to summarize their businesses.
This report features:
(1) an income statement including accrual adjustments for farm business expenses and receipts, as well as measures of profitability with and without appreciation,
(2) a complete balance sheet with analytical ratios; (3) a statement of owner equity which shows the sources of the change in
owner equity during the year; (4) a cash flOW statement and debt repayment ability analysis; (5) an analysis of crop acreage, yields, and expenses; (6) an analysis of dairy liyestock numbers. production, and expenses; and (7) a capital and labor efficiency analysis.
-*This summary was prepared by Linda D. Putnam and Robert A. Milligan, Department of Agricultural, Resource, and Managerial Economics, New York state College of Agriculture and Life Sciences, Cornell University, in cooperation with Cooperative Extension Agents Jerry LeClar and John Carlson, and area Extension Specialist Carl Crispell. The Eastern Plateau Region is comprised of Broome, Chemung, Chenango, Cortland, Delaware, Otsego, Schuyler, Tioga and Tompkins Counties.

2
SUMMARY AND ANALYSIS OP THE PARK BUSINESS
Busin.ss Characteristics
Planning the optimal management strategies is a crucial component of operating a successful farm. Various combinations of farm resources, .'
enterprises, business arrangements, and management techniques are used by the dairy farmers in this region. The following table shows important farm business characteristics and the number of farms with each characteristic.
BUSINESS CHARACTERISTICS 66 Eastern Plateau Region Dairy Farms, 1993
Type of Farm Dairy Part-time dairy Dairy cash-crop Part-time cash-crop
Number 66 o o
dairy 0
Type of Ownership Owner
Number 60
Renter 6
Type of Business Number Single proprietorship 46 Partnership 20 Corporation o
Business Record System Number ELFAC II 1 Account Book 16 Agrifax (mail-in only) 10 On-Farm Computer 17 Other 22
Type of Barn Number stanchion/Tie-stall 42 Freestall 19 Combination 5
Milking System Number Bucket & carry o Dumping station 1 Pipeline 42 Herringbone parlor 17 other parlor 6
Milking Frequency Number 2x/day 54 3x/day 10 other 2
Production Records Number DHIC 48 Owner-Sampler 10 other 2 None 6
The averages used in this report were compiled using data from all the participating dairy farms in this region unless noted otherwise. There are full-time dairy farms, part-time farms, dairy cash-crop farms, farm renters, partnerships, and corporations included in the average. Average data for these specific types of farms are presented in the State Business Summary.
Income Statement
In order for an income statement to accurately measure farm income, it must include cash transactions and accrual adjustments (changes in accounts payable, accounts receivable, inventories, and prepaid expenses) .
Cash paid is the actual cash outlay during the year and does not necessarily -represent the cost of goods and services actually used in 1993. .'
Chanae in inventory: Increases in inventories of supplies and other purchased inputs are subtracted in computing accrual expenses because they represent purchased inputs not actually used during the year. Decreases in purchased inventories are added to expenses because they represent inputs purchased in a prior year and used this year.

3
CASH AND ACCRUAL PARK EXPENSES 66 Eastern Plateau Region Dairy Farms, 1993
Change in Inventory Change in
Cash or Prepaid Accounts Accrual Expense Item Paid + Expense + Payable Expenses
Hired Labor $29,911 $0 « $28 $29,939 ~ Dairy grain & conc. 73,288 568 -121 73,735 Dairy roughage 907 14 34 955 Nondairy 10 -4 1 7 Machinery Mach. hire, rent/lease 2,218 o « 30 2,248 Machinery repairs/parts 15,159 -57 142 15,244 Auto expo (farm share) 893 o « o 893 Fuel, oil & grease 6,309 11 -26 6,294 Liyestock Replacement livestock 2,408 o « -53 2,355 Breeding 4,136 40 14 4,190 Vet & medicine 5,531 -16 210 5,725 Milk marketing 13,538 o « 3 13,541 Cattle lease/rent 69 o « o 69 Other livestock expense 14,458 11 -135 14,334 ~ Fertilizer & lime 5,761 118 9 5,888 Seeds & plants 3,768 152 30 3,950 Spray, other crop expo 3,743 38 -65 3,716 Real Estate Land/bldg./fence repair 4,350 -26 82 4,406 Taxes 7,325 13 « 92 7,430 Rent & lease 4,484 -1 « -17 4,466 ~ Insurance 4,287 o « o 4,287 Telephone (farm share) 705 o « -2 703 Electricity (farm share) 7,809 o « 8 7,817 Interest paid 15,086 o « o 15,086 Miscellaneous 2,753 44 -32 2,765 Total Operating $228,906 $905 $232 $230,043
Expansion livestock 1,420 o « o 1,420 Machinery depreciation 15,316 Building depreciation 8,352
TOTAL ACCRUAL EXPENSES $255.131
Change in prepaid expenses (noted above by «) is a net change in non-inventory expenses that have been paid in advance of their use. If 1993 funds used to prepay 1994 leases exceed the amount of 1993 leases prepaid in 1992, the amount of this excess is entered as a negative number to exclude it from 1993 accrual lease expenses. The excess prepaid lease is charged against the future year's business operation. A decrease in prepaid lease is added to accrual expenses because it represents use of resources during this year that were paid for in past years. -Change in accounts payable: An increase in accounts payable from beginning to end of year is added when calculating accrual expenses because these expenses were incurred (resources used) in 1993 but not paid for. A decrease is subtracted because the resource was used before 1993.
Accrual expenses are the costs of inputs actually used in this year's production. They are the total of cash paid, as well as changes in inventory, prepaid expenses, and accounts payable.

4
CASH AND A.CCRUAL PAIUI RECBIPTS 66 Eastern Plateau Region Dairy Farms, 1993
Change in Cash Change in Accounts Accrual
Receipt Item Receipts + Inventory + Receivable = Receipts Milk sales $248,560 $1,862 $250,422 Dairy cattle 16,230 $6,034 61 22,325 Dairy calves 4,634 -3 4,631 Other livestock 433 -45 o 388 Crops 1,879 2,557 17 4,453 Government receipts 3,697 -42* 474 4,129 Custom machine work 805 -87 718 Gas tax refund 117 4 121 Other 3,998 51 4,049
Less nonfarm noncash cap. ** ( - )__--=1..::.5 (-) 15 Total Receipts $280,353 $8,489 $2,379 $291,221
*Change in advanced government receipts. **Gifts or inheritances of cattle or crops included in inventory.
Cash receipts include the gross value of milk checks received during the year plus all other payments received from the sale of farm products, services, and government programs. Nonfarm income is not included in calculating farm profitability.
Changes in inventory of assets produced by the business are calculated by subtracting beginning of year values from end of year values excluding appreciation. Increases in livestock inventory caused by herd growth and/or quality are added, and decreases caused by herd reduction and/or quality are subtracted. Changes in inventories of crops grown are also included. An annual increase in advanced government receipts is subtracted from cash income because it represents income received in 1993 for the 1994 crop year in excess of funds earned for 1993. Likewise, a decrease is added to cash government receipts because it represents funds earned for 1993 but received in 1992.
Changes in accounts receivable are calculated by subtracting beginning year balances from end year balances. The January milk check for this December's marketings compared with the previous January's check is included as a change in accounts receivable.
Accrual receipts represent the value of all farm commodities produced and services actually generated by the farm business during the year.
Profitability Analysis
Farm operators* contribute labor, management, and equity capital to their businesses and the combination of these resources, and the other resources used in the business, determines profitability. Farm profitability can be measured as the return to all family resources or as the return to one or more individual resources such as labor and management. -
*Operators are the individuals who are integrally involved in the operation and management of the farm business. They are not limited to those who are the owner of a sole proprietorship or are formally a member of the partnership or corporation.

5
Net farm income is the return to the farm operators and other unpaid family members for their labor, management, and equity capital. It is the farm family's net annual return from working, managing, financing, and owning the farm business. This is not a measure of cash available from the year's business operation. Cash flow is evaluated later in this report.
Net farm income is computed both with and without appreciation. Appreciation represents the change in values caused by annual changes in prices of livestock, machinery, real estate inventory, and stocks and certificates (other than Farm Credit). Appreciation is a major factor contributing to changes in farm net worth and must be included for a complete profitability analysis.
NET PARK INCOME 66 Eastern Plateau Region Dairy Farms, 1993
Item Average My Farm
Total accrual receipts Appreciation: Livestock
Machinery Real Estate Other Stock/Certificates
Total Including Appreciation Total accrual expenses Net Farm Income (with appreciation) Net Farm Income (without appreciation)
$291,221 1,546 1,721 7,076
332 $301,896
- 255,131 $46,765 $36,090
$---
$---
$--- $---
The chart below shows the relationship between net farm income per cow (with appreciation) and pounds of milk sold per cow. Generally, farms with a higher production per cow have higher profitability per cow.
Net Farm Income/Cow and Milk/Cow 66 Eostern Plateau Doiry Forms, 19931.Sr---- -----------------.----~ l
1.4 I o
1.J~ o ~ 1.2rc o ~ 1.11- i uf o o o 0 0
.~
0.: t o
Q. Q. I o 0.8 t- III" o 0 ~~ 0.7 LI o~II o 0 0 ~"O 0.6 0
0 o C o 0 o o0.5"-~ 0II 0 DO 00.4 0E.cot:. o DO 0
0.3 ,...u oIc o
0.2 r- 0 o
E L 0.1 i-- 0 0 0 o
L... o -----~--- .-------0--- -----._.----- p--- ---------- [1.. --0.1 i- o
o-0.2 i o
-0.3 +i
o I-0.4 ....
-0.5 L L ._1 L L L l __ J_ 1 __L __L .J.. _L_..l .l-.J 10 12 14 16 18 22 24
(Thousands) Pounds Milk Sold Per Cow
6
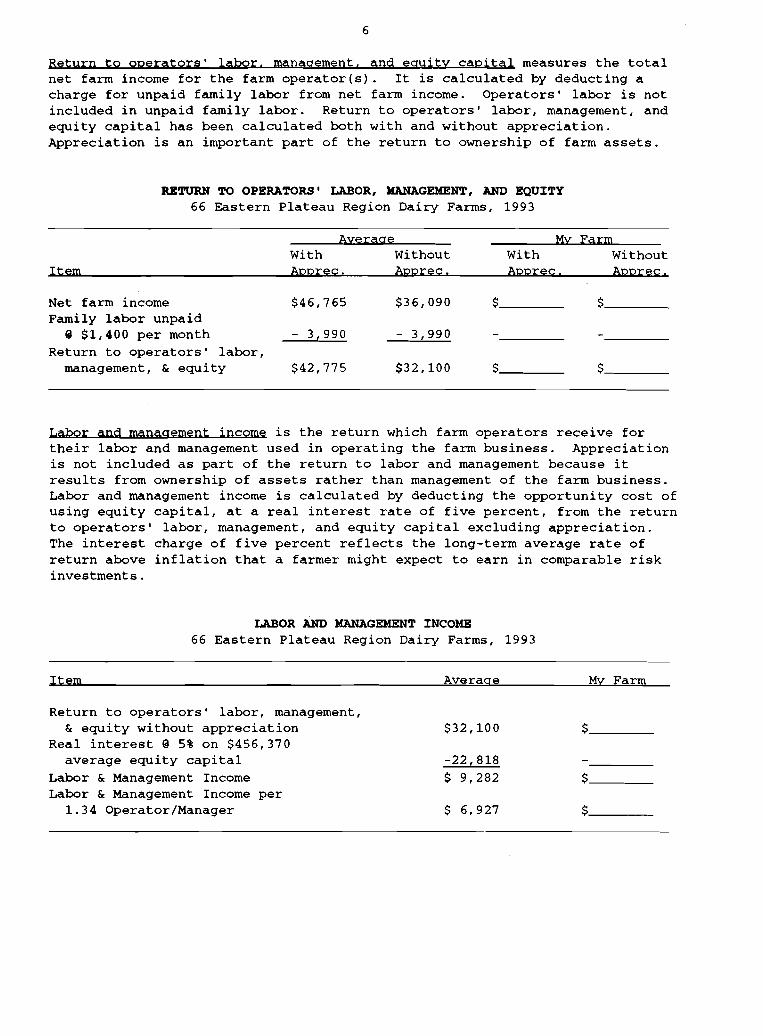
Return to operators' labor. management. and equity capital measures the total net farm income for the farm operator(s). It is calculated by deducting a charge for unpaid family labor from net farm income. Operators' labor is not included in unpaid family labor. Return to operators' labor, management, and equity capital has been calculated both with and without appreciation. Appreciation is an important part of the return to ownership of farm assets. .J
U'l'URN TO OPERATORS I LABOR, KANAGEHENT, AND EQUITY 66 Eastern Plateau Region Dairy Farms, 1993
-
Item
Average With Without Apprec. Apprec.
My With Apprec.
Farm Without Apprec.
Net farm income Family labor unpaid
@ $1,400 per month Return to operators' labor,
management, & equity
$46,765
- 3,990
$42,775
$36,090
- 3,990
$32,100
$---
$---
$---
$---
Labor and management income is the return which farm operators receive for their labor and management used in operating the farm business. Appreciation is not included as part of the return to labor and management because it results from ownership of assets rather than management of the farm business. Labor and management income is calculated by deducting the opportunity cost of using equity capital, at a real interest rate of five percent, from the return to operators' labor, management, and equity capital excluding appreciation. The interest charge of five percent reflects the long-term average rate of return above investments.
inflation that a farmer might expect to earn in comparable risk
66 LABOR AND KANAGEMENT INCOME
Eastern Plateau Region Dairy Farms, 1993
Item Average My Farm
Return to operators' labor, management, & equity without appreciation
Real interest @ 5% on $456,370 average equity capital
Labor & Management Income Labor & Management Income per
1.34 Operator/Manager
$32,100
-22,818 $ 9,282
$ 6,927
$
$
$

7
Return on equity capital measures the net return remaining for the farmer's equity or owned capital after a charge has been made for the owner-operator's labor and management. The earnings or amount of net farm income allocated to labor and management is the opportunity cost of operators' labor and management estimated by the cooperators. Return on equity capital is calculated with and without appreciation. The rate of return on equity capital is determined by dividing the amount returned by the average farm net worth or equity capital. Return on total capital is calculated by adding interest paid to the return on equity capital and then dividing by average farm assets to calculate the rate of return on total capital.
RETURN ON EQUITY CAPITAL AND RETURN ON TOTAL CAPITAL 66 Eastern Plateau Region Dairy Farms, 1993
Item Ayerage My Farm
Return to operators' labor, management, & equity capital with appreciation
Value of operators' labor & management Return on equity capital with appreciation Interest paid Return on total capital with appreciation Return on equity capital without appreciation Return on total capital without appreciation Rate of return on average equity capital:
with appreciation without appreciation
Rate of return on average total capital: with appreciation without appreciation
$42,775 -30,639 $12,136 +15,086 $27,222 $ 1,461 $16,547
$
$ + $ $ $
2.66% .32%
% %
4.04% 2.45%
% %
rarm and ramily rinancial Statu.
The first step in evaluating the financial position of the farm is to construct a balance sheet which identifies all the assets and liabilities of the business. The second step is to evaluate the relationship between assets, liabilities, and net worth and changes that occurred during the year.
Financial lease obligations are included in the balance sheet. The present value of all future payments is listed as a liability since the farmer is committed to make the payments by signing the lease. The present value is also listed as an asset, representing the future value the item has to the business. For 1993, leases were discounted by 7.75 percent.
Adyanced government receipts are included as current liabilities. Government payments received in 1993 that are for participation in the 1994 program are the end year balance and payments received in 1992 for participation in the 1993 program are the beginning year balance
Current Portion or principal due in the next year for intermediate and long term debt is included as a current liability.

8
1993 FARM BUSINESS ~ NONFARM BALANCB SHEET 66 Eastern Plateau Region Dairy Farms, 1993
Farm Liabilities Farm Assets Jan. 1 Dec. 31 & Net Worth Jan. 1 Dec. 31 Current Farm cash, checking
& savings $ 5,733 Accounts rec. 17,910 Prepaid exp. 15 Feed & supplies 55,604
Total $79,262
Intermediate Dairy cows:
owned $108,588 leased o
Heifers 47,044 Bulls/other lvstk. 1,501 Mach./eq. owned 127,401 Mach./eq. leased 1,379 Farm Credit stock 638 Other stock/cert. 6,346
Total $292,897
Long-Term Land/buildings:
owned $292,282 leased 342
Total $292,624
Total Farm Assets $664,783
$ 5,340 20,288
3
57,267
$82,898
$113,533 o
49,686 1,447
129,814 928 701
6,492
$302,601
$298,024 271
$298,295
$683,794
Current Accounts payable $ 4,366 Operating debt 9,175 Short-term 2,297 Advanced govt. rec. o Current Portion:
Intermediate o Long Term o Total $15,838 .
Intermediate Structured debt
1-10 years $89,996 Financial lease
(cattle/mach. ) 1,379 Farm Credit stock 638
Total $92,013
Long Term Structured debt
>10 yrs $107,762 Financial lease
(structures) 342
Total $108,104
Total Farm Liab. $215,955 FARM NET WORTH $448,828
$ 4,597 9,960 3,586
42
18,161 6.762
$43,108
$72,651
928 701
$74,280
$102,224
271
$102,495
$219,883 $463,911
Nonfarm Assets, Liabilities & Net Worth (Average of 39 farms reporting) Liabilities
Assets Jan. 1 Dec. 31 & Net Worth Jan. 1 pec. 31 Personal cash, chkg.
& savings $ 4,715 $ 5,025 Cash value life ins. 13,038 14,754 Nonfarm real estate 18,836 19,669 Auto (personal sh.) 3,822 3,919 Stocks & bonds 8,053 9,068 Household furn. 9,938 10,105 All other 2,022 3,023
Total Nonfarm $60,425 $65,563
Nonfarm Liab. $ 4,391 $ 3,722
NONFARM NET WORTH $56,034 $61,841
-Farm & Nonfarm Assets. Liabilities. & Net Worth* Jan. 1 pec. 31 Total Assets $725,208 $749,357 Total Liabilities 220,346 223,605 TOTAL FARM & NONFARM NET WORTH $504,862 $525,752
*Assumes that average nonfarm assets and liabilities for the nonreporting farms were the same as for those reporting.

9
The following condensed balance sheet, including deferred taxes, contains average data from only those farmers who elected to provide the additional information required to compute deferred taxes.
Deferred taxes represent an estimate of the taxes that would be paid if the farm were sold at year end fair market values and date on the balance sheet. Accuracy is dependent on the accuracy of the market values and the tax basis data provided. Any tax liability for assets other than livestock, machinery, land, buildings and nonfarm assets is excluded. It is assumed that all gain on purchased livestock and machinery is ordinary gain and that listed market values are net of selling costs. The effects of investment tax credit carryover and recapture, carryover of operating losses, alternative minimum taxes and other than average exemptions and deductions are excluded because they have only minor influence on the taxes of most farms. However, they could be important.
CONDENSED BALANCB SHEET INCLUDING DEPERRED TAXES December 31, 1993
16 New York Dairy Farms, 1993
ASSETS LIABILITIES & NET WORTH
Total Current Assets
Total Inter. Assets
Total Long Term Assets
TOTAL FARM ASSETS
$ 67,751
$243,440
$234,047
$545,238
Total Nonfarm Assets $ 73.436
TOTAL ASSETS $618,674
Current debts & payab1es
Current deferred taxes
Total Current Liabilities
Intermediate debts & leases
Intermediate deferred taxes
Total Inter. Liabilities
Long term debts & leases
Long term deferred taxes
Total Long Term Liab.
TOTAL FARM LIABILITIES
Farm Net Worth
Percent Equity (Farm)
Nonfarm debts
Nonfarm deferred taxes
Total Nonfarm Liabilities
TOTAL LIABILITIES
Total Net Worth
Percent Equity (Total)
$ 44,121
22,447
$ 66,568
$ 80,485
70,976
$151,461
$ 66,083
34,246
$100,329
$318,358
$226,880
42%
$ 3,684
18,347 $22.031
$340,389
$278,286
45%
10
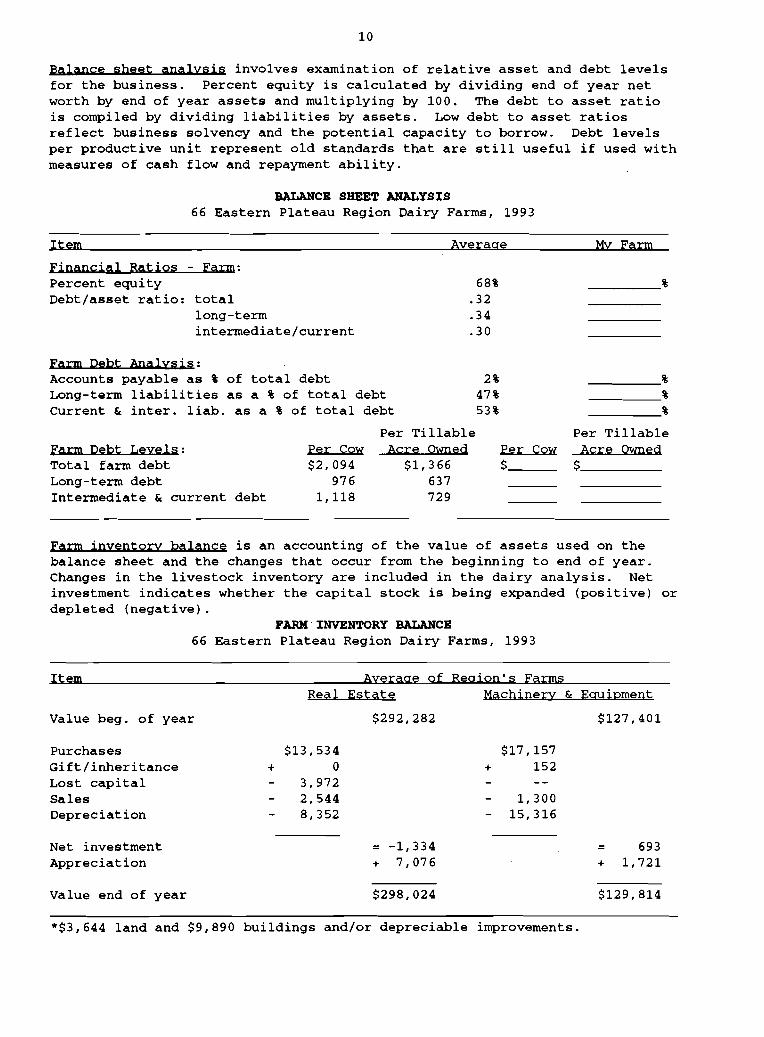
Balance sheet analysis involves examination of relative asset and debt levels for the business. Percent equity is calculated by dividing end of year net worth by end of year assets and multiplying by 100. The debt to asset ratio is compiled by dividing liabilities by assets. Low debt to asset ratios reflect business solvency and the potential capacity to borrow. Debt levels per productive unit represent old standards that are still useful if used with measures of cash flow and repayment ability.
BALANCE SHEET ANALYSIS 66 Eastern Plateau Region Dairy Farms, 1993
Item Average My Farm
Financial Ratios - Farm: Percent equity 68% ----_% Debt/asset ratio: total .32
long-term .34 intermediate/current .30
Farm Debt Analysis: Accounts payable as % of total debt 2% ----_% Long-term liabilities as a % of total debt 47% ----_% Current & inter. liab. as a % of total debt 53% ----_%
Per Tillable Per Tillable Farm Debt Leyels: Per Cow Acre Owned Per Cow Acre Owned Total farm debt $2,094 $1,366 $--- $---Long-term debt 976 637 Intermediate & current debt 1,118 729
Farm inyentory balance is an accounting of the value of assets used on the balance sheet and the changes that occur from the beginning to end of year. Changes in the livestock inventory are included in the dairy analysis. Net investment indicates whether the capital stock is being expanded (positive) or depleted (negative).
PARK INVENTORY BALANCE 66 Eastern Plateau Region Dairy Farms, 1993
Item Ayerage of Region'S Farms
Value beg. of year
Purchases Gift/inheritance Lost capital Sales Depreciation
+
Real
$13,534 0
3,972 2,544 8,352
Net investment Appreciation
Value end of year
Estate Machinery & Equipment
$292,282 $127,401
$17 ,157 + 152
1,300 15,316
= -1,334 = 693 + 7,076 + 1,721 -$298,024 $129,814
*$3,644 land and $9,890 buildings and/or depreciable improvements.

11
The Statement of Owner Equity has two purposes. It allows (1) verification that the accrual income statement and market value balance sheet are interrelated and consistent (in accountants terms, they reconcile) and (2) identification of the causes of change in equity that occurred on the farm during the year. The Statement of Owner Equity allows you to determine to what degree the change in equity was caused by (1) earnings from the business, and nonfarm income, in excess of withdrawals being retained in the business (called retained earnings), (2) outside capital being invested in the business or farm capital being removed from the business (called contributed/withdrawn capital) and (3) increases or decreases in the value (price) of assets owned by the business (called change in valuation equity) .
Retained earnings is an excellent indicator of farm generated financial progress.
STATEMENT OF OWNER EQUITY (RECONCILIATION) 66 Eastern Plateau Region Dairy Farms, 1993
Item Ayerage My Farm
Beginning of year farm net worth $448,828 $--
Net farm income w/o apprec. $ 36,090 $._-+Nonfarm cash income + 7,114 +---Personal withdrawals & family
expenditures excluding nonfarm borrowings - 34,588
RETAINED EARNINGS +$ 8,616 $--
Nonfarm noncash transfers to farm $ 167 $--
+Cash used in business from nonfarm capital + 2,514 +--
-Note/mortgage from farm real estate sold (nonfarm) 1. 212
CONTRIBUTED/WITHDRAWN CAPITAL +$ 1,468 +$---
Appreciation $ 10,675 $---Lost capital 3.972 CHANGE IN VALUATION EQUITY +$ 6,703 +$---IMBALANCE/ERROR 1. 702 -$--
End of year farm net worth* =$463,911 =$._-Change in net worth w/apprec. $ 15,083 $,--
-Change in Net Worth Without appreciation $ 4,408 $---With appreciation $15,083 $---
*May not add due to rounding.

12 Ca.h Ploy Stat.ment
Completing an annual cash flow statement is an important step in understanding the sources and uses of funds for the business. Understanding last year's cash flow is the first step toward planning and managing cash flow for the current and future years.
The annual cash flOW statement is structured to show net cash provided by operating activities, investing activities, financing activities and from reserves. All cash inflows and outflows, including beginning and end balances, are included. Therefore, the sum of net cash provided from all four activities should be zero. Any imbalance is the error from incorrect accounting of cash inflows/outflows.
ANNUAL CASH FLOW STATEMEN'l' 66 Eastern Plateau Region Farms, 1993
Item Cash FlOW from Operating Activities
Cash farm receipts Cash farm expenses
= Net cash farm income
Nonfarm income Personal withdrawals/family expenses
including nonfarm debt payments + Net cash nonfarm income = Net Provided by Operating Activities
Cash FlOW From Investing Activities Sale of Assets: Machinery
+ real estate + other stock/cert.
= Total asset sales Capital purchases: expansion livestock
+ machinery + real estate + other stock/cert.
Total invested in farm assets = Net Provided by Investment Activities
Cash FlOW From Financing Activities Money borrowed (inter. & long term)
+ Money borrowed (short-term) + Increase in operating debt + Cash from nonfarm cap. used in business + Money borrowed - nonfarm = Cash inflow from financing
Principal payments (inter. & long-term) + Principal payments (short-term) + Decrease in operating debt
Cash outflow for financing = Net Provided by Financing Activities
Cash Flow From Reserves Beginning farm cash, checking & savings Ending farm cash, checking & savings
= Net Provided from Reserves
Imbalance (error)

13
ANNUAL CASH PLOW STATEMENT
Item My Farm
Cash FlOW from Operating Activities
=
Cash farm receipts Cash farm expenses Net cash farm income
$,--
$,--
+ =
Nonfarm income Personal withdrawals/family expenses
including nonfarm debt payments Net cash nonfarm income Net Provided by Operating Activities
$,--
$--$--
Cash Flow From Investing Activities
Sale of Assets: Machinery + real estate
$--
= + other stock/cert.
Total asset sales Capital purchases: expansion livestock
+ machinery + real estate
$--$--
=
+ other stock/cert. Total invested in farm assets Net Provided by Investment Activities
$--$--
Cash FlOW From Financing Activities
Money borrowed (inter. & long term) + Money borrowed (short-term) + Increase in operating debt + Cash from nonfarm cap. used in business + Money borrowed - nonfarm = Cash inflow from financing
$--
$--
Principal payments (inter. & long-term) + Principal payments (short-term) + Decrease in operating debt
Cash outflow for financing = Net Provided by Financing Activities
$--
$--$--
Cash FlOW From Reserves
=
Beginning farm cash, checking & savings Ending farm cash, checking & savings Net Provided from Reserves
$--
$-- -Imbalance (error) $--

14
R,payment Analy.i. A valuable use of cash flow analysis is to compare the debt payments
planned for the last year with the amount actually paid. The measures listed below provide a number of different perspectives on the repayment performance of the business. However, the critical question to many farmers and lenders is whether planned payments can be made in 1994. The cash flow projection worksheet on the next page can be used to estimate repayment ability, which can then be compared to planned 1994 debt payments shown below.
PARK DEBT PAYMENTS PLANNED Same 58 Eastern Plateau Region Dairy Farms, 1992 & 1993
Ayerage My Farm 1993 Payments Planned 1993 Payments Planned
Debt Payments Planned Made 1994 Planned Made 1994
Long-term $13,243 $15,579 $13,193 Intermediate-term 26,410 27,363 24,431 Short-term 1,063 1,810 2,215 Operating (net
reduction) 2,174 0 1,904 Accounts payable
(net reduction) 895 291 359
Total $43,786 $45,043 $42,102
Per cow $438 $450 Per cwt. 1993 milk $2.34 $2.40 Percent of total
1993 receipts 15% 16% Percent of 1993
milk receipts 18% 18%
$--- $--- $--
$--- $--- $--
$-- $-- $--- $--
The cash flow coverage ratio measures the ability of the farm business to meet its planned debt payment schedule. The ratio shows the percentage of payments planned for 1993 (as of December 31, 1992) that could have been made with the amount available for debt service in 1993. Farmers who did not participate in DFBS in 1992 have their 1993 cash flow coverage ratio based on planned debt payments for 1994.
CASH PLOW COVERAGE RATIO
Same 58 Eastern Plateau Region Dairy Farms, 1992 & 1993
Item Ayerage My Farm
Cash farm receipts - Cash farm expenses + Interest paid - Net personal withdrawals from farm*
$277,573 225,329
14,746 27,443
$---
(A) = Amount Available for Debt Service (B) = Debt Payments Planned for 1993
(as of December 31, 1992) (A/B) = Cash Flow Coverage Ratio for 1993
$39,547
$43,786 .90
$---
$---
-
*Personal withdrawals and family expenditures less nonfarm income and nonfarm money borrowed. If family withdrawals are excluded, or inaccurately included, the cash flow coverage ratio will be incorrect.

15
ANNUAL CASH FLOW WORKSHEBT
My Farm ....R.=;e.::.l.a..i.:.::o.un,li:loa..l.....&:lA.:t,v.=;e.....r,li:loa.::.l.a.=;e_ Per Cow/ Expected 1994 Per Cow Per Cwt, Per ewt,Item Change Projection 102,1 18,933,7No, cows and cwt. milk
Accrual Oper, Receipts Milk $2,452.71 $13.23 $ _ $---Dairy cattle 218.66 1.18 Dairy calves 45.36 .24 Other livestock 3.80 .02 Crops 43.61 ,23 Misc. receipts 88.33 ~
Total $2,852.45 $15.38 $ _ $---
Accrual Oper, Expenses Hired labor $ 293.23 $ 1.58 $ _ $---Dairy grain & conc. 722,18 3.89 Dairy roughage 9,35 .05 Nondairy feed .07 ,00 Mach. hire/rent/lease 22,02 ,12 Mach, rpr,/parts & auto 158.04 .85 Fuel, oil & grease 61.65 .33 Replacement 1vstk. 23,07 .12 Breeding 41.04 .22 Vet & medicine 56,07 .30 Milk marketing 132,62 .72 Cattle lease ,68 ,00 Other livestock exp, 140,39 .76 Fertilizer & lime 57,67 .31 Seeds & plants 38.69 ,21 Spray/other crop exp, 36.39 ,20 Land, bldg"fence repair 43.15 ,23 Taxes 72.77 .39 Real estate rent/lease 43,74 ,24 Insurance 41.99 ,23 Utilities 83.45 .45 Miscellaneous 27.09 -----..l2
Total Less Int. Paid $2,105.35 $11.35 $---
Net Accrual Operatina Income (Total) (without interest paid) $76,280 $-- $---
- Change in lvstk./crop inv.* 8,489 - Change in accts, rec. 2,379 + Change in feed/supply inv,** 905 + Change in accts. payable*** 232 NET CASH FLOW $66,549 $-- $---- Net personal w/drawals from
farm (see footnote on pg, 14) $27,474 Available for Farm Debt
Payments & Investments $39,075 $-- $---- Farm debt payments 46,697 Available for Farm Investment $-7,622 $-- $---- Capital purchases: cattle,
machinery & improvements $32,133 Additional Capital Needed $ $
*Includes change in advance government receipts, **Includes change in prepaid expenses,
***Excludes change in interest account payable.
-

16
cropping Analy.i.
The cropping program is an important part of the dairy farm business and often represents opportunities for improved productivity and profitability. A complete evaluation of what the available land resources are, how they are being used, how well crops are producing, and what it costs to produce them is important to evaluating alternative cropping and feed purchasing alternatives.
LAND RESOURCES AND CROP PRODUCTION 66 Eastern Plateau Region Dairy Farms, 1993
Item Ayerage My Farm
LAw;l ~ Rented ~ Owned Rented Tillable 161 118 280 Nontillable 59 21 80 Other nontillable 87 15 102
Total 307 154 462
Croe Yields ~ ~* Prod/Acre Prod/Acre Hay crop 66 159 2.60 tn DM ___ tn DM Corn silage 61 64 14.91 tn tn
4.92 tn DM tn DM Other forage 4 30 1. 58 tn DM tn DM Total forage 66 220 3.21 tn DM tn DM Corn grain 33 78 109.39 bu bu Oats 14 22 59.65 bu bu Wheat 0 0 0.00 bu bu Other crops 3 8 Tillable pasture 18 31 Idle 22 21 Total Tillable Acres 66 280
*This column represents the average acreage for the farms producing that crop. Average acreages including those farms not producing were hay crop 159, corn silage 59, corn grain 39, oats 5, tillable pasture 9, and idle 7.
Average crop acres and yields compiled for the region are for the farms reporting each crop. Yields of forage crops have been converted to tons of dry matter using dry matter coefficients reported by the farmers. Grain production has been converted to bushels of dry grain equivalent based on dry matter information provided.
The following crop/dairy ratios indicate the relationship between forage production, forage production resources, and the dairy herd.
CROP/DAIRY RATIOS 66 Eastern Plateau Region Dairy Farms, 1993
-Item Ayerage My Farm
Total tillable acres per cow 2.74 Total forage acres per cow 2.15 Harvested forage dry matter, tons per cow 6.92

17
Croppina Analysi. (continued)
A number of cooperators have allocated crop expenses among the hay crop, corn, and other crops produced. Fertilizer and lime, seeds and plants, and spray and other crop expenses have been computed per acre and per production unit for hay and corn. Additional expense items such as fuels, labor, and machinery repairs are not included. Rotational grazing was used on eleven farms in the region.
CROP RELATED ACCRUAL EXPENSES Eastern Plateau Region Farms Reporting, 1993
Total All Corn Corn Pasture Per Corn Silage Grain Hay Crop Per Per Till. Per Per Per Dry Per Per Till. Total
Item Acre Acre Ton DM Sh.Bu. Acre Ton DM Acre Acre
No. of farms reporting 66 16 16 2
Ave.number of acres 280 102 142 58 113
Fert./lime $21. 03 $35.05 $ 8.09 $.32 $18.35 $ 6.32 $19.85 $10.15 Seeds/plants 14.11 25.15 5.81 .23 . 13 .97 4.82 2.05 1. 05 Spray/other
crop expo 13 .27 29.09 6.72 .......n 3.66 1.26 1. 77 .90 TOTAL $48.41 $89.29 $20.62 $.82 $35.98 $12.40 $23.67 $12.10
My Farm:
Fert./lime $--- $--- $--- $--- $-- $-- $-- $-Seeds/plants Spray/other
crop expo TOTAL $--- $--- $--- $--- $-- $-- $-- $-
Most machinery costs are associated with crop production and should be analyzed with the crop enterprise. Total machinery expenses include the major fixed costs (interest and depreciation), as well as the accrual operating costs. Although machinery costs have not been allocated to individual crops, they are shown below per total tillable acre.
ACCRUAL KACHXNERY EXPENSES 66 Eastern Plateau Region Farms, 1993
Ayerage My Farm Machinery Total Per Till. Total Per Till.
Expense Item Expenses Acre Expenses Acre
Fuel, oil & grease $ 6,294 $ 22.48 $--- $--- -Machinery repairs & parts 15,243 54.44 Machine hire, rent & lease 2,248 8.03 Auto expense (farm share) 893 3.19 Interest (5%) 6,430 22.97 Depreciation 15,316 54.70
Total $46,424 $165.80 $--- $---
18
Dairy Analysi.
Analysis of the dairy enterprise can reveal a great deal about the strengths and weaknesses of the dairy farm pusiness. Information on this page should be used in conjunction with DHI and other dairy production ~.nformation.
Changes in dairy herd size and market values that occur during the year are identified in the table below. The change in inventory value w1thout appreciation is attributed to physical changes in herd size and quality. Any change all of
in inventory the profitability
is included as an accrual farm receipt when measures on pages 6 and 7.
calculating
66 DAIRY HERD INVENTORY
Eastern Plateau Region Dairy Farms, 1993
Dairy Cows Heifers Bred Open Calves
Item No. Value No· Value No. Value No. Value
Beg. year (owned) 101 $108,588 29 $24,570 27 $15,130 25 $7,343
+ Change w/o apprec. 3,919 448 2,287 -619
+ Appreciation 1,026 356 151 21
End year (owned) 105 $113,533 29 $25,374 30 $17,568 24 $6,745
End incl. leased 105
Average number 102 83 (all age groups)
My Farm:
Beg. of year (owned) _ $-- $-- $-- $-+ Change w/o apprec.
+ Appreciation
End of year (owned) $-- $-- $-- $-End including leased
Average number _____ (all age groups)
Total milk sold and milk sold per cow are extremely valuable measures of size and productivity, respectively, on the dairy farm. These measures of milk output are based on pounds of milk marketed during the year. Farm managers on DHI should compare milk sold per cow with their rolling herd average on the test date nearest December 31 to see how close the DHI estimate of milk produced is to actual milk sales.
MILK PRODUCTION 66 Eastern Plateau Region Dairy Farms, 1993
Item Average My Farm -Total milk sold, lbs. 1,893,369
Milk sold per cow, lbs. 18,551
Average milk plant test, percent butterfat 3.68

19
The cost of producing milk has been compiled using the whole farm method and is featured in the following table. Accrual receipts from milk sales can be compared with the accrual costs of producing milk per cow and per hundredweight of milk. Using the whole farm method, operating costs of producing milk are estimated by deducting nonmilk accrual receipts from total accrual operating expenses including expansion livestock purchased. Purchased inputs cost of producing milk are the operating costs plus depreciation. Total costs of producing milk include the operating costs of producing milk plus depreciation on machinery and buildings, the value of unpaid family labor, the value of operators' labor and management, and the interest charge for using equity capital.
ACCRUAL RECEIPTS PROM DAIRY AND COST OP PRODUCING MILK 66 Eastern Plateau Region Dairy Farms, 1993
Item Total Average
Per Cow Per Cwt. Total My Farm Per Cow. Per Cwt.
Accrual Costs of Producing Milk Operating costs Purchased inputs
costs Total Costs Accrual Receipts From Milk
$190,664
$214,322 $271,779
$250,422
$1,867
$2,099 $2,662
$2,453
$10.07
$11.32 $14.35
$13.23
$
$ $
$
$
$ $
$
$
$ $
$
The accrual operating expenses most commonly associated with the dairy enterprise are listed in the table below. Evaluating these costs per unit of production enables an evaluation of the dairy enterprise.
DAIRY RELATED ACCRUAL EXPENSES 66 Eastern Plateau Region Dairy Farms, 1993
Average My Farm Item Per Cow Per Cwt, Per Cow Per Cwt.
Purchased dairy grain & concentrates
Purchased dairy roughage Total Purchased
Dairy Feed Purchased grain & conc. as % of milk receipts
Purchased feed & crop expo Purchased feed & crop expo as % of milk receipts
Breeding Veterinary & medicine Milk marketing Cattle lease Other livestock expense
$722 9
$3,89 .05
$ $
$732 $3.94 $ $
$864 29%
$4.66 $ -%
$
$ 41 56
133 1
140
35% $ ,22
.30
.72
.00
.76
$ -%
$

20
Capital and Labor Efficiency Analysis
Capital efficiency factors measure how intensively the capital is being used in the farm business. Measures of labor efficiency are key indicators of management's success in generating products per unit of labor input.
CAPITAL EPPICIENCY 66 Eastern Plateau Region Dairy Farms, 1993
Item Per
Worker Per Cow
Per Tillable Acre
Per Tillable Acre Owned
Farm capital Real estate Machinery & equipment Asset turnover ratio
$220,629
42,458
$6,604 2,894 1,271
.45
$2,408
463
$4,188 1,835
My Farm: Farm capital Real estate Machinery & equipment Asset turnover ratio
$ $ $ $
LABOR PORCE INVENTORY AND ANALYSIS 66 Eastern Plateau Region Dairy Farms, 1993
Labor Force Months Age
Operator number 1 Operator number 2 Operator number 3 Family paid Family unpaid Hired
Total
My Farm: Total Operator's
11. 83 3.41
.89 3.45 2.85
li.....2.i 36.68
44 45 35
/ 12 =
/ /
12 12
= =
Years of Educ.
Value of Labor & Mgmt.
14 13 14
$22,386 6,210 2,043
3.06 Worker Equivalent 1.34 Operator/Manager Equiv.
______ Worker Equivalent Operator/Manager Equiv.
Labor Efficiencv Total Per Worker
Average Total
My Farm Per Worker
Cows, average number Milk sold, pounds Tillable acres
102 1,893,369
280
33 619,516
92 Work units 1,053 345
Average My Farm Per Per Per Per
Labor Costs Total Cow Cwt. Total Cow Cwt. -Value of operator{s) labor ($1,400/mo.) $22,582 $221 $1.19 $ $ $
Family unpaid ($l, 400/mo.) 3,990 39 .21
Hired 29.939 ....2.ll --.l.....2.a Total Labor $56,511 $553 $2.98 $ $ $ Machinery Cost $46,424 $455 $2.45 $ $ $ Total Labor & Mach. $102,935 $1,008 $5.43 $ $ $

21
COMPARATIVE ANALYSIS OP THE PARK BUSINESS
Proare.. of the Parm Busines.
Comparing your business with average data from regional DFBS cooperators that participated in both of the last two years can be helpful to establishing your goals for these parameters. It is equally important for you to determine the progress your business has made over the past two or three years, to compare this progress to your goals, and to set goals for the future.
PROGRESS OP THB PARK BUSINESS Same 58 Eastern Plateau Region Farms, 1992 & 1993
Ayerage of 58 Farms* My Farm Selected Factors 1992 1993 1992 1993 Goal
size of Business Average number of cows Average number of heifers Milk sold, lbs. Worker equivalent Total tillable acres
97 100 78 80
1,833,508 1,873,416 3.03 3.00
272 278 Rates of Production Milk sold per cow, lbs. Hay DM per acre, tons Corn silage per acre, tons Labor Efficiency Cows per worker Milk sold/worker, lbs. Cost Control
18,882 2.78
16
32 605,398
18,776 2.58
15
33 624,160
Grain & conc. purchased as % of milk sales 28% 29% % % %
Dairy feed & crop expo per cwt. milk
Labor & maph. costs/cow Operating cost of producing
cwt. of milk
$4.66 $1,028
$10.24
$4.60 $1,026
$10.04
$ $
$
$ $
$
$ $
$ Capital Efficiency** Farm capital per cow Mach. & equip. per cow Asset turnover ratio
$6,642 $1,397
.47
$6,836 $1,340
.43
$ $
$ $
$ $
Profitability Net farm inc. w/o apprec. Net farm inc. w/apprec. Labor & mgt. income
per oper./manager Rate of return on eq.
capital w/apprec. Rate of return on all
capital w/apprec. Financial Summary Farm net worth, end year Debt to asset ratio
$40,558 $55,309
$10,649
5%
6%
$455,509 .32
$36,230 $46,205
$6,369
3%
4%
$478,942 .31
$ $
$
$
%
%
$ $
$
$
$ $
$
%
%
$
%
% -Farm debt per cow $2,127 $2,068 $
*Farms participating both years. **Average for the year.

22 Reaional Parm Business Chart
The Farm Business Chart is a tool which can be used in analyzing your business. Compare your business by drawing a line through or near the figure in each column which represents your current level of performance. The five figures in each column represent the average of each 20 percent or quintile of farms included in the regional summary. Use this information to identify business areas where more challenging goals are needed.
PARK BUSINESS CHART POR PARK MANAGEMENT COOPERATORS 66 Eastern Plateau Region Dairy Farms, 1993
Size of Business Rates of Production Labor Efficiency Worker No. Pounds Pounds Tons Tons Corn Cows Pounds Equiv of Milk Milk Sold Hay Crop Silage Per Milk Sold alent Cows Sold Per Cow OM/Acre Per Acre Worker Per Worker
(11) * (11) (11) (10) (9 ) (9 ) (11) (11)
5.8 221 4,206,451 21,731 4.7 21 44 828,164 3.2 100 1,875,061 19,845 3.1 17 35 632,842 2.6 78 1,446,280 18,370 2.5 15 32 567,472 2.1 58 1,039,924 16,827 2.0 12 27 494,494 1.5 44 721,201 14,243 1.4 9 23 .399,238
Cost Control
Grain % Grain is Machinery Labor & Feed & Crop Feed & Crop Bought of Milk Costs Machinery Expenses Expenses .Per
Per Cow Receipts Per Cow Costs Per Cow Per Cow Cwt. Milk
(10) (10) (11) (11) (10) (10)
$431 19% $271 $735 $576 $3.35 600 26 382 920 730 4.24 700 30 453 1,016 841 4.72 802 33 506 1,157 954 5.07 998 38 658 1,322 1,126 5.79
Value and Cost of Production Profitability Milk Oper. Cost Total Cost Net Farm Net Farm Labor & Change in
Receipts Milk Production Income Inc. w/o Mgt. Inc. Net Worth Per Cow Per Cwt. Per Cwt. w/Apprec. Apprec. Per Oper. w/Apprec.
(10) (10) (10) (3 ) (3 ) (3 ) (6 )
$2,861 $7.10 $12.46 $111,237 $85,225 $35,581 $56,185 2,650 8.95 13 .89 57,554 45,850 13,777 24,109 2,435 9.81 14.70 38,137 30,656 4,499 11,182 2,182 10.74 15.48 22,695 20,110 -4,351 3,062 1,892 12.51 17 .38 -769 -5,176 -24,501 -22,277
*Page number of the participant's DFBS where the factor is located.

-----------------------------------------------------------
23
New York Stat. Parm Busin.s. Chart.
The Farm Business Chart is a tool which can be used in analyzing a business by drawing a line through the figure in each column which represents the current level of management performance. The figure at the top of each column is the average of the top 10 percent of the 357 farms for that factor. The other figures in each column are the average for the second 10 percent, third 10 percent, etc. Each column of the chart is independent of the others. The farms which are in the top 10 percent for one factor would D2t necessarily be the same farms which make up the top 10 percent for any other factor.
The cost control factors are ranked from low to high, but the lowest cost is not necessarily the most profitable. In some cases, the "best" management position is somewhere near the middle or average. Many things affect the level of costs, and must be taken into account when analyzing the factors.
PARK BUSINESS CHART POR PARK KANAGEKENT COOPERATORS 357 New York Dairy Farms, 1992
Size of Business Rates of Production Labor Efficiency Worker No. Pounds Pounds Tons Tons Corn Cows Pounds Equiv- of Milk Milk Sold Hay Crop Silage Per Milk Sold alent Cows Sold Per Cow OM/Acre Per Acre Worker Per Worker
(11) * (11) (11) (10) (9 ) (9 ) (11) (11)
10.0 428 8,455,437 22,613 4.8 22 52 959,379 5.4 184 3,511,396 21,180 3.7 18 43 797,982 4.1 136 2,551,838 20,249 3.2 17 38 715,818 3.4 107 1,971,002 19,582 3.0 16 34 640,614 3.0 89 1,660,762 18,753 2.7 15 32 587,553
2.6 76 1,366,246 18,065 2.5 15 29 534,745 2.4 04 1,149,820 17,445 2.3 13 27 477,585 2.1 57 964,766 16,486 2.1 12 25 432,399 1.8 48 792,337 15,085 1.8 10 23 389,221 1.2 37 578,602 12,400 1.4 6 18 296,180
Cost Control
Grain % Grain is Machinery Labor & Feed & Crop Feed & Crop Bought of Milk Costs Machinery Expenses Expenses Per Per Cow Receipts Per Cow Costs Per Cow Per Cow Cwt. Milk
(10 ) (10) (ll) (11) (10) (10)
$348 16% $250 $675 $497 $3.23 484 21 325 803 649 3.77 556 24 379 867 716 4.09 618 26 414 926 783 4.36 665 27 442 993 832 4.55 -712 29 478 1,058 892 4.76 763 31 512 1,114 943 4.99 826 32 548 1,180 1,004 5.27 896 35 608 1,274 1,071 5.70
1,030 42 796 1,563 1,232 6.76
*Page number of the participant's DFBS where the factor is located.

24
PARK BUSINESS CHART POR PARK KANAGEMENT COOPERATORS
357 New York Dairy Farms, 1992
Milk Receipts Per Cow
(10)
Milk Receipts Per Cwt.
(10)
Oper. Cost Milk
Per Cow (10)
Oper. Cost Milk
Per Cwt. (10)
Total Cost Production
Per Cow (10)
Total Cost Production
Per Cwt. (10)
$3,086 2,861 2,732 2,638 2,527
$14.64 14.02 13.77 13.60 13 .46
$1,068 1,419 1,575 1,706 1,845
$ 6.84 8.27 8.96 9.62
10.15
$1, 952 2,312 2,452 2,567 2,691
$11. 79 13 .00 13.60 14.12 14.75
2,434 2,340 2,199 2,023 1,684
13 .38 13 .27 13.15 13 .02 12.56
1,954 2,051 2,163 2,357 2,636
10.67 11.07 11.51 12.18 14.08
2,792 2,934 3,091 3,241 3,666
15.44 16.01 16.59 17.54 21.09
Profitability
Return to Operator's Labor, Labor &
Net Farm Income Management. & Eauitv Capital Management Income With Without With Without Per Per
Appreciation Appreciation Appreciation Appreciation Farm Operator (3 ) (3 ) (3 ) (3 ) (3 ) (3 )
$275,597 $218,659 $272,714 $216,089 $152,525 $111,774 99,964 79,562 97,288 77,148 46,635 33,282 71,930 55,878 68,243 53,019 28,823 20,747 55,060 42,428 52,537 38,519 18,603 12,977 44,009 32,527 39,218 27,999 9,260 6,723
33,724, 23,687 29,676 19,523 1,980 1,639 26,725 16,924 22,688 12,394 -4,505 -3,779 18,592 9,627 14,777 5,882 -13,845 -11,067
8,916 353 5,299 -4,196 -23,769 -21,005 -16,432 -31,254 -20,794 -34,417 -61,040 -53,650
Farm Business Charts for farms with freestall barns and 120 cows or less and more than 120 cows, and farms with conventional barns with 60 cows or less and more than 60 cows are shown on pages 28-31.
Pinancial Analy,i. Chart
The farm financial analysis chart on page 25 is designed just like the Farm Business Chart and may be used to assess the financial health of the farm business. Most of the financial measures used in the chart are defined on pages 6, 10, 14 and 20 of this publication. References to DFBS output page numbers for participating dairy farmers are provided in the table headings.

25
PINANCIAL ANALYSIS CHART 357 New York Dairy Farms, 1992
Liquidity (repayment) Planned Debt Available for Cash Flow Debt Payments
Payments Debt Service Coverage as Percent Debt Per Cow Per Cow Ratio of Milk Sales Per Cow
(8)*
$ 46 191 276 362 411 458 501 584 677 885
(12)
$840 663 579 494 440 401 339 274 181 -22
Solyency
(8)
4.11 1. 75 1.37 1.14 0.98 0.86 0.73 0.60 0.29
-0.14
Leverage Ratio"
Percent Equity
(5)
Debt/Asset Current &
Intermediate
Ratio Long Term
(5) (5)
0.02 0.11 0.24 0.35 0.48 0.58 0.74 0.95 1.29 3.20
98% 90 81 73 68 63 57 52 44 29
0.01 0.08 0.14 0.21 0.29 0.35 0.39 0.46 0.55 0.77
0.00 0.00 0.04 0.18 0.28 0.38 0.48 0.57 0.70 1.04
Efficiency (Capitall Asset Real Estate Machinery Total Farm Change in Turnover Investment Investment Assets Net Worth (ratio) Per Cow Per Cow Per Cow w/Appreciation
(11)
.71
.57
.52
.48
.45
.42
.39
.35
.31
.24
(8) (5)
5% $ 116 9 754
13 1,302 15 1,781 17 2,160 19 2,521 22 2,882 25 3,243 30 3,735 38 5,214
Profitabi lity Percent Rate of Return with
appreciation on; Equity Investment***
( 11)
$1,327 2,044 2,372 2,667 2,967 3,279 3,663 4,188 4,861 7,201
(11)
$ 545 792 942
1,054 1,194 1,358 1,520 1,753 2,008 2,722
(3)
22% 11
8 5 3 1
-1 -4 -8
-26
(3)
16% 10
8 6 4 3 1
-1 -2 -7
( 11)
$ 4,339 5,156 5,727 6,243 6,680 7,120 7,621 8,236 9,100
12,014
( 11)
$185,910 59,227 40,515 28,384 19,748 13,025
5,269 -2,230
-10,422 -50,747
-*Page number of the participant's DFBS where the factor is located. **Dollars of debt per dollar of equity, computed by dividing total liabilities by total equity. ***Return on all farm capital (no deduction for interest paid) divided by total farm assets.

26
cgmpAri'OD by Type of Barn and Herd Size
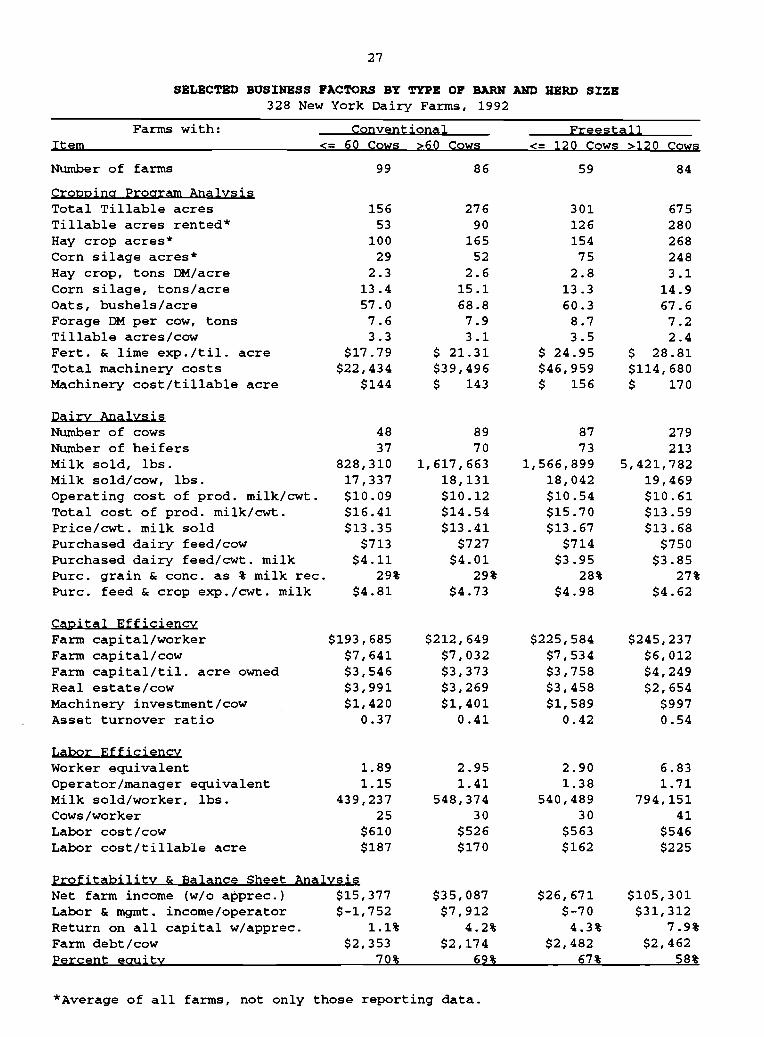
When analyzing a dairy farm business by comparing it to a group of farms, it is important that the group of farms have used as many of the same physical characteristics as possible as the farm being analyzed. To assist in this endeavor, dairy farms in the summary have been divided into those with freestall and those with conventional housing. Conventional housing includes stanchion and tiestall barns. Within each group, is a further classification by size of the dairy herd.
The table on page 27 includes the average values for the resulting four groups of dairy farms. The average size of farms in the four groups ranges from 47 cows on the small conventional farms to 250 cows on the large freestall farms. The large conventional farms and small freestall farms averaged approximately the same herd size and rates of milk output per cow.
The large freestall farms averaged the highest milk output per cow and per worker, the lowest total costs of production and investment per cow, and the greatest returns to labor, management and capital. The large conventional farms showed average profits somewhat higher than the small freestall operations. Total costs of production averaged substantially less on the large conventional farms.
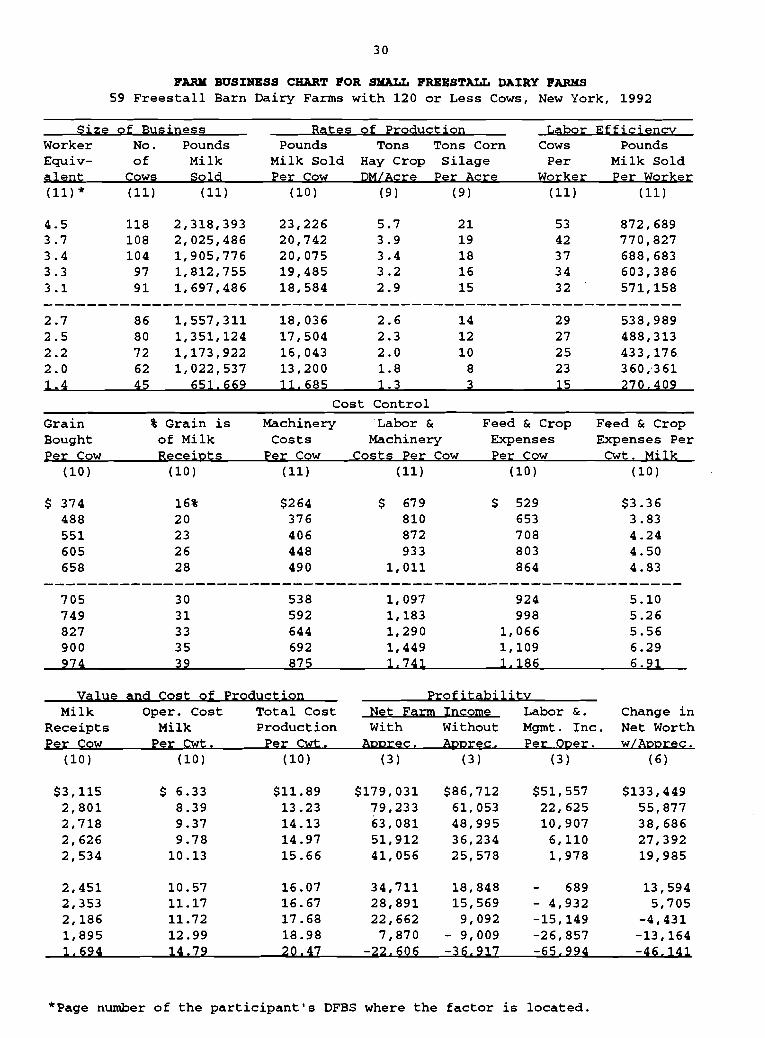
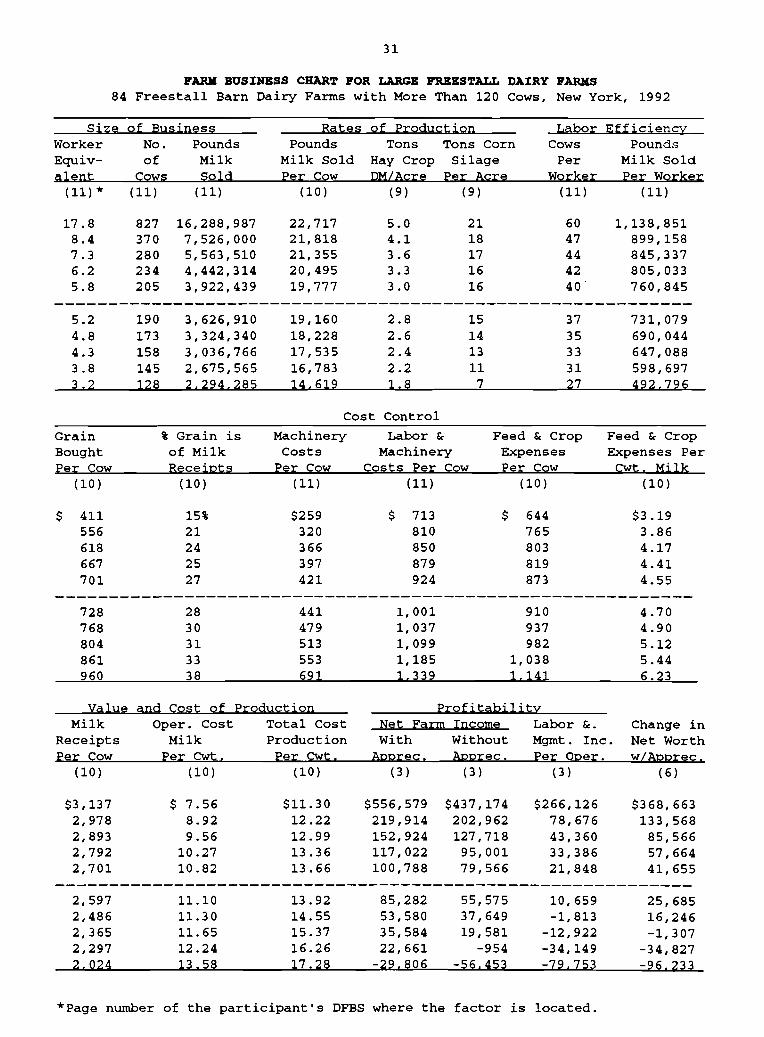
Farm business charts have been computed for each of the four housing and herd size categories and are on pages 28-31. By comparing the farm's performance on the most appropriate business chart, a farm manager will be better able to evaluate his or her business performance.
Herd Sile Cgmpari,oD'
A detailed comparison of profitability, financial situation and business analysis factors across herd sizes is contained on pages 40-49 of the 1992 State Summary*. As herd size increases, the average profitability generally increases (pages 42-43). Net farm income without appreciation was $252,256 per farm for the 300 or more herd size group and $4,790 per farm for those with less than 40 cows. This relationship generally holds for all measures of profitability including rate of return on capital. However, the 200 to 299 herd size group showed a lower level of profitability in 1992 than the farms with 150-199 cows.
Farm net worth increases rapidly as herd size increases (pages 44-47), even though percent equity was higher on the smaller farms. The 85 to 99 cow group and the group with more than 300 cows demonstrated the strongest ability to make debt payments.
Crop yields showed little relationship to herd size, but fertilizer and lime expenses, and machinery cost per tillable acre generally increased as herd size increased (pages 48-49)*. Milk sold per cow increased as herd size increased, ranging from 17,208 pounds on the farms with less than 40 cows to 19,795 pounds on farms with 300 or more cows. Farm capital per worker increased, and farm capital per cow decreased as herd size increased. Milk sold per worker increased ....dramatically as herd size increased, ranging from 369,797 pounds at the lowest herd size category up to 923,495 pounds at the largest size category.
*Smith, Stuart F., Wayne A. Knoblauch, and Linda D. Putnam, Dairy Farm Management Business Summary, New York, 1992, Department of Agricultural, Resource, and Managerial Economics, Cornell University, A.E. Res. 93-11, August 1993.
27
SBLBCTBD BUSINESS FACTORS BY TYPB OF BARN AND HERD SIZB 328 New York Dairy Farms, 1992
Farms with: Conventional Freestall Item <= 60 Cows >60 Cows <= 120 Cows >120 Cows
Number of farms 99 86 59 84
Cropping Program Analysis Total Tillable acres 156 276 301 675 Tillable acres rented* 53 90 126 280 Hay crop acres· 100 165 154 268 Corn silage acres· 29 52 75 248 Hay crop, tons DM/acre 2.3 2.6 2.8 3.1 Corn silage, tons/acre 13 .4 15.1 13 .3 14.9 Oats, bushels/acre 57.0 68.8 60.3 67.6 Forage DM per cow, tons 7.6 7.9 8.7 7.2 Tillable acres/cow 3.3 3.1 3.5 2.4 Fert. & lime exp. /til. acre $17.79 $ 21.31 $ 24.95 $ 28.81 Total machinery costs $22,434 $39,496 $46,959 $114,680 Machinery cost/tillable acre $144 $ 143 $ 156 $ 170
pairy Analysis Number of cows 48 89 87 279 Number of heifers 37 70 73 213 Milk sold, lbs. 828,310 1,617,663 1,566,899 5,421,782 Milk sold/cow, lbs. 17,337 18,131 18,042 19,469 Operating cost of prod. milk/ewt. $10.09 $10.12 $10.54 $10.61 Total cost of prod. milk/ewt. $16.41 $14.54 $15.70 $13.59 Price/ewt. milk sold $13.35 $13 .41 $13.67 $13.68 Purchased dairy feed/cow $713 $727 $714 $750 Purchased dairy feed/ewt. milk $4.11 $4.01 $3.95 $3.85 Purc. grain & conc. as % milk rec. 29% 29% 28% 27% Purc. feed & crop exp./ewt. milk $4.81 $4.73 $4.98 $4.62
Capital Efficiency Farm capital/worker Farm capital/cow Farm capital/til. acre owned Real estate/cow Machinery investment/cow Asset turnover ratio
$193,685 $7,641 $3,546 $3,991 $1,420
0.37
$212,649 $7,032 $3,373 $3,269 $1,401
0.41
$225,584 $7,534 $3,758 $3,458 $1,589
0.42
$245,237 $6,012 $4,249 $2,654
$997 0.54
Labor Efficiency Worker equivalent Operator/manager equivalent Milk sold/worker, lbs. Cows/worker Labor cost/cow Labor cost/tillable acre
1.89 1.15
439,237 25
$610 $187
2.95 1.41
548,374 30
$526 $170
2.90 1.38
540,489 30
$563 $162
6.83 1. 71
794,151 41
$546 $225 -
AnalysisProfitability & Balance Sheet Net farm income (w/o apprec.) Labor & mgmt. income/operator Return on all capital w/apprec. Farm debt/cow Percent equity
$15,377 $-1,752
1.1% $2,353
70%
$35,087 $7,912
4.2% $2,174
69%
$26,671 $-70
4.3% $2,482
67%
$105,301 $31,312
7.9% $2,462
58%
*Average of all farms, not only those reporting data.

-----------------------------------------------------------
28
PARK BUSINESS CHART POR SHALL CONVENTIONAL STALL DAIRY PARKS 99 Conventional Stall Dairy Farms with 60 or Less Cows, New York, 1992
Size of Business Rates of Production Labor Efficiency Worker No. Pounds Pounds Tons Tons Corn Cows Pounds Equiv of Milk Milk Sold Hay Crop Silage Per Milk Sold alent Cows Sold Per Cow PM/Acre Per Acre Worker Per Worker (11) * (11) (11) (10) (9) (9) (11) (11)
2.9 60 1,216,307 21,382 3.1 22 46 760,933 2.5 59 1,056,041 19,969 3.1 18 36 627,590 2.3 56 971,222 19,389 2.9 16 30 540,690 2.1 52 904,369 18,540 2.6 15 27 492,638 2.0 50 833,676 18,160 2.4 15 26 454,994
1.8 47 784,602 17,523 2.2 13 24 427,601 1.6 44 741,239 16,512 2.1 12 23 400,809 1.4 42 663,822 15,520 1.9 12 22 369,048 1.2 38 614,828 14,121 1.6 10 20 323,957 1.0 29 460,178 11. 563 1.2 4 16 241. 563
Cost Control
Grain % Grain is Machinery Labor & Feed & Crop Feed & Crop Bought of Milk Costs Machinery Expenses Expenses Per Per Cow Receipts Per Cow Costs Per Cow Per Cow Cwt. Milk
(10) (10) (11) (11) (10) (10)
$324 17% $251 $ 666 $ 451 $3.20 454 23 304 810 582 3.78 531 25 352 917 671 4.12 602 26 396 977 724 4.34 650 28 437 1,049 783 4.52
690 29 470 1,108 849 4.73 729 31 506 1,159 913 4.95 796 33 545 1,212 967 5.33 874 35 599 1,316 1,054 5.90
1. 068 43 867 1. 680 1. 302 6.88
'Value and Cost of Production Profitability Milk Oper. Cost Total Cost Net Farm Income Labor &. Change in
Receipts Milk Production With Without Mgmt. Inc. Net Worth Per Cow Per Cwt. Per Cwt. Apprec. Apprec. Per Oper. w/Apprec.
(10) (10) (10) (3 ) (3 ) (3) (6 )
$2,911 $ 6.56 $12.90 $63,046 $44,806 $23,678 $59,924 2,698 8.05 14.03 45,628 34,597 14,168 35,056 2,574 8.52 14.70 36,269 27,896 9,493 22,019 2,497 9.30 15.40 28,971 22,714 4,888 16,391 2,422 9.88 16.05 24,643 17,420 1,521 12,621 2,322 10.38 16.43 18,479 12,690 -2,983 6,278 2,178 10.84 16.83 14,042 8,549 -7,798 119 2,049 11.31 17.59 8,645 2,239 -13,240 -4,219 1,882 12.23 19.38 3,338 -3,095 -19,918 -9,925 1. 468 13.66 23.90 -9,920 -17,335 -38,585 -20,443
* Page number of the participant's DFBS where the factor is located.

-----------------------------------------------------------
29
PAD BOSl:HBSS CHART POR LARCB CORVBHTl:OHAL STALL DAl:RY PARKS 86 Conventional Stall Dairy Farms with More Than 60 Cows, New York, 1992
Size of Business Rates of Production Labor Efficiencv Worker No. Pounds Pounds Tons Tons Corn Cows Pounds Equiv- of Milk Milk Sold Hay Crop Silage Per Milk Sold alent Cows Sold Per Cow pM/Acre Per Acre Worker Per Worker (11) * (11 ) (11) (10) (9 ) (9 ) (11) (11)
4.9 153 2,798,611 22,871 5.0 23 48 876,546 3.7 115 2,136,428 20,905 3.6 19 37 724,109 3.3 101 1,839,098 20,106 3.2 17 34 641,723 3.1 90 1,662,293 19,342 2.9 17 32 592,104 2.9 83 1,550,272 18,385 2.7 16 31 563,811
2.6 77 1,423,737 17,845 2.5 15 29 512,314 2.5 70 1,333,387 17,054 2.2 13 27 467,326 2.3 67 1,236,304 16,373 2.0 12 25 430,539 2.1 65 1,104,978 15,006 1.8 10 24 397,414 1.8 62 878.461 12.535 1.4 7 21 352.630
Cost Control
Grain % Grain is Machinery Labor & Feed & Crop Feed & Crop Bought of Milk Costs Machinery Expenses Expenses Per Per Cow Receipts Per Cow Costs Per Cow Per Cow Cwt. Milk
(10) (10) (11) (11) (10) (10)
$ 311 14% $223 $ 620 $ 442 $3.02 411 20 316 747 580 3.60 506 22 369 824 656 3.79 568 24 412 887 707 4.04 636 26 426 945 811 4.41
710 28 447 1,014 875 4.64 807 31 489 1,075 953 4.93 870 34 523 1,122 1,004 5.19 925 37 563 1,197 1,058 5.60
1.054 42 718 1.372 1.245 6.51
Value and Cost of Production Profitability Milk Opera Cost Total Cost Net Farm Income Labor &. Change in
Receipts Milk Production With Without Mgmt. Inc. Net Worth Per Cow Per cwt. Per cwt. Apprec. Apprec. Per Opera w/Apprec.
(10) (10) (10) (3) (3) (3) (6 )
$3,093 $ 6.72 $11. 87 $108,267 $91,353 $43,558 $82,187 2,821 7.90 12.73 74,747 65,766 28,599 41,744 2,690 8.52 13.29 62,248 55,029 23,048 32,305 2,590 9.10 13 .68 53,294 43,685 18,555 25,438 -2,465 9.66 14.21 45,675 37,569 9,783 15,961
2,394 10.37 14.75 34,976 28,776 4,808 8,831 2,265 10.88 15.42 27,816 19,963 -1,813 4,654 2,159 11.34 15.91 19,825 12,165 -7,608 -157 2,013 11. 76 16.56 11,517 2,831 -17,446 -6,447 1. 699 12.91 18.29 -9.556 -20.251 -43.084 -39.646
*Page number of the participant's DFBS where the factor is located.
-----------------------------------------------------------
30
PARK BUSIHBSS CHART POR SHALL PREBSTALL DAIRY PARKS 59 Freestall Barn Dairy Farms with 120 or Less Cows, New York, 1992
Size of Business Rates of Production Labor Efficiency Worker No. Pounds Pounds Tons Tons Corn Cows Pounds Equiv- of Milk Milk Sold Hay Crop Silage Per Milk Sold alent Cows Sold Per Cow OM/Acre Per Acre Worker Per Worker (11) * (11) (11) (10) (9) (9 ) (11) (11)
4.5 118 2,318,393 23,226 5.7 21 53 872,689 3.7 108 2,025,486 20,742 3.9 19 42 770,827 3.4 104 1,905,776 20,075 3.4 18 37 688,683 3.3 97 1,812,755 19,485 3.2 16 34 603,386 3.1 91 1,697,486 18,584 2.9 15 32 571,158
2.7 86 1,557,311 18,036 2.6 14 29 538,989 2.5 80 1,351,124 17,504 2.3 12 27 488,313 2.2 72 1,173,922 16,043 2.0 10 25 433,176 2.0 62 1,022,537 13,200 1.8 8 23 360,-361 1.4 45 651. 669 11. 685 1.3 3 15 270.409
Cost Control
Grain % Grain is Machinery "Labor & Feed & Crop FQed & Crop Bought of Milk Costs Machinery Expenses Expenses Per Per Cow Receipts Per Cow Costs Per Cow Per Cow Cwt. Milk
(10) (10) (11 ) (11) (10) (10)
$ 374 16% $264 $ 679 $ 529 $3.36 488 20 376 810 653 3.83 551 23 406 872 708 4.24 605 26 448 933 803 4.50 658 28 490 1,011 864 4.83
705 30 538 1,097 924 5.10 749 31 592 1,183 998 5.26 827 33 644 1,290 1,066 5.56 900 35 692 1,449 1,109 6.29 974 39 875 1. 741 1.186 6.91
Value and Cost of Production Profitability Milk Oper. Cost Total Cost Net Farm Income Labor &. Change in
Receipts Milk Production With Without Mgmt. Inc. Net Worth Per Cow Per cwt. Per cwt. Mprec. Apprec. Per Oper. w/Apprec.
(10) (10) (10) (3 ) (3 ) (3 ) (6 )
$3,115 $ 6.33 $11. 89 $179,031 $86,712 $51,557 $133,449 2,801 8.39 13.23 79,233 61,053 22,625 55,877 2,718 9.37 14.13 63,081 48,995 10,907 38,686 2,626 9.78 14.97 51,912 36,234 6,110 27,392 2,534 10.13 15.66 41,056 25,578 1,978 19,985 2,451 10.57 16.07 34,711 18,848 689 13,594 2,353 11.17 16.67 28,891 15,569 - 4,932 5,705 2,186 11.72 17.68 22,662 9,092 -15,149 -4,431 1,895 12.99 18.98 7,870 - 9,009 -26,857 -13,164 1. 694 14.79 20.47 -22,606 -36.917 -65.994 -46.141
*Page number of the participant's DFBS where the factor is located.
-----------------------------------------------------------
-----------------------------------------------------------
31
PARK BUS:IHBSS CHAR'l' POR LARGB PRBES'l'ALL DA:IRY PAlUUJ 84 Freesta11 Barn Dairy Farms with More Than 120 Cows, New York, 1992
Size of Business Rates of Production Labor Efficiency Worker No. Pounds Pounds Tons Tons Corn Cows Pounds Equiv- of Milk Milk Sold Hay Crop Silage Per Milk Sold alent Cows Sold Per Cow OM/Acre Per Acre Worker Per Worker
(11) * (11) (11) (10) (9 ) (9 ) (11) (11)
17.8 827 16,288,987 22,717 5.0 21 60 1,138,851 8.4 370 7,526,000 21,818 4.1 18 47 899,158 7.3 280 5,563,510 21,355 3.6 17 44 845,337 6.2 234 4,442,314 20,495 3.3 16 42 805,033 5.8 205 3,922,439 19,777 3.0 16 40 760,845
5.2 190 3,626,910 19,160 2.8 15 37 731,079 4.8 173 3,324,340 18,228 2.6 14 35 690,044 4.3 158 3,036,766 17,535 2.4 13 33 647,088 3.8 145 2,675,565 16,783 2.2 11 31 598,697 3.2 128 2,294,285 14,619 1.8 7 27 492,796
Cost Control
Grain % Grain is Machinery Labor & Feed & Crop Feed & Crop Bought of Milk Costs Machinery Expenses Expenses Per Per Cow Receipts Per Cow Costs Per Cow Per Cow cwt. Milk
(10) (10) (11) (11) (10) (10)
$ 411 15% $259 $ 713 $ 644 $3.19 556 21 320 810 765 3.86 618 24 366 850 803 4.17 667 25 397 879 819 4.41 701 27 421 924 873 4.55
728 28 441 1,001 910 4.70 768 30 479 1,037 937 4.90 804 31 513 1,099 982 5.12 861 33 553 1,185 1,038 5.44 960 38 691 1. 339 1,141 6.23
Value and Cost of Production Profitabil ity Milk Oper. Cost Total Cost Net Farm Income Labor &. Change in
Receipts Milk Production With Without Mgmt. Inc. Net Worth Per Cow Per Cwt. Per Cwt. Apprec. Apprec. Per Oper. w/Apprec.
(10) (10) (10) (3 ) (3 ) (3) (6 )
$3,137 $ 7.56 $11.30 $556,579 $437,174 $266,126 $368,663 2,978 8.92 12.22 219,914 202,962 78,676 133,568 2,893 9.56 12.99 152,924 127,718 43,360 85,566 2,792 10.27 13 .36 117,022 95,001 33,386 57,664 2,701 10.82 13.66 100,788 79,566 21,848 41,655
2,597 11.10 13.92 85,282 55,575 10,659 25,685 2,486 11.30 14.55 53,580 37,649 -1,813 16,246 2,365 11.65 15.37 35,584 19,581 -12,922 -1,307 2,297 12.24 16.26 22,661 -954 -34,149 -34,827 2.024 13.58 17 .28 -29.806 -56.453 -79.753 -96,233
*Page number of the participant's DFBS where the factor is located.

32
IDENTIFY AND SET GOALS
If businesses are to be successful, they must have direction. Written goals help provide businesses with an identifiable direction over both the long and short term. Goal setting is as important on a dairy farm as it is in other businesses. Written goals are a tool which farm operators can use to ensure that the business continues to move in the proper direction. Goals should be SMART:
l. Goals should be Specific.
2. Goals should be Measurable.
3. Goals should be Achieyable but challenging.
4. Goals should be Rewarding.
5. You should designate a~ when each goal will be achieved.
Goal setting on a dairy farm does not have to be a complex process. In many cases it provides a process for writing down and agreeing on goals that you have already given some thought to. It is also important to remember that once you write out your goals they are not cast in concrete. If a change takes place which has a major impact on the farm business, the goals should be reworked to accommodate that change. Refer to your goals as often as necessary to keep the farm business progressing.
It is important to identify both objectives (long-range) and goals (short-range) when looking at the future of your farm business.
A suggested format for writing out your goals is as follows:
a. Begin with a mission statement which describes why the business exists based on the preferences and values of the owners.
b. Identify 4-6 objectives.
c. Identify SMART goals.
Worksheet for Setting Goals
I. Mission and Objectives
-

33
Worksheet for Setting Goals (continued)
II. Goals
What How When Who is Responsible
Summarize Your Business Performance
The Farm Business and Financial Analysis Charts on pages 22-25 and 28-31 can be used to help identify strengths and weaknesses of your farm business. Identify three major strengths and three areas of your farm business that need improvement.
Strengths : _ Needs improvement : _
-
34
GLOSSARY AND LOCATION' 01' CODON' TERHS
Account. Payable - Open accounts or bills owed to feed and supply firms, cattle dealers, veterinarians and other providers of farm services and supplies.
Account. Receivable - Outstanding receipts from items sold or sales proceeds not yet received, such as the payment for December milk sales received in January.
Accrual Bxpen.e. - (defined on page 3)
Accrual Receipts - (defined on page 4)
Annual Ca.h PlOW Statement - (defined on page 12)
Appreciation - (defined on page 5)
As.et TUrnover Batio - The ratio of total farm income to total farm assets, calculated by dividing total accrual operating receipts plus appreciation by average total farm assets.
Balance Sheet - A "snapshot" of the business financial position at a given point in time, usually December 31. The balance sheet equates the value of assets to liabilities plus net worth.
Capital Efficiencv - The amount of capital invested per production unit. Relatively high investments per worker with low to moderate investments per cow imply efficient use of capital.
Ca.h Prgm Bentarm Capital U.ed in the Bu.ine•• - Transfers of money from nonfarm savings or investments to the farm business where it is used to pay operating expenses, make debt payments and/or capital purchases.
Ca.h PlOW Coverage Ratio - (defined on page 14)
Ca.h Paid - (defined on page 2)
Ca.h Receipt. - (defined on page 4)
Change in Account. Payable - (defined on page 3)
ChApge in AcCOunt. Receivable - (defined on page 4)
Change in Inveptory - (defined on page 2)
Current Portion - (defined on page 7)
Dairy <tara) - A farm business where dairy farming is the primary enterprise, operating and managing this farm is a full-time occupation for one or more people and cropland is owned.
Dairy Cash-Crop <tara) - Operating and managing this farm is the full-time occupation of one or more people, cropland is owned but crop sales exceed 10 percent of accrual milk receipts.
Debt Per Cgw - Total end-of-year debt divided by end-of-year number of cows.
Debt to Aa.et Batio. - (defined on page 10)
Deterred TA%e. - (defined on page 9)
Dry Matter - The amount or proportion of dry material that remains after all water is removed. Commonly used to measure dry matter percent and tons of dry matter in feed.
lquity Capital - The farm operator/manager's owned capital or farm net worth.

35
Bmansion Liyestock - Purchased dairy cattle and other livestock that cause an increase in herd size from the beginning to the end of the year.
Fara Debt Payments as Percent of Kilk Sales - Amount of milk income committed to debt repayment, calculated by dividing planned debt payments by total milk receipts. A reliable measure of repayment ability, see page 14.
Farm Debt PaymeQts Per Cow Planned or scheduled debt payments per cow represent the repayment plan scheduled at the beginning of the year divided by the average number of cows for the year. This measure of repayment ability is used in the Financial Analysis Chart.
Financial Lease - A long-term non-cancellable contract giving the lessee use of an asset in exchange for a series of lease payments. The term of a financial lease usually covers a major portion of the economic life of the asset. The lease is a substitute for purchase. The lessor retains ownership of the asset.
Income Statoment - A complete and accurate account of farm business receipts and expenses used to measure profitability over a period of time such as one year or one month.
Labor and ¥anaaement Income - (defined on page 6)
Labor and Hanaaoment Income Per Operator - The return to the owner/manager's labor and management per full-time operator.
Labor Bfficiency - Production capacity and output per worker.
Liquidity - Ability of business to generate cash to make debt payments or to convert assets to cash.
Net Farm Income - (defined on page 5)
Net Worth - The value of assets less liabilities equal net worth. It is the equity the owner has in owned assets.
Operatina Costs of Producina Kilk - (defined on page 19)
Opportunity Costs - The cost or charge made for using a resource based on its value in its most likely alternative use. The opportunity cost of a farmer's labor and management is the value he/she would receive if employed in his/her most qualified alternative position.
other Liyestock Rxpenses - All other dairy herd and livestock expenses not included in more specific categories. Other livestock expenses include; bedding, DHIC, milk house and parlor supplies, livestock board, registration fees and transfers.
Part-T1me Cash-Crop Dairy (farm) - Operating and managing this farm is not a fulltime occupation, crop sales exceed 10 percent of accrual milk receipts and cropland is owned.
Part-Time Dairy (fara) - Dairy farming is the primary enterprise, cropland is owned but operating and managing this farm is not a full-time occupation for one or more people.
Personal Withdrawals and Family Rxpenditures Includina Nonfarm Debt Payments - All the money removed from the farm business for personal or nonfarm use including family living expenses, health and life insurance, income taxes, nonfarm debt .... payments, and investments.
Profitability - The return or net income the owner/manager receives for using one or more of his or her resources in the farm business. True "economic profit" is what remains after deducting all the costs including the opportunity costs of the owner/manager's labor, management, and equity capital.
Purchased Inputs Cost of Producina Kilk - (defined on page 19)

36
RepAYment Analyaia - An evaluation of the business' ability to make planned debt payments.
ReplaCement Liyestock - Dairy cattle and other livestock purchased to replace those that were culled or sold from the herd during the year.
Return on Equity Capital - (defined on page 7)
Return on Total Capital - (defined on page 7)
Return to Operatora' Labor. Management. and Bquity Capital - (defined on page 6)
Solyency - The extent or ability of assets to cover or pay liabilities. Debt/asset and leverage ratios are common measures of solvency.
Total Costs of Producing Kilk - (defined on page 19)
Whole Para Method - A procedure used to calculate costs of producing milk on dairy farms without using enterprise cost accounts. All non-milk receipts are assigned a cost equal to their sale value and deducted from total farm expenses to determine the costs of producing milk.
-

Accounts Payable Accounts Receivable Accrual Expenses Accrual Receipts Acreage . Advanced Government
Receipts . Age . Amount Available
for Debt Service. Annual Cash Flow
Statement Appreciation Asset Turnover Ratio. Balance Sheet Barn Type Business Type Capital Efficiency Cash From Nonfarm
Capital Used in the Business .
Cash Flow Coverage Ratio Cash Paid . Cash Receipts Change in Accounts
Payable . Change in Accounts
Receivable Change in Inventory Change in Net Worth Crop Expenses Crop/Dairy Ratios Current Portion. Dairy (farm) Dairy Cash-Crop (farm) Debt Per Cow .. Debt to Asset Ratios Deferred Taxes Depreciation Dry Matter ... Education Equity Capital Expansion Livestock Expenses ..... Farm Business Chart.
Farm Debt Payments as Percent of Milk Sales
Farm Debt Payments Per Cow .
37
INDia
Paqe(sl
3,8 4,8 3,5 4,5
16
7,8 20
14
12 5,11,18
20 8 2 2
20
12 14
2 4,12
3
4 2,3
11 3,17
16 7,8
2 2
10 10
9 3,10
16 20
7 3,12
3 22,23,
.24,25,28 . . 29,30,31
13
13
Financial Analysis Chart Financial Lease Income Statement . Inflows . Labor and Management
Income . Labor and Management
Income Per Operator Labor Efficiency Land Resources Liquidity . Lost Capital . Machinery Expenses Milking Frequency Milk Production Milking System Money Borrowed Net Farm Income Net Investment Net Worth Number of Cows. Operating Costs of
Producing Milk Opportunity Cost .. Other Livestock Expenses Outflows . Part-Time Cash-Crop
Dairy (farm) Part-Time Dairy (farm) Percent Equity . Personal Withdrawals and
Family Expenditures Including Nonfarm Debt Payments ..
Principal Payments Profitability Receipts . Record System . Repayment Analysis Replacement Livestock Retained Earnings.... Return on Equity Capital Return on Total Capital Return to Operator's
Labor, Management, and Equity Capital
Solvency . Total Costs of
Producing Milk Whole Farm Method Worker Equivalent Yields Per Acre
Paqe(s)
25 8 2
12
6
6 20 16 10 10
3,17 2
18 2
12 5
10 8
18
19 6 3
12
2 2
9,10
12 12
4 4 2
14 3
11 7 7
6 -10
19 19 20 16

OTHER A.R.M.E. EXTENSION BULLETINS (Formerly A.E. Extension pUblications)
No. 94-08 Dairy Replacement Programs: Costs & Analysis western New York, 1993
Jason Karszes
No. 94-09 Dairy Farm Business Summary Northern New York Region 1993
Stuart F. smith Linda D. Putnam George Allhusen Patricia Beyer German Davalos Anita Deming Gleason Wally George Yarnall
No. 94-10 Dairy Farm Business Summary Central New York and Central Plain
Wayne A. Linda D.
Knoblauch Putnam
Regions 1993 James A. Hilson A. Edward Staehr Michael L. Stratton
No. 94-11 Dairy Farm Business Summary Western Plateau Region 1993
George L. Andrew N.
Casler Dufresne
Joan S. Petzen Carl W. Albers Stuart F. Smith Linda D. Putnam
No. 94-12 Dairy Farm Business Summary Northern Hudson Region 1993
Stuart F. smith Linda D. Putnam Cathy S. Wickswat John M. Thurgood
No. 94-13 Dairy Farm Business Summary Oneida-Mohawk Region 1993
EddyL. LaDue Jacqueline M. Mierek Charles Z. Radick Linda D. Putnam
No. 94-14 Dairy Farm Business Summary Southeastern New York Region 1993
Stuart F. Smith Linda D. Putnam Alan S. White -Stephen E. Hadcock Larry R. Hulle