Embed Size (px)
Citation preview
1
AUSTIN ENERGY WHITE PAPER
DISTRIBUTED ENERGY RESOURCE (DER) STRATEGY,
NEXT STEPS, AND PRELIMINARY FINDINGS FROM
AUSTIN SHINES DER INTEGRATION PROJECT
AUSTIN ENERGY, CITY OF AUSTIN
2
Contents Introduction .................................................................................................................................................. 3
Executive Summary ....................................................................................................................................... 3
Energy Storage - An Alternative ................................................................................................................ 5
Distributed Energy Resources - More than Energy Storage ..................................................................... 5
Austin SHINES Project Configuration ............................................................................................................ 7
Research Priorities for SHINES ................................................................................................................ 11
Lessons Learned ...................................................................................................................................... 12
Technical ............................................................................................................................................. 12
Interoperability ................................................................................................................................... 12
Siting.................................................................................................................................................... 15
Sizing ................................................................................................................................................... 18
Value/Economics .................................................................................................................................... 25
Holistic Control .................................................................................................................................... 26
Reliability Modeling ............................................................................................................................ 31
Economic Modeling ............................................................................................................................ 34
Field Demonstration Data ................................................................................................................... 37
Load Control Considerations ............................................................................................................... 42
Conclusions ................................................................................................................................................. 45
Next Steps ................................................................................................................................................... 49
Standards & Policy .................................................................................................................................. 49
Utility Strategy ........................................................................................................................................ 49
Project-Focused (SHINES and ongoing DER initiatives) .......................................................................... 49
References .................................................................................................................................................. 50
3
Austin Energy Distributed Energy Resource (DER) Strategy, Next Steps and Preliminary Findings from Austin SHINES DER Integration Project
Introduction The 2017 Austin Energy Resource, Generation and Climate Protection Plan (The Plan) directed staff to
provide reports to support the development of the 2019 Plan. Reports about energy storage will be
broken into two areas, with one report issued by Austin Energy’s Energy Market Operations group
looking at the feasibility of bulk storage, while this report will look at distributed energy storage and
other distributed energy resources through the lens of preliminary results from Austin Energy’s Austin
SHINES (SHINES) project.
The SHINES project reporting is scheduled to be released per the project plan and schedule with US
Department of Energy in CY19 and early CY20. This DER report is in addition and prior to the planned full
DER Report per the SHINES project schedule.
The 2017 Plan asked for analysis in the following areas relevant to SHINES1:
• Study the technical and economic feasibility of emerging technologies, including dispatchable
renewable energy technologies, battery storage, aggregated demand response and vehicle to grid
• Using lessons learned from the completion and implementation of SHINES, develop a roadmap for
implementation of electrical storage to achieve the existing goal of 10 MW by 2025
This report will provide a primer on terminology relevant to exploring storage goals, an overview of
technical and economic analysis from SHINES, and a summary of lessons learned. Due to the timing of
the initiation of the 2019 resource planning process relative to the completion of the US DOE SHINES
grant/project, the roadmap for implementation of electrical storage is not ready, but the general
direction moving forward can be inferred from the conclusions and next steps sections of this report.
Executive Summary Some key takeaways from SHINES about distributed energy resources (DER):
• All resource decisions involving energy storage need to be analyzed and compared to other
alternatives for meeting the same needs.
• Austin Energy should research developing the capability to model the potential value of DER
across different feeders using different resources and use cases to inform future planning efforts.
1 Sustainable and Holistic Integration of Energy Storage and Solar PV.

4
• Currently battery systems greater than 1MW in size are required to register with and be
metered by ERCOT. The meter data is then accounted for during 4CP2 similar to power plant
generation and does not result in a calculated reduction to Austin Energy’s load the way
demand response programs do, thus significantly reducing the value of grid-scale storage in
ERCOT to utilities.
• Modeling shows voltage issues at solar penetrations of 40% on the distribution feeders studied;
however, the highest penetration of renewable energy resources on Austin Energy’s distribution
grid is around 6%. We should continue to monitor reliability impacts, but preliminary modeling
indicates that widespread system level impacts from DER are only likely at much higher levels of
penetration. Localized impacts are a far more immediate concern. Development of hosting
capacity tools should be a short-term priority.
• Modeling the fielded assets showed the scenario with the SHINES assets increased the per kWh
cost versus the baseline case.
• Field demonstration data indicates the value of battery storage does not yet outweigh the costs,
and reliability support is not yet needed.
• Behind the meter load control with rooftop solar is more economic than options (a) without
solar and (b) with solar and battery storage.
• The current state of DER communication and integration standards poses a non-trivial risk of
uncertainty and having to implement proprietary technologies thus “vendor-locking” wide-scale
deployment of assets.
• Building codes and permitting processes are not keeping pace with DER technology
advancements, hindering installation and potentially creating unaccounted for impacts.
Economic modeling has revealed that to realize a positive differential value of DER from a control
perspective, some combination of the following would need to occur.
• Additional market opportunities that require sophisticated controls, such as fast frequency
response, would need to become available in the ERCOT.
• Market prices would need to rise and/or become more volatile.
• Reliability issues would need to start occurring on Austin Energy’s system, likely due to higher
renewable penetration, and the value of reliability would need to be able to be quantified.
• The costs of communicating with smaller DER assets behind the meter would need to reduce.
• Additional DER types, such as electric vehicles and load control, would need to be integrated at
larger scales to realize the benefits of value stacking through asset diversity.
In summary, the concept of holistic control and value stacking is clear, but it is not easily realized given
current conditions. Austin Energy is best suited to engage in “readying” activities such as streamlining
control system architecture, developing integrations for additional DER types, and developing tools to
monitor key trigger points rather than engaging in wider-scale deployment of DERs at the current time.
2 Four coincident peak: Peak interval demand on the ERCOT grid during each of the four summer months of June through September.
5
Energy Storage - An Alternative Economical energy storage is hailed as an answer to many potential challenges facing our community
and our electric utility. Some of those challenges are voltage issues caused by the proliferation of local
solar and the desire for customers to be able to participate in a transactional energy marketplace.
Energy storage has incredible flexibility in how it can be applied to address a variety of challenges
including acting like generation, the ability to provide voltage support for the grid, helping to lower
emissions, and a host of other capabilities.
While energy storage is one option for how we can manage our electric needs in the future, there are
other options to consider as well. Energy storage is but one of many potential options for meeting those
needs, therefore all resource decisions involving energy storage need to be analyzed and compared to
other alternatives for meeting the same needs.
Distributed Energy Resources - More than Energy Storage The inclusion of other emerging technologies into the examination of energy storage is derived from an
understanding by the 2017 energy storage working group for the need to consider many distributed
resources within the context of one another. Collectively, these resources can be defined as distributed
energy resources or DER. So, what are DER? Advanced Energy Economy defines them as… “physical and
virtual assets that are deployed across the distribution grid, typically close to load, and usually behind
the meter, which can be used individually or in aggregate to provide value to the grid, individual
customers, or both.”
Although this definition is somewhat vague, it applies to assets that are not centralized like a power
plant in a single location whose electricity is transmitted to the transmission system to feed downstream
load. There are many different opinions on what assets fit into the DER category, but Austin Energy
generally includes the following:
• Non-Renewable Distributed Generation (DG) – A generation resource that produces electricity
near where it will be used. There are many different types of non-renewable DG including
natural gas or diesel-fueled emergency back-up generators and combined heat and power
systems.
• Solar Photovoltaics (PV) – A technology that converts sunlight (solar radiation) into direct
current (DC) electricity using semiconductors. Solar PV systems include an inverter to convert
the DC electricity to alternating current (AC) electricity, which is the type of electricity
transmitted on the electric grid and used by consumers at homes and businesses.
• Wind Turbines – A technology that converts the kinetic energy in the wind into mechanical
power. Wind turbines include generators to convert the mechanical power into AC electricity.
• Energy Storage Systems (ESS) – A system that captures electricity produced by renewable
and/or non-renewable resources and stores it for use at a later time. There are many different
types of ESS including batteries, flywheels, compressed air, pumped hydro and thermal energy
6
storage. A battery storage system stores DC electricity and includes an inverter to convert the
energy from DC to AC.
• Electric Vehicles (EV) – A vehicle that uses one or more electric motors for propulsion.
Electricity can be used as a transportation fuel to power battery EVs, and the energy stored in an
EV’s battery can be discharged to serve load in vehicle-to-home (V2H) or vehicle-to-grid (V2G)
configurations.
• Controllable Load – A demand resource that can be controlled to increase or decrease the
amount of load it provides depending on the need of the controlling entity. There are many
different types of controllable load including heating, ventilation, and air conditioning (HVAC)
systems, electric water heaters, pool pumps, and electric vehicles. Additionally, electricity
consumers at homes or businesses can serve as controllable load providers by adjusting their
usage (e.g., lighting, refrigeration, manufacturing cycles, etc.) in response to signals from an
external entity.
• Smart Inverters – The equipment that converts electricity from DC to AC. Smart inverters go
beyond standard inverters by providing grid support functions, such as voltage regulation,
frequency support and ride through capabilities.
Many of the technologies described above can also be utility-scale assets, connected at the transmission
level and set farther away from the load they serve. In general, DERs are characterized as such because
they are smaller in size, potentially many in number, connected to the grid in a distributed manner, and
close to load.
DER can be divided into two categories with regards to their ability to be controlled. The first group is
essentially binary; they are either on or off. Examples include HVAC with (remotely) controlled
thermostats and PV with a traditional inverter. The second group is more dynamic in nature, and they
can be controlled in sophisticated ways. Examples include resources that are controlled by a smart
inverter, such as newer PV installations, energy storage, and EVs. Dispatchable DG also fits into this
category. Employing different management capabilities and strategies for each category can enable
different values from their control. Managing these resources requires integration, either through
market signals, physical integration through networking, or both.
Increasing grid integration of DER, such as solar and wind energy, poses a potential risk for maintaining
grid reliability. As DER inclusion becomes a key goal of many public power utilities, mitigating inherent
reliability concerns presents an interesting conundrum. The original electric distribution grid was not
designed for the intermittency of renewable DER at scale, and the challenge of redesigning such systems
to effectively decarbonize the grid has grasped the attention and funding of utilities, tech companies,
and other entities in the global energy industry. Understanding progress to date and the future plans of
industry players in this space is crucial for appropriate planning and will be touched upon later in this
report.
An integral aspect to successful expansion of DER assets is the DER Management System (DERMS) used
to control them. DERMS employ a combination of software and hardware to coordinate varied
components of renewable energy systems, including connected energy storage systems, to optimally
7
utilize the energy produced. The DERMS regulates how and when accumulated energy is fed into the
grid to address and mitigate overall reliability concerns. DERMS can either be stand-alone systems or
can be integrated with other systems, giving them the potential to optimize assets for grid needs,
economic value, or balancing the two. The SHINES project looks closely at how DER, DERMS and DERMS
integration can solve these challenges in the future.
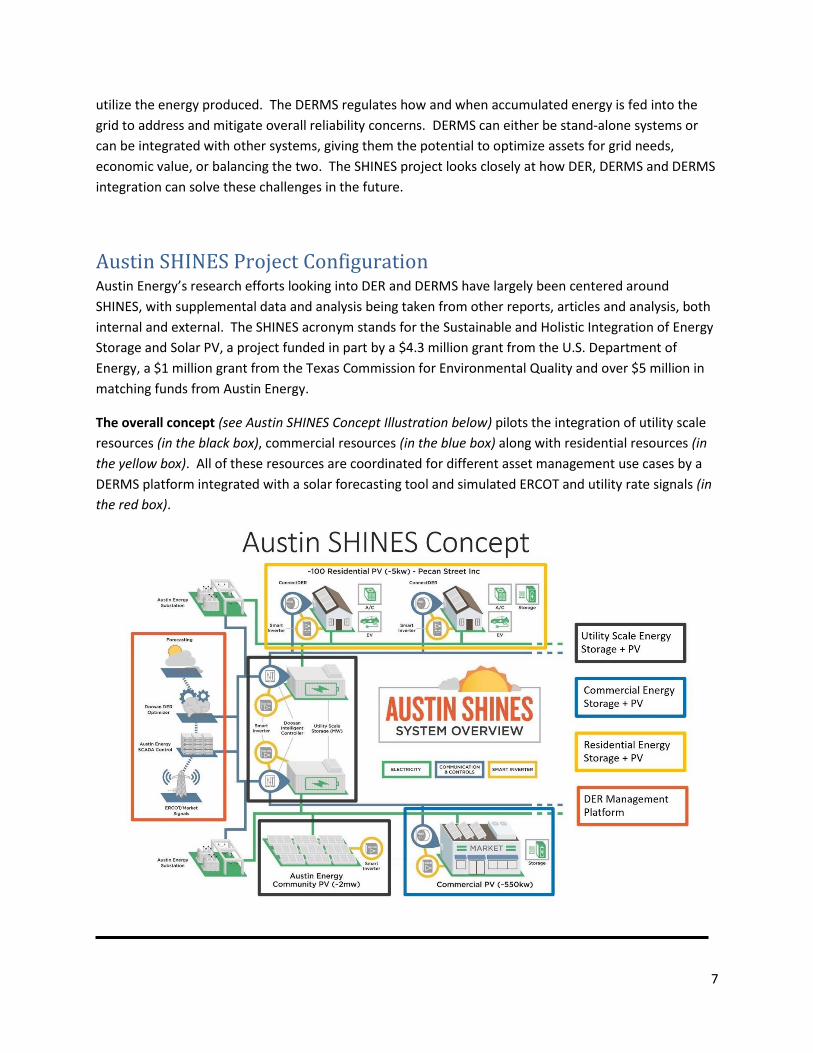
Austin SHINES Project Configuration Austin Energy’s research efforts looking into DER and DERMS have largely been centered around
SHINES, with supplemental data and analysis being taken from other reports, articles and analysis, both
internal and external. The SHINES acronym stands for the Sustainable and Holistic Integration of Energy
Storage and Solar PV, a project funded in part by a $4.3 million grant from the U.S. Department of
Energy, a $1 million grant from the Texas Commission for Environmental Quality and over $5 million in
matching funds from Austin Energy.
The overall concept (see Austin SHINES Concept Illustration below) pilots the integration of utility scale
resources (in the black box), commercial resources (in the blue box) along with residential resources (in
the yellow box). All of these resources are coordinated for different asset management use cases by a
DERMS platform integrated with a solar forecasting tool and simulated ERCOT and utility rate signals (in
the red box).
8
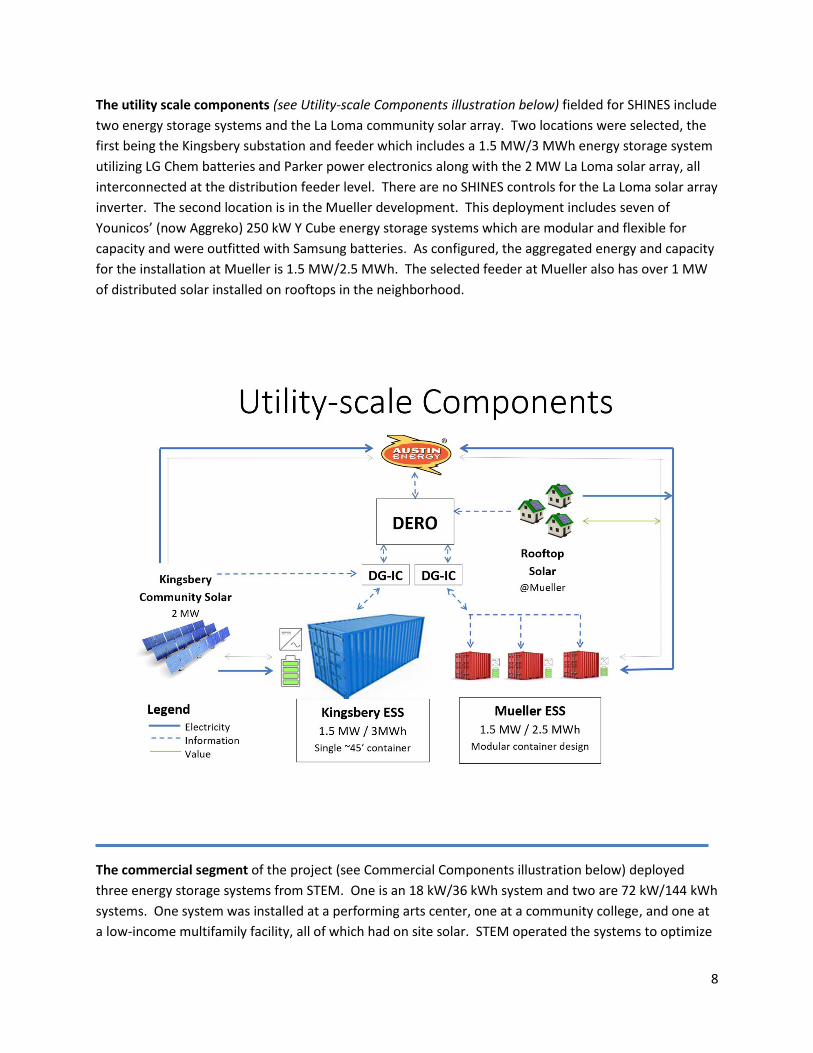
The utility scale components (see Utility-scale Components illustration below) fielded for SHINES include
two energy storage systems and the La Loma community solar array. Two locations were selected, the
first being the Kingsbery substation and feeder which includes a 1.5 MW/3 MWh energy storage system
utilizing LG Chem batteries and Parker power electronics along with the 2 MW La Loma solar array, all
interconnected at the distribution feeder level. There are no SHINES controls for the La Loma solar array
inverter. The second location is in the Mueller development. This deployment includes seven of
Younicos’ (now Aggreko) 250 kW Y Cube energy storage systems which are modular and flexible for
capacity and were outfitted with Samsung batteries. As configured, the aggregated energy and capacity
for the installation at Mueller is 1.5 MW/2.5 MWh. The selected feeder at Mueller also has over 1 MW
of distributed solar installed on rooftops in the neighborhood.
The commercial segment of the project (see Commercial Components illustration below) deployed
three energy storage systems from STEM. One is an 18 kW/36 kWh system and two are 72 kW/144 kWh
systems. One system was installed at a performing arts center, one at a community college, and one at
a low-income multifamily facility, all of which had on site solar. STEM operated the systems to optimize
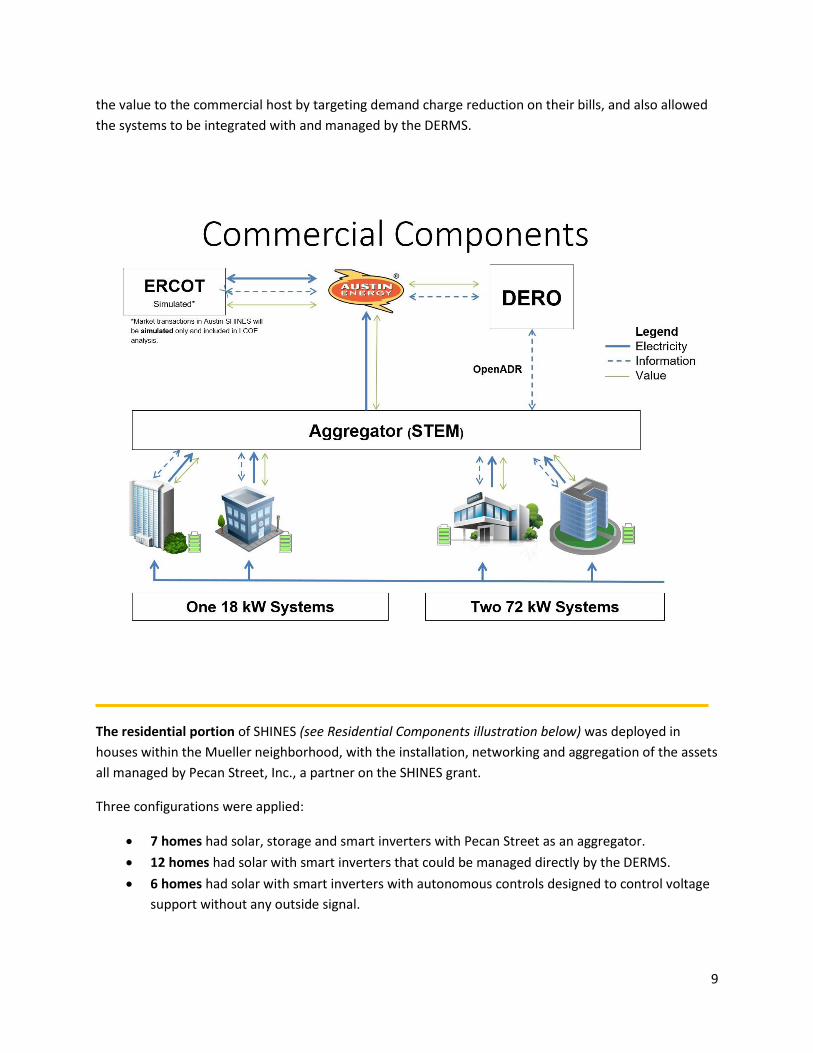
9
the value to the commercial host by targeting demand charge reduction on their bills, and also allowed
the systems to be integrated with and managed by the DERMS.
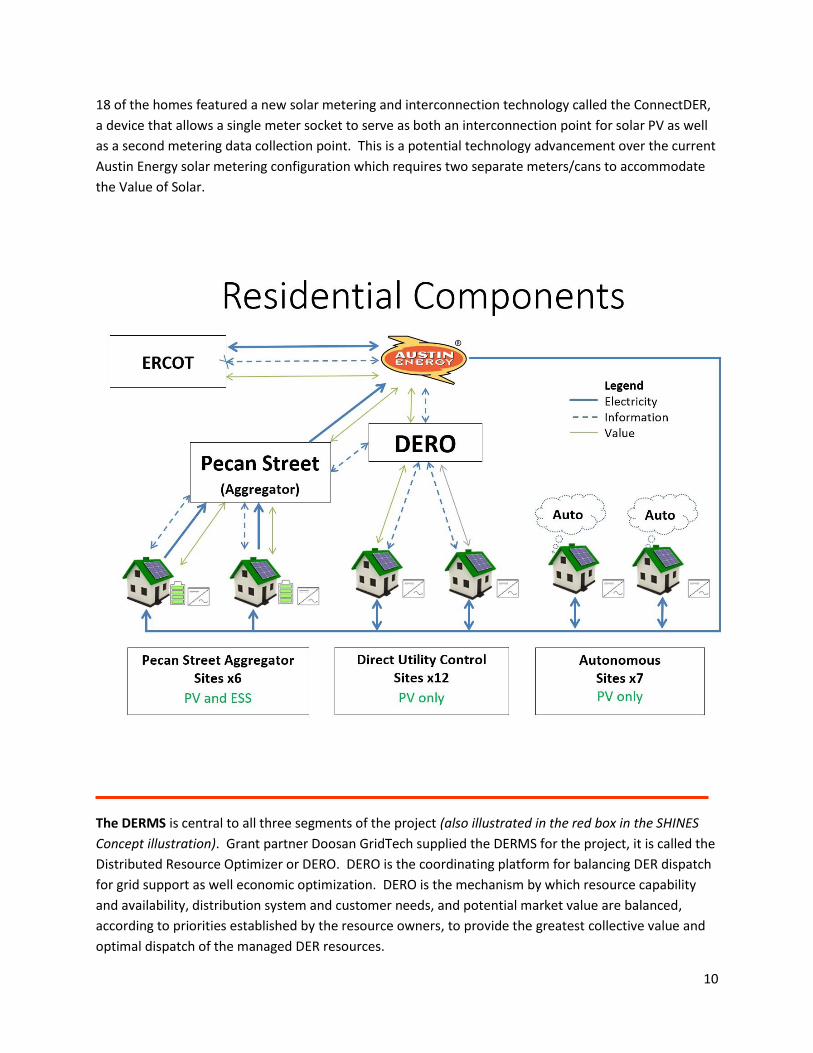
The residential portion of SHINES (see Residential Components illustration below) was deployed in
houses within the Mueller neighborhood, with the installation, networking and aggregation of the assets
all managed by Pecan Street, Inc., a partner on the SHINES grant.
Three configurations were applied:
• 7 homes had solar, storage and smart inverters with Pecan Street as an aggregator.
• 12 homes had solar with smart inverters that could be managed directly by the DERMS.
• 6 homes had solar with smart inverters with autonomous controls designed to control voltage
support without any outside signal.
10
18 of the homes featured a new solar metering and interconnection technology called the ConnectDER,
a device that allows a single meter socket to serve as both an interconnection point for solar PV as well
as a second metering data collection point. This is a potential technology advancement over the current
Austin Energy solar metering configuration which requires two separate meters/cans to accommodate
the Value of Solar.
The DERMS is central to all three segments of the project (also illustrated in the red box in the SHINES
Concept illustration). Grant partner Doosan GridTech supplied the DERMS for the project, it is called the
Distributed Resource Optimizer or DERO. DERO is the coordinating platform for balancing DER dispatch
for grid support as well economic optimization. DERO is the mechanism by which resource capability
and availability, distribution system and customer needs, and potential market value are balanced,
according to priorities established by the resource owners, to provide the greatest collective value and
optimal dispatch of the managed DER resources.
11
Research Priorities for SHINES At its core, SHINES is a study in DER integration and optimization. Ultimately the work can best be
broken down into two categories of technical and economic/value, although the two topics are so
interdependent when exploring DER that the lines between them often blur. Processes and technology
for balancing either economic decisions or technical priorities independently within a utility are in broad
use, but technologies for concurrently managing both economic and technical priorities, particularly for
grid assets, mark a brave new frontier.
The technical concerns explored center around whether the equipment and systems needed to execute
the project exist or can be developed, whether they can be made to work together, and what lessons
learned about the technical aspects of DER installation can be applied to making a decision about when
or if to pursue DER integration and optimization. More specifically, technical concerns being explored
include interoperability (standards and integration), siting, sizing and safety.
Economic and value-based priorities become a bigger concern once there is some degree of certainty
that the technical issues can be overcome, however the nature of technology development requires that
technical and economic challenges are worked out in parallel because the technical challenges play such
a huge role in determining the economic picture. Technical issues dictate costs, so lessons learned there
are applied to the cost side of the equation. The cost side may not be simple, but the path to
determining them is fairly straight forward. Understanding the potential value of DER is far more
complicated.
Given the proliferation of technology in the electric utility industry over the last 10-15 years, it is a rare
instance that a distribution system challenge that can only be solved one way. The best value is
determined by the best alternative to meet a specific situation or need. Any number of factors can
figure into determining the best choice, and the best alternative may vary widely from place to place
and situation to situation, even on a single distribution feeder.
In order to explore the potential value of DER, the project uses several tools to help define potential
values. Value is partially a factor of perspective. For the purpose of SHINES potential beneficiaries of
DER management are broken up into three categories: utilities, utility customers, and third-party
aggregators. The SHINES team developed different use cases, for example the value of peak load
reduction and the value of energy arbitrage, to determine the potential value for each use case to each
potential beneficiary. Finally, the SHINES team has developed a model that allows simulations based
upon demonstrated asset performance matched to use cases to predict the value of asset management
over time.
This rudimentary analysis provides a baseline for the potential value of DER, but it only speaks to the
potential value of a single use case. Utilizing an asset to take advantage of a single potential value or
revenue stream is simplistic and risks leaving potential value unrealized. If an asset can be used across
different time intervals to meet multiple use cases, it raises the potential value of managing that
resource. This principle is referred to as value stacking, which can also be modeled and is built into the
optimization engine within DERO. Only by looking at a combination of who the beneficiary is, what the
12
use case is, and stacking values from them all collectively can you project the potential value of an
integrated and optimized DER. Coming up with a solution to facilitate this poses significant technical
challenges.
Per the grant guidelines, SHINES committed to the DOE to demonstrate two firm economic metrics for
DER and DER integration. The first is to meet a 14 cent levelized cost of energy produced by local solar.
which is stored within an energy storage system and dispatched back onto the grid. The second metric
is to demonstrate the potential for DER managed by an integrated optimization platform, DERMS, to
realize a 20% cost benefit relative to the baseline cost of the same level of DER deployed without
optimization and integration. Less specific goals include understanding the technical challenges of DER
integration and determining the value of integrated and optimized DER within the Austin Energy
distribution feeders fielding SHINES assets. This information and the associated tools will allow Austin
Energy to develop the capability to model the potential value of DER across different feeders using
different resources and use cases to inform future planning efforts.
Lessons Learned The work performed over the last two years, most notably the Austin SHINES project, has been
purposefully designed to provide a comprehensive area of study. Hands-on work in combination with
simulations and modeling have offered a rich field from which to gather a better understanding of the
opportunities, challenges, and realities of DER integration. As a result, Austin Energy and project
partners have gleaned numerous lessons learned from a technical and value/economics perspective as
further described below.
Technical
The technical lessons learned derive from physically installing DER hardware and software in Austin
Energy’s system, collaborating with vendors, experiencing this work in the current regulatory and
market landscapes, and working within the utility to ensure readiness to own and operate controllable
DER assets. Of the many learnings gathered to date, four technical topics stand out with key takeaways:
• Interoperability: The current state of DER communication and integration standards poses a
non-trivial risk of uncertainty to wide-scale deployment of assets.
• Siting: Building codes and permitting processes are not currently keeping pace with DER
technology advancements, hindering installation in some cases and potentially creating
unaccounted for impacts in others.
• Sizing: Proper system design is highly dependent on the value application and location on the
grid.
• Safety: Deployment of emerging technologies involves uncertainties regarding safety, and
current review processes are not at speed with the technology emergence.
Interoperability
Background
13
The National Institute of Standards and Technology (NIST) describes interoperability as “The capability
of two or more networks, systems, devices, applications, or components to exchange and readily use
information—securely, effectively, and with little or no inconvenience to the user.” Degrees of
interoperability can be described as a spectrum of maturity, and the initial growth curve can be steep,
especially in the presence of proprietary protocols. Austin Energy promotes open standard protocols
and requires them whenever possible. The goals of which are to ease communication capability,
increase productivity, reduce cost, avoid vendor lock-in, and establish a transferrable knowledge base
within the company.
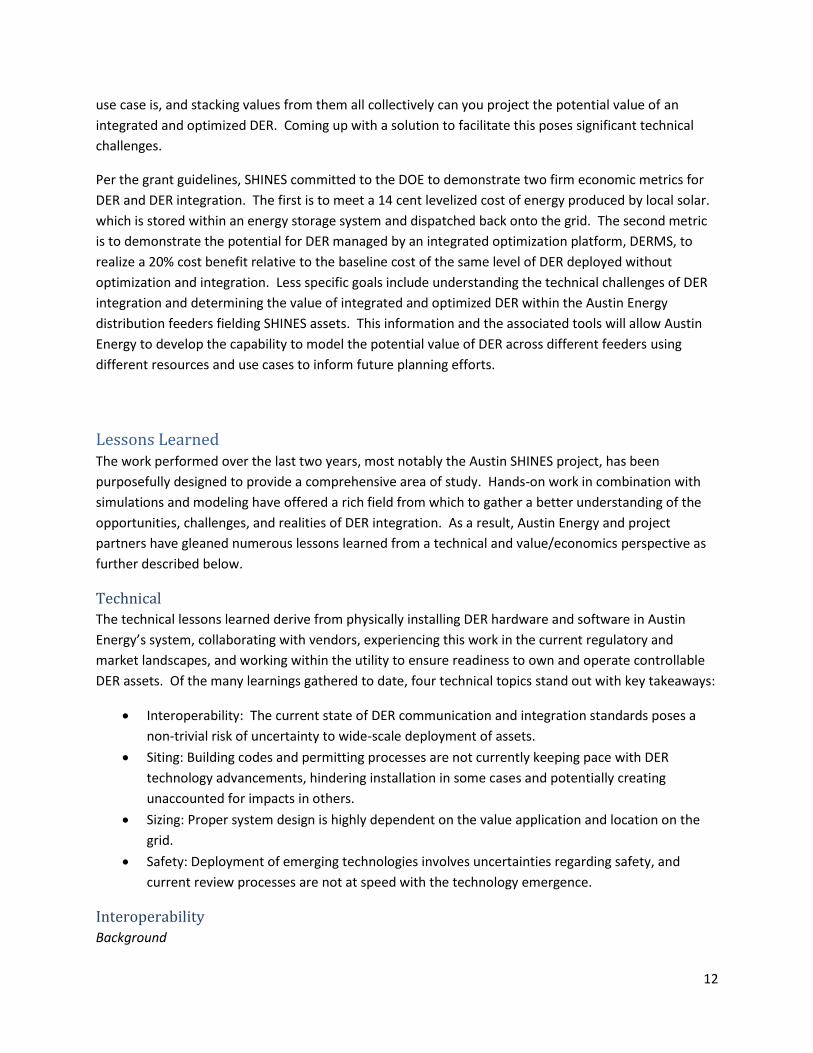
In theory, requiring open standards is a straightforward answer, but in practice – and especially
regarding DER – it is anything but simple. The following chart is courtesy of the Electric Power Research
Institute (EPRI). It describes many points of contact in the DER chain of monitoring and control.
Figure illustrating the complex landscape for DER interoperability
− TSO refers to the Transmission System Operator, or ERCOT in this region.
− DSO refers to the Distribution System Operator, which is Austin Energy.
− An aggregator could be a third party that consolidates numerous smaller DER assets for the benefit of providing
services to a DSO or TSO from a fleet that looks like a single, larger DER asset.
− The DER Provider refers to the owner of the DER, which could have its own monitoring point in the mix.
− The Device/Resource Controller is the site-level, local controller that co-exists with the DER, or the Device, itself.
Instead of showing a single communication path, or “daisy-chain”, from one level to the next, the
diagram shows the possibility of two-way communications between nearly every level. The flexibility is

14
rooted in considerations related to system architecture, entity objective, DER use-case and more. With
so many possibilities, the road to standardization and interoperability has been long and winding with
many forks along the way. The gray arrows on the sides reference communication standards and
protocols that cover all or some levels of the path. Standards bodies like the International
Electrotechnical Commission (IEC) and the Institute of Electrical and Electronics Engineers (IEEE) each
have multiple standards in the DER space. Others, like OpenFMB and SunSpec Modbus, were developed
by industry alliances that formed, in part, to develop a standard to meet an unfulfilled need identified by
members.
Interoperability aims for a seamless communication path from end-to-end, but the industry has not
evolved to that level of maturity yet. As a step in the right direction, some entities are aiming for
“harmonization”, which NIST describes as “the process of achieving technical equivalency and enabling
interchangeability between different standards with overlapping functionality.” An example of
harmonization is California Rule 21, which requires use of an interconnection standards suite (IEEE
2030.5, IEEE 1815, IEEE 1547, and SunSpec Modbus).
Key Takeaway
The current state of DER communication and integration standards poses a non-trivial risk of uncertainty
to wide-scale deployment of assets.
Austin Energy Experiences
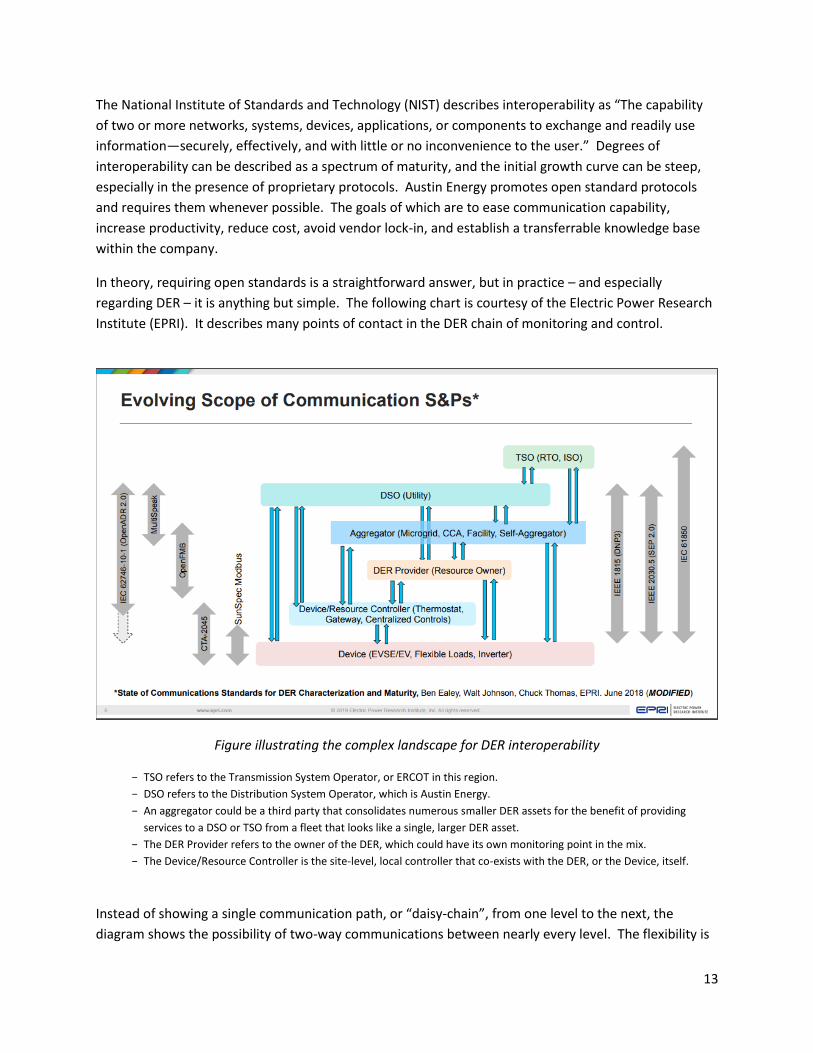
For the Austin SHINES project, Austin Energy required open standards to promote interoperability. The
diagram below shows DER standards in the orange boxes. The Modular Energy Storage Architecture
(MESA) protocol is an open standard used for grid-scale battery storage systems. The OpenADR
protocol, first popular for demand response programs, became the open standard choice for
communicating between Austin Energy’s DER control system and third-party aggregators with DER
fleets. SunSpec is the open standard used for communication with residential solar photovoltaic (PV)
devices.
15
As-Built Control System Architecture for Austin SHINES Assets
While these standards are considered open, Austin Energy has found that all require some level of
customization to meet the needs of both end points. Additionally, potential vendors of similar assets
suggest using alternative protocols such as those under development at IEC and IEEE for these same
type of communication paths. During this project several vendors, some not part of the project,
revealed that items considered by Austin Energy as critical to full DER integration either were not on
their technology roadmaps or worse were being intentionally omitted to help create vendor lock-in. It is
clear standardization has not been achieved. At some point, having many open standard protocols for
interfacing with the utility’s fleet-level DER management system starts to look similar to using
proprietary standards, especially from an administrative perspective. Finally, this multi-faceted
landscape is bound to settle at some point, perhaps driven by commercial vendors, utilities and other
stakeholders alike. When that will happen is unknown, but until then, wide-scale deployments pose a
risk similar to choosing between VHS and Betamax in the 1970s.
Siting
Background
A few factors influence battery storage system siting regardless of application. Suitable physical space is
a basic requirement of all installations, not only in terms of required physical footprint and height, but
also in the installation space characteristics. Whether an interior or exterior application, considerations
including ambient temperature, fire ratings, adjacent equipment and security must all be taken into
account. An installation in a public interior space or an exterior location may have sizing impacted by
aesthetics. Occupancy characteristics of the installation space or adjacent spaces my also impact siting,
with regards to code on commercial and residential applications.
16
Commercial facilities are typically designed and constructed to utilize every square foot for cost
effectiveness. New commercial construction presents the opportunity to weigh different options when
it comes to siting a battery storage system. The higher costs of additional conditioned square footage
for interior installations are partially offset by the lower cost of indoor rated enclosures, while outdoor
installations allow for less conditioned square footage and/or space for other building needs but
increased equipment costs. Local codes place restrictions on indoor applications based on battery
chemistry or size, as well as building occupancy types. Existing electrical infrastructure for battery
interconnection is another physical constraint which must be investigated in retrofit applications.
Local building codes can have a significant impact on battery siting. Code development cycles struggle
to keep pace with the rapid strides of technology, meaning many requirements are created ad-hoc by
local inspectors, which could result in greater restrictions or inadequate oversight than may prove
necessary in the long term. Some jurisdictions have placed increasing requirements related to fire
suppression as battery size is increased, including increased sprinkler flows, chemical fire suppression
equipment, increased fire-ratings for the envelope, additional code reviews and inspections, tighter
security restrictions, and restricted occupancy in the equipment spaces. Larger scale batteries may also
draw more scrutiny from electrical inspectors, requiring additional costs in the form of more extensive
reviews and the installation of additional disconnects and isolation strategies.
Key Takeaway
Building codes and permitting processes are not currently keeping the pace of DER technology
advancements, hindering installation in some cases and potentially creating unaccounted for impacts in
others.
Austin Energy Experiences
When Austin Energy looked to install battery storage systems at commercial customer sites for the
Austin SHINES project, the goal was to install seven systems. Coordination with the Development
Services Department revealed there was no existing process for reviewing and permitting battery
storage at commercial sites. The Department leveraged the existing process for commercial solar PV as
much as possible; however, one major gap was the lack of Austin Fire Department (AFD) review criteria.
Seeking to establish criteria for acceptable siting, AFD first looked to existing building and fire code.
Noting these codes lagged behind present day need and did not include relevant details for battery
storage systems, AFD looked to other jurisdictions for best practice applications. The findings varied
from coast to coast with California fire departments allowing many commercial storage installations and
New York restricting the same. With time, study and experience, AFD put forth a set of criteria which
they applied to the nine potential sites. In the end, only three were able to be built out. AFD required
sprinkler density calculations and, in cases where the results showed inadequate flow compared to the
criterion, sprinkler system modifications were made. AFD also required smoke detection evaluation and
fire rated walls and doors.
The locations that were acceptable by AFD standards are typically not conditioned spaces. Some have
forced ventilation and others have vents for natural air flow. However, operations experience has
17
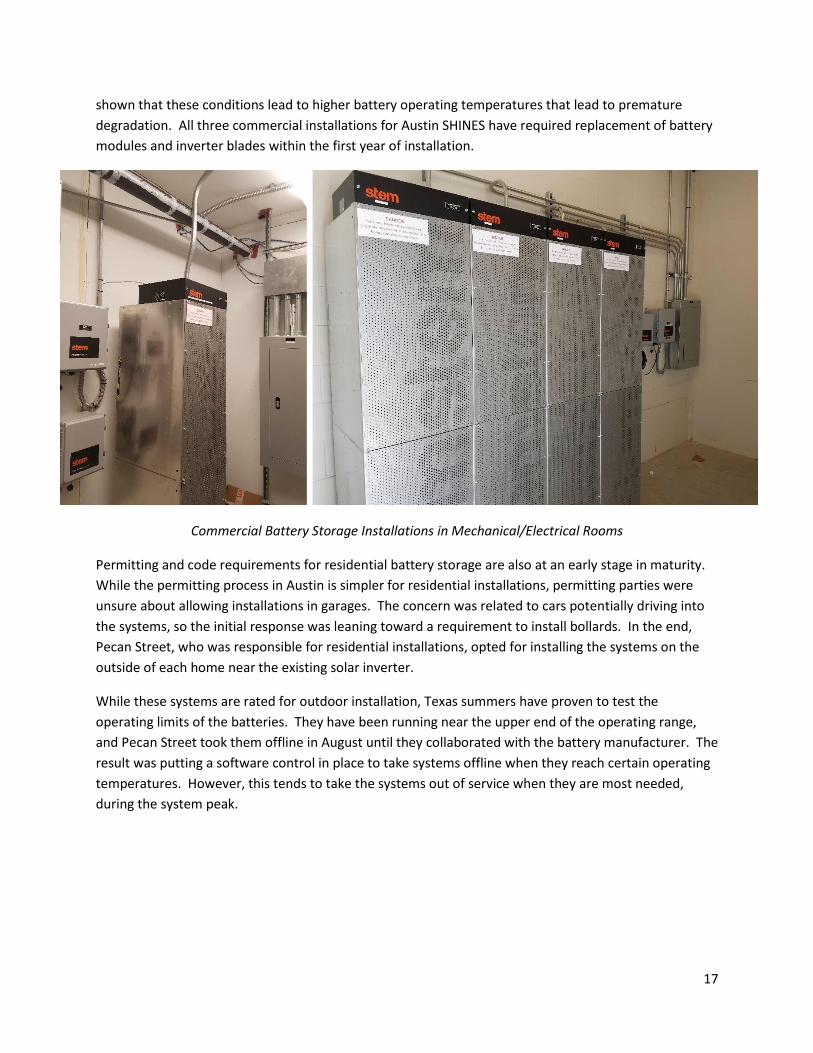
shown that these conditions lead to higher battery operating temperatures that lead to premature
degradation. All three commercial installations for Austin SHINES have required replacement of battery
modules and inverter blades within the first year of installation.
Commercial Battery Storage Installations in Mechanical/Electrical Rooms
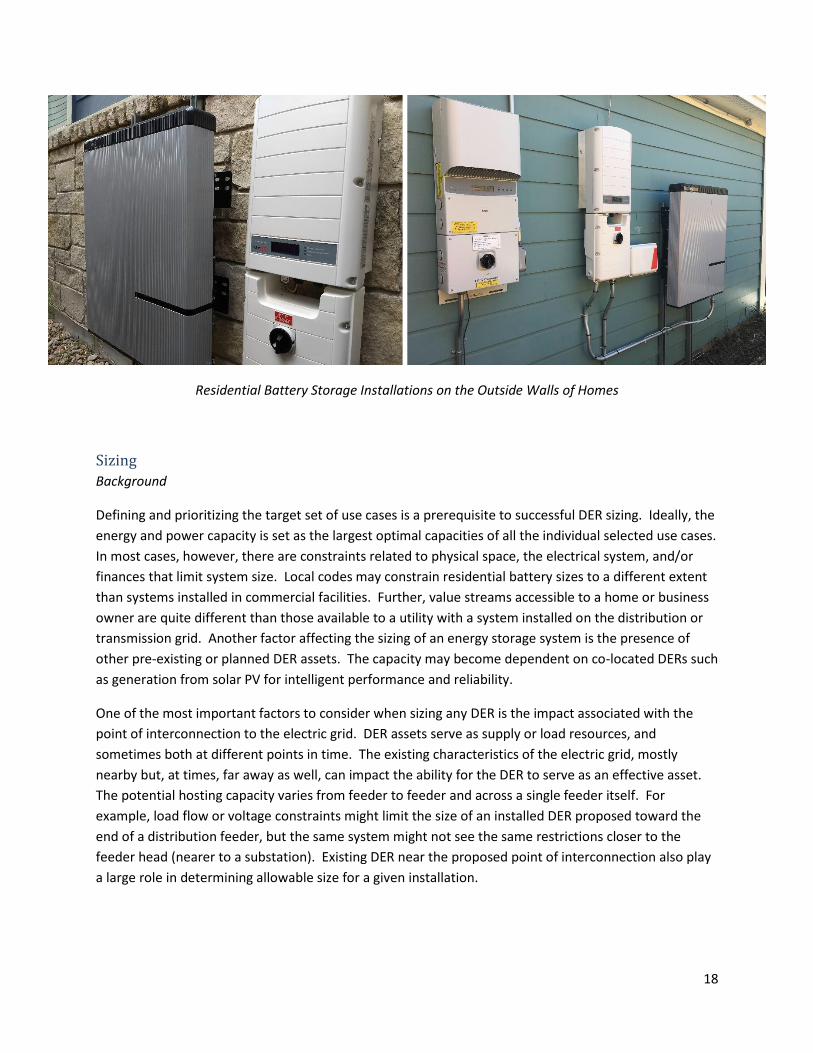
Permitting and code requirements for residential battery storage are also at an early stage in maturity.
While the permitting process in Austin is simpler for residential installations, permitting parties were
unsure about allowing installations in garages. The concern was related to cars potentially driving into
the systems, so the initial response was leaning toward a requirement to install bollards. In the end,
Pecan Street, who was responsible for residential installations, opted for installing the systems on the
outside of each home near the existing solar inverter.
While these systems are rated for outdoor installation, Texas summers have proven to test the
operating limits of the batteries. They have been running near the upper end of the operating range,
and Pecan Street took them offline in August until they collaborated with the battery manufacturer. The
result was putting a software control in place to take systems offline when they reach certain operating
temperatures. However, this tends to take the systems out of service when they are most needed,
during the system peak.
18
Residential Battery Storage Installations on the Outside Walls of Homes
Sizing
Background
Defining and prioritizing the target set of use cases is a prerequisite to successful DER sizing. Ideally, the
energy and power capacity is set as the largest optimal capacities of all the individual selected use cases.
In most cases, however, there are constraints related to physical space, the electrical system, and/or
finances that limit system size. Local codes may constrain residential battery sizes to a different extent
than systems installed in commercial facilities. Further, value streams accessible to a home or business
owner are quite different than those available to a utility with a system installed on the distribution or
transmission grid. Another factor affecting the sizing of an energy storage system is the presence of
other pre-existing or planned DER assets. The capacity may become dependent on co-located DERs such
as generation from solar PV for intelligent performance and reliability.
One of the most important factors to consider when sizing any DER is the impact associated with the
point of interconnection to the electric grid. DER assets serve as supply or load resources, and
sometimes both at different points in time. The existing characteristics of the electric grid, mostly
nearby but, at times, far away as well, can impact the ability for the DER to serve as an effective asset.
The potential hosting capacity varies from feeder to feeder and across a single feeder itself. For
example, load flow or voltage constraints might limit the size of an installed DER proposed toward the
end of a distribution feeder, but the same system might not see the same restrictions closer to the
feeder head (nearer to a substation). Existing DER near the proposed point of interconnection also play
a large role in determining allowable size for a given installation.
19
When grid impact studies identify constraints on size or installation location, some factors can be
overcome by introducing mitigation measures or system upgrades. These changes also come with
added costs that could impact the economic viability of installing the DER system.
Another factor impacting DER sizing is the potential revenue stream portfolio. Although the available
revenue streams vary widely according to such opportunities enabled by energy markets, rates, ancillary
service programs, demand response programs, and system functionality, all installations should identify
these opportunities and allow them to play a large part in driving the sizing process, to avoid missed
financial opportunity as well as unnecessary oversizing.
Scalability should also be considered in DER system sizing across all applications. Modular systems
present the opportunity to defer increased capacity costs based on anticipated future use cases until
such use cases become economically feasible, for example. Changes in building use, rates or peak load
could justify increasing the size of a commercial system at some future time as well. Similarly, a rise in
energy prices or increased demand could present financial incentive for a utility to increase a grid scale
system, which would again be facilitated by the selection of a modular type energy storage system.
When system sizes exceed the limits of distribution system infrastructure, upgrades for reliability and
safety can potentially impact both the utility and the system owner depending on specific application
and utility requirements. In systems other than grid scale applications, costly upgrades to site electrical
infrastructure can limit the size of systems from a cost effectiveness perspective.
When referring to sizing battery storage systems specifically, one must consider both power capacity
and energy capacity. For example, the Kingsbery Energy Storage System is sized at 1.5 MW / 3 MWh.
This means, when discharging, it can produce 1.5 MW of electricity for a time period of 2 hours. When
charging from empty to full capacity, it looks like a 1.5 MW load that will last for 2 hours.
Battery storage systems have flexibility similar to conventional generators in that they do not have to
charge or discharge at maximum power capacity. For example, the same system can also discharge (or
produce) 0.75 MW of electricity for 4 hours. Incorrect sizing of either attribute can quickly hamper
project effectiveness, limit revenues, shorten project lifetime, and cause wasteful capital and operating
expenditure. The table below describes some of the potential impacts of inadequate sizing of battery
storage systems.
Sizing Attribute Power Capacity Energy Capacity
Definition
The maximum amount of electricity a battery can physically produce (if discharging) or draw (if charging) at a point in time, measured in kilowatts (kW) or megawatts (MW). This is often determined by the size of the inverter.
The amount of electricity a battery can discharge or charge over a specific period of time, measured in kilowatt-hours (kWh) or megawatt-hours (MWh)
20
Examples of Impacts of Undersizing
• If intended to shave a peak load above a grid constraint (reliability purposes), will not successfully defer distribution or transmission upgrades
• If intended to shave system peak load for economic purposes, may limit potential market revenues or bill savings
• If intended to serve as backup power and load shedding is not possible, may not be able to support critical loads or maintain grid stability in an electrical island
• If load growth is not adequately accounted for, the system could be undersized by the end of the project lifetime
• If sized based on a single event and there is not sufficient recharging time between events, the system may be rendered ineffective
• May limit peak shaving and potential market revenues
• May experience accelerated degradation because, compared to a larger system, a smaller system (1) will have a higher average resting state of charge to maintain the same required MWh capacity and (2) sees a greater depth of discharge when performing the same duty cycle
Examples of Potential Impacts of Oversizing
• May trigger unnecessary grid equipment upgrades if grid hosting capacity is exceeded
• May trigger additional regulatory requirements, such as system registration
• May result in excessive capital expenditure for unnecessary ESS components
• May result in excessive operating and maintenance expenditure
• Can reduce the probability of project financing and regulatory approval
• May result in a larger system size potentially exaggerating any siting constraints
• May trigger additional regulatory requirements, such as building and fire code constraints
• May result in excessive capital expenditure for unnecessary ESS components
• May result in excessive operating and maintenance expenditure
• Can reduce the probability of project financing and regulatory approval
Key Takeaway
Proper system design is highly dependent on the value application and location on the grid.
Austin Energy Experiences
The sizing process for the Kingsbery and Mueller battery storage systems largely followed an optimized
methodology considering functionality and market participation strategy. System impact studies
revealed no adverse grid impacts and thus no restrictions on the proposed size. One of the primary
intended use cases for each system was utility peak load reduction, with a goal of offsetting Austin
Energy load during an ERCOT system peak.
21
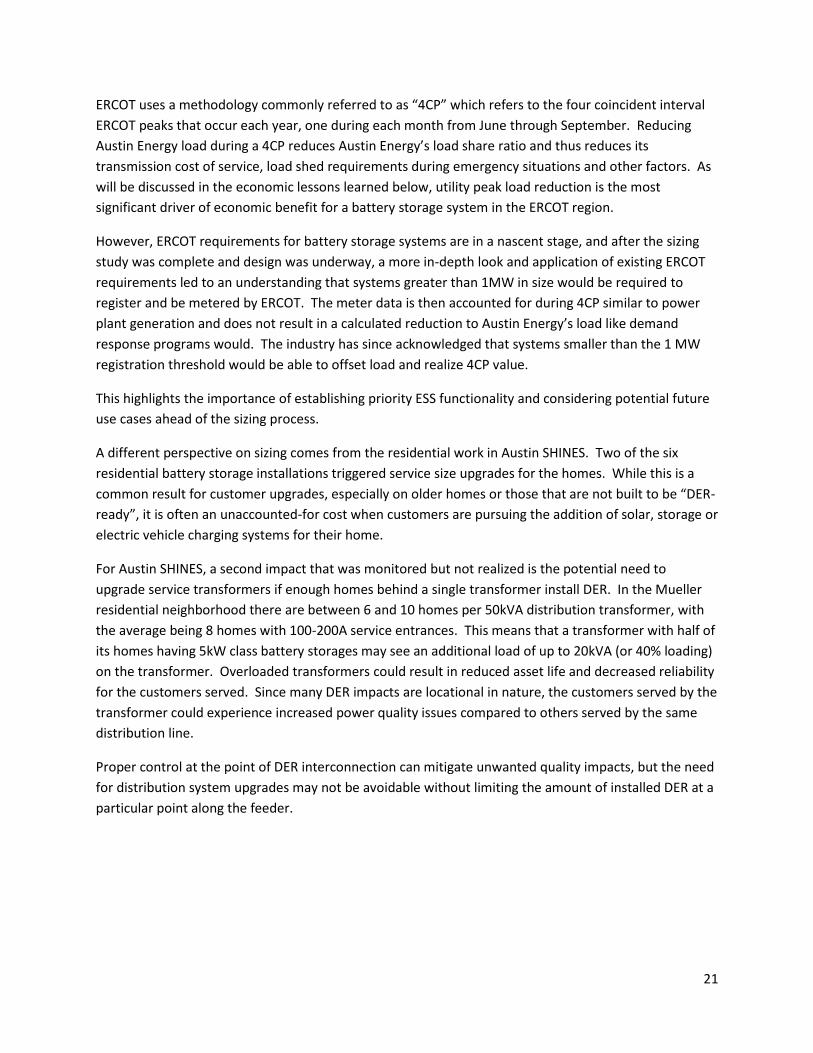
ERCOT uses a methodology commonly referred to as “4CP” which refers to the four coincident interval
ERCOT peaks that occur each year, one during each month from June through September. Reducing
Austin Energy load during a 4CP reduces Austin Energy’s load share ratio and thus reduces its
transmission cost of service, load shed requirements during emergency situations and other factors. As
will be discussed in the economic lessons learned below, utility peak load reduction is the most
significant driver of economic benefit for a battery storage system in the ERCOT region.
However, ERCOT requirements for battery storage systems are in a nascent stage, and after the sizing
study was complete and design was underway, a more in-depth look and application of existing ERCOT
requirements led to an understanding that systems greater than 1MW in size would be required to
register and be metered by ERCOT. The meter data is then accounted for during 4CP similar to power
plant generation and does not result in a calculated reduction to Austin Energy’s load like demand
response programs would. The industry has since acknowledged that systems smaller than the 1 MW
registration threshold would be able to offset load and realize 4CP value.
This highlights the importance of establishing priority ESS functionality and considering potential future
use cases ahead of the sizing process.
A different perspective on sizing comes from the residential work in Austin SHINES. Two of the six
residential battery storage installations triggered service size upgrades for the homes. While this is a
common result for customer upgrades, especially on older homes or those that are not built to be “DER-
ready”, it is often an unaccounted-for cost when customers are pursuing the addition of solar, storage or
electric vehicle charging systems for their home.
For Austin SHINES, a second impact that was monitored but not realized is the potential need to
upgrade service transformers if enough homes behind a single transformer install DER. In the Mueller
residential neighborhood there are between 6 and 10 homes per 50kVA distribution transformer, with
the average being 8 homes with 100-200A service entrances. This means that a transformer with half of
its homes having 5kW class battery storages may see an additional load of up to 20kVA (or 40% loading)
on the transformer. Overloaded transformers could result in reduced asset life and decreased reliability
for the customers served. Since many DER impacts are locational in nature, the customers served by the
transformer could experience increased power quality issues compared to others served by the same
distribution line.
Proper control at the point of DER interconnection can mitigate unwanted quality impacts, but the need
for distribution system upgrades may not be avoidable without limiting the amount of installed DER at a
particular point along the feeder.
22
Safety
Background
In recent years, lithium-ion battery fires in consumer products such as cell phones, hover boards, and
electric scooters have increased safety concerns for those living and working near battery storage
systems. In many cases, the consumer product issues relate to lack of certification from a Nationally
Recognized Testing Laboratory (NRTL) or packaging that is designed to minimize size but does not
accommodate the battery specifications. While these concerns do not translate directly to battery
modules installed in energy storage systems, there are several areas of battery storage safety that are
still developing.
UL-certifications and IEEE standards exist for battery storage system components; however, standards
for the battery storage system as a whole, including the integrations between components are only
recently established and continue to evolve. The stakeholder process for creating and revising
standards is lengthy, and in most cases, it does not keep up with the pace of technology innovation.
Furthermore, the April 2019 battery fire and deflagration incident at Arizona Public Service’s (APS)
McMicken Battery Storage Facility in Surprise, AZ put a spotlight on the catastrophic possibilities of this
emerging technology. The stateside event caused many in the industry to put additional focus on
activities in Korea where there were 23 battery fire incidents in a time period just over 1.5 years
between late 2017 and early 2019. The Korean government called for the Ministry of Trade, Industry
and Energy (MOTIE) to perform a root cause analysis and issue a report. In June 2019, the report
revealed four probable causes:
• Inadequate protection against external electric short circuits;
• Inadequate management of operating environments/climate control (temperature,
humidity/condensation, dust);
• Faulty installation (wrong connections, poor storage, dropped modules); and
• The absence of adequate, integrated control and protection systems.
The MOTIE report calls for measures to strengthen energy storage system safety in each of the
manufacturing, installation, operations, and firefighting phases. It also speaks to implementing safety
measures and supporting the Korean energy storage industry to enhance its industrial competitiveness
with the safety of the people as the number one priority.
Although the report speaks of good intentions, it does not contain concrete details or any pass/fail
criteria regarding safety checks. The industry is at a point of more questions than answers when it
comes to battery safety.
Key Takeaway
Deployment of emerging technologies involves uncertainties regarding safety, and current review
processes are not at speed with the technology emergence.
Austin Energy Experiences

23
In September 2018, Austin Energy issued a warranty claim related to its first battery storage system
tripping offline on numerous occasions by ground fault protection system action. The system integrator
worked with component manufacturers for several months to identify the root cause and ultimately
used indirect evidence to identify the root cause as humidity in the battery container that, under certain
conditions, allowed for power flow tracking across components setting off the ground fault detection
system. The remedy involved redesigning and retrofitting the environmental controls to include
dehumidification capabilities and adjusting control logic to stagger the HVAC systems depending on
operating conditions for optimal environmental management.
Austin Energy’s battery storage system had proper protections in place to prevent safety incidents.
However, this provided first-hand experience related to inadequate management of environmental
conditions, one of the probable causes listed in the MOTIE report.
In April 2019, just days after the McMicken Battery Storage event, Austin Energy took its grid-scale
battery storage systems offline out of an abundance of caution. One system remained offline until mid-
July 2019. During the extended outage, Austin Energy and its system integrator worked with the battery
manufacturer to understand how the Austin battery facility components compared to those in faulty
systems in Korea and Arizona. The team also installed hardware and software retrofits required by the
battery manufacturer that were not already in place.
After obtaining safe to operate documentation from the suppliers and performing a review of existing
protections, alarms/notifications, and response procedures, Austin Energy returned the system to
normal operations. Austin Energy has increased existing coordination with the Austin Fire Department
regarding site familiarization and response procedures. Additional monitoring and detection measures
are under consideration for retrofit potential. Furthermore, Austin Energy is working with industry
stakeholders on the development or enhancement of risk assessment tools specific to battery fire safety
such as Failure Mode and Effects Analysis (FMEA), Hazard Assessment, and analyse and demonstrate
causal relationships in high risk scenarios (e.g. Bow-Tie Risk Analysis).
24
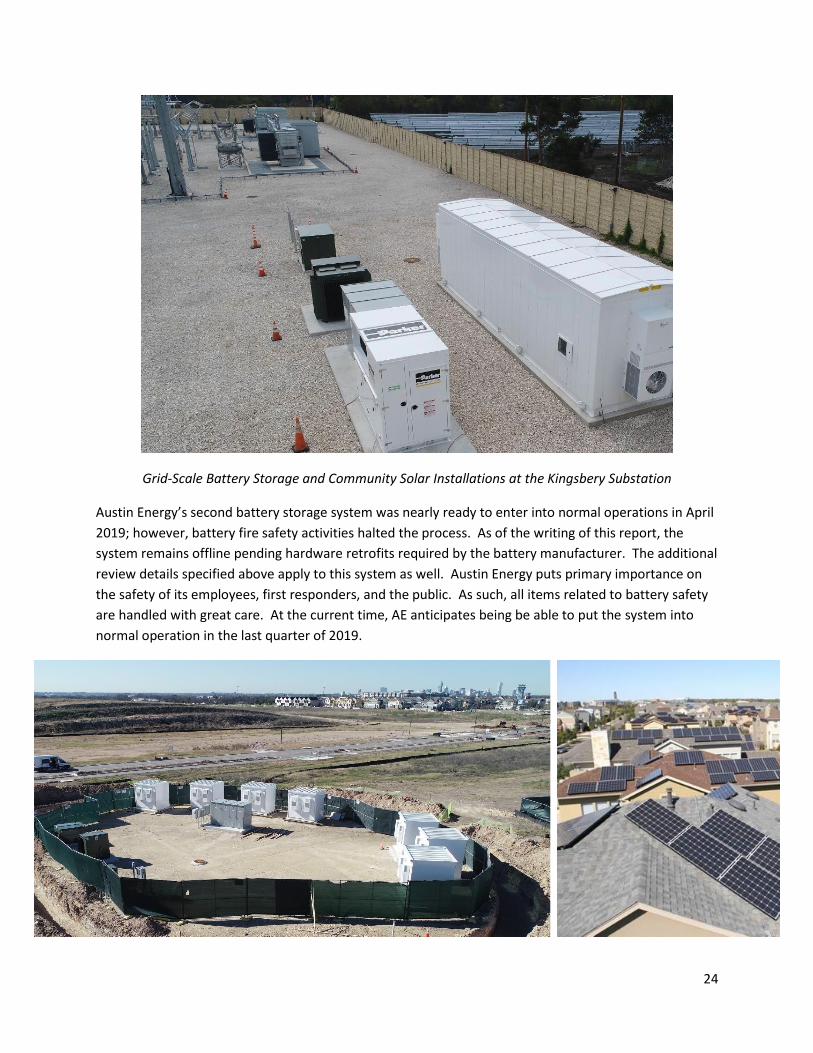
Grid-Scale Battery Storage and Community Solar Installations at the Kingsbery Substation
Austin Energy’s second battery storage system was nearly ready to enter into normal operations in April
2019; however, battery fire safety activities halted the process. As of the writing of this report, the
system remains offline pending hardware retrofits required by the battery manufacturer. The additional
review details specified above apply to this system as well. Austin Energy puts primary importance on
the safety of its employees, first responders, and the public. As such, all items related to battery safety
are handled with great care. At the current time, AE anticipates being be able to put the system into
normal operation in the last quarter of 2019.
25
Grid-Scale Battery Storage Installation and Rooftop Solar in the Mueller Neighborhood
Although neither system is identical to any of those that experienced fire events, the industry as a whole
is visibly shaken and taking a closer look at battery fire safety issues. Austin Energy’s prudent approach
aligns with utility counterparts, many of whom are set back by the battery safety concerns.
Value/Economics The lessons learned related to value and economics derive from physically monitoring and controlling
installed DER as well as creating models and simulations to perform sensitivity analysis and study future
scenarios. As mentioned previously, the ultimate objective of the Austin SHINES project is to
understand the value of DER installation, integration and control. Austin Energy purposefully included
many use-cases to allow for insights into the economics of DER from various perspectives, and five
topics stand out with key takeaways:
• Holistic control: Value stacking is possible but not all use-cases are created equal. Prioritization
is key.
• Reliability modeling: Modeling shows voltage issues at penetrations of 40% on the distribution
feeders studied; however, the maximum penetration of renewable energy resources on Austin
Energy’s distribution grid is currently 6%.
• Economic modeling: Modeling the fielded assets showed the scenario with the SHINES assets
increased the per kWh cost versus the baseline case.
• Field demonstration data: Field demonstration data indicates the value of battery storage does
not yet outweigh the costs, and reliability support is not yet needed.
• Load control considerations: Research by the University of Texas estimates that in Austin
Energy’s current environment, summer peak load can be reduced by 110 MW through load
control while including the effects of rooftop solar and onsite storage. Additionally, behind the
meter load control with rooftop solar is more economic than options (a) without solar and (b)
with solar and battery storage.
Before diving into the details of each takeaway listed above, it is important to recognize that DER value
and economics can be considered from multiple perspectives. The three most commonly considered
are the customer perspective, the utility perspective, and a third-party perspective. The economics of
the decision to own or operate DER depends heavily on which perspective you are considering. In
Austin SHINES, for example, Austin Energy chose to own and operate the grid-scale energy storage
systems. The grid-scale community solar farm is owned and operated by a third party and the energy
output is sold to Austin Energy through a Power Purchase Agreement (PPA). The PPA does not include
terms and conditions allowing for control of the solar farm, and as such, Austin Energy simply monitors
it and uses the data as an input into the control of the adjacent battery storage system.
The dynamics of value proposition perspectives increase when one entity owns DER assets but a
separate entity operates them. This could be the case if residential customers who own rooftop solar

26
systems allowed the utility to control their smart inverters for grid services. Another example could be
commercial customers owning battery storage systems but hiring a third-party aggregator to operate
the system to reduce the customer’s load or pair it with other systems and bid the fleet into the ancillary
services market. When considering ownership and control (or operations) from three different
perspectives, the use-case possibilities seem endless.
Holistic Control
Background
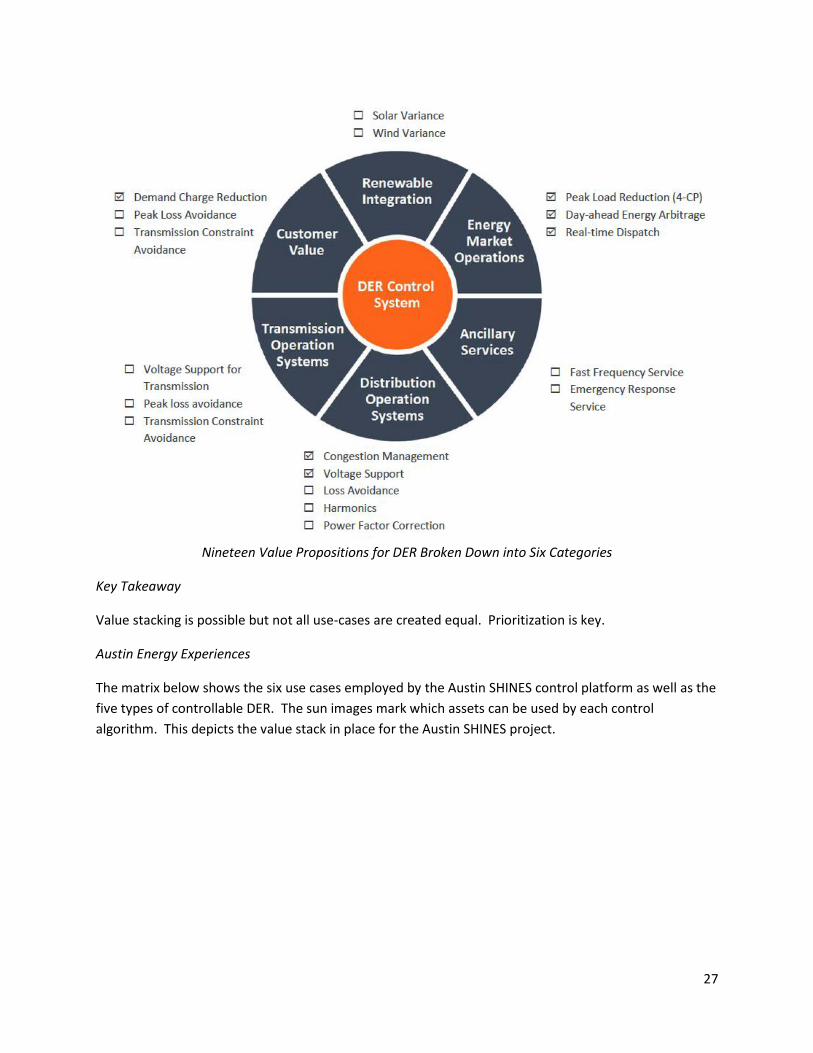
The diagram below lists the many potential value propositions DER can provide broken out into six
categories. Utilities must decide which strategies will be most effective for a given DER project location,
topology, and application. Not all are applicable to a particular situation; however, it is often the case
that more than one value stream can be realized from a single asset. Often DER are deployed with a
solitary use case defined, but this may not be enough to create a positive business case. While there is
often a value proposition that outweighs the others, adding extra value to the stack usually supports the
business case, provided the use cases do not have divergent objectives.
The centralized, fleet-level controller for the SHINES project is called the DER Optimizer or “DERO.”
DERO can employ the strategies with checkmarks next to them in the diagram below, while empty boxes
indicate strategies that are not fielded in Austin SHINES.
27
Nineteen Value Propositions for DER Broken Down into Six Categories
Key Takeaway
Value stacking is possible but not all use-cases are created equal. Prioritization is key.
Austin Energy Experiences
The matrix below shows the six use cases employed by the Austin SHINES control platform as well as the
five types of controllable DER. The sun images mark which assets can be used by each control
algorithm. This depicts the value stack in place for the Austin SHINES project.
28
Value Stacking: Austin SHINES Assets and Applications Matrix
For example, the grid-scale battery storage systems can realize market value through two use cases
(day-ahead energy arbitrage and real-time price dispatch) as well as provide reliability value through
two different use cases (voltage support and distribution congestion management). The battery storage
systems installed behind the meter at residential homes provide value through the same four use cases
plus additional market value through utility peak load reduction. As mentioned above in the technical
section regarding sizing, the grid-scale battery storage systems installed exceed the 1 MW registration
threshold in ERCOT, and therefore they cannot reduce the utility peak like their smaller counterparts
who do not have to register.
After defining the value stack for a set of controllable DER assets, one should consider the relative value
each use case provides. For example, in the ERCOT market, the value of reduced transmission cost of
service (TCOS) realized through the utility peak load reduction application far outweighs the economic
value realized by the day-ahead energy arbitrage and real-time price dispatch applications combined.
This is largely because ERCOT wholesale market prices are relatively low and stable throughout the year.
While supply constraints and extreme weather days lead to the occasional high price spike, the
occurrence does not happen often enough to equal the economic value of using battery storage to
offset the utility load during the fifteen-minute ERCOT system peak for a summer month, a use-case
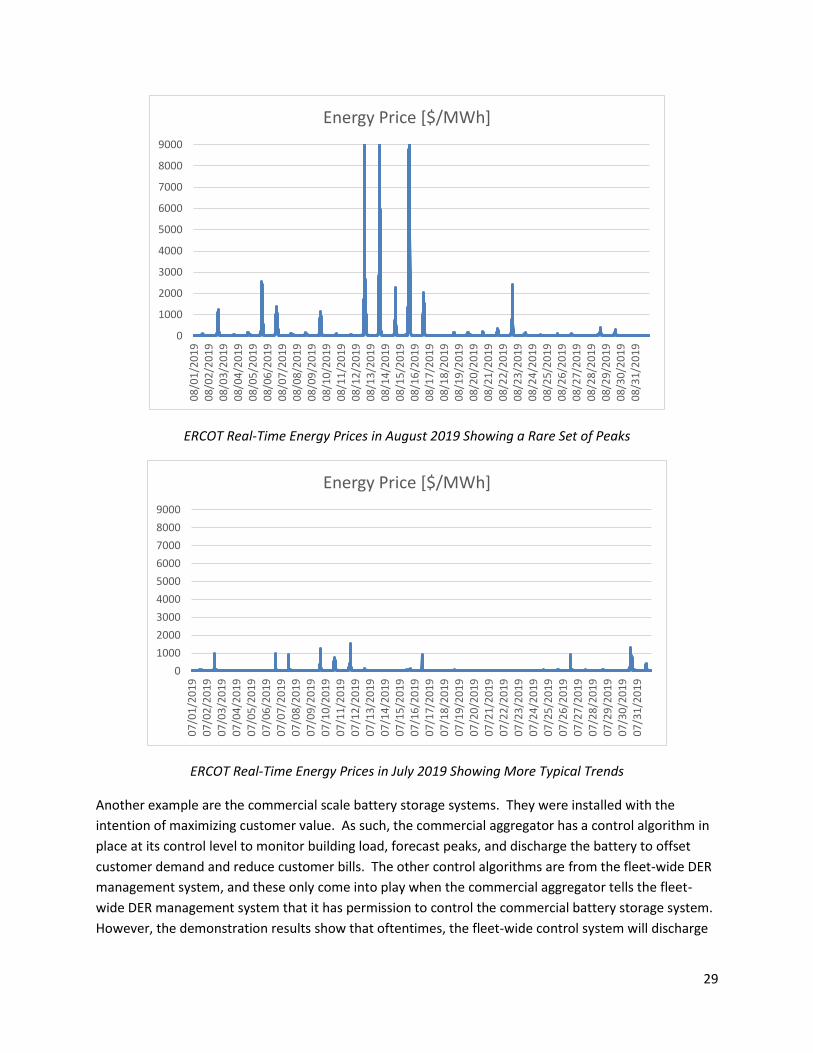
valued at $60/kW. Extreme summer conditions in August 2019, for example, caused the five-minute
real time energy price to spike to the market cap of $9000/MWh three times. In this anomalous month,
the average energy price was $107/MWh. By comparison, July 2019, which is more representative of a
typical month, had approximately ten price spikes, but all of them were below $2000/MWh, and the
monthly average energy price was $30/MWh.
29
ERCOT Real-Time Energy Prices in August 2019 Showing a Rare Set of Peaks
ERCOT Real-Time Energy Prices in July 2019 Showing More Typical Trends
Another example are the commercial scale battery storage systems. They were installed with the
intention of maximizing customer value. As such, the commercial aggregator has a control algorithm in
place at its control level to monitor building load, forecast peaks, and discharge the battery to offset
customer demand and reduce customer bills. The other control algorithms are from the fleet-wide DER
management system, and these only come into play when the commercial aggregator tells the fleet-
wide DER management system that it has permission to control the commercial battery storage system.
However, the demonstration results show that oftentimes, the fleet-wide control system will discharge
0
1000
2000
3000
4000
5000
6000
7000
8000
9000
08
/01
/20
19
08
/02
/20
19
08
/03
/20
19
08
/04
/20
19
08
/05
/20
19
08
/06
/20
19
08
/07
/20
19
08
/08
/20
19
08
/09
/20
19
08
/10
/20
19
08
/11
/20
19
08
/12
/20
19
08
/13
/20
19
08
/14
/20
19
08
/15
/20
19
08
/16
/20
19
08
/17
/20
19
08
/18
/20
19
08
/19
/20
19
08
/20
/20
19
08
/21
/20
19
08
/22
/20
19
08
/23
/20
19
08
/24
/20
19
08
/25
/20
19
08
/26
/20
19
08
/27
/20
19
08
/28
/20
19
08
/29
/20
19
08
/30
/20
19
08
/31
/20
19
Energy Price [$/MWh]
0
1000
2000
3000
4000
5000
6000
7000
8000
9000
07
/01
/20
19
07
/02
/20
19
07
/03
/20
19
07
/04
/20
19
07
/05
/20
19
07
/06
/20
19
07
/07
/20
19
07
/08
/20
19
07
/09
/20
19
07
/10
/20
19
07
/11
/20
19
07
/12
/20
19
07
/13
/20
19
07
/14
/20
19
07
/15
/20
19
07
/16
/20
19
07
/17
/20
19
07
/18
/20
19
07
/19
/20
19
07
/20
/20
19
07
/21
/20
19
07
/22
/20
19
07
/23
/20
19
07
/24
/20
19
07
/25
/20
19
07
/26
/20
19
07
/27
/20
19
07
/28
/20
19
07
/29
/20
19
07
/30
/20
19
07
/31
/20
19
Energy Price [$/MWh]
30
the battery storage to a state of charge that is insufficient to reduce the customer peaks when they
arrive at a later time.
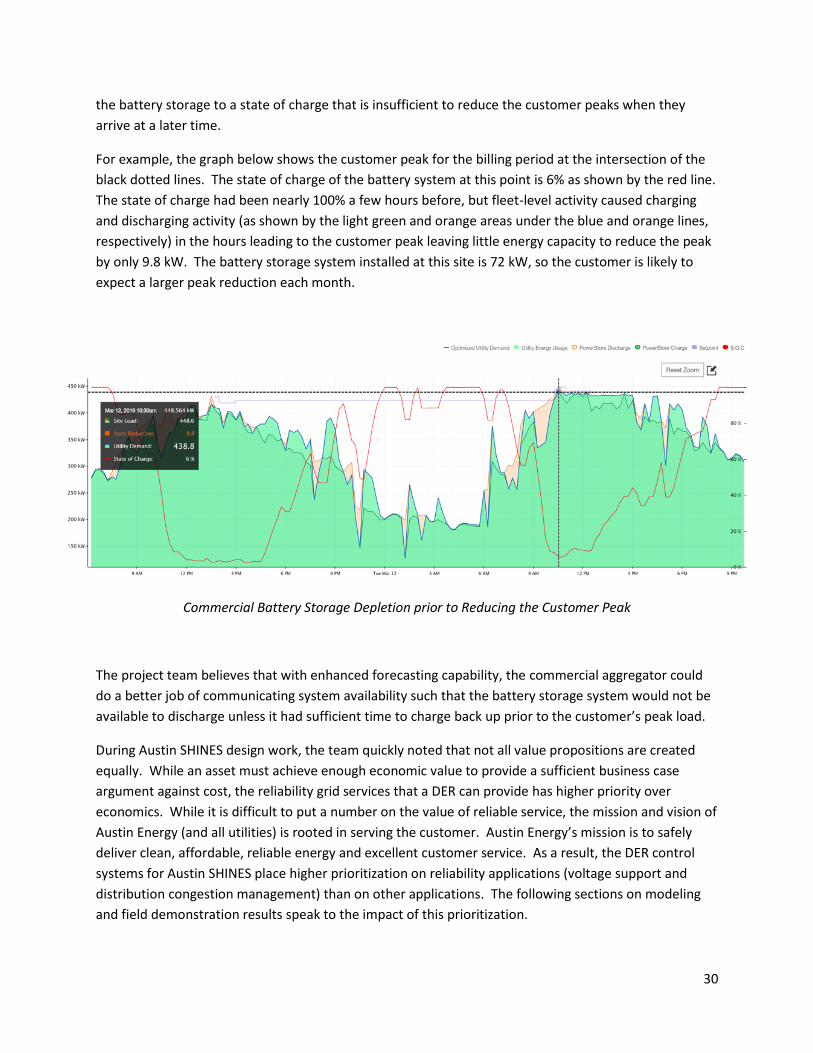
For example, the graph below shows the customer peak for the billing period at the intersection of the
black dotted lines. The state of charge of the battery system at this point is 6% as shown by the red line.
The state of charge had been nearly 100% a few hours before, but fleet-level activity caused charging
and discharging activity (as shown by the light green and orange areas under the blue and orange lines,
respectively) in the hours leading to the customer peak leaving little energy capacity to reduce the peak
by only 9.8 kW. The battery storage system installed at this site is 72 kW, so the customer is likely to
expect a larger peak reduction each month.
Commercial Battery Storage Depletion prior to Reducing the Customer Peak
The project team believes that with enhanced forecasting capability, the commercial aggregator could
do a better job of communicating system availability such that the battery storage system would not be
available to discharge unless it had sufficient time to charge back up prior to the customer’s peak load.
During Austin SHINES design work, the team quickly noted that not all value propositions are created
equally. While an asset must achieve enough economic value to provide a sufficient business case
argument against cost, the reliability grid services that a DER can provide has higher priority over
economics. While it is difficult to put a number on the value of reliable service, the mission and vision of
Austin Energy (and all utilities) is rooted in serving the customer. Austin Energy’s mission is to safely
deliver clean, affordable, reliable energy and excellent customer service. As a result, the DER control
systems for Austin SHINES place higher prioritization on reliability applications (voltage support and
distribution congestion management) than on other applications. The following sections on modeling
and field demonstration results speak to the impact of this prioritization.
31
Reliability Modeling
Background
Grid reliability can be defined as the ability of the electric power system to deliver electricity in the
quantity and quality required by the customer. This means not only providing adequate supply to meet
collective customer demand, but also ensuring the electricity provided is of high-power quality. An
unreliable grid leads to insufficient service for customers with the ultimate impact being power outages.
Among other characteristics such as frequency and waveform, power quality refers to the degree to
which voltage is provided as a steady supply that stays within the prescribed range. A satisfactory
voltage profile on a distribution circuit must maintain the following qualities:
• Voltage at any node within the distribution circuit must remain within ANSI C84.1 limits of 0.95
to 1.05 at the point of service
• Voltage at any node with the distribution circuit must remain relatively smooth and free of
problematic volatility and variability
The intermittency and rapid fluctuations of renewable generation such as solar and wind, especially at
higher penetrations, may lead to undesirable voltage volatility in the distribution system.
As the amount of renewable energy and distributed generation on the grid continues to increase,
utilities are examining how they can best leverage DERs to provide and maintain a reliable grid. All
alternating current (AC) power grids have two kinds of power: Watts of real power which provide useful
energy to consumers, and VARs (volt-amperes reactive) of reactive power, which only supply power to
magnetic fields. Though on average VARs do not provide any net power to end-use devices, VARs are
consumed by many common grid components, including power lines, air conditioners, and motors.
Reactive power can positively or negatively impact grid power quality measures, including voltage,
power losses, and power factor, and can even be a contributing cause to power outages. Especially in
areas with intermittent renewable energy resources, uncontrolled VARs on the grid can worsen grid
reliability; conversely, optimizing and controlling reactive power output from DERs can enhance it.
Existing solutions to provide reactive power control are effective but often do not provide the same
optionality provided by DERs. Utilities commonly use substation load tap changers (LTCs) and deploy
capacitor banks as the main methods of reactive power support due to low cost, but DERs have the
potential to supply or consume VARs with smaller resolution and faster reaction time. For areas
experiencing increased distributed generation by intermittent renewable energy resources, deploying
DERs with quick reactive power control becomes increasingly valuable.
Key Takeaway
Modeling shows voltage issues at solar penetrations of 40% on the distribution feeders studied;
however, the maximum penetration of renewable energy resources on Austin Energy’s distribution grid
is currently 6%.
Austin Energy Experiences

32
Austin SHINES included the development of a voltage support control application for DERs to mitigate
voltage volatility and improve the quality of voltage in the distribution system. A second reliability
application was developed to relieve distribution congestion, which occurs when electricity flow across a
system component (such as distribution line or transformers) exceeds safe design capacity. Both
reliability applications rank higher than the economic value applications (whether driven by market or
customer value) in the control prioritization. The reasoning is simple: if a utility does not provide a
reliable grid, then there is no platform on which to derive economic efficiencies.
The modeling results show, however, that the reliability applications are rarely used on the feeders
studied in Austin SHINES. Austin Energy design criteria and practices result in a robust distribution grid
with large conductors, relatively short feeders, and generally balanced loads. At current conditions,
Austin Energy achieves top decile performance in grid reliability metrics related to duration and
frequency of power outages. Austin Energy, in its local area but in conjunction with the larger ERCOT
grid, is able to manage power supply-demand balance as well as voltage and frequency levels within
acceptable ranges. In fact, most power outages arise from unrelated causes such as storms (e.g.
lightning) and vegetation, not power quality issues.
All DERs installed for Austin SHINES were concentrated on feeders served by Mueller and Kingsbery
substations to provide a dedicated area of study. These feeders have the highest solar penetration
percentages by energy, ranging between 5-6%. Kingsbery hosts the 2.6MW La Loma Community solar
farm and several rooftop solar installations. Mueller hosts the largest collection of rooftop solar in
Austin Energy’s service territory with over 1.1MW installed. Since reliability modeling and experience
(as further described below) does not show any impact from the current level of DER on Austin Energy’s
feeders, the project team looked to future scenarios where solar penetration is increased to 25% and
40% on the subject feeders.
Based on simulation results, voltage fluctuations (or volatility) are not a problem at 25% solar
penetration. That is, the fluctuations did not cause a significant increase in the number of load tap
changer operations, which translates to value in the form of asset deferment and reduced maintenance.
Regarding over and under voltage conditions, simulation results show one node at Mueller and a small
cluster of nodes at Kingsbery will experience overvoltage at 25% solar penetration, but only occasionally
and dependent on loading and the interaction of existing voltage regulating devices.
33
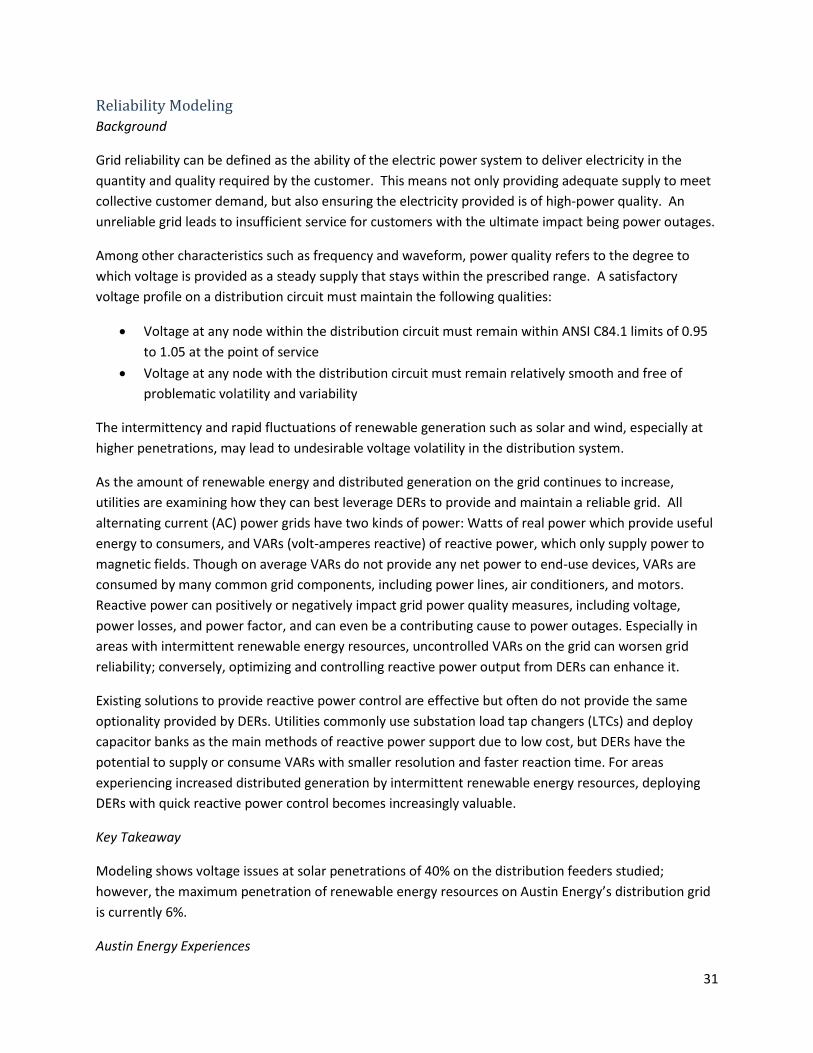
Voltage Heatmap of Mueller Feeders at 25% Solar Penetration
For Mueller, overvoltage occurs occasionally in shoulder months when the load is low and only at a
single node (shown in black). This overvoltage condition can be resolved by simply lowering the tap at
the substation regulator. No over or undervoltage conditions are observed in summer months.
Voltage Heatmap of Kingsbery Feeders at 25% Solar Penetration
For the Kingsbery feeders, overvoltage is observed in a cluster of nodes (shown in black) in early
summer months, a condition which is not observed in the March shoulder month analysis. The
Kingsbery feeder already has capacitor banks installed, so the solution to overvoltage is a combination

34
of switching the capacitor banks out and lowering the tap. As shown in the figures above, voltage levels
cover a broader range on the Kingsbery feeder compared to the Mueller feeder. This is due to the
interaction of voltage regulating devices. This suggests at higher penetration; voltage control would
become more complicated.
While solar penetrations up to 25% on Austin Energy feeders are manageable by the distribution grid as
currently designed, the problem of overvoltage is more widespread and happens more frequently at
40% penetration. Additionally, voltage fluctuations will be a problem at 40% as the load tap changers
must operate more frequently to keep the voltage under control. While results are location specific, this
points to 40% penetration as a trigger point when DER control would start to show substantial reliability
value.
Economic Modeling
Background
As stated previously, the cost-benefit analysis for DER installation is not complete without considering
economic value. An asset owner must find sufficient payback methods to overcome the still relatively
high costs of DER technologies and control mechanisms. While prices are coming down, the path to a
renewable portfolio is shortened by maximizing economic return.
One common way to consider the economic value of a generation asset is the Levelized Cost of Energy
(LCOE), which provides a normalizing value by calculating costs (capital and O&M) divided by the
amount of energy produced by the asset. The result is a $/kWh metric that can be compared across
assets. With DER, the concept can quickly become more complicated. Some DERs provide value by
producing energy, while others reduce load. Some adjust the timeframe by which energy can be used
by storing it now for use later. This can be simplified by thinking about the differential value of DER
integration. That is, consider the value gained less the cost incurred to serve the load within a defined
boundary. As a formula, this looks like (Value Gained – Cost Incurred)/kWh Served. While this also
results in a $/kWh metric, it looks at a system holistically, including the synergistic value obtained by
assets within a boundary working together instead of studying the value of a single asset. This is more
characteristic of DER, which are often used in pairings or groups to obtain value.
Once the system boundary is defined, the metric can be used to compare, for a given kWh, current
state (with some level of DER) to an alternate state (with additional levels of DER). While the ultimate
choice of whether or not to deploy DER will also consider qualitative factors, this methodology provides
quantitative factors to support decision making efforts.
35
An Illustrative System Boundary that Includes Traditional Grid Assets and DERs
In concept, higher levels of DER mean more assets in the system, which leads to increased costs unless
one of two things are true. Either (1) the DER must replace traditional utility assets so as to not have
additive costs, or (2) the DER must provide value to offset the costs or both. The use of DERs to replace
traditional utility assets is known as Non-Wires Alternatives (NWA) and is often used in conjunction with
reliability considerations. The other option relates more directly to economic value, which is often
realized through the use of controls.
Few DER resources provide value simply through installation. Smart inverters, energy storage, electric
vehicles and controllable loads require communications, monitoring and controls to maximize their
value. Control is possible at various levels of sophistication. On one end of the spectrum are
rudimentary or rigidly scheduled controls, where DER carry out very simple applications. Changes in the
operation of a DER at this control level are often according to preset time schedules intended to
maximize the value of the DER, based on such parameters as time-of-use rates, historical load profiles,
or historical energy prices.
The opposite end of the spectrum is holistic controls where DERs carry out schedules established,
coordinated, and optimized by a fleet-level control system that uses various inputs to forecast future
conditions and can make updates as conditions change.
One can use the previously described cost metric, in $/kWh, to compare a system with DERs that are
controlled simply compared to the same system where the DER are controlled holistically. One might
hypothesize that the value of holistic controls would be greater than more simplistic controls, especially
as the metric relates to a baseline value where no additional DER are installed. However, economic
modeling results often showed otherwise given regulatory and market conditions.
36
Key Takeaway
Modeling the fielded assets showed the scenario with the SHINES assets increased the per kWh cost
versus the baseline case.
Austin Energy Experiences
As stated previously, Austin SHINES includes a metric that calculates the potential for DER managed by
an integrated optimization platform (holistic controls) to realize a cost benefit relative to the baseline
cost of the same level of DER deployed without optimization and integration (simplistic controls). The
model determined that the cost of additional SHINES assets as deployed and dispatched would raise the
cost to serve load on the feeder. As fielded, holistic controls raised costs even more. In other words,
energy/service costs more under the SHINES program than it does under the baseline. This is not
unexpected, as energy prices are relatively low and energy storage and local solar prices still relatively
high. In addition, assets under DERO control encountered difficulty in optimally managing multiple use
cases and interfacing with commercial systems. It is anticipated that these bugs can be ironed out with
additional work on management algorithms and better coordination between DERO and other
management systems.
Modeled scenarios can demonstrate the potential for holistic controls to provide a higher value than
simple controls or a baseline with no controls. Research shows that the differential value of DER
optimization has merit and is worth investigating further, even though widespread deployment is not
supported by current market and system conditions. Understanding the sensitivity of the model to
different cost and value impacts is critical to predictive analytics being able to forecast tipping points for
the economic viability of DER deployment and integration. More research should be conducted in this
area.
As stated earlier, the 1MW registration requirement for distributed generation in ERCOT precludes the
three grid-scale assets installed (both solar and battery storage) from realizing the highest valued use-
case, Peak Load Reduction. These larger-scale assets far outweigh the size of the smaller, behind the
meter DER, and they can better realize economies of scale. To achieve the same amount of load
reduction requires a high quantity of smaller systems, each with the added costs of communications
which is often a monthly subscription fee that adds up quickly. Additionally, system peaks often occur
during a known time window which can be captured with high probability using simple controls. Other
economically driven control applications are driven by market prices, which were demonstrated earlier
to be relatively low and flat.
Economic modeling discussions have revealed that to realize a positive differential value of DER from a
control perspective, some combination of the following would need to occur.
37
• Additional market opportunities that require sophisticated controls, such as fast frequency
response, would need to become available in the ERCOT market in a more unrestricted manner
than they are today;
• Market prices would need to rise and/or become more volatile;
• Reliability issues would need to start occurring on Austin Energy’s system, likely due to higher
renewable penetration, and the value of reliability would need to be able to be quantified (not
just considered as a qualitative factor);
• The costs of communicating with smaller DER assets beyond the grid’s edge would need to
reduce, potentially from using costly monthly cellular subscriptions to leveraging the network in
place for Advanced Metering Infrastructure (AMI); and
• Additional DER types with differing value propositions, such as electric vehicles and load
control, would need to be integrated into the control platform at larger scales to realize the
benefits of value stacking through asset diversity.
In summary, the concept of holistic control and value stacking is clear, but it is not easily realized
given current conditions. Economic modeling results show that Austin Energy would be better
suited to engage in “readying” activities such as streamlining control system architecture,
developing integrations for additional DER types, and developing tools to monitor key trigger points
rather than engaging in wider-scale deployment of DERs at the current time.
Field Demonstration Data
Background
Although the benefits of modeling and simulations provide opportunity for what-if scenarios, there is
also tremendous benefit to obtaining actual field demonstration data. Often models and simulations
make assumptions that assets function seamlessly and end-to-end communication is uninhibited. In
reality, equipment components fail or become unavailable during maintenance periods, communication
paths are interrupted, control algorithm software contains bugs that prevent intended outcomes, and
human error introduces unexpected results. In some cases, this is a level of system integration maturity,
and early “growing pains” can be worked out with proper feedback loops.
In other cases, technology is evolving, and manufacturers are working through product roadmaps to
provide enhanced functionality. Regardless, one must recognize that these issues are realities that must
be overcome before achieving expected value streams. The experience of working through these issues
is valuable from a learning perspective, but at some point, lessons are learned, experience is gained, and
utilities move out of a research and development mode and into a full-scale deployment based on a true
business case assessment.
Key Takeaway
Field demonstration data indicates the value of battery storage does not yet outweigh the costs, and
reliability support is not yet needed.
Austin Energy Experiences
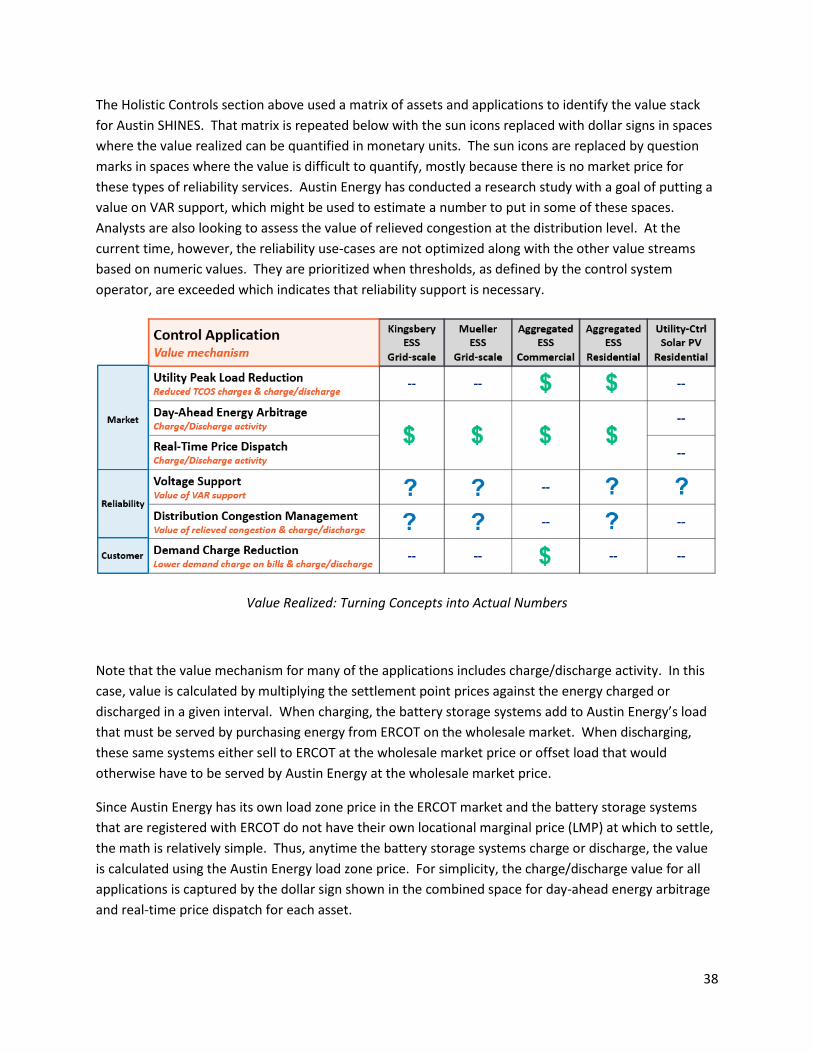
38
The Holistic Controls section above used a matrix of assets and applications to identify the value stack
for Austin SHINES. That matrix is repeated below with the sun icons replaced with dollar signs in spaces
where the value realized can be quantified in monetary units. The sun icons are replaced by question
marks in spaces where the value is difficult to quantify, mostly because there is no market price for
these types of reliability services. Austin Energy has conducted a research study with a goal of putting a
value on VAR support, which might be used to estimate a number to put in some of these spaces.
Analysts are also looking to assess the value of relieved congestion at the distribution level. At the
current time, however, the reliability use-cases are not optimized along with the other value streams
based on numeric values. They are prioritized when thresholds, as defined by the control system
operator, are exceeded which indicates that reliability support is necessary.
Value Realized: Turning Concepts into Actual Numbers
Note that the value mechanism for many of the applications includes charge/discharge activity. In this
case, value is calculated by multiplying the settlement point prices against the energy charged or
discharged in a given interval. When charging, the battery storage systems add to Austin Energy’s load
that must be served by purchasing energy from ERCOT on the wholesale market. When discharging,
these same systems either sell to ERCOT at the wholesale market price or offset load that would
otherwise have to be served by Austin Energy at the wholesale market price.
Since Austin Energy has its own load zone price in the ERCOT market and the battery storage systems
that are registered with ERCOT do not have their own locational marginal price (LMP) at which to settle,
the math is relatively simple. Thus, anytime the battery storage systems charge or discharge, the value
is calculated using the Austin Energy load zone price. For simplicity, the charge/discharge value for all
applications is captured by the dollar sign shown in the combined space for day-ahead energy arbitrage
and real-time price dispatch for each asset.
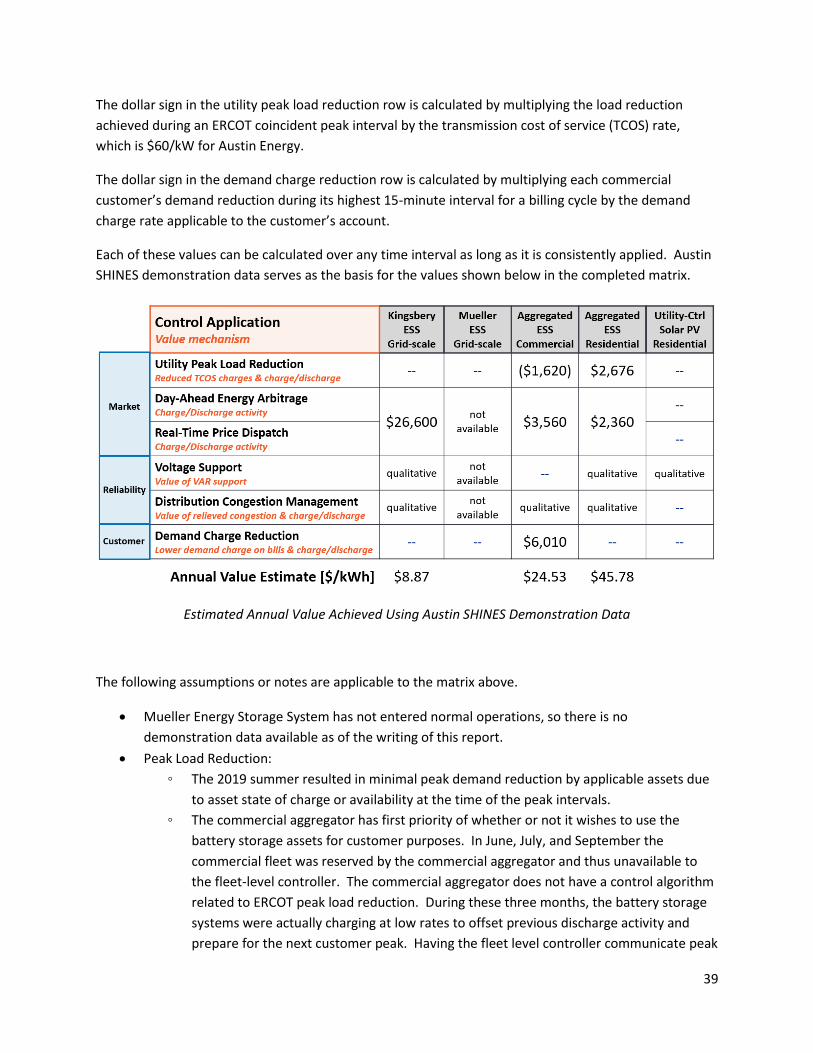
39
The dollar sign in the utility peak load reduction row is calculated by multiplying the load reduction
achieved during an ERCOT coincident peak interval by the transmission cost of service (TCOS) rate,
which is $60/kW for Austin Energy.
The dollar sign in the demand charge reduction row is calculated by multiplying each commercial
customer’s demand reduction during its highest 15-minute interval for a billing cycle by the demand
charge rate applicable to the customer’s account.
Each of these values can be calculated over any time interval as long as it is consistently applied. Austin
SHINES demonstration data serves as the basis for the values shown below in the completed matrix.
Estimated Annual Value Achieved Using Austin SHINES Demonstration Data
The following assumptions or notes are applicable to the matrix above.
• Mueller Energy Storage System has not entered normal operations, so there is no
demonstration data available as of the writing of this report.
• Peak Load Reduction:
◦ The 2019 summer resulted in minimal peak demand reduction by applicable assets due
to asset state of charge or availability at the time of the peak intervals.
◦ The commercial aggregator has first priority of whether or not it wishes to use the
battery storage assets for customer purposes. In June, July, and September the
commercial fleet was reserved by the commercial aggregator and thus unavailable to
the fleet-level controller. The commercial aggregator does not have a control algorithm
related to ERCOT peak load reduction. During these three months, the battery storage
systems were actually charging at low rates to offset previous discharge activity and
prepare for the next customer peak. Having the fleet level controller communicate peak
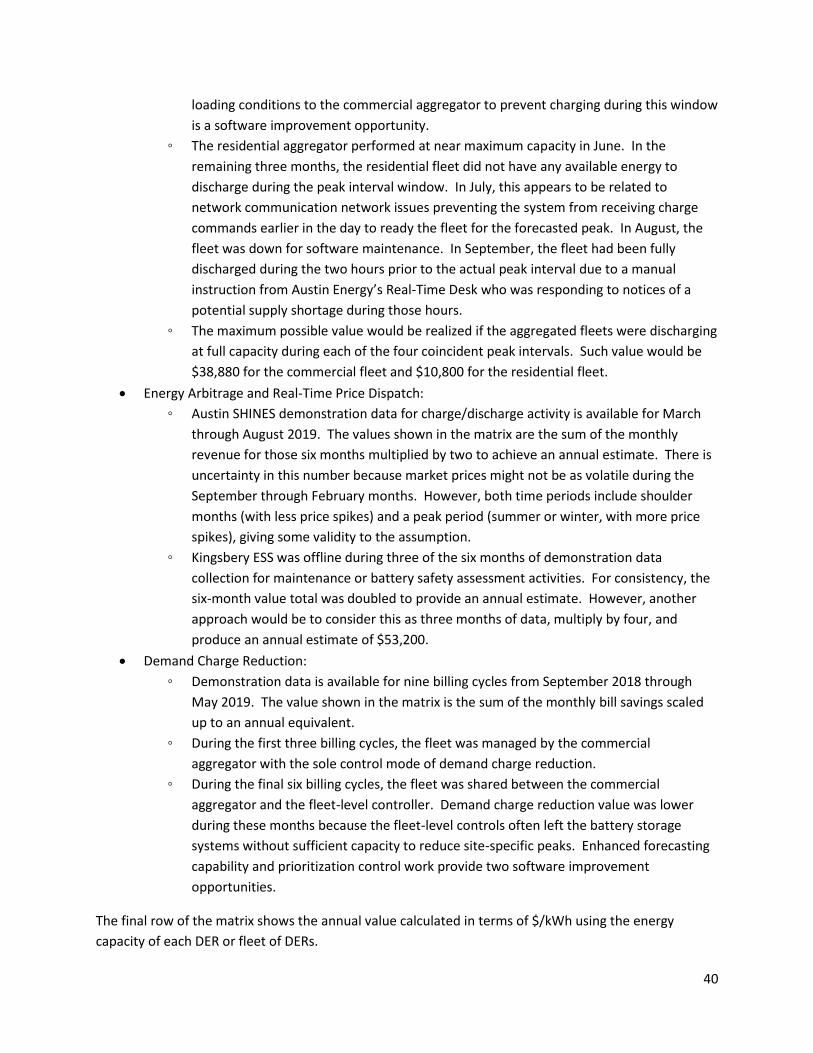
40
loading conditions to the commercial aggregator to prevent charging during this window
is a software improvement opportunity.
◦ The residential aggregator performed at near maximum capacity in June. In the
remaining three months, the residential fleet did not have any available energy to
discharge during the peak interval window. In July, this appears to be related to
network communication network issues preventing the system from receiving charge
commands earlier in the day to ready the fleet for the forecasted peak. In August, the
fleet was down for software maintenance. In September, the fleet had been fully
discharged during the two hours prior to the actual peak interval due to a manual
instruction from Austin Energy’s Real-Time Desk who was responding to notices of a
potential supply shortage during those hours.
◦ The maximum possible value would be realized if the aggregated fleets were discharging
at full capacity during each of the four coincident peak intervals. Such value would be
$38,880 for the commercial fleet and $10,800 for the residential fleet.
• Energy Arbitrage and Real-Time Price Dispatch:
◦ Austin SHINES demonstration data for charge/discharge activity is available for March
through August 2019. The values shown in the matrix are the sum of the monthly
revenue for those six months multiplied by two to achieve an annual estimate. There is
uncertainty in this number because market prices might not be as volatile during the
September through February months. However, both time periods include shoulder
months (with less price spikes) and a peak period (summer or winter, with more price
spikes), giving some validity to the assumption.
◦ Kingsbery ESS was offline during three of the six months of demonstration data
collection for maintenance or battery safety assessment activities. For consistency, the
six-month value total was doubled to provide an annual estimate. However, another
approach would be to consider this as three months of data, multiply by four, and
produce an annual estimate of $53,200.
• Demand Charge Reduction:
◦ Demonstration data is available for nine billing cycles from September 2018 through
May 2019. The value shown in the matrix is the sum of the monthly bill savings scaled
up to an annual equivalent.
◦ During the first three billing cycles, the fleet was managed by the commercial
aggregator with the sole control mode of demand charge reduction.
◦ During the final six billing cycles, the fleet was shared between the commercial
aggregator and the fleet-level controller. Demand charge reduction value was lower
during these months because the fleet-level controls often left the battery storage
systems without sufficient capacity to reduce site-specific peaks. Enhanced forecasting
capability and prioritization control work provide two software improvement
opportunities.
The final row of the matrix shows the annual value calculated in terms of $/kWh using the energy
capacity of each DER or fleet of DERs.
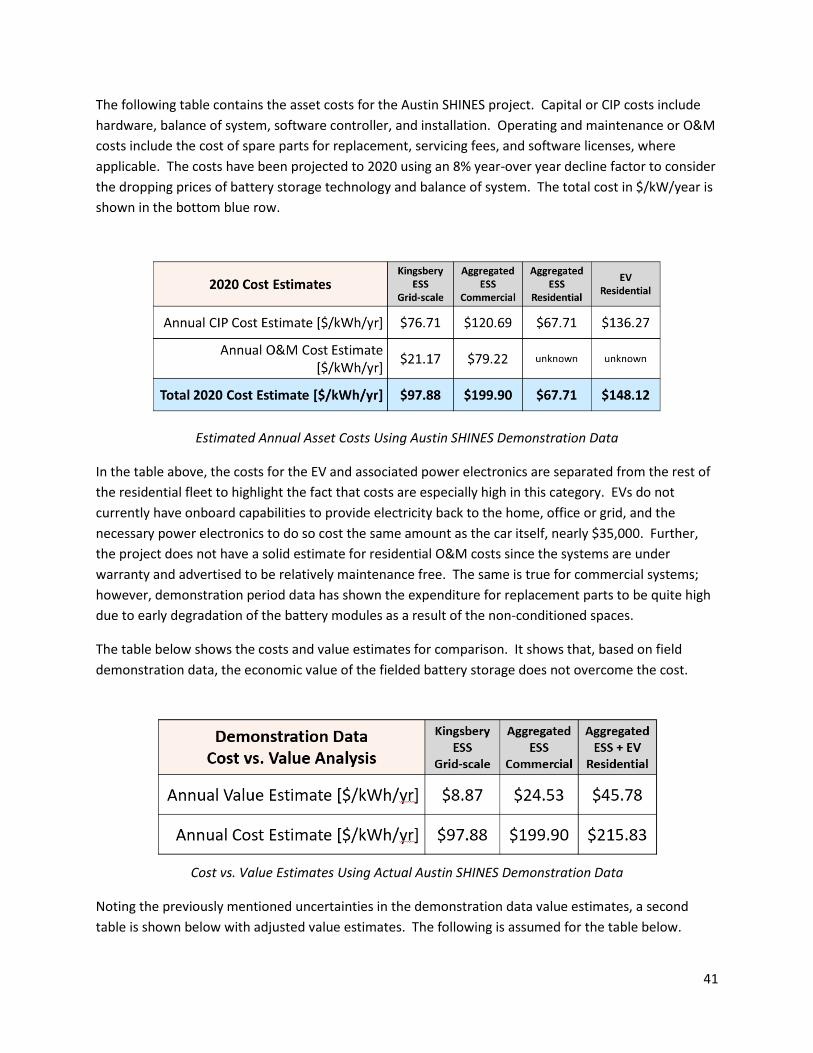
41
The following table contains the asset costs for the Austin SHINES project. Capital or CIP costs include
hardware, balance of system, software controller, and installation. Operating and maintenance or O&M
costs include the cost of spare parts for replacement, servicing fees, and software licenses, where
applicable. The costs have been projected to 2020 using an 8% year-over year decline factor to consider
the dropping prices of battery storage technology and balance of system. The total cost in $/kW/year is
shown in the bottom blue row.
Estimated Annual Asset Costs Using Austin SHINES Demonstration Data
In the table above, the costs for the EV and associated power electronics are separated from the rest of
the residential fleet to highlight the fact that costs are especially high in this category. EVs do not
currently have onboard capabilities to provide electricity back to the home, office or grid, and the
necessary power electronics to do so cost the same amount as the car itself, nearly $35,000. Further,
the project does not have a solid estimate for residential O&M costs since the systems are under
warranty and advertised to be relatively maintenance free. The same is true for commercial systems;
however, demonstration period data has shown the expenditure for replacement parts to be quite high
due to early degradation of the battery modules as a result of the non-conditioned spaces.
The table below shows the costs and value estimates for comparison. It shows that, based on field
demonstration data, the economic value of the fielded battery storage does not overcome the cost.
Cost vs. Value Estimates Using Actual Austin SHINES Demonstration Data
Noting the previously mentioned uncertainties in the demonstration data value estimates, a second
table is shown below with adjusted value estimates. The following is assumed for the table below.
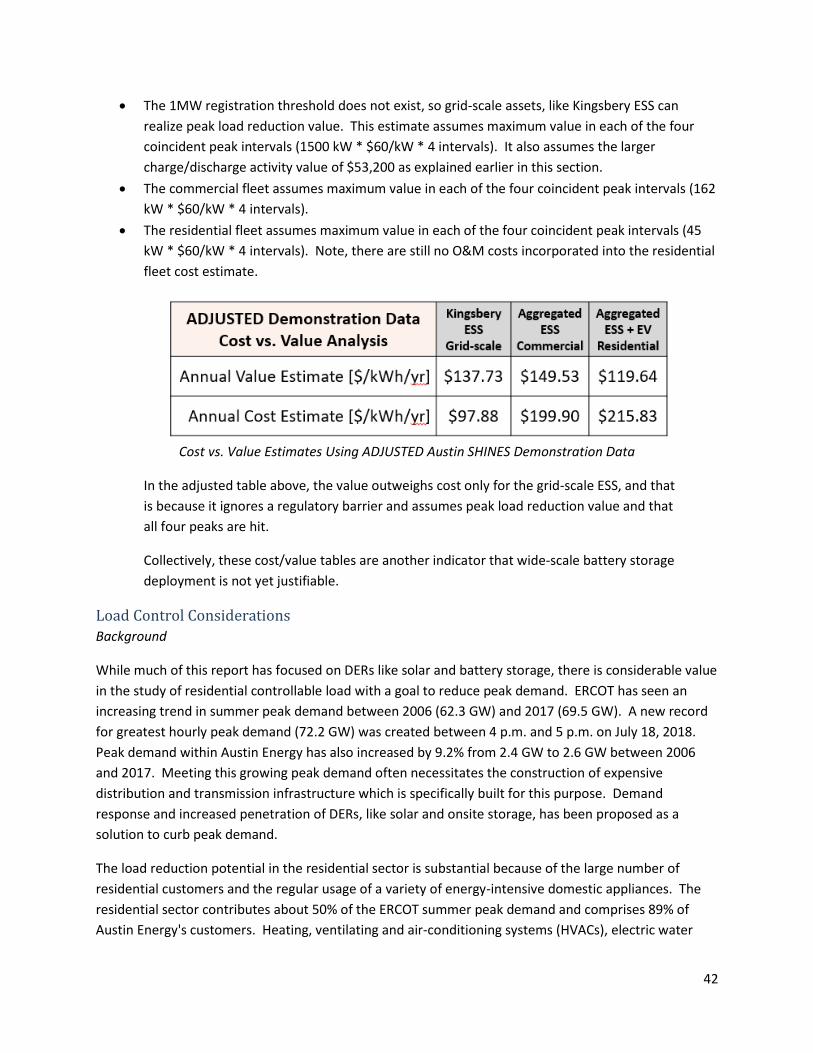
42
• The 1MW registration threshold does not exist, so grid-scale assets, like Kingsbery ESS can
realize peak load reduction value. This estimate assumes maximum value in each of the four
coincident peak intervals (1500 kW * $60/kW * 4 intervals). It also assumes the larger
charge/discharge activity value of $53,200 as explained earlier in this section.
• The commercial fleet assumes maximum value in each of the four coincident peak intervals (162
kW * $60/kW * 4 intervals).
• The residential fleet assumes maximum value in each of the four coincident peak intervals (45
kW * $60/kW * 4 intervals). Note, there are still no O&M costs incorporated into the residential
fleet cost estimate.
Cost vs. Value Estimates Using ADJUSTED Austin SHINES Demonstration Data
In the adjusted table above, the value outweighs cost only for the grid-scale ESS, and that
is because it ignores a regulatory barrier and assumes peak load reduction value and that
all four peaks are hit.
Collectively, these cost/value tables are another indicator that wide-scale battery storage
deployment is not yet justifiable.
Load Control Considerations
Background
While much of this report has focused on DERs like solar and battery storage, there is considerable value
in the study of residential controllable load with a goal to reduce peak demand. ERCOT has seen an
increasing trend in summer peak demand between 2006 (62.3 GW) and 2017 (69.5 GW). A new record
for greatest hourly peak demand (72.2 GW) was created between 4 p.m. and 5 p.m. on July 18, 2018.
Peak demand within Austin Energy has also increased by 9.2% from 2.4 GW to 2.6 GW between 2006
and 2017. Meeting this growing peak demand often necessitates the construction of expensive
distribution and transmission infrastructure which is specifically built for this purpose. Demand
response and increased penetration of DERs, like solar and onsite storage, has been proposed as a
solution to curb peak demand.
The load reduction potential in the residential sector is substantial because of the large number of
residential customers and the regular usage of a variety of energy-intensive domestic appliances. The
residential sector contributes about 50% of the ERCOT summer peak demand and comprises 89% of
Austin Energy's customers. Heating, ventilating and air-conditioning systems (HVACs), electric water

43
heaters (EWHs), electric vehicles (EVs), and pool pumps are significant consumers of energy in the
residential sector.
HVAC load comprises one-third of the peak during the summer peak day while uncontrollable load
comprises the majority of the demand during the winter minimum peak. EWHs cycle on and off
throughout the day to keep water hot, EVs are charged in the early morning and late evening hours, and
pool pump load is observed during the waking hours on both days. Research shows that controlling
these four types of loads can result in significant peak reduction results. For example, EV charging
control alone provides a valuable opportunity to shape demand, especially when vehicles are plugged in
for long stretches of time providing flexibility to the charging window. According to a 2013 study, a
single EV battery being charged using a residential level 2 charger can increase electricity consumption
by the same amount as an average North American household.
Compared to other DER investments, load control devices are relatively inexpensive. However,
customers who engage in load control may also be those who consider other DER installations for their
homes, like solar and onsite storage. As discussed throughout this report, residential DERs, like those at
other installation scales, can provide multiple value streams especially when integrated and optimized.
However, high capital and installation costs remain one of the major disadvantages associated with
residential solar and storage. Investment tax credits, rebates, and rate structure programs offered by
some utilities can help reduce the economic burden of DER investments.
Key Takeaway
In Austin Energy’s current environment, summer peak load can be reduced through load control while
including the effects of rooftop solar and onsite storage. Additionally, behind the meter load control
with rooftop solar is more economic than options (a) without solar and (b) with solar and battery
storage.
Austin Energy Experiences
As part of the Austin SHINES project, Austin Energy engaged with the University of Texas at Austin (UT)
to perform academic research into the benefits and drivers of residential load control when including
the effects of other DER, such as rooftop solar and onsite storage. UT performed several studies.
The first aimed to find the maximum possible peak load reduction and shifts in total consumption by
considering operational changes to HVACs, EVs, EWHs, and pool pumps and including the effects of
rooftop solar PV and energy storage systems (ESSs). For the summer day in 2017, peak load was
reduced by 110 MW (7.8%) using the load shifting algorithm developed. This analysis shifted HVAC load
only after shifting all other controllable loads, with a goal of minimizing the impact on customer
comfort. In fact, the control algorithm for each appliance included some constraint to maintain
customer comfort at satisfactory levels. If one is willing to shift HVAC load more drastically and
frequently, higher peak reductions can be achieved as seen in a scenario resulting in 366 kW reduction.
In this case, HVAC load was shifted second, only after pool pump adjustments were made.
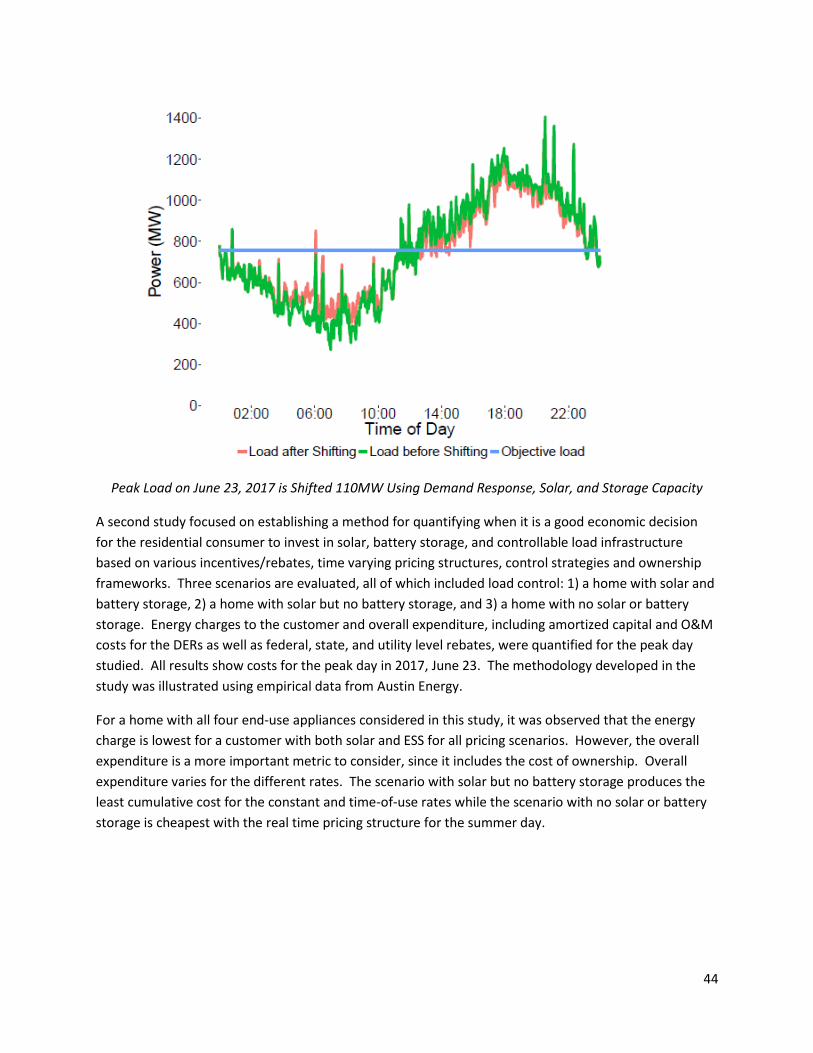
44
Peak Load on June 23, 2017 is Shifted 110MW Using Demand Response, Solar, and Storage Capacity
A second study focused on establishing a method for quantifying when it is a good economic decision
for the residential consumer to invest in solar, battery storage, and controllable load infrastructure
based on various incentives/rebates, time varying pricing structures, control strategies and ownership
frameworks. Three scenarios are evaluated, all of which included load control: 1) a home with solar and
battery storage, 2) a home with solar but no battery storage, and 3) a home with no solar or battery
storage. Energy charges to the customer and overall expenditure, including amortized capital and O&M
costs for the DERs as well as federal, state, and utility level rebates, were quantified for the peak day
studied. All results show costs for the peak day in 2017, June 23. The methodology developed in the
study was illustrated using empirical data from Austin Energy.
For a home with all four end-use appliances considered in this study, it was observed that the energy
charge is lowest for a customer with both solar and ESS for all pricing scenarios. However, the overall
expenditure is a more important metric to consider, since it includes the cost of ownership. Overall
expenditure varies for the different rates. The scenario with solar but no battery storage produces the
least cumulative cost for the constant and time-of-use rates while the scenario with no solar or battery
storage is cheapest with the real time pricing structure for the summer day.
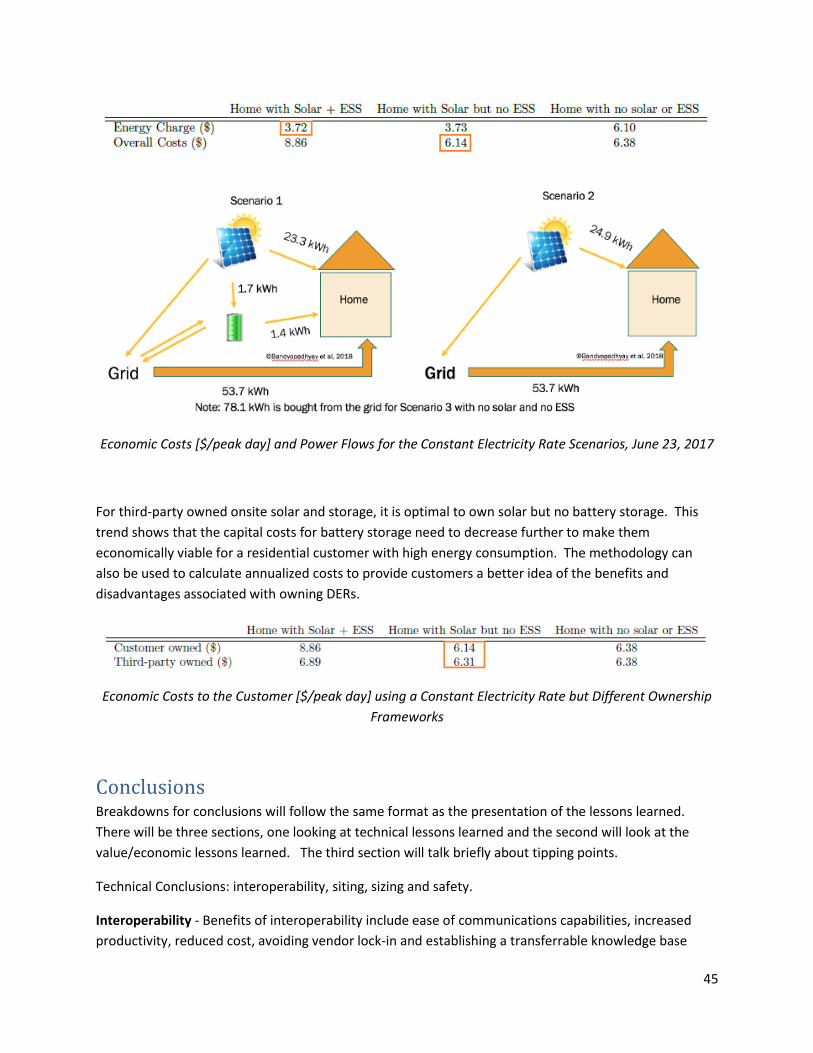
45
Economic Costs [$/peak day] and Power Flows for the Constant Electricity Rate Scenarios, June 23, 2017
For third-party owned onsite solar and storage, it is optimal to own solar but no battery storage. This
trend shows that the capital costs for battery storage need to decrease further to make them
economically viable for a residential customer with high energy consumption. The methodology can
also be used to calculate annualized costs to provide customers a better idea of the benefits and
disadvantages associated with owning DERs.
Economic Costs to the Customer [$/peak day] using a Constant Electricity Rate but Different Ownership
Frameworks
Conclusions Breakdowns for conclusions will follow the same format as the presentation of the lessons learned.
There will be three sections, one looking at technical lessons learned and the second will look at the
value/economic lessons learned. The third section will talk briefly about tipping points.
Technical Conclusions: interoperability, siting, sizing and safety.
Interoperability - Benefits of interoperability include ease of communications capabilities, increased
productivity, reduced cost, avoiding vendor lock-in and establishing a transferrable knowledge base
46
within the company. It is clear from work to date that vendors and the industry have yet to settle on the
relevant standards necessary to ensure systems can work together reliably, or with ease of integration.
Efforts by some vendors to intentionally lock out competition, as well as the lack of clarity of many
vendors’ DER integration roadmap for the future, hamper planning efforts. The result is that significant
additional investment in DER integration requiring known standards is risky as it exposes the utility to
potential vendor lock-in, additional (unknown) integration costs, and potentially limits the future
capabilities of those assets procured or developed. An appropriate risk mitigation strategy is to limit the
investment of time and money in the development of infrastructure that does not have relevant and
required standards developed. Care should be taken to direct the bulk of investment in DER integration
into areas that aren’t prone to obsolescence due to evolving standards. These areas include developing
safety, siting and design guidelines, understanding the locational impacts of DER deployment, and
developing a roadmap for DER integration that allows flexibility for accommodating uncertainty related
to standards.
Siting - All three areas of SHINES, utility, commercial and residential, revealed significant challenges for
battery energy storage in initial siting work, and unresolved issues for future installations in both
existing buildings and new construction. Siting, construction, safety and installation standards as well as
building and fire codes are rapidly evolving based upon lessons learned from earlier deployments.
Location plays a very important role when considering battery storage, a point that is explored more in
other sections of this report. Widespread investment in battery energy storage at this time could
expose the investor to unnecessary levels of risk, conversely, limited installations, when thoroughly
vetted, pose an opportunity for additional lessons learned. Significant work remains in the areas of
safety code development and new building design to accommodate future storage installations. Vendor
product development advancements are also required to ensure systems are safe and can operate in
adverse environments.
Sizing - Design is critical when considering the location, application/economics and size of DER.
Modeling predicts that many feeders won’t experience widespread voltage issues until approaching 40%
penetration of solar, but that the location of potential DER interconnections may have a significant
impact upon distribution system reliability in even relatively small deployments. This suggests that near
term investments should be made into understanding, communicating and mitigating the locational
impacts of DER, and longer-term research should be dedicated to abating concerns posed by high
penetrations of DER upon the distribution system.
Understanding the locational impacts of DER is best addressed by having the capability to determine the
hosting capacity at any point on a given feeder in real time, as hosting capacity changes over time as the
electrical system architecture is changed and other assets (such as solar and storage) are deployed on a
given feeder. The ERCOT requirement that systems 1 MW and over be registered merits tracking as
well. ERCOT has a number of working groups looking at energy storage issues. A change in the ERCOT
requirement would dramatically impact the potential economics of large-scale distributed energy
storage.
47
Safety - The APS fire and deflagration incident heightened safety concerns within Austin Energy, and
expanded the national dialogue around battery fire safety. Many of the design flaws believed to be
potential causes for other fires appear to have been addressed in the initial design of systems deployed
in Austin. Other issues such as failure detection, fire suppression and emergency response have been
revisited and continue to be examined. It appears that changes in technology are currently outpacing
the changes in standards and procedures. Therefore, attention should be paid to the evolving nature of
these changes and being involved in the national and industry discussions taking place about these
changes. Continued involvement in discussions with vendors, trade organizations, and standards bodies
are critical to establishing and maintaining a safe DER fleet.
From a technical integration standpoint, it appears that standards in the design and installation of DER
(and in particular energy storage) are poorly defined, lack consensus, and are struggling to keep up with
the pace of change in technology. This is typical in emerging technology fields. While there is
substantial potential upside for some vendors/investors in taking a risky early position related to
technologies in the DER space at this time, there is little upside for Austin Energy. That said, it appears
that the widespread technical viability of DER is a “when not if” proposition. The prudent path is to
continue to work on areas of DER integration that position Austin Energy, its customers, and the
marketplace to be able to deploy these assets quickly and easily as the market and system conditions
support it. Therefore, the areas of safety, design, hosting capacity, policy and overall utility distribution
system control architecture integration are the areas of the biggest immediate need.
The continued installation of energy storage, either by Austin Energy or its customers, on a very limited
basis, is beneficial in order to continue to test the technical readiness of these systems and the
processes put into place to support them, even if the economics of energy storage do not provide the
impetus for deployment in the short term.
Value/Economic
The value/economic section speaks to results validated by field installations as well as estimated by
modeled results. Modeling examined technical as well as economic issues, specifically the system limits
for solar penetration before there are reliability issues. This speaks to the value of having a market as
well as an avoided cost function. For this project, DER dispatch decisions were made upon either a
distribution system threshold limit being violated, or a certain economic (market) target being reached.
The use cases being applied weren’t sophisticated enough to put quantifiable (dollar) values upon
reliability, so default limits had to be the trigger for reliability dispatch. For better modeling in the
future, values for reliability will need to be developed.
Beyond the lack of a specific monetary value to help trigger system dispatch signals, a critical lesson
learned is that for the feeders tested, a solar penetration around 40% was the threshold modeled at
which solar posed a reliability threat. This is a function of Austin Energy design criteria which calls for
large conductors and short feeder runs relative to many other utilities. While this was discussed in the
technology conclusions section as well, it bears repeating that until solar penetration reaches higher
levels, there are other areas that should be focused on other than solar reliability impacts to the bulk
48
grid. Neighboring utilities are likely to experience reliability issues at levels lower than Austin Energy.
To minimize financial risk and ultimately affordability goals, hosting capacity for individual resources and
their locational impact and defining the value of reliability are proper areas for immediate work, rather
than investment in assets to mitigate the impacts of high levels of solar. Investigation into the economic
value of DER will provide valuable data for planning nearer-term.
Evaluation of use cases and value stacking shows considerable promise. While only a handful of
applications provide meaningful value at this time, there is enough merit in the concept to continue
developing and refining use cases and modeling values under current and future market scenarios. The
value of reliability will need to be understood as well, although this is likely to be a longer-term priority.
Once there is a higher level of understanding in these areas, those findings should then be applied to
DER specific rates as adoption dictates.
Modeling has demonstrated that the differential value of DER integration is a method that is promising
and should be investigated further and refined. This methodology requires that there be inputs for cost
and value and should be valuable in projecting when DER integration is a viable alternative at scale.
Current modeling and field demonstrations indicate that costs for DER deployments and integration are
higher than the potential value they can generate at this time. Further research needs to go into when
the inflection point for market viability is likely to be reached, how to lower costs and develop the
architecture to support DER integration by the time it is a viable market alternative.
Tipping Points
Reaching a point in time when it makes sense to invest at scale in DER and DER integration is mentioned
throughout this report. Triggers for this can be referred to as tipping points. Put simply, a tipping point
for DER and/or integration is reached when the decision to deploy them is perceived to be a better
option than pursuing other alternatives. Categories of tipping points are varied but easily outlined.
• Economic imperative- the economics of widespread investment in DER are a primary
determinant, these can be any combination of costs for DER deployment going down and value
of their deployment increasing.
• Technical requirements- there may come a time when storage is the best technological solution
for meeting system requirements. Storage may perform in a manner superior to other options,
making it the logical solution
• Policy imperatives- regulatory changes may dictate that storage is the best solution, though
market changes or the only solution through mandates. Market changes may be a regulator like
ERCOT or the PUC changing rules to favor DER deployment, or the establishment or
continuation of subsidies supporting their deployment
Regardless of which tipping point(s) eventually sway the equation into the favor of DER deployment, it is
up to Austin Energy staff to continue to research and understand the developments impacting their
viability, and to position the utility for success in whatever scenario ultimately unfolds. DER integration
has been identified as a critical strategic initiative for Austin Energy, results from this study indicate that
it should remain one and be supported accordingly.
49
Next Steps The results from studies listed here are largely preliminary so the first order of business is to conclude
the SHINES work as expeditiously as possible. The SHINES report will provide more depth than this
preliminary. It is unlikely that final results will dramatically change any of the conclusions outlined here.
That said, what we learn moving forward could dramatically alter our perspective on specific actions the
utility should undertake and their timing.
Bulk power systems will also play a role in future DER decisions, coordination with the Energy Market
Operations group in that area is ongoing. Following is a bulleted list of next steps that will serve as a
foundation for development of a DER roadmap for Austin Energy.
Standards & Policy • Develop safety and siting guidelines for DER, particularly energy storage
• Develop design criteria/codes/ratings for energy storage for new construction
• Participate actively in storage standards efforts such as IEEE and MESA
• Participate actively in ERCOT energy storage market/rule development efforts
• Leverage membership in EPRI, other industry organizations to focus on DER integration
Utility Strategy
• Continue to classify DER integration as a strategic initiative for Austin Energy
• Develop a strategic roadmap for DER research, deployment and integration
• Limit locally distributed battery energy storage deployments to research projects for the next
two years unless a tipping point appears imminent
• Steer the bulk of near-term of DER investment into activities and equipment that aren’t as prone
to obsolescence due to evolving standards, rules, markets or technologies
• Rely on energy market operations’ RFPs to gauge market readiness of energy storage at scale
• Continue to partner with vendors to ensure knowledge of industry trends, areas to focus
research
• Focus short-term on economic/value potential of DERs, and transition work to focus more upon
the system reliability impacts of DER on the bulk power system as penetration is projected to
increases to levels impacting reliability in the longer term
• Continue focus on DER integration and how to best roll it into the overall utility distribution
system control architecture
• Continue to monitor the state of the industry for V2G
• Quantify the impacts of reliability as it relates to DER integration and decision prioritization
Project-Focused (SHINES and ongoing DER initiatives)
• Conclude all SHINES work and deliverables
• Develop or purchase a solar hosting capacity tool that can look at feeders in real time to
understand the potential locational impacts of DER
• Work to improve DERO optimization/interface to better realize potential value of integration
and management of DER

50
• Continue to develop cost/value modeling, assumptions
• Continue to develop use cases for DER integration initiated through SHINES
• Continue to develop and refine the differential value of DER methodology
• Develop a model that can perform sensitivity analysis on economic viability of DER and DER
integration to better understand the relationship of costs and value of DER
• Develop DER specific rates as adoption and technology dictate
All conclusions reached and recommendations about next steps in this report are based upon the best
information available at this time. SHINES work is ground breaking and industry leading. Through the
SHINES partnership and related DER work, it is likely that no other entity in the world knows more about
the current and potential “real-world” value of DER in Austin at this time than the grant partners,
including Austin Energy. Maintaining that industry lead is an imperative for Austin Energy. The next
steps outlined above are the best recommendation at this time, given what is known. They are subject
to change and certainly will need to change in the future as there is different and better information
available.
References • National Institute of Standards and Technology (NIST) Framework and Roadmap for Smart Grid
Interoperability Standards, Release 1.0 2010
• Ealey, B., Johnson, W., Thomas, C. State of Communication Standards for DER Characterization and Maturity. EPRI. June 2018
• Release of Results of Cause Investigation into ESS Accidents and Strengthened Safety Measures. Ministry of Trade, Industry and Energy. June 11, 2019
• ERCOT. 2017 State of the Grid Report. Available online: http://www.ercot.com/content/wcm/lists/144926/ERCOT 2017 State of the Grid Report.pdf (accessed October 12, 2018)
• U.S. Energy Information Administration. Electricity Reliability Council of Texas surpassed all-time peak hourly load in July. Available online: https://www.eia.gov/todayinenergy/detail.php?id=36775 (accessed October 20, 2018)
• City of Austin. Austin Energy System Peak Demand. Available online: https://data.austintexas.gov/Utilities-and-City-Services/Austin-Energy-System-Peak-Demand/a6pm-qynf (accessed October 20, 2018).
• Stenner, K., Frederiks, E.R., Hobman, E.V. and Cook, S. Willingness to participate in direct load control: the role of consumer distrust. Applied Energy 2017, 189, 76{88, 2017. DOI: https://doi.org/10.1016/j.apenergy.2016.10.099.
• Rhodes, J.D. Texas Electric Grid Sets New System-Wide All-Time Peak Demand Record, Twice. Forbes 2018 Available online: https://www.forbes.com/sites/joshuarhodes/2018/07/19/texas-electric-grid-sets-new-system-wide-all-time-peak-demand-record-twice/#5a8d3a215212 (accessed 20 October,2018).
• Austin Energy At-a-Glance. Available online: https://austinenergy.com/ae/about/company-profile/austin-energy-at-a-glance (accessed October 14, 2018)
• Dubey, A., Santoso, S., and Cloud, M.P. A Practical Approach to Evaluate Voltage Quality Effects of Electric
Vehicle Charging. 2013 International Conference on Connected Vehicles & Expo. (2013). DOI:
10.1109/ICCVE.2013.94