Embed Size (px)
Citation preview
1
Title 1
Correlation between spinal and pelvic movements during gait and aggravation of low 2
back pain by gait loading in lumbar spinal stenosis patients 3
4
Authors 5
Wataru Kuwaharaa, Hiroshi Kurumadanib, Nobuhiro Tanakac, Kazuyoshi Nakanishic, 6
Haruka Nakamurad, Yosuke Ishiia, Akio Uedaa, Masataka Deiee, Nobuo Adachic, Toru 7
Sunagawab 8
9
Affiliations 10
a Health Sciences Major, Graduate School of Biomedical and Health Sciences, 11
Hiroshima University, 1-2-3 Kasumi, Minami-ku, Hiroshima 734-8551, Japan 12
b Laboratory of Analysis and Control of Upper Extremity Function, Graduate School of 13
Biomedical and Health Sciences, Hiroshima University, 1-2-3 Kasumi, Minami-ku, 14
Hiroshima 734-8551, Japan 15
c Department of Orthopaedic Surgery, Graduate School of Biomedical and Health 16
Sciences, Hiroshima University, 1-2-3 Kasumi, Minami-ku, Hiroshima 734-8551, Japan 17
2
d Department of Rehabilitation, Kibinomori Rehabilitation Hospital, 1-30-1, 1
Kibinomori-Minami, Oamishirasato-shi, Chiba 299-3241, Japan 2
e Department of Orthopaedic Surgery, Aichi Medical University, 1-1 Yazakokarimata, 3
Nagakute-shi, Aichi 480-1195, Japan 4
5
Corresponding author 6
Wataru Kuwahara 7
Health Sciences Major, Graduate School of Biomedical and Health Sciences, Hiroshima 8
University, 1-2-3 Kasumi, Minami-ku, Hiroshima 734-8551, Japan 9
E-mail address: [email protected] 10
Tel.: +81-082-257-5457 11
Fax: +81-082-257-5457 12
13
Word counts 14
Abstract: 272ords 15
Main text: 3089 words 16
17
3
Abstract 1
Background 2
Lumbar alignment of posterior or anterior tilts affects the exacerbation and remission of 3
symptoms of lumbar spinal stenosis patients. This study aimed to clarify the correlation 4
between spinal and pelvic movements during gait and the aggravation of low back pain 5
after gait loading in lumbar spinal stenosis patients. 6
Methods 7
A total of 29 patients with lumbar spinal stenosis completed leg and low back pain 8
assessments and gait analysis before and after gait loading tests. Patients were divided 9
into leg and low back pain change (n = 8), leg pain only change (n = 12), and non-10
change (n = 9) groups based on the differences of leg and low back pain between before 11
and after the tests. Peak kinematic values of the anterior tilts of the trunk, thoracic spine, 12
lumbar spine and pelvis during the stance phase were obtained via three-dimensional 13
gait analysis. 14
Results 15
In the leg and low back pain change group, the anterior lumbar and pelvic tilts were 16
larger after than before the tests; however, in the leg pain only change and non-change 17
groups, only the anterior lumbar tilt was larger after than before the tests. Anterior 18

4
lumbar tilt before and after the tests negatively correlated with the aggravation of low 1
back pain, and increasing in the anterior pelvic tilt positively correlated with the 2
aggravation of low back pain. 3
Conclusions 4
In lumbar spinal stenosis patients, smaller anterior lumbar tilt and larger anterior pelvic 5
tilt during gait loading may affect the aggravation of low back pain by gait loading. 6
Increasing in lumbar lordosis during gait might be one of the factors leading to low back 7
pain in lumbar spinal stenosis patients. 8
9
5
1. Introduction 1
Lumbar spinal stenosis (LSS) patients frequently complain of numbness and pain 2
in the lower limbs, and neurogenic intermittent claudication [1, 2]. It is known that the 3
lumbar alignment of the posterior or anterior tilts affects exacerbation and remission of 4
symptoms of LSS patients. A previous study [3] showed that in the standing position, 5
the epidural pressure was increased by maximum lumbar extension, but decreased by a 6
30° forward flexion compared to the upright position in LSS patients. 7
There are a few studies on trunk tilt before and after a gait loading test for LSS 8
patients. While Suda et al. and Nagai et al. [4, 5] showed an increase in anterior trunk 9
tilt, another study [6] did not show any change after gait loading test. Thus, no 10
consensus has been reached as to spinal and pelvic movements before and after gait 11
loading in LSS patients. We postulated that the differences in results of each study were 12
due to investigating the movement of the whole spine being considered in the previous 13
studies. The thoracic and lumbar movements should be investigated separately to better 14
understand the spinal kinematics of LSS patients during gait before and after gait 15
loading. 16
Furthermore, 67.6% of LSS patients have low back pain (LBP) [7], and a 17
previous study [8] showed that LBP for LSS patients was improved after decompression 18
6
surgery without fusion. In this literature, authors discussed that the factors leading to 1
LBP in LSS were the facet joints, ischemia of the nerve roots, and postures of increased 2
lumbar anterior tilt. Considering these facts, there is a possibility that spinal and pelvic 3
movements affect LBP, that are exacerbated by walking. 4
The purposes of this study were: (1) To investigate both thoracic and lumbar 5
movements during gait in LSS patients before and after gait loading, and (2) To clarify 6
that the aggravation of LBP after gait loading is affected by spinal and pelvic 7
movements during gait in LSS patients. We hypothesized that the anterior lumbar tilt 8
during gait would be increased after gait loading to avoid the appearance of neurogenic 9
intermittent claudication and that the larger anterior lumbar tilt after gait loading would 10
induce LBP in LSS patients. 11
12
2. Materials and methods 13
2.1 Participants 14
This study included the LSS patients who underwent decompression surgery 15
without fusion at our institute between January 2015 and August 2017. LSS patients 16
were diagnosed based on a review of the patient history, physical examination, and 17
confirmation of LSS by magnetic resonance imaging. All patients had experienced 18
7
lower-extremity pain and/or numbness and neurogenic intermittent claudication. 1
Patients were excluded if they had significant instability or scoliosis of the lumbar 2
spine, previous spinal surgery, bone tumour, apparent vertebral fracture on plane X-ray, 3
severe hip and/or knee osteoarthritis, inability to walk independently, no increase in leg 4
pain by gait loading. A total of 29 patients with LSS (17 male and 12 female adults) 5
were recruited in the study. In 10 patients who were evaluated by standing lateral 6
radiographs of the whole spine and pelvis [9], the average sagittal vertical axis, thoracic 7
kyphosis, lumbar lordosis, pelvic tilt, sacral slope, and pelvic incidence were 55.4 ± 8
27.0 mm, 33.4 ± 13.9°, 30.4 ± 17.6°, 33.4 ± 13.9°, 30.2 ± 11.0°, 29.2 ± 14.2°, and 59.4 9
± 20.2°, respectively. 10
This study was approved by the Epidemiology Research Ethical Review Board of 11
our institution (approval number: E Epd-1050-2). All patients received information 12
about the purpose and design of the study, and each of them was provided a written 13
informed consent. 14
15
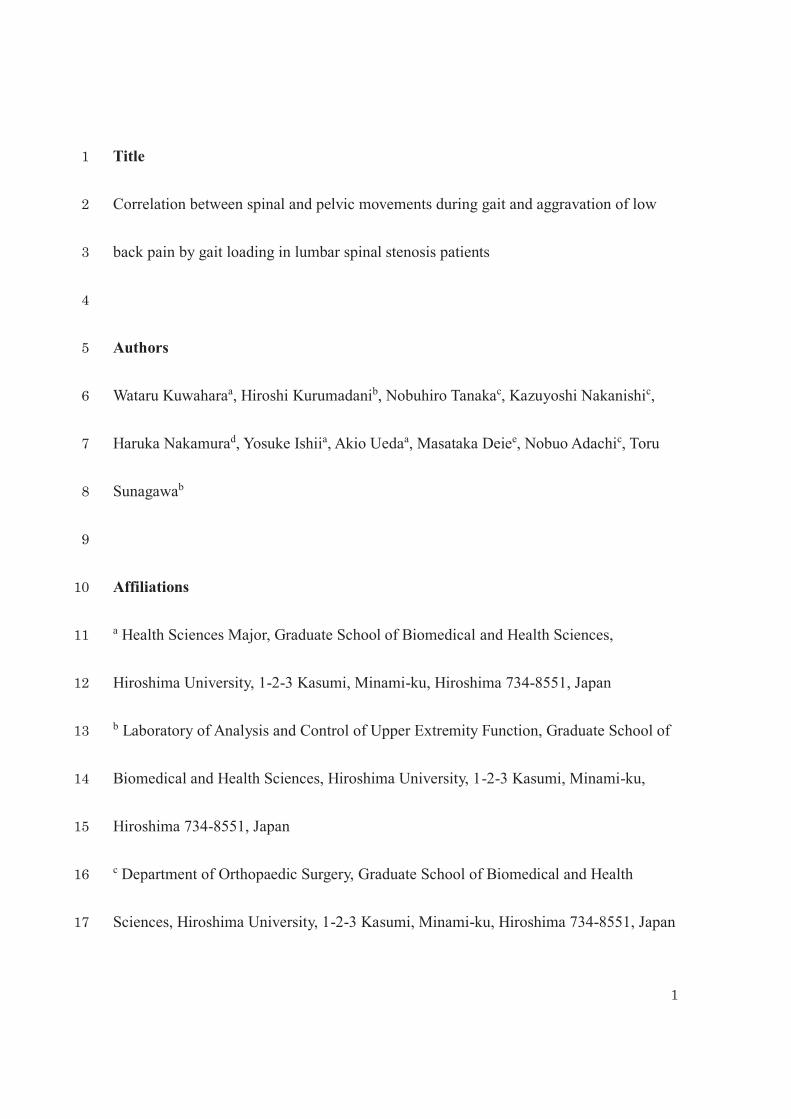
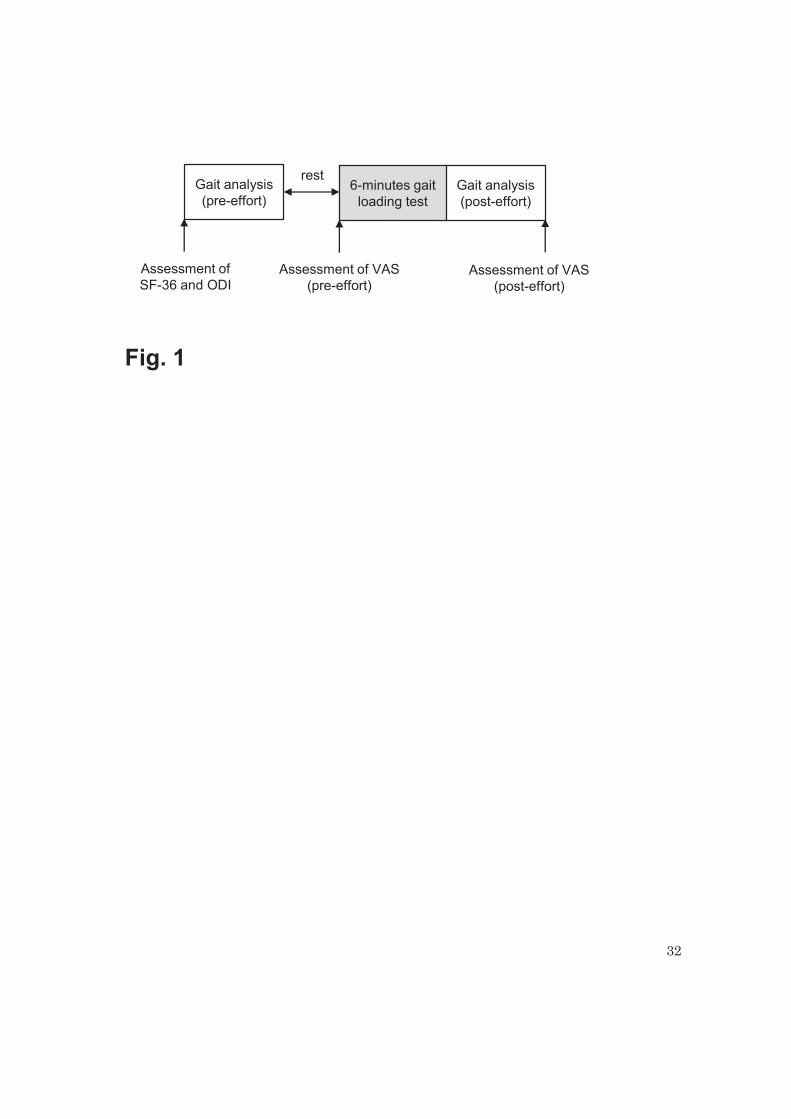
2.2. Protocol (Fig. 1) 16
All patients performed the following measurements in the week prior to 17
decompression surgery. Initially, they were screened for health status related to LSS by 18
8
using the MOS 36-item Short-Form Health Survey (SF-36). The SF-36, which consisted 1
of eight subcategories, was used to evaluate health-related quality of life, and a higher 2
score indicated a better health status [10, 11]. The Oswestry Disability Index (ODI) was 3
used to evaluate activities of daily living related to LBP, and a lower score indicated a 4
better health status [12, 13]. 5
Next, patients performed a modified 6-minutes gait loading test with the aim to 6
induce symptoms [14, 15]. They were instructed to walk back and forth along a 10-m 7
walkway as fast as possible for 6-minutes following the instructions ‘‘walk as fast as 8
you comfortably can, bearing in mind that you will be walking for six minutes.’’ 9
Patients were allowed to stop and rest during the test as long as they stood. Then, we 10
measured leg pain (LP), LBP, and gait kinematics immediately before (pre-effort) and 11
after (post-effort) the gait loading test. We measured LP and LBP pre-effort after 12
sufficient rest. A walking distance was recorded after the test. 13
14
2.3. Assessment of pain intensity before and after gait loading test and classification 15
into groups 16
We measured patients’ LP and LBP intensity using a 100 mm-Visual Analogue 17
Scale (VAS) pre- and post-effort. Patients marked their pain intensity on the 100 mm-18
9
VAS, where 0 mm signified “no pain” and 100 mm signified “the worst pain 1
imaginable.” 2
ΔLP and ΔLBP were calculated by subtracting the pre-effort VAS scores from 3
post-effort. Patients with ΔLP of ≤0 mm were defined as the non-change group. 4
Furthermore, in patients with ΔLP of >0 mm, because a minimum clinically important 5
change is defined as a change in pain of ≥18 mm on VAS [16], we set the threshold as 6
18 mm to classify the following groups: LP and LBP change (ΔLBP of ≥18 mm) and LP 7
only change (ΔLBP of <18 mm). 8
9
2.4. Gait analysis 10
A three-dimensional motion analysis system (VICON MX: Vicon Motion 11
Systems, Oxford, UK) with 16 infrared cameras (sampling at 100 Hz) and eight force 12
plates (sampling at 1000 Hz; AMTI, Watertown, USA) recorded LSS patients’ gait. 13
Thirty-five passive reflective markers (14 mm diameter) were attached according to a 14
commercially available kinematic model (Plug-in-gait, Vicon® Peak, Oxford, UK). To 15
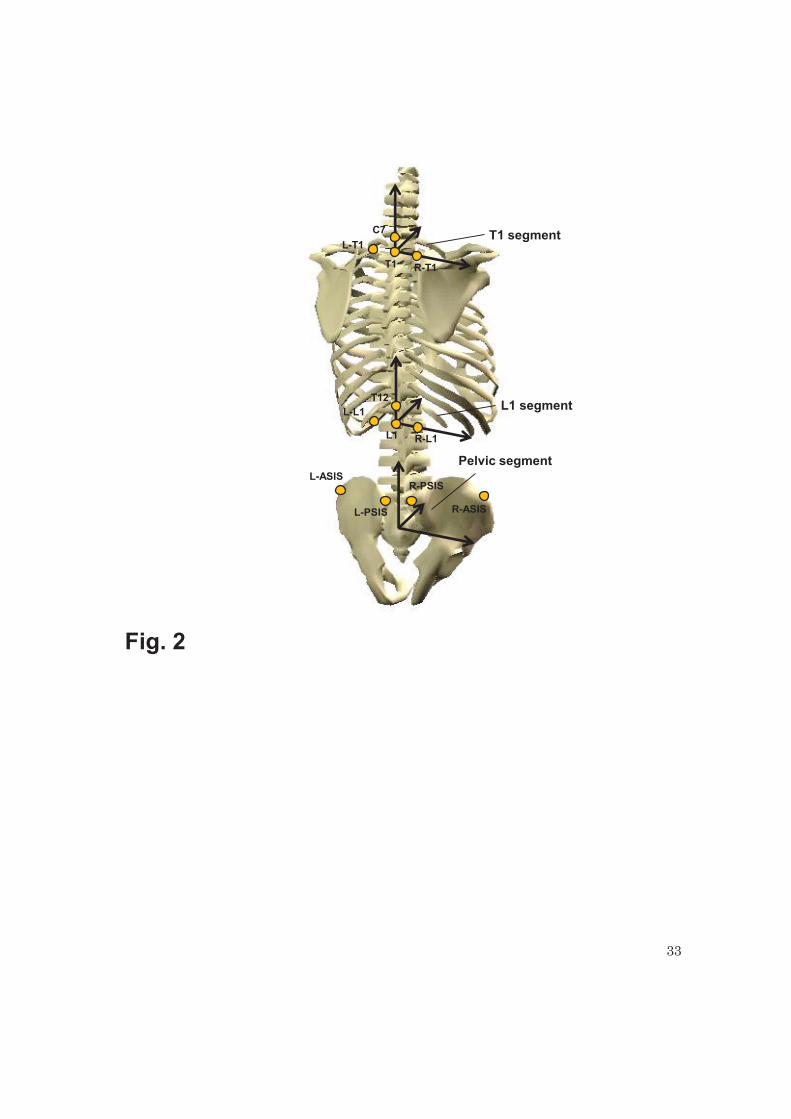
examine both thoracic and lumbar motion during gait, eight markers were attached to 16
the spinous processes of C7, T1, T12, and L1 and on both sides of the spinous processes 17
of T1 and L1 [17, 18]. Before gait protocols were started, the static standing reference 18
10
position of the patients was measured twice. The patients were directed to look straight 1
ahead and keep standing for 5 s. Patients then walked barefoot at a self-selected speed 2
along a 10-m walkway, three times at each pre- and post-effort. 3
Acquired data was filtered by a 4th-order Butterworth low-pass filter with cut-off 4
frequency of 6 Hz (ButterPlug; Vaquita Software, Zaragoza, Spain). Spatiotemporal 5
parameters: gait velocity, cadence, and stride length, were extracted from the 6
biomechanical model output, and the stride length was normalized to the body height. 7
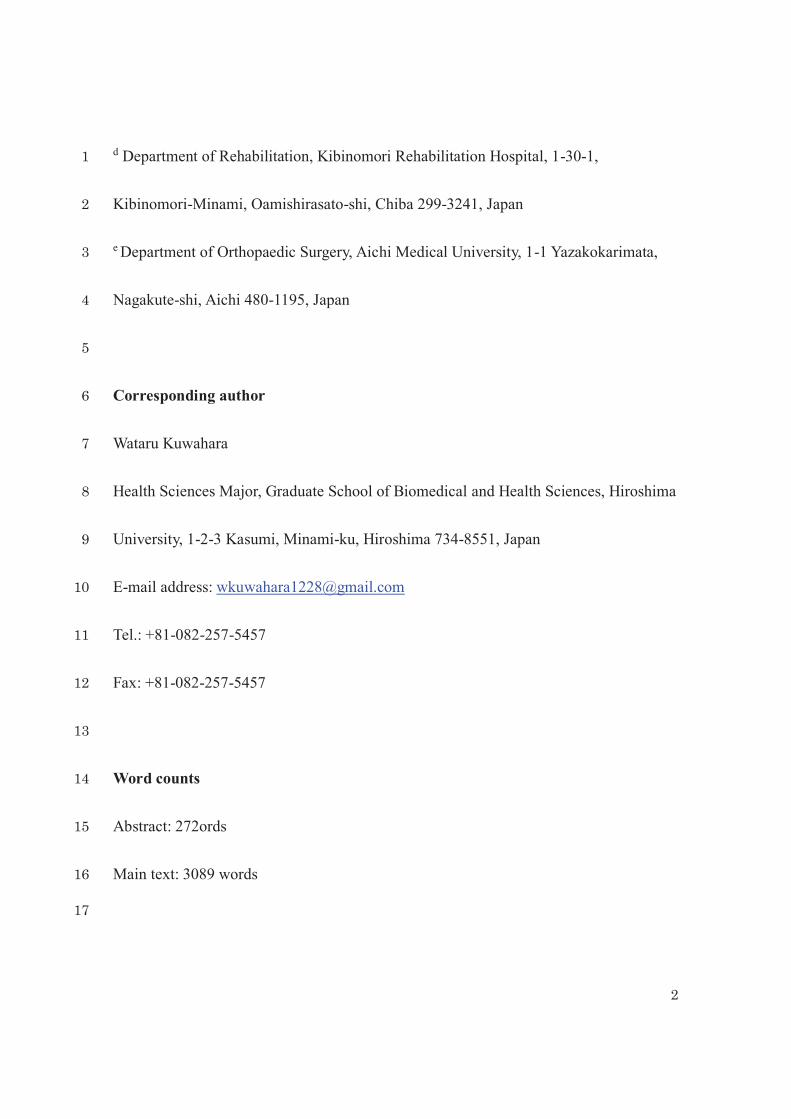
Using the Vicon Bodybuilder processing software (Vicon Motion Systems), anatomical 8
reference segments: the T1, L1, and pelvic segments, were defined according to a 9
previous study (Fig. 2) [18]. The trunk, thoracic, and lumbar tilts were defined as 10
movements of the T1 segment to the pelvic segment, the T1 segment to the L1 segment, 11
and the L1 segment to the pelvic segment, respectively. Pelvic tilt was defined as the 12
movement of the pelvic segment to the global segment. The positive and negative 13
kinematic data were represented as the anterior and posterior tilt, respectively. 14
The gait kinematics of the spine and pelvis were expressed relative to the 15
patient’s standing reference position by subtracting the standing reference values from 16
those measured during the gait tasks [19]. Initial contact was identified by the force 17
plates detecting >10 N, while toe-off was defined as the detection of <10 N. Kinematic 18
11
data included the peak values of each data point during the stance phase both pre- and 1
post-effort. Further, Δ values of all spatiotemporal and kinematic parameters were 2
calculated by subtracting the values at pre-effort from post-effort. The mean values of 3
three trials were used in the statistical analysis. Gait analysis was conducted by one 4
examiner (W.K). To evaluate the intra-rater reliability of kinematic data, 10 healthy 5
male volunteers (mean age: 25 ± 3 years, body height: 1.72 ± 0.05 m, body weight: 63.5 6
± 5.1 kg, body mass index (BMI): 21.4 ± 1.0 kg/m2) underwent gait analysis in two 7
sessions. 8
9
2.5. Statistical analysis 10
Statistical analysis was performed using SPSS for Windows (version 23.0; IBM 11
Japan, Tokyo, Japan). Agreement between measurements was analysed using the 12
intraclass correlation coefficients (ICCs). For this calculation, the one-way random 13
effects model was selected. Furthermore, the standard error of measurement (SEM) was 14
used to estimate absolute repeatability and provide information to delineate intra-15
individual variability over repeated measurements [20]. 16
A Shapiro-Wilk test was used to analyse normality of data distribution. Next, one-17
way analysis of variance, Kruskal-Wallis test, and chi-square test were used to assess 18
12
differences among the three groups (LP and LBP change, LP only change, and non-1
change). A post hoc analysis was performed using the Tukey-Kramer test or Steel-2
Dwass test to determine differences among the groups. Differences in spatiotemporal 3
and kinematic data among the groups before and after the gait loading test were 4
examined using a two-way mixed repeated-measure analysis with factors of the groups 5
(LP and LBP change, LP only change, and non-change) and the time effect (pre- and 6
post-effort). If there were significant interactions, simple main effects were evaluated 7
using a Bonferroni test. Correlations between gait velocity and kinematics of the spine 8
or pelvis during gait and ΔLP or ΔLBP were analysed using the Spearman rank 9
correlation coefficient for patients with LSS except for the non-change group. The level 10
of statistical significance was <5%. 11
12
3. Results 13
ICC values for the peak tilts during the stance phase in the trunk, thoracic spine, 14
lumbar spine, and pelvis were 0.635, 0.742, 0.838, and 0.944, respectively. SEM values 15
for the peak tilts during the stance phase in the trunk, thoracic spine, lumbar spine, and 16
pelvis were 3.0°, 2.9°, 1.8°, and 1.4°, respectively. 17
13
Based on VAS scores of LP and LBP, 8 patients were included in the LP and LBP 1
change group, 12 in the LP only change group, and 9 in the non-change group. No 2
significant differences were observed in age, height, weight, BMI, sex, walking distance 3
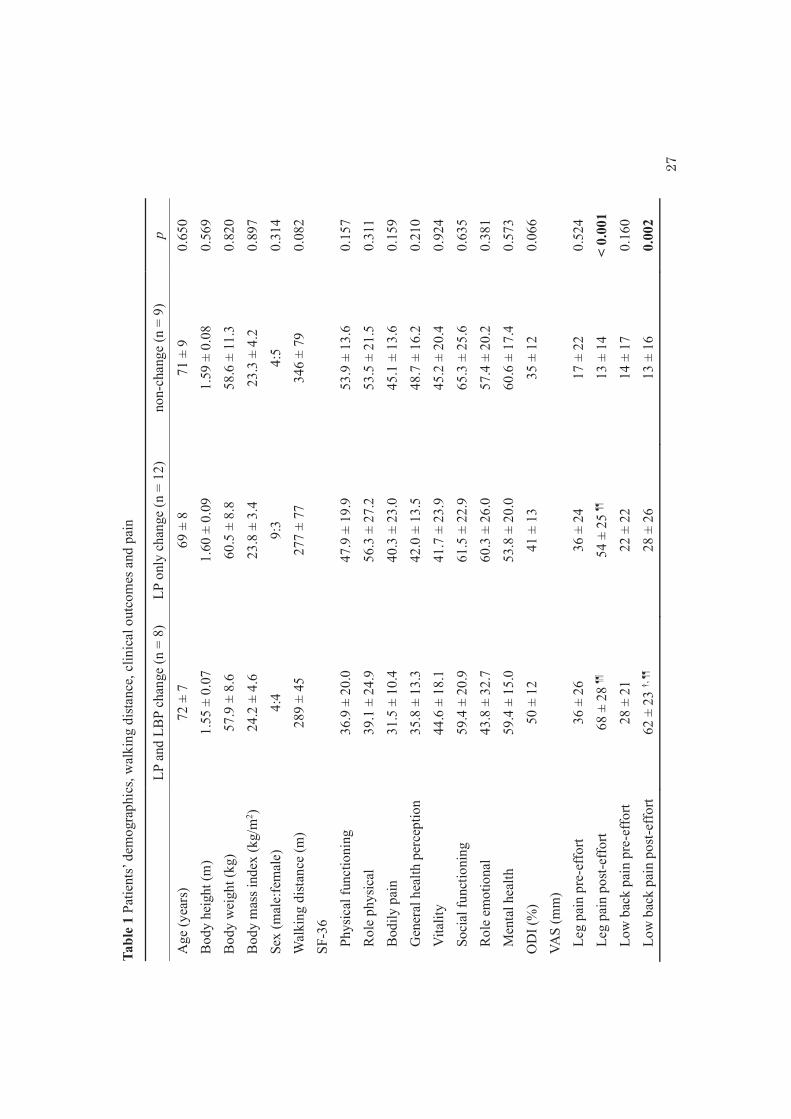
of gait loading test, SF-36 scores, and ODI scores between the groups (Table 1). 4
No significant differences in VAS scores of LP and LBP pre-effort were observed 5
among the groups (Table 1). The VAS score of LP was significantly higher in the LP and 6
LBP change and LP only change groups than in the non-change group post-effort. The 7
VAS score of LBP was significantly higher in the LP and LBP change group than in the 8
LP only change and non-change groups post-effort. 9
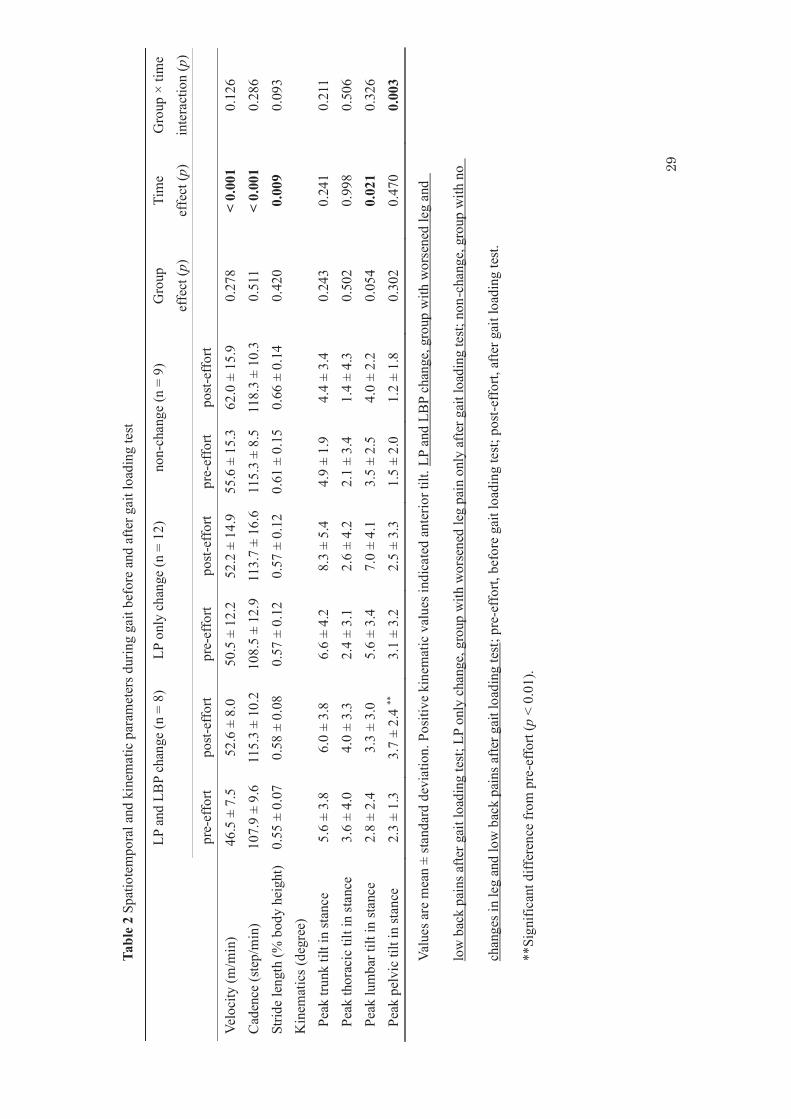
Gait velocity, cadence, and stride length were significantly higher post-effort than 10
pre-effort in the three groups (Table 2). There were no significant differences in gait 11
velocity, cadence, and stride length between the groups. 12
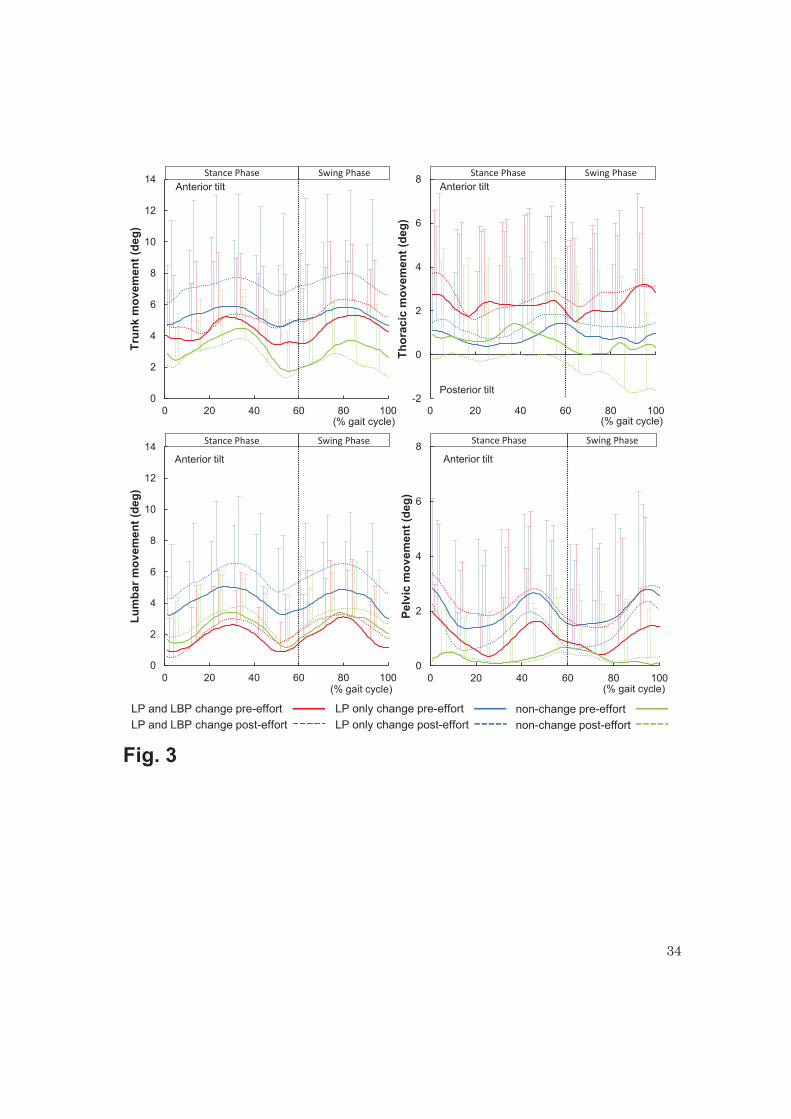
There was no significant effect of group, time and interactions on peak anterior 13
trunk and thoracic tilts during the stance phase (Table 2, Fig. 3). Peak anterior lumbar 14
tilt was significantly larger in post-effort than in pre-effort in the three groups, but no 15
significant effect was observed on the anterior lumbar tilt in all groups. Peak anterior 16
pelvic tilt was significantly larger in post-effort than in pre-effort in the LP and LBP 17
change group only. 18
14
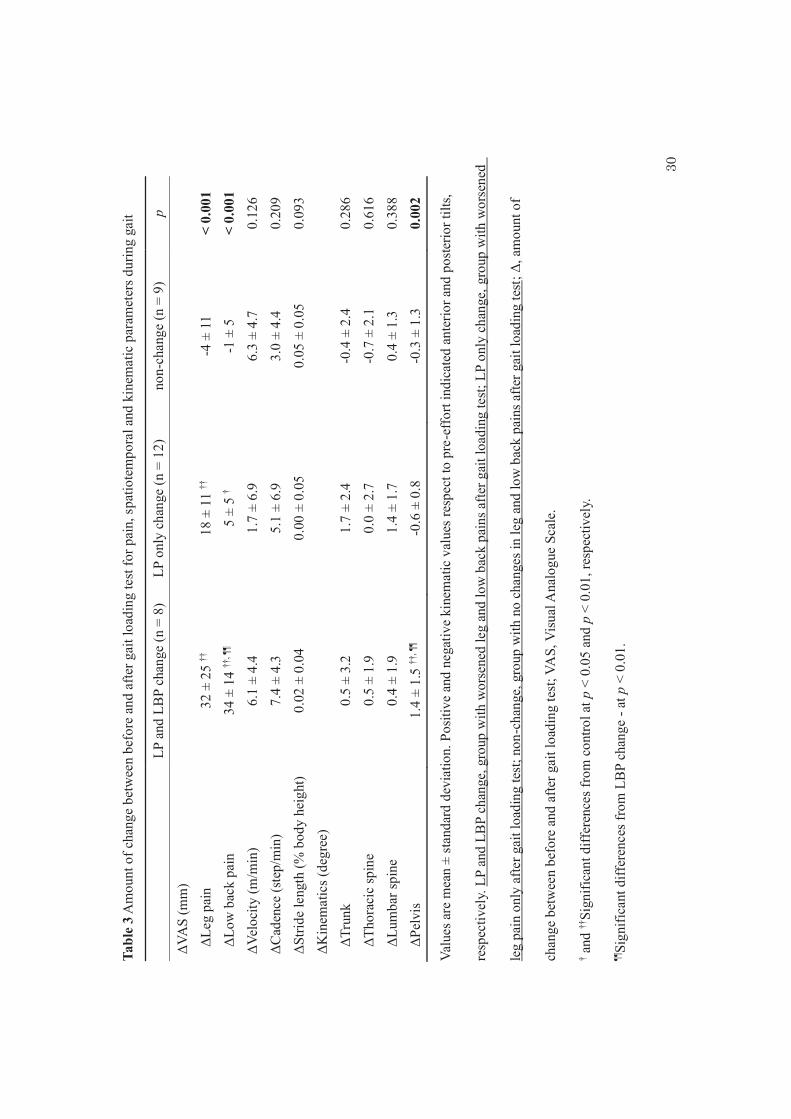
ΔLP and ΔLBP were significantly higher in the LP and LBP change and LP only 1
change groups than in the non-change group (Table 3). Moreover, ΔLBP was 2
significantly higher in the LP and LBP change group than in the LP only change group. 3
ΔPelvis was significantly higher in the LP and LBP change group than in the LP only 4
change and non-change groups. No significant differences in the other Δ values were 5
observed between the groups. 6
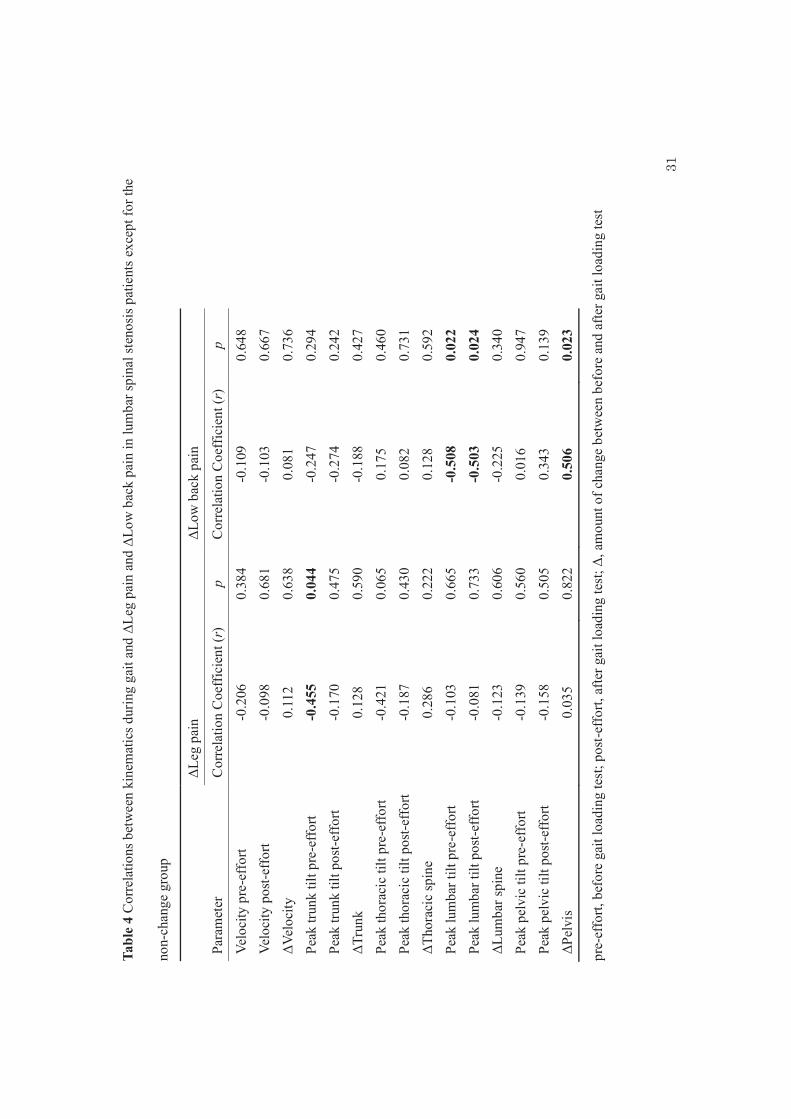
In patients with LSS except for the non-change group, the peak anterior trunk tilt 7
during the stance phase pre-effort was negatively correlated with ΔLP (Table 4). On the 8
contrary, no significant correlations were observed between gait velocity or other 9
kinematic values and ΔLP. Peak anterior lumbar tilt during the stance phase both pre- 10
and post-effort negatively correlated with ΔLBP, while ΔPelvis positively correlated 11
with ΔLBP (Table 4). In contrast, no significant correlations were observed between gait 12
velocity or other kinematic values and ΔLBP. 13
14
4. Discussion 15
To the best of our knowledge, this is the first study to investigate the thoracic, 16
lumbar, and pelvic movements during gait before and after gait loading in LSS patients, 17
particularly focusing on LBP. Our study provides two important findings. Firstly, 18
15
anterior tilts of the trunk and thoracic spine showed no change between before and after 1
gait loading; however, lumbar anterior tilt increased after gait loading even in patients 2
with LSS who had no aggravation of LP by gait loading. Secondly, in LSS patients, a 3
smaller anterior lumbar tilt both before and after gait loading and a larger anterior pelvic 4
tilt post-effort compared to pre-effort affected aggravation of LBP by gait loading. 5
There was no consensus about trunk tilt before and after gait loading because the 6
spinal movements analysed in each study were different [4-6]. As hypothesised, our 7
results showed an increase in the anterior lumbar tilt even in patients with LSS who had 8
no worsened LP after gait loading. In addition, no significant differences were observed 9
between pre- and post-effort in terms of the trunk or thoracic tilts during gait. These 10
findings suggest that LSS might induce the abnormal lumbar movement during gait. In 11
the larger anterior lumbar tilt, the spinal canal becomes larger; thus, the compression of 12
the nerve roots is reduced [3, 21]. Therefore, when performing gait loading test for LSS 13
patients, focusing on the lumbar movement would be important to evaluate the spinal 14
kinematics during gait. 15
Based on the amount of change in the VAS score of LBP, we classified patients 16
into two groups: the LP and LBP change and LP only change. Interestingly, LBP post-17
effort and ΔLBP were higher in the LP and LBP change group; however, there was no 18
16
significant difference between the two groups in LBP pre-effort and other clinical 1
outcomes such as LP, walking distance of gait loading test, SF-36, and ODI. In other 2
words, no difference in intermittent claudication was observed between the LP and LBP 3
change and LP only change groups. Therefore, for patients in the LP and LBP change 4
group, gait loading specifically induced LBP. 5
The most important result in the present study was that the anterior pelvic tilt in 6
the LP and LBP change group increased post-effort compared to pre-effort. 7
Furthermore, a smaller anterior lumbar tilt during gait, both in the pre- and post-efforts, 8
and a larger increase of the anterior pelvic tilt post-effort compared to pre-effort 9
significantly correlated with higher ΔLBP in patients with LSS except for the non-10
change group. Kang et al. [22] reported that anterior pelvic tilt in LSS patients was 11
decreased after gait loading. Similar to this, although no significant difference was 12
observed, patients in the LP only change and non-change groups had slightly decreased 13
in the anterior pelvic tilt (mean ΔPelvis was -0.6° and -0.3°, respectively). Thus, an 14
increase in the anterior pelvic tilt in the LP and LBP change group (mean ΔPelvis was 15
1.4°) was very characteristic. Increasing the anterior pelvic tilt in the standing position 16
increases lumbar lordosis [23]. The smaller anterior lumbar tilt and the increase in the 17
anterior pelvic tilt might cause an increase in lumbar lordosis. Jones et al. [8] reported 18
17
that the factors leading to LBP in LSS were the facet joints, ischemia of the nerve roots, 1
and postures of increased lumbar anterior tilt. Because excessive lumbar lordosis causes 2
an increase in compressive force within the facet joints [24], the aggravation of LBP by 3
gait loading in patients with LSS might be derived from the facet joints. 4
In the present study, pelvic range of motion during gait pre-effort was 2.6 ± 0.7° 5
in the LP and LBP change group, 2.7 ± 1.4° in the LP only change group, and 2.6 ± 0.9° 6
in the non-change group. A previous study [25] reported that pelvic range of motion 7
during gait in the healthy adults was 2.4 ± 1.0° as in this study. Since pelvic range of 8
motion during gait is small, the difference of 2.0° of ΔPelvis between the LP and LBP 9
change group and LP only change group is considered to be very large. 10
During gait, the pelvis plays two roles: locomotor and passenger system [26]. 11
While the pelvis is a mobile link between two lower limbs as part of the locomotor 12
system, it also serves as the bottom segment of the passenger unit that rides on the hip 13
joints. As it plays an important role during gait, it might be necessary to prevent the 14
increase of anterior pelvic tilt to reduce LBP during gait. In the future, studies involving 15
some intervention at the pelvis are needed to decrease LBP during gait in LSS patients. 16
Furthermore, the ODI scores of the LP and LBP change and LP only change groups 17
were 50% and 41%, respectively. The ODI score of level of function corresponds to a 18
18
percentage of disability whereby a score of 41–60% = severe disability [12, 13]; thus, 1
our subjects had severe disability. It is also necessary to compare the data according to 2
the severity of disability in order to confirm whether our results are applicable to only 3
LSS patients with severe disability or to all LSS patients. 4
In this study, the peak anterior trunk tilt during the stance phase pre-effort was 5
negatively correlated with ΔLP. A previous study also showed that the association of a 6
smaller anterior trunk tilt (the sum of the thoracic and lumbar tilts) with higher VAS 7
scores for LP were observed in patients with LSS preoperatively [18]. That is, the 8
aggravation of LP after gait loading might be induced by less anterior tilts both in the 9
pre-effort thoracic and lumbar spines. 10
Before gait loading, the association between a smaller anterior trunk tilt and ΔLP 11
and between a smaller lumbar anterior tilt and ΔLBP were observed in the present study. 12
That is, by analysing the trunk or lumbar spine movement at the start of walking, it is 13
possible to determine whether leg or low back pain worsens. In the future study, these 14
cut-off values should also be calculated. 15
Several limitations of this study should be noted. As this study was a cross-16
sectional study, cause-and-effect relationships between LBP and kinematics of the spine 17
and pelvis can only be inferred. To clarify causal relationships, a longitudinal study 18
19
should be conducted. Another limitation was that difficulty in selecting patients who 1
were capable of performing the selected tasks and obtaining three-dimensional gait 2
analysis led to a small sample size. 3
In conclusion, even in patients with LSS who had no worsened LP after gait 4
loading, the anterior tilt of the lumbar region still increased, but not that of the whole 5
spine or thoracic region. Our findings suggest that gait analysis for LSS patients using 6
gait loading test should be conducted to focus on the lumbar movement. Furthermore, 7
the smaller lumbar anterior tilt of LSS patients regardless of gait loading and the larger 8
anterior pelvic tilt after gait loading may affect the aggravation of LBP by gait loading. 9
Therefore, increase in the lumbar lordosis might be one of the factors leading to LBP 10
during gait in LSS patients. 11
12
Conflict of interest 13
The authors declare that they have no conflict of interest. 14
15
Acknowledgements 16
The authors thank Professor Hiroaki Kimura, Department of Rehabilitation, 17
Hiroshima University Hospital for his assistance in the preparation of this manuscript. 18
19
20
References 1
[1] Katz JN, Harris MB. Clinical practice. Lumbar spinal stenosis. N Engl J Med 2008 2
Feb;358(8):818-25. 3
[2] Suri P, Rainville J, Kalichman L, Katz JN. Does this older adult with lower 4
extremity pain have the clinical syndrome of lumbar spinal stenosis? JAMA 2010 5
Dec;304(23):2628-36. 6
[3] Takahashi K, Miyazaki T, Takino T, Matsui T, Tomita K. Epidural pressure 7
measurements. Relationship between epidural pressure and posture in patients with 8
lumbar spinal stenosis. Spine 1995 Mar;20(6):650-3. 9
[4] Suda Y, Saitou M, Shibasaki K, Yamazaki N, Chiba K, Toyama Y. Gait analysis of 10
patients with neurogenic intermittent claudication. Spine 2002 Nov;27(22):2509-13. 11
[5] Nagai K, Aoyama T, Yamada M, Izeki M, Fujibayashi S, Takemoto M, Nishiguchi S, 12
Tsuboyama T, Neo M. Quantification of changes in gait characteristics associated with 13
intermittent claudication in patients with lumbar spinal stenosis. J Spinal Disord Tech 14
2014 Jun;27(4):E136-42. 15
[6] Garbelotti SA Jr, Lucareli PR, Ramalho A Jr, de Godoy W, Bernal M, D'Andréa 16
Greve JM. An investigation of the value of tridimensional kinematic analysis in 17
functional diagnosis of lumbar spinal stenosis. Gait Posture 2014;40(1):150-3. 18
21
[7] Miyakoshi N, Hongo M, Kasukawa Y, Ishikawa Y, Shimada Y. Prevalence, Spinal 1
Alignment, and Mobility of Lumbar Spinal Stenosis with or without Chronic Low Back 2
Pain: A Community-Dwelling Study. Pain Res Treat 2011;2011:340629. 3
[8] Jones AD, Wafai AM, Easterbrook AL. Improvement in low back pain following 4
spinal decompression: observational study of 119 patients. Eur Spine J 2014 5
Jan;23(1):135-41. 6
[9] Lee CS, Chung SS, Kang KC, Park SJ, Shin SK. Normal patterns of sagittal 7
alignment of the spine in young adults radiological analysis in a Korean population. 8
Spine 2011 Dec;36(25):E1648-54. 9
[10] Fukuhara S, Bito S, Green J, Hsiao A, Kurokawa K. Translation, adaptation, and 10
validation of the SF-36 for use in Japan. J Clin Epidemiol 1998 Nov;51(11):1037-44. 11
[11] Laucis NC, Hays RD, Bhattacharyya T. Scoring the SF-36 in Orthopaedics: A Brief 12
Guide. J Bone Joint Surg Am 2015 Oct;97(19):1628-34. 13
[12] Fairbank JC, Couper J, Davies JB, O'Brien JP. The Oswestry low back pain 14
disability questionnaire. Physiotherapy 1980 Aug;66(8):271-3. 15
[13] Fairbank JC, Pynsent PB. The Oswestry Disability Index. Spine 2000 16
Nov;25(22):2940-52. 17
22
[14] McLoughlin JV, Barr CJ, Crotty M, Sturnieks DL, Lord SR. Six minutes of 1
walking leads to reduced lower limb strength and increased postural sway in people 2
with Multiple Sclerosis. NeuroRehabilitation 2014;35(3):503-8. 3
[15] McLoughlin JV, Barr CJ, Patritti B, Crotty M, Lord SR, Sturnieks DL. Fatigue 4
induced changes to kinematic and kinetic gait parameters following six minutes of 5
walking in people with multiple sclerosis. Disabil Rehabil 2016;38(6):535-43. 6
[16] Bellamy N, Carette S, Ford PM, Kean WF, le Riche NG, Lussier A, Wells GA, 7
Campbell J. Osteoarthritis antirheumatic drug trials. III. Setting the delta for clinical 8
trials--results of a consensus development (Delphi) exercise. J Rheumatol 1992 9
Mar;19(3):451-7. 10
[17] Kim SH, Kwon OY, Yi CH, Cynn HS, Ha SM, Park KN. Lumbopelvic motion 11
during seated hip flexion in subjects with low-back pain accompanying limited hip 12
flexion. Eur Spine J 2014 Jan;23(1):142-8. 13
[18] Kuwahara W, Deie M, Fujita N, Tanaka N, Nakanishi K, Sunagawa T, Asaeda M, 14
Nakamura H, Kono Y, Ochi M. Characteristics of thoracic and lumbar movements 15
during gait in lumbar spinal stenosis patients before and after decompression surgery. 16
Clin Biomech 2016 Dec;40:45-51. 17
23
[19] Gombatto SP, Brock T, DeLork A, Jones G, Madden E, Rinere C. Lumbar spine 1
kinematics during walking in people with and people without low back pain. Gait 2
Posture 2015 Oct;42(4):539-44. 3
[20] Atkinson G, Nevill AM. Statistical methods for assessing measurement error 4
(reliability) in variables relevant to sports medicine. Sports Med 1998 Oct;26(4):217-38. 5
[21] Inufusa A, An HS, Lim TH, Hasegawa T, Haughton VM, Nowicki BH. Anatomic 6
changes of the spinal canal and intervertebral foramen associated with flexion-extension 7
movement. Spine 1996 Nov;21(21):2412-20. 8
[22] Kang MH, Kim ER, Kim YG, Kim TH, Oh JS. The effects of lumbo-pelvic 9
postural taping on gait parameters in patients with lumbar spinal stenosis. Clin Biomech 10
2013 Nov-Dec;28(9-10):956-60. 11
[23] Levine D, Whittle MW. The effects of pelvic movement on lumbar lordosis in the 12
standing position. J Orthop Sports Phys Ther 1996 Sep;24(3):130-5. 13
[24] Shirazi-Adl A, Drouin G. Load-bearing role of facets in a lumbar segment under 14
sagittal plane loadings. J Biomech 1987;20(6):601-13. 15
[25] MacWilliams BA, Rozumalski A, Swanson AN, Wervey R, Dykes DC, Novacheck 16
TF, Schwartz MH. Three-dimensional lumbar spine vertebral motion during running 17
using indwelling bone pins. Spine 2014;39(26):E1560-5. 18
24
[26] Perry J, Burnfield JM. Gait analysis: Normal and Pathological Function, 2nd edn. 1
New Jersey: Slack Incorporated; 2010, p. 19-22. 2
3
25
Figure captions 1
2
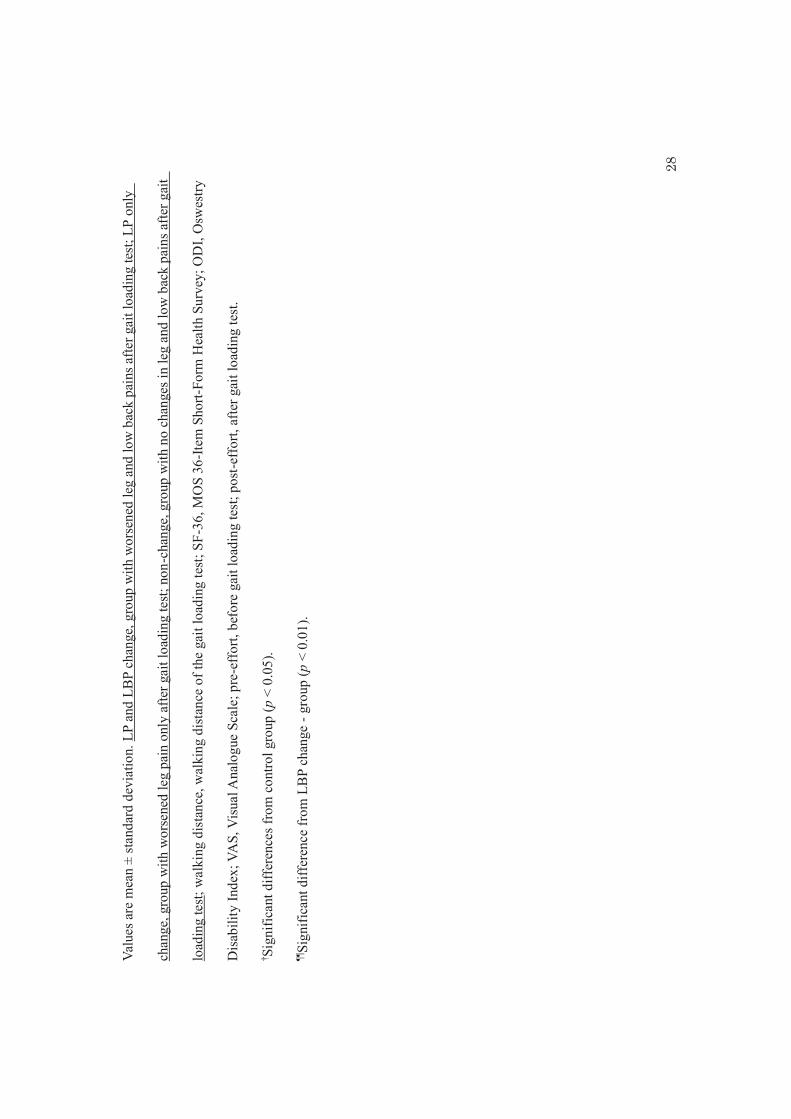
Fig. 1 A flow diagram describing the protocol used. SF-36, MOS 36-Item Short-Form 3
Health Survey; ODI, Oswestry Disability Index; VAS, Visual Analogue Scale, pre-4
effort, before gait loading test; post-effort, after gait loading test. 5
6
Fig. 2 Definition of the T1, L1, and Pelvic segments. C7, T1, T12, and L1 show each 7
spinous process. R- and L- T1, L1, ASIS, and PSIS show the right and left sides of the 8
spinous process of T1, L1, and the anterior and posterior superior iliac spines, 9
respectively. 10
11
Fig. 3 Temporal changes in trunk, thoracic, lumbar and pelvic tilting movements during 12
one gait cycle, before and after the gait loading test. Error bars showed standard 13
deviation. One gait cycle was defined as the period from the initial contact of the right 14
leg to the next initial contact of the same leg. LP and LBP change, LP only change, and 15
non-change groups were divided based on leg and low back pains according to the 16
visual analogue scale after gait loading compared to before test. Pre-effort and post-17
effort show before and after gait loading test, respectively. The red, blue, green, smooth, 18
26
and dashed lines show the mean trace of the LP and LBP change, LP only change, and 1
non-change groups, pre-effort and post-effort, respectively. 2
3
27
Tabl
e 1
Patie
nts’
dem
ogra
phic
s, w
alki
ng d
istan
ce, c
linic
al o
utco
mes
and
pai
n
LP
and
LB
P ch
ange
(n =
8)
LP o
nly
chan
ge (n
= 1
2)
non-
chan
ge (n
= 9
) p
Age
(yea
rs)
72 ±
7
69 ±
8
71 ±
9
0.65
0 B
ody
heig
ht (m
) 1.
55 ±
0.0
7 1.
60 ±
0.0
9 1.
59 ±
0.0
8 0.
569
Bod
y w
eigh
t (kg
) 57
.9 ±
8.6
60
.5 ±
8.8
58
.6 ±
11.
3 0.
820
Bod
y m
ass i
ndex
(kg/
m2 )
24
.2 ±
4.6
23
.8 ±
3.4
23
.3 ±
4.2
0.
897
Sex
(mal
e:fe
mal
e)
4:4
9:3
4:5
0.31
4 W
alki
ng d
istan
ce (m
) 28
9 ±
45
277
± 77
34
6 ±
79
0.08
2 SF
-36
Phy
sical
func
tioni
ng
36.9
± 2
0.0
47.9
± 1
9.9
53.9
± 1
3.6
0.15
7 R
ole
phys
ical
39
.1 ±
24.
9 56
.3 ±
27.
2 53
.5 ±
21.
5 0.
311
Bod
ily p
ain
31.5
± 1
0.4
40.3
± 2
3.0
45.1
± 1
3.6
0.15
9 G
ener
al h
ealth
per
cept
ion
35.8
± 1
3.3
42.0
± 1
3.5
48.7
± 1
6.2
0.21
0 V
italit
y 44
.6 ±
18.
1 41
.7 ±
23.
9 45
.2 ±
20.
4 0.
924
Soci
al fu
nctio
ning
59
.4 ±
20.
9 61
.5 ±
22.
9 65
.3 ±
25.
6 0.
635
Rol
e em
otio
nal
43.8
± 3
2.7
60.3
± 2
6.0
57.4
± 2
0.2
0.38
1 M
enta
l hea
lth
59.4
± 1
5.0
53.8
± 2
0.0
60.6
± 1
7.4
0.57
3 O
DI (
%)
50 ±
12
41 ±
13
35 ±
12
0.06
6 VA
S (m
m)
Leg
pain
pre
-eff
ort
36 ±
26
36 ±
24
17 ±
22
0.52
4 Le
g pa
in p
ost-e
ffor
t 68
± 2
8 ¶¶
54
± 2
5 ¶¶
13
± 1
4 <
0.00
1 Lo
w b
ack
pain
pre
-eff
ort
28 ±
21
22 ±
22
14 ±
17
0.16
0 Lo
w b
ack
pain
pos
t-eff
ort
62 ±
23
†, ¶
¶ 28
± 2
6 13
± 1
6 0.
002
28
Valu
es a
re m
ean
± st
anda
rd d
evia
tion.
LP
and
LBP
chan
ge, g
roup
with
wor
sene
d le
g an
d lo
w b
ack
pain
s afte
r gai
t loa
ding
test
; LP
only
chan
ge, g
roup
with
wor
sene
d le
g pa
in o
nly
afte
r gai
t loa
ding
test;
non
-cha
nge,
gro
up w
ith n
o ch
ange
s in
leg
and
low
bac
k pa
ins a
fter g
ait
load
ing
test;
wal
king
dis
tanc
e, w
alki
ng d
istan
ce o
f the
gai
t loa
ding
test
; SF-
36, M
OS
36-It
em S
hort-
Form
Hea
lth S
urve
y; O
DI,
Osw
estry
Disa
bilit
y In
dex;
VA
S, V
isual
Ana
logu
e Sc
ale;
pre
-eff
ort,
befo
re g
ait l
oadi
ng te
st; p
ost-e
ffor
t, af
ter g
ait l
oadi
ng te
st.
† Sig
nific
ant d
iffer
ence
s fro
m c
ontro
l gro
up (p
< 0
.05)
.
¶¶Si
gnifi
cant
diff
eren
ce fr
om L
BP
chan
ge -
grou
p (p
< 0
.01)
.
29
Tabl
e 2
Spat
iote
mpo
ral a
nd k
inem
atic
par
amet
ers d
urin
g ga
it be
fore
and
afte
r gai
t loa
ding
test
LP a
nd L
BP
chan
ge (n
= 8
) LP
onl
y ch
ange
(n =
12)
no
n-ch
ange
(n =
9)
Gro
up
effe
ct (p
) Ti
me
effe
ct (p
) G
roup
× ti
me
inte
ract
ion
(p)
pre-
effo
rt po
st-ef
fort
pre-
effo
rt po
st-ef
fort
pre-
effo
rt po
st-ef
fort
Velo
city
(m/m
in)
46.5
± 7
.5
52.6
± 8
.0
50.5
± 1
2.2
52.2
± 1
4.9
55.6
± 1
5.3
62.0
± 1
5.9
0.27
8 <
0.00
1 0.
126
Cad
ence
(ste
p/m
in)
107.
9 ±
9.6
115.
3 ±
10.2
10
8.5
± 12
.9
113.
7 ±
16.6
11
5.3
± 8.
5 11
8.3
± 10
.3
0.51
1 <
0.00
1 0.
286
Strid
e le
ngth
(% b
ody
heig
ht)
0.55
± 0
.07
0.58
± 0
.08
0.57
± 0
.12
0.57
± 0
.12
0.61
± 0
.15
0.66
± 0
.14
0.42
0 0.
009
0.09
3 K
inem
atic
s (d
egre
e)
P
eak
trunk
tilt
in st
ance
5.
6 ±
3.8
6.0
± 3.
8 6.
6 ±
4.2
8.3
± 5.
4 4.
9 ±
1.9
4.4
± 3.
4 0.
243
0.24
1 0.
211
Peak
thor
acic
tilt
in st
ance
3.
6 ±
4.0
4.0
± 3.
3 2.
4 ±
3.1
2.6
± 4.
2 2.
1 ±
3.4
1.4
± 4.
3 0.
502
0.99
8 0.
506
Pea
k lu
mba
r tilt
in st
ance
2.
8 ±
2.4
3.3
± 3.
0 5.
6 ±
3.4
7.0
± 4.
1 3.
5 ±
2.5
4.0
± 2.
2 0.
054
0.02
1 0.
326
Pea
k pe
lvic
tilt
in st
ance
2.
3 ±
1.3
3.7
± 2.
4 **
3.
1 ±
3.2
2.5
± 3.
3 1.
5 ±
2.0
1.2
± 1.
8 0.
302
0.47
0 0.
003
Valu
es a
re m
ean
± st
anda
rd d
evia
tion.
Pos
itive
kin
emat
ic v
alue
s ind
icat
ed a
nter
ior t
ilt. L
P an
d LB
P ch
ange
, gro
up w
ith w
orse
ned
leg
and
low
bac
k pa
ins a
fter g
ait l
oadi
ng te
st; L
P on
ly c
hang
e, g
roup
with
wor
sene
d le
g pa
in o
nly
afte
r gai
t loa
ding
test;
non
-cha
nge,
gro
up w
ith n
o
chan
ges i
n le
g an
d lo
w b
ack
pain
s afte
r gai
t loa
ding
test
; pre
-eff
ort,
befo
re g
ait l
oadi
ng te
st; p
ost-e
ffor
t, af
ter g
ait l
oadi
ng te
st.
**Si
gnifi
cant
diff
eren
ce fr
om p
re-e
ffort
(p <
0.0
1).
30
Tabl
e 3
Am
ount
of c
hang
e be
twee
n be
fore
and
afte
r gai
t loa
ding
test
for p
ain,
spa
tiote
mpo
ral a
nd k
inem
atic
par
amet
ers d
urin
g ga
it
LP
and
LB
P ch
ange
(n =
8)
LP o
nly
chan
ge (n
= 1
2)
non-
chan
ge (n
= 9
) p
ΔVA
S (m
m)
ΔLeg
pai
n 32
± 2
5 ††
18
± 1
1 ††
-4
± 1
1 <
0.00
1 ΔL
ow b
ack
pain
34
± 1
4 ††
, ¶¶
5 ±
5 †
-1 ±
5
< 0.
001
ΔVel
ocity
(m/m
in)
6.1
± 4.
4 1.
7 ±
6.9
6.3
± 4.
7 0.
126
ΔCad
ence
(ste
p/m
in)
7.4
± 4.
3 5.
1 ±
6.9
3.0
± 4.
4 0.
209
ΔStri
de le
ngth
(% b
ody
heig
ht)
0.02
± 0
.04
0.00
± 0
.05
0.05
± 0
.05
0.09
3 ΔK
inem
atic
s (de
gree
)
ΔT
runk
0.
5 ±
3.2
1.7
± 2.
4 -0
.4 ±
2.4
0.
286
ΔTho
raci
c sp
ine
0.5
± 1.
9 0.
0 ±
2.7
-0.7
± 2
.1
0.61
6 ΔL
umba
r spi
ne
0.4
± 1.
9 1.
4 ±
1.7
0.4
± 1.
3 0.
388
ΔPel
vis
1.4
± 1.
5 ††
, ¶¶
-0.6
± 0
.8
-0.3
± 1
.3
0.00
2
Valu
es a
re m
ean
± st
anda
rd d
evia
tion.
Pos
itive
and
neg
ativ
e ki
nem
atic
val
ues r
espe
ct to
pre
-eff
ort i
ndic
ated
ant
erio
r and
pos
terio
r tilt
s,
resp
ectiv
ely.
LP
and
LBP
chan
ge, g
roup
with
wor
sene
d le
g an
d lo
w b
ack
pain
s afte
r gai
t loa
ding
test;
LP
only
cha
nge,
gro
up w
ith w
orse
ned
leg
pain
onl
y af
ter g
ait l
oadi
ng te
st; n
on-c
hang
e, g
roup
with
no
chan
ges i
n le
g an
d lo
w b
ack
pain
s afte
r gai
t loa
ding
test
; Δ, a
mou
nt o
f
chan
ge b
etw
een
befo
re a
nd a
fter g
ait l
oadi
ng te
st; V
AS,
Visu
al A
nalo
gue
Scal
e.
† and
††Si
gnifi
cant
diff
eren
ces f
rom
con
trol a
t p <
0.0
5 an
d p
< 0.
01, r
espe
ctiv
ely.
¶¶Si
gnifi
cant
diff
eren
ces f
rom
LB
P ch
ange
- at
p <
0.0
1.
31
Tabl
e 4
Cor
rela
tions
bet
wee
n ki
nem
atic
s dur
ing
gait
and
ΔLeg
pai
n an
d ΔL
ow b
ack
pain
in lu
mba
r spi
nal s
teno
sis p
atie
nts
exce
pt fo
r the
non-
chan
ge g
roup
ΔL
eg p
ain
ΔLow
bac
k pa
in
Para
met
er
Cor
rela
tion
Coe
ffic
ient
(r)
p C
orre
latio
n C
oeff
icie
nt (r
) p
Velo
city
pre
-eff
ort
-0.2
06
0.38
4 -0
.109
0.
648
Velo
city
pos
t-eff
ort
-0.0
98
0.68
1 -0
.103
0.
667
ΔVel
ocity
0.
112
0.63
8 0.
081
0.73
6 Pe
ak tr
unk
tilt p
re-e
ffor
t -0
.455
0.
044
-0.2
47
0.29
4 Pe
ak tr
unk
tilt p
ost-e
ffor
t -0
.170
0.
475
-0.2
74
0.24
2 ΔT
runk
0.
128
0.59
0 -0
.188
0.
427
Peak
thor
acic
tilt
pre-
effo
rt -0
.421
0.
065
0.17
5 0.
460
Peak
thor
acic
tilt
post
-eff
ort
-0.1
87
0.43
0 0.
082
0.73
1 ΔT
hora
cic
spin
e 0.
286
0.22
2 0.
128
0.59
2 Pe
ak lu
mba
r tilt
pre
-eff
ort
-0.1
03
0.66
5 -0
.508
0.
022
Peak
lum
bar t
ilt p
ost-e
ffor
t -0
.081
0.
733
-0.5
03
0.02
4 ΔL
umba
r spi
ne
-0.1
23
0.60
6 -0
.225
0.
340
Peak
pel
vic
tilt p
re-e
ffor
t -0
.139
0.
560
0.01
6 0.
947
Peak
pel
vic
tilt p
ost-e
ffor
t -0
.158
0.
505
0.34
3 0.
139
ΔPel
vis
0.03
5 0.
822
0.50
6 0.
023
pre-
effo
rt, b
efor
e ga
it lo
adin
g te
st; p
ost-e
ffor
t, af
ter g
ait l
oadi
ng te
st; Δ
, am
ount
of c
hang
e be
twee
n be
fore
and
afte
r gai
t loa
ding
test
32
Gait analysis(pre-effort)
Gait analysis(post-effort)
6-minutes gaitloading test
Assessment of VAS(pre-effort)
rest
Assessment of VAS(post-effort)
Assessment of SF-36 and ODI
Fig. 1
33
T12
L1
L-L1
R-L1
C7
T1 R-T1
L-T1
R-PSISL-ASIS
R-ASISL-PSIS
T1 segment
L1 segment
Pelvic segment
Fig. 2
34
Fig. 3
0
2
4
6
8
10
12
14
0 20 40 60 80 100
Lum
bar m
ovem
ent (
deg)
(% gait cycle)
Stance Phase Swing Phase
Anterior tilt
0
2
4
6
8
0 20 40 60 80 100
Pelv
ic m
ovem
ent (
deg)
(% gait cycle)
Stance Phase Swing Phase
Anterior tilt
0
2
4
6
8
10
12
14
0 20 40 60 80 100
Trun
km
ovem
ent(
deg)
(% gait cycle)
Stance Phase Swing PhaseAnterior tilt
-2
0
2
4
6
8
0 20 40 60 80 100Th
orac
icm
ovem
ent(
deg)
(% gait cycle)
Stance Phase Swing PhaseAnterior tilt
non-change pre-effortnon-change post-effort
LP and LBP change pre-effortLP and LBP change post-effort
LP only change pre-effortLP only change post-effort
Posterior tilt