Embed Size (px)
Citation preview
IIHR—Hydroscience & Engineering
College of Engineering
The University of Iowa
Iowa City, Iowa 52242-1585
October, 2016
DESIGN, CONSTRUCTION, AND OPERATIONAL PROCEDURES FOR A
RECIRCULATING LABORATORY FLUME AT IOWA STATE UNIVERSITY
by
Andrew Craig, Mark Wilson, James Niemeier, and Alan McCarville
Submitted to:
Professor Michelle Soupir
Professor Steve Mickelson
Iowa State University
Ames, IA 50010
Limited Distribution Report No. 412

THE UNIVERSITY OF IOWA
IIHR - Hydroscience & Engineering October 2016
100 C. Maxwell Stanley Hydraulics Laboratory Page 1
Iowa City, Iowa 52242-1585 USA
ACKNOWLEDGEMENTS
The authors are grateful to Dr. Michelle Soupir and Dr. Steve Mickelson for the
opportunity to participate in this project as well as for their ongoing contributions to the overall
design and scope of works.
THE UNIVERSITY OF IOWA
IIHR - Hydroscience & Engineering October 2016
100 C. Maxwell Stanley Hydraulics Laboratory Page 2
Iowa City, Iowa 52242-1585 USA
TABLE OF CONTENTS
1. INTRODUCTION ......................................................................................................................... 8
2. FLUME DESIGN ......................................................................................................................... 8
2.1 Flume Dimensions ........................................................................................................................ 8
2.2 Structural Design ........................................................................................................................ 12
2.3 Flow Control and Measurement .................................................................................................. 14
2.4 Tilting Capabilities ...................................................................................................................... 16
2.5 Depth Control and Measurement ................................................................................................ 16
2.6 Sediment Test Section ................................................................................................................. 16
2.7 Sediment Feeder .......................................................................................................................... 16
2.8 Instrumentation Platform and Linear Rails ................................................................................. 17
2.9 Flume Control Station ................................................................................................................. 17
Appendix A: Electronic Instrumentation .................................................................................................... 19
A.1 VFD Description ......................................................................................................................... 20
A.1.1 Specifications ...................................................................................................................... 20
A.1.2 Output signals utilized ........................................................................................................ 21
A.1.3 Pump VFD Modified Parameter Settings Report ................................................................ 22
A.2 Magnetic Flow Meter Description .............................................................................................. 23
A.2.1 Factory specs summary ....................................................................................................... 24
A.2.2 Output signals utilized ........................................................................................................ 24
A.3 Ultrasonic Level Sensors Description ......................................................................................... 25
A.3.1 Factory Specs summary ...................................................................................................... 26
A.3.2 Output signals utilized ........................................................................................................ 26
A.4 Actuated Valves Description ...................................................................................................... 27
A.4.1 Factory specifications summary .......................................................................................... 28
A.4.2 Momentary controls ............................................................................................................ 28
A.4.3 Output signals utilized (valve % open indicator) ................................................................ 29
A.5 Tilting Actuator Description ....................................................................................................... 29
A.5.1 Motor and Jacks .................................................................................................................. 30
A.5.2 Limit Switches .................................................................................................................... 30
A.5.3 VFD / Momentary controller bundle................................................................................... 31
A.5.4 Specifications ...................................................................................................................... 32
A.5.5 Output signals utilized ........................................................................................................ 32

THE UNIVERSITY OF IOWA
IIHR - Hydroscience & Engineering October 2016
100 C. Maxwell Stanley Hydraulics Laboratory Page 3
Iowa City, Iowa 52242-1585 USA
A.5.6 Tilt VFD Modified Parameter Settings Report ................................................................... 33
A.6 Inclinometer Description............................................................................................................. 34
A.6.1 General Specifications ........................................................................................................ 35
A.6.2 Ouput Signals ...................................................................................................................... 35
A.7 Schematics and Wiring Diagrams ............................................................................................... 37
A.8 System Software & Hardware Links .......................................................................................... 43
Appendix B: Computer Controls and Data Acquisition ............................................................................. 44
B. COMPUTER CONTROLS AND DATA ACQUISITION .................................................................... 45
B.1 Graphical User Interface (GUI) and LabVIEW Description ...................................................... 45
B.2 Functions of the GUI and LabVIEW Program ........................................................................... 45
B.2.1 General ................................................................................................................................ 46
B.2.2 VFD and Pump Control Features ........................................................................................ 48
B.2.3 Magflow Meter ................................................................................................................... 48
B.2.4 Manual and Flow Tracking Control Modes ........................................................................ 49
B.2.5 Ultrasonic Level Sensors .................................................................................................... 52
B.2.6 Actuated Valves .................................................................................................................. 52
B.2.7 Jack Control - Tilting .......................................................................................................... 53
B.2.8 Inclinometer ........................................................................................................................ 54
B.3 Main Control Program Features and Details ............................................................................... 54
B.3.1 Info Tab ............................................................................................................................... 57
B.3.2 A/I Tab ................................................................................................................................ 58
B.3.3 A/O Tab .............................................................................................................................. 59
B.3.4 DIO Tab .............................................................................................................................. 60
B.3.5 XSonic Tab ......................................................................................................................... 61
B.3.6 Cal Tab ................................................................................................................................ 62
B.3.7 Tracking Tab ....................................................................................................................... 63
B.3.8 ISU_Flume_Scale.vi ........................................................................................................... 64
B.3.9 ISU_Flume_Set_Config.vi .................................................................................................. 65
B.3.10 ISU_Flume_VFD_Tracker.vi ............................................................................................. 68
B.3.11 ISU_Flume_Error_States.vi ................................................................................................ 69
B.3.12 ISU_Flume_Flow_Stats.vi .................................................................................................. 70
B.4 Tilting/Slope Control Program Features and Details .................................................................. 71
B.4.1 ISU_Flume_jack_control_v1.vi .......................................................................................... 71
B.4.2 ISU_Flume_write_DO.vi .................................................................................................... 71
THE UNIVERSITY OF IOWA
IIHR - Hydroscience & Engineering October 2016
100 C. Maxwell Stanley Hydraulics Laboratory Page 4
Iowa City, Iowa 52242-1585 USA
B.4.3 ISU_Flume_get_current_slope.vi ....................................................................................... 72
B.4.4 ISU_Flume_jack_parameters.vi .......................................................................................... 74
B.5 Operational and Safety Features ................................................................................................. 75
B.5.1 Manual and Flow Tracking Modes of Operation ................................................................ 75
B.5.2 VFD/Pump Ramp-up and Ramp-down ............................................................................... 75
Appendix C: Instrument Calibrations ......................................................................................................... 76
C. INSTRUMENT CALIBRATIONS .................................................................................................. 77
C.1 General Calibration Procedure .................................................................................................... 77
C.1.1 Magflow meter calibration .................................................................................................. 77
C.1.2 Ultrasonic level sensor calbirations .................................................................................... 78
C.1.3 Actuated valve calibrations ................................................................................................. 80
C.1.4 Inclinometer calibration ...................................................................................................... 82
C.1.5 Orifice flow meter calibration ............................................................................................. 83
Appendix D: Flume Maintenance ............................................................................................................... 85
D. ISU FLUME MAINTENANCE INSTRUCTIONS ............................................................................ 86
D.1 Lubrication for Mechanical Components.................................................................................... 86
D.1.1 Pump ................................................................................................................................... 86
D.1.2 Gearmotor ........................................................................................................................... 86
D.1.3 Mechanical Screw Actuators .............................................................................................. 87
D.1.4 Tailgate Winch .................................................................................................................... 87
D.2 Repairs, Parts, or Replacement ................................................................................................... 87
D.3 Cleaning ...................................................................................................................................... 88
D.4 Water Leakage ............................................................................................................................ 89
D.5 Paint ............................................................................................................................................ 89

THE UNIVERSITY OF IOWA
IIHR - Hydroscience & Engineering October 2016
100 C. Maxwell Stanley Hydraulics Laboratory Page 5
Iowa City, Iowa 52242-1585 USA
LIST OF TABLES
Table A-1. VFD specifications ..................................................................................................... 21
Table A-2. Yaskawa P1000 I/O signals utilized for systems control ........................................... 22
Table A-3. Modified VFD Parameters .......................................................................................... 23
Table A-4. Specifications for Magflow Meter .............................................................................. 24
Table A-5. Mag Flow Meter utilized output signals ..................................................................... 25
Table A-6. Senix ToughSonic Specifications ............................................................................... 26
Table A-7. Specifications for Pomation actuated valves. ............................................................. 28
Table A-8. Signals for Promation actuated valves ........................................................................ 29
Table A-9. Yaskawa V1000 VFD main specifications. ................................................................ 32
Table A-10. Yaskawa V1000 I/O signals utilized for systems control ......................................... 33
Table A-11. Modified parameters set in V1000 VFD .................................................................. 34
Table A-12. Specifications of VS series inclinometer .................................................................. 35
Table A-13. Signals utilized on VS Series Inclinometer .............................................................. 36
LIST OF FIGURES
Figure 2 - 1. Plan view of flume and laboratory ............................................................................. 9
Figure 2 - 2. Plan, elevation and section views of flume .............................................................. 10
Figure 2 - 3. 3-D renderings .......................................................................................................... 11
Figure 2 - 4. Structural performance of the continuous MC18x42 flume support members ........ 12
Figure 2 - 5. Stress contours from Creo Simulate FEA ................................................................ 13
Figure 2 - 6. Displacement contours from Creo Simulate FEA .................................................... 14
Figure 2 - 7. Hydroflo pump curve ............................................................................................... 15
Figure 2 - 8. Gandy drop spreader/sediment feeder ...................................................................... 17
Figure A-1 Yaskawa P1000 variable frequency drive .................................................................. 20
Figure A-2 Badger M2000 electromagnetic flow meter ............................................................... 24
Figure A-3. Senix ToughSonic ultrasonic level transducer .......................................................... 26
Figure A-4. Promation actuated valve .......................................................................................... 27
Figure A-5. Valve Control Toggle Switch Box ............................................................................ 29
Figure A-6. Tilting actuator for raising and lowering the flume. ................................................. 30
Figure A-7. Limit switch used to stop upward and downward motion of the flume. ................... 31

THE UNIVERSITY OF IOWA
IIHR - Hydroscience & Engineering October 2016
100 C. Maxwell Stanley Hydraulics Laboratory Page 6
Iowa City, Iowa 52242-1585 USA
Figure A-8. Yaskawa V1000 VFD used for controlling the motion in tilting the flume. ............. 32
Figure A-9. Voltage divider resistors installed in the Yaskawa V1000 VFD terminals ............... 33
Figure A-10. Inclinometer used for measuring the tilt angle of the flume ................................... 35
Figure A-11. Electronics control enclosure .................................................................................. 37
Figure A-12. Wiring diagram for all DAQ connections ............................................................... 38
Figure A-13. Senix manufactured ultrasonic termination board used to power and interface
with Senix ultrasonic transducers, one board per transducer ................................ 39
Figure A-14. Wiring diagram between pump VFD and B&B wireless I/O system ..................... 40
Figure A-15. Flume electronics I/O printed circuit board used to translate sensor current
outputs to voltage outputs. The board provides power to the inclinometer
sensor and communications to the control PC ...................................................... 41
Figure A-16. Wiring diagram for tilting VFD, limit switches and pushbutton control which
control the tilt angle of the flume .......................................................................... 42
Figure B - 1. Main user interface .................................................................................................. 46
Figure B - 2. Starting the main VI ................................................................................................ 47
Figure B - 3. Stopping the main VI............................................................................................... 47
Figure B - 4. Remote ops and flow control options ...................................................................... 48
Figure B - 5. Flow rate display ..................................................................................................... 49
Figure B - 6. VFD manual flow control operations ...................................................................... 50
Figure B - 7. VFD operations set to Flow Tracking ..................................................................... 51
Figure B - 8. Flow Tracking mode of operation ........................................................................... 51
Figure B - 9. Test section depth indicator ..................................................................................... 52
Figure B - 10. Sump depth indicators ........................................................................................... 52
Figure B - 11. 12-inch supply pipe valve opening (%) ................................................................. 53
Figure B - 12. Sump A and B valve opening (%) ......................................................................... 53
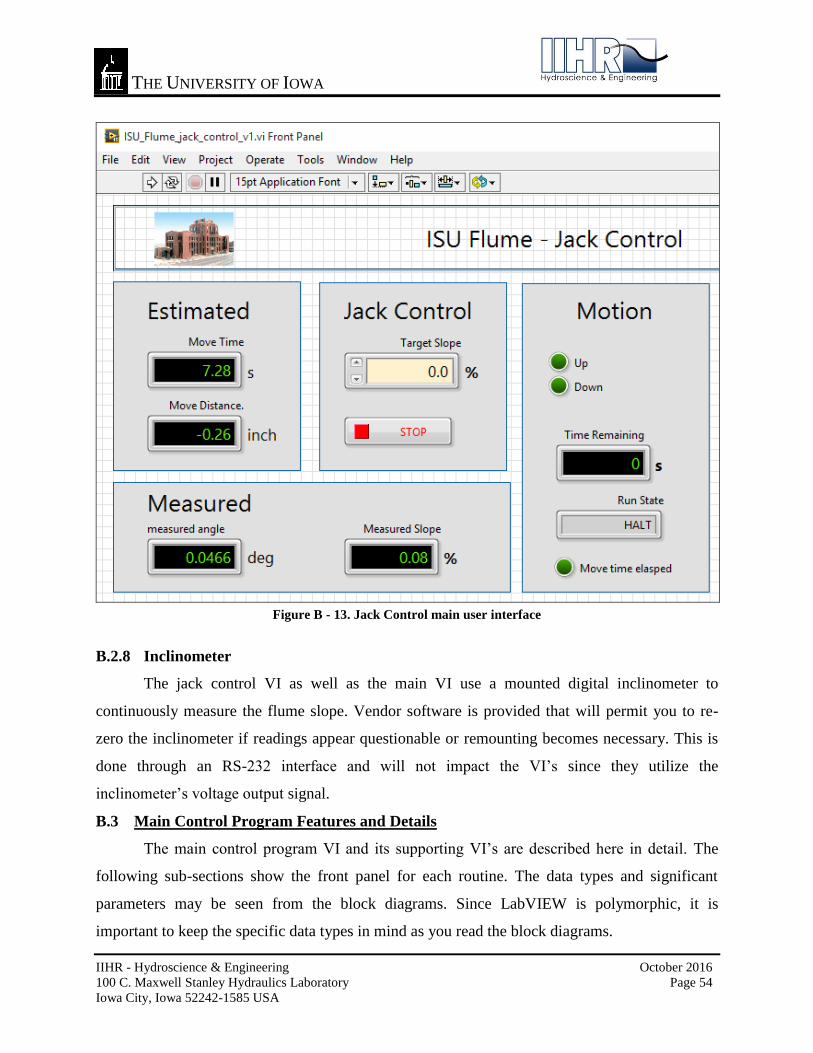
Figure B - 13. Jack Control main user interface ........................................................................... 54
Figure B - 14. Main user interface ................................................................................................ 55
Figure B - 15. Primary operator interface ..................................................................................... 56
Figure B - 16. Information tab ...................................................................................................... 57
Figure B - 17. Analog input information tab ................................................................................ 58
Figure B - 18. Analog output information tab .............................................................................. 59
Figure B - 19. Digital input and output information tab ............................................................... 60
Figure B - 20. Ultrasonic probe information tab........................................................................... 61
Figure B - 21. Calibration information tab ................................................................................... 62

THE UNIVERSITY OF IOWA
IIHR - Hydroscience & Engineering October 2016
100 C. Maxwell Stanley Hydraulics Laboratory Page 7
Iowa City, Iowa 52242-1585 USA
Figure B - 22. Tracking mode information tab ............................................................................. 63
Figure B - 23. ISU_Flume_Scale.vi input and output variables ................................................... 64
Figure B - 24. ISU_Flume_Scale.vi main interface ...................................................................... 64
Figure B - 25. ISU_Flume_Set_Config.vi input and output variables ......................................... 65
Figure B - 26. Calibration definitions for display on the front panel ........................................... 65
Figure B – 26 cont. Calibration definitions for display on the front panel ................................... 66
Figure B – 26 cont. Calibration definitions for display on the front panel ................................... 67
Figure B - 27. ISU_Flume_VFD_Tracker.vi input and output variables ..................................... 68
Figure B - 28. ISU_Flume_VFD_Tracker.vi main interface ........................................................ 68
Figure B - 29. ISU_Flume_Error_States.vi input and out variables ............................................. 69
Figure B - 30. ISU_Flume_Error_States.vi main user interface .................................................. 69
Figure B - 31. ISU_Flume_Flow_Stats.vi input and output variables .......................................... 70
Figure B - 32. ISU_Flume_Flow_Stats.vi main user interface ..................................................... 70
Figure B - 33. ISU_Flume_jack_control_v1.vi main user interface ............................................. 71
Figure B - 34. ISU_Flume_write_DO.vi input and output variables ............................................ 71
Figure B - 35. ISU_Flume_write_DO.vi main user interface ....................................................... 72
Figure B - 36. ISU_Flume_get_current_slope.vi input and output variables ............................... 72
Figure B - 37. ISU_Flume_get_current_slope.vi main user interface .......................................... 73
Figure B - 38. ISU_Flume_jack_parameters.vi input and output variables ................................. 74
Figure B - 39. ISU_Flume_jack_parameters.vi main user interface ............................................ 74
Figure C - 1. Magflow meter calibration data and plot................................................................ 78
Figure C - 2. Flume test section ultrasonic level sensor calibration ............................................. 79
Figure C - 3. Sump A ultrasonic level sensor calibration ............................................................. 79
Figure C - 4. Sump B ultrasonic level sensor calibration ............................................................. 80
Figure C - 5. 12-inch valve calibration ......................................................................................... 81
Figure C - 6. 18-inch (Sump A) valve calibration ........................................................................ 81
Figure C - 7. 18-inch (Sump B) valve calibration ........................................................................ 82
Figure C - 8. Inclinometer calibration........................................................................................... 83
Figure C - 9. Orifice flow meter calibration ................................................................................. 84

THE UNIVERSITY OF IOWA
IIHR - Hydroscience & Engineering October 2016
100 C. Maxwell Stanley Hydraulics Laboratory Page 8
Iowa City, Iowa 52242-1585 USA
1. INTRODUCTION
The University of Iowa’s IIHR-Hydroscience & Engineering (IIHR) was contracted by
Iowa State University’s (ISU’s) Agricultural & Biosystems Engineering (ABE) department for
the design, fabrication and installation of a research-grade laboratory flume. The flume was
designed and fabricated at IIHR, deconstructed, transported to ISU, re-assembled and
commissioned in the designated laboratory space in ABE’s Sukup Hall on the ISU main campus.
2. FLUME DESIGN
2.1 Flume Dimensions
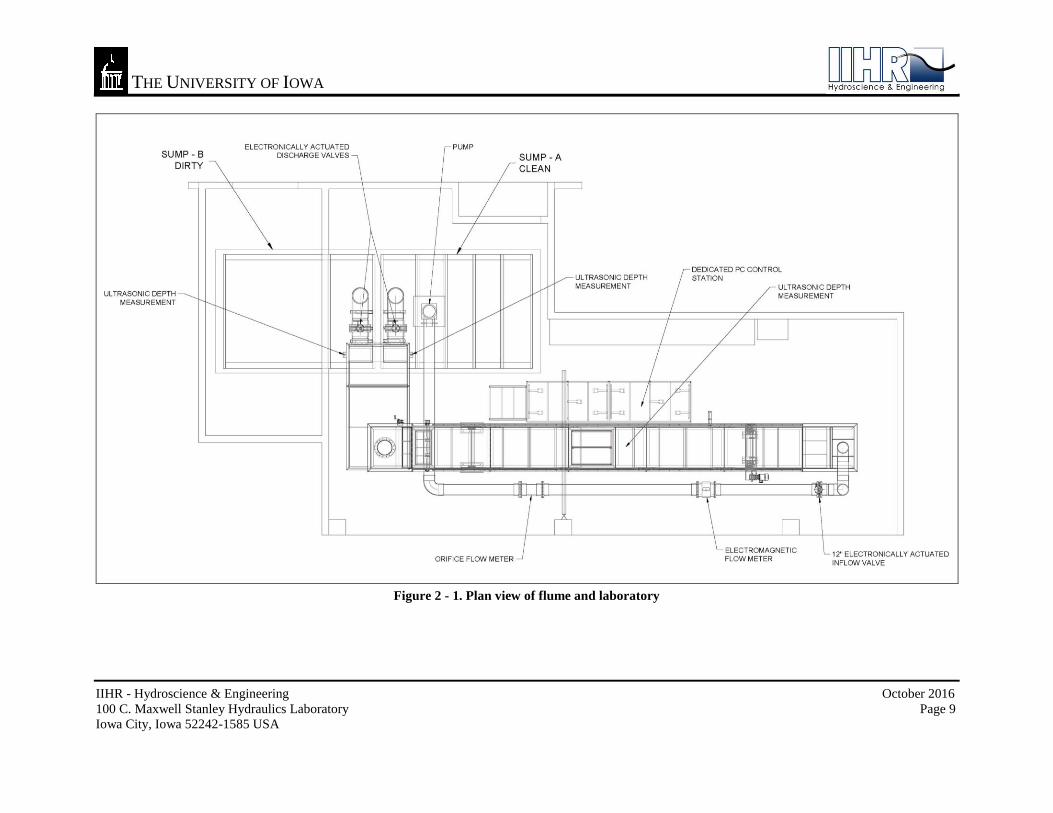
The laboratory flume consists primarily of a 2 feet high by 4 feet wide by 38 feet long
open channel of uniform cross-section. Additional length on both ends for head and tail tanks
results in an overall length of approximately 48 feet. A clear space of approximately 4 feet
between the flume structure and existing laboratory walls was maintained. Engineering drawings
of the flume are included in Figure 2 - 1 and Figure 2 - 2. Figure 2 - 3 shows isometric
renderings of the final flume design generated from the fully 3-dimensional CAD model created
in Creo Parametric.
THE UNIVERSITY OF IOWA
IIHR - Hydroscience & Engineering October 2016
100 C. Maxwell Stanley Hydraulics Laboratory Page 9
Iowa City, Iowa 52242-1585 USA
Figure 2 - 1. Plan view of flume and laboratory

THE UNIVERSITY OF IOWA
IIHR - Hydroscience & Engineering October 2016
100 C. Maxwell Stanley Hydraulics Laboratory Page 10
Iowa City, Iowa 52242-1585 USA
Figure 2 - 2. Plan, elevation and section views of flume

THE UNIVERSITY OF IOWA
IIHR - Hydroscience & Engineering October 2016
100 C. Maxwell Stanley Hydraulics Laboratory Page 11
Iowa City, Iowa 52242-1585 USA
Figure 2 - 3. 3-D renderings

THE UNIVERSITY OF IOWA
IIHR - Hydroscience & Engineering October 2016
100 C. Maxwell Stanley Hydraulics Laboratory Page 12
Iowa City, Iowa 52242-1585 USA
2.2 Structural Design
The flume was constructed from carbon steel, stainless steel, and tempered glass to
achieve a flume structure that will deflect no more than L/3000, where L is section length, along
the total length of the flume and within any flume member/section per IIHR’s flume design
standards. Figure 2 - 4 shows the shear, moment, and deflection calculated for two continuous
MC18x42 support beams with a water depth of 20 inches (note that the head and tail boxes are
considered point loads at the ends of the beams).
Figure 2 - 4. Structural performance of the continuous MC18x42 flume support members

THE UNIVERSITY OF IOWA
IIHR - Hydroscience & Engineering October 2016
100 C. Maxwell Stanley Hydraulics Laboratory Page 13
Iowa City, Iowa 52242-1585 USA
The flume was built in sections (non-continuous) in order to fit inside the elevator in
Sukup Hall. The sections were fastened together along flange connections and 1-inch thick plates
were laminated across the C-channel joints to recreate beam continuity and provide adequate
structural integrity. A full 3-dimensional finite element analysis (FEA) was performed using
Creo Simulate to verify that the stresses and deflections were acceptable. Resultant stresses and
displacements from analysis with the flume filled with 20 inches of water are shown in Figure 2 -
5 and Figure 2 - 6, respectively. Results were satisfactory and consistent with the continuous
beam results.
Figure 2 - 5. Stress contours from Creo Simulate FEA

THE UNIVERSITY OF IOWA
IIHR - Hydroscience & Engineering October 2016
100 C. Maxwell Stanley Hydraulics Laboratory Page 14
Iowa City, Iowa 52242-1585 USA
Figure 2 - 6. Displacement contours from Creo Simulate FEA
2.3 Flow Control and Measurement
The flume is equipped with a Hydroflo two-stage mixed flow vertical turbine pump and
60 horsepower motor that draws water from a clean sump (sump A) with a peak flow rate of
about 4,000 gallons per minute (gpm) or 9.0 cubic feet per second (cfs) through a 12-inch inflow
line to the flume’s headbox. Water is discharged from the flume’s tailbox either into the “clean”
sump (sump A) or to a designated “dirty” sump (sump B). The peak flow rate provides an
average velocity within the flume of about 1.35 feet per second (fps) with a water depth of 20-
inches (1.67 ft) with the flume in a level position. The pump curve is shown in Figure 2 - 7.

THE UNIVERSITY OF IOWA
IIHR - Hydroscience & Engineering October 2016
100 C. Maxwell Stanley Hydraulics Laboratory Page 15
Iowa City, Iowa 52242-1585 USA
Figure 2 - 7. Hydroflo pump curve
The flow rate can be measured with either an electromagnetic flow meter (magflow) or
with a traditional orifice-type flow meter. Manual flow rate control is provided by a variable
frequency drive (VFD) and electronically actuated butterfly valves (1 in supply line, 2 in
discharge line for sump A/B selection – see Appendix A for details).
The magflow meter also provides electronic feedback between the VFD and a custom
proportional controller in LabVIEW (see Appendix B for details) that allows a constant flow rate
to be specified and maintained in the case where there may be water drawn from one sump and
discharged into another. This provides a way for the pump to compensate for the falling head in
the supply sump and maintain a constant flow rate during such tests.

THE UNIVERSITY OF IOWA
IIHR - Hydroscience & Engineering October 2016
100 C. Maxwell Stanley Hydraulics Laboratory Page 16
Iowa City, Iowa 52242-1585 USA
2.4 Tilting Capabilities
The flume has the capability to be set at any sloped position between 0 and 5% (0 – 2.86
degrees). Two electronically actuated screw jacks provide lifting at a point near the flume
headbox to achieve the desired slope. The slope/angle is measured with an electronic
inclinometer. Details on the actuated screw jacks, jack motor, and inclinometer are provided in
Appendix A. The slope can be altered either manually with momentary push-button control or by
specifying a desired slope in a standalone LabVIEW program (see Appendix B).
2.5 Depth Control and Measurement
Water levels within the flume are controlled with a manually adjusted hinged weir
(tailgate) near the downstream end of the flume section. Water levels within the flume and the
two sumps are measured with ultrasonic level sensors which output to the dedicated PC. The
depth measurement within the flume can be used in combination with the flow rate to determine
the average velocity, Froude number, bed shear stress, Reynolds Number, as well as many other
useful flow parameters in the flume test section. Details on the ultrasonic level sensors are
provided in Appendix A.
2.6 Sediment Test Section
A sediment test section consisting of a recessed floor with removable sediment
inserts/trays was incorporated into the flume design. Various sediment tray insert configurations
were also included. A jib crane with an electronic chain hoist was installed to assist in
manipulating/installing/removing sediment tray inserts. A false floor cover insert was designed
to fit over the sediment test section for test cases that do not require the recessed section. A
sediment trap just upstream of the tailgate was incorporated in the design to assist with sediment
control and removal.
2.7 Sediment Feeder
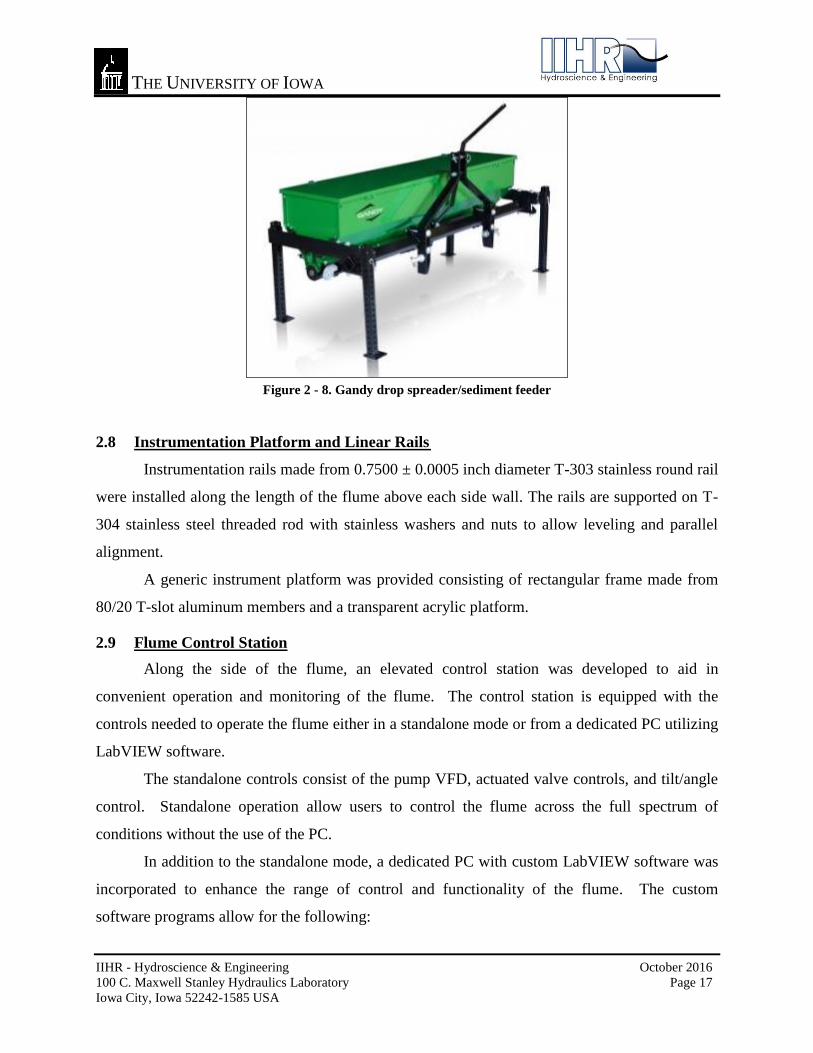
A Gandy 4 ft drop spreader (Figure 2 - 8) equipped with dual 12 volt electric drive
motors was adapted for installation at the upstream end of the test section to serve as a controlled
sediment feeder for sediment transport related studies. It is partitioned into two reservoirs, each
half the width of the flume. A calibration tray is included to aid in setting desired feed rates or
sediment concentrations. The feeder is operated manually with on/off toggle switches.
THE UNIVERSITY OF IOWA
IIHR - Hydroscience & Engineering October 2016
100 C. Maxwell Stanley Hydraulics Laboratory Page 17
Iowa City, Iowa 52242-1585 USA
Figure 2 - 8. Gandy drop spreader/sediment feeder
2.8 Instrumentation Platform and Linear Rails
Instrumentation rails made from 0.7500 ± 0.0005 inch diameter T-303 stainless round rail
were installed along the length of the flume above each side wall. The rails are supported on T-
304 stainless steel threaded rod with stainless washers and nuts to allow leveling and parallel
alignment.
A generic instrument platform was provided consisting of rectangular frame made from
80/20 T-slot aluminum members and a transparent acrylic platform.
2.9 Flume Control Station
Along the side of the flume, an elevated control station was developed to aid in
convenient operation and monitoring of the flume. The control station is equipped with the
controls needed to operate the flume either in a standalone mode or from a dedicated PC utilizing
LabVIEW software.
The standalone controls consist of the pump VFD, actuated valve controls, and tilt/angle
control. Standalone operation allow users to control the flume across the full spectrum of
conditions without the use of the PC.
In addition to the standalone mode, a dedicated PC with custom LabVIEW software was
incorporated to enhance the range of control and functionality of the flume. The custom
software programs allow for the following:

THE UNIVERSITY OF IOWA
IIHR - Hydroscience & Engineering October 2016
100 C. Maxwell Stanley Hydraulics Laboratory Page 18
Iowa City, Iowa 52242-1585 USA
Depth display in the flume channel and in sumps A and B
Flow rate display from the magflow meter
Actuated valve position display
Flume slope/angle display
Actuated jack control for specified slope setting
Display of variables such as average velocity, bed shear stress, Froude Number,
Reynolds Number, etc.
“Flow Tracking” mode that utilizes internal LabVIEW proportional controller
function to set and maintain target flow rate.
Detailed descriptions of the LabVIEW virtual instrument programs are provided in
Appendix B.
THE UNIVERSITY OF IOWA
IIHR - Hydroscience & Engineering October 2016
100 C. Maxwell Stanley Hydraulics Laboratory Page 19
Iowa City, Iowa 52242-1585 USA
APPENDIX A: ELECTRONIC INSTRUMENTATION

THE UNIVERSITY OF IOWA
IIHR - Hydroscience & Engineering October 2016
100 C. Maxwell Stanley Hydraulics Laboratory Page 20
Iowa City, Iowa 52242-1585 USA
A.1 VFD Description
One Yaskawa P1000 variable frequency drive (VFD), shown in Figure A-1, powers and
controls the US Motors, 60HP, 900RPM, MODEL 15411 electrical motor attached to the flume
water pump. A VFD is a type of controller that varies the frequency and voltage supplied to an
electric motor. For this application the Yaskawa P1000 VFD can be remotely operated through
LabVIEW using low voltage DC signals allowing the user to vary the motor (i.e. pump) speed
and thus the flow of water through the flume.
Figure A-1 Yaskawa P1000 variable frequency drive
A.1.1 Specifications
Table A-1 lists the key information of main interest for the P1000, for more
specifications please see the supplied user manual. For this application the VFD is connected to
three-phase, 208 Volts AC power.

THE UNIVERSITY OF IOWA
IIHR - Hydroscience & Engineering October 2016
100 C. Maxwell Stanley Hydraulics Laboratory Page 21
Iowa City, Iowa 52242-1585 USA
Table A-1. VFD specifications
Model CIMR-PU2A0169FAA
Input power 3 phase, 200 to 240 Volts AC
Amperage 169 A
Input/Output Analog and Digital
A.1.2 Output signals utilized
The user manual for P1000 notes in several locations of the inherent noise coupled to
peripheral devices connected to the VFD. These peripheral devices are typically used for both
monitoring and controlling the VFD. Table A-2 lists the VFD terminals and signal description
used in controlling the VFD remotely through LabVIEW. Large noise spikes were observed in
LabVIEW readings when the VFD was wired directly to the National Instruments Data
Acquisition device (DAQ). To isolate the noise generated by VFD on the DAQ, a pair of B&B
Electronics Zlinx Wireless I/O RF modules (i.e., Master and Slave) Model ZZ24D-NC-SR were
used to wirelessly transfer signal levels between the P1000 VFD and DAQ/LabVIEW. The
Zlinx I/O Base Modules operate at 2.4GHz and have 2 Analog Inputs, 2 Analog Outputs, 2
Digital Inputs, and 2 Digital Outputs. Pull-up resistors were added to the RF modules as needed
since the RF units can only sink current. Both analog and digital control and feedback signals
travel between LabVIEW software and the VFD using the Zlinx master and slave wireless units.
For a wiring diagram of the RF module and the VFD, see Figure A-14. For wiring diagram from
RF module to DAQ see Figure A-12. The B&B Electronics Zlinx RF modules were configured
using the built-in encryption functionality using a unique code to eliminate the possibility of
signal corruption if other Zlinx RF modules are operating in the area. A complete list of the
configuration settings for the Zlinx modules is available in the user manual folder in the file
B&B_Zlinx.doc.
THE UNIVERSITY OF IOWA
IIHR - Hydroscience & Engineering October 2016
100 C. Maxwell Stanley Hydraulics Laboratory Page 22
Iowa City, Iowa 52242-1585 USA
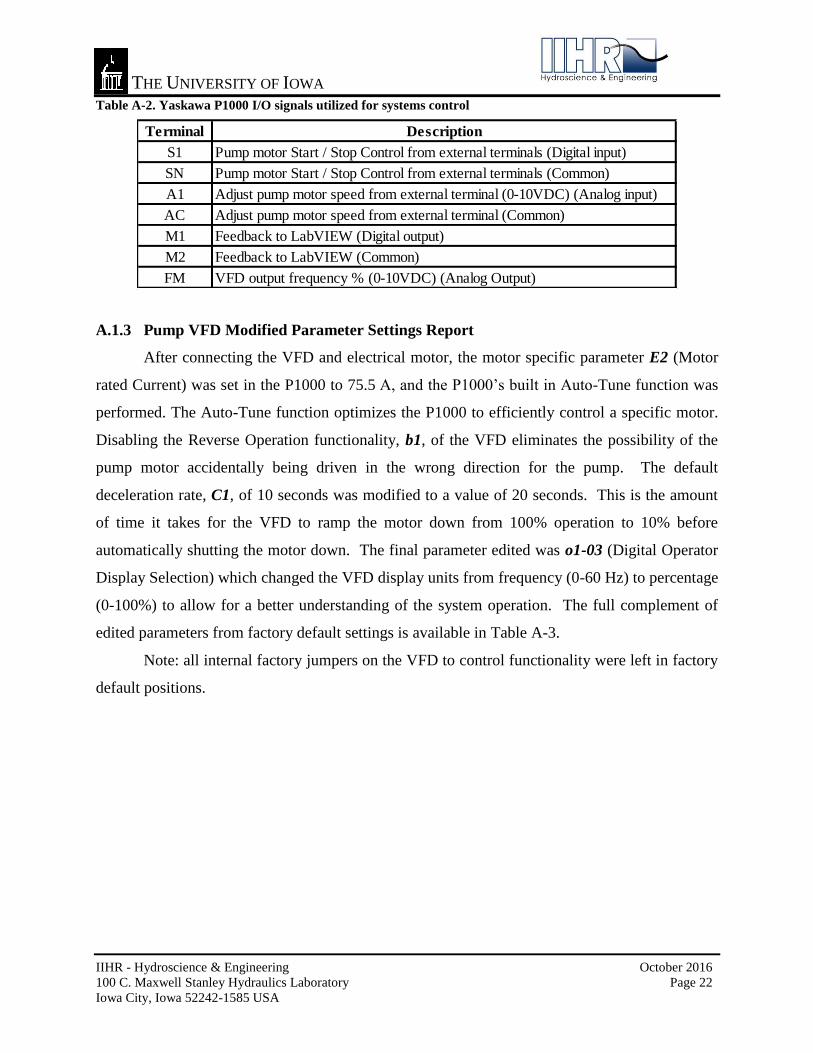
Table A-2. Yaskawa P1000 I/O signals utilized for systems control
Terminal Description
S1 Pump motor Start / Stop Control from external terminals (Digital input)
SN Pump motor Start / Stop Control from external terminals (Common)
A1 Adjust pump motor speed from external terminal (0-10VDC) (Analog input)
AC Adjust pump motor speed from external terminal (Common)
M1 Feedback to LabVIEW (Digital output)
M2 Feedback to LabVIEW (Common)
FM VFD output frequency % (0-10VDC) (Analog Output)
A.1.3 Pump VFD Modified Parameter Settings Report
After connecting the VFD and electrical motor, the motor specific parameter E2 (Motor
rated Current) was set in the P1000 to 75.5 A, and the P1000’s built in Auto-Tune function was
performed. The Auto-Tune function optimizes the P1000 to efficiently control a specific motor.
Disabling the Reverse Operation functionality, b1, of the VFD eliminates the possibility of the
pump motor accidentally being driven in the wrong direction for the pump. The default
deceleration rate, C1, of 10 seconds was modified to a value of 20 seconds. This is the amount
of time it takes for the VFD to ramp the motor down from 100% operation to 10% before
automatically shutting the motor down. The final parameter edited was o1-03 (Digital Operator
Display Selection) which changed the VFD display units from frequency (0-60 Hz) to percentage
(0-100%) to allow for a better understanding of the system operation. The full complement of
edited parameters from factory default settings is available in Table A-3.
Note: all internal factory jumpers on the VFD to control functionality were left in factory
default positions.

THE UNIVERSITY OF IOWA
IIHR - Hydroscience & Engineering October 2016
100 C. Maxwell Stanley Hydraulics Laboratory Page 23
Iowa City, Iowa 52242-1585 USA
Table A-3. Modified VFD Parameters
Parameter Value Default
A1 Initialization
A1-06 Application Preset 8 0
b1 Operation Mode Selection 0
b1-04 Reversion Operation Selection 1 0
C1 Acceleration and Deceleration Times
C1-02 Deceleration Time 1 20.0 sec 10.0 sec
C6 Carrier Frequency
C6-02 Carrier Frequency Selection 6 7
d1 Frequency Reference
d1-01 Frequency Reference 1 25.67% 0.00%
d1-17 Jog Frequency Reference 10.00% 6.00%
E2 Motor 1 Setup
E2-01 Motor Rated Current 75.7 A 79.7A
L5 Fault Reset
L5-05 Auto restart selection 1 0
o1 Display Settings
o1-03 Digital Operator Display Selection 1 0
A.2 Magnetic Flow Meter Description
One Badger M2000 electromagnetic flow meter (Figure A-2) is used to provide fluid
metering capabilities for the flume. For this application, the M2000 provides output data for
pipe flow velocities and volumetric flow rates as well as empty pipe detection features.

THE UNIVERSITY OF IOWA
IIHR - Hydroscience & Engineering October 2016
100 C. Maxwell Stanley Hydraulics Laboratory Page 24
Iowa City, Iowa 52242-1585 USA
Figure A-2 Badger M2000 electromagnetic flow meter
A.2.1 Factory specs summary
Table A-4 lists the key specifications for the magflow meter. For additional details, refer
to the supplied user manual. For this application, the magflow meter was connected to 120V
single-phase AC input supply power.
Table A-4. Specifications for Magflow Meter
Model M2000
Input power 85…265 Volts AC
Power 20 W
±0.25 percent of rate for velocities greater than 1.64 ft./s (0.50 m/s)
± 0.004 ft./s (± 1mm/s) for velocities less than 1.64 ft./s (0.50 m/s)
Pulse Width Scalable up to 10 kHz, open collector up to 1 kHz, solid-state relay
Output Analog and Digital
Accuracy
A.2.2 Output signals utilized
The magflow meter signals are used with the Proportional-Integral-Derivative (PID)
controller functionality embedded within the custom LabVIEW software application installed on

THE UNIVERSITY OF IOWA
IIHR - Hydroscience & Engineering October 2016
100 C. Maxwell Stanley Hydraulics Laboratory Page 25
Iowa City, Iowa 52242-1585 USA
the control PC. Terminals 15 (-) and 16 (+) on the magflow output a 0-20 mA current loop (this
value was modified from the default 4-20 mA factory setting) signal and is converted into a
voltage signal by a 250 ohm resistor located on the custom I/O printed circuit board, Figure A-
15. Terminals 1 (+) and 2 (-) have been set to enable the Empty Pipe Alarm signal. The Empty
Pipe Alarm digital signal is sent from the magflow to the DAQ using a 10 kΩ pull-up resistor
located on the custom I/O printed circuit board inside the electronics enclosure, Figure A-15. All
digital outputs on the magflow implement internal open collector circuits and the manufacturer
recommends using 10 kΩ pull-up resistors. Table A-5 lists the output signals utilized from the
magflow meter.
Note: The Analog Output factory default settings for terminals 16 (+) and 15 (-) have
been changed from 4-20 mA Resistive Load <800 Ω, to 0-20 mA. The Empty Pipe Alarm
detection used on terminals 1(+) and 2(-) have been modified from factory default.
Table A-5. Mag Flow Meter utilized output signals
Terminal Description
1 (+) Empty pipe alarm (Open Collector Digital signal)
2 (-) Empty pipe alarm (common)
15 (-) Flow Unit – flow rate set to cubic feet per second (common)
16 (+) Flow Unit – flow rate set to cubic feet per second (0-20mA)
A.3 Ultrasonic Level Sensors Description
Three Senix ToughSonic Level and Distance sensors are used to monitor water depths in
the system (Figure A-3). ToughSonic sensors are IP68 waterproof rated and contain a rugged
transducer potted in a stainless steel housing to provide long life. The Senix sensor is a non-
contact Time of Flight (ToF) measuring device, measuring the distance (air space) to the target.
To provide an accurate ToF measurement, the sensors internal temperature compensation was
enabled to account for changes in the speed of sound with changes in temperature. The factory
default setting is to disable internal temperature compensations.

THE UNIVERSITY OF IOWA
IIHR - Hydroscience & Engineering October 2016
100 C. Maxwell Stanley Hydraulics Laboratory Page 26
Iowa City, Iowa 52242-1585 USA
Figure A-3. Senix ToughSonic ultrasonic level transducer
A.3.1 Factory Specs summary
Table A-6 lists the key specifications for the Senix ultrasonic transducers. For additional
details, refer to the supplied user manual. For this application, the Senix sensors are connected
to regulated 24 VDC power supplies located in the electronics enclosure shown in Figure A-11.
Table A-6. Senix ToughSonic Specifications
TSPC-30S1
TSPC-15S
Input power 10-30 VDC @ 70 mA maximum; Typical: 45 mA @ 24 VDC
Amperage 70 mA; 45 mA
Accuracy Nominal 0.3% of range @ constant temp. Affected by target, distance, environment
Digital: 0.0034 in. (0.086 mm) TSPC-30S1
Digital: 0.0068 in. (0.172 mm) TSPC-15S
Analog:4099 steps (0-10 VDC), 3279 steps (4-20 mA) Both models
Output 0-10, 0-5 VDC or PC customized, 10 mA max
0.5 – 10 ft TSPC-30S1
1 – 20 ft TSPC-15S
Models
Resolution
Range
A.3.2 Output signals utilized
One Senix ToughSonic 14 sensor is used to determine water depth in the flume test
section. Two Senix ToughSonic 30 sensors are used to determine water depth in sump A and
sump B. The ToughSonic 14 outputs a voltage that equates to the distance to the water’s surface
or “air space”. LabVIEW then converts this value to water depth and displays it in the Test
Section Depth measured in feet. Both of the ToughSonic 30 sensors output a voltage that

THE UNIVERSITY OF IOWA
IIHR - Hydroscience & Engineering October 2016
100 C. Maxwell Stanley Hydraulics Laboratory Page 27
Iowa City, Iowa 52242-1585 USA
equates to the distance to the water’s surface or “air space”. Those voltages are interpreted by
the LabVIEW software application installed on the control PC that displays the Depth Sump A
and Depth Sump B values in feet for the end user to view. If the water level in the Sump A is
less than 2.5 feet (7.5 feet of measured air space), the ToughSonic sensor triggers a relay which
turns on a strobe light mounted on top of the Sump A’s 18-inch actuated valve, Figure A-13.
Flume operators will be made aware of low water level in Sump A due to the strobe lights
automatically powering on when a low water level condition is present. This warning is to aid in
preventing the user from running the pump dry when the water level in the sump is low. The
ultrasonic sensor in Sump B is programmed to turn on its warning strobe light when the water
level in Sump B is less than 12 inches from the top of the sump. This warning is to aid in
preventing the system from overflowing the sump and flooding the floor of the room. The Sump
B warning strobe is mounted on top of the Sump B’s 18-inch actuated valve.
A.4 Actuated Valves Description
Three Promation actuated valves are used to control water flow within the flume system,
Figure A-4. One 12-inch actuated valve is used to control inflow to the flume. Two 18-inch
actuated valves control water flow for Sump A and Sump B. All three valves can be operated
both manually and electronically using the valve control panel located at the workstation.
Figure A-4. Promation actuated valve
THE UNIVERSITY OF IOWA
IIHR - Hydroscience & Engineering October 2016
100 C. Maxwell Stanley Hydraulics Laboratory Page 28
Iowa City, Iowa 52242-1585 USA
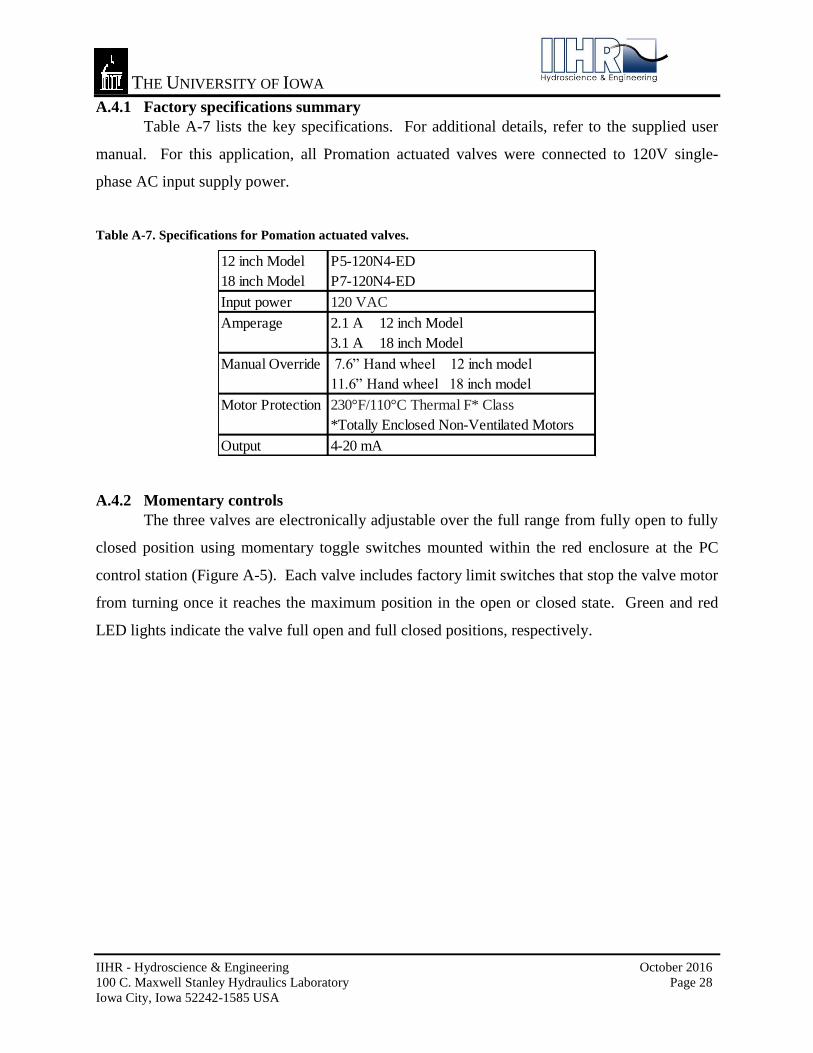
A.4.1 Factory specifications summary
Table A-7 lists the key specifications. For additional details, refer to the supplied user
manual. For this application, all Promation actuated valves were connected to 120V single-
phase AC input supply power.
Table A-7. Specifications for Pomation actuated valves.
12 inch Model P5-120N4-ED
18 inch Model P7-120N4-ED
Input power 120 VAC
2.1 A 12 inch Model
3.1 A 18 inch Model
7.6” Hand wheel 12 inch model
11.6” Hand wheel 18 inch model
230°F/110°C Thermal F* Class
*Totally Enclosed Non-Ventilated Motors
Output 4-20 mA
Amperage
Manual Override
Motor Protection
A.4.2 Momentary controls
The three valves are electronically adjustable over the full range from fully open to fully
closed position using momentary toggle switches mounted within the red enclosure at the PC
control station (Figure A-5). Each valve includes factory limit switches that stop the valve motor
from turning once it reaches the maximum position in the open or closed state. Green and red
LED lights indicate the valve full open and full closed positions, respectively.

THE UNIVERSITY OF IOWA
IIHR - Hydroscience & Engineering October 2016
100 C. Maxwell Stanley Hydraulics Laboratory Page 29
Iowa City, Iowa 52242-1585 USA
Figure A-5. Valve Control Toggle Switch Box
A.4.3 Output signals utilized (valve % open indicator)
Each actuated valve outputs a 4-20 mA signal that is converted into a voltage signal by a
250-ohm resistor located the custom I/O printed circuit board (Figure A-15). LabVIEW software
displays each valve’s position in terms of percentage open. Table A-8 lists the signals used to
control and monitor the actuated valves.
Table A-8. Signals for Promation actuated valves
Terminal Description
4-20 OUT Milliamp output for valve position
SIG RTN Milliamp output for valve position
RUN OPEN Control to open valve
OPEN PILOT Signal to green LED that valve is full open
RUN CLSD Control to close valve
CLSD PILOT Signal to red LED that valve is full closed
A.5 Tilting Actuator Description
The tilting mechanism (Figure A-6) installed on the flume consists of two actuator jacks,
Nord electric motor, gearbox, and Yaskawa V1000 VFD (Figure A-8). The gearbox is coupled
to a drive shaft connected to the jacks. The system is designed to provide tilting of the flume
from 0 to 5% slope. The assembly uses a unique double pivoting system to maintain a proper

THE UNIVERSITY OF IOWA
IIHR - Hydroscience & Engineering October 2016
100 C. Maxwell Stanley Hydraulics Laboratory Page 30
Iowa City, Iowa 52242-1585 USA
lifting angle to the structure. The system can be controlled either from LabVIEW (see Appendix
B) or by using the manual push-button control switch connected to the V1000 VFD.
Figure A-6. Tilting actuator for raising and lowering the flume.
A.5.1 Motor and Jacks
The Nord electric motor (model SK 132S/4 CUS) is used to power the gearbox (SK
96272). The 7.5hp motor and gear ratio of 1:8.71 provide approximately 2300 in-lbs of torque.
This system powers the Nook Action Jacks (model 15-MSJ-U 8:1). The jacks are capable of
lifting 15 tons each, with a range of 0-18” of total actuation.
A.5.2 Limit Switches
Four limit switches (Figure A-7) are mounted to the flume structure near the lifting
assembly. Two pairs of limit switches control the upper and lower stop positions. One set of
switches act as the main limit switch set, limiting the flume travel from 0-5% slope. The second
set of limit switches acts as a failsafe if the main set of limit switches fail to stop the upward or
downward travel. The failsafe set of limit switches are connected to the VFD in series with the
emergency stop button. In the highly unlikely event that the main set of limit switches fails to
stop flume travel, the failsafe set of switches will stop the system as if the emergency stop button
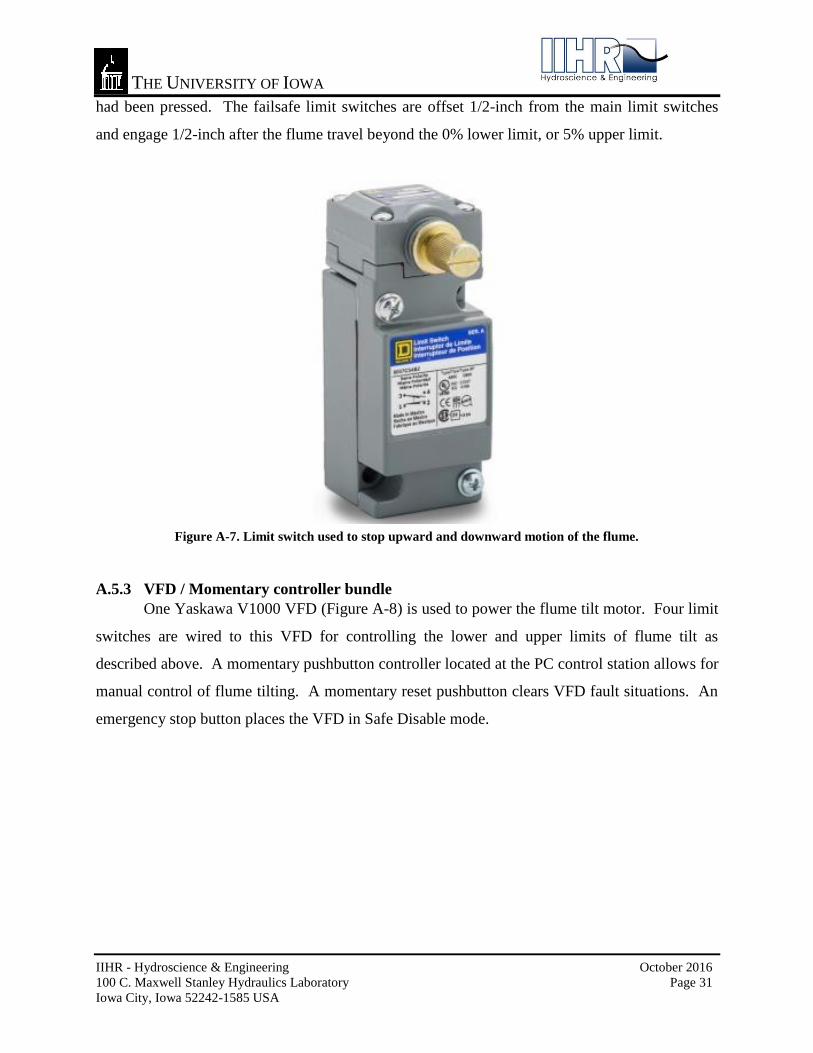
THE UNIVERSITY OF IOWA
IIHR - Hydroscience & Engineering October 2016
100 C. Maxwell Stanley Hydraulics Laboratory Page 31
Iowa City, Iowa 52242-1585 USA
had been pressed. The failsafe limit switches are offset 1/2-inch from the main limit switches
and engage 1/2-inch after the flume travel beyond the 0% lower limit, or 5% upper limit.
Figure A-7. Limit switch used to stop upward and downward motion of the flume.
A.5.3 VFD / Momentary controller bundle
One Yaskawa V1000 VFD (Figure A-8) is used to power the flume tilt motor. Four limit
switches are wired to this VFD for controlling the lower and upper limits of flume tilt as
described above. A momentary pushbutton controller located at the PC control station allows for
manual control of flume tilting. A momentary reset pushbutton clears VFD fault situations. An
emergency stop button places the VFD in Safe Disable mode.

THE UNIVERSITY OF IOWA
IIHR - Hydroscience & Engineering October 2016
100 C. Maxwell Stanley Hydraulics Laboratory Page 32
Iowa City, Iowa 52242-1585 USA
Figure A-8. Yaskawa V1000 VFD used for controlling the motion in tilting the flume.
A.5.4 Specifications
Table A-9 shows the key specifications for the V1000. For additional details, refer to the
supplied user manual. For this application, the VFD is connected to three-phase, 208 Volts AC
power.
Table A-9. Yaskawa V1000 VFD main specifications.
Model CIMR-VU2A0030FAA
Input power 3 phase, 200 to 240 Volts AC
Amperage 37 A
Input/Output Analog and Digital
Operator Controls Keypad Included
A.5.5 Output signals utilized
The following Yaskawa VFD I/O connections utilized for system control signals are
shown in Table A-10. A 1:6 voltage divider installed between terminals V+, A1 and AC
provides constant input voltage of 1.75 V on terminal A1 Figure A-9). This input voltage on
terminal A1 sets the V1000 VFD to fixed 10 Hz when operating the Nord electric motor. A

THE UNIVERSITY OF IOWA
IIHR - Hydroscience & Engineering October 2016
100 C. Maxwell Stanley Hydraulics Laboratory Page 33
Iowa City, Iowa 52242-1585 USA
complete wiring diagram for the V1000, limit switches, push button control and DAQ
connections is provided in Figure A-16.
Figure A-9. Voltage divider resistors installed in the Yaskawa V1000 VFD terminals
Table A-10. Yaskawa V1000 I/O signals utilized for systems control
Terminal Description
S1 Tilt motor forward run / stop (Digital)
S2 Tilt motor reverse run / stop (Digital)
HC Safe disable input power supply (Common)
SC Multi-Function Digital Inputs signal level sequence (Common)
H1 Safe disable input; Open: Output disabled, Closed: Normal operation (Digital)
V+ Input power supply 10.5 Vdc (Analog)
A1 Multi-function input 2 (frequency reference 0-10V) (Analog)
AC Frequency reference (Common)
A.5.6 Tilt VFD Modified Parameter Settings Report
After the VFD was wired to the Nord electric motor, the motor specific parameter E2
(Motor rated Current) was set in the V1000 to 19.8 A. The V1000’s built in Auto-Tune function
was performed as per the setup instructions in the V1000 manual. The Auto-Tune function
optimizes the V1000 to efficiently control a specific motor. Disabling LOCAL operation o2,
eliminates the possibility of the tilt motor being driven by the V1000’s internal control panel.
THE UNIVERSITY OF IOWA
IIHR - Hydroscience & Engineering October 2016
100 C. Maxwell Stanley Hydraulics Laboratory Page 34
Iowa City, Iowa 52242-1585 USA
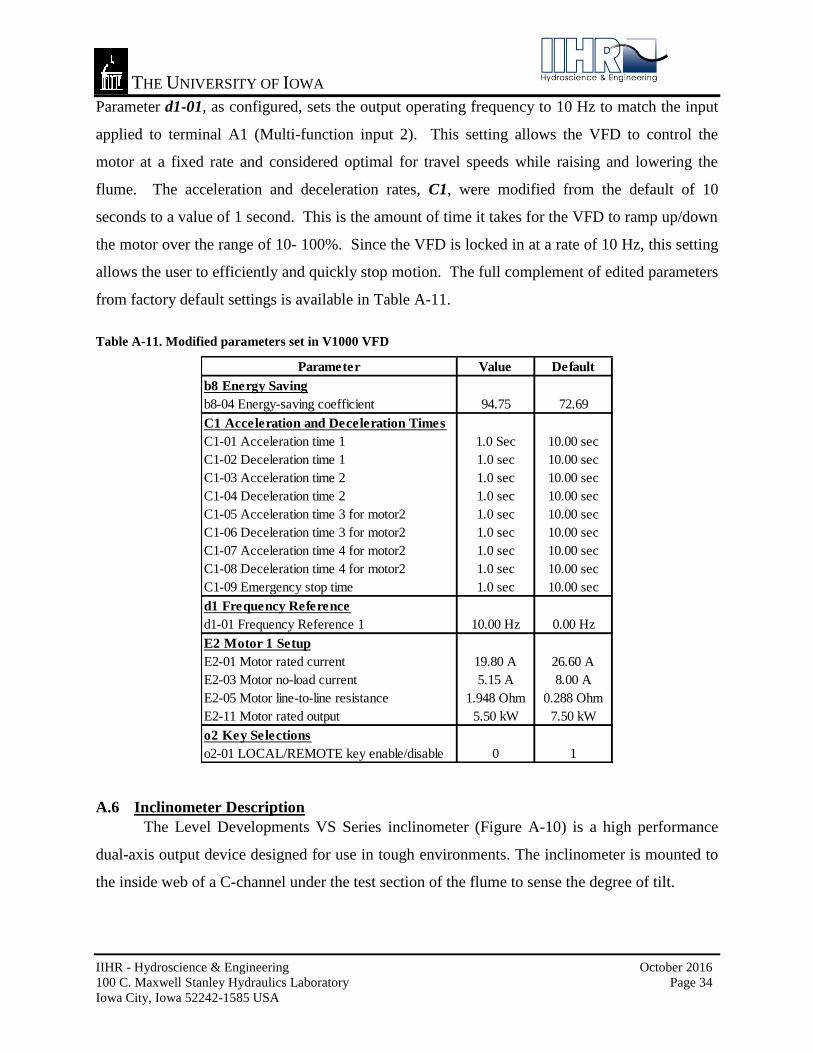
Parameter d1-01, as configured, sets the output operating frequency to 10 Hz to match the input
applied to terminal A1 (Multi-function input 2). This setting allows the VFD to control the
motor at a fixed rate and considered optimal for travel speeds while raising and lowering the
flume. The acceleration and deceleration rates, C1, were modified from the default of 10
seconds to a value of 1 second. This is the amount of time it takes for the VFD to ramp up/down
the motor over the range of 10- 100%. Since the VFD is locked in at a rate of 10 Hz, this setting
allows the user to efficiently and quickly stop motion. The full complement of edited parameters
from factory default settings is available in Table A-11.
Table A-11. Modified parameters set in V1000 VFD
Parameter Value Default
b8 Energy Saving
b8-04 Energy-saving coefficient 94.75 72.69
C1 Acceleration and Deceleration Times
C1-01 Acceleration time 1 1.0 Sec 10.00 sec
C1-02 Deceleration time 1 1.0 sec 10.00 sec
C1-03 Acceleration time 2 1.0 sec 10.00 sec
C1-04 Deceleration time 2 1.0 sec 10.00 sec
C1-05 Acceleration time 3 for motor2 1.0 sec 10.00 sec
C1-06 Deceleration time 3 for motor2 1.0 sec 10.00 sec
C1-07 Acceleration time 4 for motor2 1.0 sec 10.00 sec
C1-08 Deceleration time 4 for motor2 1.0 sec 10.00 sec
C1-09 Emergency stop time 1.0 sec 10.00 sec
d1 Frequency Reference
d1-01 Frequency Reference 1 10.00 Hz 0.00 Hz
E2 Motor 1 Setup
E2-01 Motor rated current 19.80 A 26.60 A
E2-03 Motor no-load current 5.15 A 8.00 A
E2-05 Motor line-to-line resistance 1.948 Ohm 0.288 Ohm
E2-11 Motor rated output 5.50 kW 7.50 kW
o2 Key Selections
o2-01 LOCAL/REMOTE key enable/disable 0 1
A.6 Inclinometer Description
The Level Developments VS Series inclinometer (Figure A-10) is a high performance
dual-axis output device designed for use in tough environments. The inclinometer is mounted to
the inside web of a C-channel under the test section of the flume to sense the degree of tilt.

THE UNIVERSITY OF IOWA
IIHR - Hydroscience & Engineering October 2016
100 C. Maxwell Stanley Hydraulics Laboratory Page 35
Iowa City, Iowa 52242-1585 USA
Figure A-10. Inclinometer used for measuring the tilt angle of the flume
A.6.1 General Specifications
Table A-12 shows the key specifications for the VS Series inclinometer. For additional
information, refer to the supplied user manual. For this application, the VS Series inclinometer
is connected to a regulated 24 VDC power supply located in the electronics enclosure (Figure A-
11).
Table A-12. Specifications of VS series inclinometer
Model VS-10-C-1-3
Input power 12-30 Volts DC
Amperage 68 mA
Range ±10°
Accuracy ±0.03° (@20°C )
Resolution 0.001° (@1Hz BW)
Output RS232 & 0-5VDC
A.6.2 Ouput Signals
The range of operation for this model sensor is ±10 degrees. Output data from the
inclinometer is communicated to the control PC via the RS232 connection and can be viewed
using the vendor-supplied software installed on the control PC. In addition, LabVIEW programs
utilize the voltage output from the sensor and translate the output voltage to an angle
measurement. A summary of the signals utilized from the inclinometer is provided in Table A-
13.

THE UNIVERSITY OF IOWA
IIHR - Hydroscience & Engineering October 2016
100 C. Maxwell Stanley Hydraulics Laboratory Page 36
Iowa City, Iowa 52242-1585 USA
Table A-13. Signals utilized on VS Series Inclinometer
Terminal Description
Red Power Supply +ve
Black Power Supply GND
Brown Transmit Serial: DB9 Pin 2
Blue Receive Serial: DB9 Pin 3
Green Signal GND and Serial: DB9 Pin 5 GND
Orange X-axis analogue output 0-5 V (Analog)

THE UNIVERSITY OF IOWA
IIHR - Hydroscience & Engineering October 2016
100 C. Maxwell Stanley Hydraulics Laboratory Page 37
Iowa City, Iowa 52242-1585 USA
A.7 Schematics and Wiring Diagrams
Figure A-11. Electronics control enclosure

THE UNIVERSITY OF IOWA
IIHR - Hydroscience & Engineering October 2016
100 C. Maxwell Stanley Hydraulics Laboratory Page 38
Iowa City, Iowa 52242-1585 USA
Figure A-12. Wiring diagram for all DAQ connections

THE UNIVERSITY OF IOWA
IIHR - Hydroscience & Engineering October 2016
100 C. Maxwell Stanley Hydraulics Laboratory Page 39
Iowa City, Iowa 52242-1585 USA
Figure A-13. Senix manufactured ultrasonic termination board used to power and interface with Senix
ultrasonic transducers, one board per transducer

THE UNIVERSITY OF IOWA
IIHR - Hydroscience & Engineering October 2016
100 C. Maxwell Stanley Hydraulics Laboratory Page 40
Iowa City, Iowa 52242-1585 USA
Figure A-14. Wiring diagram between pump VFD and B&B wireless I/O system

THE UNIVERSITY OF IOWA
IIHR - Hydroscience & Engineering October 2016
100 C. Maxwell Stanley Hydraulics Laboratory Page 41
Iowa City, Iowa 52242-1585 USA
Figure A-15. Flume electronics I/O printed circuit board used to translate sensor current outputs to voltage
outputs. The board provides power to the inclinometer sensor and communications to the control PC

THE UNIVERSITY OF IOWA
IIHR - Hydroscience & Engineering October 2016
100 C. Maxwell Stanley Hydraulics Laboratory Page 42
Iowa City, Iowa 52242-1585 USA
Figure A-16. Wiring diagram for tilting VFD, limit switches and pushbutton control which control the tilt
angle of the flume
THE UNIVERSITY OF IOWA
IIHR - Hydroscience & Engineering October 2016
100 C. Maxwell Stanley Hydraulics Laboratory Page 43
Iowa City, Iowa 52242-1585 USA
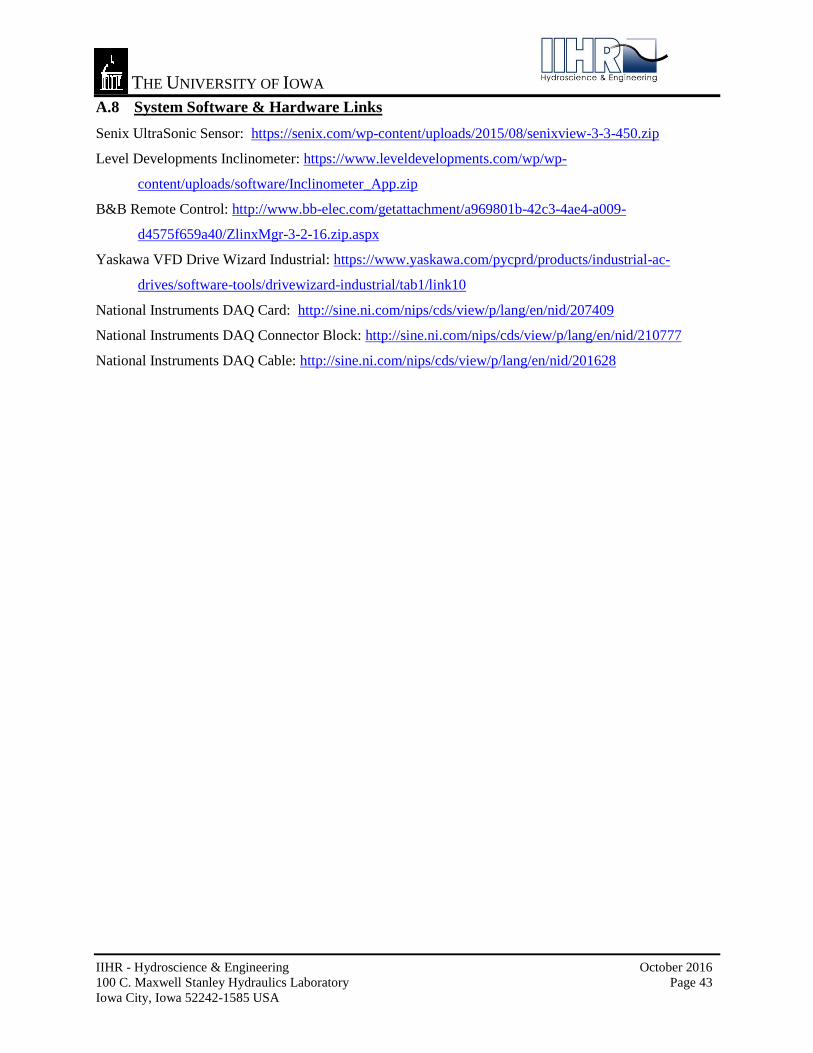
A.8 System Software & Hardware Links
Senix UltraSonic Sensor: https://senix.com/wp-content/uploads/2015/08/senixview-3-3-450.zip
Level Developments Inclinometer: https://www.leveldevelopments.com/wp/wp-
content/uploads/software/Inclinometer_App.zip
B&B Remote Control: http://www.bb-elec.com/getattachment/a969801b-42c3-4ae4-a009-
d4575f659a40/ZlinxMgr-3-2-16.zip.aspx
Yaskawa VFD Drive Wizard Industrial: https://www.yaskawa.com/pycprd/products/industrial-ac-
drives/software-tools/drivewizard-industrial/tab1/link10
National Instruments DAQ Card: http://sine.ni.com/nips/cds/view/p/lang/en/nid/207409
National Instruments DAQ Connector Block: http://sine.ni.com/nips/cds/view/p/lang/en/nid/210777
National Instruments DAQ Cable: http://sine.ni.com/nips/cds/view/p/lang/en/nid/201628

THE UNIVERSITY OF IOWA
IIHR - Hydroscience & Engineering October 2016
100 C. Maxwell Stanley Hydraulics Laboratory Page 44
Iowa City, Iowa 52242-1585 USA
APPENDIX B: COMPUTER CONTROLS AND DATA ACQUISITION

THE UNIVERSITY OF IOWA
IIHR - Hydroscience & Engineering October 2016
100 C. Maxwell Stanley Hydraulics Laboratory Page 45
Iowa City, Iowa 52242-1585 USA
B. COMPUTER CONTROLS AND DATA ACQUISITION
B.1 Graphical User Interface (GUI) and LabVIEW Description
While there is no better documentation of a program than the illustrated source code,
descriptions of the various routines are provided here for convenience and quick access. Most
controls, indicators, variables, and algorithms are well commented in LabVIEW and are best
viewed in that environment.
The source code was written in LabVIEW 2015 and down versioned to 2012 for use at
ISU. There are two top-level virtual instruments (VI’s) and a number of sub-VI’s. In addition, a
large number of standard LabVIEW library routines are called. These are not altered in any way
and should be part of any LabVIEW installation so they are not documented here.
The hardware interface code uses the DAQMx libraries supplied with LabVIEW. These
handle the low-level analog signal acquisition, analog output, and the digital input/output duties.
The code should be easily transportable between different computers with only a
(possible) change in A/D interface board settings being required. The performance of any new or
replacement A/D board should be similar to those of the current NI board. The programs are
built with the expectation of certain analog and digital signals being provided on specific
hardware channels. Changing these will result in failure of the program to control the flume
properly.
B.2 Functions of the GUI and LabVIEW Program
The primary goal of the GUI in the LabVIEW program is to assist the operator in safely
and repeatability achieving a desired flow state at the test section. The code is dedicated to flume
operations and should not be altered for any other tasks. It is assumed that any electronic data
acquisition will occur using a different system. It is possible for the user to do data acquisition on
unused channels of the supplied data acquisition board, however it is recommend to use a
different system altogether.
Proper operation of the program is dependent upon the underlying hardware, sensors, and
connections. This is a complex system and there are no fool-proof protocols that can be invoked
blindly. The operator is cautioned to carefully inspect the state of the system prior to operation
and to be prepared for emergency shutdown if needed.

THE UNIVERSITY OF IOWA
IIHR - Hydroscience & Engineering October 2016
100 C. Maxwell Stanley Hydraulics Laboratory Page 46
Iowa City, Iowa 52242-1585 USA
This program assumes the operator has verified that the system is in good order and
functioning properly.
B.2.1 General
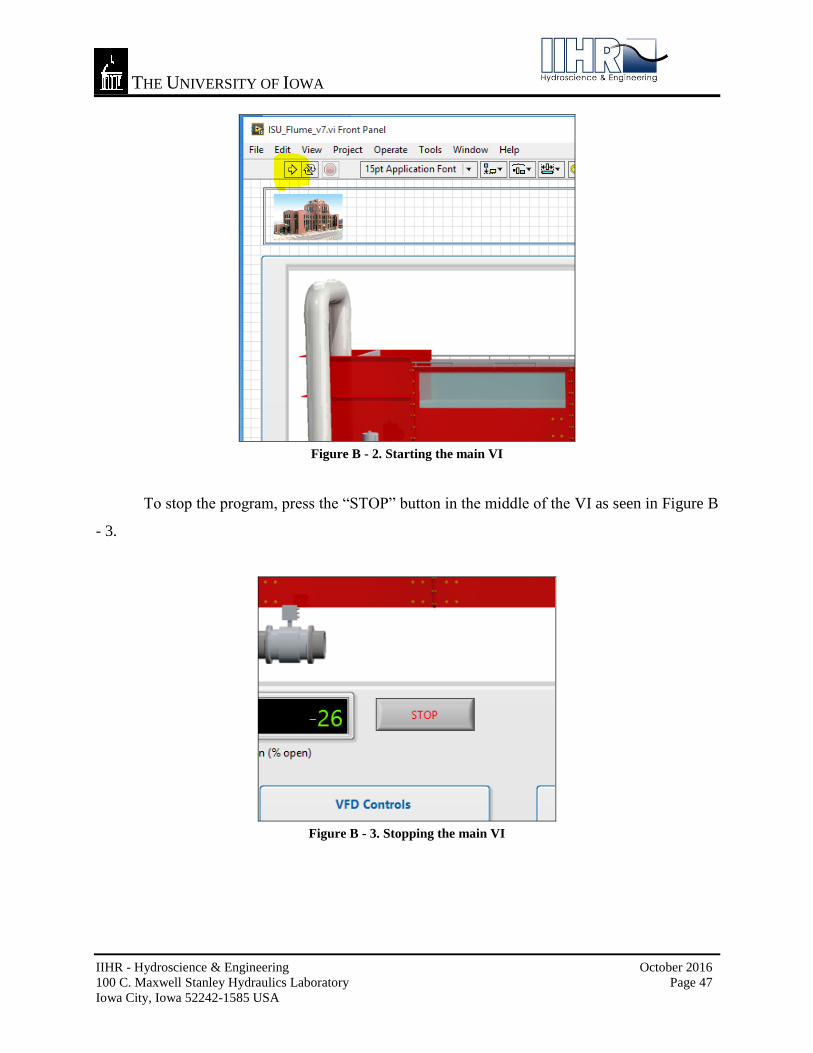
The main program GUI is shown in Figure B - 1. To start the program, press the “run”
arrow at the upper left of the VI screen, high-lighted in yellow in Figure B - 2.
Figure B - 1. Main user interface
THE UNIVERSITY OF IOWA
IIHR - Hydroscience & Engineering October 2016
100 C. Maxwell Stanley Hydraulics Laboratory Page 47
Iowa City, Iowa 52242-1585 USA
Figure B - 2. Starting the main VI
To stop the program, press the “STOP” button in the middle of the VI as seen in Figure B
- 3.
Figure B - 3. Stopping the main VI
THE UNIVERSITY OF IOWA
IIHR - Hydroscience & Engineering October 2016
100 C. Maxwell Stanley Hydraulics Laboratory Page 48
Iowa City, Iowa 52242-1585 USA
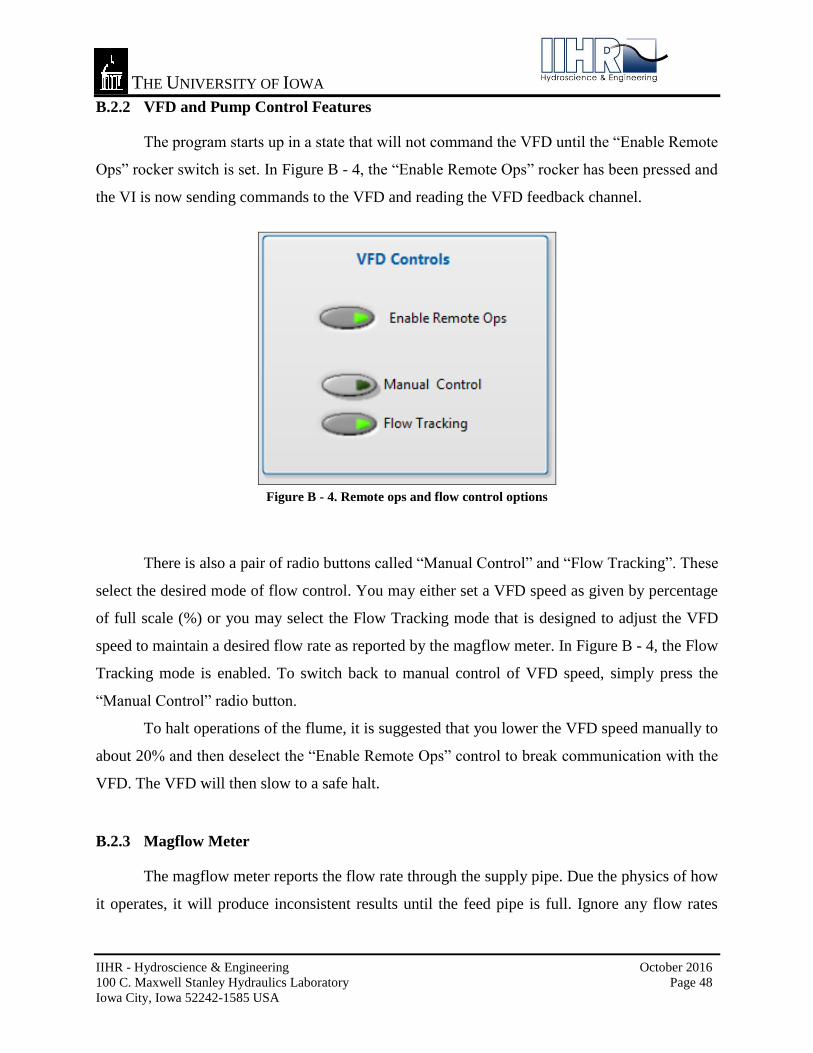
B.2.2 VFD and Pump Control Features
The program starts up in a state that will not command the VFD until the “Enable Remote
Ops” rocker switch is set. In Figure B - 4, the “Enable Remote Ops” rocker has been pressed and
the VI is now sending commands to the VFD and reading the VFD feedback channel.
Figure B - 4. Remote ops and flow control options
There is also a pair of radio buttons called “Manual Control” and “Flow Tracking”. These
select the desired mode of flow control. You may either set a VFD speed as given by percentage
of full scale (%) or you may select the Flow Tracking mode that is designed to adjust the VFD
speed to maintain a desired flow rate as reported by the magflow meter. In Figure B - 4, the Flow
Tracking mode is enabled. To switch back to manual control of VFD speed, simply press the
“Manual Control” radio button.
To halt operations of the flume, it is suggested that you lower the VFD speed manually to
about 20% and then deselect the “Enable Remote Ops” control to break communication with the
VFD. The VFD will then slow to a safe halt.
B.2.3 Magflow Meter
The magflow meter reports the flow rate through the supply pipe. Due the physics of how
it operates, it will produce inconsistent results until the feed pipe is full. Ignore any flow rates

THE UNIVERSITY OF IOWA
IIHR - Hydroscience & Engineering October 2016
100 C. Maxwell Stanley Hydraulics Laboratory Page 49
Iowa City, Iowa 52242-1585 USA
presented until the “Pipe Full” indicator is illuminated. In Figure B - 5, the pipe is not yet full
and the flow rate is not valid.
Figure B - 5. Flow rate display
B.2.4 Manual and Flow Tracking Control Modes
The desired mode of flow control may be either 1) Manual Control set a VFD speed as
given by percentage of full scale (%) and monitor the flow rate or 2) Flow Tracking the
desired flow rate is entered and the VI attempts to adjust the VFD speed to maintain the specified
flow rate as reported by the magflow meter.
The program takes the current state of operation of the VFD, including values from
pervious iterations, and computes a new set of operational parameters to provide a tracking
feature for VFD operations. This is essentially a “Proportional” or “P” controller as the slow rate
of change of the system did not require a full “Proportional-Integral-Derivative” or “PID”
control system.
Manual VFD speed control is the start-up condition and is indicated by the high-lighted
“Manual Control” radio button on the right of Figure B - 6.

THE UNIVERSITY OF IOWA
IIHR - Hydroscience & Engineering October 2016
100 C. Maxwell Stanley Hydraulics Laboratory Page 50
Iowa City, Iowa 52242-1585 USA
Figure B - 6. VFD manual flow control operations
Once the “Enable Remote Ops” button is selected you may set a VFD speed, in % of full
scale, just under the “VFD Speed and Feedback (%)” dial. The above control is set to 32.0 % of
full scale. The red needle indicates the desired VFD speed and the black needle shows what the
VFD is reporting as its current speed. The black needle will approach the red needle according to
the VFD ramp-up and ramp-down limiting rates in the VI. When the feedback reaches the
desired setting the “TARGET Attained” indicator will illuminate. The flow rate observed is
presented just above the dial indicator as seen in Figure B - 5.
The second mode of operation is to allow the VI to control the VFD to maintain a
specified flow rate. You select this mode of operation by pressing the “Flow Tracking” radio
button as in Figure B - 7.

THE UNIVERSITY OF IOWA
IIHR - Hydroscience & Engineering October 2016
100 C. Maxwell Stanley Hydraulics Laboratory Page 51
Iowa City, Iowa 52242-1585 USA
Figure B - 7. VFD operations set to Flow Tracking
The dial changes to reflect flow rates rather than VFD speed as in Figure B - 8.
Figure B - 8. Flow Tracking mode of operation
In this case the VFD will be commanded to speed up or slow down to reach a given,
desired flow rate set point, “Flow Set Point”. Again, the red needle indicates the desired setting
and the black needle indicates the VFD feedback computed flow rate.
You may switch back and forth between the manual control and Flow Tracking control
whenever you wish. The flow rate set point will be whatever flow rate the system was

THE UNIVERSITY OF IOWA
IIHR - Hydroscience & Engineering October 2016
100 C. Maxwell Stanley Hydraulics Laboratory Page 52
Iowa City, Iowa 52242-1585 USA
experiencing when the switch from manual to tracking was selected. Similarly, the VFD setting
will be whatever it was when the switch back to manual was selected. This keeps the pump and
flow at the same rate as we transition between modes of operation.
B.2.5 Ultrasonic Level Sensors
Three ultrasonic level sensors are utilized to calculate water levels in the test section
(Figure B - 9) and sumps A and B (Figure B - 10). Each sensor is calibrated and mounted with
calibration and offset values set in the calibration sub-VI. The current water levels are reported to
the front panel.
Figure B - 9. Test section depth indicator
Figure B - 10. Sump depth indicators
B.2.6 Actuated Valves
The three actuated valves report the percentage open and are displayed on the front panel.
The position of the 12-inch valve in the supply pipe is denoted as “Valve In (% open)” as seen in
Figure B - 11. The sump A and sump B valve positions are reported as shown Figure B - 12.

THE UNIVERSITY OF IOWA
IIHR - Hydroscience & Engineering October 2016
100 C. Maxwell Stanley Hydraulics Laboratory Page 53
Iowa City, Iowa 52242-1585 USA
Figure B - 11. 12-inch supply pipe valve opening (%)
Figure B - 12. Sump A and B valve opening (%)
B.2.7 Jack Control - Tilting
There is an independent jack control program provided for moving the flume by
extending or contracting the jack (Figure B - 13). Be sure to run this VI independently from the
main control interface as it relies on the same hardware and connections, and therefore cannot
run coincidentally with the main VI.
This routine takes the target flume slope (%) as user input and moves the jack
accordingly to achieve the specified slope. The move time and move distance are displayed so
the operator can observe the jack motion. The STOP button will halt the jack motion.
THE UNIVERSITY OF IOWA
IIHR - Hydroscience & Engineering October 2016
100 C. Maxwell Stanley Hydraulics Laboratory Page 54
Iowa City, Iowa 52242-1585 USA
Figure B - 13. Jack Control main user interface
B.2.8 Inclinometer
The jack control VI as well as the main VI use a mounted digital inclinometer to
continuously measure the flume slope. Vendor software is provided that will permit you to re-
zero the inclinometer if readings appear questionable or remounting becomes necessary. This is
done through an RS-232 interface and will not impact the VI’s since they utilize the
inclinometer’s voltage output signal.
B.3 Main Control Program Features and Details
The main control program VI and its supporting VI’s are described here in detail. The
following sub-sections show the front panel for each routine. The data types and significant
parameters may be seen from the block diagrams. Since LabVIEW is polymorphic, it is
important to keep the specific data types in mind as you read the block diagrams.

THE UNIVERSITY OF IOWA
IIHR - Hydroscience & Engineering October 2016
100 C. Maxwell Stanley Hydraulics Laboratory Page 55
Iowa City, Iowa 52242-1585 USA
Each section below shows the block diagram icon and the input and output variables for
each routine. The front panel of each VI is also shown with sample data and results.
The main VI (ISU_Flume_v7.vi) opens with a main operator’s view on the left of the
screen and a configuration and monitoring view on the right (Figure B - 14). The right of the
screen consists of a several tabbed pages. The contents of each page may be displayed by
pressing the corresponding tab at the top.
Figure B - 14. Main user interface
Key elements of the front panel interface include a visualization of the flume slope: the
flume image tilts corresponding to the slope of the actual flume in 0.5 degree increments; a
Boolean indicator when the feed pipe is full; a number of digital indicators – black with green
lettering – showing the flume’s state of operation (e.g., valve closures, sump depths, test section
depth, average flow velocity, Froude Number, Reynolds Number; a dial showing VFD speed,
both in the control and tracking modes; several Boolean rocker switches controlling remote
operations, and manual or tracking control modes. A close-up view of the primary operator
interface is shown in Figure B - 15.

THE UNIVERSITY OF IOWA
IIHR - Hydroscience & Engineering October 2016
100 C. Maxwell Stanley Hydraulics Laboratory Page 56
Iowa City, Iowa 52242-1585 USA
Figure B - 15. Primary operator interface

THE UNIVERSITY OF IOWA
IIHR - Hydroscience & Engineering October 2016
100 C. Maxwell Stanley Hydraulics Laboratory Page 57
Iowa City, Iowa 52242-1585 USA
B.3.1 Info Tab
The “Info” page summarizes information relating to the operation of the flume and a
quick statement of operational startup and shutdown procedures (Figure B - 16).
Figure B - 16. Information tab

THE UNIVERSITY OF IOWA
IIHR - Hydroscience & Engineering October 2016
100 C. Maxwell Stanley Hydraulics Laboratory Page 58
Iowa City, Iowa 52242-1585 USA
B.3.2 A/I Tab
The analog input page shows the current settings for the National Instruments hardware
for the differential channels, single-ended channels, and hardware timing. See Figure B - 17.
These settings come from a configuration sub-VI described later.
Figure B - 17. Analog input information tab

THE UNIVERSITY OF IOWA
IIHR - Hydroscience & Engineering October 2016
100 C. Maxwell Stanley Hydraulics Laboratory Page 59
Iowa City, Iowa 52242-1585 USA
B.3.3 A/O Tab
The analog output page shows the current settings for the National Instruments hardware
for the analog output channels related to VFD control. See Figure B - 18. These settings come
from a configuration sub-VI described later.
Figure B - 18. Analog output information tab

THE UNIVERSITY OF IOWA
IIHR - Hydroscience & Engineering October 2016
100 C. Maxwell Stanley Hydraulics Laboratory Page 60
Iowa City, Iowa 52242-1585 USA
B.3.4 DIO Tab
The digital input/output page shows the current settings for the National Instruments
hardware for the digital input and output channels related to VFD control and feedback. See
Figure B - 19. These settings come from a configuration sub-VI described later.
Figure B - 19. Digital input and output information tab

THE UNIVERSITY OF IOWA
IIHR - Hydroscience & Engineering October 2016
100 C. Maxwell Stanley Hydraulics Laboratory Page 61
Iowa City, Iowa 52242-1585 USA
B.3.5 XSonic Tab
The XSonic page summarizes the geometric offsets used in the mounting of the sump
ultrasonic water level sensors. A small diagram of the mounting geometry is provided in Figure
B - 20. These settings come from a configuration sub-VI described later.
Figure B - 20. Ultrasonic probe information tab
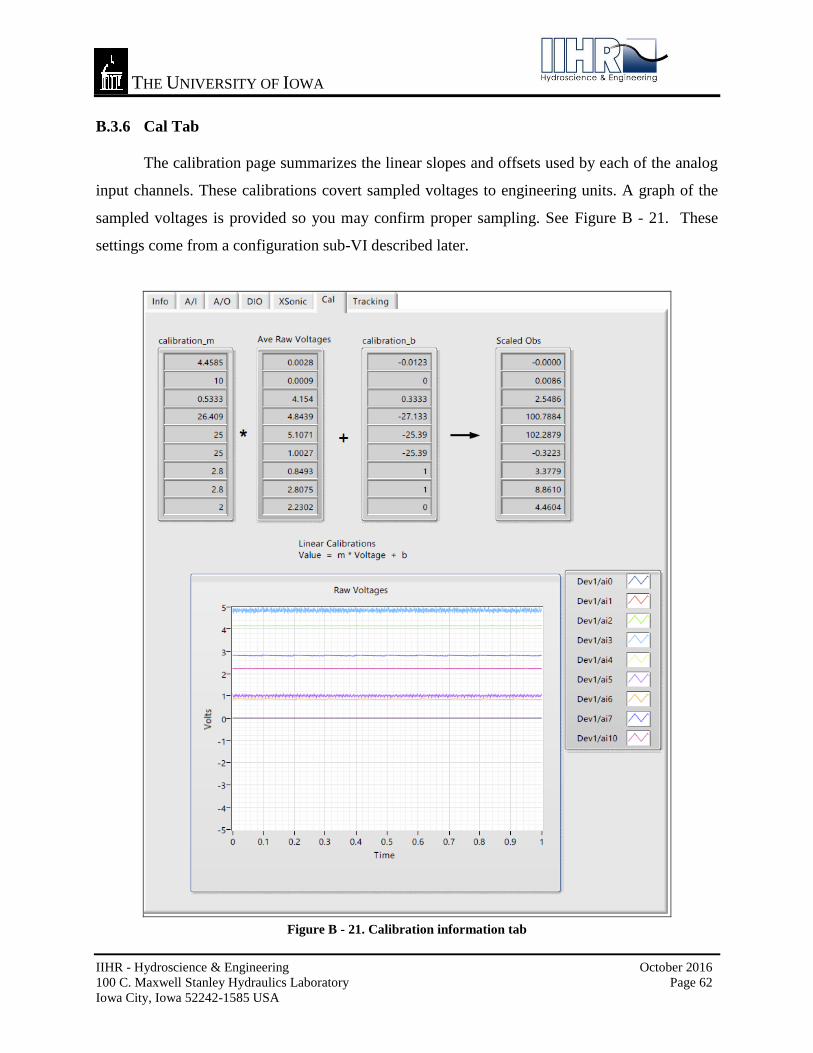
THE UNIVERSITY OF IOWA
IIHR - Hydroscience & Engineering October 2016
100 C. Maxwell Stanley Hydraulics Laboratory Page 62
Iowa City, Iowa 52242-1585 USA
B.3.6 Cal Tab
The calibration page summarizes the linear slopes and offsets used by each of the analog
input channels. These calibrations covert sampled voltages to engineering units. A graph of the
sampled voltages is provided so you may confirm proper sampling. See Figure B - 21. These
settings come from a configuration sub-VI described later.
Figure B - 21. Calibration information tab

THE UNIVERSITY OF IOWA
IIHR - Hydroscience & Engineering October 2016
100 C. Maxwell Stanley Hydraulics Laboratory Page 63
Iowa City, Iowa 52242-1585 USA
B.3.7 Tracking Tab
The tracking page summarizes the control settings and feedback used by the Flow
Tracking mode of operation. A graph of the VFD speed and the state of the tracker is provided so
you may confirm proper operation. See Figure B - 22. These settings come from a configuration
sub-VI described later.
Figure B - 22. Tracking mode information tab
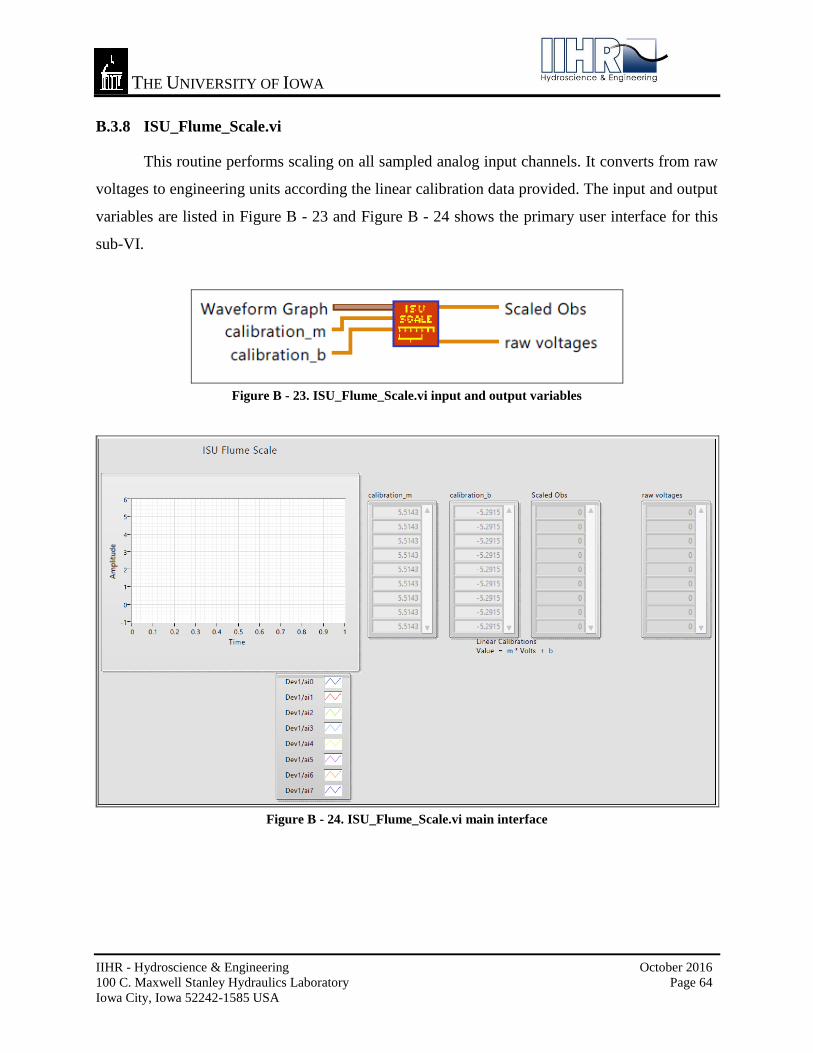
THE UNIVERSITY OF IOWA
IIHR - Hydroscience & Engineering October 2016
100 C. Maxwell Stanley Hydraulics Laboratory Page 64
Iowa City, Iowa 52242-1585 USA
B.3.8 ISU_Flume_Scale.vi
This routine performs scaling on all sampled analog input channels. It converts from raw
voltages to engineering units according the linear calibration data provided. The input and output
variables are listed in Figure B - 23 and Figure B - 24 shows the primary user interface for this
sub-VI.
Figure B - 23. ISU_Flume_Scale.vi input and output variables
Figure B - 24. ISU_Flume_Scale.vi main interface

THE UNIVERSITY OF IOWA
IIHR - Hydroscience & Engineering October 2016
100 C. Maxwell Stanley Hydraulics Laboratory Page 65
Iowa City, Iowa 52242-1585 USA
B.3.9 ISU_Flume_Set_Config.vi
This VI defines many of the operational parameters for the main program. This is the
place where most configuration values are defined for other program units to use. Each value is
defined on the left of the display screen and echoed on the right as they are passed back to the
calling routine. The input and output variables are listed in Figure B - 25 and Figure B - 26
shows the primary user interface for this sub-VI.
Figure B - 25. ISU_Flume_Set_Config.vi input and output variables
Figure B - 26. Calibration definitions for display on the front panel

THE UNIVERSITY OF IOWA
IIHR - Hydroscience & Engineering October 2016
100 C. Maxwell Stanley Hydraulics Laboratory Page 66
Iowa City, Iowa 52242-1585 USA
Figure B – 26 cont. Calibration definitions for display on the front panel

THE UNIVERSITY OF IOWA
IIHR - Hydroscience & Engineering October 2016
100 C. Maxwell Stanley Hydraulics Laboratory Page 67
Iowa City, Iowa 52242-1585 USA
Figure B – 26 cont. Calibration definitions for display on the front panel
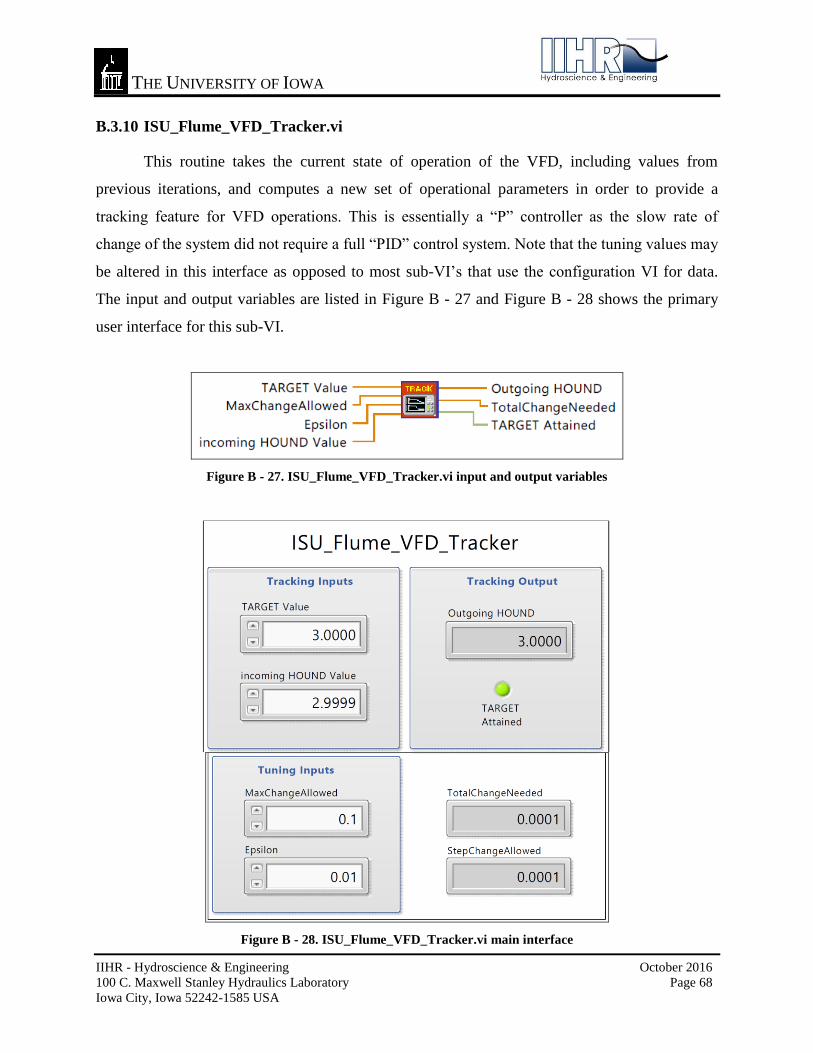
THE UNIVERSITY OF IOWA
IIHR - Hydroscience & Engineering October 2016
100 C. Maxwell Stanley Hydraulics Laboratory Page 68
Iowa City, Iowa 52242-1585 USA
B.3.10 ISU_Flume_VFD_Tracker.vi
This routine takes the current state of operation of the VFD, including values from
previous iterations, and computes a new set of operational parameters in order to provide a
tracking feature for VFD operations. This is essentially a “P” controller as the slow rate of
change of the system did not require a full “PID” control system. Note that the tuning values may
be altered in this interface as opposed to most sub-VI’s that use the configuration VI for data.
The input and output variables are listed in Figure B - 27 and Figure B - 28 shows the primary
user interface for this sub-VI.
Figure B - 27. ISU_Flume_VFD_Tracker.vi input and output variables
Figure B - 28. ISU_Flume_VFD_Tracker.vi main interface

THE UNIVERSITY OF IOWA
IIHR - Hydroscience & Engineering October 2016
100 C. Maxwell Stanley Hydraulics Laboratory Page 69
Iowa City, Iowa 52242-1585 USA
B.3.11 ISU_Flume_Error_States.vi
Several significant error states are observed during flume operations. There are minimum
values for each sump and the test section to ensure that an alarm is raised if the sumps get too
low or water is draining from the test section due to a leak or other incident. In order to
distinguish between low flow in the test section at start-up versus low flow later in a run there is
a minimum run time before this alarm is raised. The input and output variables are listed in
Figure B - 29 and Figure B - 30 shows the primary user interface for this sub-VI.
Figure B - 29. ISU_Flume_Error_States.vi input and out variables
Figure B - 30. ISU_Flume_Error_States.vi main user interface

THE UNIVERSITY OF IOWA
IIHR - Hydroscience & Engineering October 2016
100 C. Maxwell Stanley Hydraulics Laboratory Page 70
Iowa City, Iowa 52242-1585 USA
B.3.12 ISU_Flume_Flow_Stats.vi
This routine computes several flow statistics at each iteration for display on the main
panel. The input and output variables are listed in Figure B - 31 and Figure B - 32 shows the
primary user interface for this sub-VI.
Figure B - 31. ISU_Flume_Flow_Stats.vi input and output variables
Figure B - 32. ISU_Flume_Flow_Stats.vi main user interface

THE UNIVERSITY OF IOWA
IIHR - Hydroscience & Engineering October 2016
100 C. Maxwell Stanley Hydraulics Laboratory Page 71
Iowa City, Iowa 52242-1585 USA
B.4 Tilting/Slope Control Program Features and Details
B.4.1 ISU_Flume_jack_control_v1.vi
This is a top-level routine and runs independently of the main VI. This VI cannot be run
while the main VI is running, as described previously. Figure B - 33 shows the primary user
interface.
Figure B - 33. ISU_Flume_jack_control_v1.vi main user interface
B.4.2 ISU_Flume_write_DO.vi
This routine is used to implement the jack motion. The Boolean logic and resulting
motion is explained on the front panel. The input and output variables are listed in Figure B - 34
and Figure B - 35 shows the primary user interface for this sub-VI.
Figure B - 34. ISU_Flume_write_DO.vi input and output variables

THE UNIVERSITY OF IOWA
IIHR - Hydroscience & Engineering October 2016
100 C. Maxwell Stanley Hydraulics Laboratory Page 72
Iowa City, Iowa 52242-1585 USA
Figure B - 35. ISU_Flume_write_DO.vi main user interface
B.4.3 ISU_Flume_get_current_slope.vi
This routine reads the digital protractor are displays the measured angle and resulting
slope. The input and output variables are listed in Figure B - 36 and Figure B - 37 shows the
primary user interface for this sub-VI.
Figure B - 36. ISU_Flume_get_current_slope.vi input and output variables

THE UNIVERSITY OF IOWA
IIHR - Hydroscience & Engineering October 2016
100 C. Maxwell Stanley Hydraulics Laboratory Page 73
Iowa City, Iowa 52242-1585 USA
Figure B - 37. ISU_Flume_get_current_slope.vi main user interface

THE UNIVERSITY OF IOWA
IIHR - Hydroscience & Engineering October 2016
100 C. Maxwell Stanley Hydraulics Laboratory Page 74
Iowa City, Iowa 52242-1585 USA
B.4.4 ISU_Flume_jack_parameters.vi
This sub-vi takes the desired state of the jack and references it to the current state to
determine how long and how far to move the jack. The jack calibration is defined here in terms
of % slope relative displacement of the jack. The input and output variables are listed in Figure B
- 38 and Figure B - 39 shows the primary user interface for this sub-VI.
Figure B - 38. ISU_Flume_jack_parameters.vi input and output variables
Figure B - 39. ISU_Flume_jack_parameters.vi main user interface

THE UNIVERSITY OF IOWA
IIHR - Hydroscience & Engineering October 2016
100 C. Maxwell Stanley Hydraulics Laboratory Page 75
Iowa City, Iowa 52242-1585 USA
B.5 Operational and Safety Features
B.5.1 Manual and Flow Tracking Modes of Operation
In order to maintain a smooth transition between the manual and Flow Tracking control
modes and hence eliminate large step changes in desired VFD speeds, the current state of
operation in one mode is translated to the equivalent state in the target mode. That is to say,
when moving from manual/speed control to Flow Tracking control the reported flow observed in
the manual state is set as the first value in the tracking state. Similarly, when moving from
tracking to manual control, the observed VFD value while in tracking is made to be the value for
the beginning of the manual operation.
B.5.2 VFD/Pump Ramp-up and Ramp-down
There are two control systems covering the VFD start-up and shut-down. One is a pre-
programmed set of ramps in the firmware of the VFD controller itself and the second is in the
LabVIEW program. The VI limits the rate of change of any VFD state to 1% of full scale. This is
to say that if the VFD is operating at 42% then the next commanded VFD state would either be
to 41% or 43% in the next cycle. This keeps the VFD in a safe mode and prevents any large or
sudden changes in speed. The firmware is pre-programmed to serve as a backup in case of
computer failure or other incident. If a sudden change in VFD state is detected (e.g. loss of
power to the computer) the VFD will ramp down following a safe curve. Similarly, if a sudden
increase in VFD state is commanded (unforeseen failure of the computer code) the ramp up will
be follow a safe curve.

THE UNIVERSITY OF IOWA
IIHR - Hydroscience & Engineering October 2016
100 C. Maxwell Stanley Hydraulics Laboratory Page 76
Iowa City, Iowa 52242-1585 USA
APPENDIX C: INSTRUMENT CALIBRATIONS

THE UNIVERSITY OF IOWA
IIHR - Hydroscience & Engineering October 2016
100 C. Maxwell Stanley Hydraulics Laboratory Page 77
Iowa City, Iowa 52242-1585 USA
C. INSTRUMENT CALIBRATIONS
C.1 General Calibration Procedure
Calibration of any electronic instrument included in this design requires the same basic
concept. That is, provide a designated state/condition for the instrument (i.e. open/closed,
high/low, etc.) and measure it’s corresponding electrical response (i.e. voltage). All instruments
included behave in a linear fashion and therefore require only two valid points to be calibrated.
However, it is wise to cover the full range of response from the instrument when doing so, or at
least above and below the range of expected operation (bracketing).
The provided LabVIEW routine “i_Aquire.vi” provides a simple means for instrument
calibration. The program allows the user to interrogate the input channel of interest and provides
raw output signals (i.e. voltages).
An Excel spreadsheet containing all calibrations “Instrument Calibrations 5-26-16.xls” has been
provided.
C.1.1 Magflow meter calibration
As programmed upon installation, the magflow meter is able to measure flows up to
10,000 gpm. 0 – 5 volts corresponds with 0 – 10,000 gpm per factory calibration settings. In this
case, however, the resident voltage while zero flow was occurring was slightly above zero.
Therefore, the actual output voltage with no flow of 0.00276 volts was plotted. The calibration
plot for the magflow meter is included below in Figure C - 1.
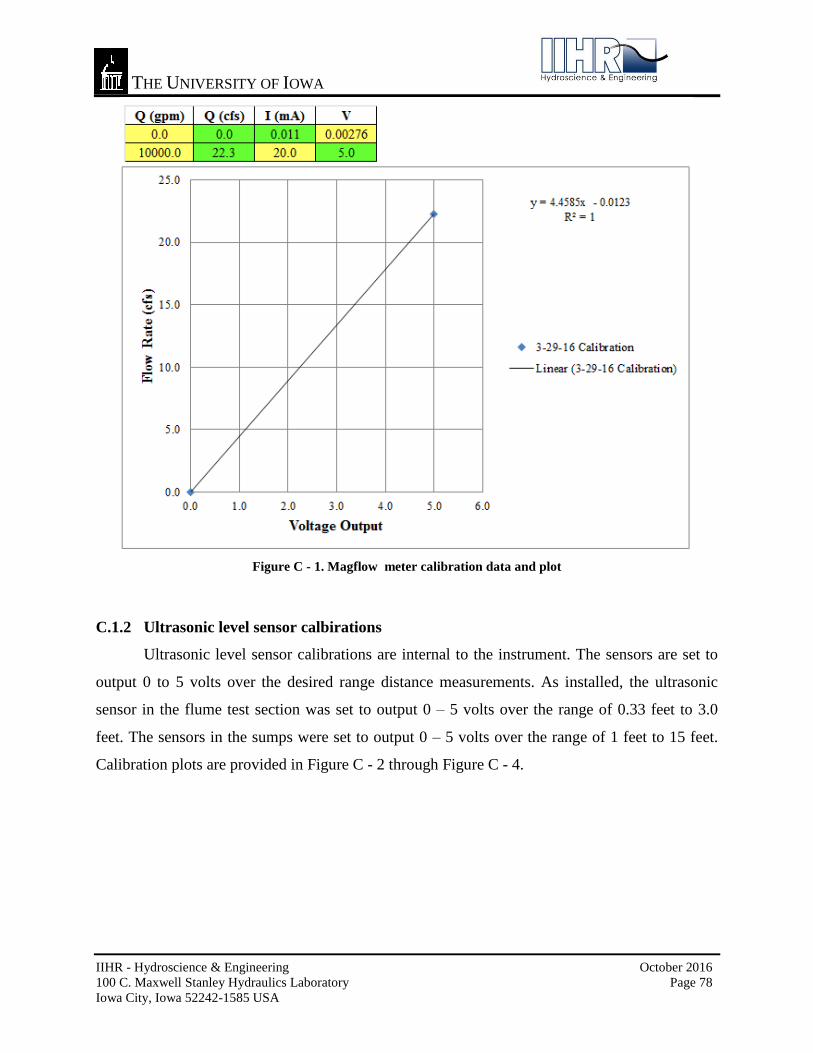
THE UNIVERSITY OF IOWA
IIHR - Hydroscience & Engineering October 2016
100 C. Maxwell Stanley Hydraulics Laboratory Page 78
Iowa City, Iowa 52242-1585 USA
Figure C - 1. Magflow meter calibration data and plot
C.1.2 Ultrasonic level sensor calbirations
Ultrasonic level sensor calibrations are internal to the instrument. The sensors are set to
output 0 to 5 volts over the desired range distance measurements. As installed, the ultrasonic
sensor in the flume test section was set to output 0 – 5 volts over the range of 0.33 feet to 3.0
feet. The sensors in the sumps were set to output 0 – 5 volts over the range of 1 feet to 15 feet.
Calibration plots are provided in Figure C - 2 through Figure C - 4.

THE UNIVERSITY OF IOWA
IIHR - Hydroscience & Engineering October 2016
100 C. Maxwell Stanley Hydraulics Laboratory Page 79
Iowa City, Iowa 52242-1585 USA
Figure C - 2. Flume test section ultrasonic level sensor calibration
Figure C - 3. Sump A ultrasonic level sensor calibration

THE UNIVERSITY OF IOWA
IIHR - Hydroscience & Engineering October 2016
100 C. Maxwell Stanley Hydraulics Laboratory Page 80
Iowa City, Iowa 52242-1585 USA
Figure C - 4. Sump B ultrasonic level sensor calibration
C.1.3 Actuated valve calibrations
The actuated valves were calibrated as installed at ISU by setting each valve to fully open
and fully closed positions and recording their respective output voltages using i_Acquire.vi.
Calibrations for the three actuated valves are provided in Figure C - 5 through Figure C - 7.

THE UNIVERSITY OF IOWA
IIHR - Hydroscience & Engineering October 2016
100 C. Maxwell Stanley Hydraulics Laboratory Page 81
Iowa City, Iowa 52242-1585 USA
Figure C - 5. 12-inch valve calibration
Figure C - 6. 18-inch (Sump A) valve calibration

THE UNIVERSITY OF IOWA
IIHR - Hydroscience & Engineering October 2016
100 C. Maxwell Stanley Hydraulics Laboratory Page 82
Iowa City, Iowa 52242-1585 USA
Figure C - 7. 18-inch (Sump B) valve calibration
C.1.4 Inclinometer calibration
The inclinometer was calibrated as installed at ISU by setting the flume at various slopes
ranging from 0% to just above 5%. The angle as measured by the inclinometer was taken from
the vendor-supplied software. The corresponding output voltages were measured and recorded
using i_Acquire.vi. The resulting calibration plot is provided in Figure C - 8.

THE UNIVERSITY OF IOWA
IIHR - Hydroscience & Engineering October 2016
100 C. Maxwell Stanley Hydraulics Laboratory Page 83
Iowa City, Iowa 52242-1585 USA
Figure C - 8. Inclinometer calibration
C.1.5 Orifice flow meter calibration
The 12-inch by 10.5-inch orifice flow meter was calibrated at Utah State University using
by measuring differential pressures across the meter and plotting against weigh-tank measured
volumetric flow rates. The resulting calibration data and plot are provided in Figure C - 9. The
slope of the line in the calibration plot is the coefficient of discharge for the orifice meter. The
flow rate in cubic feet per second (cfs) is calculated with the following equation:
Where H is measured in feet.

THE UNIVERSITY OF IOWA
IIHR - Hydroscience & Engineering October 2016
100 C. Maxwell Stanley Hydraulics Laboratory Page 84
Iowa City, Iowa 52242-1585 USA
Figure C - 9. Orifice flow meter calibration
THE UNIVERSITY OF IOWA
IIHR - Hydroscience & Engineering October 2016
100 C. Maxwell Stanley Hydraulics Laboratory Page 85
Iowa City, Iowa 52242-1585 USA
APPENDIX D: FLUME MAINTENANCE
THE UNIVERSITY OF IOWA
IIHR - Hydroscience & Engineering October 2016
100 C. Maxwell Stanley Hydraulics Laboratory Page 86
Iowa City, Iowa 52242-1585 USA
D. ISU FLUME MAINTENANCE INSTRUCTIONS
Failure to follow the recommended maintenance guidelines provided in this document
and referenced documents voids all IIHR responsibility. IIHR is providing these maintenance
instructions as suggested guidelines and in no way implies any type of warranty on the materials,
products, or performance of the flume and its components.
Any questions or concerns regarding maintenance or repair advisement can be directed to
the IIHR Shop Manager Brandon Barquist – (319) 984-3273, [email protected]
D.1 Lubrication for Mechanical Components
D.1.1 Pump
In general, the pump is a fairly maintenance free device in a lab situation, given that
the pump is used infrequently compared to an industrial setting of constant operation.
However, preventative maintenance should not be neglected.
The pump consists of two components: an electric motor and pump assembly. These
were provided by two different manufacturers.
The pump has a stuffing box that receives packing glands. These glands should be
replaced every 2000 hours of operation.
The pump has a grease line near the visible portion of the shaft that should receive 2-
3 shots of grease every 3-6 months, depending on use.
The electric motor has an oil reservoir near the top of the motor. The type of fluid is
specified on the motor along with the date of installation. Should that note somehow
be removed, the required fluid is IS0 32 gear oil.
The motor has a grease line and near the bottom of the motor frame that should also
receive 2-3 shots of grease every 3-6 months, depending on use. See the manual listed
below page 24 for a schematic.
Service manuals:
http://apps.motorboss.com/Manuals/in509-1d.pdf
http://www.hydroflopumps.com/downloads/HydrofloFiles/OEMManual_VerticalTurb
ine_2012.pdf
D.1.2 Gearmotor
NORD helical-worm reducers are shipped from the factory with a pre-determined oil
fill level in accordance to the specified reducer size and mounting position. NORD

THE UNIVERSITY OF IOWA
IIHR - Hydroscience & Engineering October 2016
100 C. Maxwell Stanley Hydraulics Laboratory Page 87
Iowa City, Iowa 52242-1585 USA
helical worm gear reducers are filled with ISO VG 680 synthetic-
hydrocarbon/polyalphaolefin (SHC/PAO) worm gear oil.
Oil should be replaced every 20,000 hours or every 4 years of use.
For important information regarding installation, operation and maintenance refer to
Nord Drive Systems Publication U10770 referencing Part No. SK-92672-132S/4
D.1.3 Mechanical Screw Actuators
Grease the assemblies using the recommended lubricant
Lubricate annually or monthly depending on frequency of use. Pump grease until old
grease emerges from the top of the housing. Then run the jacks up and down to insure
the entire working area of the screw is lubricated.
NOTE: Mechanical screws should never be run dry. Inspect frequently at regular
intervals to be certain that a lubrication film is present.
Service manual:
http://www.nookindustries.com/Content/media/MSJ_Booklet_web.pdf
D.1.4 Tailgate Winch
Grease the worm gear with lithium grease.
Lubricate annually or monthly depending on frequency of use.
Run tailgate up and down while flowing water to insure grease is applied to the spool
gear as well.
D.2 Repairs, Parts, or Replacement
Product: Pump: Hydroflo H14PMF and HF12
Manufacturer: Hydroflo Pumps
Manufacturer Contact: www.hydroflopumps.com; 308-398-0920
Vendor: Pumping Solutions
Vendor Contact: 708-272-1800
Product: Gearmotor: SK 92672-132S/4
Manufacturer: Nord Drive Systems
Manufacturer Contact: www.nord.com; (888)314-6673
Vendor: Van Meter Inc.
Vendor Contact: 319-339-1816

THE UNIVERSITY OF IOWA
IIHR - Hydroscience & Engineering October 2016
100 C. Maxwell Stanley Hydraulics Laboratory Page 88
Iowa City, Iowa 52242-1585 USA
Product: Screw Actuators: 15-MSJ-U
Manufacturer: Nook Industries
Manufacturer Contact: www.Nookindustries.com; (800)321-7800
Vendor: Nook Industries (direct purchase)
Product: Tailgate Winch
Vendor: McMaster Carr
Item: www.mcmaster.com/#3205t42/=14r76oc
D.3 Cleaning
Interior
1) When cleaning the interior, always start by rinsing with garden hose and soft bristled
brush.
2) Remove as much sand and abrasive material as possible before scrubbing or rubbing
the glass.
3) Any further scrubbing should be done with non-abrasive tools.
4) De-calcifying cleaners can be used for lime scale, but should be used with caution, as
a spot treatment only, and under the use and concentration of manufacturer's
recommendations only.
Glass
1) Glass can be cleaned with a non-abrasive cloth and a solution intended specifically
for glass.
2) Clean glass according to manufacturer’s recommendations.
3) Permanent marker or other stubborn marks can be removed with a generic denatured
alcohol.
4) Sprayway Glass Cleaner is suggested for use
Exterior
1) Dust and debris can be removed using water and mild detergent or Windex.
2) Avoid using solvents such as denatured alcohol and lacquer thinner that may remove
or discolor the paint finish.
3) Start with mild cleaners and progress to more aggressive cleaners as needed.

THE UNIVERSITY OF IOWA
IIHR - Hydroscience & Engineering October 2016
100 C. Maxwell Stanley Hydraulics Laboratory Page 89
Iowa City, Iowa 52242-1585 USA
D.4 Water Leakage
As a note, flumes will tend to leak when left dried out for periods of 6 months or longer.
It is best to flow water through the flume on at least a monthly basis to prevent seals from drying
and shrinking. Often times, small leaks will self-heal after 2-3 days of wet conditions.
In the event that a leak occurs in the system, the leak should be located and the entire
basin drained and dried. With an appropriate tool, thoroughly remove the silicone one
foot in either direction of the leak. Use caution not to scratch the glass or injure
oneself when using scrapers and knives.
Once the silicone is completely removed, all dirt, grease, and/or additional moisture
should be removed and the area wiped clean with denatured alcohol. Allow area to
dry thoroughly.
Apply painters tape along edges with a 3/4" allowance from where the silicone will
be applied in order to maintain a neat and clean appearance.
Apply silicone according to manufacturer’s recommendations (use plenty). Wipe
excess silicone away with a non-abrasive scraper or coving tool made of rubber or a
soft plastic.
Remove painter’s tape.
Let silicone set according to manufacturer’s recommendations (usually 24 hours).
Dow Corning 733 Black silicone adhesive is recommended for use
D.5 Paint
In the event that the painted areas of the flume must be touched-up due to chips, rust
marks, or other cause, a non-water soluble paint must be applied.
Clean the area with denatured alcohol and allow area to dry thoroughly.
Apply paint according to manufacturer’s recommendations.
The specific paints used on the flume and suggested for touch-ups are listed below:
o Aquapon 35 two-component epoxy paint
Safety Red: 95-10 (A) Curing Agent: 95-98 (B)
Safety Yellow: 95-13 (A) Curing Agent: 95-98 (B)
Manufacturer: PPG Architectural Finishes, Inc.
o Nearest Supplier: PPG Paint Store, 1220 8th St., West
Des Moines, IA 50265, (515) 223-5237

THE UNIVERSITY OF IOWA
IIHR - Hydroscience & Engineering October 2016
100 C. Maxwell Stanley Hydraulics Laboratory Page 90
Iowa City, Iowa 52242-1585 USA
o Supermarine – Marine Paint
SM-266 Ironside Urethane – Black MT
http://supermarinepaint.com/marinepaint/pc/SM-266-Ironside-
Urethane-Gallon-p7.htm