Embed Size (px)
Citation preview

D. B. Raut & A. Bhattrai: Performance Analysis of Grid Connected Solar PV System Using Matlab/Simulink
Rentech Symposium Compendium, Volume 3, September 2013 48
Performance Analysis of Grid Connected Solar PV System
Using Matlab/Simulink Debendra Bahadur Raut*
1 and Ajay Bhattrai
2
1Peaksun Engineering Solutions (PES) Pvt. Ltd., Kathmandu, Nepal
2Institute of Engineering (IOE), Pulchowk Campus, Nepal
Abstract— Solar PV energy is one of the most promising
renewable resources that use the abundant and free energy
from the sun having clean, inexhaustible and
environmentfriendly cyclic operations. However, the
intermittent nature of the output power of PV systems reduces
their reliability in providing continuous power to customers.
Solar PV energy can be used mainly in standalone (off-grid)
and grid connected system. A stand alone solar PV cannot
provide a continuous supply of energy due to seasonal and
periodic variations. Therefore, in order to satisfy consumer
load demand, grid connected PV energy systems that combine
solar energy and other conventional conversion units are
becoming more popular in recent years. But, the fluctuations in
the PV output power with climatic conditions might lead to
undesirable performance of the electric network in grid
connected system.
The objective of this work to study the performance
analysis of grid connected solar PV system. To accomplish this,
the mathematical modeling of 1kWp grid connected system is
carried out and the power profile is estimated using historical
environmental data collected over a number of years at
Kathmandu. Identified the possible operational problems that
might arise in grid connected PV system and different
strategies that can mitigate these problems are studied. In
addition, the performance of the system is evaluated.1
Index Terms— Standalone, off-grid, grid penetration,
performance ratio, Maximum Power Point Tracking (MPPT),
Total Harmonic Distortion (THD), power factor (Pf).
I. INTRODUCTION
In gird connected PV system, the output from the PV
system is connected to utility grid by means of PV grid tied
inverter. Unlike off grid system, there is no need of batteries
and charge controllers but the grid tied inverter should have
special functioning capability such as anti-islanding, grid
synchronization etc. Out of 67GWp PV installed globally,
80% is of the grid connection type. In Nepal, 680 kWp PV
system delivering energy of 560kWh/day for water pumping
and 1736kWh/day is injected to NEA grid is the first grid
connection project in country. 1kWp grid connected PV
system has been installed at CES/IOE to study the
performance analysis of it and its effect on utility system.
The fluctuating behavior of PV output with
environmental condition may degrade the power quality of
inverter output which may cause to degrade the performance
of utility and the consumer electrical appliances? So, to
study the performance of PV grid connected system, 1kWp
PV system is modeled using MATLAB/Simulink and detail
study has been carried out in this work.
* Corresponding author: [email protected]
II. SYSTEM DESIGN
A. Modeling of solar cell and module
The short-circuit current (Isc) from a cell is nearly
proportional to the illumination, while the open-circuit
voltage (Voc) may drop only 10%with an 80% drop in
illumination [1]. The important result of these two effects is
that the power of a PV cell decreases when light intensity
decreases and/or temperature increases. The amount of
power generated by a PV cell depends on the operating
voltage of the PV cell array. It’s V-I and V-P characteristic
curves specify a unique operating point at which maximum
possible power is delivered. The point at which the PV
operates at highest efficiency is called the maximum power
point (MPP). The light generated current (Ipv.) is the
function of solar irradiance and environmental temperature.
The little impact has also been shown by the wind speed.
Irradiance has direct relation while working temperature has
inverse relation to the Ipv.
Fig. 1: Single-diode model of the theoretical PV cell and
equivalent circuit of a practical PV cell
Practical PV device is composed of several connected
PV cells and the observation of the characteristics at the
terminals of the PV array requires the inclusion of additional
parameters to the basic equations given by Eq.1 [2]
Where,
Ipv and I0 are the PV and saturation currents of module,
Vt = NskT/q is the thermal voltage of the array with Ns
cells connected in series,
Rs = equivalent series resistance and
Rp= equivalent parallel resistance of the array of Ns cells
in series.
The value of the diode constant ‘a’ may be arbitrarily
chosen usually 1≤a ≤1.5[3]. If the array is composed of Np
parallel connections of cells then the saturation currents is
given by I0=I0,cell*Np. and module current is modified to
Ipv=Ipv,cell*Np.
D. B. Raut & A. Bhattrai: Performance Analysis of Grid Connected Solar PV System Using Matlab/Simulink
Rentech Symposium Compendium, Volume 3, September 2013 49
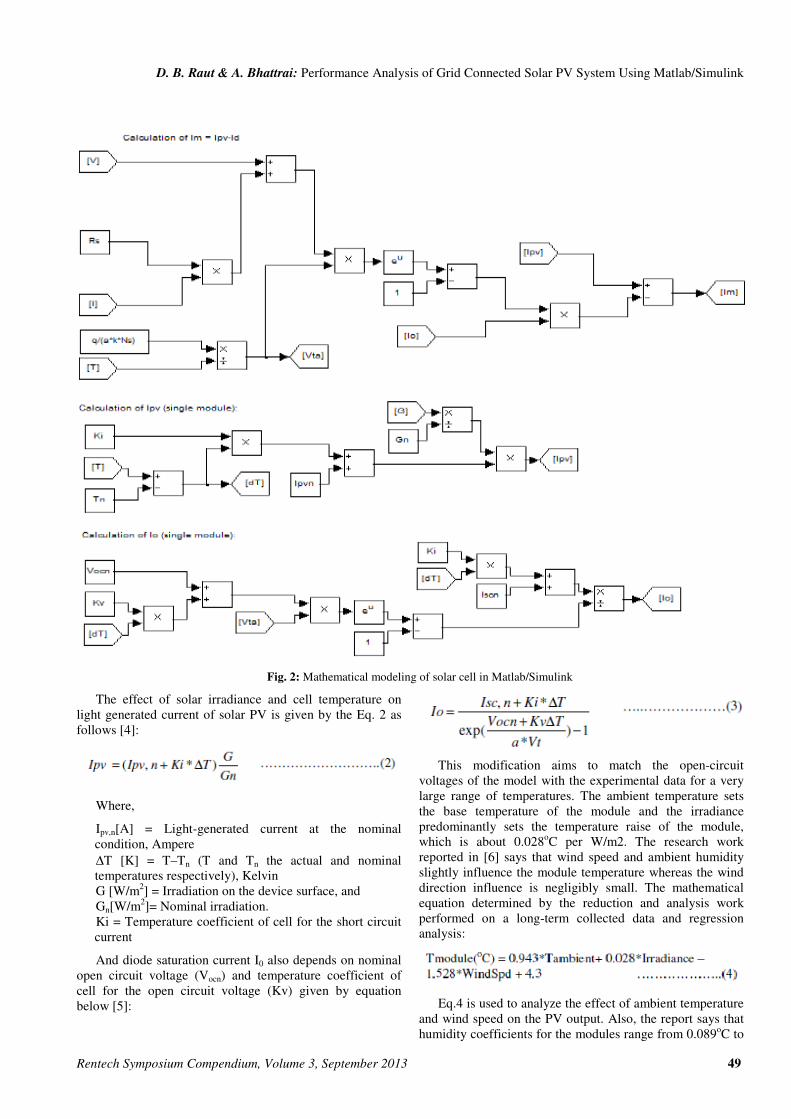
Fig. 2: Mathematical modeling of solar cell in Matlab/Simulink
The effect of solar irradiance and cell temperature on
light generated current of solar PV is given by the Eq. 2 as
follows [4]:
Where,
Ipv,n[A] = Light-generated current at the nominal
condition, Ampere
∆T [K] = T–Tn (T and Tn the actual and nominal
temperatures respectively), Kelvin
G [W/m2] = Irradiation on the device surface, and
Gn[W/m2]= Nominal irradiation.
Ki = Temperature coefficient of cell for the short circuit
current
And diode saturation current I0 also depends on nominal
open circuit voltage (Vocn) and temperature coefficient of
cell for the open circuit voltage (Kv) given by equation
below [5]:
This modification aims to match the open-circuit
voltages of the model with the experimental data for a very
large range of temperatures. The ambient temperature sets
the base temperature of the module and the irradiance
predominantly sets the temperature raise of the module,
which is about 0.028oC per W/m2. The research work
reported in [6] says that wind speed and ambient humidity
slightly influence the module temperature whereas the wind
direction influence is negligibly small. The mathematical
equation determined by the reduction and analysis work
performed on a long-term collected data and regression
analysis:
Eq.4 is used to analyze the effect of ambient temperature
and wind speed on the PV output. Also, the report says that
humidity coefficients for the modules range from 0.089oC to

D. B. Raut & A. Bhattrai: Performance Analysis of Grid Connected Solar PV System Using Matlab/Simulink
Rentech Symposium Compendium, Volume 3, September 2013 50
0.181oC per RH% and it has little or no influence on the
temperature of the modules [6]. The mathematical modeling
of PV cell has shown in Fig. 2.
Simulink model for cell temperature
Simulink model for module
Fig. 3: Mathematical modeling of solar PV in Matlab/Simulink
B. Modeling of MPPT system algorithms
Maximum Power Point Tracker (MPPT) is used to
operate the module at the peak power point so that the
maximum power can be delivered to the load under varying
temperature and irradiance conditions. A DC to DC
converter serves the purpose of transferring maximum
power from the solar PV module to the load by changing the
duty cycle of it and load impedance as seen by the source is
varied and matched at the point of the peak power with the
source so as to transfer the maximum power.
Among various algorithms, Perturb and Observe (P&O)
algorithm is used in this work for the MPP tracking. A slight
perturbation is introduced to the system, due to this
perturbation, the power of the module changes. If the power
increases due to the perturbation then the perturbation is
continued in that direction. After the peak power is reached
the power at the next instant decreases and hence after that
the perturbation reverses [7][8]. The Matlab/Simulink model
has shown in Fig. 4.
Fig. 4(b): Model for MPPT: Simulink model for PWM wave
generation
Fig. 4(a): Model for MPPT: Simulink model for P&O algorithm
D. B. Raut & A. Bhattrai: Performance Analysis of Grid Connected Solar PV System Using Matlab/Simulink
Rentech Symposium Compendium, Volume 3, September 2013 51
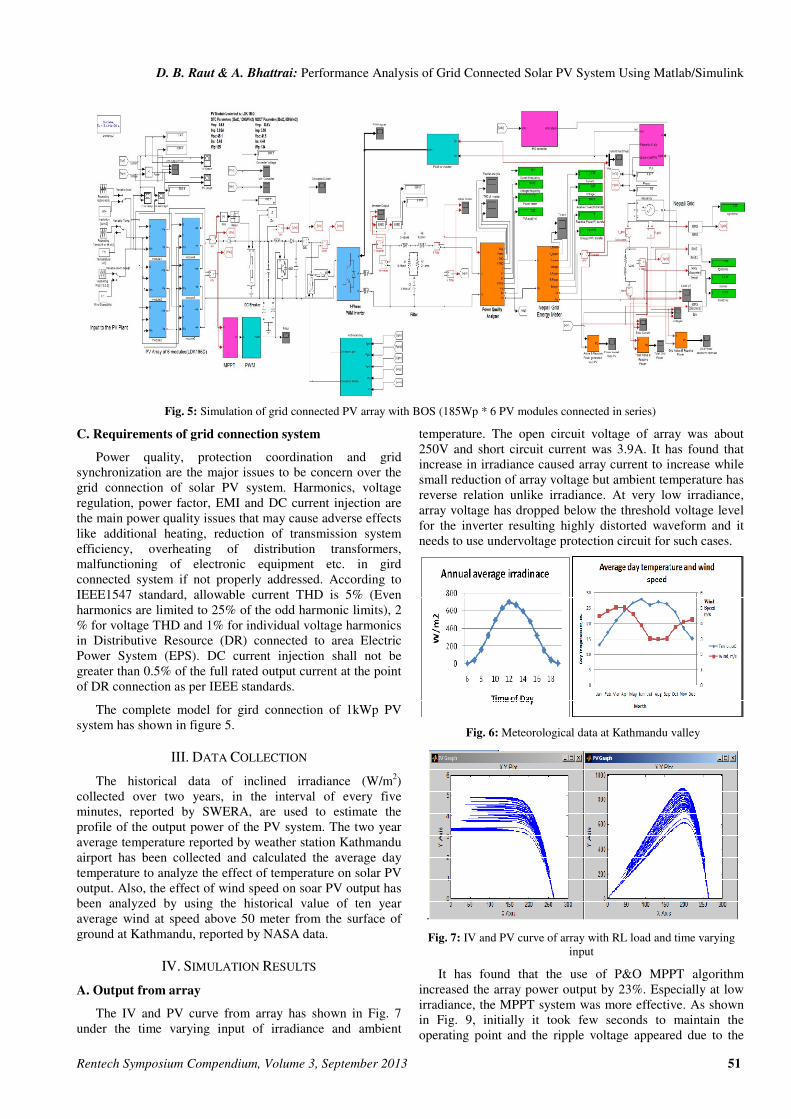
Fig. 5: Simulation of grid connected PV array with BOS (185Wp * 6 PV modules connected in series)
C. Requirements of grid connection system
Power quality, protection coordination and grid
synchronization are the major issues to be concern over the
grid connection of solar PV system. Harmonics, voltage
regulation, power factor, EMI and DC current injection are
the main power quality issues that may cause adverse effects
like additional heating, reduction of transmission system
efficiency, overheating of distribution transformers,
malfunctioning of electronic equipment etc. in gird
connected system if not properly addressed. According to
IEEE1547 standard, allowable current THD is 5% (Even
harmonics are limited to 25% of the odd harmonic limits), 2
% for voltage THD and 1% for individual voltage harmonics
in Distributive Resource (DR) connected to area Electric
Power System (EPS). DC current injection shall not be
greater than 0.5% of the full rated output current at the point
of DR connection as per IEEE standards.
The complete model for gird connection of 1kWp PV
system has shown in figure 5.
III. DATA COLLECTION
The historical data of inclined irradiance (W/m2)
collected over two years, in the interval of every five
minutes, reported by SWERA, are used to estimate the
profile of the output power of the PV system. The two year
average temperature reported by weather station Kathmandu
airport has been collected and calculated the average day
temperature to analyze the effect of temperature on solar PV
output. Also, the effect of wind speed on soar PV output has
been analyzed by using the historical value of ten year
average wind at speed above 50 meter from the surface of
ground at Kathmandu, reported by NASA data.
IV. SIMULATION RESULTS
A. Output from array
The IV and PV curve from array has shown in Fig. 7
under the time varying input of irradiance and ambient
temperature. The open circuit voltage of array was about
250V and short circuit current was 3.9A. It has found that
increase in irradiance caused array current to increase while
small reduction of array voltage but ambient temperature has
reverse relation unlike irradiance. At very low irradiance,
array voltage has dropped below the threshold voltage level
for the inverter resulting highly distorted waveform and it
needs to use undervoltage protection circuit for such cases.
Fig. 6: Meteorological data at Kathmandu valley
Fig. 7: IV and PV curve of array with RL load and time varying
input
It has found that the use of P&O MPPT algorithm
increased the array power output by 23%. Especially at low
irradiance, the MPPT system was more effective. As shown
in Fig. 9, initially it took few seconds to maintain the
operating point and the ripple voltage appeared due to the

D. B. Raut & A. Bhattrai: Performance Analysis of Grid Connected Solar PV System Using Matlab/Simulink
Rentech Symposium Compendium, Volume 3, September 2013 52
perturbance of the algorithms. Upon the use of small
perturbance, ripple was reduced but it took more time to
track the operating point.
B. Power quality
It has found that current THD is 21.35% and
fundamental or 1st harmonic component (50Hz) is
4.124Apeak (2.91Arms). The even harmonics are much less
than the odd harmonics and they have severe impacts on
power quality. Similarly, voltage signal contained 5.01% of
THD with fundamental components of 312.8 Vpeak
(221.18Vrms). The details of even and odd harmonics are
shown in Table I. Since the harmonics present in the inverter
output are higher than the IEEE 159 standard (below 5%),
harmonic filter is used for suppression of harmonics. In this
work, a passive LCL harmonic filter is used for the
harmonics compensation techniques.
Output current, voltage and power from PV array without MPPT
Output current, voltage and power from PV array without MPPT
Fig. 8: Array output profile with time
Fig. 9: Voltage output from boost converter with time
Fig. 10: Current and Voltage THD at inverter before LCL filtering
After employing harmonic compensation techniques, the
current THD is maintained at 4.98% with the fundamental
output of 4.048Apeak (2.86rms). The voltage THD is 0.12%
with fundamental component of 312.8Vpeak. The orders of
filtered harmonics are presented in Table I and II.
TABLE I
HARMONIC ORDERS AND MAGNITUDES AT INVERTER CURRENT
Even
harmonics %
h2 h4 h6 h8 h10 h12 h14 h16 h18 h20 DC
component 0.35 0.42 0.28 0.71 0.30 0.45 0.20 0.28 0.06 0.33
Odd
harmonics %
h3 h5 h7 h9 h11 h13 h15 h17 h19 h21 0.13%
8.14 11.42 5.05 3.96 1.35 1.37 0.99 0.71 0.93 0.36
TABLE II
HARMONIC ORDERS AND MAGNITUDES OF FILTERED CURRENT
Even
harmonics %
h2 h4 h6 h8 h10 h12 h14 h16 h18 h20 DC
component 0.22 0.02 0.06 0.04 0.01 0.02 0.01 0.00 0.02 0.02
Odd
harmonics %
h3 h5 h7 h9 h11 h13 h15 h17 h19 h21 0.13% 3.07 1.17 0.12 0.15 0.09 0.04 0.02 0.04 0.02 0.01

D. B. Raut & A. Bhattrai: Performance Analysis of Grid Connected Solar PV System Using Matlab/Simulink
Rentech Symposium Compendium, Volume 3, September 2013 53
Pf fluctuation at high solar irradiance
Pf fluctuation at intermediate solar irradiance
Fig. 11: Variation of power factor with irradiance
Ideally, the reactive power generated by the inverter
should be zero i.e. the power factor is unity. But, because of
the inductive and capacitive components used in the energy
conversion and transmission system power factor is
changed. Results show that the reactive power generated by
the inverter is increased with the decrease in irradiance i.e.
power factor decreased with decrease in irradiance.
C. Power outputs from the array and system efficiency
The system is simulated individually for the inputs of
meteorological data collected over 12 month. The array
energy was 1886.1 kWh/Year at STC but the array actually
produced 1699.62kWh/year out of which 1523.69 kWh/year
is injected to the grid and the performance ratio is 80.76%.
The least energy is generated in January and August
(4.09kWh/day) and total energy in this month is
126.66kWh/month. The highest energy is produced in
October with 5.68kWh/day and total of 176.2kWh/month.
The average inverter efficiency throughout the year ranged
from 87% to 93%. The average gird penetration throughout
the year varied from 95%, in June, to 99%, in February.
Similarly, the overall performance ratio is 78% to 84 %. A
thesis work done by A. Bhattrai 2012 shows that average
final yield is 2.31kWh/day; array yield is 2.64 kWh/day
under the average 4 hours of load shedding during day time
at Kathmandu. Grid penetration is the ratio of energy
injected to the grid to the energy available at inverter output
and performance ratio is the power at inverter output to the
energy fall to the PV array.
Fig. 12: Monthly energy generation from 1kWp PV system
throughout the year
Variation of current THD and power factor with irradiance
Variation of voltage THD with irradiance
Fig. 13: Effect of irradiance on power quality on inverter output
Inductive load decreased the power factor and to
compensate it, capacitive load should be added. But, the
power factor also varied with the irradiance in grid
connected solar PV. The variation of power factor with time

D. B. Raut & A. Bhattrai: Performance Analysis of Grid Connected Solar PV System Using Matlab/Simulink
Rentech Symposium Compendium, Volume 3, September 2013 54
at constant load and it has found that for most fraction of
day, the power factor is acceptable. Also, the current THD
became lowest at peak day but voltage THD is highest and it
slowly decreased on either side.
Active and reactive power variation at inverter output
Performance of PV system with irradiance
Fig. 14: Active and Reactive power vs. Irrad; PV performance vs.
Irrad.
V. CONCLUSION
Grid tied inverters convert DC power to AC power with
an efficiency of 90% or more most of the time. Inverters can
even work to some extent when irradiance levels up to
200W/m2, but performance starts to drop off dramatically
when irradiance levels falls below it.
The use of MPPT system is of great value to the array
output as it (P&O algorithm) optimizes the PV power output
by 23% than without the use of MPPT system. The
nonlinear devices used in the converter circuits are the great
source of harmonics in the PV grid connected system. The
harmonics generated in the PV power converting systems
greatly vary with the solar irradiance. The odd harmonics
have greater impacts on power quality than even harmonics
as they have higher magnitude. The current THD is more
sensitive on the fluctuation of solar irradiance than the
respective voltage THD. Current THD greatly decreases
with the increase in the solar irradiance while voltage THD
slightly increases with increase in solar irradiance. Power
factor varies linearly for values of solar irradiance lower
than 200 W/m2 and remains close to unity for higher solar
irradiance values. In addition, reactive power injection
increases at low irradiance.
ACKNOWLEDGEMENT
In the first place, I owe my deepest gratitude to my thesis
supervisor Prof. Jagan Nath Shrestha, PhD, IOE Pulchowk
Campus, for his continuous supervision, advice, and
guidance for this thesis work. The authors gratefully
acknowledge the contributions of everyone involved during
the planning and organizing the background for this project.
REFERENCES
[1] G. E. Ahmad, H. M. S. Hussein, and H. H. El-Ghetany, 2003,
“Theoretical analysis and experimental verification of PV modules”,
”Renewable Energy”, 28(8):1159–1168.
[2] H. S. Rauschenbach, Solar cell array design handbook, Van Nostrand
Reinhold, 1980.
[3] C. Carrero, J. Amador, and S. Arnaltes, 2007, “A single procedure for
helping PV designers to select silicon PV module and evaluate the
loss resistances”, Renewable Energy.
[4] E. I. Ortiz-Rivera and F. Z. Peng, 2005, “Analytical model for a PV
module using the electrical characteristics provided by the
manufacturer data sheet”, “In Proc. IEEE 36th Power Electronics
Specialists Conference, PESC”, p. 2087–2091, 2005.
[5] D. Sera, R. Teodorescu, and P. Rodriguez, 2007, “PV panel model
based on datasheet values”. “In Proc. IEEE International Symposium
on Industrial Electronics, ISIE”, p. 2392–2396.
[6] G.T. Mani, Liang Ji, Yingtang Tang, 2006, “Long –Term Monitoring
and Model Development for Energy Rating”, “Renewable Energy
Laboratory. NCPV and Solar Program Review Meeting“ NREL/CD-
520-33586 Pg. 936.
[7] Hua, Chihchiang, Jongrong Lin & Chihming Shen, 1998,
“Implementation of a DSP Controlled PV System with Peak Power
Tracking”, “IEEE Transactions on Industrial Electronics”, Vol. 45,
No. 1, page 99-107.
[8] Xuejun Liu and A.C.Lopes, 2004,“An Improved Perturbation and
Observe Maximum Power Point Tracking Algorithm for PV Arrays”,
“ IEEE PESC “, pp.2005-2010
BIOGRAPHIES
Mr. Debendra Bahadur Raut is the postgraduate
of Renewable Energy Engineering form Institute of
Engineering (IOE) Pulchowk Campus, Nepal after
graduated from Electronics and Communication
Engineering. He is the Managing Director of
Peaksun Engineering Solutions Pvt. Ltd. Kathmandu
Nepal. He is also involving in academics as Lecturer
at Acme Engineering College, Kathmandu Nepal.
Mr. Ajay Bhattarai has completed master’s degree
in Renewable Energy Engineering form Institute of
Engineering (IOE) Pulchowk Campus, Nepal after
graduated from Electronics and Communication
Engineering. He is currently involved as part time
Lecturer at Pulchowk Campus.


![QCL-v4_[ChallengNo1]_[VJTI]_[SANIKA RAUT]](https://img.pdfslide.us/doc/110x75/55ce1b0bbb61ebce4a8b46b5/qcl-v4challengno1vjtisanika-raut-55cf98ad723d2.jpg)