Embed Size (px)
Citation preview
,. SBuJCT D pATuction and nutrition ASO0-000-000
FCI,oN "AHu n"n~utrition
7. TITLEE ANOSUBTITLE
Simplified field assessment on nutritional status inearly childhood; practical suggestions for dmvelopng countries 2., AUTNORIS)
Mt!1er,D.C.; Ntchaman,M.Z.; Lane,J.M. ' ' . c UMBER74.DOCUMENT DATE9 S.NUMBER OFPAGES S..ARC N
7. REFERENCE ORGANIZATION NAME AND ADDRESS
AID/TA/N
SI. SUPPLEMENTARY NOTES (Spooring Orglanisation#,Publishers, A valal'ity)
,.ASTRCT A simple, inexpensive approach to the field assessment of nutritional status is proposed to determine the location and extent of protein-energy malnutrition and anemia ina defined geographic area. The approach has two principal features, a simple statistical method for randomly selecting the population samples to he studied,
and a suggested core of objective nutritional indicators, unfformly measured, inyoung children. The method limits basic measurements to body length and weight, heioglobin concentration, and pretibial edema. The need to adequately train indigenous paraprofessionals as assessors and to periodically control their measurement accuracy is stressed. The paper advocates the cross-tabulation form proposed by J.C. Waterlow for cross-classifying height-for-age and weight-for-height to estimate prevalence and severity of past and recent undernutrition. Itsuggests methods for comparisons with reference data. The Waterlow method makes the degrees of long-term stunting and shorter-term wasting in a population more readily discernable. Inadditior to providing baseline indications of where and to what extent common nutritional problems may exist in various regions of a nation, the assessment method, repeated periodically, will indicate ctAnges with time, and thus itmay be used to evaluate the effectiveness of remedial .ntervention. Ifthe assessment demonstrates that protein-energy malnutrition isa public health problem, a supplemental ecoogic analysis of possible causal factors may be indicated so that appropriate remedial programs can be instituted.
I1 PRICE OF DOCUMENT10. CONTROL NUM-lE
12. DESCRIPTORS 13. PROJECT NUMUER
Assessments 14. CONTRACT NUMUER
Children. AID/TA/N Infants TYPE OF DOCUMENT1S.
Malnutrition AID 11W I4-4)

MANUAL FOR
SIMPLIFIED FIELD ASSESSMENT
OF NUTRITIONAL STATUS IN DEVELOPING COUNTRIES
(3rd Revision)
Office of Nutrition Technical Assistance Bureau
Agency for International Development Department of State
Washington, D.C. 20523
HEW, PHS, CDC October 1977
SIWLIFIED FIELD ASSESSMENT
OF NUTRITIONAL STATUS IN ERLY CHILDHOOD:
PRACTICAL SUGGESTIONS FOR DEVELOPING COUNTRIES
David C. Miller, M.D.1
Milton Z. Nichaman, M.D.2
J. Michael Lane, M.D.3
1Medical Officer, Preventable Diseases and Nutrition Activity,
BSE, Center for Disease Control, Atlanta, Georgia 30333.
2Assistant Director, Preventable Diseases and Nutrition Activity,
BSE, Center for Disease Control, Atlanta, Georgia 30333.
Present Address: Department of Nutrition, Hebrew University,
Hadassah Mcdical School, P.O.B. 1172, Jerusplem, Israel.
3Director, Preventable Diseases and Nutrition Activity, BSE,
Center for Disease Control, Atlanta, Georgia 30333.
ABSTRACT
This paper pr3,oses a simple and inexpensive method for the
field assessment of certain objective indicators of nutritional
status in children of preschool age. It emphasizes the need
for statistfcal'y valid sample selection, and presents a
design for randomly selecting 30 children from each of 30
village sites from each region for which quantitative inferences
are to be made. The primary purpose being to estimate the
prevalence of protein-energy undernutrition and anemia, the
method limits basic measurements to body length and weight,
hemoglobin concentration and pretibial edema. The presentation
stresses the need to adequately train indigenous para-professionals
as assessors, and to periodically control their measurement
accuracy. If advocates the approach of Waterlow for cross
classifying height-for-age and weight-for-height to estimate
prevalence and severity of past and recent undernutrition, and
suggests methods for comparisons with reference data. The paper
acknowledges that the method Is limited to an estimate of location
and magnitude of common childhood malnutrition, and recommends
that it be supplemented, as appropriate and feasible, by
detailed ecological analysis to elucidate causation and guide
remedial action.
INTRODUCTION
The need for effective programs to improve global nutrition
and health becomes evermore urgent. 2nformation regarding
the magnitude of the problem of malnutrition, the identification
of population groups in greatest need of assistance, and the
effectiveness of programs aimed at improving nutritional
health can best be obtained by objective and periodic assess
ment of the nutritional status of representative communities.
In the past, national nutrition surveys have often been
excessively costly and complex, as well as unrepresentative
of the total'population because of poor sampling techniques.
Consequently, the translation of survey results into practical
programs for nutritional improvement has usually been unsatis
factory. Because of these constraints, the replication of
the surveys to measure program effectiveness has rarely been
possible. Simpler methods must be developed and field tested
which can provide maximum useful data with minimum expenditure
of money, complex equipment, highly trained personnel, and
time.
2
The outlines of such a simplified system are presented in
this paper. The system utilizes certain key indicators of
malnutrition to assess the magnitude of protein-energy
malnutrition (PEM) and anemia in early childhood. The
relatively few measurements recommended in this method can
be performed by para-professional personnel who have been
The results car be quickly analyzed andspecially trained.
made available for practical pro&lem planning and evaluation.
This method is not a comprehensive nutritional assessment of
en entire population and cannot be expected to detect all
cases of malnutrition, nor all of its correlates, within a
c mmunity or a cobntry. It is not designed to identify and
measure the many ecologic factors associated with PEM. Stich
analysis requires greater sophisti-ation, the determination
of many economic, &ociological, dietary, agricultural and
other variables, and could be undertaken at a later stage
in the development of nutrition improvement programs. The
purpose of this simplified method is more to answer the
question, "What is the magnitude and geographic extent of
the problem?" than "What are its various causes?" It will
generate valid and useful data bearing upon the prevalence
of the most conon nutritional problems of young children
in developing nations, and thus provide indication of where,
among whom, and what kind of nutritional problems require
remedial action.
.3
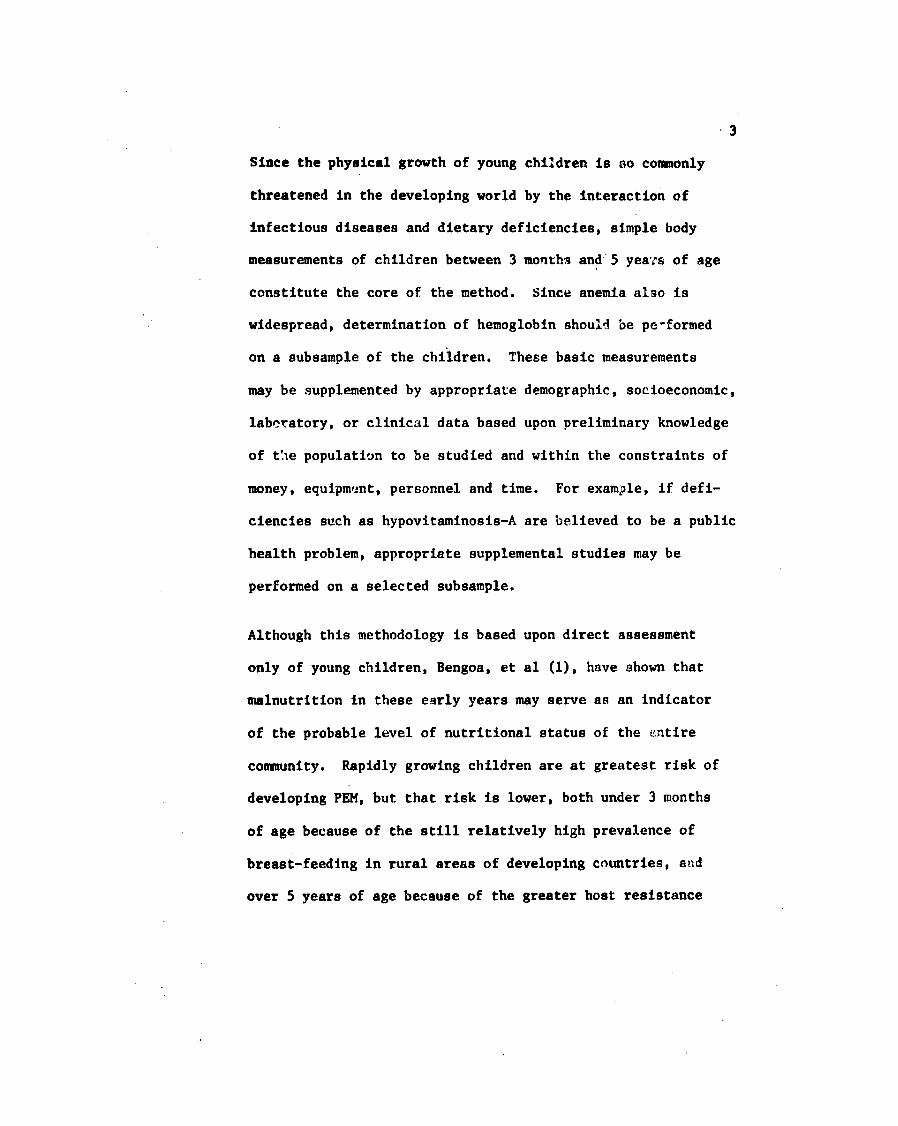
Since the physical growth of young children is no commonly
threatened in the developing world by the interaction of
infectious diseases and dietary deficiencies, simple body
measurements of children between 3 months and'5 yeamcs of age
constitute the core of the method. Since anemia also is
widespread, determination of hemoglobin should be pe-formed
on a subsample of the children. These basic measurements
may be supplemented by appropriate demographic, socioeconomic,
laberatory, or clinical data based upon preliminary knowledge
of t ie population to be studied and within the constraints of
money, equipment, personnel and time. For example, if defi
ciencies such as hypovitaminosis-A are believed to be a public
health problem, appropriate supplemental studies may be
performed on a selected subsample.
Although this methodology is based upon direct assessment
only of young children, Bengoa, et al (1), have shown that
malnutrition in these early years may serve as an indicator
of the probable level of nutritional status of the entire
community. Rapidly growing children are at greatest risk of
developing PEM, but that risk is lower, both under 3 months
of age because of the still relatively high prevalence of
breast-feeding in rural areas of developing countries, and
over 5 years of age because of the greater host resistance
4
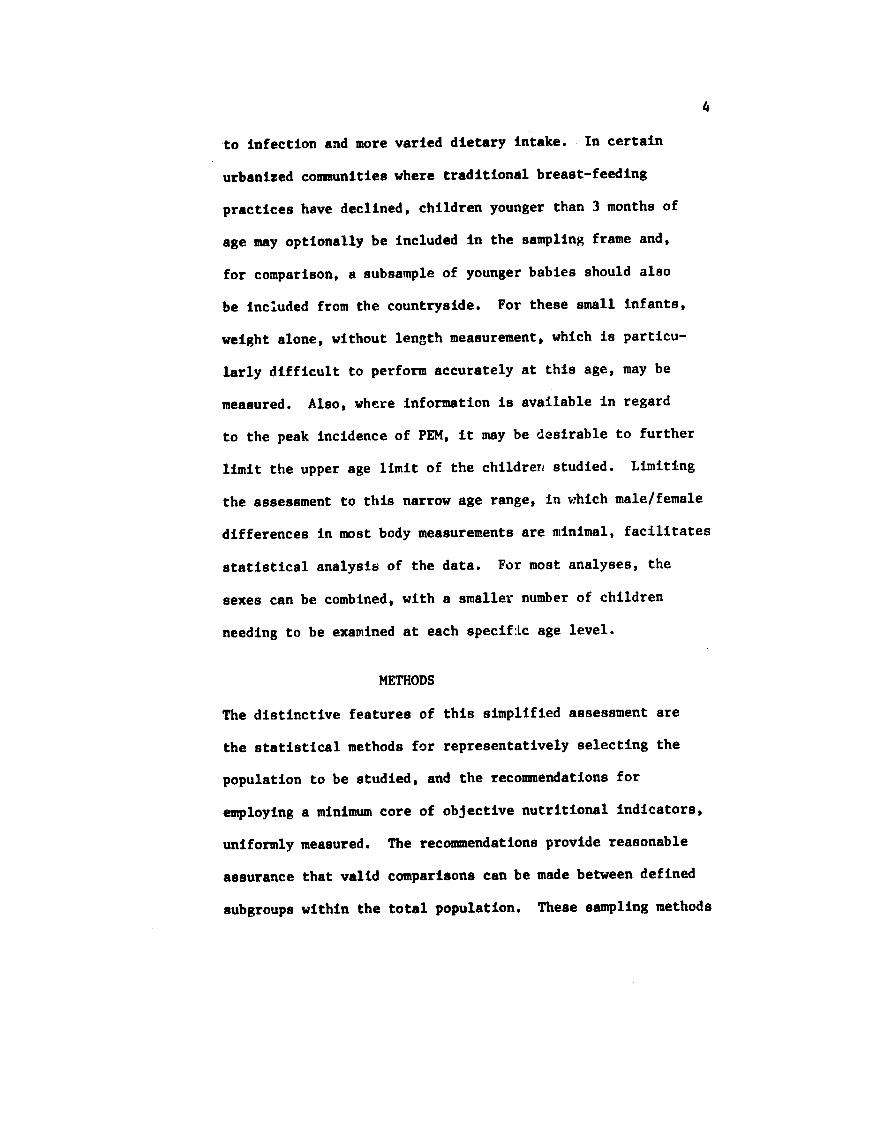
to infection and more varied dietary intake. In certain
urbanized communities where traditional breast-feeding
practices have declined, children younger than 3 months of
age may optionally be included in the sampling frame and,
for comparison, a subsample of younger babies should also
be Included from the countryside. For these small infants,
weight alone, without length measurement, which is particu
larly difficult to perform accurately at this age, may be
measured. Also, where information is available in regard
to the peak incidence of PEM, it may be desirable to further
limit the upper age limit of the children studied. Limiting
the assessment to this narrow age range, in which male/female
differences in most body measurements are minimal, facilitates
statistical analysis of the data. For most analyses, the
sexes can be combined, with a smaller number of children
needing to be examined at each specif:Lc age level.
METHODS
The distinctive features of this simplified assessment are
the statistical methods for representatively selecting the
population to be studied, and the recommendations for
employing a minimum core of objective nutritional indicators,
uniformly measured. The recommendations provide reasonable
assurance that valid comparisons can be made between defined
subgroups within the total population. These sampling methods
5
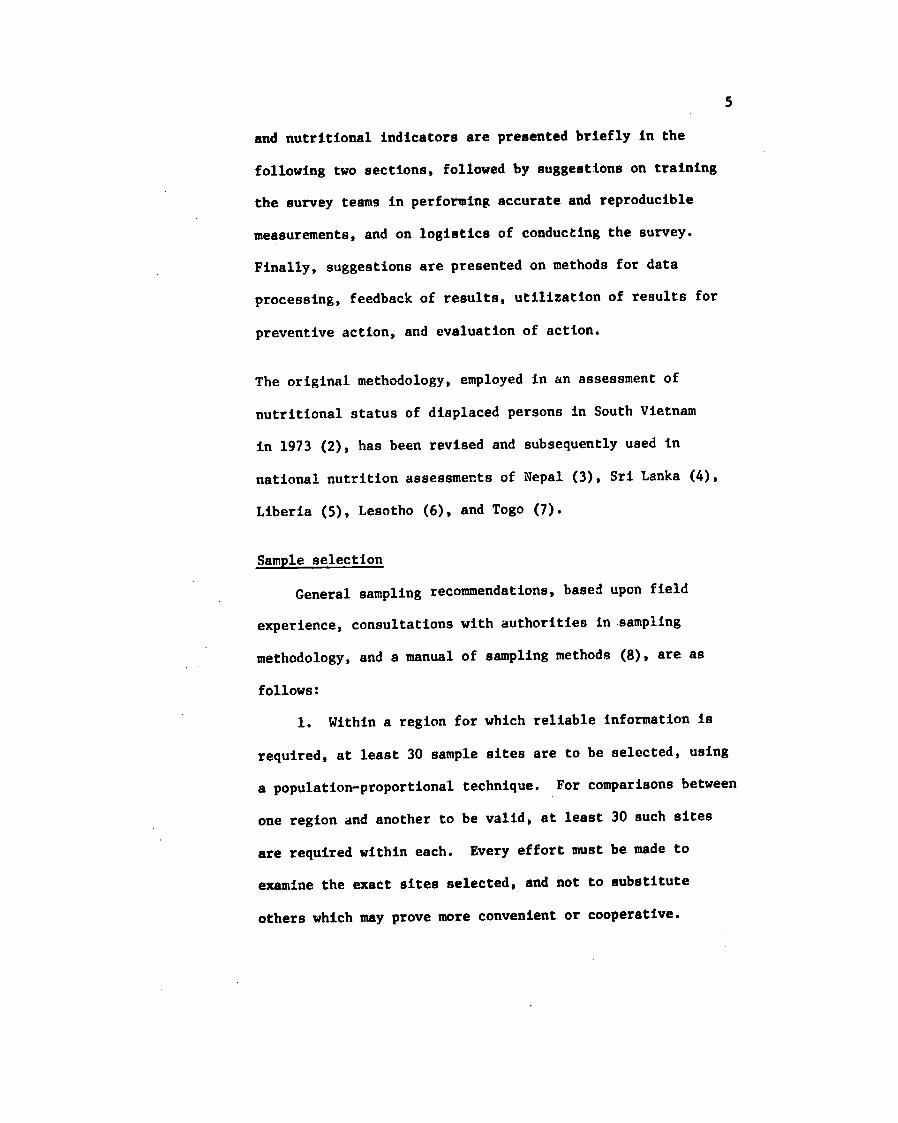
and nutritional indicators are presented briefly in the
following two sections, followed by suggestions on training
the survey teams in performing accurate and reproducible
measurements, and on logistics of conducting the survey.
Finally, suggestions are presented on methods for data
processing, feedback of results, utilization of results for
preventive action, and evaluation of action.
The original methodology, employed in an assessment of
nutritional status of displaced persons in South Vietnam
in 1973 (2), has been revised and subsequently used in
national nutrition assessments of Nepal (3), Sri Lanka (4),
Liberia (5), Lesotho (6), and Togo (7).
Sample selection
General sampling recommendations, based upon field
experience, consultations with authorities in sampling
are asmethodology, and a manual of sampling methods (8),
follows:
1. Within a region for which reliable information is
required, at least 30 sample sites are to be selected, using
a population-proportional technique. For comparisons between
one region and another to be valid, at least 30 such sites
are required within each. Every effort must be made to
examine the exact sites selected, and not to substitute
others which may prove more convenient or cooperative.
6
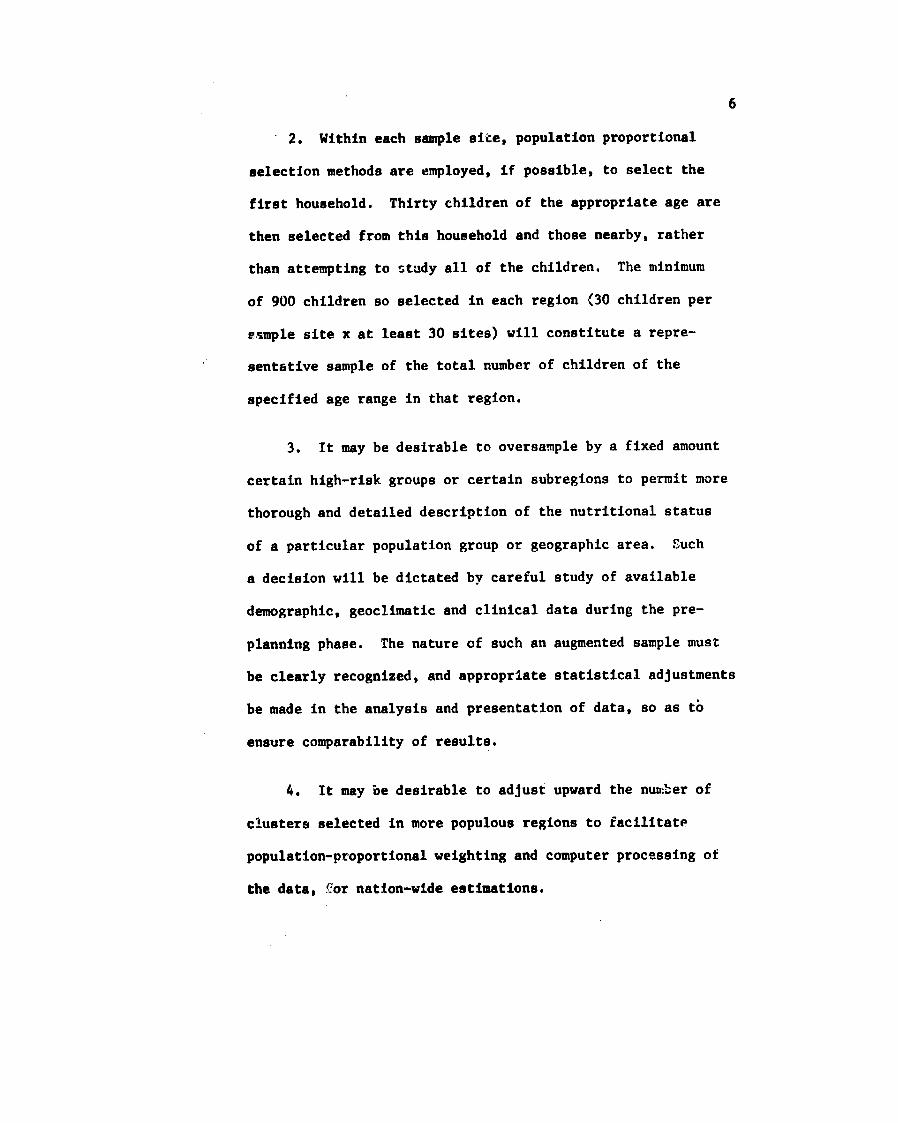
2. Within each sample site, population proportional
selection methods are employed, if possible, to select the
first household. Thirty children of the appropriate age are
then selected from this household and those nearby, rather
than attempting to study all of the children. The minimum
of 900 children so selected in each region (30 children per
esmple site x at least 30 sites) will constitute a repre
sentative sample of the total number of children of the
specified age range in that region.
3. It may be desirable to oversample by a fixed amount
certain high-risk groups or certain subregions to permit more
thorough and detailed description of the nutritional status
of a particular population group or geographic area. Such
a decision will be dictated by careful study of available
demographic, geoclimatic and clinical data during the pre
planning phase. The nature of such an augmented sample must
be clearly recognized, and appropriate statistical adjustments
be made in the analysis and presentation of data, so as to
ensure comparability of results.
4. It may be desirable to adjust upward the number of
clusters selected inmore populous regions to facilitate
population-proportional weighting and computer processing of
the data, 'or nation-wide estimations.
7
5. For those measurements which are to be performed on
only a part of the sample, as with hemoglobin determination
and certain other tests, the same systematically chosen
subsample, here 20 percent, should be employed for each
measurement.
Assessment methods
In the sample selected for study, the following set of
measurements, indicative of nutritional status of these
children, constitute the core of key indicators. Those
underlined are recommended to be done in all situations.
The role of other optional measurements in the assessment
methodology will be discussed, and their use dictated by
the particular situation.
In outline form, these indicators are:
1. From mothers, or those who may substitute as mothers
of the children examined:
a. basic identification (total sample)
b. selected demographic and socioeconomic data
(total sample)
c. height of mothers (subsample)
2. From selected children, approximately 3 months to
5 years of age:
a. body measures
(1)length or height (total sample)
(2)weight (total sample)
(3)mid-upper arm circumference (subsample)
8
(4) triceps fatfold thickness (subsample)
(5) Head and chest circumference (all under
2 years old, and subsample of others)
b. clinical screening
(1) bilateral pretibial edema (total sample)
(2) selected signs associated with specific
nutrient deficiency, such as hypo-vitaminosis A, as indicated
by the local situation (total sample).
c. laboratory determinations*
(1) hemoglobin
(2) additional determinations such as plasma or
serum vitamin A as indicated by the local situation may be
done on an appropriate subsample.
Further discussion of these suggested indicators, under
the same subject headings, is presented in:
1. From mothers
a. Basic identifying data should be coded to include,
in addition to the region, site, family and child, the child's
His or her name (not to be coded),position in the family.
sex and age complete the identifying data. Each child's age
should be carefully ascertained, confirmed as feasible by
*In addition to the indications noted, performance of these
determinations is dependent upon the availability of adequate
technical capability.
9
existing records, popularly known astrological signs, or
specially constructed local events calendars. Tne record
should make clear whether the recorded age is a crude or a
reliable estimate, so that appropriate categorization may be
made for analysis of growth indices requiring accurate age.
b. Depending upon local geographic, ethnic and
socioeconomic conditions, further selected, relevant data
may be collected, as feasible.
c. If time permits, and where an accurate instrument
for measuring the height of adults is available, an estimate
of the maternal contribution to stature of children can be
made. Garn and Rohmann (9)have shown that this may help to
evaluate the relative impact upon growth retardation of
familial and environmental factors.
2. From children:
a. Body reasures
(1)Length or height. Supine length should be
measured on all children 2 years or less of age, or if accurate
age is unknowns, children 85 cm or less in length. For children
older than 2 years, or taller than 85 cm, standing height
should be measured. In either case the meapurement must be
that of the child in full extension aligned with the measuring
instrument, and with feet bare and head positioned so that the
child's gaze is directed perpendicular to its body alignment.
10
For measurement of length, to accomplish proper
positioning of an often uncooperative child, the measurer
must be as3isted by a full-time helper. The measuring
instrument must have a fixed right angle headboard and a
freely movable right angle footboard which slides along a
clearly legible scale. One person holds the child's head
in alignment with the body with the line of vision straight
up and applies gentle traction tj bring the top of the head
into contact with the fixed headboard ensuring that it is
The other person holds the child's feetmaintained there.
with the toes straight up and pushes down on the knees to
fully extend the legs. With the other hand he brings thte
movable footboard firmly against the heels, reading the
measurement when the position is optimum.
For measurement of height the child should stand on
a horizontal bare floor or platform with feet close together,
with heels, buttocks and back of shoulders touching the wall
or a vertical surface of a measuring device, and with the line
of vision straight ahead. He should be told to "stand up
straight and tall and look straight ahead." A block squared
at right angles against the wall should then be brought into
firm contact with the crown of the head. When an assistant
is available, this person should place one hand against the
child's knees to detecL any flexion of the legs and the other
hand on the feet to detect any lifting of the heels. The
measurement is read when the position is optimum.
Plans of two suitable, portable and durable boards which can
accurately measure both length and height, and which have been
used successfully in the field, are appended.*
(2)Weight. For children of this age, the
Salter hanging scale,** which weighs up to 25 kg, marked
at 0.1 kg intervals, has proven to be eminently satisfactory
in field work. It can be hung from a tree bzanch or a door
frame, but in desert conditions a portable tripod will be
useful. Reliable and inexpensive beam balances which aie
now available may also be used. Accuracy of all scales
should be checked periodically by weights of known mass.
This may be done using large plastic bottles or jugs, which
are easily transportable empty, and, filled with water in
the field, always contain an exactly known volume.
(3) Mid-upper arm circumference (AC). Jelliffe
and Jelliffe (10) have shown that this measure can provide
an independent assessment of the severity of undernutrition,
as manifested by wasting of muscle. As usually performed,
its validity has been questioned because of the relatively
*Unpublished document.
**Use of trade names is for identification only and does not
constitute endorsement.
12
large standard ,rror of its measurement. With the use of
insertion-type tapes developed by Zerfas (11), together
with adequate training and quality control of the measurers,
satisfactory precision and accuracy are possible. The
mid-point of the upper arm must be accurately located, and
the tape applied snugly, but not too tightly.
(4) Triceps fatfold thickness (Tr FF). To
estimate the contribution of subcutaneous fac to the AC
measure, and to provide an objective indication of children's
caloric reserve, as described by Gurney, et al (12), the
measurement of Tri FF may be considered. This consideration
will be governed by the availability of an appropriate instru
ment such as the new Tanner-Holtain caliper,* and the ability
to control, satisfactorily, measurement accuracy. This
measuremenc must be made on the posterior aspect of the upper
arm, directly upward from the olecranon process of the ulna,
at the mid-point as marked for the AC measurement.
(5) Head and chest circumference (HC & CC).
These measures can be performed with more satisfactory
accuracy than either AC or Tr FF. In most populations, HC
is normally greater than CC up to one-half year of age, and
less than CC after age 1. In severe PEM, CC may remain
smaller than HC up to 2 years or more. Maline, et al (13),
have recently presented evidence to suggest that the greatest
*Use of trade names is for identification only and does not
constitute endorsement.
13
usefulness of these measures, particularly of HC, may be to
detect, in chiiren as old as 5 years, undernutition which
may have occurred before age 2.
b. Clinical screening
(1) Pretibial edema. In diagnosing the type of
PE4, it is of critical importance to establish the presence
or absence of edema. This sign should be elicited with great
care and consistency by applying bilateral firm thumb pressure
over tho lower tibiae for three seconds. Resultant bilateral
pitting signifieo edema of systemic origin. None or question
able pitting is to be graded 0, slight but definite pitting
as 1, and moderate to marked pitting, 2.
(2) Other signs. Much more difficult than
training for the detection of edema is the training necessary
for nonmedical workers to recognize Bitot's spots and other
eye signs consistent with hypovitaminosis A, or other clinical
signs of specific nutrient deficiency. Although difficult,
collection of such data should be considered when a high index
of suspicion exists in regard to these or other significant
micronutrient deficiencies in the population.
c. Laboratory determinations
(1) Hemoglobin (Hgb). Anemias due to iron
deficiency, and often other causes, are common throughout the
world, and thair detection in a subsample of childxen is
recomended im all cases. Miale (14) has shown that Hgb,
14
as measured by the photometric determination of cyanmethe
moglobin, is preferred over hematocrit since it is a more
direct reflection of the oxygen-carrying function of blood,
and since the specimens can be more readily handled in the
field and more reproducibly determined later in a central
laboratory.
(2) Other determinations. If a high prevalence
of such conditions as hypovitaminosis A is suspected, laboratory
measurement of this or other micronutrients may be indicated,
when feasible. In field situations, however, problems of proper
handling of specimens, and accurate performance of laboratory
procedures are considerable, and usually militate against
inclusion of such complex determinations in a simplified nutri
tional assessment of this kind.
Ensuring measurement accuracy
Since anthropometrics are the core of the simplified
assessment methodology, sufficient time and effort must be
taken for careftilly training the para-professional personnel
in simple anthropometry, and systematically checking their
precision and accuracy at periodic intervals.
Group differences in body measurements which may be small
but biologically meaningful are frequently obscured because of
unacceptably large measurement errors which go unrecognized
and uncorrected. To the degree that such 'rrors can be mii
mized, the usefulness of anthropometric fiata, and of clinical
15
and laboratory data as well, will be maximized. Toward
this end, a set of standardized but simple exerctses has
been developed for training in basic anthropometry, and
for quality control of measurement accuracy in the field.
Thcae exercises include prepared forms for recording and
quickly analyzing the data of standardization tests, which
have been adapted from those proposed by Habicht (15). They
have proven feasible and extremely useful.
Laboratory data as well are useful to the extent that
their precision and accuracy are known. Each technologist's
performance should be tested periodically, at unannounced
and irregular intervals. In addition to the capability and
care of the technologist, factors such as proper collection,
refrigeration, storage, and transport of specimens are
crucial.
Assessment logistic3
In the initial phases of planning it is essential to
answer the following complex question: "To accomplish the
nutritional assessment satisfactorily, how many teams, of
what size, and with what equipment, must be transported to
and from which villages, at what rate and over what period
of time?"
16
Each situation calls for a balanced consideration of a
host of variables of geography, time and weather; of personnel,
equipment, supplies and money. Such consideration will deter
mine the logistic solutions which are most appropriate in a
given situation. Although many details of plan and procedure
must necessarily vary, certain principles remain relevant in
all situations. Some of these will be mentioned.
Sampling requirements will dictate the number of sites
to be visited, whether 30 or some multiple of 30. Experience
indicates that each team should spend 2 days at each site, to
have time to explain the assessment to the village leaders, to
learn accurate details of the information sought, and to find
the children selected for examination. Each team must there
fore be equipped to remain overnight in or near each village.
The number of teams required to complete the assessment
will be inversely proportional to the time for its completion.
It is preferable to have fewer teams, and to take a longer
time, in order to minimize the degree of interteam measurement
bias, and to create a cadre of experienced examiners who can
be employed permanently in periodic assessments. Seasonal
factors will also determine the timing and duration of the
assessment.
17
Adequate transportation is always difficult and costly.
With problems of bad weather and worse roads which are common
in many countries, the teams may be required to do considerable
hiking, which is costly in time and salary, while saving in
motor fuel. For the most part, the mainstay of transportation
is likely to be a number of sturdy vehicles of the jeep or
landrover type.
Data handling
Examination forms should be designed to facilitate subse
quent computer analysis. Before sending the forms to the local
data processing center, probably in the capital city, all forms
should be edited for error and completeness in the field by
the project director. Insofar as feasible, loccl statistical
personnel and computer facilities should be employed. The
Center for Disease Control (CDC) has developed a comprehensive
computer program for handling the anthropometric and hemato
logic data input from these surveys on an IBM 370/145 computer.
Software for this program is available at no cost to qualified
facilities. The program usually can be translated into appro
priate language for a local computer, but in past experience
it has been advantageous to send a duplicate computer tape
or set of cards to a reference computer facility for dual
processing.
The interpretation of anthropometric data, and the choice
of reference populations for making appropriate comparisons of
children's growth are problems whose complexity is often
unsuspected. One might think that the analysis of children's
height and weight should be reasonably simple, with methods
long since agreed upon. Such, however, is not the case.
Of the several anthropometric indices in common use,
(16),weight-for-age (Wt-for-Age), as advocated by Gomez, et al
has been used most commonly. It is of particular value in
evaluating the growth of individual children over time, but
in comparing groups of children examined only once, Wt-for-Age
is not able to distinguish long-term stunting in linear growth,
particularly of bones, from shorter-term wasting of other body
tissues, mainly muscle and fat. A child, or a group of chil
dren, with low Wt-for-Age may be low by virtue either of low
height-for-age (Ht-for-Age; stunting) or low weight-for
height (Wt-for-Ht; wasting), or some combination of both.
The implications of the two conditions may be quite different.
Seone and Latham (17) have recommended that the two
indices, Ht-for-Age and Wt-for-Ht, be determined and presented
separately. From them, one can arithmetically derive Wt-for-
Age if desired, but from Wt-for-Age alone one cannot derive
the other two.
Other problems in presenting anthropometric data include
the choice of a reference population for making comparisons
with the study population, and whether to compare the two
populations by centile levels of Ht-for-Age and Wt-for-Ht,
19
or by determining the percentage of persons in the study
group whose values for either index are below an arbitrary
percentage of the reference population's median (50th
centile) value.
Objections have been raised against using reference
populations, such as those of Tanner (18) or Stuart and
Meredith (19),, for comparison in international studies.
These commonly employed reference populations of children,
predominantly middle-class Caucasians from Britain or the
United States, are considered by some critics to be
inappropriate for comparison with children of other socio
ec6nomic and ethnic backgrounds. In response to such
criticism, it is impc tant that the reference population
be considered not a "..:andard" but simply a measurement
tool whl!h provides a baseline for comparison among diverse
groups, with no implication of "normality" (20). For such
relative comparisons to be more useful to the country involved,
measurements may be made on a small group of children, with
perhaps 100 in each year of age, chosen deliberately from
the "elite," well-nourished segment of the population. Such
a special selected group would not be representative of the
whole subgroup nor composed of as many children as required
for a true reference population, but Walker and Richardson (21)
have shown that their observed Ht and Wt can validly indicate
the growth potential of the ethnic group under study.
20
The decision whether to present anthropometric data by
centiles, or by percent of a study population below an
arbitrary percent of a reference median value, will depend
mainly upon the nature of the study populaticn. Centiles
are usually more appropriate for data from industrialized
nations, where observed distributions of values are similar
to those of available reference populations. The percent of
a population below a certain percent of a reference median
value (for Ht-for-Age this is usually selected at 90 percent
of median, and for Wt-for-Ht, at 80 percent) is more appro
priate for less-developed nations, where observed median
values in many rural regions and urban slums may be well
below the 5th, or the 3rd, centiles of Western reference
populations (22). Standard deviation (SD) units may also
be utilized ao cut-off levels; minus 2.5 SD for instane
being less than the 1st centile.
It has been found particularly useful to present Ht-for-
Age and Wt-for-Ht data as percentages of the study population
above and below 90 percent and 80 percent, respectively, of
reference median values, in a cross-tabulation form proposed
by Waterlow (23). With this technique the degrees of long-term
stunting and shorter-term wasting in a population are readily
discernable. The limitations of such a presentation must be
recognized, especially when attempting to draw etiologic
inferences. Exactly how long in the past undernutrition may
21
have been operative in causing stunted growth cannot be deter
mined by data from one examination. The effect of causative
factors other than undernutrition, such as infectious diseases,
cannot be determined from simple anthropometrics alone, and
interpretation of results should be confined mainly to the
distribution and degree of abnormal growth, without speculating
upon its causes.
Feedback of assessment results should be made promptly
to the sponsoring health and governmental agencies whose task
it is to develop realistic plans for indicated remedial action.
What type of action program may be most appropriate and where
it should be implemented will depend upon the nature of these
results, further investigation into etiology, and the availa
bility of needed resources.
Reassessment of the study villages may be considered to
evaluate the effectiveness of subsequent intervention programs.
Such reassessment would constitute one form of nutritional
surveillance, but repeated surveys should not be considered
the sole form of nutritional surveillance. In other situa
tions different forms of surveillance may be more feasible
and equally useful. It is important to reiterate that this
simplified assessment of nutritional status can provide valid
and relatively inexpensive answers to the questions of where,
how much, and what kind of malnutrition may exist in a region
22
or a nation. An action program based upon further knowledge
of the etiologic correlates of malnutrition is likely to have
the greatest effectiveness. Therefore, a more detailed
ecological survey ar a followup to the simplified assessment
should be considered in areas where intervention is planned.
SUMMARY
A simple, inexpensive approach to the field assessment of
nutritional status is proposed to determine the location and
extent of protein-energy malnutrition and anemia in a defined
geographic area. The approach is characterized by two principal
features, a simple statistical method for randomly selecting
the population samples to be studied, and a suggested core of
objective nutritional indicators, uniformly measured, in young
children.
The basic measurements, length or height, weight, and hemo
globin are recomnended to be made on 30 randomly selected
children between 6 months and 6 years of age, in each of 30
randomly selected sites in each region for which valid
nutritional inferences are desired. Children in this age
range are assumed to be at maximum risk of malnutrition,
and their categorization by degree of physical growth impair
ment and anemia will in most cases reflect a community's
nutritional status. Additional measurements may be performed,
if indicated clinically or epidemiologically, and if feasible
economically and technically.
23
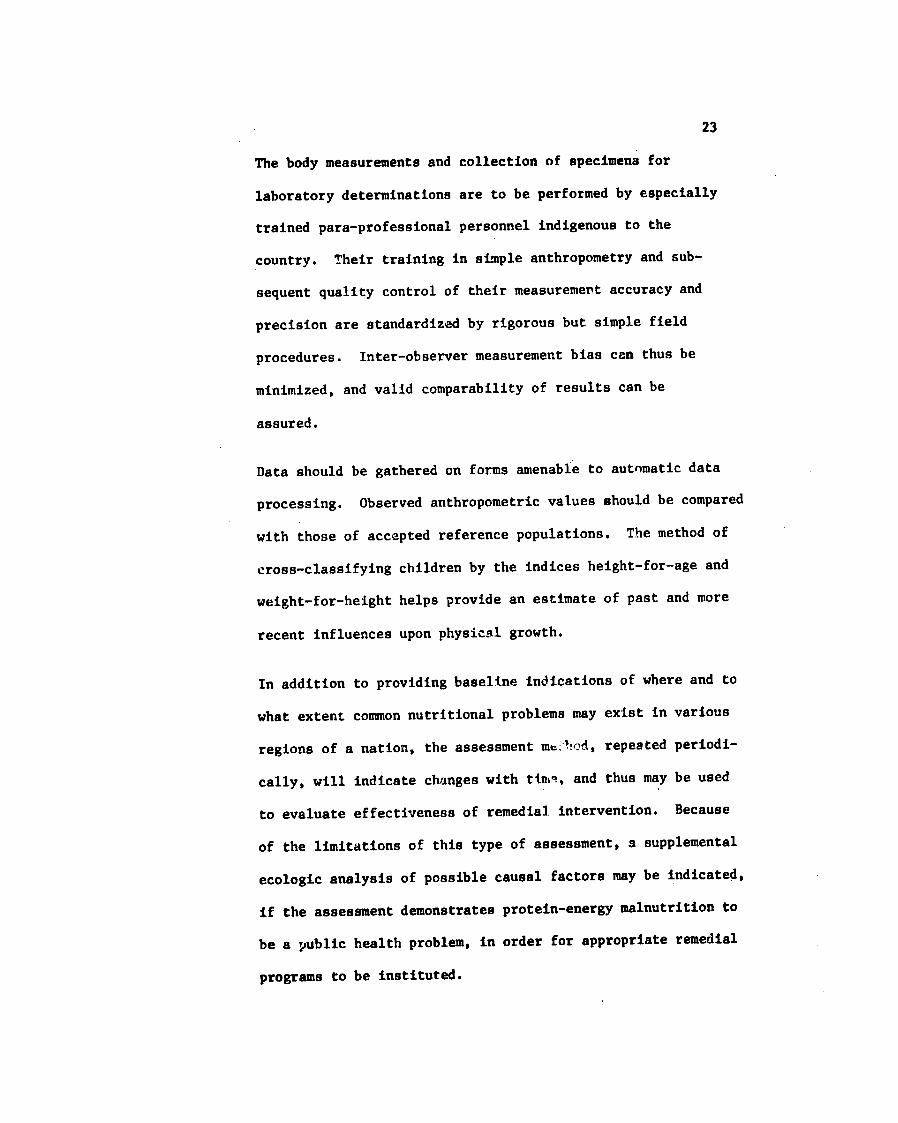
The body measurements and collection of specimens for
laboratory determinations are to be performed by especially
trained para-professional personnel indigenous to the
country. Their training in simple anthropometry and sub
sequent quality control of their measurement accuracy and
precision are standardized by rigorous but simple field
procedures. Inter-observer measurement bias can thus be
minimized, and valid comparability of results can be
assured.
Data should be gathered on forms amenable to automatic data
processing. Observed anthropometric values should be compared
with those of accepted reference populations. The method of
cross-classifying children by the indices height-for-age and
weight-for-height helps provide an estimate of past and more
recent influences upon physicsl growth.
In addition to providing baseline indications of where and to
what extent common nutritional problems may exist in various
regions of a nation, the assessment , repeated periodi
cally, will indicate changes with tinii, and thus may be used
to evaluate effectiveness of remedial intervention. Because
of the limitations of this type of assessment, a supplemental
ecologic analysis of possible causal factors may be indicated,
if the assessment demonstrates protein-energy malnutrition to
be a public health problem, in order for appropriate remedial
programs to be instituted.
REFERENCES
1. Bengoa, J.M., et al. Some indicators for a broad
assessment of the magnitude of protein-calorie malnutrition
in young children in population groups Amer. J. Clin. Nutr.,
7:714-720 (Nov.-Dec.1959).
2. U.S. Dept. of Health, Education, and Welfare, Public
Health Service, Center for Disease Control, in cooperation
with U.S. Agency for International Development. Nutritional
survey of registered war victims in the Republic of Vietnam
(1974).
3. Brink, E.W., et al. Nutritional status of children
in Nepal, 1975. Bull. WHO, 54:311-318 (1976).
4. U.S. Dept. of Health, Education, and Welfare, Public
Health Service, Center for Disease Control, in cooperation
with U.S. Agency for International Development and the Ministry
of Health, Government of Sri Lanka, CARE/Sri Lanka. Sri Lanka
nutrition status survey, Sept. 1976 - Mar. 1976 (1976).
5. UCLA Nutrition Assessment Unit, Division of Population,
Family and International Health, School of Public Health,
University of California, Los Angeles, in cooperation with
the Ministry of Health and Social Welfare, Republic of Liberia
and the U.S. Agency for International Development. Liberia
national nutrition survey, Dec. 4, 1975 - Mar. 25, 1976
(July 1976).
6. The Government of Lesotho, with the assistance of
the UCLA Nutrition Assessment Unit, Division of Population,
Family and International Health, School of Public Health,
University of California, Los Angeles, California, in
cooperation with the U.S. Agency for International Development.
The kingdom of Lesotho national nutrition survey (1976).
7. U.S. Dept. of Health, Education, and Welfare, Public
Health Service, Center for Disease Control, in cooperation
with U.S. Agency for International Development ancl the Ministry
of Rural Development, Government of Togo. Togo nutrition
status survey, October 1976 - January 1977 (June 1977).
8. Serfling, R.E. and Sherman, I.L. Attribute sampling
methods for local health departments. USDHEW, PHS, CDC, Atlanta,
Georgia, 1965.
9. Garn, S.M., & Rohmann, C.G. Interaction of nutrition
and genetics in the timing of growth and development. Pediat.
Clin. N. Amer., 13:353-379 (May 1966).
10. Jelliffe, D.B., & Jelliffe, E.F.P. The arm circum
ference as a public health index of protein-calorie malnutrition
of early childhood. XX. Current conclusions, J. Trop. Pediat.,
15:253 (Dec. 1969).
11. Zerfas, A.I. The insertion tape: a new circumference
tapt for use in nutritional assessment. Amer. J. Clin. Nutr.,
28:782-787 (July 1975).
12. Gurney, M., et a]. Anthropometry in the differential
diagnosis of protein-calorie malnutrition. J. Trop. Pediar.
and Environ. Child Health, 18:1-2 (Mar. 1972).
13. Malina, R.M., et al. Head and chest circumferences in
rural Guatemalan Ladino children, birth to 7 years of age.
Amer. J. Clin. Nutr., 28:1061-1070 (Sept. 1975).
14. Miale, J.B. Laboratory medicine: hematology
St. Louis, C.V. Mosby, 1972, pp. 475-481, 592-593.
15. Habicht, J.P. Standardization procedures for quanti
tative epidemiological field methods. Manual of internationally
comparable growth studies in Latin America and the Caribbean,
PAHO/WHO document, Washington, D.C., Oct. 1972, pp. 44-59.
16. Gomez, E., et al. Malnutrition in infancy and child
hood with special reference to kwashiorkor. In: Levine, S., ed.
Advances in pediatrics, vol. 7, Yearbook Publ., N.Y., 1955.
17. Seone, N., & Latham, M.C. Nutritional anthropometry
in the identification of malnutrition in childhood. J. Trop.
Pediat. and Environ. Child Health, 17:98-104 (Sept. 1971).
18. Tanner, J.M., et al. Standards from birth to maturity
for height, weight, height velocity, and weight velocity:
British children, 1965. Part I, Arch. Dis. Children, 41:454-471
(Oct. 1966). Part II, ibid., 41:613-35 (Dec. 1966).
19. Vaughan, V.C. III. Growth and development. In:
Vaughan, V.C. III, & McKay, B.J. (eds.), Nelson textbook of
pediatrics, 10th ed., W.B. Suanders, Philadelphia, 1975,
pp. 13-51.
20. Habicht, J-P; et al. Height and weight standards
for preschool children. How relevant are ethnic differences
in growth potential? Lancet, 1:611-615, (Apr. 6, 1974).
21. Walker, A.R.P., & Richardson, B.D. International
and local growth standards. Amer. J. Clin. Nutr., 26:897-900
(Aug. 1973).
22. Nichaman, M.Z., et al. The use of height and weight
indices for the classification of malnutrition in young
children. Lancet, in press.
23. Waterlow, J.C., & Rutishauser, I.H.E. Malnutrition
in man. In: Cravioto, J., Hambraeus, L., Vahlquist, B., eds.
Early malnutrition and mental development, Symposium of the
Swedish Nutrition Foundation, XII, Almquist and Wiksell,
Uppsala, 1974, pp. 13-26.