Embed Size (px)
Citation preview

An Analytical Method of Predicting Lee-Kesler-Plikker Binary Interaction Coefficients -
Part I: For Non-Polar Hydrocarbon Mixtures
Solomon D. Labinov Tlm-modynamic Center
Kiev? Ukraine
James R Sand Oak Ridge National Laboratory
Oak Ridge, TN
Resented at the Twelfth Symposhm on
Themphysical Properties June 1924,1994
Boulder, Colorado

Solomon D. Labinog, James R. Sand“
Paper presented at the Tbelfth Symposium on Thennophysical Properties, June 19-24,1994, Boulder, Colorado.
7.
3
4
Guest scientist at Oak Ridge National Laboratoly from the Thermodynamics Center, Kiev, Ukraine.
Oak Ridge National Laboratoly Energy Division P . 0 Box 2008, Building 3147, MS 6070 Oak Ridge, Tennessee 37831-6070
Author to whom correspondence should be addressed.
DISCLAIMER
This report was prepared as an a w u n t of work sponsored by an agency of the United States Government. Neither the United States Government nor any agency thereof, nor any of their employees, makes any warranty, express or implied, or assumes any legal liability or responsi- bility for the accuracy, completeness, or usefulness of any information, apparatus, product, or process disclosed, or represents that its use would not infringe privately owned rights. Refer- ence herein to any specific commercial product, process, or service by trade name, trademark, manufacturer, or otherwise does not necessarily constitute or imply its endorsement, recom- mendation, or favoring by the United States Government or any agency thereof. The views and opinions of authors expressed herein do not necessarily state or reflect those of the United States Government or any agency thereof.

DISCLAIMER
Portions of this document may be in electronic image produced from the document.
illegible products. Images are best available original

An Analytical Method of Predicting Lee-Kder-Pkker Binary Interaction Coefikknts -
Part I: For Non-Polar Hydrocarbon Mixtures
Solomon D. Labinov James R. Sand
Oak Ridge National Laboratory
ABsrRAcr An analytical method is proposed for finding numerical values of b i n q
interaction coefficients for non-polar hydrocarbon mixtures when the Lee-Kesler ox) equation of state is applied. The method is based on solving simultaneous equations,
which are Pliicker's mixing rules for pseudocritical parameters of a mixture, and the
Lee-Kesler equation for the saturation line.
For a hydrocarbon mixture, the method allows prediction of xii interaction
coefficients (ICs) which are close to values obtained by processing experimental p-v-t
data on the saturation line and subsequent averaging. For mixtwes of hydrocarbon
molecules containing from 2 to 9 carbon atoms, the divergence between calculated and
experimentally based ICs is no more than f 0.4%.
The possibility of extending application of this method'to other non-polar
substances is discussed.
KEYWORD3 algorithm; binary interaction coefficient; calculation; equation of
state; mixture; non-polar substance; thermophysical properties.

1. INTRODUCTIION
In 1975 Lee and Kesler proposed an equation of state for pure non-polar
substances and described mixing rules for calculating pressure-volume-temperature
(p-v-t) and thermodynamic properties of mixtures, but binary interaction coefficients
were not mentioned in this original work.’ In order to calculate the pseudocritical
temperature of mixtures, the authors proposed the well known equation:
where: T- is the pseudocritical temperature of a mixture, K;
Vcij = (1/8) (Vr + V p ;
Tcij = Pd* TJ” % ;
V,, Vci are critical molar volumes of the components i and j correspondingly, cm3/gm01;
T,, Tci are critical temperatures of the components i and j correspondingly, K; xi, X ,
are molar fractions of the components i and j correspondingly; xii equals one.
In 1978 V. J. Pliicker, H. Knapp, and J. Prausnitz extended this work by
publishing work applying the Lee and Kesler equation of state to phase equilibrium
analysis in mixtures of non-polar substances with a considerable difference in critical
1

parameters? For this purpose the authors estabbhed that equation (1) did not agree
with the experimental data, and they offered another formula for the pseudocritical
temperature of a mixture:
q is an empirical coefficient and K~ is a binary interaction coefficient (IC) that does
not depend on composition, pressure and temperature. The authors assigned a
universal numerical value of 0.25 to q, which they obtained by processing experimental
data. The K~~~~ was considered to be a fitting parameter determined by processing
experimental data exclusively. Numerical values of %s were calculated by the authors
for approximately one hundred binary combinations of non-polar components, and an
empirical correlation of these q ' s for mixtures of hydrocarbons and other non-polar
molecules was established as a function of the parameter (V, Td)/(Vd Td).
Henceforth, whenever the Lee and Kesler (LK) equation of state was used for mixture
analysis, the mixing rule indicated by equation (2) and x i s determined by processing
available experimental data were used for the thermodynamic property calculations.
In this manner the main advantage of the LK equation, which is the ability to
calculate properties of mixtures by making use of critical parameters of pure
components, was compromised. The original LK equation provided the opportunity
2

parameters might be estimated by a group contriiution method from only a structural
formula. Several unsuccessful attempts were made to restore this advantage by
predicting K ~ ~ . ~ from component parameters? This lack of success is not surprising,
because Kijav is a unique fitting parameter that depends not only on properties of
components but also on the extent to which the LK equation (and the models of
Benedict-Webb-Rubin (BWR) and Pitzer relation that are built-in) correspond to the
physical nature of substances and their mixtures.'$ It is necessary to remember that
the basic BWR equation was developed for natural gas property analysis, and the
Pitzer relation is good only for non-polar substances like hydrocarbons. Meanwhile,
the LK equation has come to be broadly used for various substances and their mixtures
including polar substances.
Additionally, the optimal values of K ~ . ~ differ for different thermophysical
properties, and various authors optimize K~~ by means of different minimization
functions working with different properties! As a result, the set of xiF values
reported in the literature is badly generalized and shows a large range of variability.
It is understandable that K~~~~ values obtained by different authors for the same
mixture differ considerably (Table 1): So, for non-polar and polar mixtures, the
development of an analytical method intended for predicting K~ values only on the
basis of mixture component parameters is still a very compelling problem. In Part I
of this article, the problem is solved for mixtures of non-polar substances.
3

2 INTERAcIlON COEFFICIENT CALCULATION
In this work an attempt is made to predict the values analytically, to
develop a fundamentally grounded method for the value prediction, and to
estimate the importance of factors that impact the accuracy of the prediction. The
most simple assumption that makes it possible to obtain the K~~ value is:
T- = Th, (3)
From this expression we have to find different values of K~~~~ for each value of molar
concentration, x , and then to average them. Table I1 presents the xij- values from
reference 2 and the K ~ ~ ~ . % ~ ~ values found from equation (3); the formula used for
averaging is:
0.9 Kijo25ak = ( c '(ir + 2y11 ;
x 4 . 1 (4)
K~~ values were determined over a range of molar compositions from 0.1 to 0.9 in 0.1
increments; the sum of values obtained was increased by two because xiiaZr = 1 when
x = 0, and x = 1.0. Table I1 shows that the calculated values track the experimental
values well, but, naturally, differ from them, because formula (1) is not sufficiently
accurate when mixtures of substances with large differences in critical parameters is
encountered. It is evident that the multiplier, K!, needed for Tcii in equation (1) differs
more from 1.0 with greater differences in critical parameters of mixture components.
The equations given in reference 1 were used to find the value of the multiplier.
4
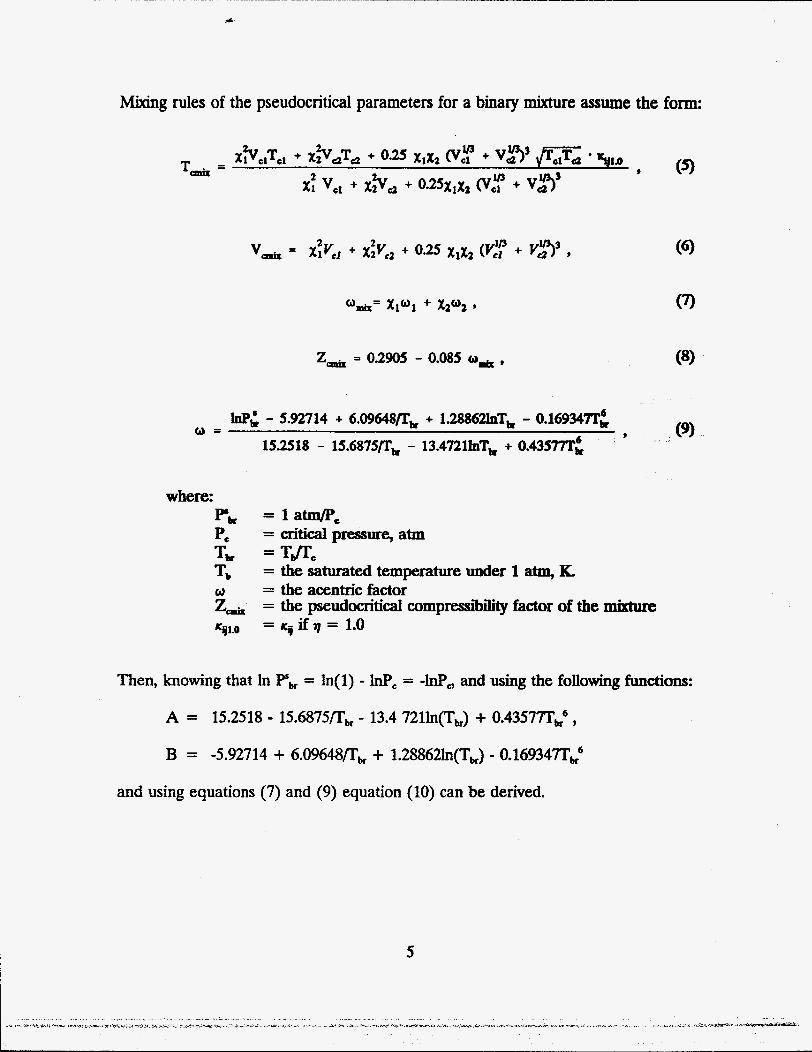
Mixing rules of the pseudocritical parameters for a binary mixture assume the form:
2- = 0.2905 - 0.085 ,
s (9) - 5.92714 + 6.09648/Tk + 1.28862hTk - 0.16934nL
a = 15.2518 - 15.6875/Tk - 13.47211nTk + 0.4357";
where: Pk = l a w e p, = critical pressure, atm
T b = the saturated temperature under 1 atm, K. w = the acentric. factor Z- = the pseudocritical COmpressiWity factor of the mjxture
Tbr =Tdrc
= 'L? i f q = 1.0
Then, knowing that In PIbr = In(1) - InP, = -InPo and using the following functions:
A = 15.2518 - 15.6875fI'bf - 13.4 721h(Tbf) + 0.43577Th6,
B = -5.92714 + 6.O9648flbr + 1.288621n(Th) - 0.169347T;
and using equations (7) and (9) equation (10) can be derived.
5

where: P M = the pseudocritical pressure of a mixture, atm,
= f,[(TJI'JJ for a mixture = fA('I'flJJ for a mixture
k i K
BDix A, = f,[(TflJ,] for a component 1 4 = f,[(TJI'J.J for a component 2 B, = f&"flJ,] for a component 1 & = f&Tfl&J for a component 2
(TDJmk is the pseudoparameter of a mkture, and the functions of fi and fi are those
shown for A and B above. Equation (10) fits the hypothesis that the LK equation is
based on: that a mixture is a pseudosubstance. Using equation (10) the following may
be determined:
where: R = 8204, (gas law constant; [atma3~mole-oIc]).
If equation (1 1) is set equal to equation (9, an equation with two unknowns,
(TJTJmi. and rcGt0, results. The dependence of (TdT,),, on x is defined by the change
of two parameters: T,, and Tad both are pseudoparameters. The dependence of
TCmk on molar composition is given by equation (5); an equation similar to equation
(5) Cart be written for the pseudoparameter Tam&:
6

where: + = l/%d T,,,, Tbz are normal boiling temperatures of the components
1 and 2. Setting equation (1 1) equal to equation ( 5 ) and implementing equation (12),
will result in an equation with only one unknom wijl.,. With these uijla0 values, the aWz
values may be calculated by setting equation (11) equal to equation (2) for each value
of x and subsequent averaging in accordance with equation (4).
3. RESULTS
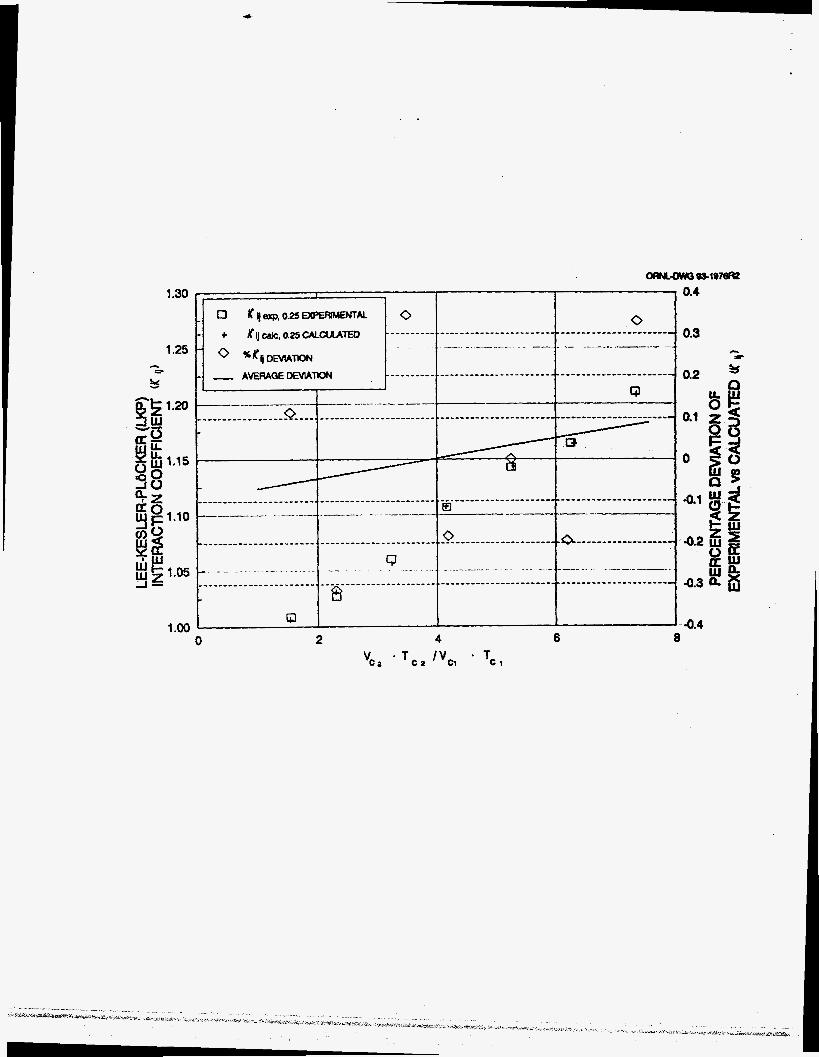
In Figure 1, the xiiO.% values are presented, which have been obbined by
processing experimental data for mixtures of hydrocarbons containing components with
2-9 carbon atoms in their structure, and the xiio= values obtained by the method
described above? When the K ~ ~ ~ . ~ ~ values were obtained, equation (8) was used to
determine Zcmir For some mixtures, the experimental data show values that slightly
differ from calculated values. This can be explained with the help of Figure 2. This
figure shows that the actual 2, values of components (and, consequently, Z-) are
sometimes different from the values obtained from equation (8).
The maximum divergence between the calculated and experimentd 5 values
(that is % K ~ ~ ~ ~ ~ ) was approximately & 0.4% with an average divergence f 0.1%, which
may be considered quite satisfactory (see Figure 1).
7

In Figure 3. the change of the calculated (’I’JI’Jli. values is plotted against the
pseudocritical volume of the mixture, Vd for ethane-propane and ethane-nonane
mixtures. The change of the (TOc) d u e against Vc for pure hydrocarbons C, - C, is also shown. The functions almost coincide which confirms the validity of the
hypothesis descriiing a mixture as a pseudosubstance.
4. CONCLUSIONS
The method outlined above makes it possible to obtain binary interaction
coefficients values, K ~ , for the LK equations of state with an average deviation of 0.1%
using the critical parameters of mixture components, and their normal boiling
temperatures, T,,. The method does not have any restrictions imposed by the nature
of the components and may be recommended as a general method for calculating the
K~~ values when the LK equation of state is applied to mixtures of non-polar substances.
5. ACKNOWLEDGEMJ3UT3
Research sponsored by the Office of Building Technologies, U.S. Department
of Energy under contract No. DE-AC05-840R21400 with Oak Ridge National
Laboratory, managed by Martin Marietta Energy Systems, Inc.
REFERENCES
1.
2.
3.
B.I. Lee and M.G. Kesler, AIChE J., 21: 150 (1975).
U. Pliicker, H. Knapp, and J.M. Prausnitz, Int. Chem. Proc., 17: 324 (1978).
S.W. WaIas, Phase Equilibria in Chemical E n g k e h g , Butterworth Publishers, Boston (1985).
8

REFERENCES
1.
2.
3.
B.I. Lee and M.G. Kesler, AIChE J., 21: 150 (1975).
U. Pliicker, €3. Knapp, and J.M. Prausnitz, Int. Chem. Proc., 17: 324 (1978).
S.W. Walas, Phase EquiZibria in Chemical Engineering, Buttenvorth Publishers, Boston (1985).
4. M. Benedict, G.B. Webb, and LC. Rubin, Chem. Eng. Phys., 10: 747 (1942).
5. ICs. Pitzer and G.O. Hultgren, J. Am. Chem. Soc., @: 4793 (1958).
6. K. Striim, State and 7kansprt Prop& of High Temperature Working F W and Nonazeotropic Mixture: h. A, B, & C, Final Report, E A Annex XIII, Chalmers University of Technology, Giiteborg, Sweden, 1992.
9

Table L VariatMlls in LReKesler-Plikker Interaction CoefIicient from Experimental Data
Mixture
R-22/R-114
R-22/R- 152a
Author
Hackstein Kruse Str6m Valtz Radermacher ~
Lame Strum Valtz Kruse Radermacher ~-
Lavue Stram Kruse Radermacher
q (%Y) 0.963 0.975 0.979 0.973
1.013 1.014 ----
-e--
---- 0.975 1.042 0.973 P
0.997 1.096 1.046 1.038 ----
---- I-
0.97
Table IL Comparison of 1IF;rCperimental to Calculated Ledbler-PBcker heraction Coefficients Using Equation (3)
Mixture I ethane & ethane & ethane & ethane & ethane & ethane & ethane & propane n-butane n-pentane n-hexane n-heptane n-octane n-nonane %c, c, c4 %c, % c6 c,c, c, C8 c,c, 1.01 1.029 1.064 1.106 1.143 1.165 1.214
1.0113 1.0333 1.0605 1 .OB73 1.1147 1.1417 1.1676 Kijarp.
Kijuic
1.30
1.25 =
5s
1 .oo
p . . ...
0
s
A -0.4 6 a
I

0.6
0.5 n
3 0.4
2 0.3 0
e f5 0.2
IL
Z w 0 0.1
3
, . - . .... ..
.
I I I t
0.24 0.25 0.26 0.27 0.28 0.29 0.30 0
COMPRESSIBIUP/ FACTOR (Zc )
i


FIGURE CAPTIONS cpart I)
Figure 1. Comparison of experimental to calculated interaction coefficients for mixtures of ethane with longer, straight-chain alkanes through n-nonane, and relative deviation of experimental versus calculated K ~ S : 0 - I C ~ . ~ -; 0 - % K ~ deviation.
+ - K ~ , , ~ &;
Figure 2. Experimental and calculated compressibility factors, 2, obtained from equation (8), plotted against the acentric factor, a, for methane (1) through n-decane (IO): 0 - experimental; - - calculated.
Figure 3. The reduced boiling temperature, Tdr, of pure substances C,-C, and the reduced pseudo-boiling temperature, (TJI’Jra for mixtures of ethanehonane and ethane/propane plotted against critical volumes (Ve Vc mJ:
+ - (TJI’J- for ethanehonane; 0 - (TbT,),, for ethane/propane; - Tbr, for C,-C,