Embed Size (px)
Citation preview
CyTOF® 2 Mass Cytometer User Manual
PN 400200 A5
i
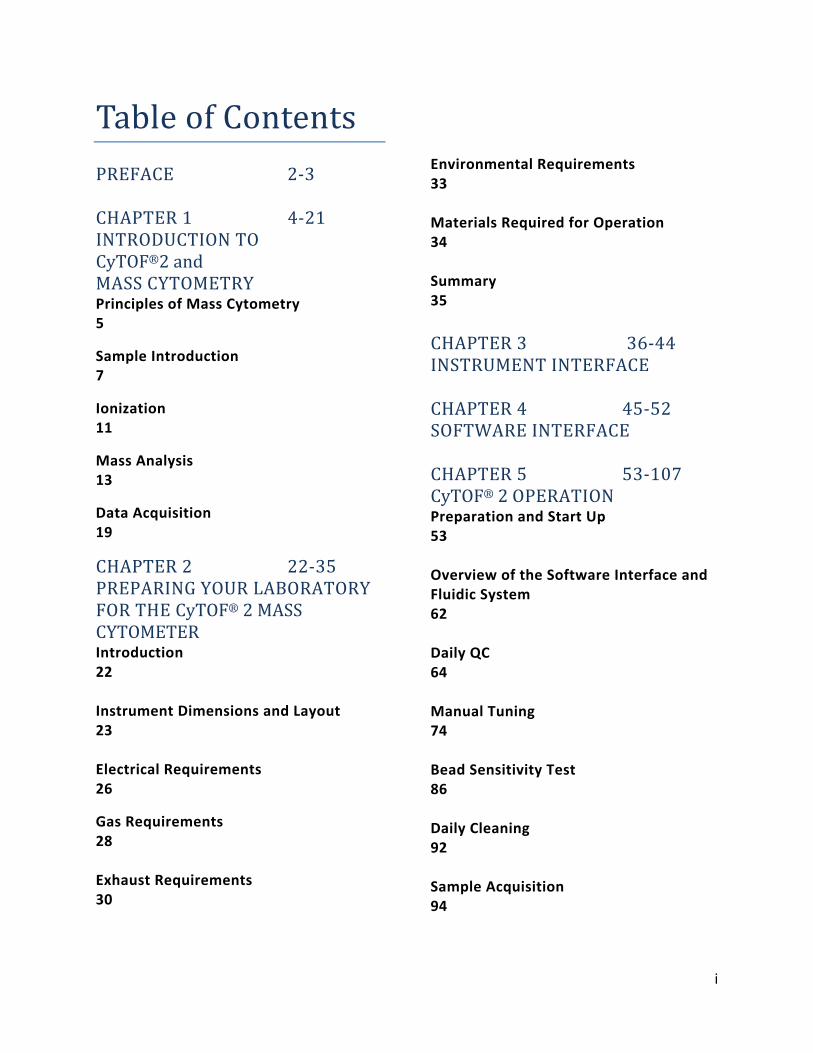
TableofContents
PREFACE 2‐3
CHAPTER1 4‐21INTRODUCTIONTOCyTOF®2andMASSCYTOMETRYPrinciples of Mass Cytometry5
Sample Introduction 7
Ionization 11
Mass Analysis 13
Data Acquisition 19
CHAPTER2 22‐35PREPARINGYOURLABORATORYFORTHECyTOF®2MASSCYTOMETERIntroduction 22
Instrument Dimensions and Layout 23
Electrical Requirements 26
Gas Requirements 28
Exhaust Requirements30
Environmental Requirements33
Materials Required for Operation 34
Summary 35
CHAPTER3 36‐44INSTRUMENTINTERFACE
CHAPTER4 45‐52SOFTWAREINTERFACE
CHAPTER5 53‐107CyTOF®2OPERATIONPreparation and Start Up 53
Overview of the Software Interface and Fluidic System 62
Daily QC 64
Manual Tuning 74
Bead Sensitivity Test 86
Daily Cleaning 92
Sample Acquisition 94

ii
Shutdown: Turning Off Plasma 96
Other Features 97
Unexpected Plasma Outages 101
Consumables 107
CHAPTER6 108‐149MAINTENANCEOverview of CyTOF ®2 Maintenance and Cleaning 108
Cleaning the Nebulizer after Plasma
Shutdown 112
Maintenance of the Spray Chamber
and the Torch Assembly 116
Cleaning the Load Coil 121
Removal of the Cones 123
Cleaning of the Cones 127
Reinsertion of the Cones 128
Reassembly of the Torch 129
Installation of Torch Assembly 131
Checking the Torch Alignment 133
Instrument Air Filters 136
Rotary Pumps 136
Unscheduled Maintenance 144
Procedure for Expected Power Outages 148
CHAPTER7 150‐163SAFETYIntroduction 150 Safety Alert Conventions General Safety Guidelines 152
Environmental Conditions 153
Electrical Safety 154
Chemical Safety 157
Pressurized Gas Safety 159
Other Hazards 162
References
164‐171
163
CHAPTER8
TROUBLESHOOTING


2
Preface This manual provides:
• An overview of the CyTOF®2 instrument and technology,• Instructions for calibration, operation, data acquisition and maintenance,• Safety recommendations for operation of the instrument,• Troubleshooting recommendations.
This document contains information proprietary and confidential to Fluidigm Corporation and is for customer use in the operation and maintenance of CyTOF® equipment or is for vendor use in the specification, fabrication and manufacture of Fluidigm Corporation designed component parts. Any other use, disclosure or reproduction of the information contained herein is strictly forbidden, except as Fluidigm Corporation may authorize in writing.
Equipment described in this document may be protected under one or more patents filed in the United States, Canada and other countries. Additional patents are pending.
Software described in this document may be furnished under a license agreement. It is against the law to copy the software on any medium, except as specifically allowed in the license agreement.
Portions of this document may make reference to other manufacturers’ products, which may contain parts that are patented and may contain parts whose names are trademarked. Any such usage is intended only to designate those manufacturers’ products as supplied by Fluidigm Corporation for incorporation into its equipment.
Fluidigm Corporation assumes no responsibility or contingent liability for any use to which the purchaser may subject the equipment described herein, or for any adverse circumstances arising therefrom.
This is a Class A device and is for use in commercial, industrial or business environments.
Warning: This is a Class A product. In a domestic environment this product may cause radio interference, in which case the user may be required to take adequate measures.

3
Do not make an unauthorized modifications to your CyTOF 2 system or accompanying computer system. The computer system has been configured to for the use only with the CyTOF 2 system. It is recommended that no modifications or updates to the operating system and drivers be performed. Installation of non-essential software be kept to a minimum.
C7-UM-01 Rev 5
4
Chapter1IntroductiontoCyTOF®2andMassCytometry
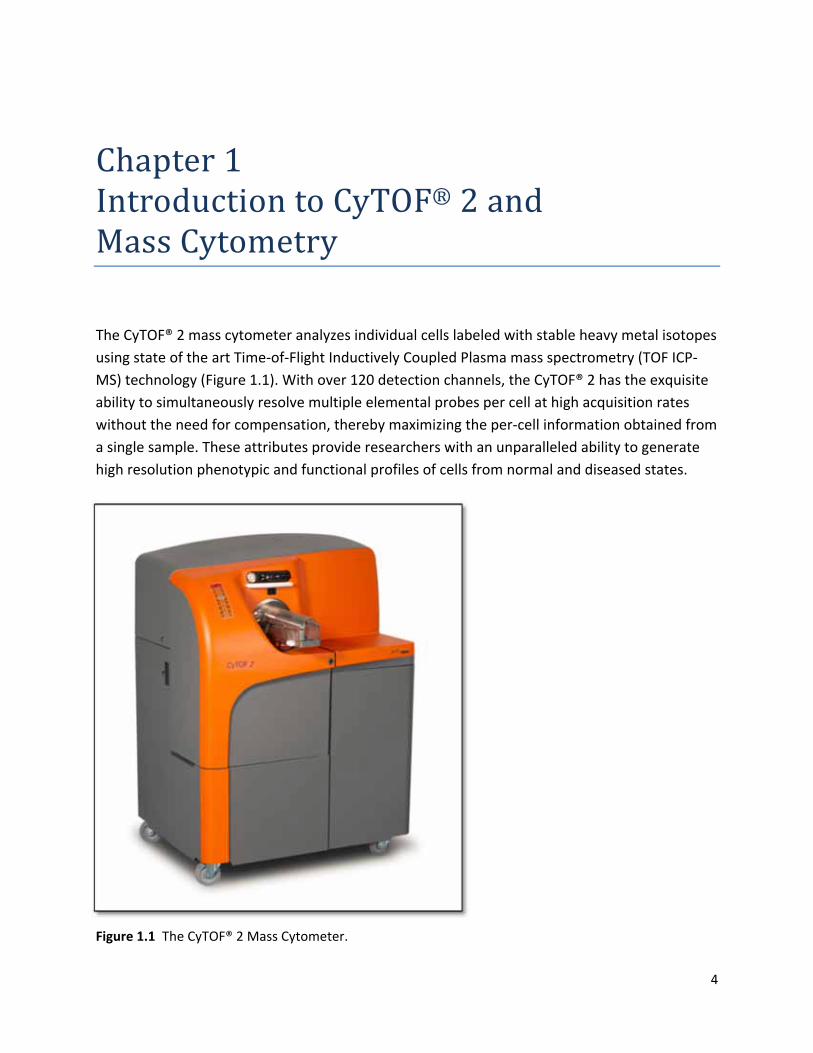
The CyTOF® 2 mass cytometer analyzes individual cells labeled with stable heavy metal isotopes
using state of the art Time‐of‐Flight Inductively Coupled Plasma mass spectrometry (TOF ICP‐
MS) technology (Figure 1.1). With over 120 detection channels, the CyTOF® 2 has the exquisite
ability to simultaneously resolve multiple elemental probes per cell at high acquisition rates
without the need for compensation, thereby maximizing the per‐cell information obtained from
a single sample. These attributes provide researchers with an unparalleled ability to generate
high resolution phenotypic and functional profiles of cells from normal and diseased states.
Figure 1.1 The CyTOF® 2 Mass Cytometer.
5
PrinciplesofMassCytometry
Mass cytometry employs elemental tags that have higher molecular weights than those
elements that are naturally abundant in biological systems. The CyTOF® 2 is specifically
designed to measure these high mass elemental tags on a per‐cell basis.
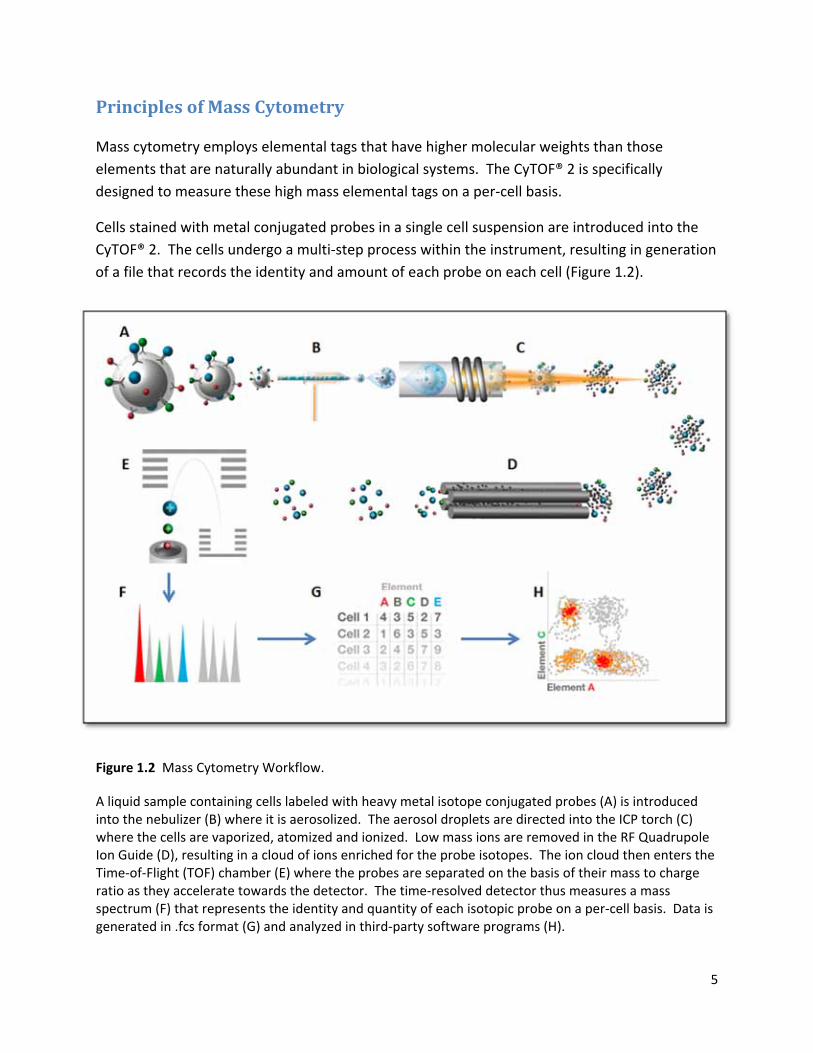
Cells stained with metal conjugated probes in a single cell suspension are introduced into the
CyTOF® 2. The cells undergo a multi‐step process within the instrument, resulting in generation
of a file that records the identity and amount of each probe on each cell (Figure 1.2).
Figure 1.2 Mass Cytometry Workflow.
A liquid sample containing cells labeled with heavy metal isotope conjugated probes (A) is introduced into the nebulizer (B) where it is aerosolized. The aerosol droplets are directed into the ICP torch (C) where the cells are vaporized, atomized and ionized. Low mass ions are removed in the RF Quadrupole Ion Guide (D), resulting in a cloud of ions enriched for the probe isotopes. The ion cloud then enters the Time‐of‐Flight (TOF) chamber (E) where the probes are separated on the basis of their mass to charge ratio as they accelerate towards the detector. The time‐resolved detector thus measures a mass spectrum (F) that represents the identity and quantity of each isotopic probe on a per‐cell basis. Data is generated in .fcs format (G) and analyzed in third‐party software programs (H).
6
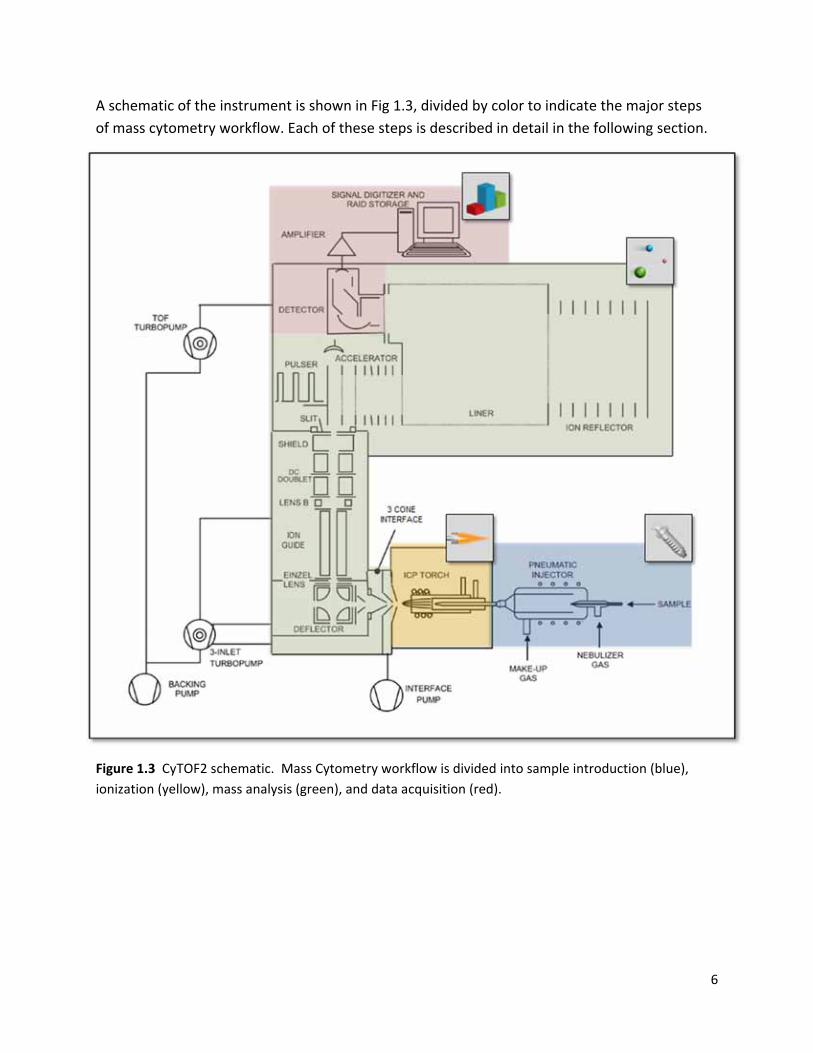
A schematic of the instrument is shown in Fig 1.3, divided by color to indicate the major steps
of mass cytometry workflow. Each of these steps is described in detail in the following section.
Figure 1.3 CyTOF2 schematic. Mass Cytometry workflow is divided into sample introduction (blue),
ionization (yellow), mass analysis (green), and data acquisition (red).
7
SampleIntroduction
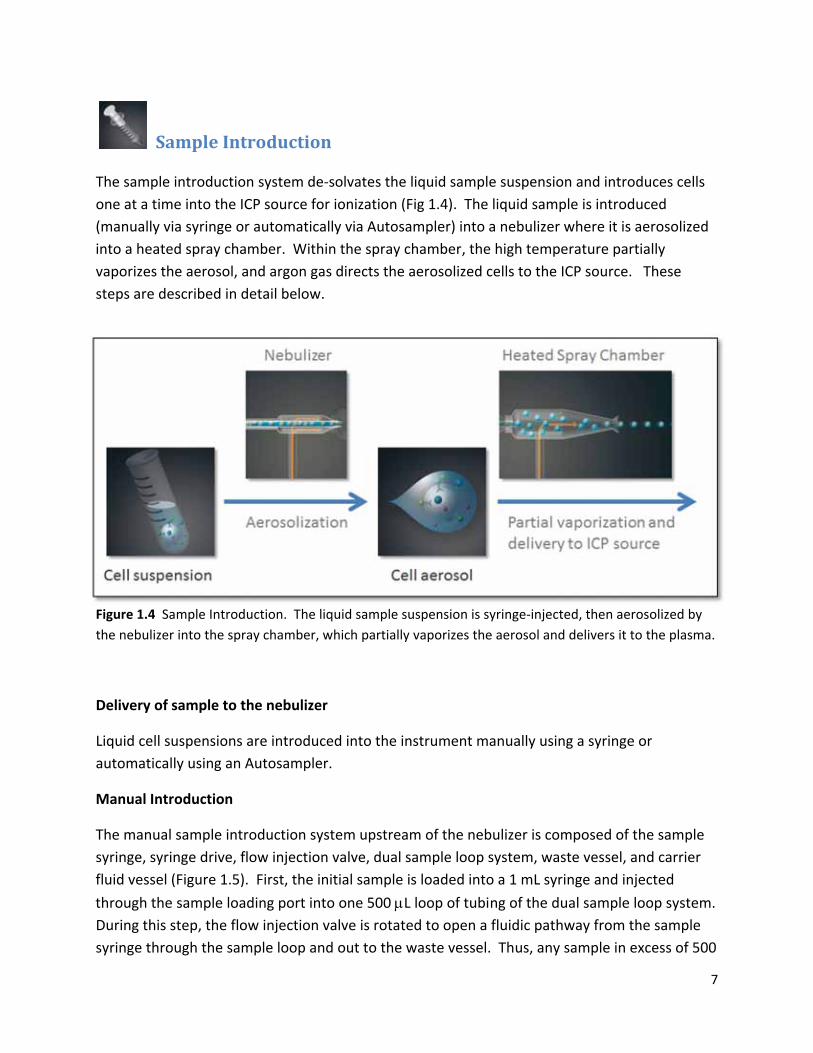
The sample introduction system de‐solvates the liquid sample suspension and introduces cells
one at a time into the ICP source for ionization (Fig 1.4). The liquid sample is introduced
(manually via syringe or automatically via Autosampler) into a nebulizer where it is aerosolized
into a heated spray chamber. Within the spray chamber, the high temperature partially
vaporizes the aerosol, and argon gas directs the aerosolized cells to the ICP source. These
steps are described in detail below.
Figure 1.4 Sample Introduction. The liquid sample suspension is syringe‐injected, then aerosolized by
the nebulizer into the spray chamber, which partially vaporizes the aerosol and delivers it to the plasma.
Delivery of sample to the nebulizer
Liquid cell suspensions are introduced into the instrument manually using a syringe or
automatically using an Autosampler.
Manual Introduction
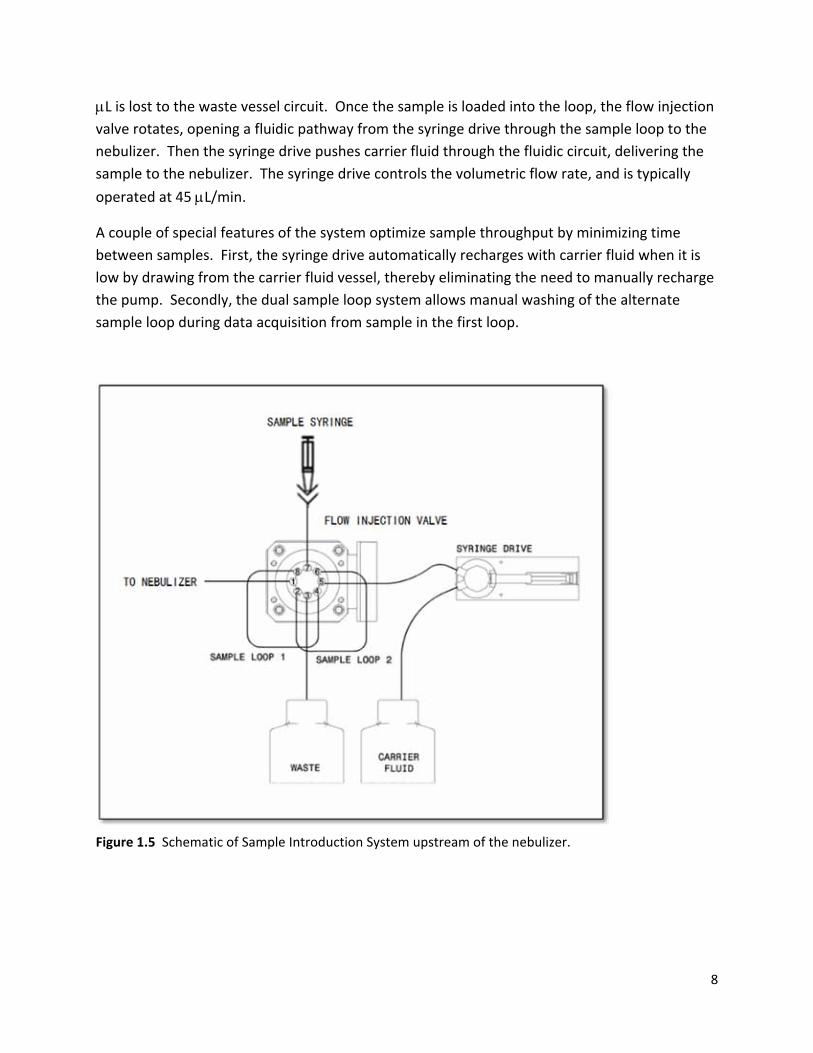
The manual sample introduction system upstream of the nebulizer is composed of the sample
syringe, syringe drive, flow injection valve, dual sample loop system, waste vessel, and carrier
fluid vessel (Figure 1.5). First, the initial sample is loaded into a 1 mL syringe and injected
through the sample loading port into one 500 L loop of tubing of the dual sample loop system.
During this step, the flow injection valve is rotated to open a fluidic pathway from the sample
syringe through the sample loop and out to the waste vessel. Thus, any sample in excess of 500
8
L is lost to the waste vessel circuit. Once the sample is loaded into the loop, the flow injection
valve rotates, opening a fluidic pathway from the syringe drive through the sample loop to the
nebulizer. Then the syringe drive pushes carrier fluid through the fluidic circuit, delivering the
sample to the nebulizer. The syringe drive controls the volumetric flow rate, and is typically
operated at 45 L/min.
A couple of special features of the system optimize sample throughput by minimizing time
between samples. First, the syringe drive automatically recharges with carrier fluid when it is
low by drawing from the carrier fluid vessel, thereby eliminating the need to manually recharge
the pump. Secondly, the dual sample loop system allows manual washing of the alternate
sample loop during data acquisition from sample in the first loop.
Figure 1.5 Schematic of Sample Introduction System upstream of the nebulizer.
9
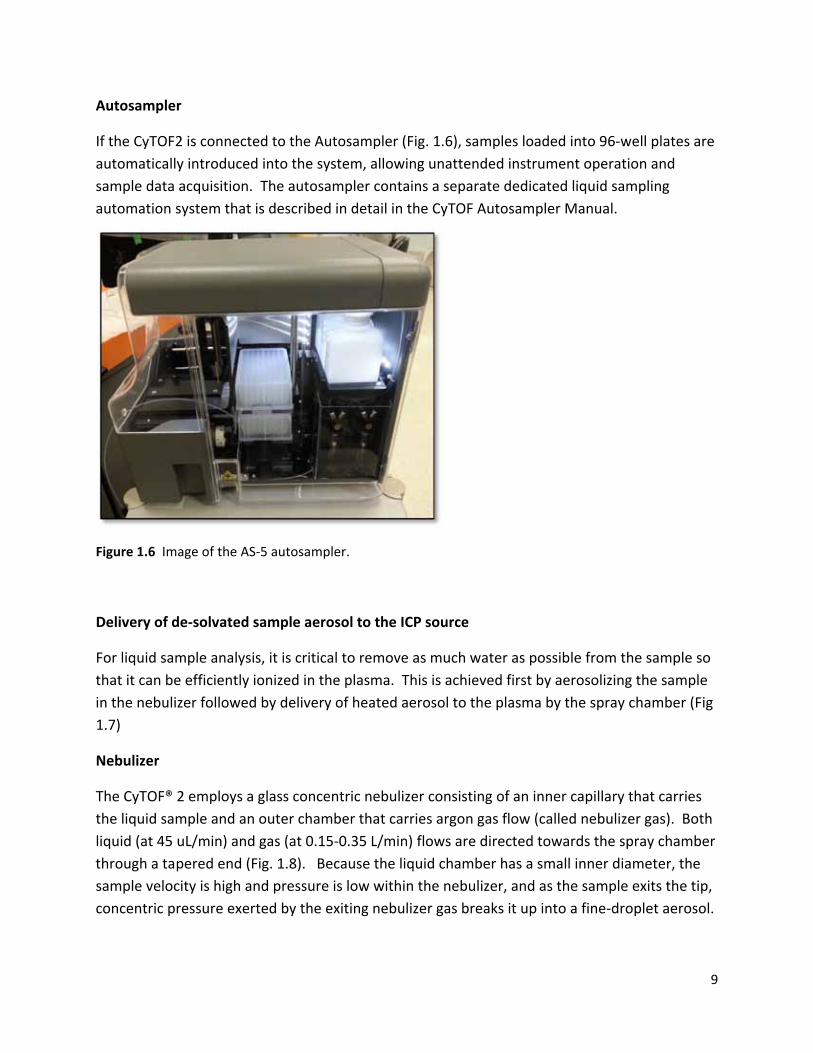
Autosampler
If the CyTOF2 is connected to the Autosampler (Fig. 1.6), samples loaded into 96‐well plates are
automatically introduced into the system, allowing unattended instrument operation and
sample data acquisition. The autosampler contains a separate dedicated liquid sampling
automation system that is described in detail in the CyTOF Autosampler Manual.
Figure 1.6 Image of the AS‐5 autosampler.
Delivery of de‐solvated sample aerosol to the ICP source
For liquid sample analysis, it is critical to remove as much water as possible from the sample so
that it can be efficiently ionized in the plasma. This is achieved first by aerosolizing the sample
in the nebulizer followed by delivery of heated aerosol to the plasma by the spray chamber (Fig
1.7)
Nebulizer
The CyTOF® 2 employs a glass concentric nebulizer consisting of an inner capillary that carries
the liquid sample and an outer chamber that carries argon gas flow (called nebulizer gas). Both
liquid (at 45 uL/min) and gas (at 0.15‐0.35 L/min) flows are directed towards the spray chamber
through a tapered end (Fig. 1.8). Because the liquid chamber has a small inner diameter, the
sample velocity is high and pressure is low within the nebulizer, and as the sample exits the tip,
concentric pressure exerted by the exiting nebulizer gas breaks it up into a fine‐droplet aerosol.
10
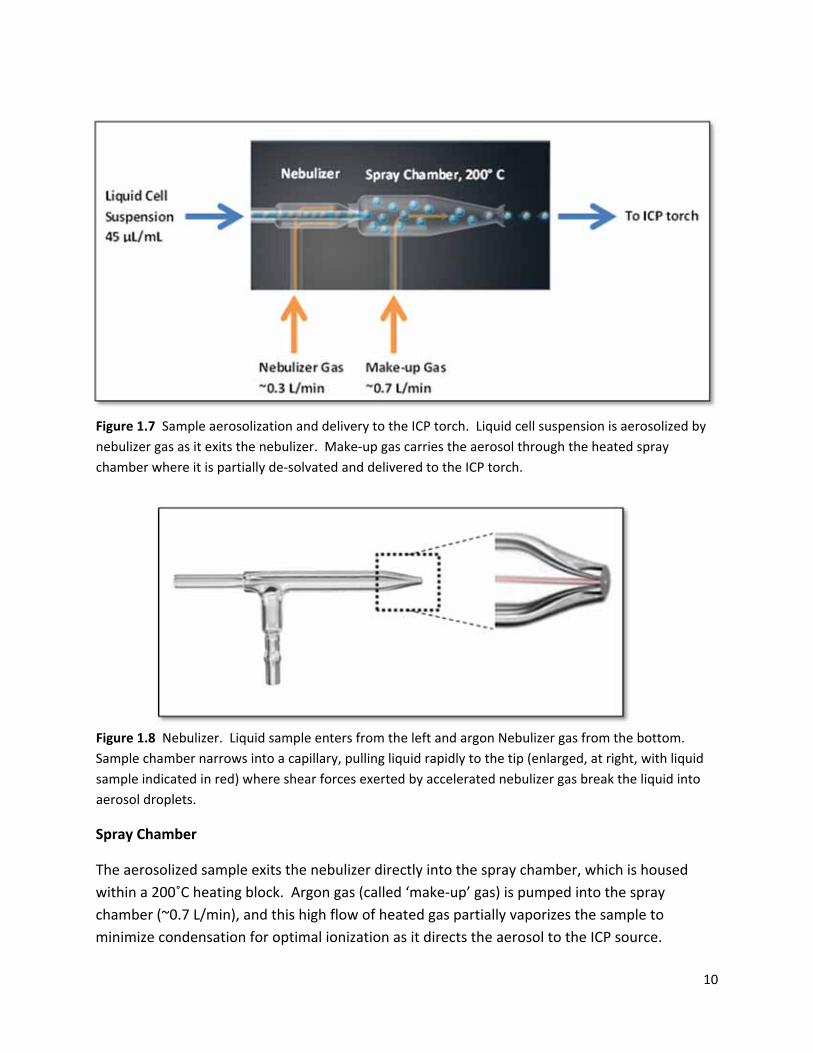
Figure 1.7 Sample aerosolization and delivery to the ICP torch. Liquid cell suspension is aerosolized by
nebulizer gas as it exits the nebulizer. Make‐up gas carries the aerosol through the heated spray
chamber where it is partially de‐solvated and delivered to the ICP torch.
Figure 1.8 Nebulizer. Liquid sample enters from the left and argon Nebulizer gas from the bottom.
Sample chamber narrows into a capillary, pulling liquid rapidly to the tip (enlarged, at right, with liquid
sample indicated in red) where shear forces exerted by accelerated nebulizer gas break the liquid into
aerosol droplets.
Spray Chamber
The aerosolized sample exits the nebulizer directly into the spray chamber, which is housed
within a 200˚C heating block. Argon gas (called ‘make‐up’ gas) is pumped into the spray
chamber (~0.7 L/min), and this high flow of heated gas partially vaporizes the sample to
minimize condensation for optimal ionization as it directs the aerosol to the ICP source.
11
Ionization
The mixture of single cell aerosol droplets and argon that exits the spray chamber is
transmitted to the ICP source where it is successively vaporized, atomized and ionized in the
plasma for subsequent mass analysis (Fig 1.9). The formation and characteristics of the plasma
responsible for the ionization process are described below.
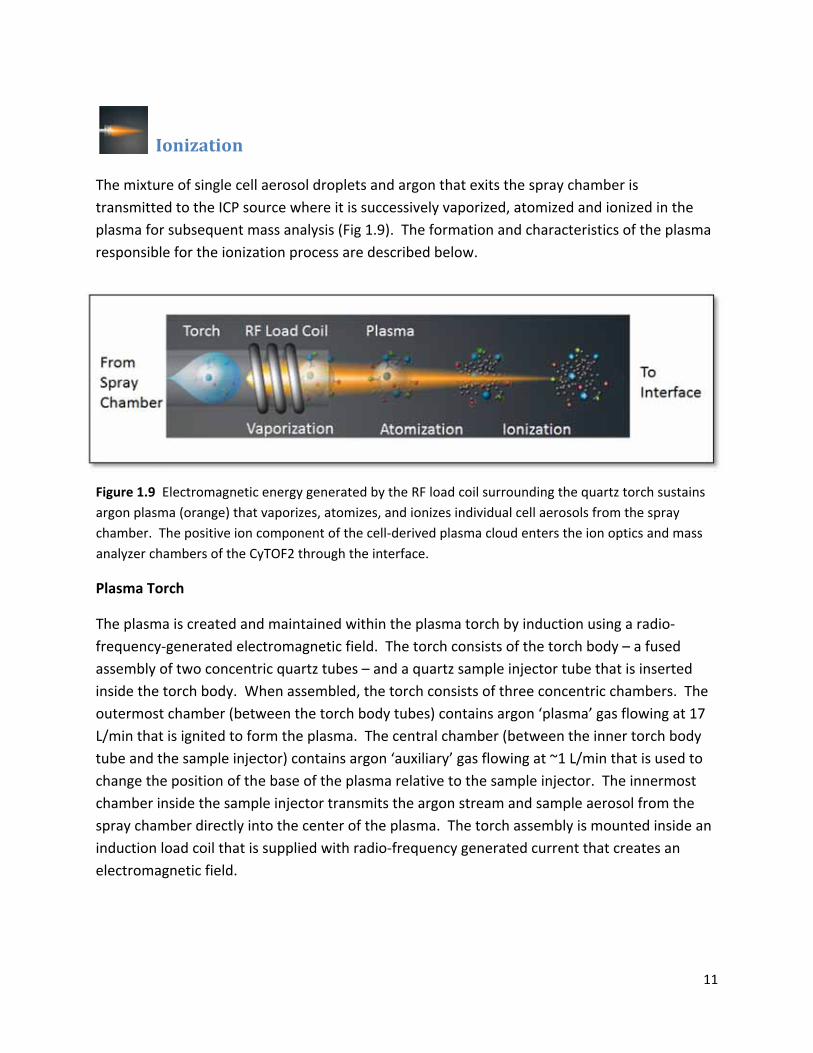
Figure 1.9 Electromagnetic energy generated by the RF load coil surrounding the quartz torch sustains
argon plasma (orange) that vaporizes, atomizes, and ionizes individual cell aerosols from the spray
chamber. The positive ion component of the cell‐derived plasma cloud enters the ion optics and mass
analyzer chambers of the CyTOF2 through the interface.
Plasma Torch
The plasma is created and maintained within the plasma torch by induction using a radio‐
frequency‐generated electromagnetic field. The torch consists of the torch body – a fused
assembly of two concentric quartz tubes – and a quartz sample injector tube that is inserted
inside the torch body. When assembled, the torch consists of three concentric chambers. The
outermost chamber (between the torch body tubes) contains argon ‘plasma’ gas flowing at 17
L/min that is ignited to form the plasma. The central chamber (between the inner torch body
tube and the sample injector) contains argon ‘auxiliary’ gas flowing at ~1 L/min that is used to
change the position of the base of the plasma relative to the sample injector. The innermost
chamber inside the sample injector transmits the argon stream and sample aerosol from the
spray chamber directly into the center of the plasma. The torch assembly is mounted inside an
induction load coil that is supplied with radio‐frequency generated current that creates an
electromagnetic field.
12
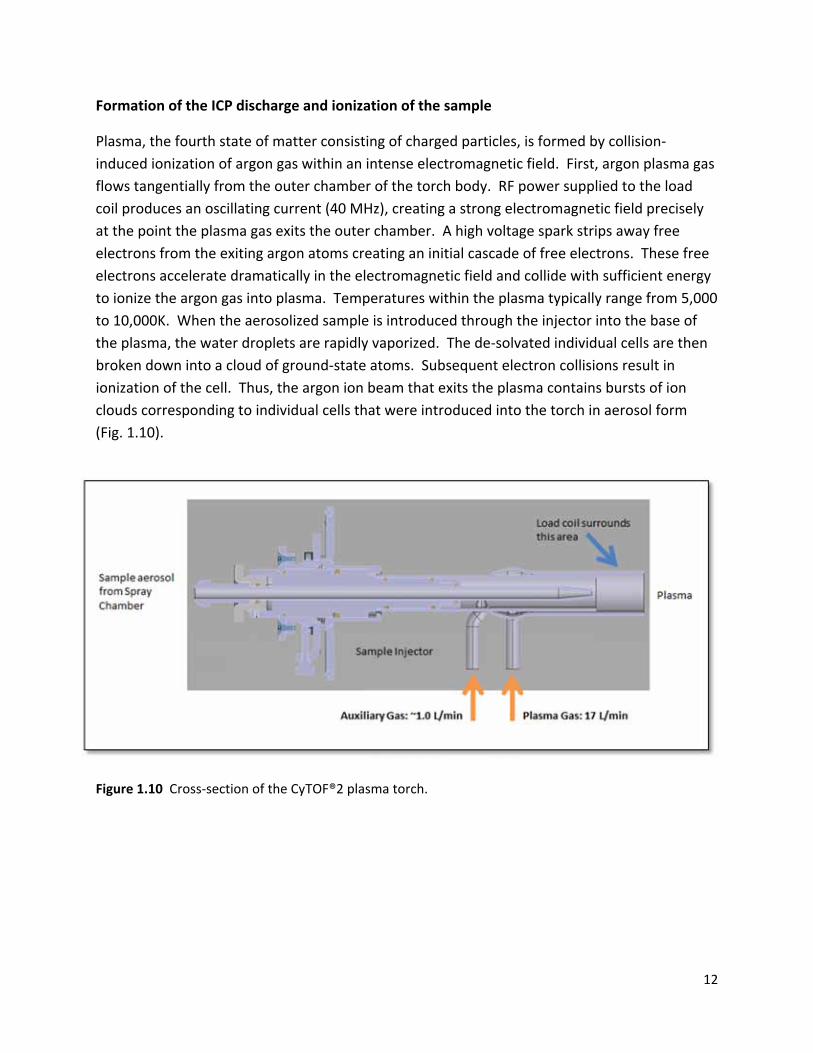
Formation of the ICP discharge and ionization of the sample
Plasma, the fourth state of matter consisting of charged particles, is formed by collision‐
induced ionization of argon gas within an intense electromagnetic field. First, argon plasma gas
flows tangentially from the outer chamber of the torch body. RF power supplied to the load
coil produces an oscillating current (40 MHz), creating a strong electromagnetic field precisely
at the point the plasma gas exits the outer chamber. A high voltage spark strips away free
electrons from the exiting argon atoms creating an initial cascade of free electrons. These free
electrons accelerate dramatically in the electromagnetic field and collide with sufficient energy
to ionize the argon gas into plasma. Temperatures within the plasma typically range from 5,000
to 10,000K. When the aerosolized sample is introduced through the injector into the base of
the plasma, the water droplets are rapidly vaporized. The de‐solvated individual cells are then
broken down into a cloud of ground‐state atoms. Subsequent electron collisions result in
ionization of the cell. Thus, the argon ion beam that exits the plasma contains bursts of ion
clouds corresponding to individual cells that were introduced into the torch in aerosol form
(Fig. 1.10).
Figure 1.10 Cross‐section of the CyTOF®2 plasma torch.
13
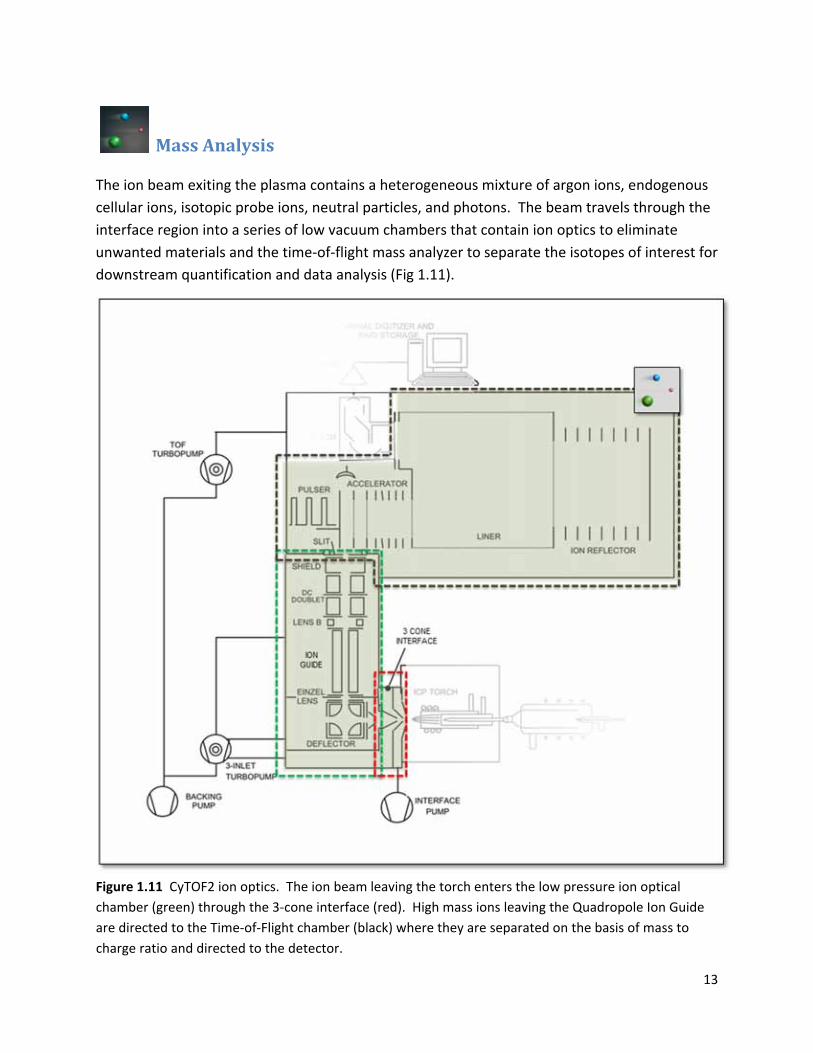
MassAnalysis
The ion beam exiting the plasma contains a heterogeneous mixture of argon ions, endogenous
cellular ions, isotopic probe ions, neutral particles, and photons. The beam travels through the
interface region into a series of low vacuum chambers that contain ion optics to eliminate
unwanted materials and the time‐of‐flight mass analyzer to separate the isotopes of interest for
downstream quantification and data analysis (Fig 1.11).
Figure 1.11 CyTOF2 ion optics. The ion beam leaving the torch enters the low pressure ion optical
chamber (green) through the 3‐cone interface (red). High mass ions leaving the Quadropole Ion Guide
are directed to the Time‐of‐Flight chamber (black) where they are separated on the basis of mass to
charge ratio and directed to the detector.
14
Interface Region
In order to analyze the identity and amount of isotopic probes in each cell derived cloud, the
high temperature ion beam exiting the plasma at atmospheric pressure (760 Torr) passes
through a series of ion focusing and separating chambers. These require low vacuum to
eliminate any collisions with gas molecules on the pathway to the detector. To achieve this, the
plasma is sampled through an interface region that dramatically reduces the temperature and
pressure of the incoming ion clouds (Fig. 1.12).
The purpose of the interface region is to efficiently transport ions from the high temperature
plasma at atmospheric pressure to the room temperature chambers that house the ion optics
at less than 10‐3 Torr. The CyTOF2 uses a three‐cone interface to transport the ion beam into a
low pressure vacuum: sampler (1.1 mm diameter orifice), skimmer (1 mm) and reducer (1.2
mm). All three cones are made of nickel, and the interface housing is water‐cooled to dissipate
the significant heat generated by the plasma. The rapidly expanding ion clouds exiting the
plasma enter the sampler cone orifice into the sampler‐skimmer region, which is pumped by a
40 m3/h rotary pump to 2.3‐2.5 Torr. The ions then pass through the skimmer cone to the
skimmer‐reducer region, which is pumped by the 25 L/s stage of the 3‐stage turbo‐molecular
pump to 2‐4x10‐2 Torr. Finally, the ions pass through the reducer cone which serves not only to
reduce the pressure (300 L/s stage of the 3‐stage pump de‐pressurizes the chamber to 3‐5x10‐4
Torr), but also to focus the ion beam to the downstream ion optics. The ions that emerge from
the reducer cone are accelerated and focused by an electrostatic field defined by the potentials
of the reducer and a downstream conical lens, and the subsequent highly focused beam is
propagated to the ion optics and mass analyzer.
15
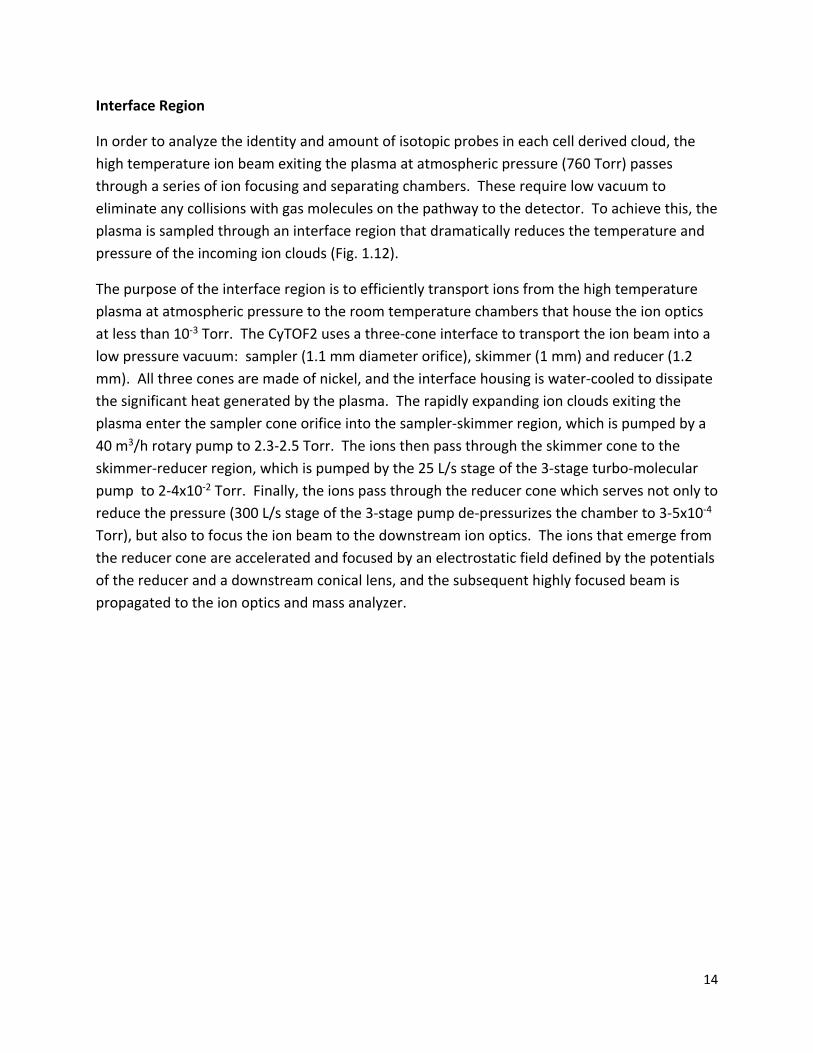
Figure 1.12 The vacuum interface includes three nickel interface cones: sampler (red), skimmer (blue)
and reducer (green). Cells ionized in the plasma (yellow) expand to approximately 2 mm in size before
entering the interface through the sampler cone. Once inside the vacuum, the ion clouds no longer
expand.
Quadrupole Ion Deflector The beam propagating through the reducer contains some non‐ionized material and photons in addition to ions. If not filtered, neutrals can attach to instrument components resulting in signal drift, and photons that reach the detector are registered erroneously as ions. To eliminate these problems, the ions in the beam are deflected perpendicularly through an electrostatic quadrupole ion deflector. This turns positively charged ions towards the downstream ion optics, while neutrals and photons follow an undisturbed pathway into the turbo molecular pump. RF Quadrupole Ion Guide The pure ion beam leaving the quadrupole ion deflector is dominated by low mass ions that are not of analytical interest (H+, C+, O+, N+, OH+, CO+, O2+, Ar+, ArH+, ArO+) and that are of such
16
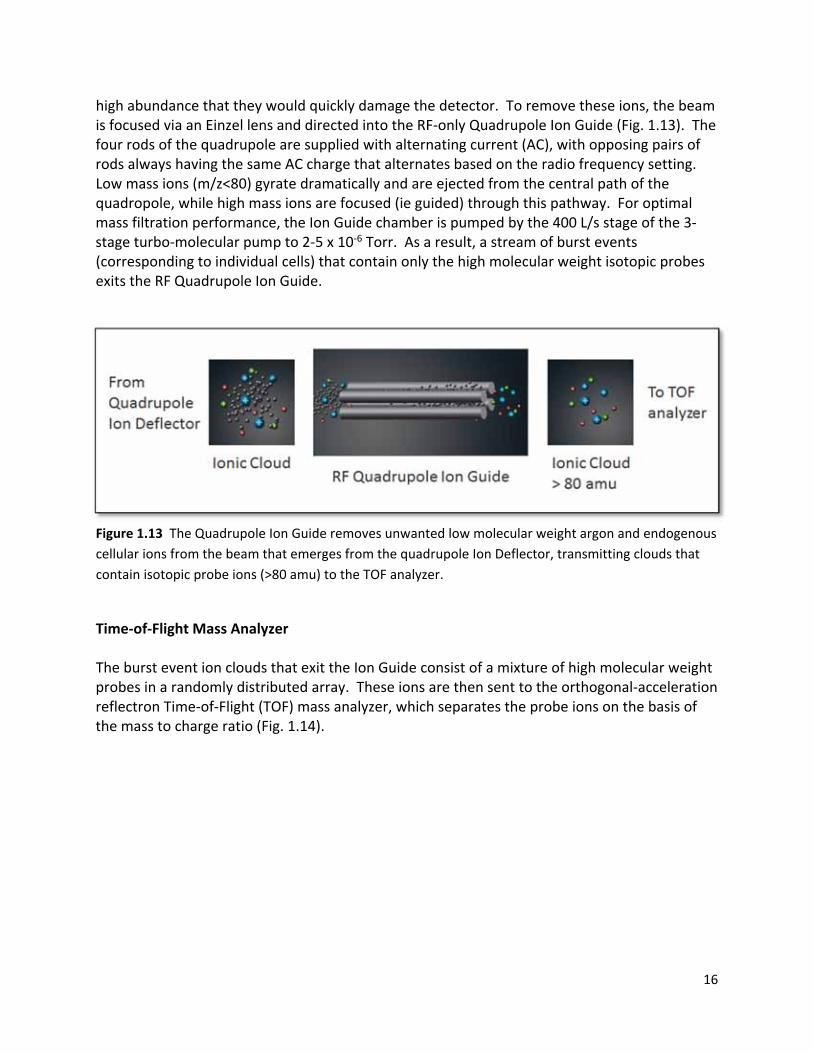
high abundance that they would quickly damage the detector. To remove these ions, the beam is focused via an Einzel lens and directed into the RF‐only Quadrupole Ion Guide (Fig. 1.13). The four rods of the quadrupole are supplied with alternating current (AC), with opposing pairs of rods always having the same AC charge that alternates based on the radio frequency setting. Low mass ions (m/z<80) gyrate dramatically and are ejected from the central path of the quadropole, while high mass ions are focused (ie guided) through this pathway. For optimal mass filtration performance, the Ion Guide chamber is pumped by the 400 L/s stage of the 3‐stage turbo‐molecular pump to 2‐5 x 10‐6 Torr. As a result, a stream of burst events (corresponding to individual cells) that contain only the high molecular weight isotopic probes exits the RF Quadrupole Ion Guide. Figure 1.13 The Quadrupole Ion Guide removes unwanted low molecular weight argon and endogenous
cellular ions from the beam that emerges from the quadrupole Ion Deflector, transmitting clouds that
contain isotopic probe ions (>80 amu) to the TOF analyzer.
Time‐of‐Flight Mass Analyzer The burst event ion clouds that exit the Ion Guide consist of a mixture of high molecular weight probes in a randomly distributed array. These ions are then sent to the orthogonal‐acceleration reflectron Time‐of‐Flight (TOF) mass analyzer, which separates the probe ions on the basis of the mass to charge ratio (Fig. 1.14).
17
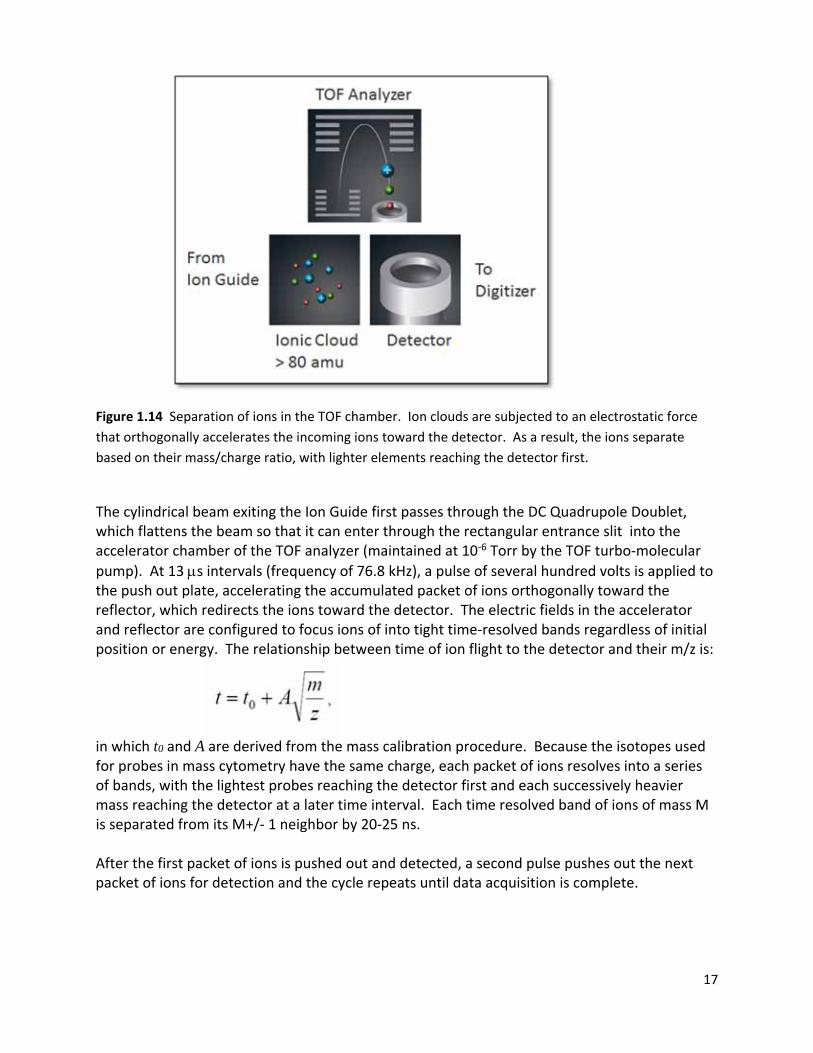
Figure 1.14 Separation of ions in the TOF chamber. Ion clouds are subjected to an electrostatic force
that orthogonally accelerates the incoming ions toward the detector. As a result, the ions separate
based on their mass/charge ratio, with lighter elements reaching the detector first.
The cylindrical beam exiting the Ion Guide first passes through the DC Quadrupole Doublet, which flattens the beam so that it can enter through the rectangular entrance slit into the accelerator chamber of the TOF analyzer (maintained at 10‐6 Torr by the TOF turbo‐molecular
pump). At 13 s intervals (frequency of 76.8 kHz), a pulse of several hundred volts is applied to the push out plate, accelerating the accumulated packet of ions orthogonally toward the reflector, which redirects the ions toward the detector. The electric fields in the accelerator and reflector are configured to focus ions of into tight time‐resolved bands regardless of initial position or energy. The relationship between time of ion flight to the detector and their m/z is: in which t0 and A are derived from the mass calibration procedure. Because the isotopes used for probes in mass cytometry have the same charge, each packet of ions resolves into a series of bands, with the lightest probes reaching the detector first and each successively heavier mass reaching the detector at a later time interval. Each time resolved band of ions of mass M is separated from its M+/‐ 1 neighbor by 20‐25 ns. After the first packet of ions is pushed out and detected, a second pulse pushes out the next packet of ions for detection and the cycle repeats until data acquisition is complete.
18
Vacuum system
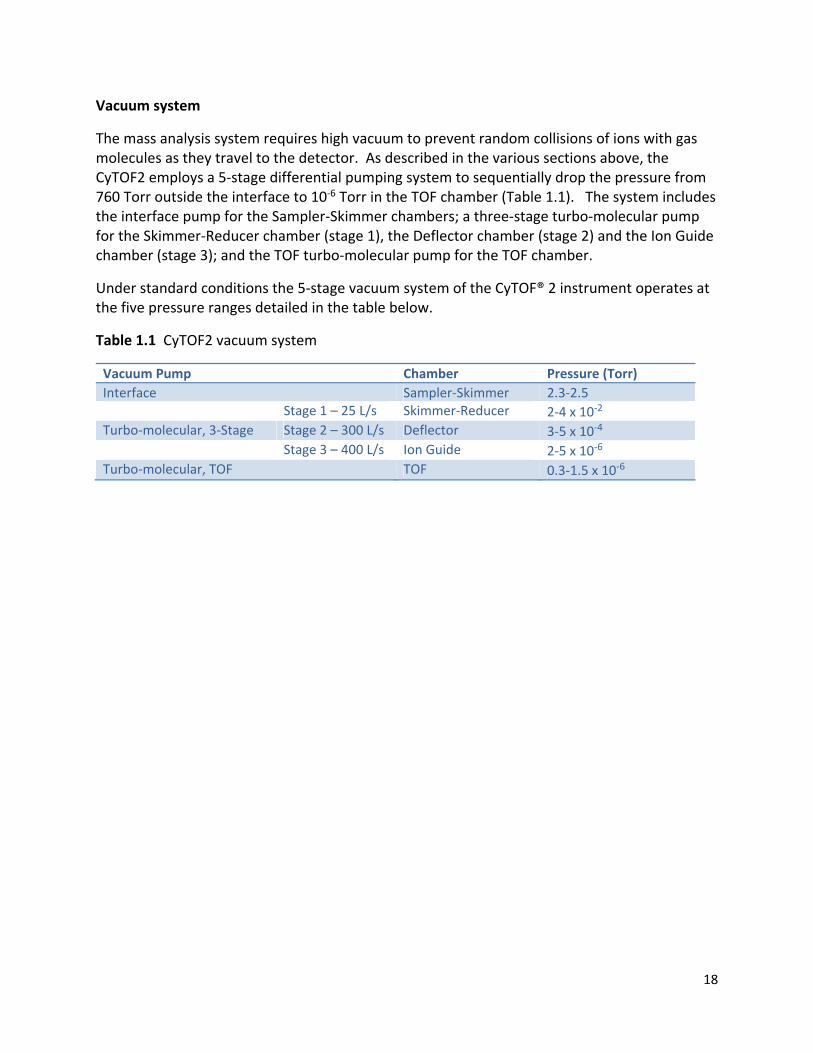
The mass analysis system requires high vacuum to prevent random collisions of ions with gas molecules as they travel to the detector. As described in the various sections above, the CyTOF2 employs a 5‐stage differential pumping system to sequentially drop the pressure from 760 Torr outside the interface to 10‐6 Torr in the TOF chamber (Table 1.1). The system includes the interface pump for the Sampler‐Skimmer chambers; a three‐stage turbo‐molecular pump for the Skimmer‐Reducer chamber (stage 1), the Deflector chamber (stage 2) and the Ion Guide chamber (stage 3); and the TOF turbo‐molecular pump for the TOF chamber.
Under standard conditions the 5‐stage vacuum system of the CyTOF® 2 instrument operates at the five pressure ranges detailed in the table below.
Table 1.1 CyTOF2 vacuum system
Vacuum Pump Chamber Pressure (Torr)
Interface Sampler‐Skimmer 2.3‐2.5 Stage 1 – 25 L/s Skimmer‐Reducer 2‐4 x 10‐2 Turbo‐molecular, 3‐Stage Stage 2 – 300 L/s Deflector 3‐5 x 10‐4 Stage 3 – 400 L/s Ion Guide 2‐5 x 10‐6
Turbo‐molecular, TOF TOF 0.3‐1.5 x 10‐6
19
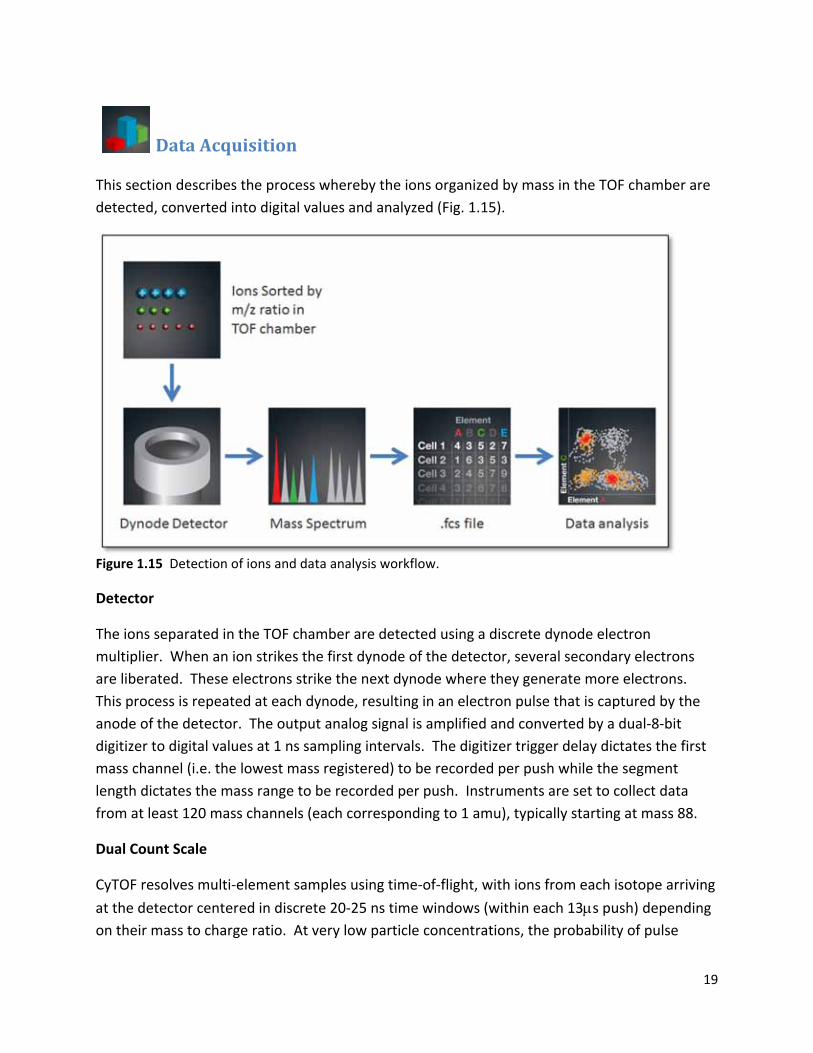
DataAcquisition
This section describes the process whereby the ions organized by mass in the TOF chamber are
detected, converted into digital values and analyzed (Fig. 1.15).
Figure 1.15 Detection of ions and data analysis workflow.
Detector
The ions separated in the TOF chamber are detected using a discrete dynode electron
multiplier. When an ion strikes the first dynode of the detector, several secondary electrons
are liberated. These electrons strike the next dynode where they generate more electrons.
This process is repeated at each dynode, resulting in an electron pulse that is captured by the
anode of the detector. The output analog signal is amplified and converted by a dual‐8‐bit
digitizer to digital values at 1 ns sampling intervals. The digitizer trigger delay dictates the first
mass channel (i.e. the lowest mass registered) to be recorded per push while the segment
length dictates the mass range to be recorded per push. Instruments are set to collect data
from at least 120 mass channels (each corresponding to 1 amu), typically starting at mass 88.
Dual Count Scale
CyTOF resolves multi‐element samples using time‐of‐flight, with ions from each isotope arriving
at the detector centered in discrete 20‐25 ns time windows (within each 13s push) depending on their mass to charge ratio. At very low particle concentrations, the probability of pulse
20
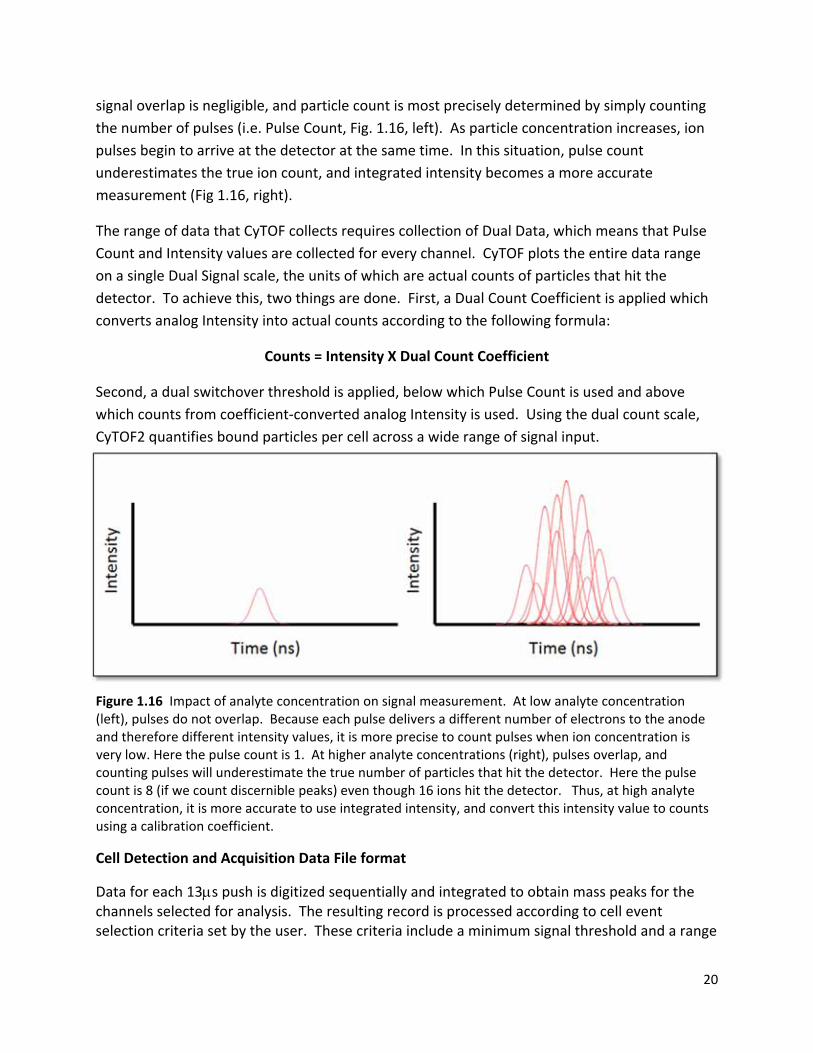
signal overlap is negligible, and particle count is most precisely determined by simply counting
the number of pulses (i.e. Pulse Count, Fig. 1.16, left). As particle concentration increases, ion
pulses begin to arrive at the detector at the same time. In this situation, pulse count
underestimates the true ion count, and integrated intensity becomes a more accurate
measurement (Fig 1.16, right).
The range of data that CyTOF collects requires collection of Dual Data, which means that Pulse
Count and Intensity values are collected for every channel. CyTOF plots the entire data range
on a single Dual Signal scale, the units of which are actual counts of particles that hit the
detector. To achieve this, two things are done. First, a Dual Count Coefficient is applied which
converts analog Intensity into actual counts according to the following formula:
Counts = Intensity X Dual Count Coefficient
Second, a dual switchover threshold is applied, below which Pulse Count is used and above
which counts from coefficient‐converted analog Intensity is used. Using the dual count scale,
CyTOF2 quantifies bound particles per cell across a wide range of signal input.
Figure 1.16 Impact of analyte concentration on signal measurement. At low analyte concentration (left), pulses do not overlap. Because each pulse delivers a different number of electrons to the anode and therefore different intensity values, it is more precise to count pulses when ion concentration is very low. Here the pulse count is 1. At higher analyte concentrations (right), pulses overlap, and counting pulses will underestimate the true number of particles that hit the detector. Here the pulse count is 8 (if we count discernible peaks) even though 16 ions hit the detector. Thus, at high analyte concentration, it is more accurate to use integrated intensity, and convert this intensity value to counts using a calibration coefficient.
Cell Detection and Acquisition Data File format
Data for each 13s push is digitized sequentially and integrated to obtain mass peaks for the channels selected for analysis. The resulting record is processed according to cell event selection criteria set by the user. These criteria include a minimum signal threshold and a range

21
for event duration consistent with single cell events. As a result, the data acquired contains the integrated number of total ion counts for each selected analyte on a per‐cell basis. These data are saved as text (.txt) and flow cytometry standard (.fcs) 3.0 format for data analysis in compatible software programs.
22
Chapter2PreparingYourLaboratoryfortheCyTOF®2MassCytometer
Introduction
This chapter is designed to help you with the preparation for the reception and successful
installation of your CyTOF® 2 mass cytometer instrument. The CyTOF® 2 mass cytometer is
shipped to you as a complete system with the exception of the following items which must be
obtained prior to installation: electrical power, exhaust vents, and argon gas supply with
approved regulator.
When preparing the laboratory for instrument installation by a Fluidigm Service Specialist, the
following items must be considered:
Receiving the instrument
System layout
Electrical requirements
Argon gas requirements
Exhaust ventilation Environmental conditions
Materials required for maintenance and operation
23
InstrumentDimensionsandLayout
CrateInformation
The instrument is shipped in a single fully packaged crate. A standard pump truck with minimum
rating for 1t/1600lbs is recommended for moving the crate if necessary. Once you have received
the crate, store it in a dry place not exposed to weather until the scheduled installation date.
Table 2.1 provides the dimensions of the instrument crate.
Table 2.1 Dimensions of crated CyTOF®2 instrument.
Component Width (cm/in) Height (cm/in) Depth (cm/in) Weight (kg/lb)
CyTOF®2 213/84 106/42 157/62 635/1400
CyTOF®2Information
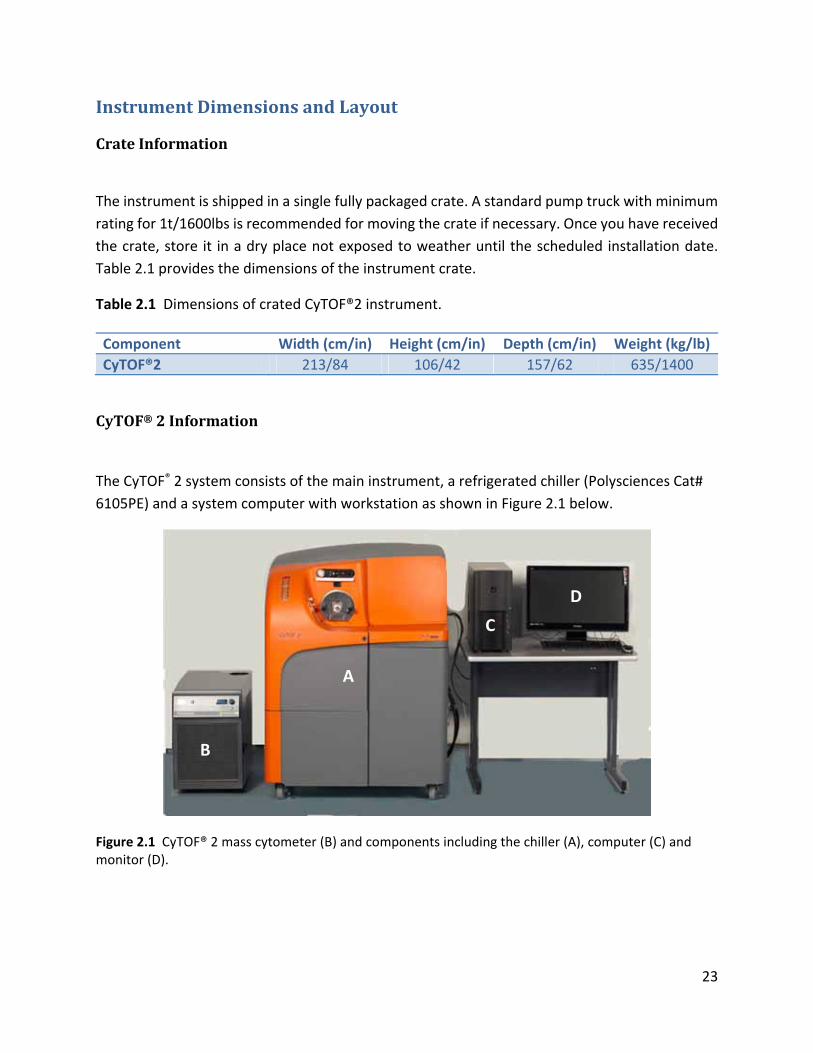
The CyTOF® 2 system consists of the main instrument, a refrigerated chiller (Polysciences Cat#
6105PE) and a system computer with workstation as shown in Figure 2.1 below.
Figure 2.1 CyTOF® 2 mass cytometer (B) and components including the chiller (A), computer (C) and monitor (D).
A
B
C
D
24
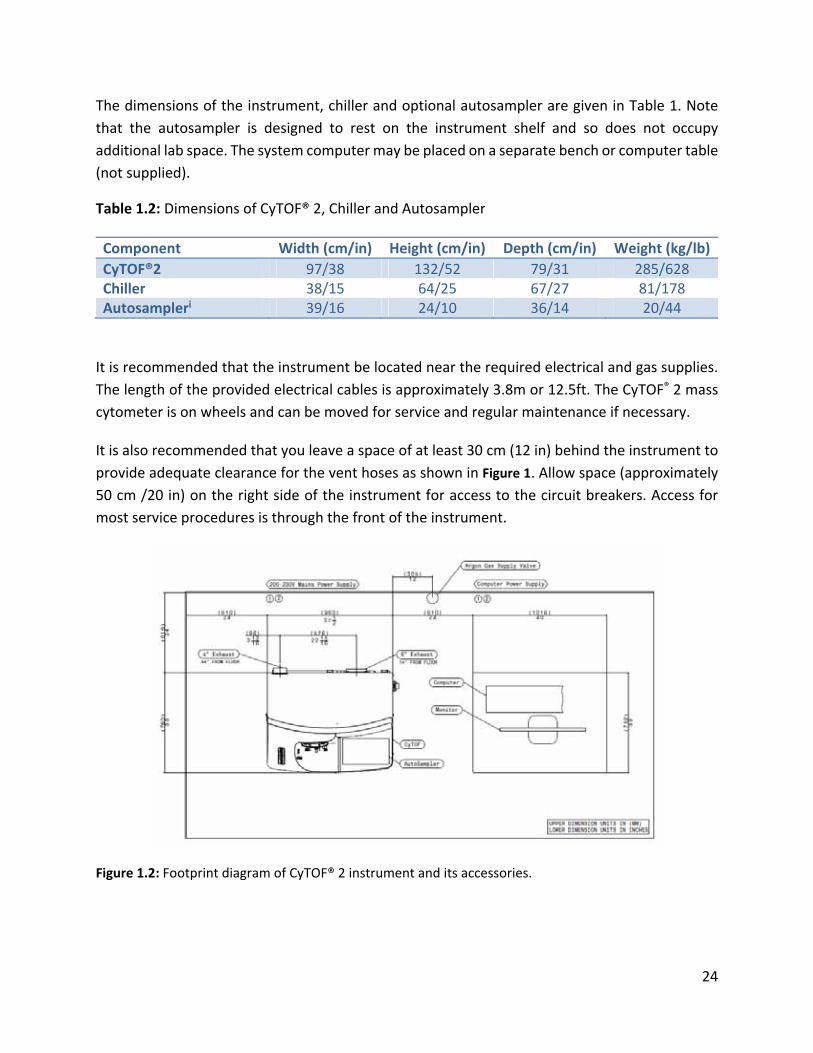
The dimensions of the instrument, chiller and optional autosampler are given in Table 1. Note
that the autosampler is designed to rest on the instrument shelf and so does not occupy
additional lab space. The system computer may be placed on a separate bench or computer table
(not supplied).
Table 1.2: Dimensions of CyTOF® 2, Chiller and Autosampler
Component Width (cm/in) Height (cm/in) Depth (cm/in) Weight (kg/lb)
CyTOF®2 97/38 132/52 79/31 285/628 Chiller 38/15 64/25 67/27 81/178 Autosampleri 39/16 24/10 36/14 20/44
It is recommended that the instrument be located near the required electrical and gas supplies.
The length of the provided electrical cables is approximately 3.8m or 12.5ft. The CyTOF® 2 mass
cytometer is on wheels and can be moved for service and regular maintenance if necessary.
It is also recommended that you leave a space of at least 30 cm (12 in) behind the instrument to
provide adequate clearance for the vent hoses as shown in Figure 1. Allow space (approximately
50 cm /20 in) on the right side of the instrument for access to the circuit breakers. Access for
most service procedures is through the front of the instrument.
Figure 1.2: Footprint diagram of CyTOF® 2 instrument and its accessories.

25
The front and rear vents of the chiller must be a minimum of 24 inches (61 cm) away from walls
or vertical surfaces so air flow is not restricted.
i The Autosampler is optional. When installed, it rests on the instrument shelf and therefore does not take additional lab space
26
ElectricalRequirements
ElectricalSpecifications
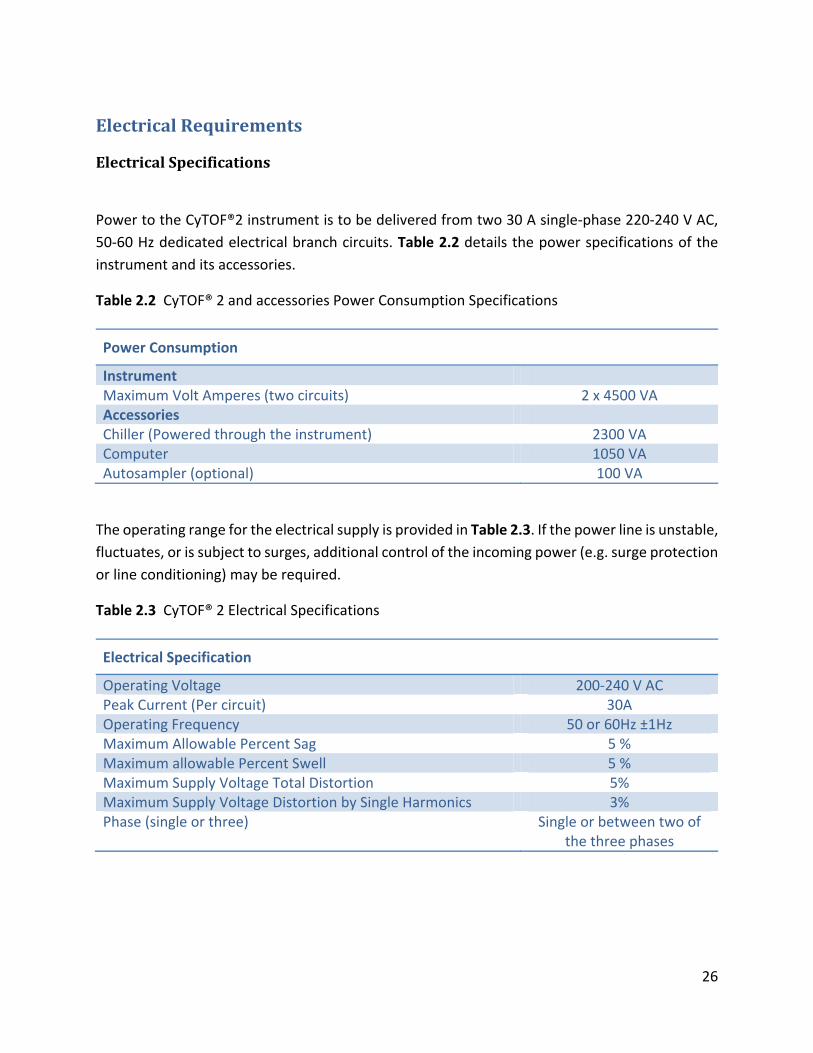
Power to the CyTOF®2 instrument is to be delivered from two 30 A single‐phase 220‐240 V AC,
50‐60 Hz dedicated electrical branch circuits. Table 2.2 details the power specifications of the
instrument and its accessories.
Table 2.2 CyTOF® 2 and accessories Power Consumption Specifications
Power Consumption
Instrument Maximum Volt Amperes (two circuits) 2 x 4500 VA Accessories Chiller (Powered through the instrument) 2300 VA Computer 1050 VA Autosampler (optional) 100 VA
The operating range for the electrical supply is provided in Table 2.3. If the power line is unstable,
fluctuates, or is subject to surges, additional control of the incoming power (e.g. surge protection
or line conditioning) may be required.
Table 2.3 CyTOF® 2 Electrical Specifications
Electrical Specification
Operating Voltage 200‐240 V AC Peak Current (Per circuit) 30A Operating Frequency 50 or 60Hz ±1Hz Maximum Allowable Percent Sag 5 % Maximum allowable Percent Swell 5 % Maximum Supply Voltage Total Distortion 5% Maximum Supply Voltage Distortion by Single Harmonics 3% Phase (single or three) Single or between two of
the three phases
27
PlugInformation
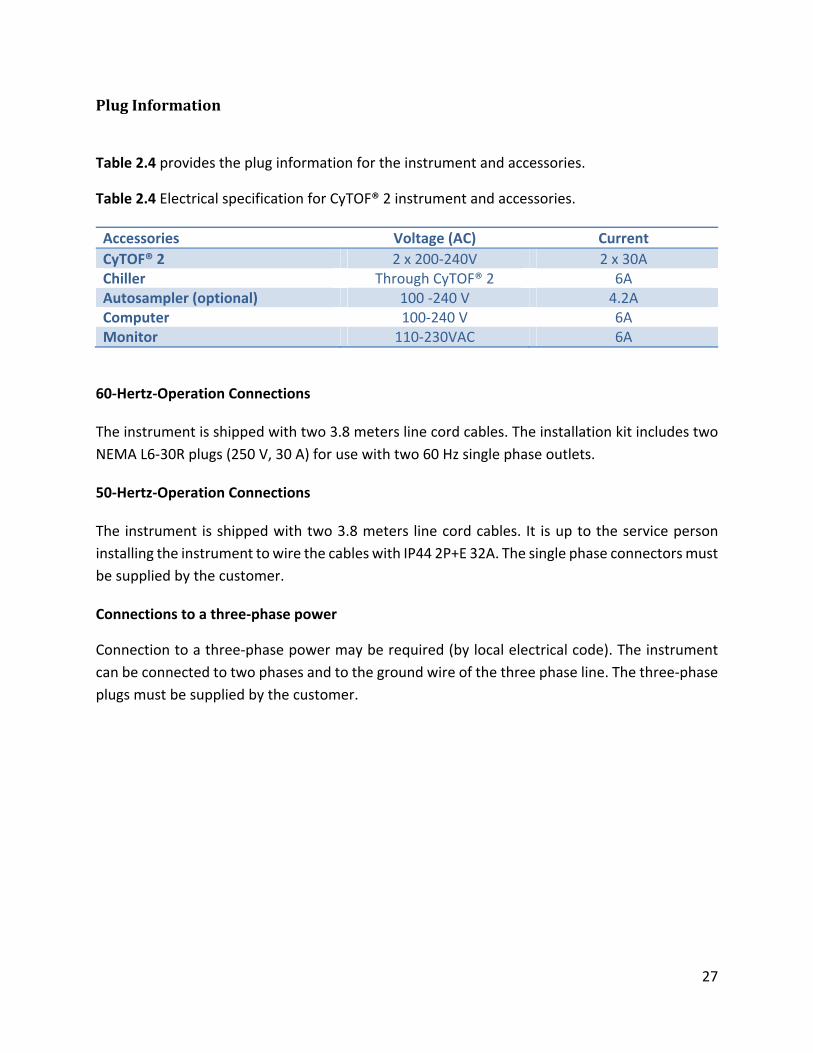
Table 2.4 provides the plug information for the instrument and accessories.
Table 2.4 Electrical specification for CyTOF® 2 instrument and accessories.
Accessories Voltage (AC) Current
CyTOF® 2 2 x 200‐240V 2 x 30A Chiller Through CyTOF® 2 6A Autosampler (optional) 100 ‐240 V 4.2A Computer 100‐240 V 6A Monitor 110‐230VAC 6A
60‐Hertz‐Operation Connections
The instrument is shipped with two 3.8 meters line cord cables. The installation kit includes two
NEMA L6‐30R plugs (250 V, 30 A) for use with two 60 Hz single phase outlets.
50‐Hertz‐Operation Connections
The instrument is shipped with two 3.8 meters line cord cables. It is up to the service person
installing the instrument to wire the cables with IP44 2P+E 32A. The single phase connectors must
be supplied by the customer.
Connections to a three‐phase power
Connection to a three‐phase power may be required (by local electrical code). The instrument
can be connected to two phases and to the ground wire of the three phase line. The three‐phase
plugs must be supplied by the customer.
28
GasRequirements
ArgonSpecification
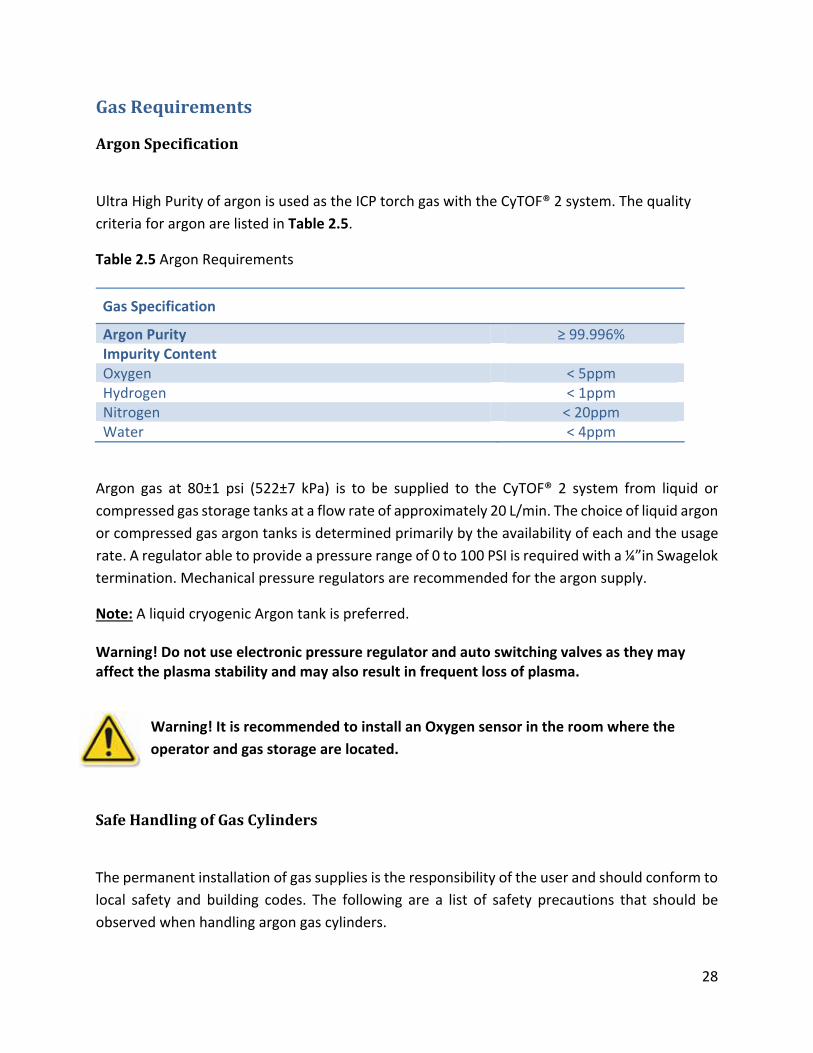
Ultra High Purity of argon is used as the ICP torch gas with the CyTOF® 2 system. The quality
criteria for argon are listed in Table 2.5.
Table 2.5 Argon Requirements
Gas Specification
Argon Purity ≥ 99.996% Impurity Content Oxygen < 5ppm Hydrogen < 1ppm Nitrogen < 20ppm Water < 4ppm
Argon gas at 80±1 psi (522±7 kPa) is to be supplied to the CyTOF® 2 system from liquid or
compressed gas storage tanks at a flow rate of approximately 20 L/min. The choice of liquid argon
or compressed gas argon tanks is determined primarily by the availability of each and the usage
rate. A regulator able to provide a pressure range of 0 to 100 PSI is required with a ¼”in Swagelok
termination. Mechanical pressure regulators are recommended for the argon supply.
Note: A liquid cryogenic Argon tank is preferred.
Warning! Do not use electronic pressure regulator and auto switching valves as they may affect the plasma stability and may also result in frequent loss of plasma.
Warning! It is recommended to install an Oxygen sensor in the room where the
operator and gas storage are located.
SafeHandlingofGasCylinders
The permanent installation of gas supplies is the responsibility of the user and should conform to
local safety and building codes. The following are a list of safety precautions that should be
observed when handling argon gas cylinders.

29
Fasten all gas cylinders securely to an immovable bulkhead or a permanent wall.
When gas cylinders are stored in confined areas, ventilation should be adequate to prevent dangerous accumulations. Move or store gas cylinders only in a vertical position with the valve cap in place.
Locate gas cylinders away from heat or ignition sources, including heat lamps. Cylinders have a pressure relief device that will release the contents of the cylinder if the temperature exceeds 52 °C (125 °F).
When storing cylinders external to a building, the cylinders should be stored so that they are protected against temperature extremes (including the direct rays of the sun) and should be stored above ground on a suitable floor.
Gas cylinders should be clearly marked to identify the contents and status (e.g. full, empty).
Do not attempt to refill gas cylinders.
Use only approved mechanical regulators and hose connectors. Left‐hand thread fittings are used for fuel gas tank connections whereas right‐hand fittings are used for oxidant and support gas connections.
Arrange gas hoses away from foot traffic to avoid damage.
Perform periodic gas leak tests by applying a soap solution to all joints and seals.
30
ExhaustRequirements
The main venting system is required to remove fumes and vapors from the torch housing. Exhaust
venting is important for four reasons:
It protects laboratory personnel from ozone and hot argon generated in plasma
It minimizes the effects of room drafts and the laboratory atmosphere on ICP torch stability.
It helps protect the instrument from corrosive vapors which may originate from the samples.
It removes dissipated heat which is produced by the ICP torch, ICP power supply and the pump motors.
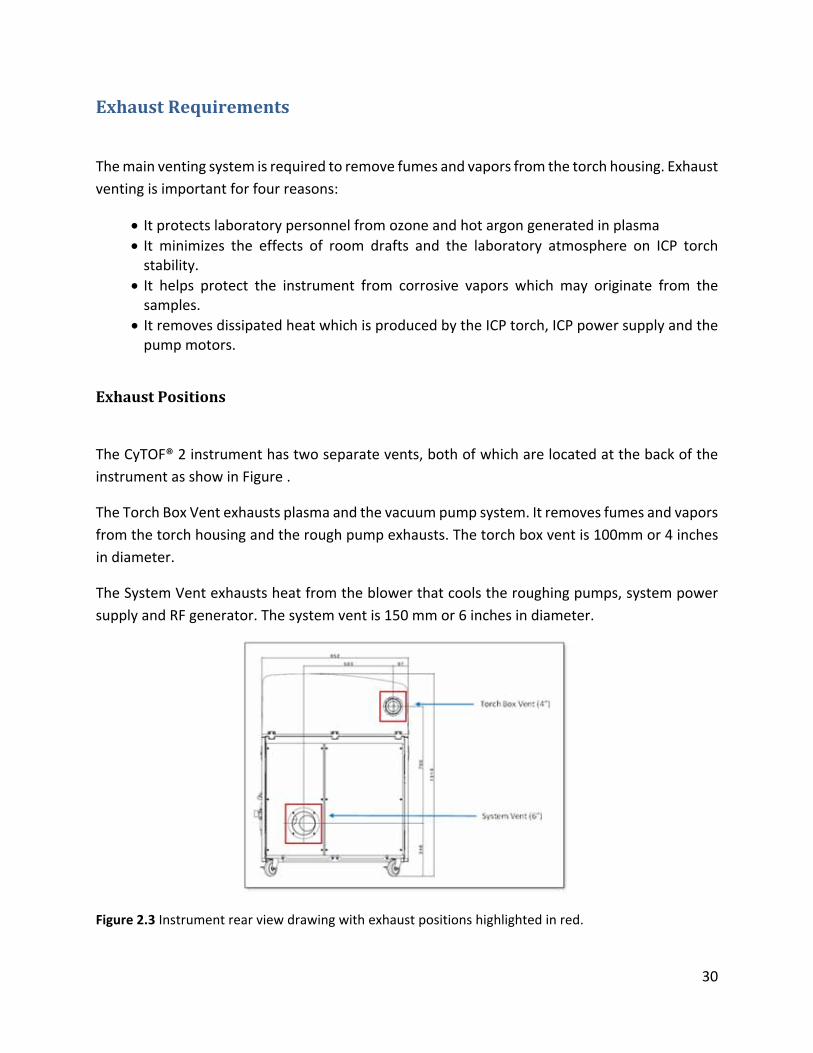
ExhaustPositions
The CyTOF® 2 instrument has two separate vents, both of which are located at the back of the
instrument as show in Figure .
The Torch Box Vent exhausts plasma and the vacuum pump system. It removes fumes and vapors
from the torch housing and the rough pump exhausts. The torch box vent is 100mm or 4 inches
in diameter.
The System Vent exhausts heat from the blower that cools the roughing pumps, system power
supply and RF generator. The system vent is 150 mm or 6 inches in diameter.
Figure 2.3 Instrument rear view drawing with exhaust positions highlighted in red.
31
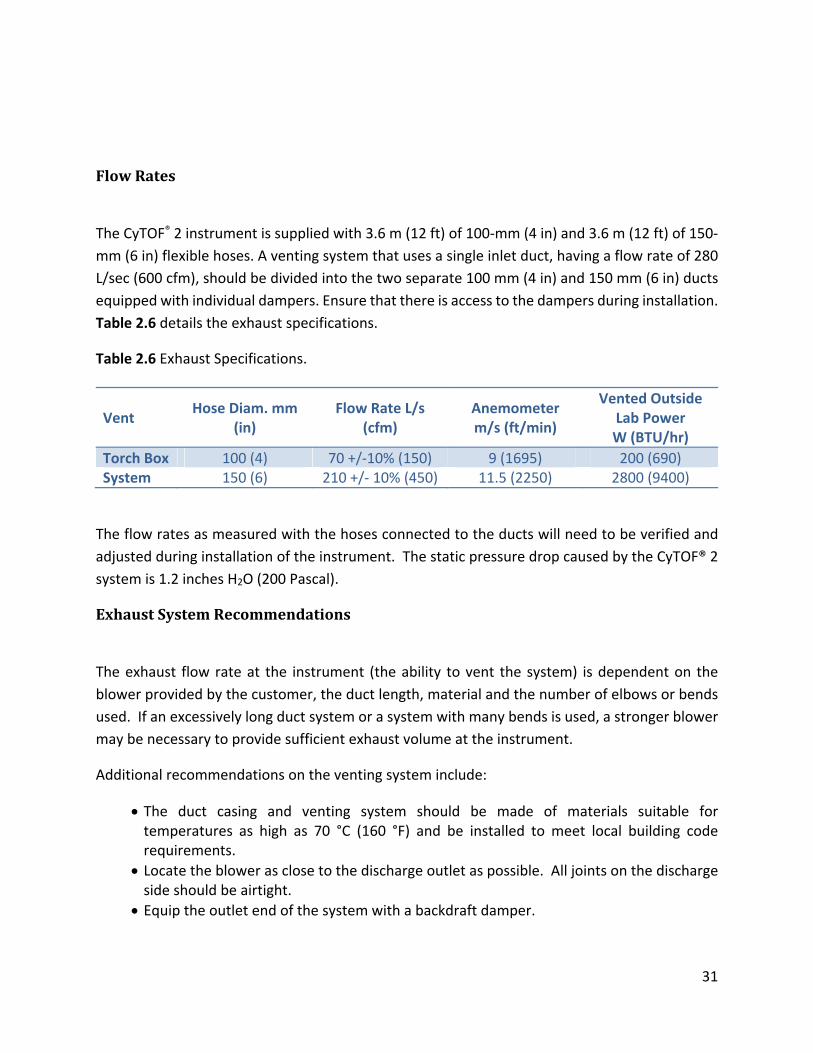
FlowRates
The CyTOF® 2 instrument is supplied with 3.6 m (12 ft) of 100‐mm (4 in) and 3.6 m (12 ft) of 150‐
mm (6 in) flexible hoses. A venting system that uses a single inlet duct, having a flow rate of 280
L/sec (600 cfm), should be divided into the two separate 100 mm (4 in) and 150 mm (6 in) ducts
equipped with individual dampers. Ensure that there is access to the dampers during installation.
Table 2.6 details the exhaust specifications.
Table 2.6 Exhaust Specifications.
Vent Hose Diam. mm
(in) Flow Rate L/s
(cfm) Anemometer m/s (ft/min)
Vented Outside Lab Power W (BTU/hr)
Torch Box 100 (4) 70 +/‐10% (150) 9 (1695) 200 (690) System 150 (6) 210 +/‐ 10% (450) 11.5 (2250) 2800 (9400)
The flow rates as measured with the hoses connected to the ducts will need to be verified and
adjusted during installation of the instrument. The static pressure drop caused by the CyTOF® 2
system is 1.2 inches H2O (200 Pascal).
ExhaustSystemRecommendations
The exhaust flow rate at the instrument (the ability to vent the system) is dependent on the
blower provided by the customer, the duct length, material and the number of elbows or bends
used. If an excessively long duct system or a system with many bends is used, a stronger blower
may be necessary to provide sufficient exhaust volume at the instrument.
Additional recommendations on the venting system include:
The duct casing and venting system should be made of materials suitable for temperatures as high as 70 °C (160 °F) and be installed to meet local building code requirements.
Locate the blower as close to the discharge outlet as possible. All joints on the discharge side should be airtight.
Equip the outlet end of the system with a backdraft damper.

32
Take the necessary precautions to keep the exhaust outlet away from open windows or inlet vents and to extend it above the roof of the building for proper dispersal of the exhaust.
Equip the exhaust end of the system with an exhaust stack to improve the overall efficiency of the system.
For best efficiency, make sure the length of the duct that enters into the blower is a straight length at least ten times the duct diameter. An elbow entrance into the blower inlet causes a loss of efficiency.
Provide make‐up air in the same quantity as is exhausted by the system. An airtight laboratory can cause an efficiency loss in the exhaust system.
Ensure that the system is drawing properly by placing a piece of cardboard over the mouth of the vent
33
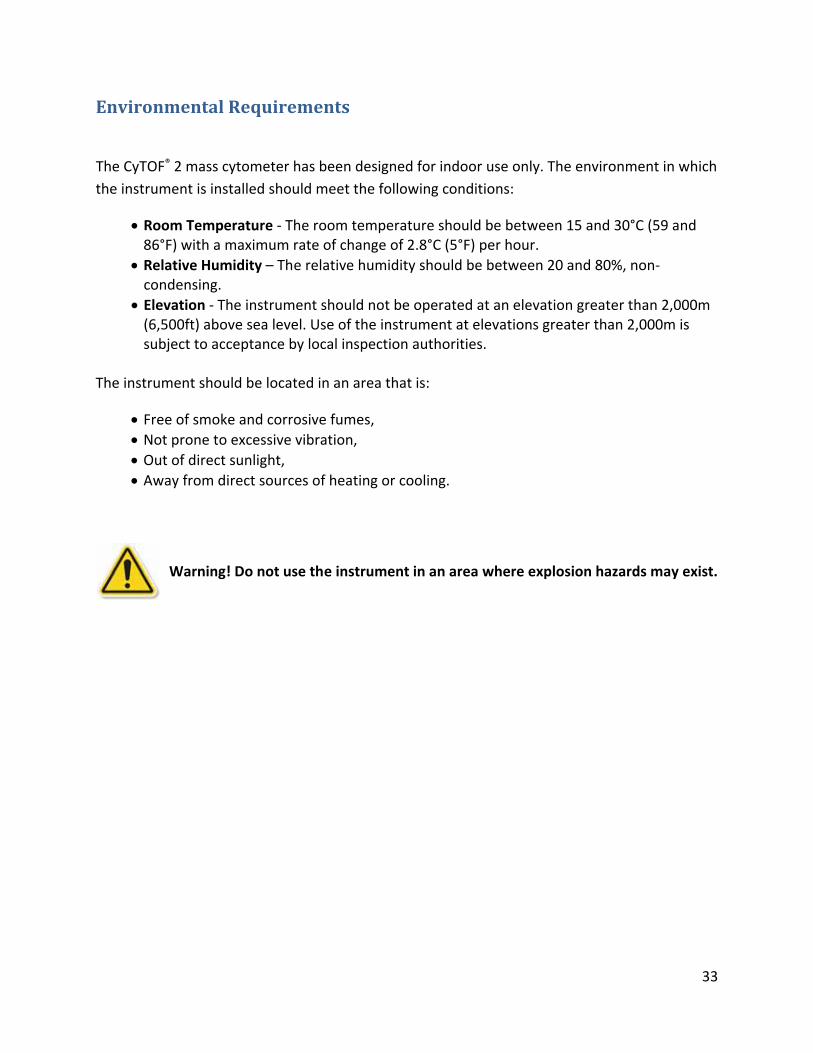
EnvironmentalRequirements
The CyTOF® 2 mass cytometer has been designed for indoor use only. The environment in which
the instrument is installed should meet the following conditions:
Room Temperature ‐ The room temperature should be between 15 and 30°C (59 and 86°F) with a maximum rate of change of 2.8°C (5°F) per hour.
Relative Humidity – The relative humidity should be between 20 and 80%, non‐condensing.
Elevation ‐ The instrument should not be operated at an elevation greater than 2,000m (6,500ft) above sea level. Use of the instrument at elevations greater than 2,000m is subject to acceptance by local inspection authorities.
The instrument should be located in an area that is:
Free of smoke and corrosive fumes,
Not prone to excessive vibration, Out of direct sunlight, Away from direct sources of heating or cooling.
Warning! Do not use the instrument in an area where explosion hazards may exist.
34
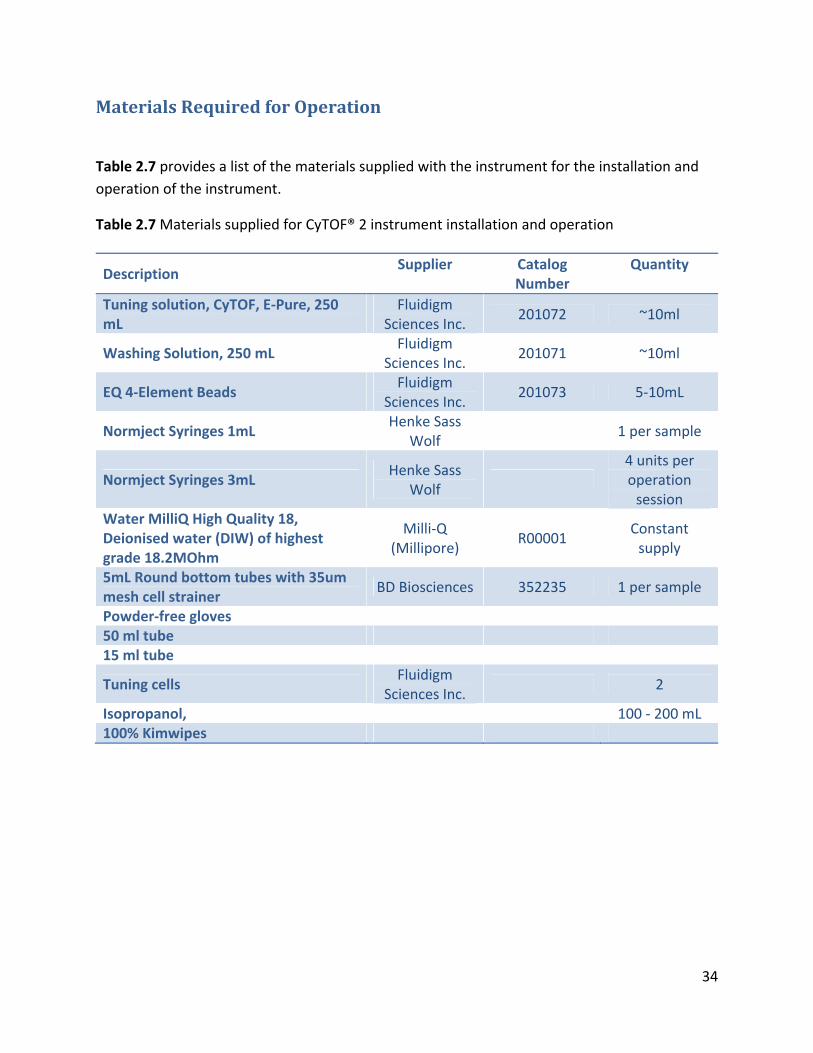
MaterialsRequiredforOperation
Table 2.7 provides a list of the materials supplied with the instrument for the installation and
operation of the instrument.
Table 2.7 Materials supplied for CyTOF® 2 instrument installation and operation
Description Supplier Catalog
Number Quantity
Tuning solution, CyTOF, E‐Pure, 250 mL
Fluidigm Sciences Inc.
201072 ~10ml
Washing Solution, 250 mL Fluidigm
Sciences Inc. 201071 ~10ml
EQ 4‐Element Beads Fluidigm
Sciences Inc. 201073 5‐10mL
Normject Syringes 1mL Henke Sass
Wolf 1 per sample
Normject Syringes 3mL Henke Sass
Wolf
4 units per operation session
Water MilliQ High Quality 18, Deionised water (DIW) of highest grade 18.2MOhm
Milli‐Q (Millipore)
R00001 Constant supply
5mL Round bottom tubes with 35um mesh cell strainer
BD Biosciences 352235 1 per sample
Powder‐free gloves 50 ml tube 15 ml tube
Tuning cells Fluidigm
Sciences Inc. 2
100 ‐ 200 mL Isopropanol, 100% Kimwipes
35
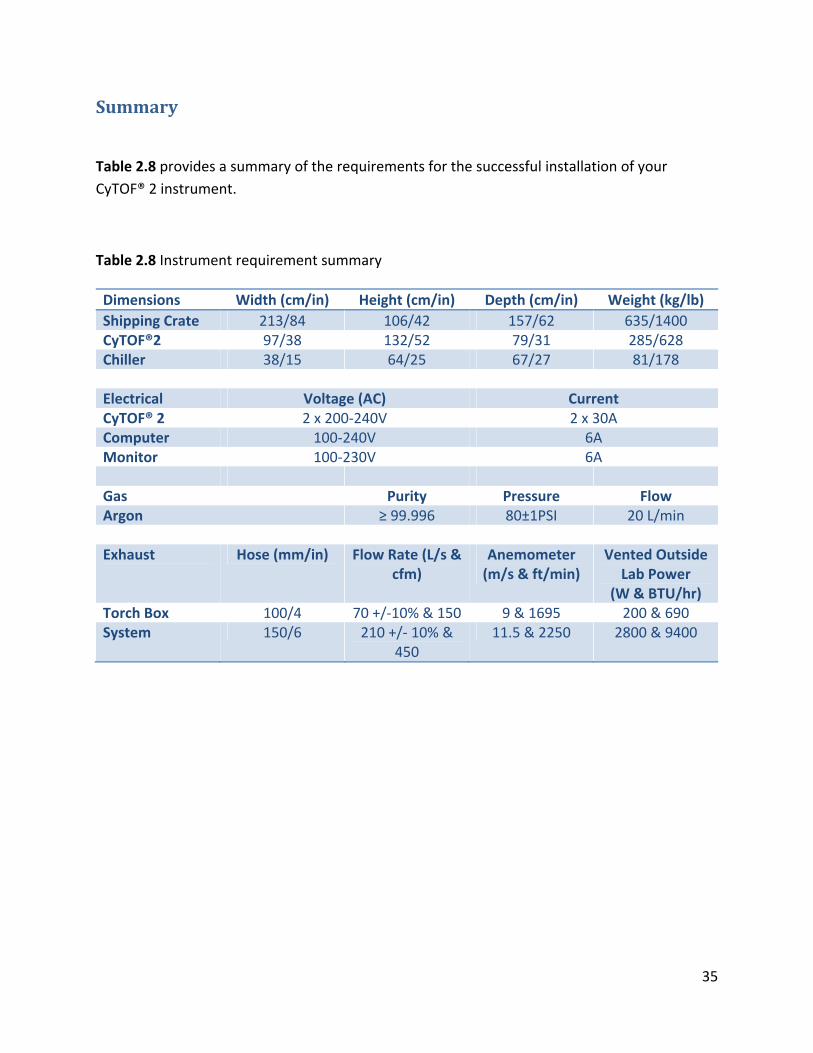
Summary
Table 2.8 provides a summary of the requirements for the successful installation of your
CyTOF® 2 instrument.
Table 2.8 Instrument requirement summary
Dimensions Width (cm/in) Height (cm/in) Depth (cm/in) Weight (kg/lb)
Shipping Crate 213/84 106/42 157/62 635/1400 CyTOF®2 97/38 132/52 79/31 285/628 Chiller 38/15 64/25 67/27 81/178 Electrical Voltage (AC) Current CyTOF® 2 2 x 200‐240V 2 x 30A Computer 100‐240V 6A Monitor 100‐230V 6A Gas Purity Pressure Flow Argon ≥ 99.996 80±1PSI 20 L/min Exhaust Hose (mm/in) Flow Rate (L/s &
cfm) Anemometer (m/s & ft/min)
Vented Outside Lab Power
(W & BTU/hr) Torch Box 100/4 70 +/‐10% & 150 9 & 1695 200 & 690 System 150/6 210 +/‐ 10% &
450 11.5 & 2250 2800 & 9400
36
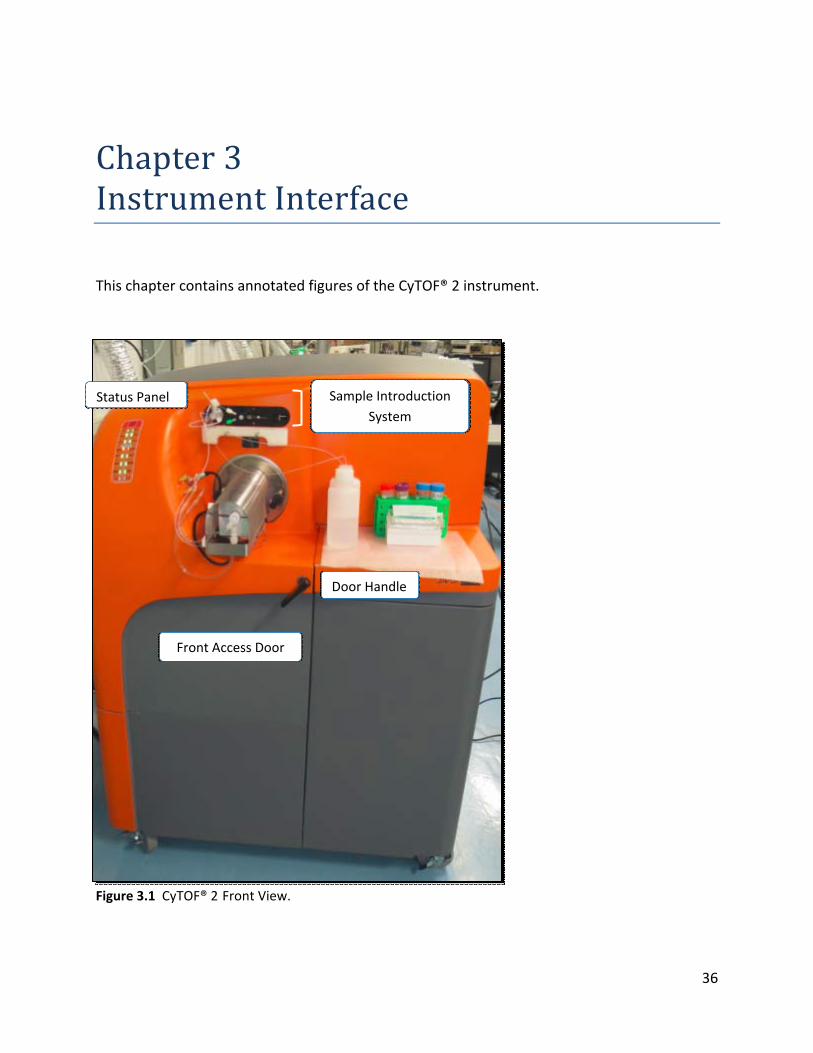
Chapter3InstrumentInterface This chapter contains annotated figures of the CyTOF® 2 instrument.
Figure 3.1 CyTOF® 2 Front View.
Status Panel
Door Handle
Front Access Door
Sample Introduction
System
37
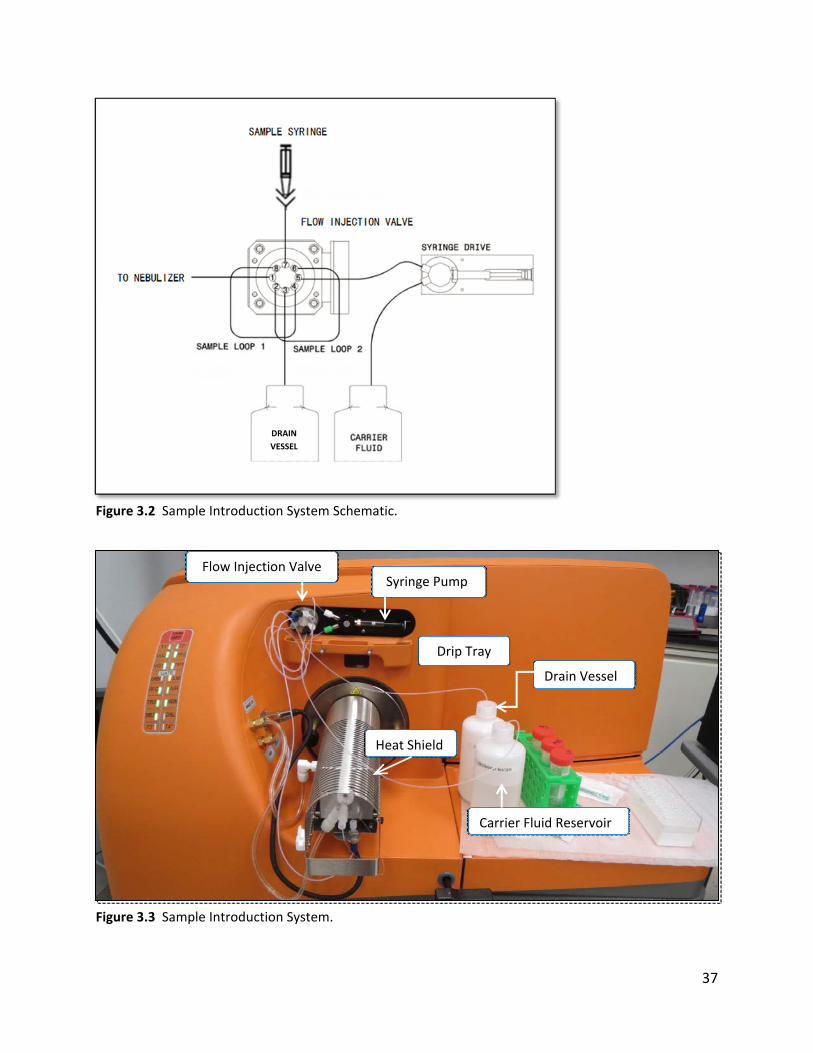
Figure 3.2 Sample Introduction System Schematic.
Figure 3.3 Sample Introduction System.
Syringe Pump
Drain Vessel
Carrier Fluid Reservoir
Heat Shield
Flow Injection Valve
Drip Tray
DRAIN
VESSEL
38
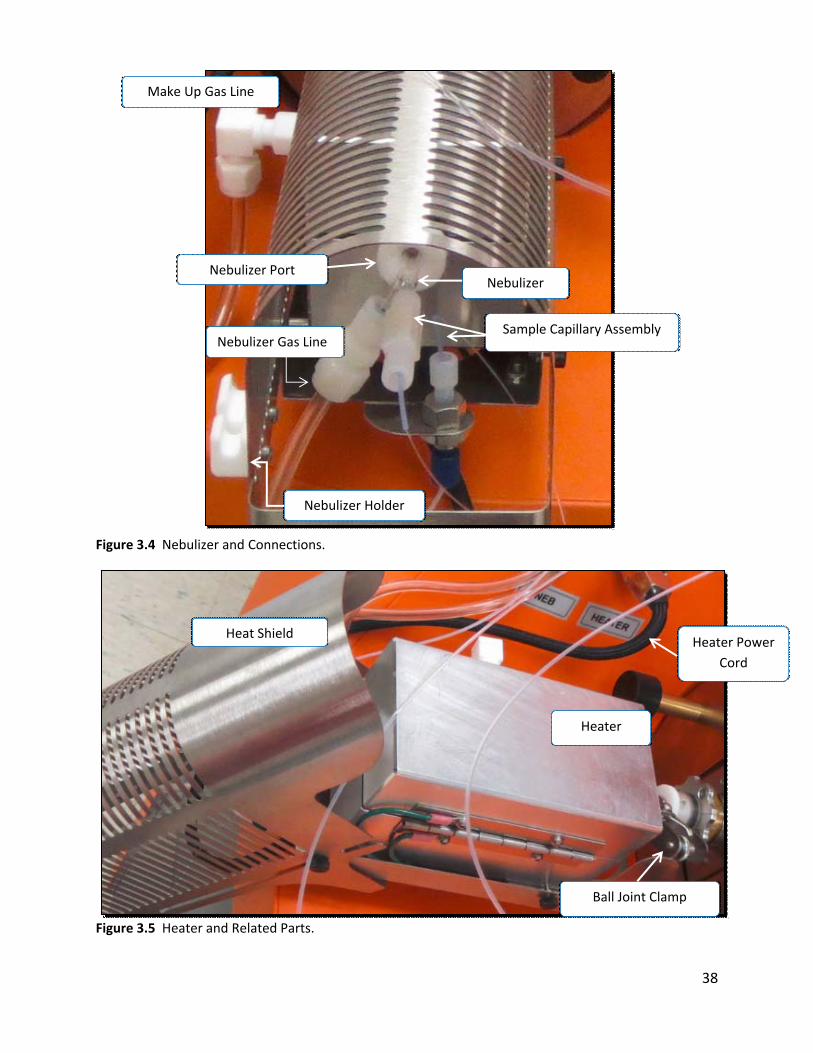
Figure 3.4 Nebulizer and Connections.
Figure 3.5 Heater and Related Parts.
Make Up Gas Line
Nebulizer
Nebulizer Gas Line Sample Capillary Assembly
Nebulizer Port
Nebulizer Holder
Heater
Heat Shield
Ball Joint Clamp
Heater Power
Cord
39
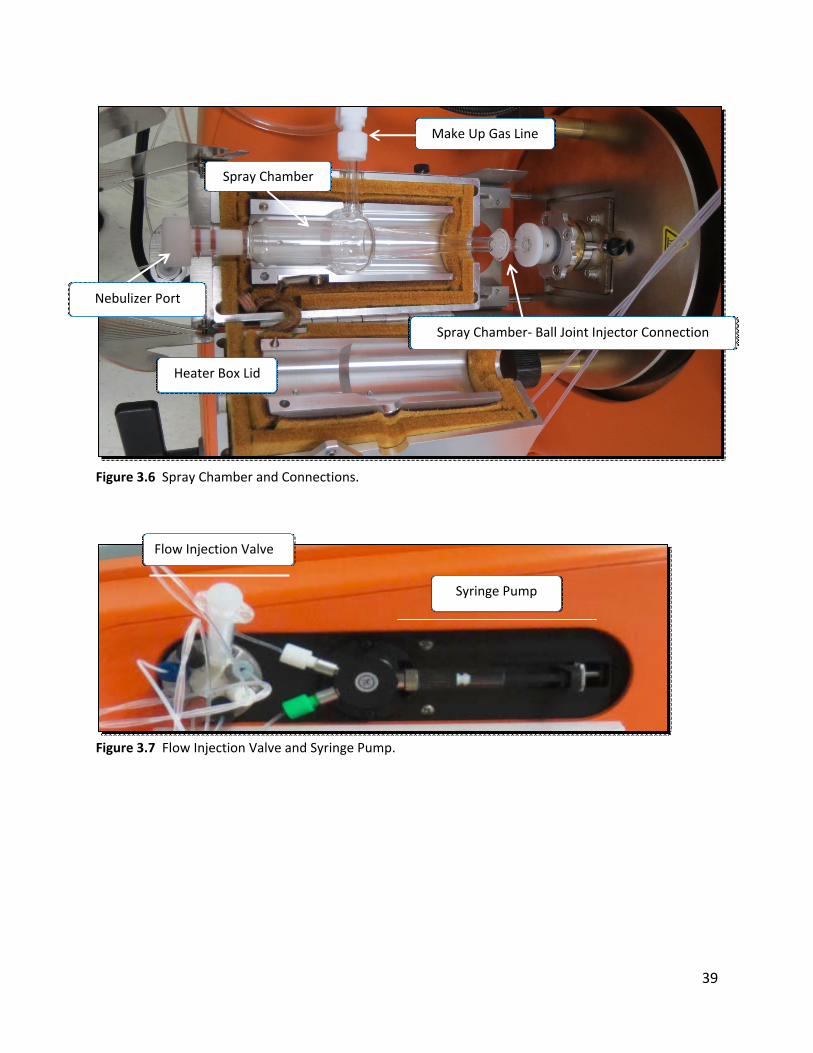
Figure 3.6 Spray Chamber and Connections.
Figure 3.7 Flow Injection Valve and Syringe Pump.
Heater Box Lid
Make Up Gas Line
Spray Chamber
Spray Chamber‐ Ball Joint Injector Connection
Nebulizer Port
Syringe Pump
Flow Injection Valve
40
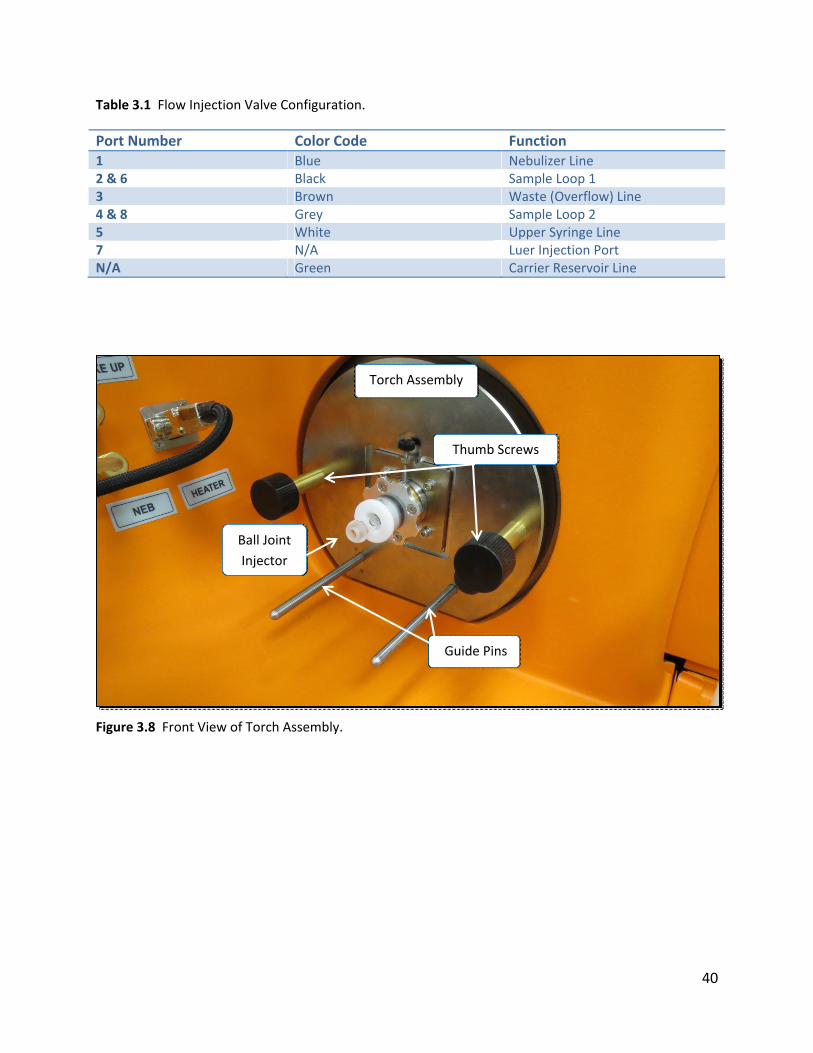
Table 3.1 Flow Injection Valve Configuration.
Port Number Color Code Function 1 Blue Nebulizer Line 2 & 6 Black Sample Loop 1 3 Brown Waste (Overflow) Line 4 & 8 Grey Sample Loop 2 5 White Upper Syringe Line 7 N/A Luer Injection Port N/A Green Carrier Reservoir Line
Figure 3.8 Front View of Torch Assembly.
Torch Assembly
Ball Joint
Injector
Thumb Screws
Guide Pins
41
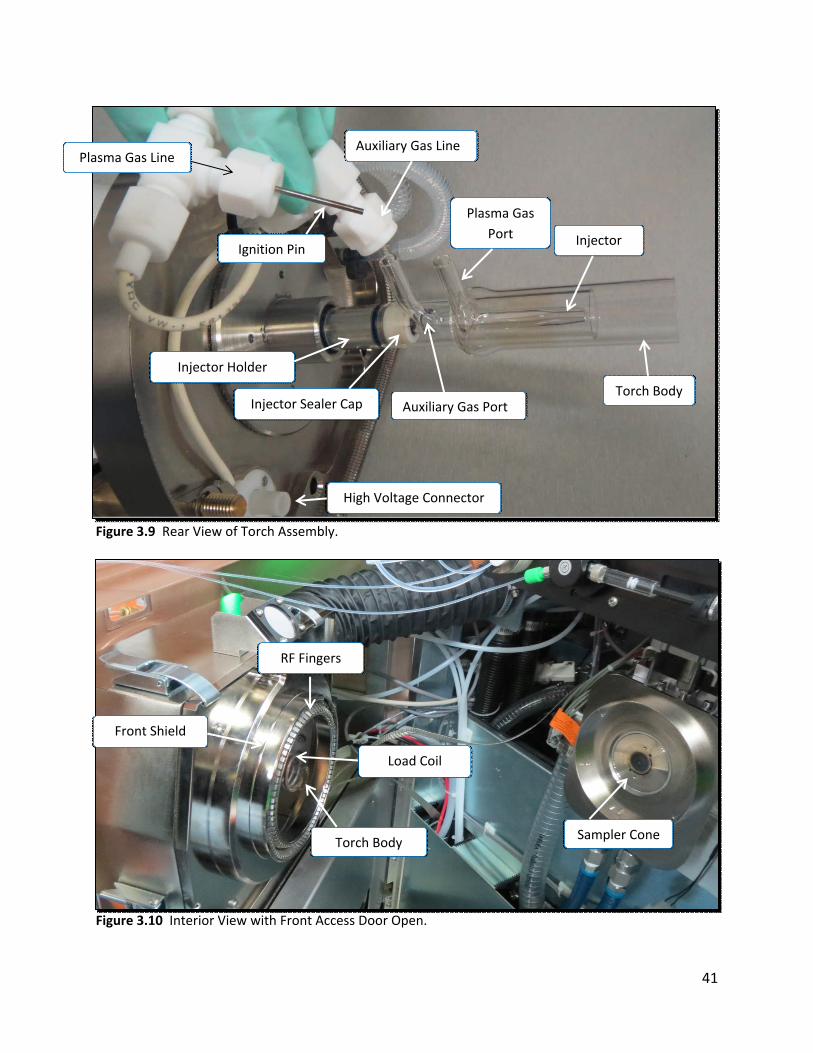
Figure 3.9 Rear View of Torch Assembly.
Figure 3.10 Interior View with Front Access Door Open.
Torch Body
Injector
Injector Holder
Plasma Gas
Port
Plasma Gas Line
Ignition Pin
Auxiliary Gas Port
Auxiliary Gas Line
High Voltage Connector
Sampler ConeTorch Body
Load Coil
Front Shield
RF Fingers
Injector Sealer Cap
42
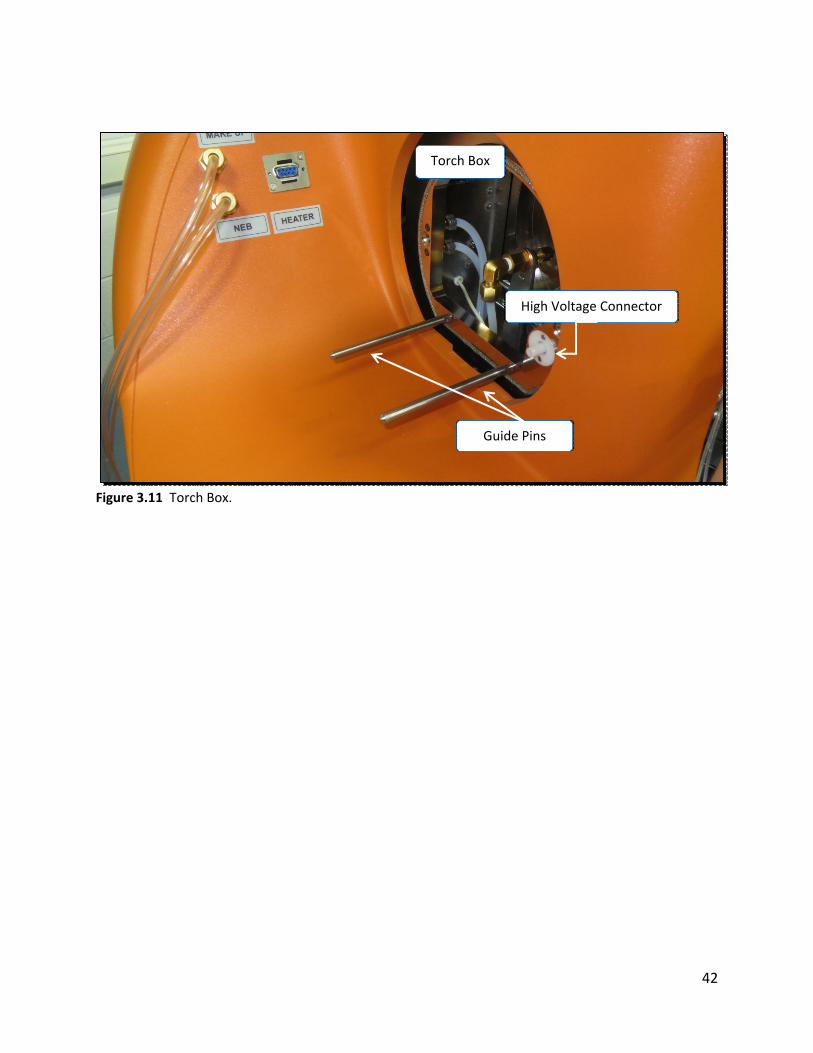
Figure 3.11 Torch Box.
Guide Pins
High Voltage Connector
Torch Box
43
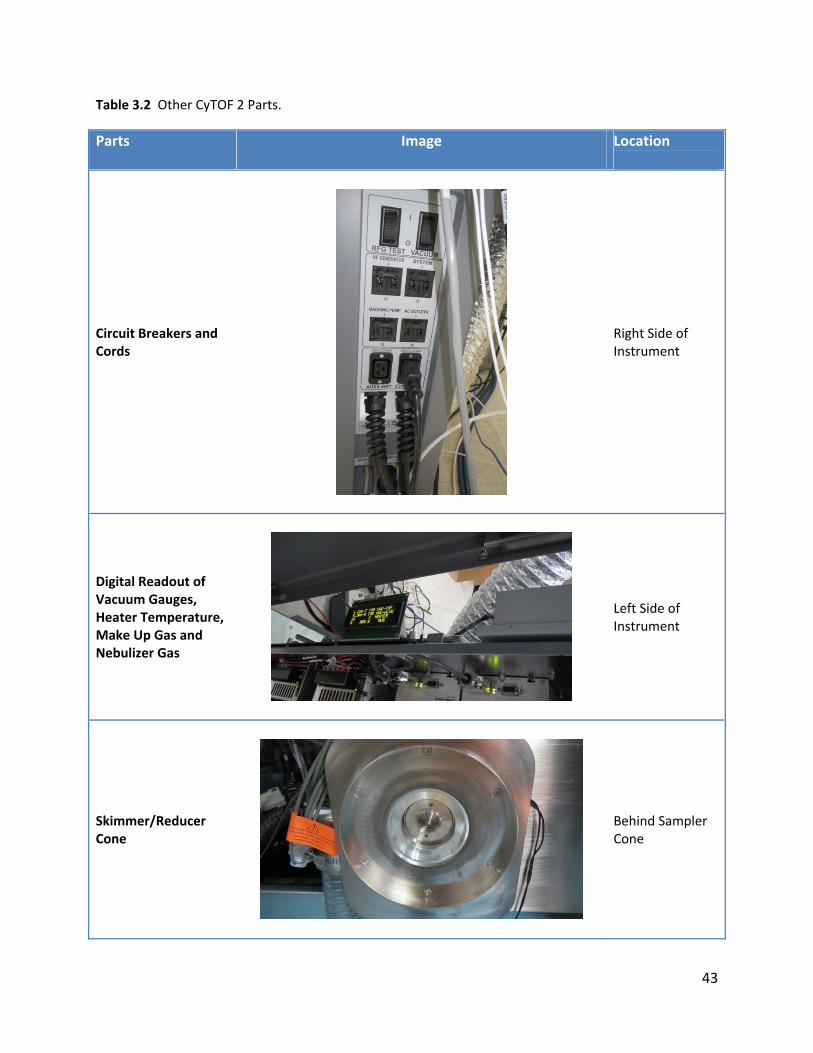
Table 3.2 Other CyTOF 2 Parts.
Parts Image Location
Circuit Breakers and Cords
Right Side of Instrument
Digital Readout of Vacuum Gauges, Heater Temperature, Make Up Gas and Nebulizer Gas
Left Side of Instrument
Skimmer/Reducer Cone
Behind Sampler Cone
44
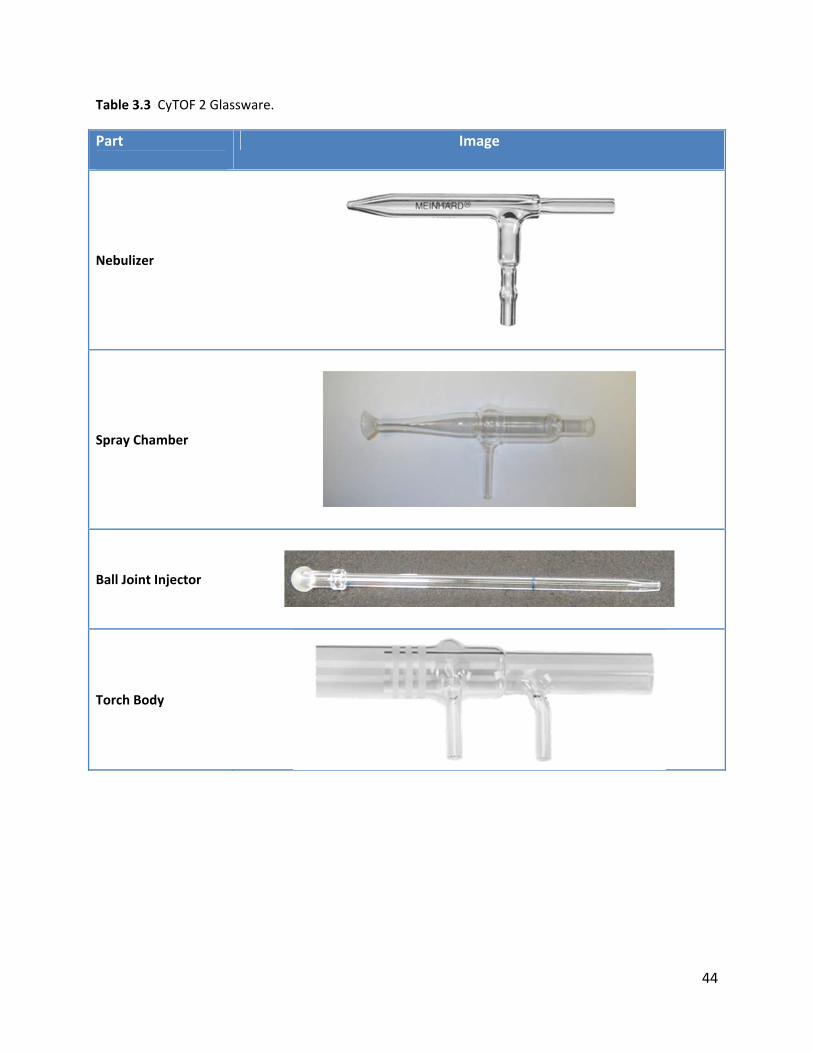
Table 3.3 CyTOF 2 Glassware.
Part
Image
Nebulizer
Spray Chamber
Ball Joint Injector
Torch Body
45
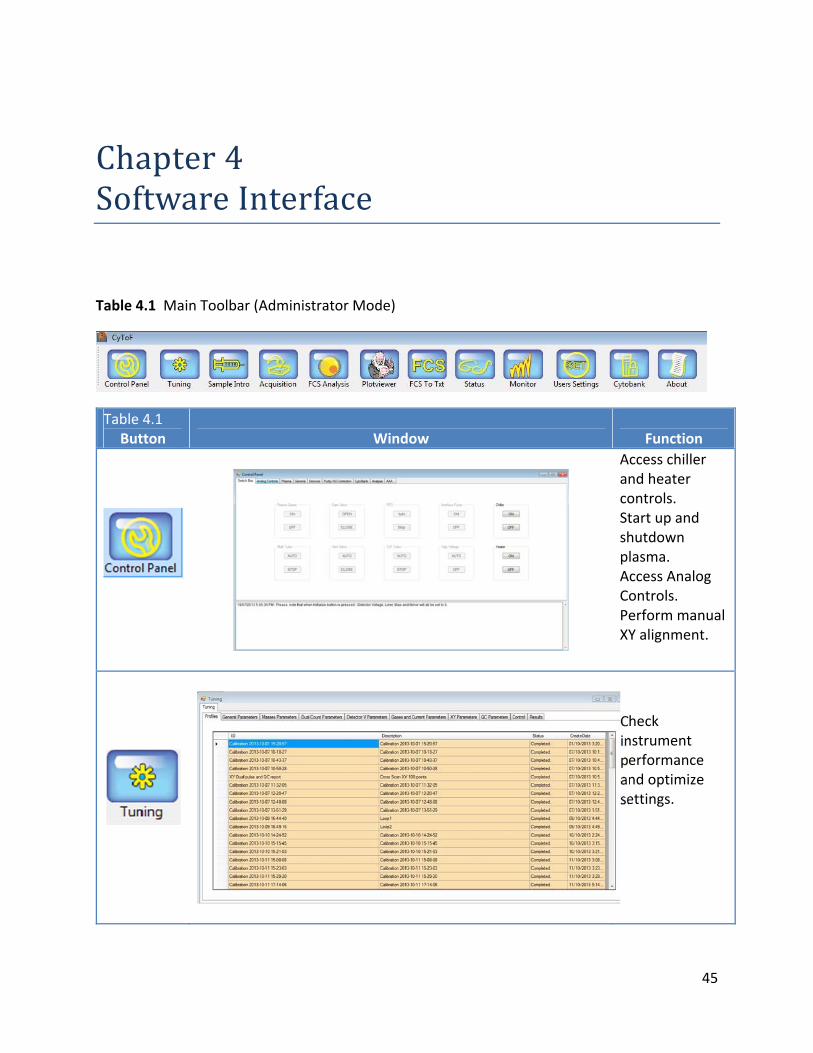
Chapter4SoftwareInterface
Table 4.1 Main Toolbar (Administrator Mode)
Table 4.1 Button Window Function
Access chiller and heater controls. Start up and shutdown plasma. Access Analog Controls. Perform manual XY alignment.
Check instrument performance and optimize settings.
46
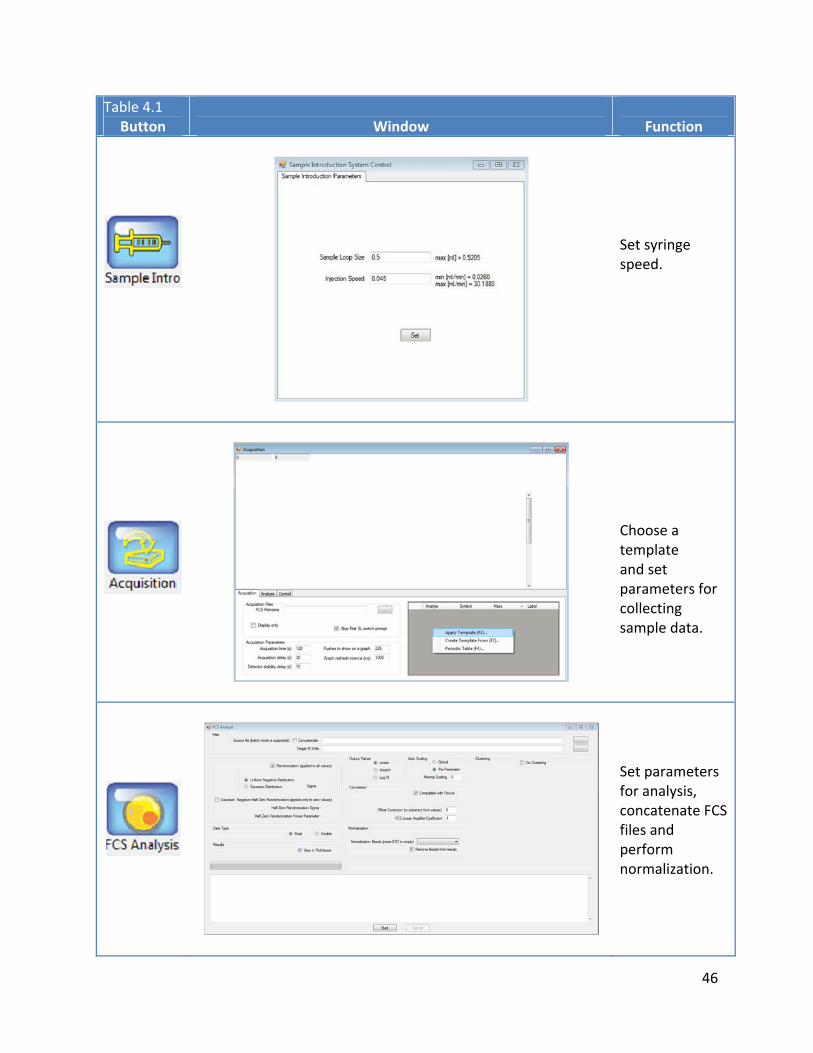
Table 4.1 Button Window Function
Set syringe speed.
Choose a template and set parameters for collecting sample data.
Set parameters for analysis, concatenate FCS files and perform normalization.
47
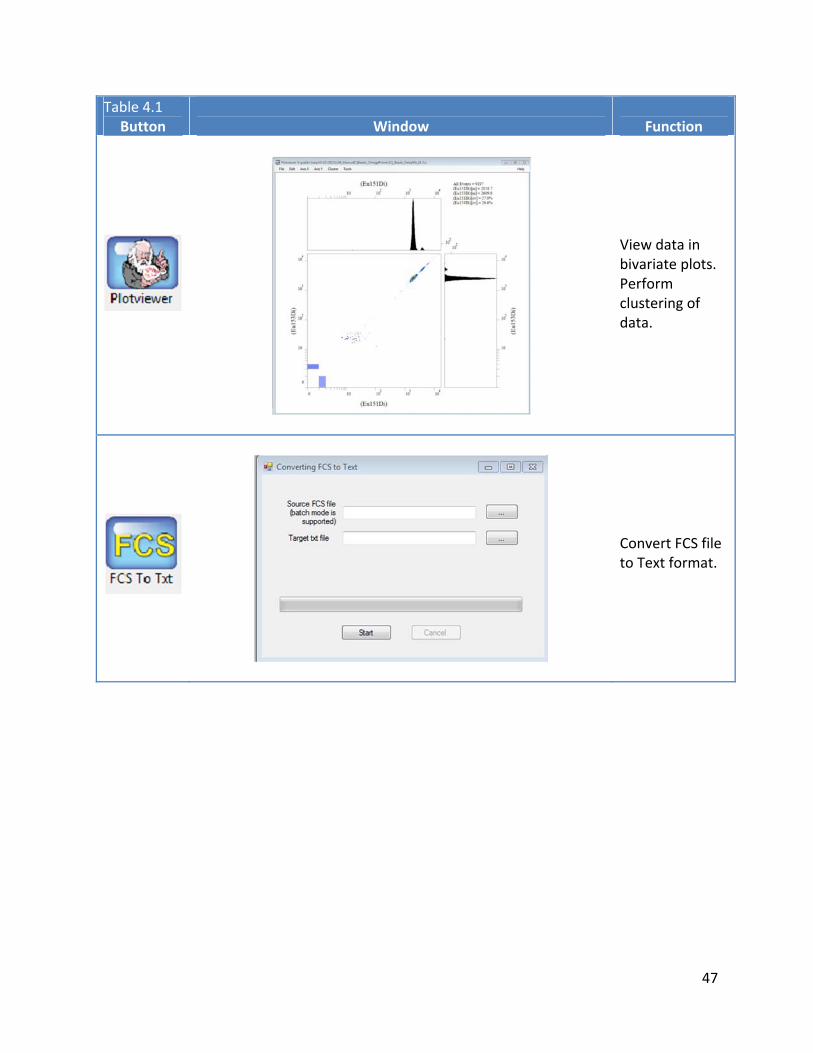
Table 4.1 Button Window Function
View data in bivariate plots. Perform clustering of data.
Convert FCS file to Text format.
48
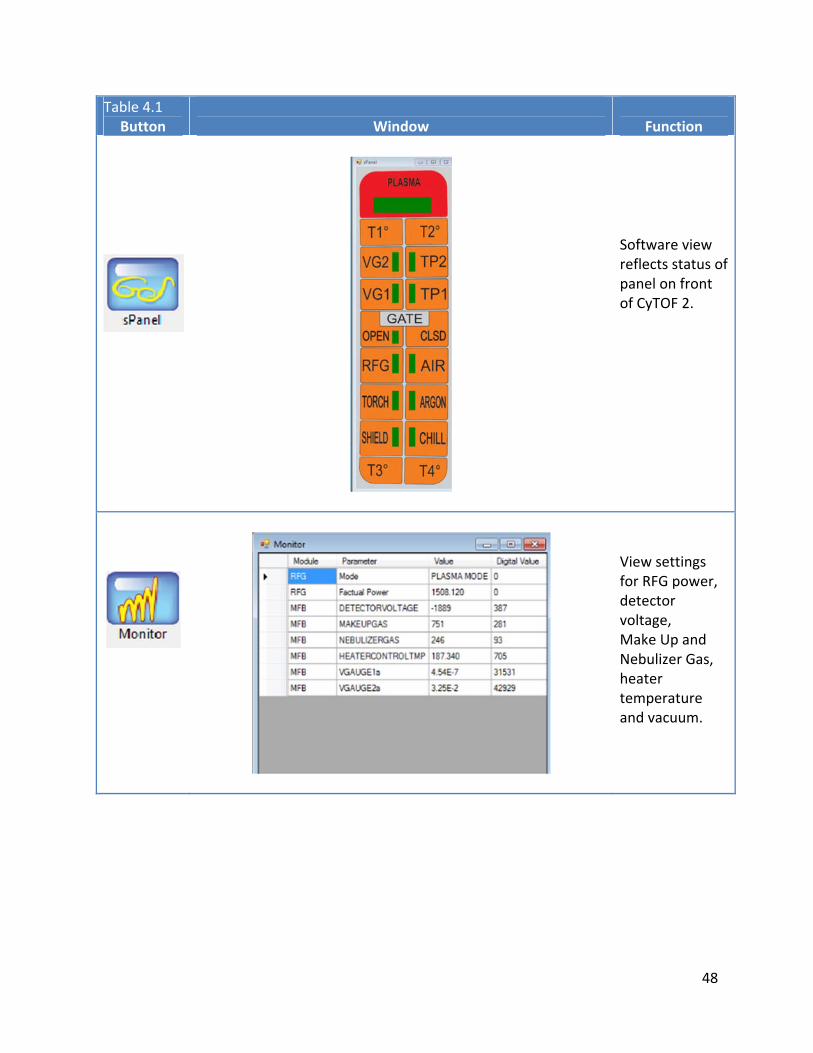
Table 4.1 Button Window Function
Software view reflects status of panel on front of CyTOF 2.
View settings for RFG power, detector voltage, Make Up and Nebulizer Gas, heater temperature and vacuum.
49
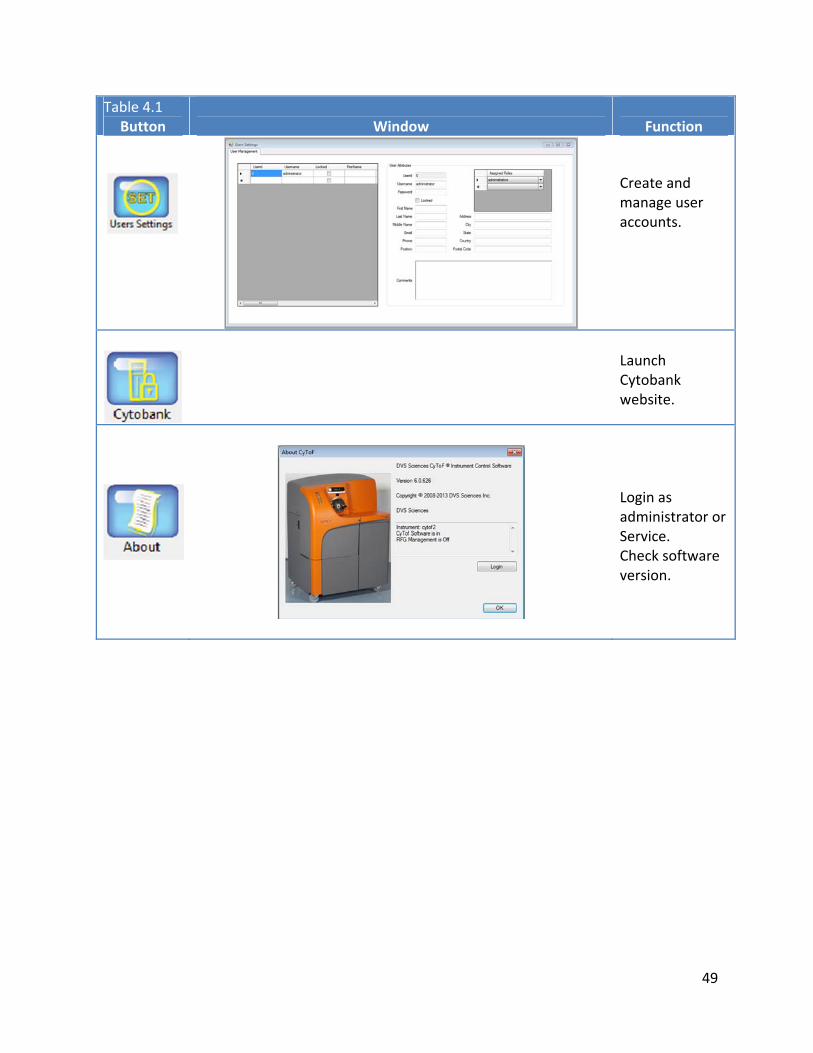
Table 4.1 Button Window Function
Create and manage user accounts.
Launch Cytobank website.
Login as administrator or Service. Check software version.
50
Table 4.2 Tuning Mode Toolbar
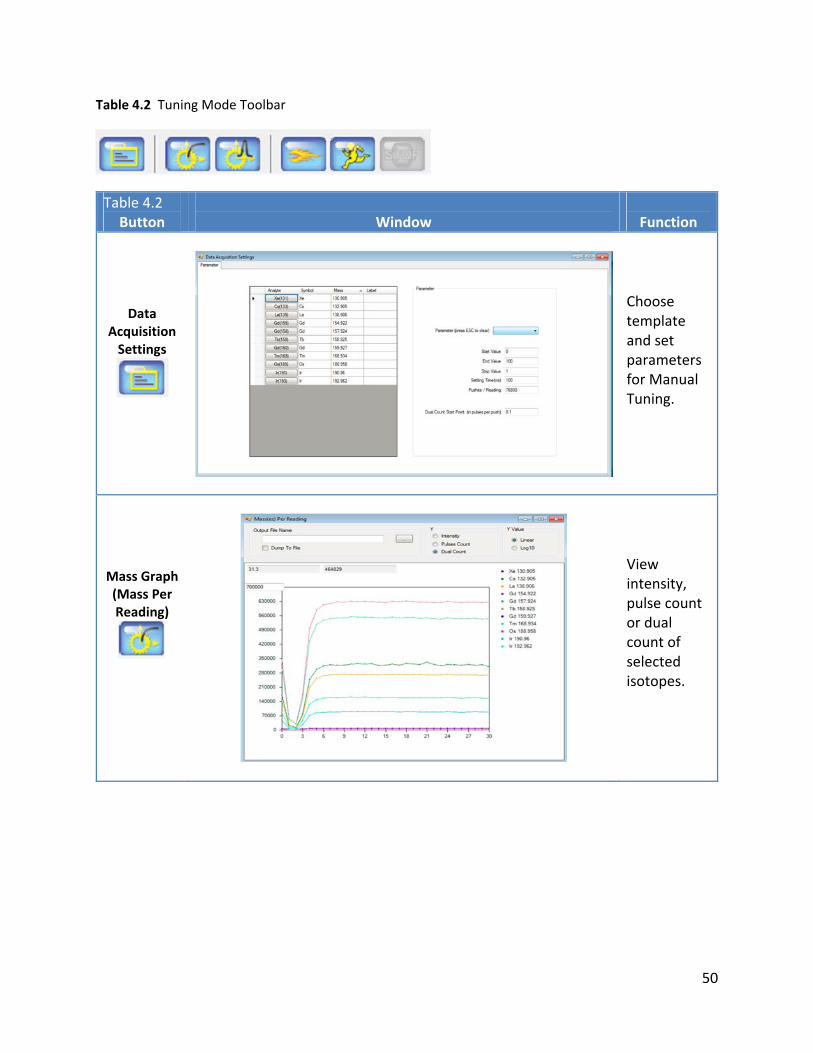
Table 4.2 Button Window Function
Data Acquisition Settings
Choose template and set parameters for Manual Tuning.
Mass Graph (Mass Per Reading)
View intensity, pulse count or dual count of selected isotopes.
51
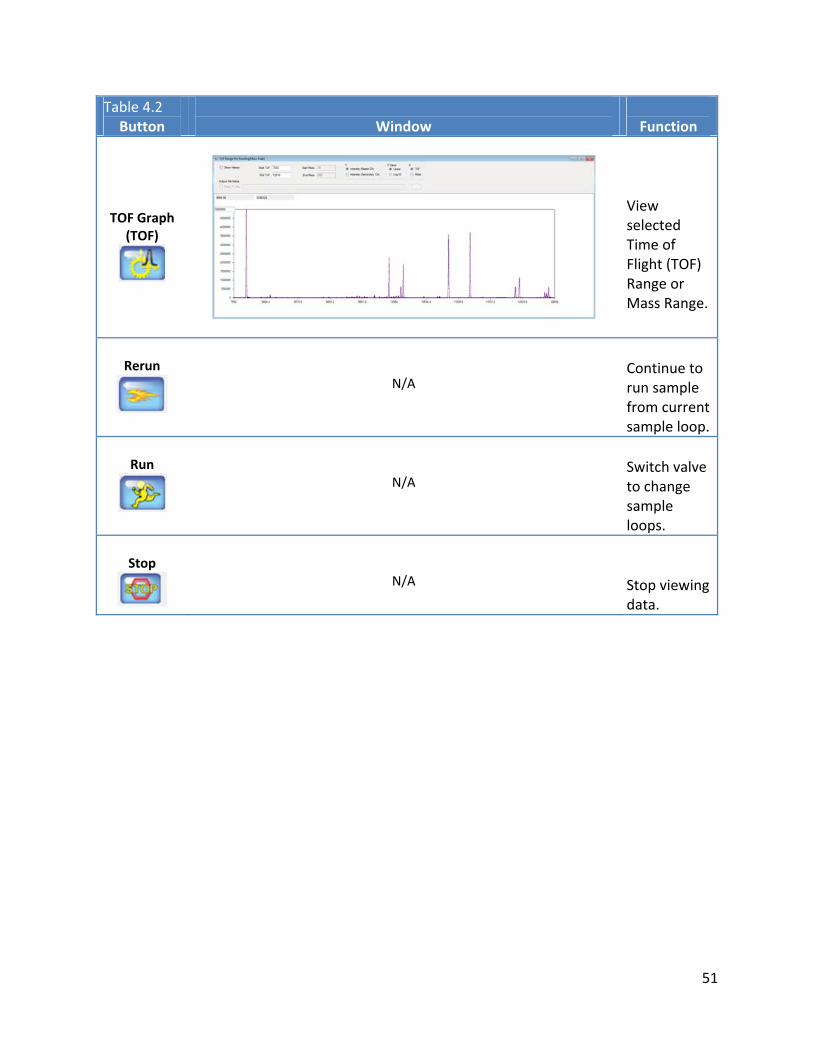
Table 4.2 Button Window Function
TOF Graph (TOF)
View selected Time of Flight (TOF) Range or Mass Range.
Rerun N/A
Continue to run sample from current sample loop.
Run N/A
Switch valve to change sample loops.
Stop N/A Stop viewing
data.
52
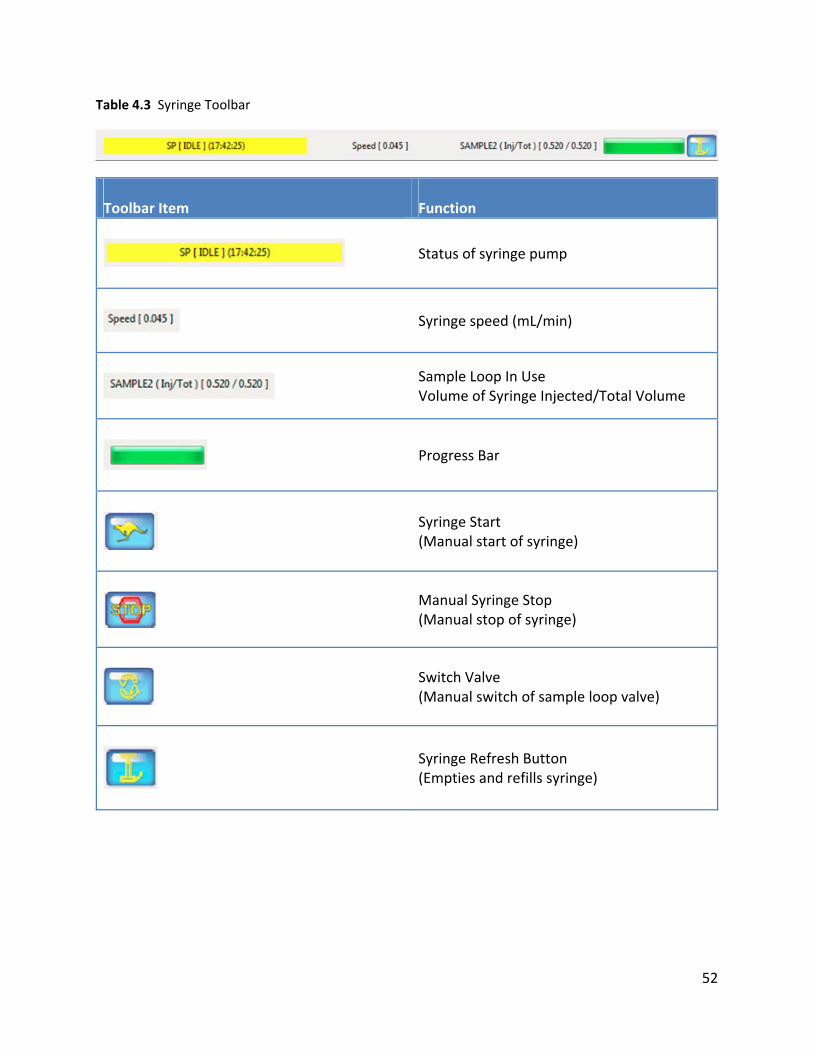
Table 4.3 Syringe Toolbar
Toolbar Item Function
Status of syringe pump
Syringe speed (mL/min)
Sample Loop In Use Volume of Syringe Injected/Total Volume
Progress Bar
Syringe Start (Manual start of syringe)
Manual Syringe Stop (Manual stop of syringe)
Switch Valve (Manual switch of sample loop valve)
Syringe Refresh Button (Empties and refills syringe)
53
Chapter 5 CyTOF® 2 Operation
This chapter describes daily operation of the CyTOF® 2 Mass Cytometer, including:
• Preparation and Start Up• Overview of the Software Interface and Fluidic System• Daily QC• Manual Tuning• Bead Sensitivity Test• Sample Acquisition• Daily Cleaning• Shutdown: Turning off Plasma• Other Features• Consumables
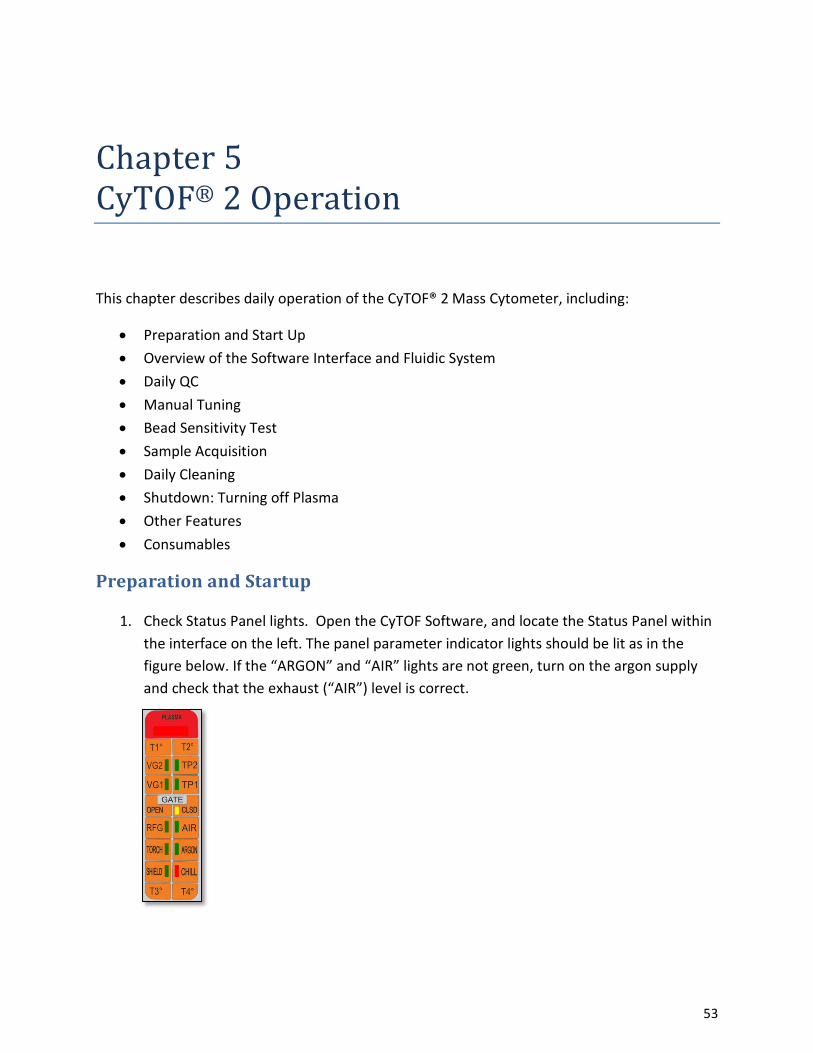
Preparation and Startup
1. Check Status Panel lights. Open the CyTOF Software, and locate the Status Panel withinthe interface on the left. The panel parameter indicator lights should be lit as in thefigure below. If the “ARGON” and “AIR” lights are not green, turn on the argon supplyand check that the exhaust (“AIR”) level is correct.
54
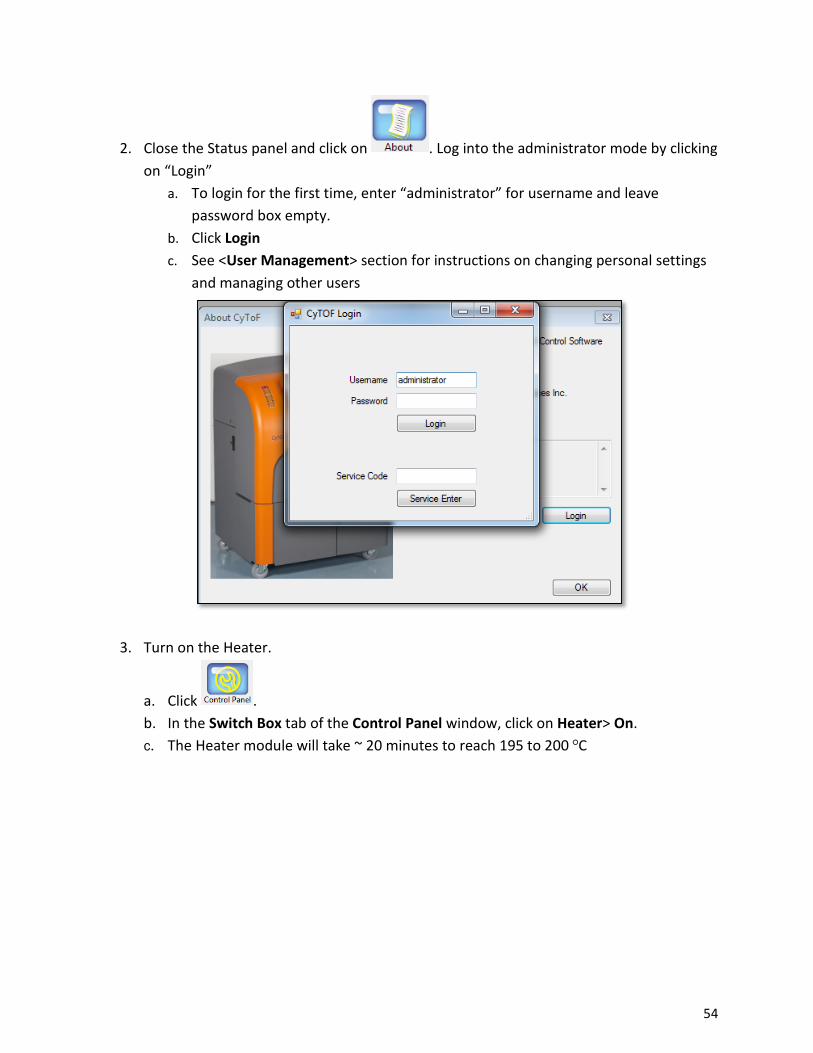
2. Close the Status panel and click on . Log into the administrator mode by clicking on “Login”
a. To login for the first time, enter “administrator” for username and leavepassword box empty.
b. Click Loginc. See <User Management> section for instructions on changing personal settings
and managing other users
3. Turn on the Heater.
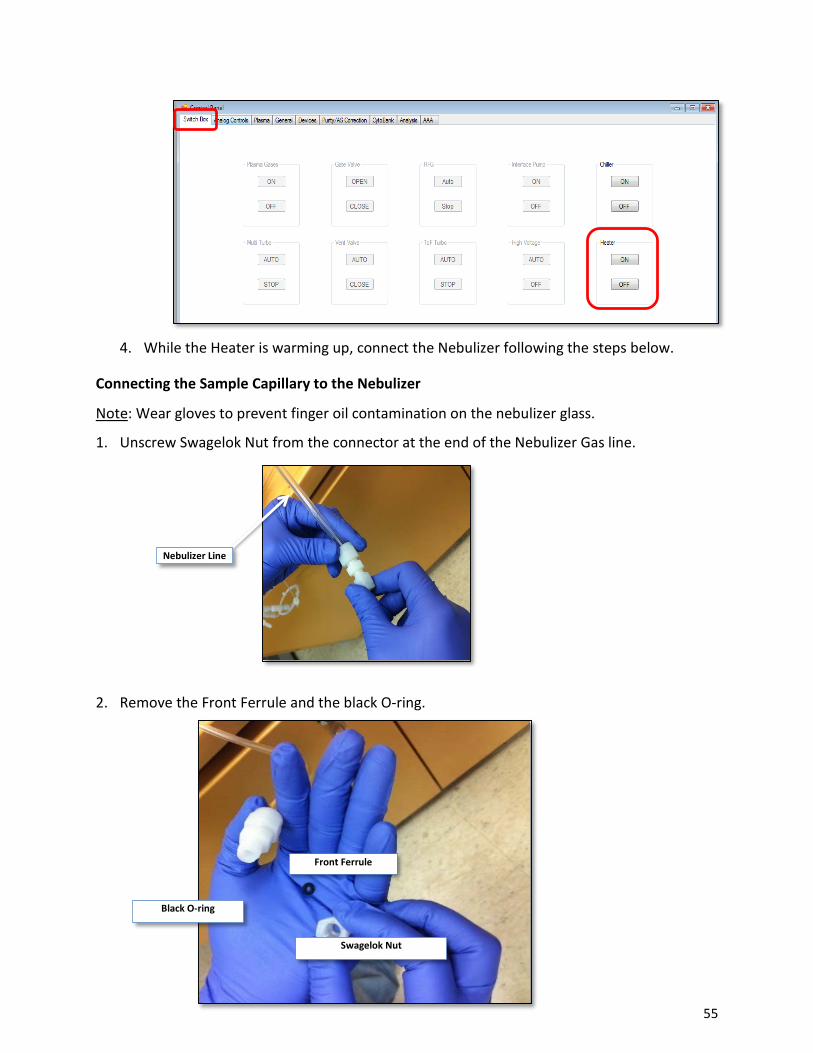
a. Click . b. In the Switch Box tab of the Control Panel window, click on Heater> On.c. The Heater module will take ~ 20 minutes to reach 195 to 200 ○C
55
4. While the Heater is warming up, connect the Nebulizer following the steps below.
Connecting the Sample Capillary to the Nebulizer
Note: Wear gloves to prevent finger oil contamination on the nebulizer glass.
1. Unscrew Swagelok Nut from the connector at the end of the Nebulizer Gas line.
2. Remove the Front Ferrule and the black O-ring.
Nebulizer Line
Front Ferrule
Black O-ring
Swagelok Nut
56
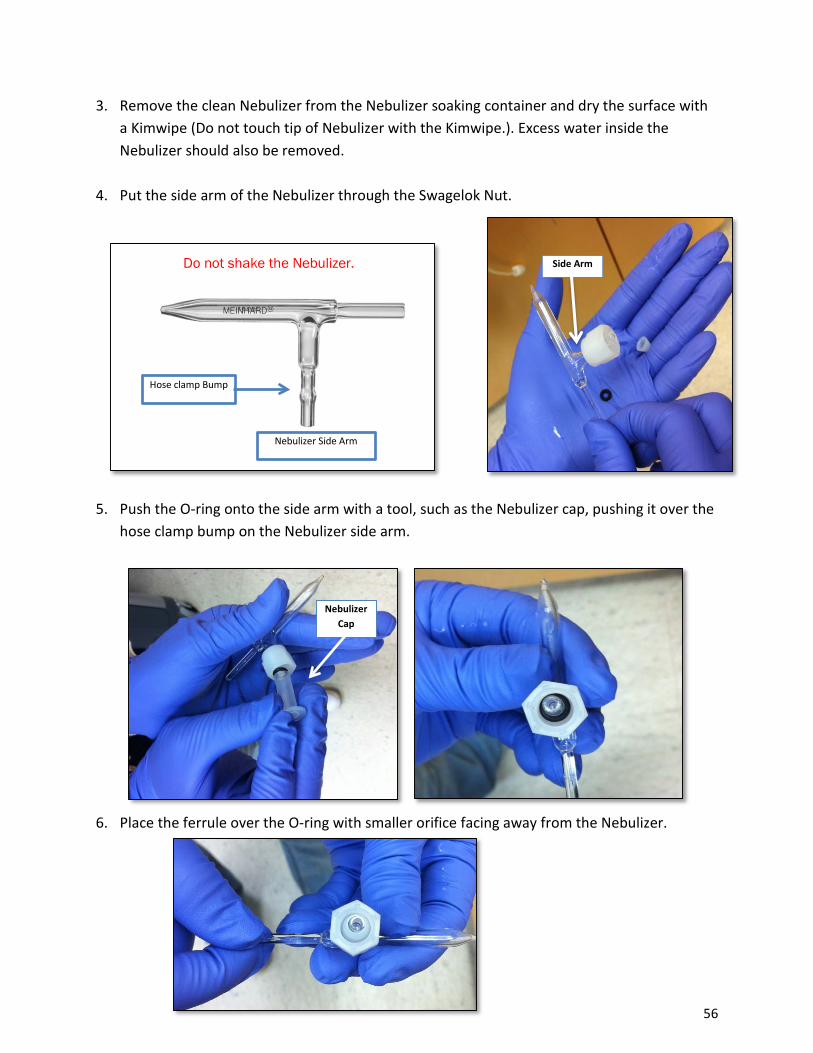
3. Remove the clean Nebulizer from the Nebulizer soaking container and dry the surface witha Kimwipe (Do not touch tip of Nebulizer with the Kimwipe.). Excess water inside theNebulizer should also be removed.
4. Put the side arm of the Nebulizer through the Swagelok Nut.
+
5. Push the O-ring onto the side arm with a tool, such as the Nebulizer cap, pushing it over thehose clamp bump on the Nebulizer side arm.
6. Place the ferrule over the O-ring with smaller orifice facing away from the Nebulizer.
Nebulizer Cap
Nebulizer Side Arm
Do not shake the Nebulizer.
Hose clamp Bump
Side Arm
57
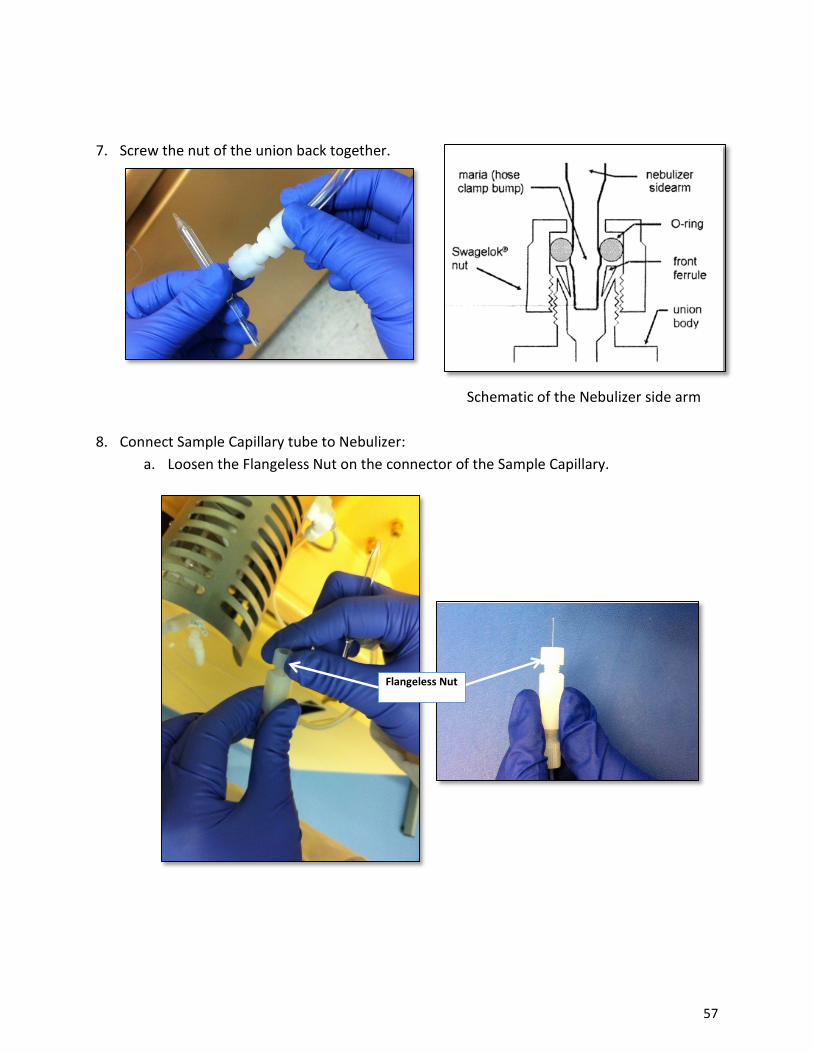
7. Screw the nut of the union back together.
Schematic of the Nebulizer side arm
8. Connect Sample Capillary tube to Nebulizer:a. Loosen the Flangeless Nut on the connector of the Sample Capillary.
Flangeless Nut
58
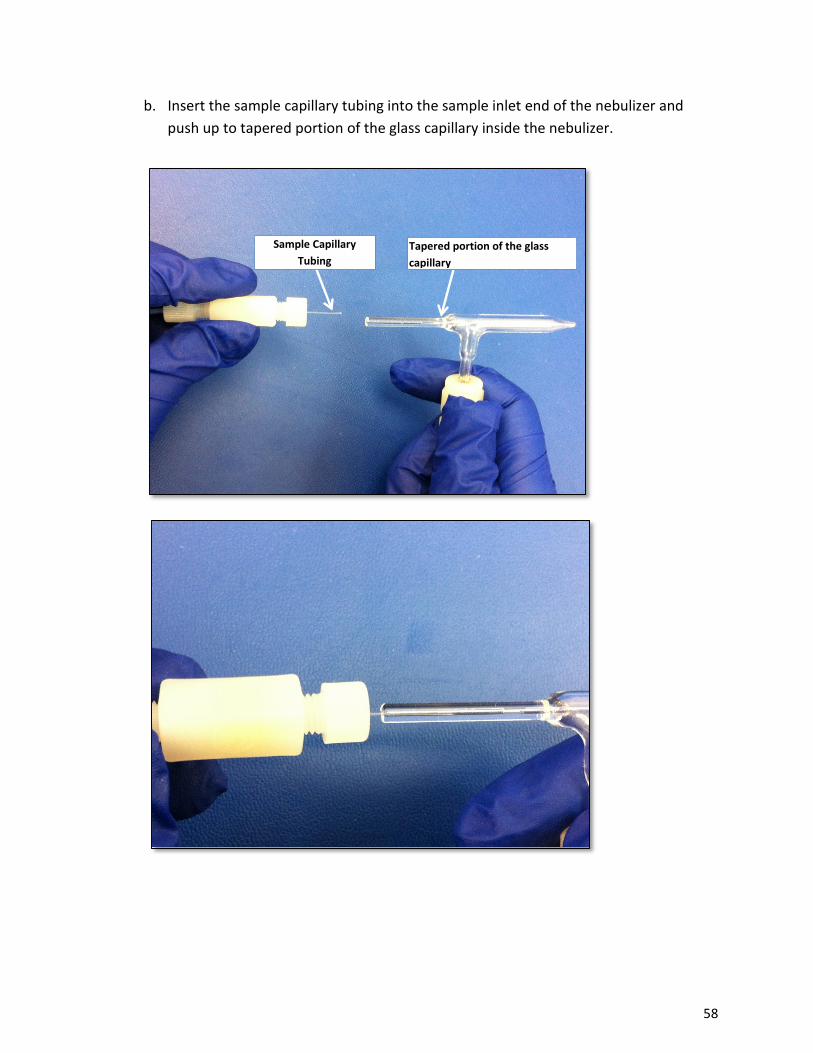
b. Insert the sample capillary tubing into the sample inlet end of the nebulizer andpush up to tapered portion of the glass capillary inside the nebulizer.
Sample Capillary Tubing
Tapered portion of the glass capillary
59
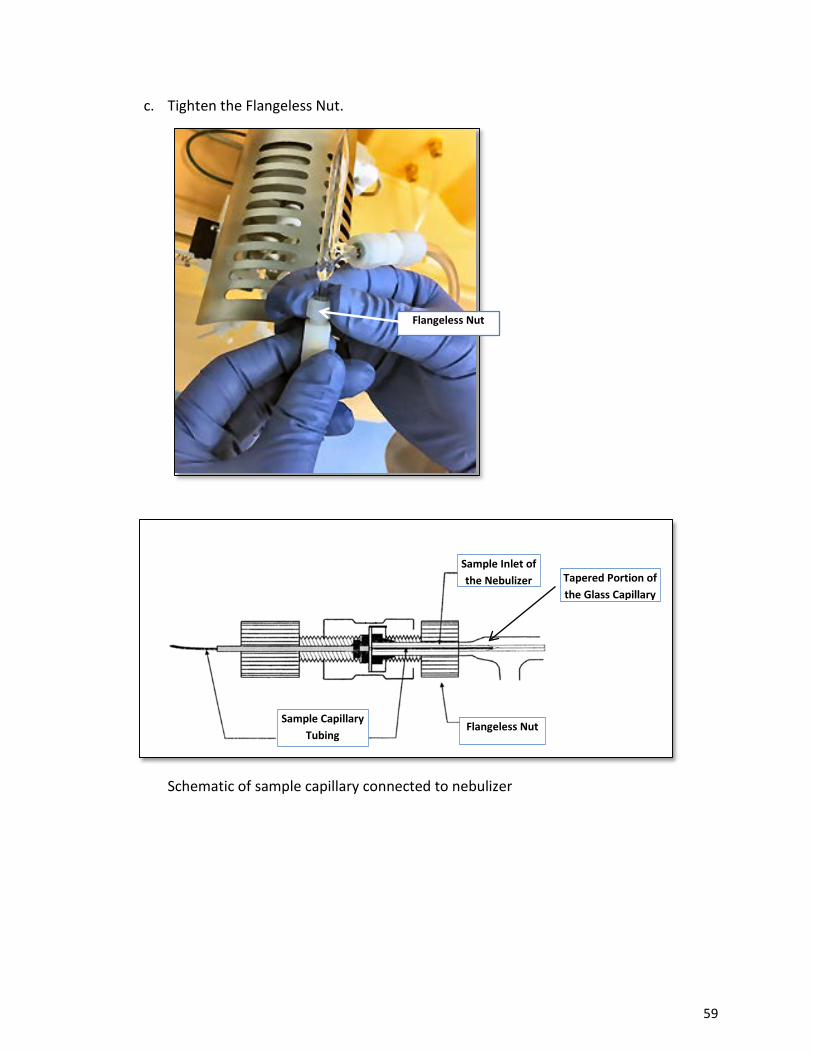
c. Tighten the Flangeless Nut.
Schematic of sample capillary connected to nebulizer
Tapered Portion of the Glass Capillary
Sample Capillary Tubing
Flangeless Nut
Sample Inlet of the Nebulizer
Flangeless Nut
60
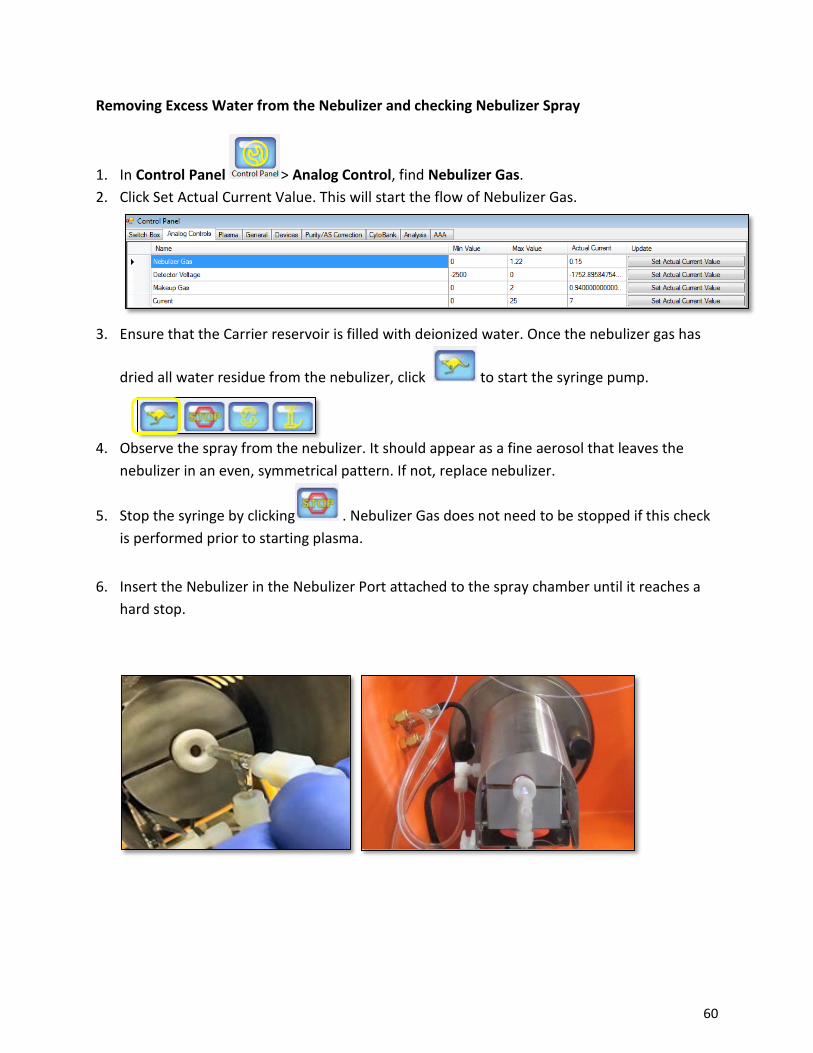
Removing Excess Water from the Nebulizer and checking Nebulizer Spray
1. In Control Panel > Analog Control, find Nebulizer Gas. 2. Click Set Actual Current Value. This will start the flow of Nebulizer Gas.
3. Ensure that the Carrier reservoir is filled with deionized water. Once the nebulizer gas has
dried all water residue from the nebulizer, click to start the syringe pump.
4. Observe the spray from the nebulizer. It should appear as a fine aerosol that leaves thenebulizer in an even, symmetrical pattern. If not, replace nebulizer.
5. Stop the syringe by clicking . Nebulizer Gas does not need to be stopped if this check is performed prior to starting plasma.
6. Insert the Nebulizer in the Nebulizer Port attached to the spray chamber until it reaches ahard stop.
61
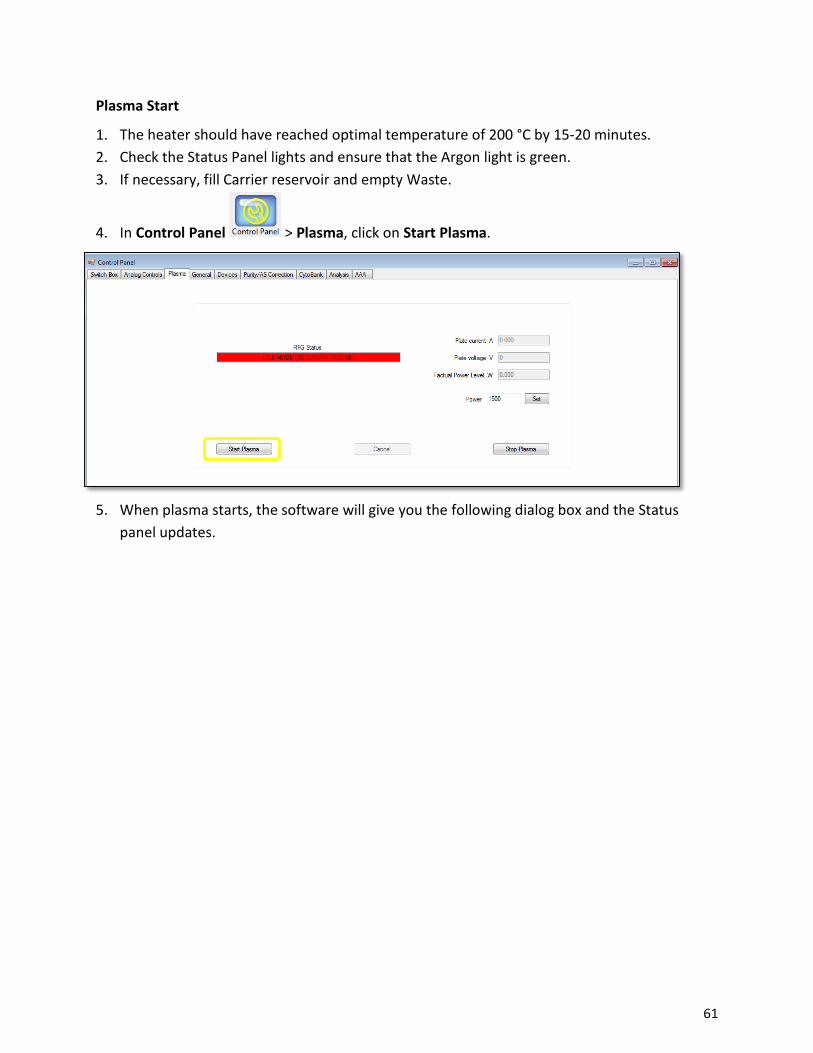
Plasma Start
1. The heater should have reached optimal temperature of 200 °C by 15-20 minutes.2. Check the Status Panel lights and ensure that the Argon light is green.3. If necessary, fill Carrier reservoir and empty Waste.
4. In Control Panel > Plasma, click on Start Plasma.
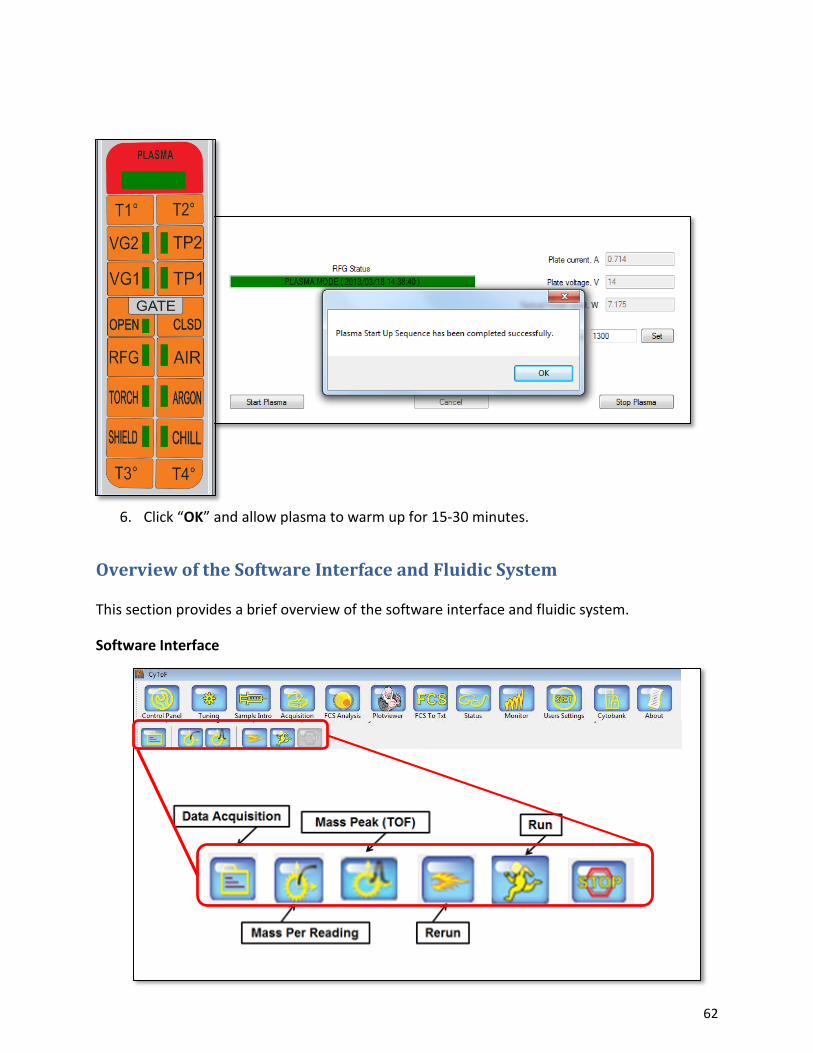
5. When plasma starts, the software will give you the following dialog box and the Statuspanel updates.
62
6. Click “OK” and allow plasma to warm up for 15-30 minutes.
Overview of the Software Interface and Fluidic System
This section provides a brief overview of the software interface and fluidic system.
Software Interface
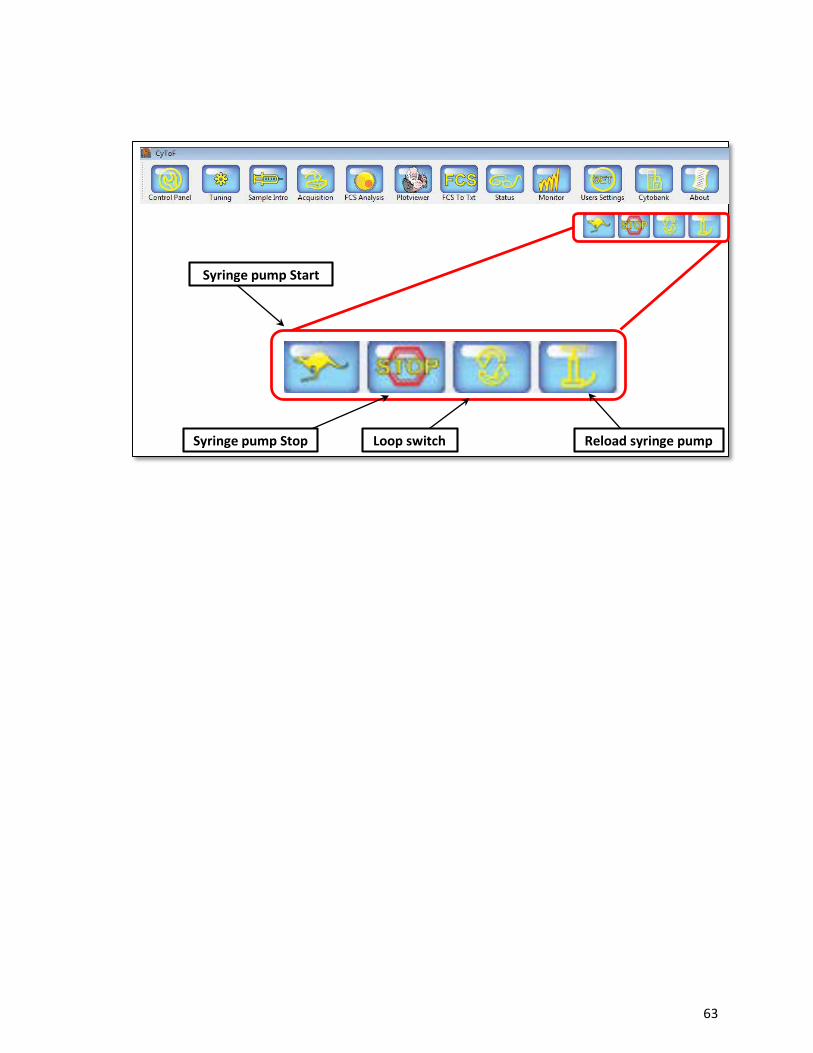
63
Syringe pump Stop Loop switch Reload syringe pump
Syringe pump Start
64
Fluidic System
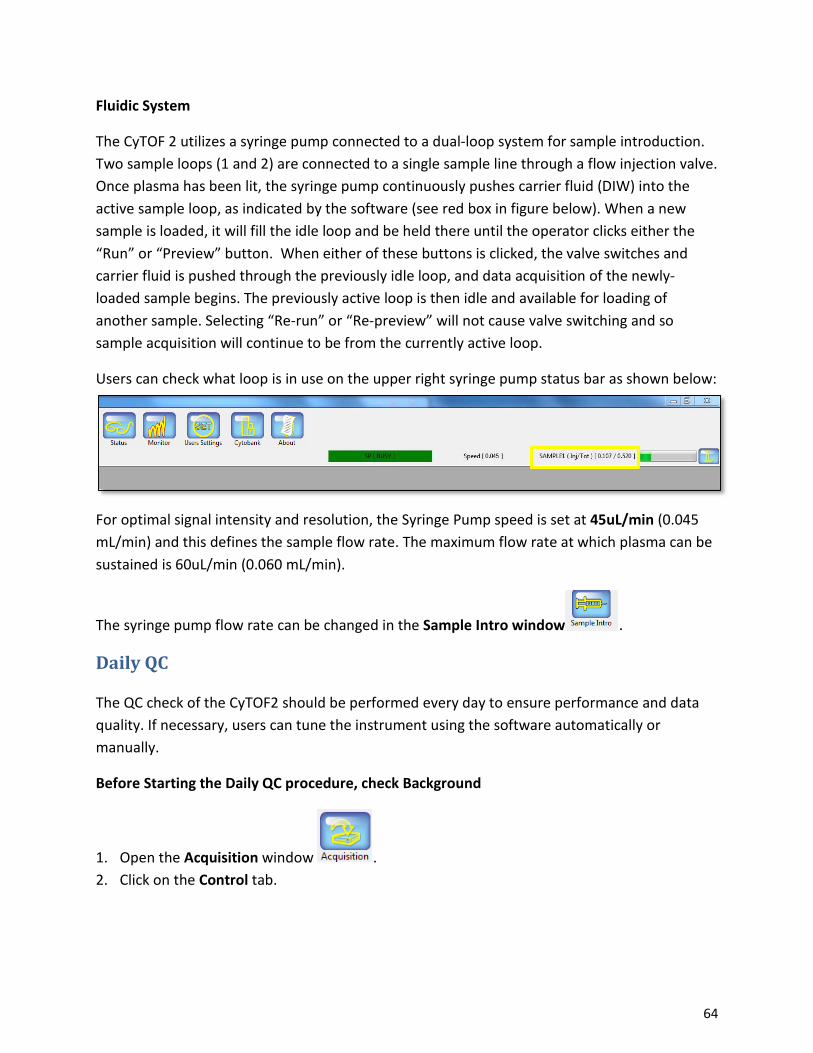
The CyTOF 2 utilizes a syringe pump connected to a dual-loop system for sample introduction. Two sample loops (1 and 2) are connected to a single sample line through a flow injection valve. Once plasma has been lit, the syringe pump continuously pushes carrier fluid (DIW) into the active sample loop, as indicated by the software (see red box in figure below). When a new sample is loaded, it will fill the idle loop and be held there until the operator clicks either the “Run” or “Preview” button. When either of these buttons is clicked, the valve switches and carrier fluid is pushed through the previously idle loop, and data acquisition of the newly-loaded sample begins. The previously active loop is then idle and available for loading of another sample. Selecting “Re-run” or “Re-preview” will not cause valve switching and so sample acquisition will continue to be from the currently active loop.
Users can check what loop is in use on the upper right syringe pump status bar as shown below:
For optimal signal intensity and resolution, the Syringe Pump speed is set at 45uL/min (0.045 mL/min) and this defines the sample flow rate. The maximum flow rate at which plasma can be sustained is 60uL/min (0.060 mL/min).
The syringe pump flow rate can be changed in the Sample Intro window .
Daily QC
The QC check of the CyTOF2 should be performed every day to ensure performance and data quality. If necessary, users can tune the instrument using the software automatically or manually.
Before Starting the Daily QC procedure, check Background
1. Open the Acquisition window . 2. Click on the Control tab.
65
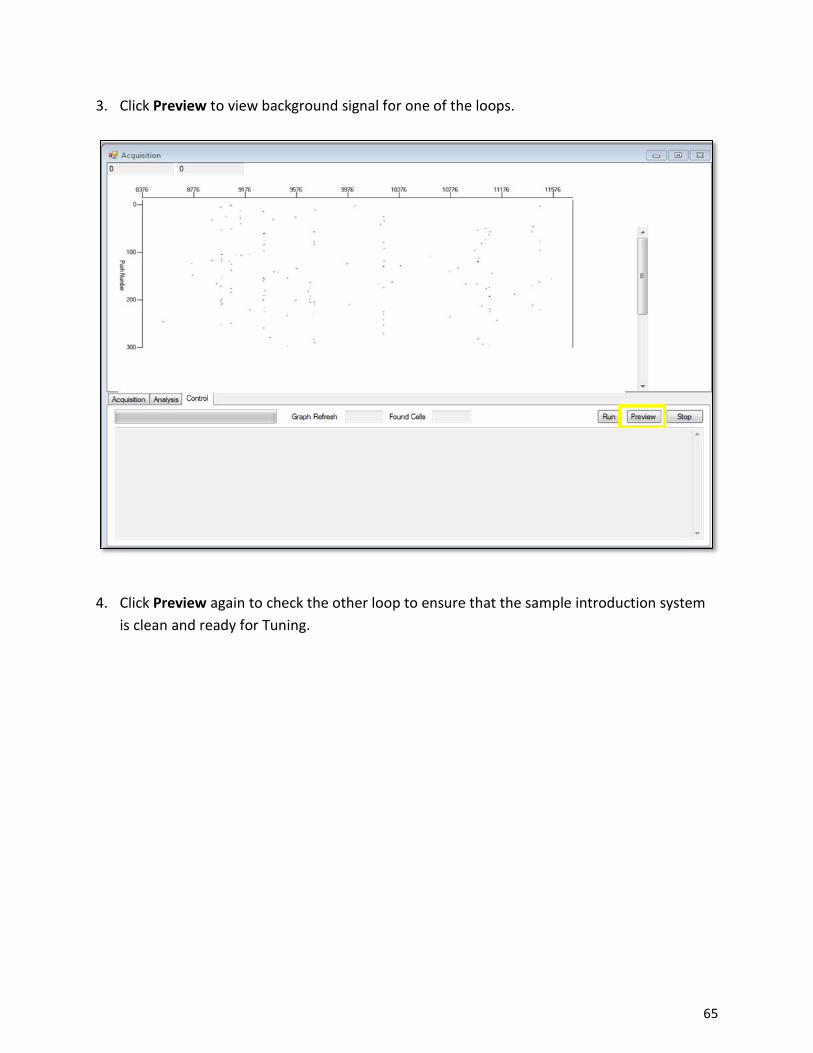
3. Click Preview to view background signal for one of the loops.
4. Click Preview again to check the other loop to ensure that the sample introduction systemis clean and ready for Tuning.
66
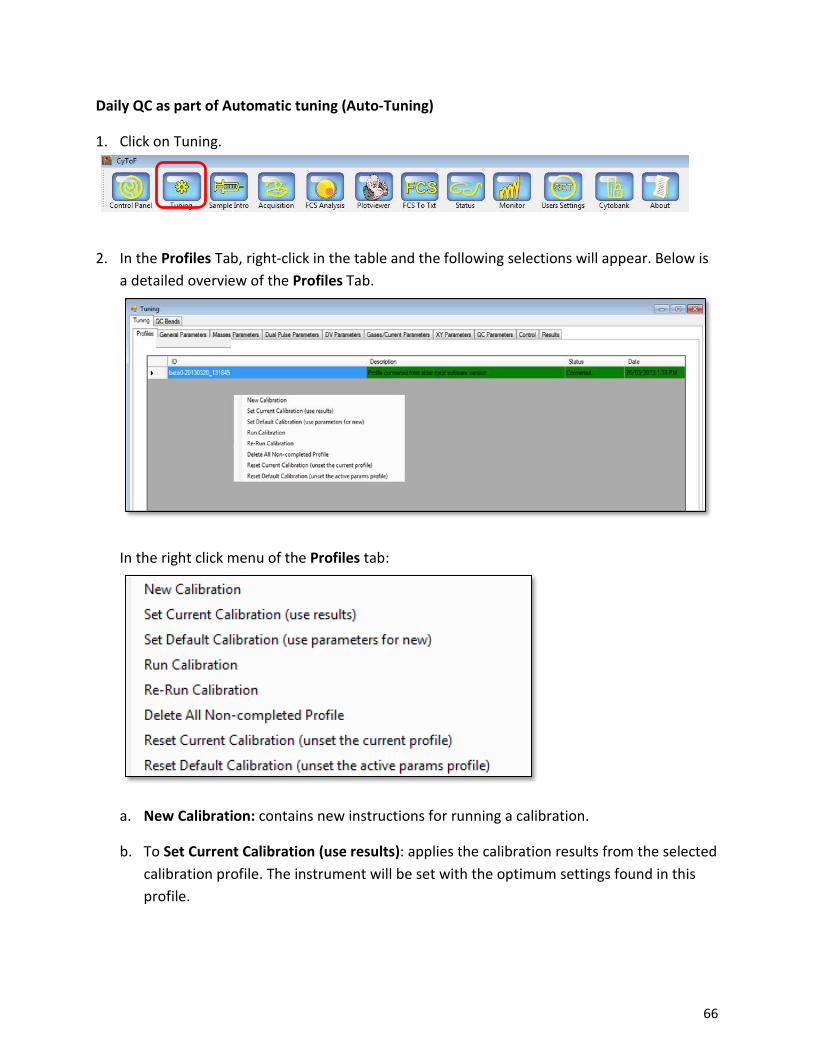
Daily QC as part of Automatic tuning (Auto-Tuning)
1. Click on Tuning.
2. In the Profiles Tab, right-click in the table and the following selections will appear. Below isa detailed overview of the Profiles Tab.
In the right click menu of the Profiles tab:
a. New Calibration: contains new instructions for running a calibration.
b. To Set Current Calibration (use results): applies the calibration results from the selectedcalibration profile. The instrument will be set with the optimum settings found in thisprofile.
67
c. To Set Default Calibration (use parameters for new): sets the calibration instructions inthe selected profile as a template. New calibrations created will have the sameinstructions as this default calibration.
d. Run Calibration: starts the calibration. Users need to ensure that the open loop is filledwith Tuning solution before clicking Run Calibration as the flow injection valve willswitch to acquire the originally open loop. This will only work for calibrations that arenew. Completed, stopped, or failed calibrations cannot be run again.
e. Re-run Calibration: starts the calibration without switching the flow injection valve,meaning that the acquisition will begin with the same loop that is already beingacquired. This should only be used if the user is certain that there is sufficient tuningsolution within the current loop. This will only work for calibrations that are new;completed, stopped, or failed calibrations cannot be run again.
f. Delete all Non-completed Profiles: cleans up the calibration profile table.
g. Reset Current Calibration (unset current profile): reverts to the previous settings of theinstrument.
h. Reset Default Calibration (unset the active params profile): removes the templatesettings for new calibrations.
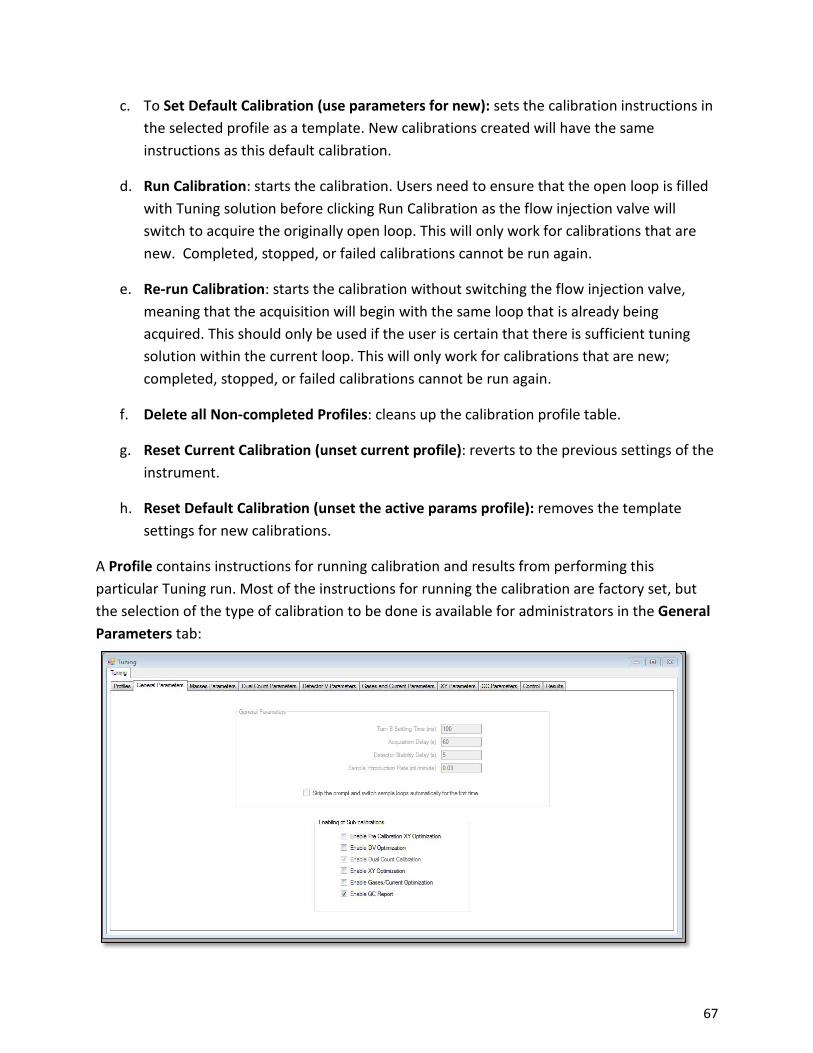
A Profile contains instructions for running calibration and results from performing this particular Tuning run. Most of the instructions for running the calibration are factory set, but the selection of the type of calibration to be done is available for administrators in the General Parameters tab:
68
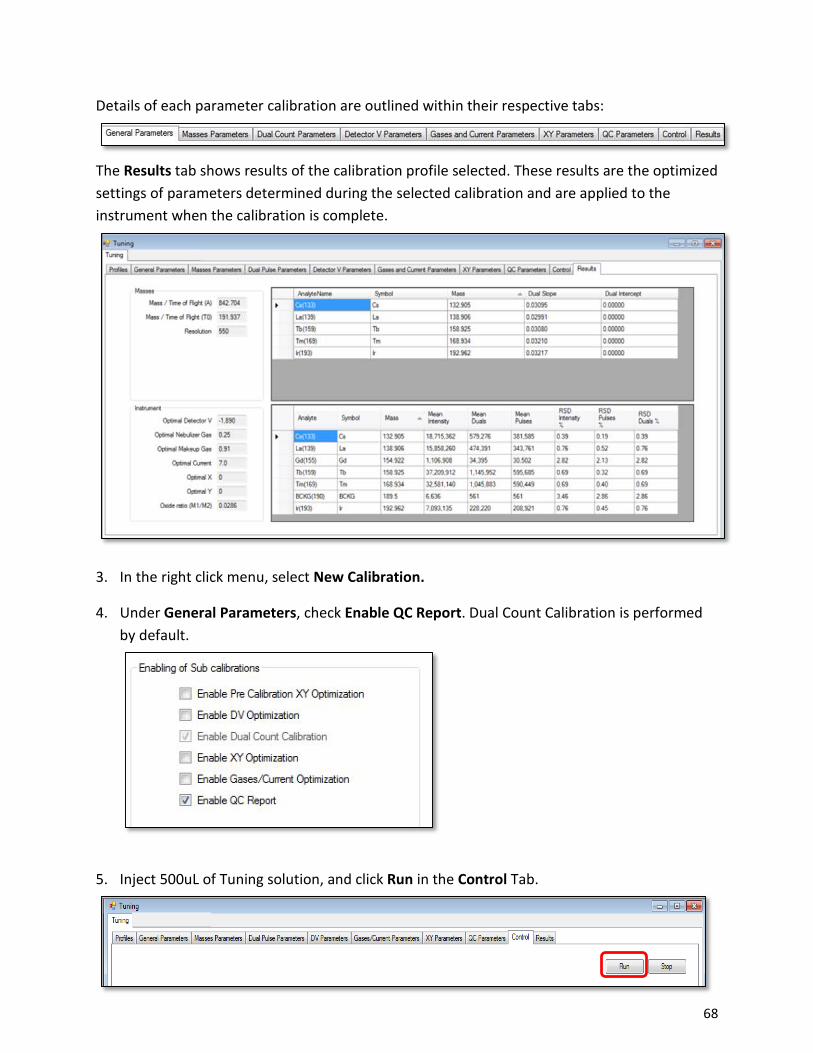
Details of each parameter calibration are outlined within their respective tabs:
The Results tab shows results of the calibration profile selected. These results are the optimized settings of parameters determined during the selected calibration and are applied to the instrument when the calibration is complete.
3. In the right click menu, select New Calibration.
4. Under General Parameters, check Enable QC Report. Dual Count Calibration is performedby default.
5. Inject 500uL of Tuning solution, and click Run in the Control Tab.
69
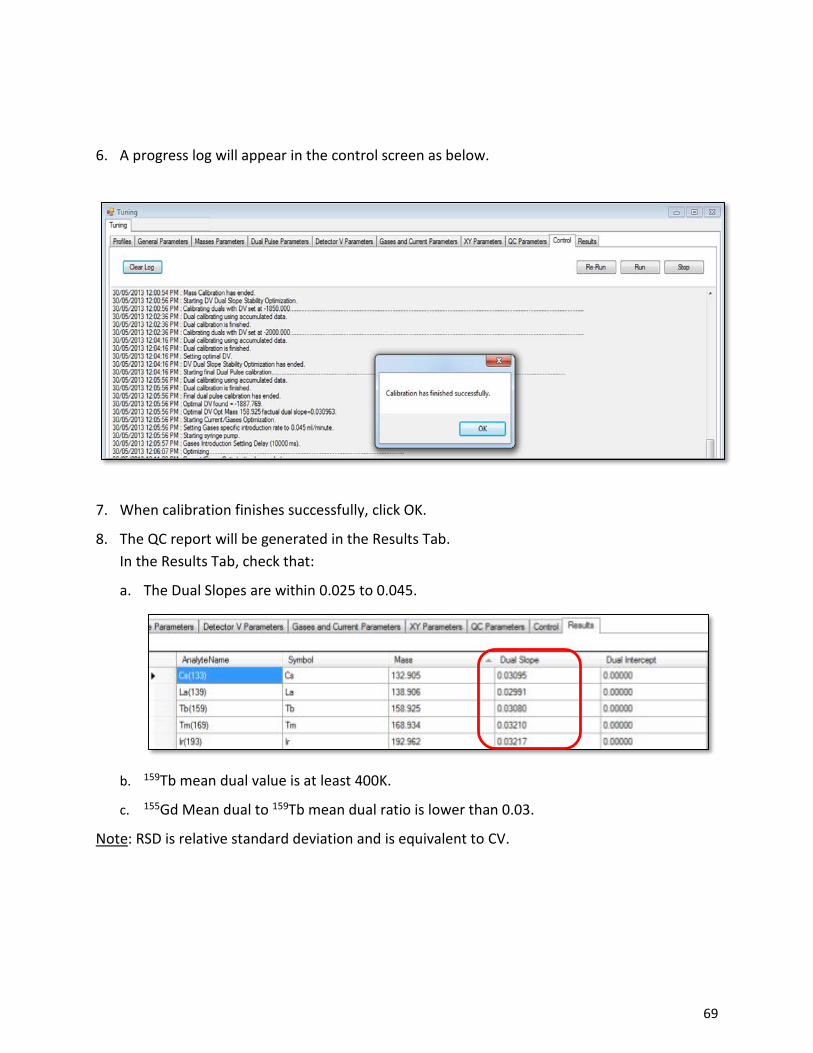
6. A progress log will appear in the control screen as below.
7. When calibration finishes successfully, click OK.
8. The QC report will be generated in the Results Tab.In the Results Tab, check that:
a. The Dual Slopes are within 0.025 to 0.045.
b. 159Tb mean dual value is at least 400K.
c. 155Gd Mean dual to 159Tb mean dual ratio is lower than 0.03.
Note: RSD is relative standard deviation and is equivalent to CV.
70
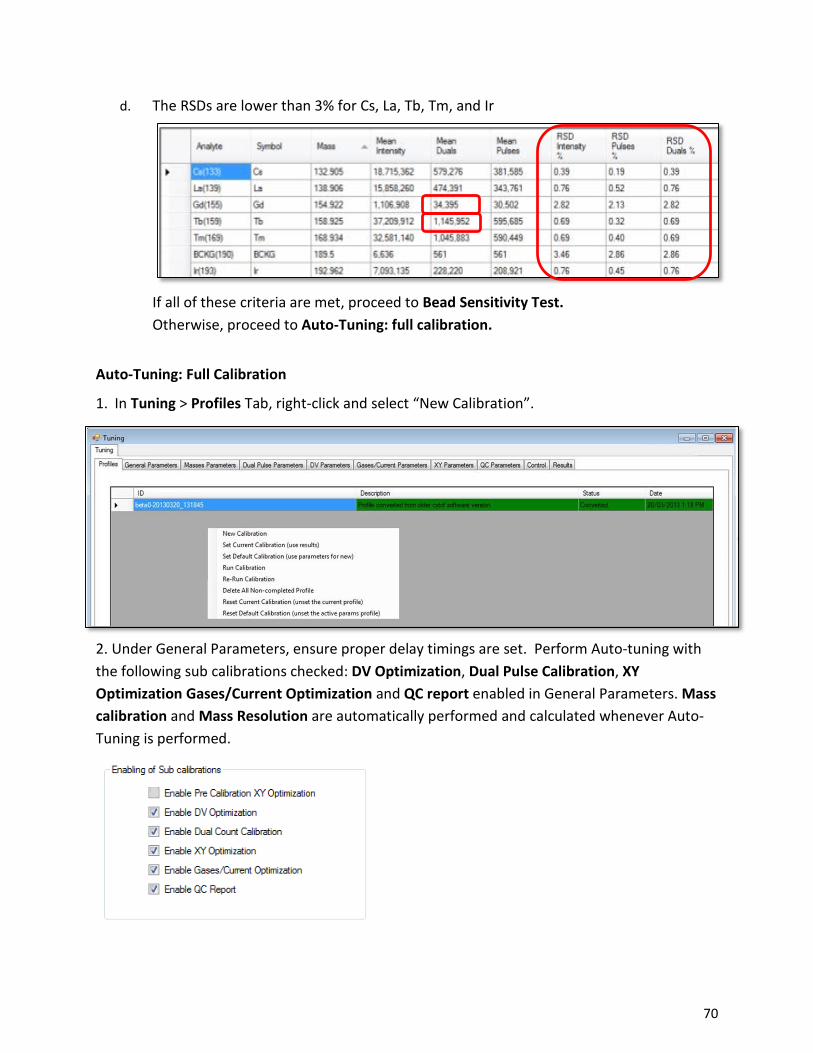
d. The RSDs are lower than 3% for Cs, La, Tb, Tm, and Ir
If all of these criteria are met, proceed to Bead Sensitivity Test. Otherwise, proceed to Auto-Tuning: full calibration.
Auto-Tuning: Full Calibration
1. In Tuning > Profiles Tab, right-click and select “New Calibration”.
2. Under General Parameters, ensure proper delay timings are set. Perform Auto-tuning withthe following sub calibrations checked: DV Optimization, Dual Pulse Calibration, XY Optimization Gases/Current Optimization and QC report enabled in General Parameters. Mass calibration and Mass Resolution are automatically performed and calculated whenever Auto-Tuning is performed.
71
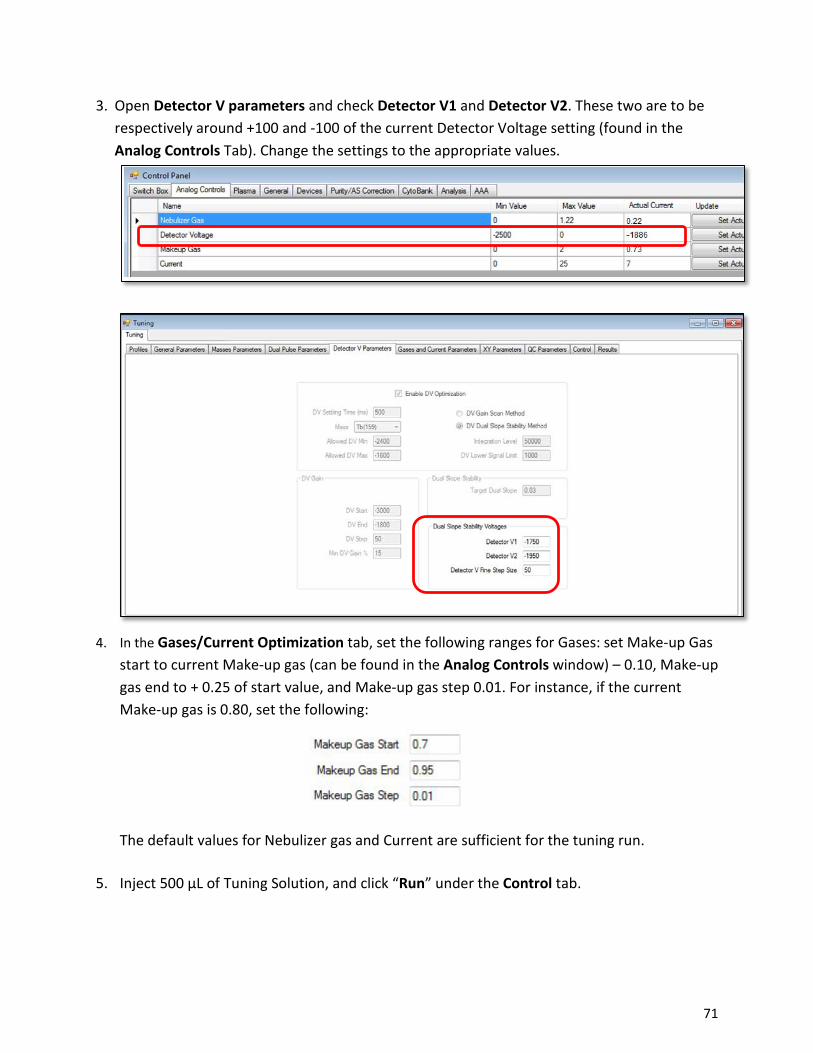
3. Open Detector V parameters and check Detector V1 and Detector V2. These two are to berespectively around +100 and -100 of the current Detector Voltage setting (found in theAnalog Controls Tab). Change the settings to the appropriate values.
4. In the Gases/Current Optimization tab, set the following ranges for Gases: set Make-up Gasstart to current Make-up gas (can be found in the Analog Controls window) – 0.10, Make-upgas end to + 0.25 of start value, and Make-up gas step 0.01. For instance, if the currentMake-up gas is 0.80, set the following:
The default values for Nebulizer gas and Current are sufficient for the tuning run.
5. Inject 500 µL of Tuning Solution, and click “Run” under the Control tab.
72
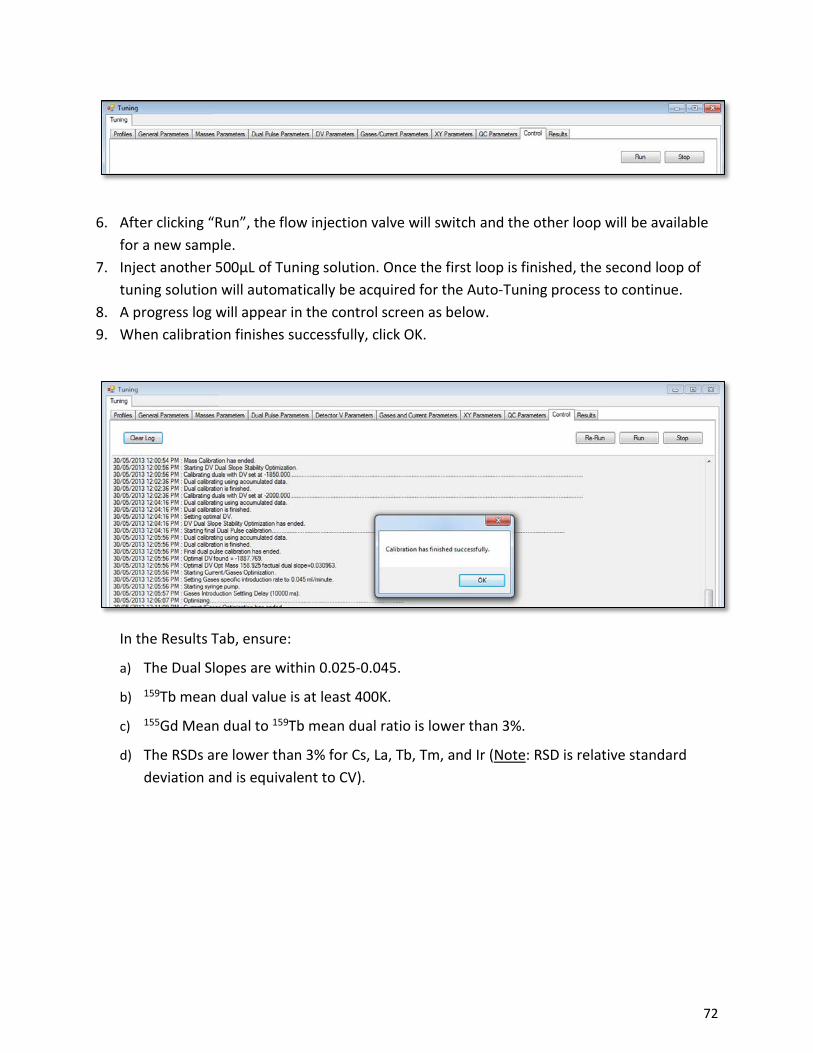
6. After clicking “Run”, the flow injection valve will switch and the other loop will be availablefor a new sample.
7. Inject another 500µL of Tuning solution. Once the first loop is finished, the second loop oftuning solution will automatically be acquired for the Auto-Tuning process to continue.
8. A progress log will appear in the control screen as below.9. When calibration finishes successfully, click OK.
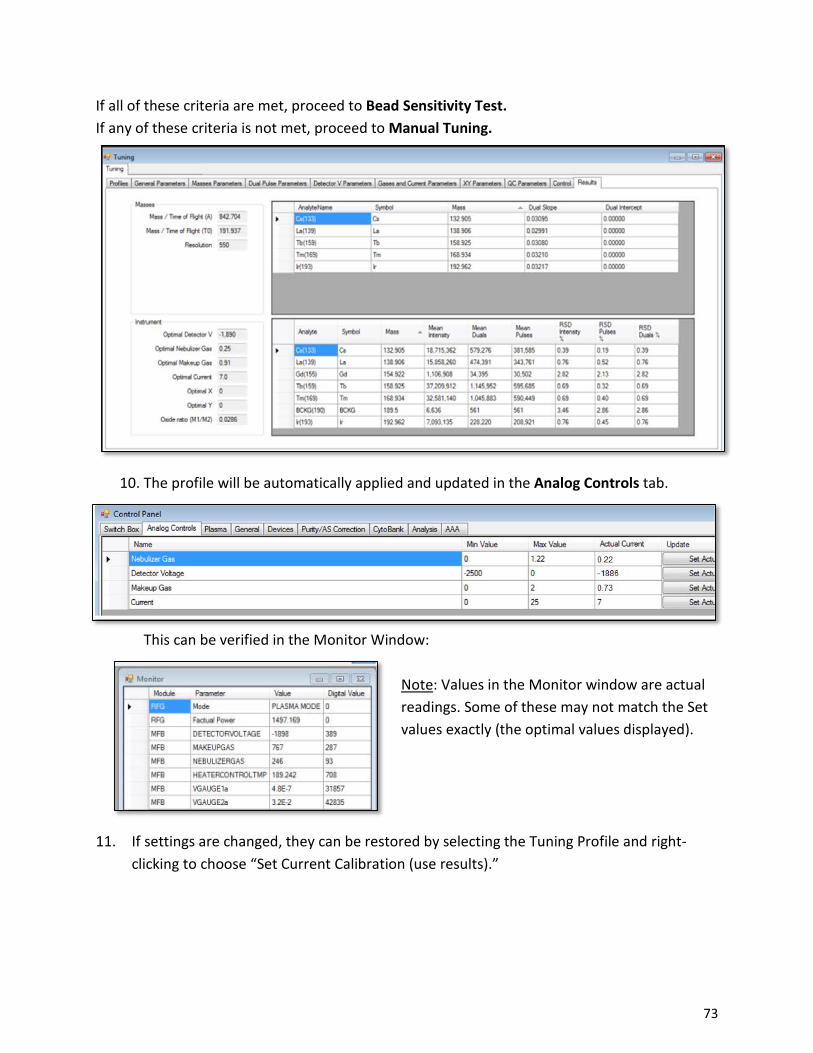
In the Results Tab, ensure:
a) The Dual Slopes are within 0.025-0.045.
b) 159Tb mean dual value is at least 400K.
c) 155Gd Mean dual to 159Tb mean dual ratio is lower than 3%.
d) The RSDs are lower than 3% for Cs, La, Tb, Tm, and Ir (Note: RSD is relative standarddeviation and is equivalent to CV).
73
If all of these criteria are met, proceed to Bead Sensitivity Test. If any of these criteria is not met, proceed to Manual Tuning.
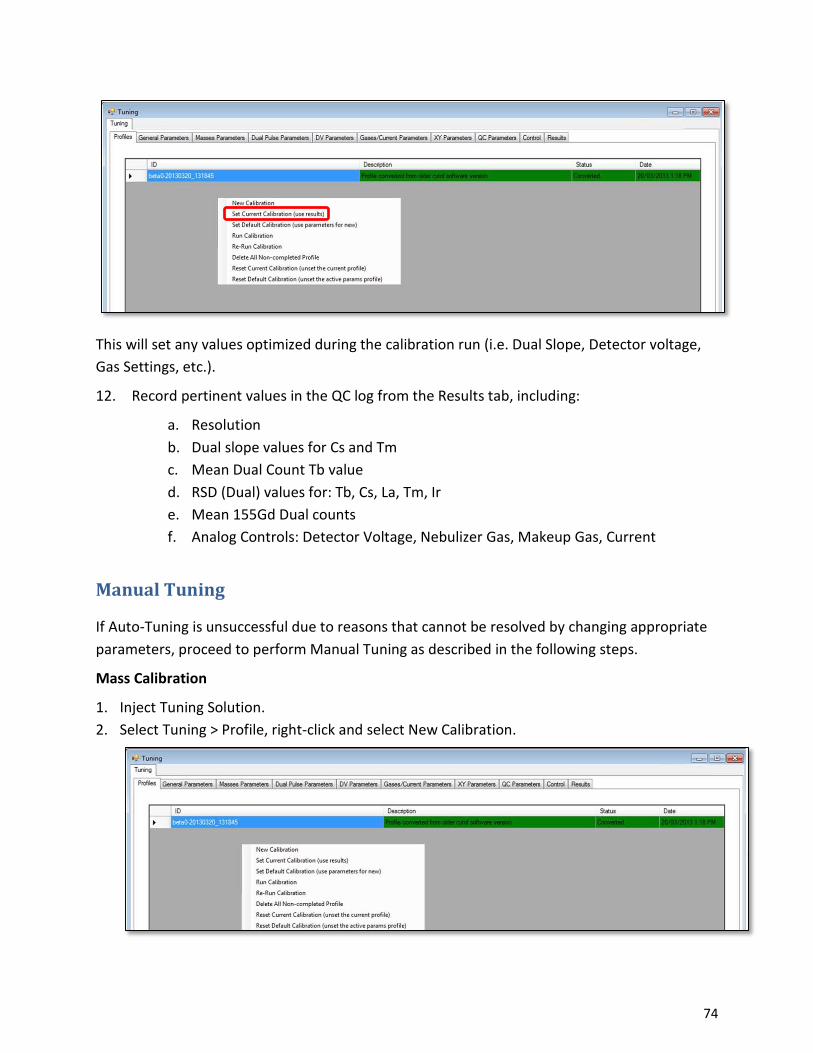
10. The profile will be automatically applied and updated in the Analog Controls tab.
This can be verified in the Monitor Window:
Note: Values in the Monitor window are actual readings. Some of these may not match the Set values exactly (the optimal values displayed).
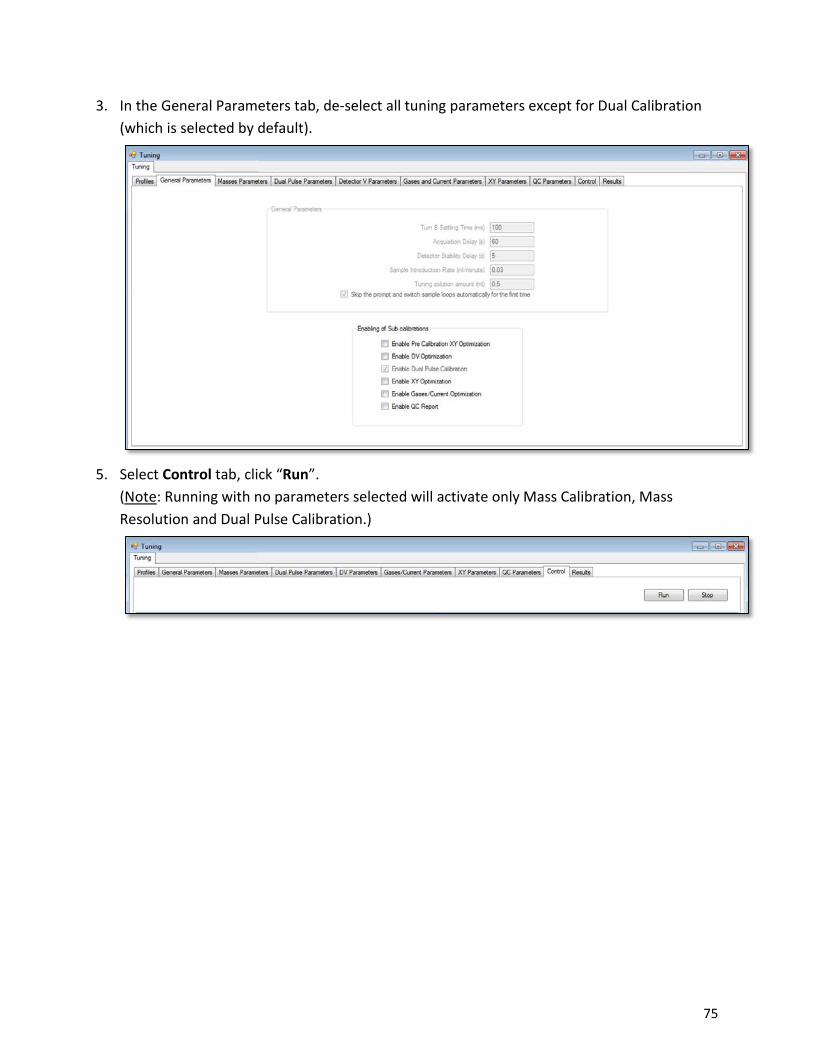
11. If settings are changed, they can be restored by selecting the Tuning Profile and right-clicking to choose “Set Current Calibration (use results).”
74
This will set any values optimized during the calibration run (i.e. Dual Slope, Detector voltage, Gas Settings, etc.).
12. Record pertinent values in the QC log from the Results tab, including:
a. Resolutionb. Dual slope values for Cs and Tmc. Mean Dual Count Tb valued. RSD (Dual) values for: Tb, Cs, La, Tm, Ire. Mean 155Gd Dual countsf. Analog Controls: Detector Voltage, Nebulizer Gas, Makeup Gas, Current
Manual Tuning
If Auto-Tuning is unsuccessful due to reasons that cannot be resolved by changing appropriate parameters, proceed to perform Manual Tuning as described in the following steps.
Mass Calibration
1. Inject Tuning Solution.2. Select Tuning > Profile, right-click and select New Calibration.
75
3. In the General Parameters tab, de-select all tuning parameters except for Dual Calibration(which is selected by default).
5. Select Control tab, click “Run”.(Note: Running with no parameters selected will activate only Mass Calibration, MassResolution and Dual Pulse Calibration.)
76
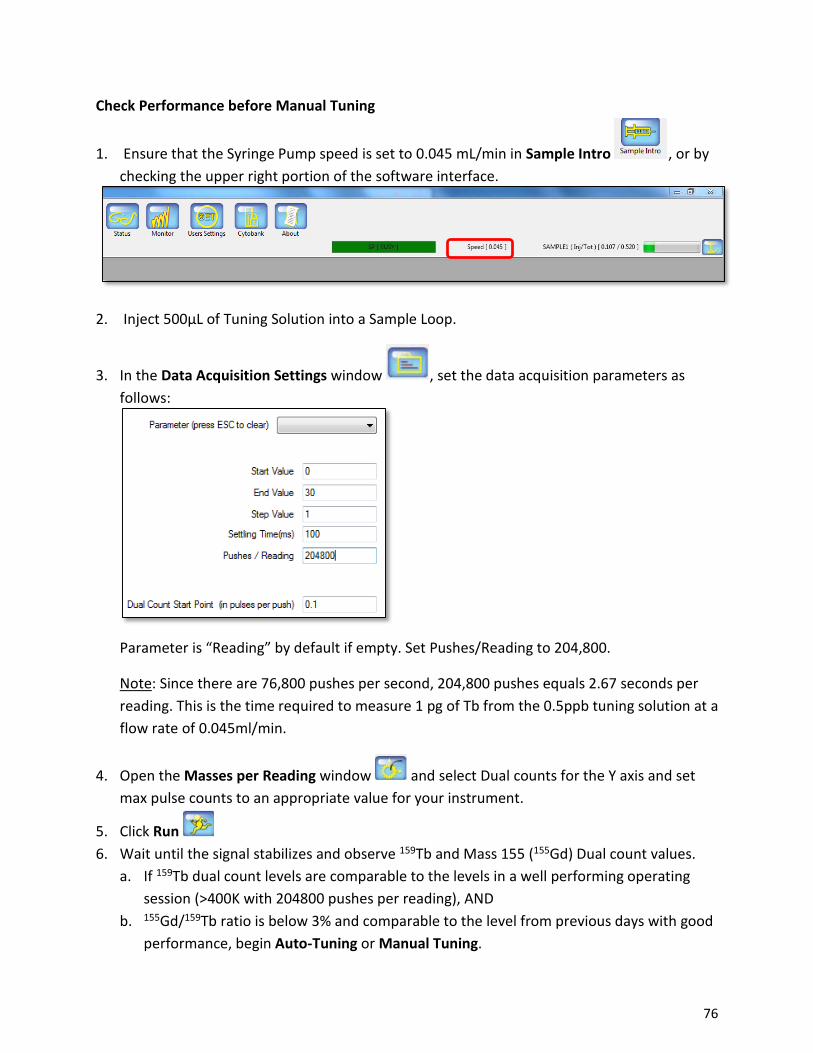
Check Performance before Manual Tuning
1. Ensure that the Syringe Pump speed is set to 0.045 mL/min in Sample Intro , or by checking the upper right portion of the software interface.
2. Inject 500µL of Tuning Solution into a Sample Loop.
3. In the Data Acquisition Settings window , set the data acquisition parameters as follows:
Parameter is “Reading” by default if empty. Set Pushes/Reading to 204,800.
Note: Since there are 76,800 pushes per second, 204,800 pushes equals 2.67 seconds per reading. This is the time required to measure 1 pg of Tb from the 0.5ppb tuning solution at a flow rate of 0.045ml/min.
4. Open the Masses per Reading window and select Dual counts for the Y axis and set max pulse counts to an appropriate value for your instrument.
5. Click Run6. Wait until the signal stabilizes and observe 159Tb and Mass 155 (155Gd) Dual count values.
a. If 159Tb dual count levels are comparable to the levels in a well performing operatingsession (>400K with 204800 pushes per reading), AND
b. 155Gd/159Tb ratio is below 3% and comparable to the level from previous days with goodperformance, begin Auto-Tuning or Manual Tuning.
77
c. If the signals are below specification, adjust XY alignment manually (see Manual Tuning> XY Alignment section below), then repeat/begin Auto-Tuning or Manual Tuning.
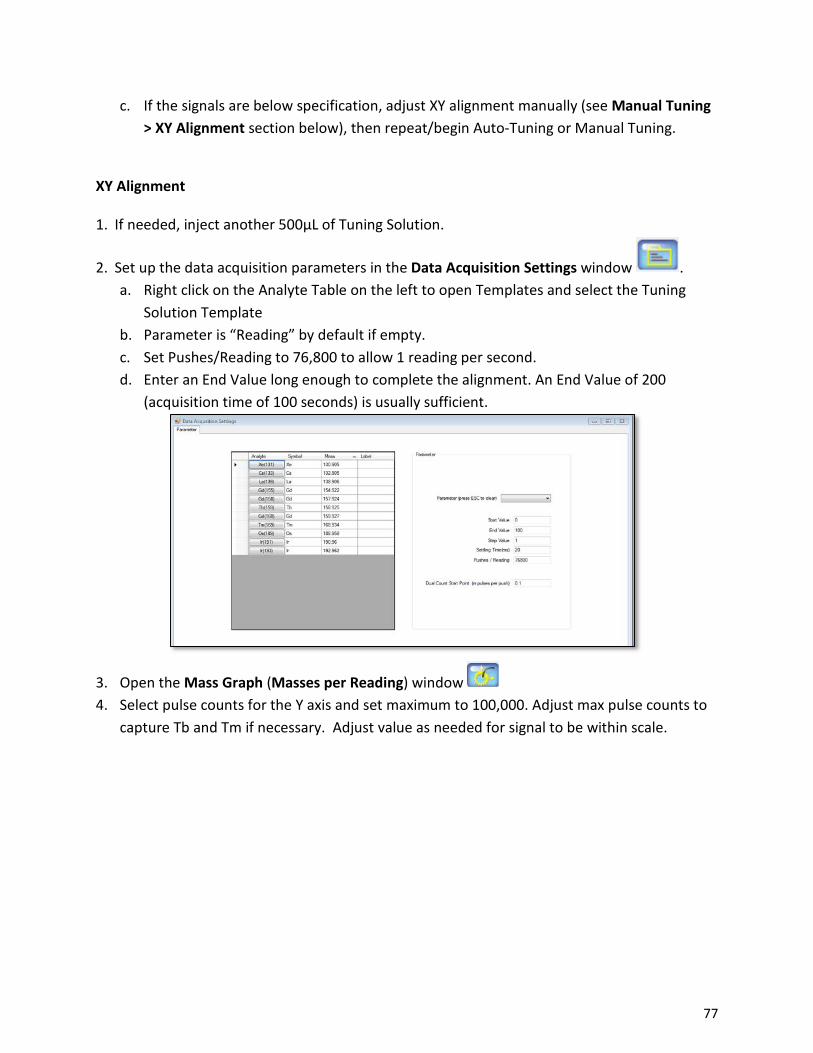
XY Alignment
1. If needed, inject another 500µL of Tuning Solution.
2. Set up the data acquisition parameters in the Data Acquisition Settings window . a. Right click on the Analyte Table on the left to open Templates and select the Tuning
Solution Templateb. Parameter is “Reading” by default if empty.c. Set Pushes/Reading to 76,800 to allow 1 reading per second.d. Enter an End Value long enough to complete the alignment. An End Value of 200
(acquisition time of 100 seconds) is usually sufficient.
3. Open the Mass Graph (Masses per Reading) window4. Select pulse counts for the Y axis and set maximum to 100,000. Adjust max pulse counts to
capture Tb and Tm if necessary. Adjust value as needed for signal to be within scale.
78
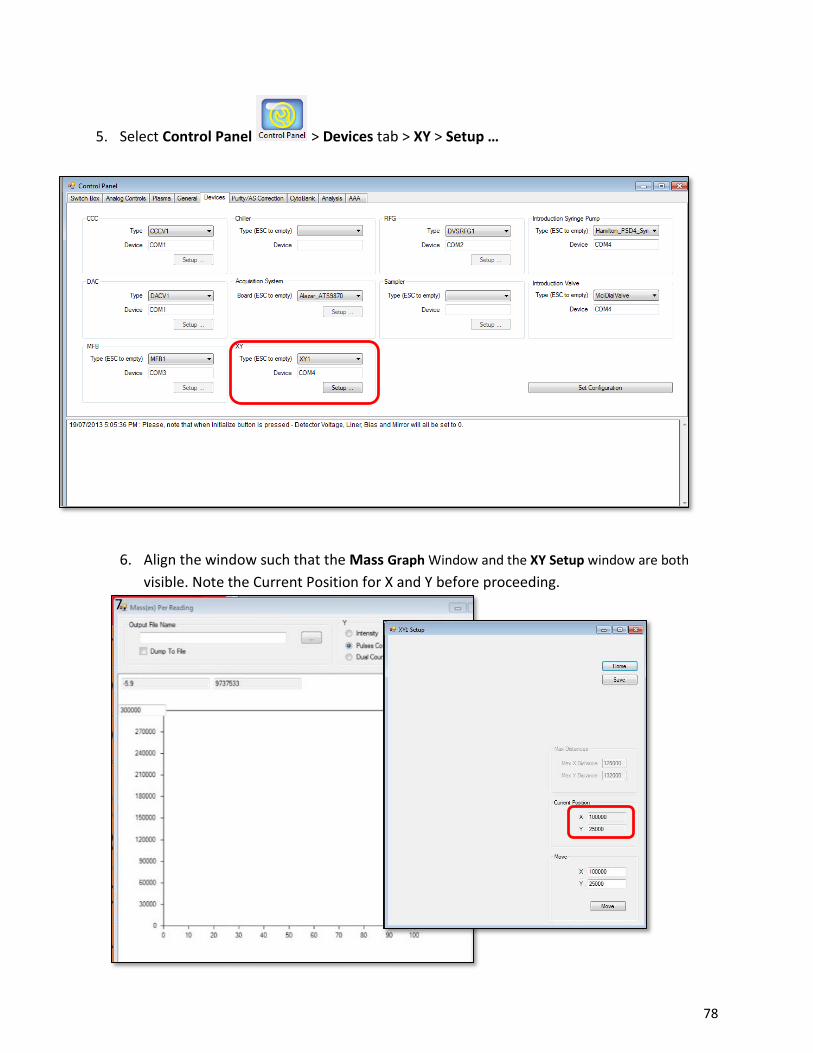
5. Select Control Panel > Devices tab > XY > Setup …
6. Align the window such that the Mass Graph Window and the XY Setup window are bothvisible. Note the Current Position for X and Y before proceeding.
7.

79
8. Click Re-run9. While observing the pulse count signal in the Masses per Reading graph, change X value by
steps of 3000 until signal is at its highest.10. Adjust by smaller steps if necessary.11. Repeat for the Y value.12. Once optimal XY coordinates are found, users can choose to return to tuning the
instrument with Auto-Tuning and deselecting XY Optimization to run the rest of theoptimization.
Dual Pulse Calibration and Detector Voltage Optimization
1. Select Tuning > Profile, right-click and select New Calibration.2. Select DV Optimization in the General Parameters tab. Dual Pulse Calibration is selected by
Default.
3. Inject 500µL of Tuning Solution, and click “Run” in the Control tab.4. When the run is finished, note the Optimal DV from the Results Tab in Auto-Tuning window.
5. Verify this value is the same as the Detector Voltage in >Analog Controls
80
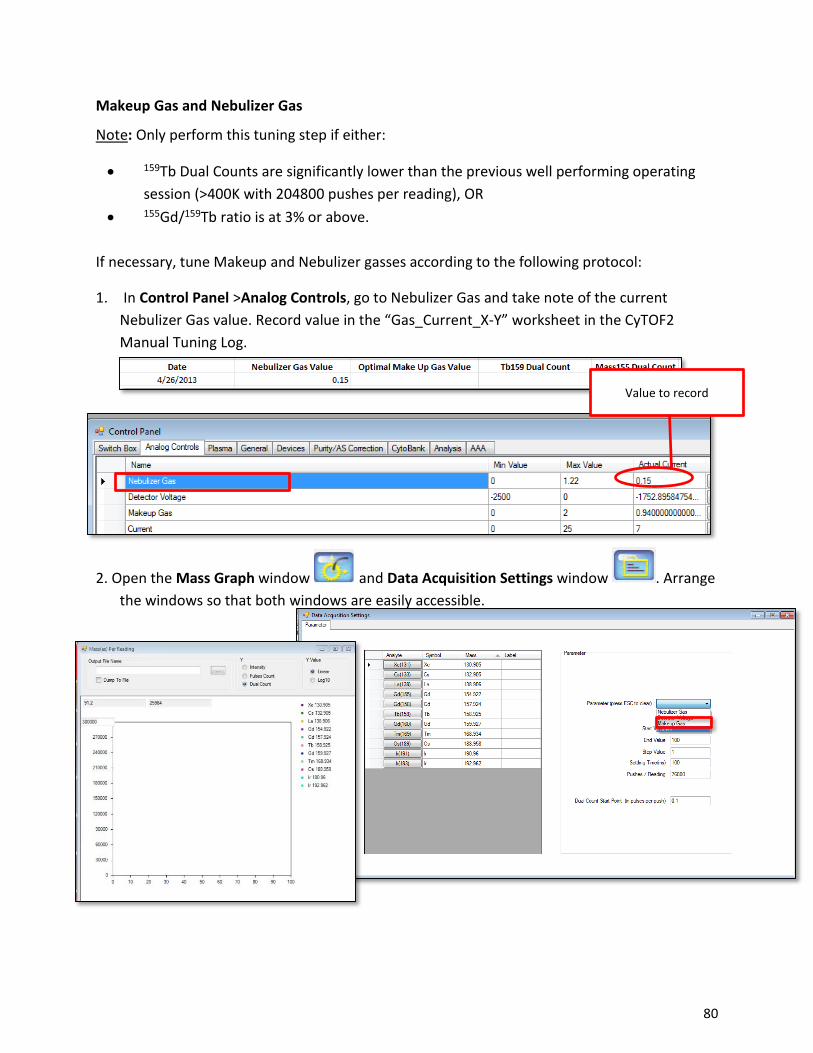
Makeup Gas and Nebulizer Gas
Note: Only perform this tuning step if either:
• 159Tb Dual Counts are significantly lower than the previous well performing operatingsession (>400K with 204800 pushes per reading), OR
• 155Gd/159Tb ratio is at 3% or above.
If necessary, tune Makeup and Nebulizer gasses according to the following protocol:
1. In Control Panel >Analog Controls, go to Nebulizer Gas and take note of the currentNebulizer Gas value. Record value in the “Gas_Current_X-Y” worksheet in the CyTOF2Manual Tuning Log.
2. Open the Mass Graph window and Data Acquisition Settings window . Arrange the windows so that both windows are easily accessible.
Value to record
81
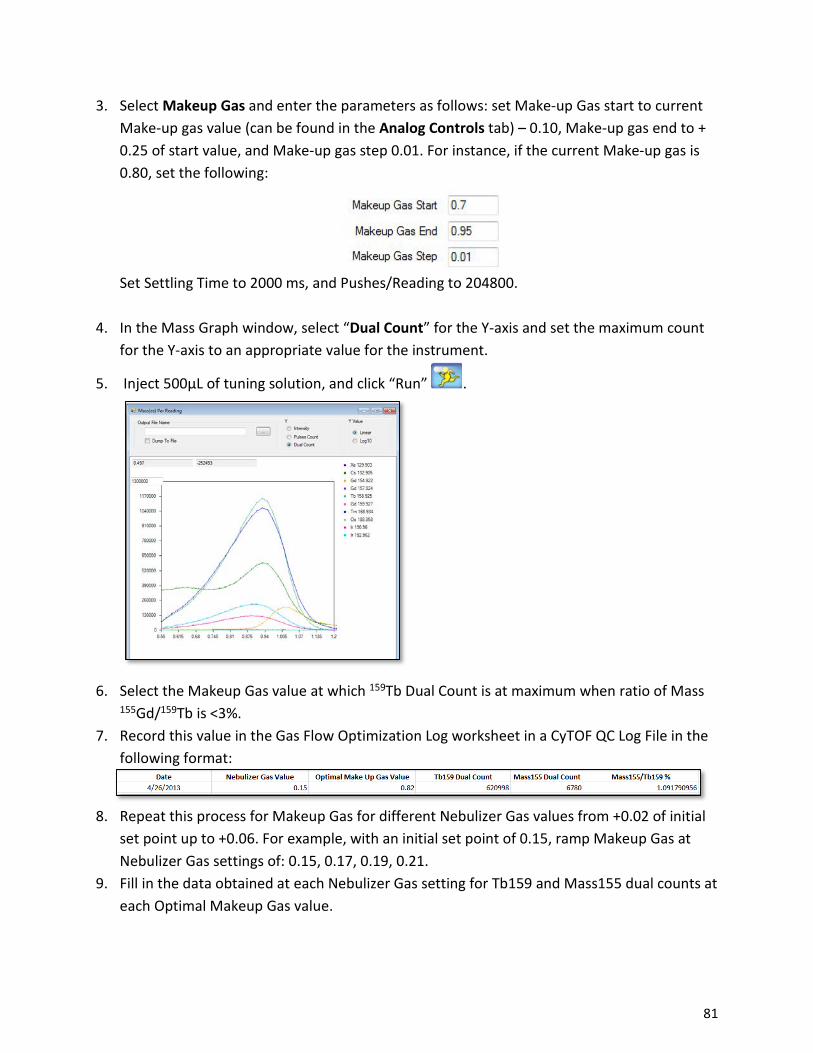
3. Select Makeup Gas and enter the parameters as follows: set Make-up Gas start to currentMake-up gas value (can be found in the Analog Controls tab) – 0.10, Make-up gas end to +0.25 of start value, and Make-up gas step 0.01. For instance, if the current Make-up gas is0.80, set the following:
Set Settling Time to 2000 ms, and Pushes/Reading to 204800.
4. In the Mass Graph window, select “Dual Count” for the Y-axis and set the maximum countfor the Y-axis to an appropriate value for the instrument.
5. Inject 500µL of tuning solution, and click “Run” .
6. Select the Makeup Gas value at which 159Tb Dual Count is at maximum when ratio of Mass155Gd/159Tb is <3%.
7. Record this value in the Gas Flow Optimization Log worksheet in a CyTOF QC Log File in thefollowing format:
8. Repeat this process for Makeup Gas for different Nebulizer Gas values from +0.02 of initialset point up to +0.06. For example, with an initial set point of 0.15, ramp Makeup Gas atNebulizer Gas settings of: 0.15, 0.17, 0.19, 0.21.
9. Fill in the data obtained at each Nebulizer Gas setting for Tb159 and Mass155 dual counts ateach Optimal Makeup Gas value.
82
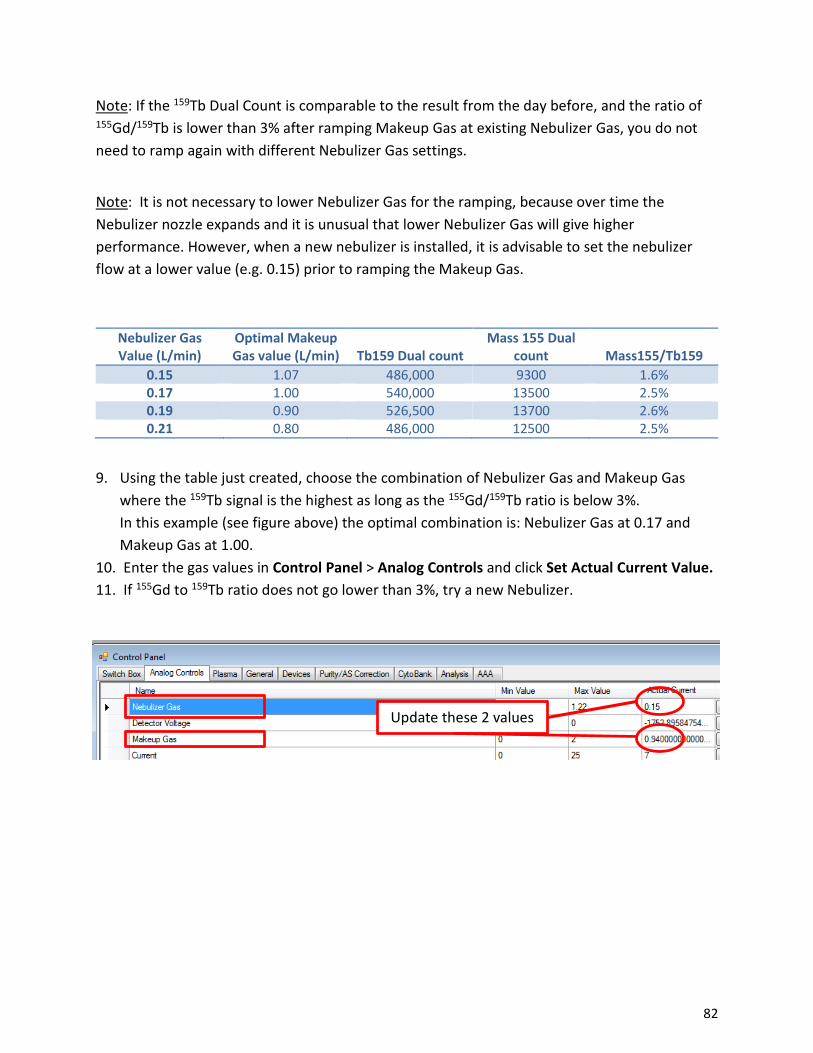
Note: If the 159Tb Dual Count is comparable to the result from the day before, and the ratio of 155Gd/159Tb is lower than 3% after ramping Makeup Gas at existing Nebulizer Gas, you do not need to ramp again with different Nebulizer Gas settings.
Note: It is not necessary to lower Nebulizer Gas for the ramping, because over time the Nebulizer nozzle expands and it is unusual that lower Nebulizer Gas will give higher performance. However, when a new nebulizer is installed, it is advisable to set the nebulizer flow at a lower value (e.g. 0.15) prior to ramping the Makeup Gas.
9. Using the table just created, choose the combination of Nebulizer Gas and Makeup Gaswhere the 159Tb signal is the highest as long as the 155Gd/159Tb ratio is below 3%.In this example (see figure above) the optimal combination is: Nebulizer Gas at 0.17 andMakeup Gas at 1.00.
10. Enter the gas values in Control Panel > Analog Controls and click Set Actual Current Value.11. If 155Gd to 159Tb ratio does not go lower than 3%, try a new Nebulizer.
Nebulizer Gas Value (L/min)
Optimal Makeup Gas value (L/min) Tb159 Dual count
Mass 155 Dual count Mass155/Tb159
0.15 1.07 486,000 9300 1.6% 0.17 1.00 540,000 13500 2.5% 0.19 0.90 526,500 13700 2.6% 0.21 0.80 486,000 12500 2.5%
Update these 2 values
83
Current Optimization
Note: Only perform this tuning step if the159Tb Dual Counts are significantly lower than the previous well-performing operating session (>400K with 204800 pushes per reading).
If necessary, tune Current according to the following protocol:
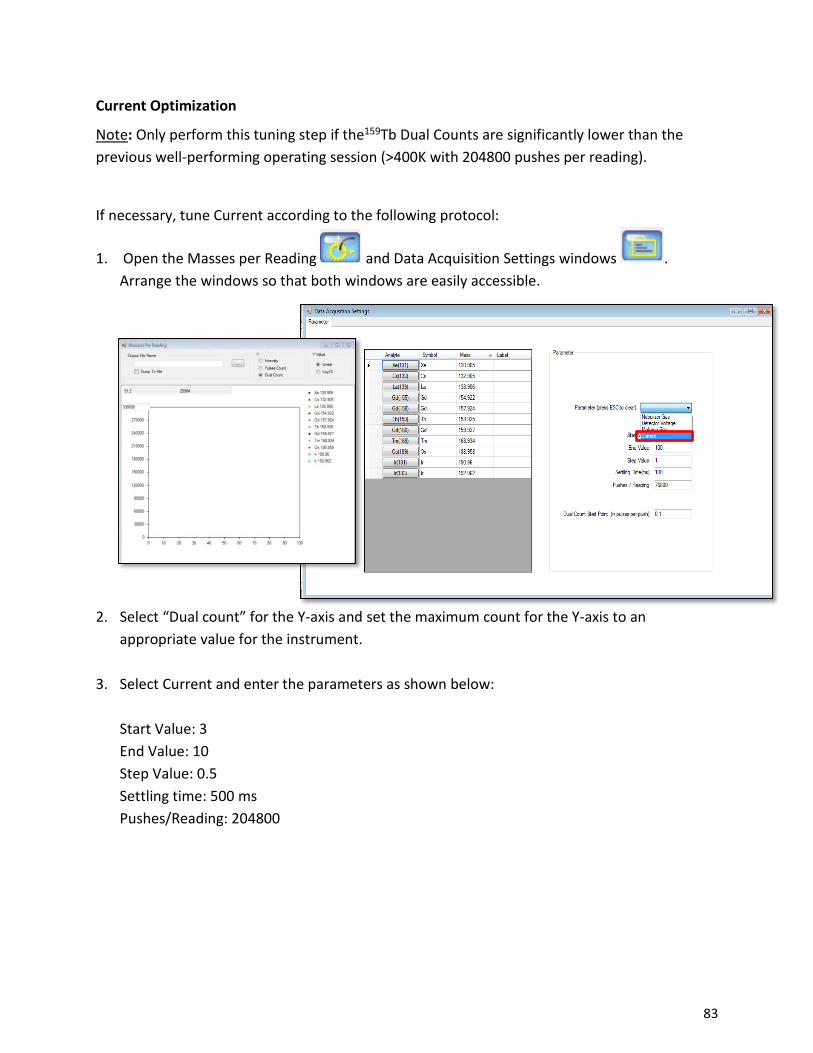
1. Open the Masses per Reading and Data Acquisition Settings windows . Arrange the windows so that both windows are easily accessible.
2. Select “Dual count” for the Y-axis and set the maximum count for the Y-axis to anappropriate value for the instrument.
3. Select Current and enter the parameters as shown below:
Start Value: 3 End Value: 10 Step Value: 0.5 Settling time: 500 ms Pushes/Reading: 204800
84
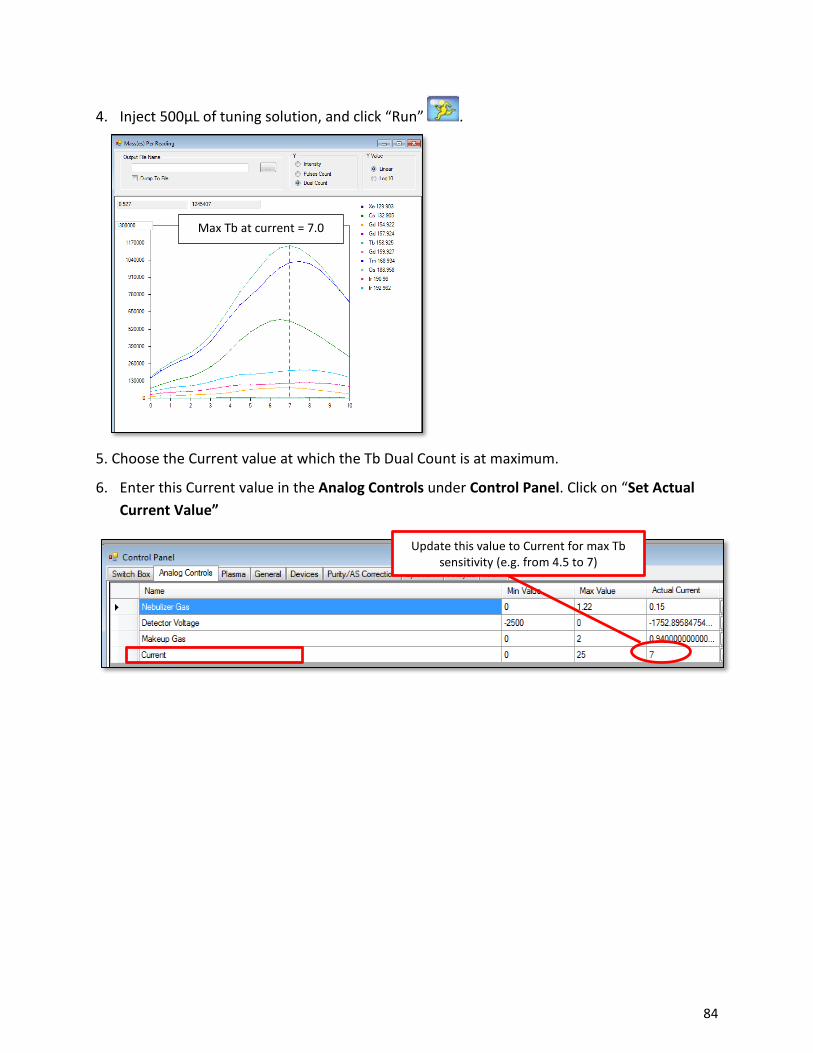
4. Inject 500µL of tuning solution, and click “Run” .
5. Choose the Current value at which the Tb Dual Count is at maximum.
6. Enter this Current value in the Analog Controls under Control Panel. Click on “Set ActualCurrent Value”
Max Tb at current = 7.0
Update this value to Current for max Tb sensitivity (e.g. from 4.5 to 7)
85
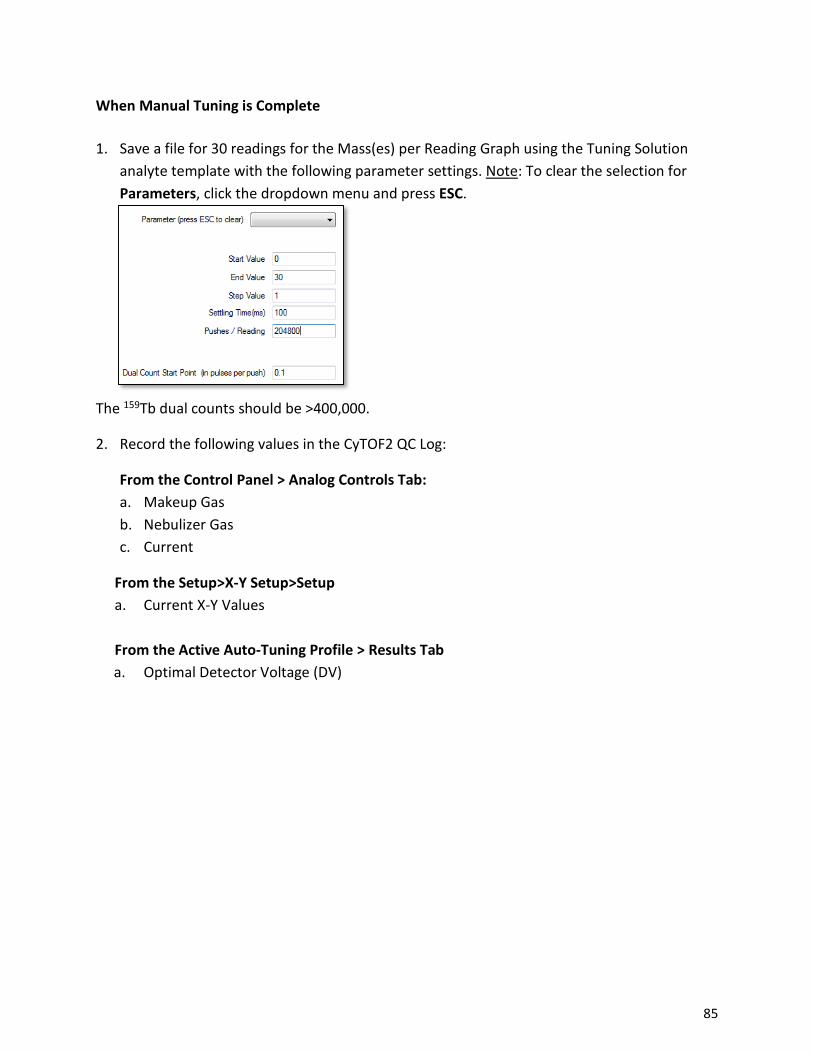
When Manual Tuning is Complete
1. Save a file for 30 readings for the Mass(es) per Reading Graph using the Tuning Solutionanalyte template with the following parameter settings. Note: To clear the selection forParameters, click the dropdown menu and press ESC.
The 159Tb dual counts should be >400,000.
2. Record the following values in the CyTOF2 QC Log:
From the Control Panel > Analog Controls Tab:a. Makeup Gasb. Nebulizer Gasc. Current
From the Setup>X-Y Setup>Setup a. Current X-Y Values
From the Active Auto-Tuning Profile > Results Tab a. Optimal Detector Voltage (DV)
86
Bead Sensitivity Test
Note: EQ™ Four Element Calibration Beads (Cat#201078) or CyTOF Calibration Beads (Cat#201073) may be used for the bead sensitivity test.
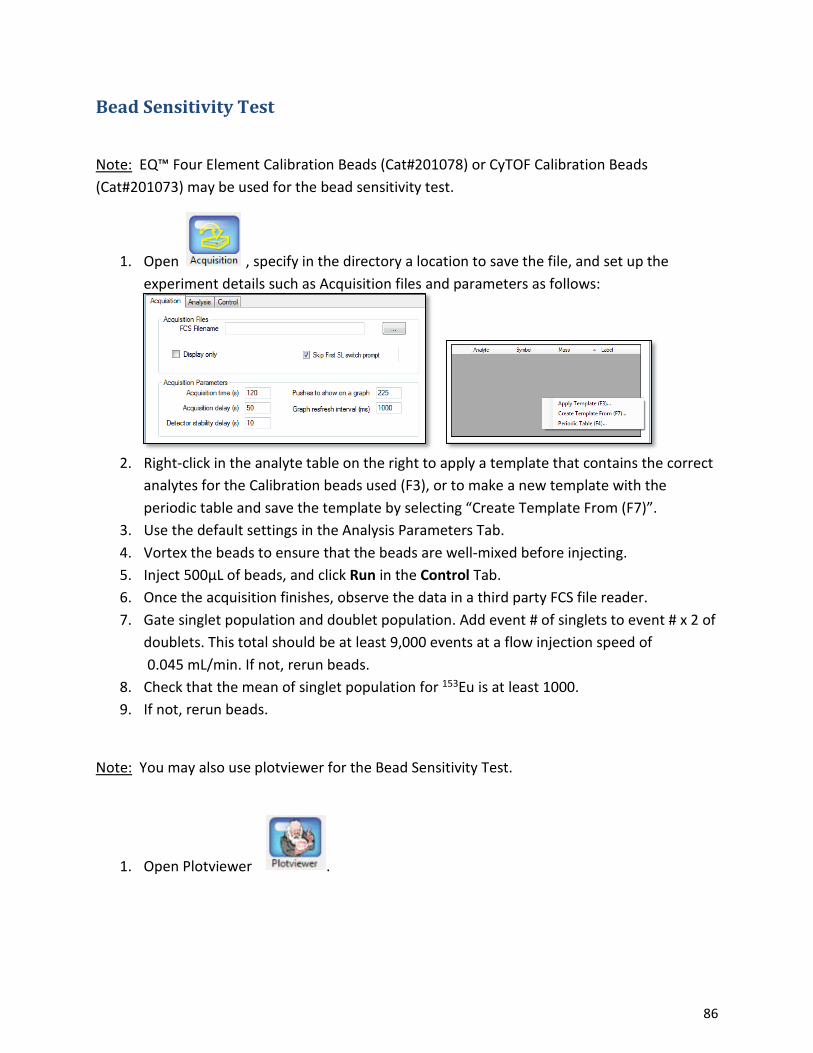
1. Open , specify in the directory a location to save the file, and set up the experiment details such as Acquisition files and parameters as follows:
2. Right-click in the analyte table on the right to apply a template that contains the correctanalytes for the Calibration beads used (F3), or to make a new template with theperiodic table and save the template by selecting “Create Template From (F7)”.
3. Use the default settings in the Analysis Parameters Tab.4. Vortex the beads to ensure that the beads are well-mixed before injecting.5. Inject 500µL of beads, and click Run in the Control Tab.6. Once the acquisition finishes, observe the data in a third party FCS file reader.7. Gate singlet population and doublet population. Add event # of singlets to event # x 2 of
doublets. This total should be at least 9,000 events at a flow injection speed of0.045 mL/min. If not, rerun beads.
8. Check that the mean of singlet population for 153Eu is at least 1000.9. If not, rerun beads.
Note: You may also use plotviewer for the Bead Sensitivity Test.
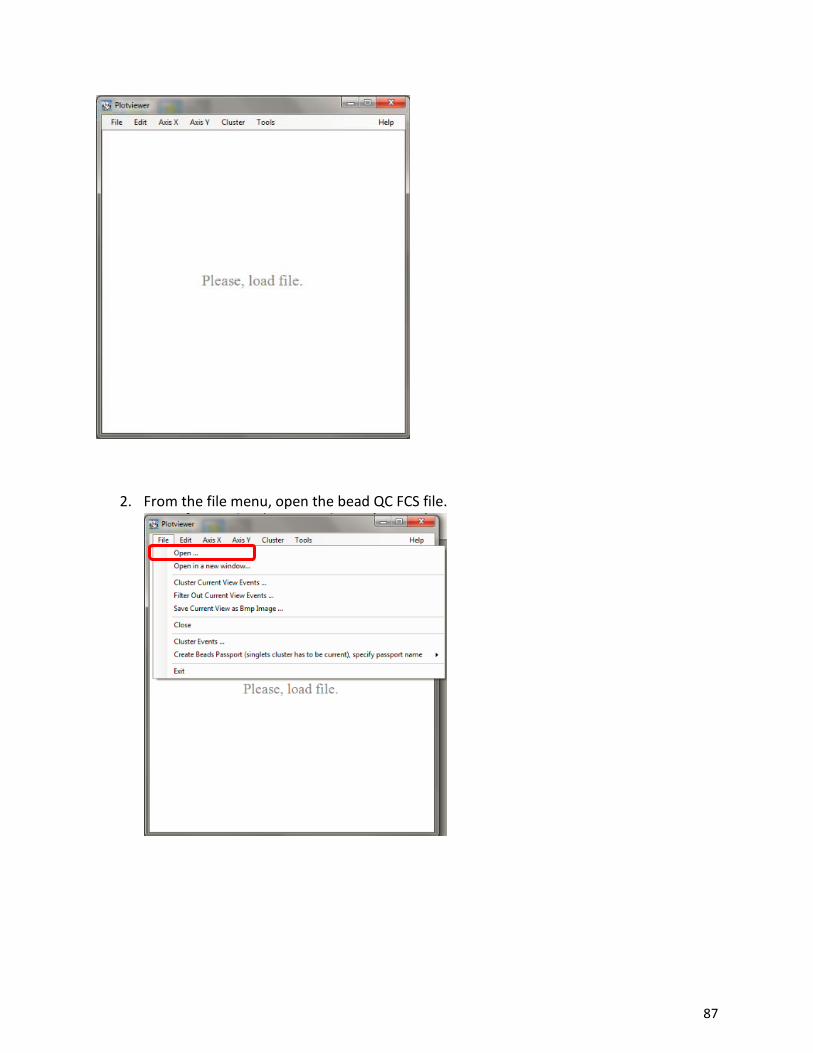
1. Open Plotviewer .
87
2. From the file menu, open the bead QC FCS file.
88
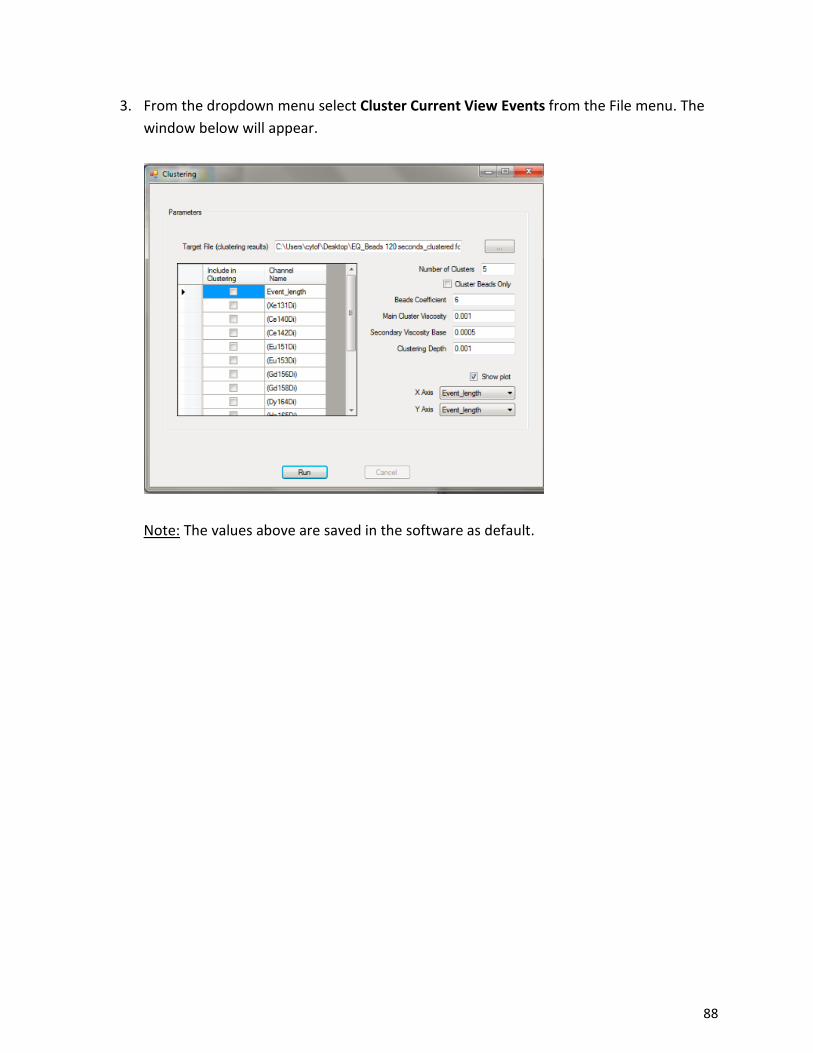
3. From the dropdown menu select Cluster Current View Events from the File menu. Thewindow below will appear.
Note: The values above are saved in the software as default.
89
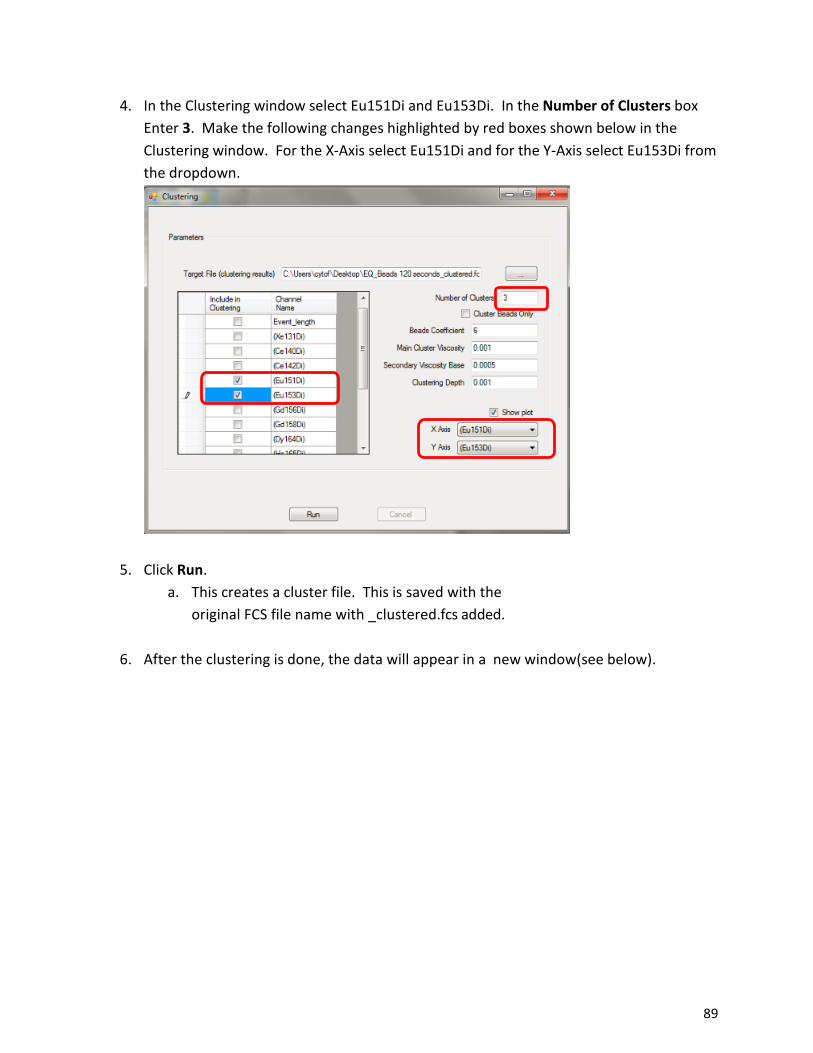
4. In the Clustering window select Eu151Di and Eu153Di. In the Number of Clusters boxEnter 3. Make the following changes highlighted by red boxes shown below in theClustering window. For the X-Axis select Eu151Di and for the Y-Axis select Eu153Di fromthe dropdown.
5. Click Run.a. This creates a cluster file. This is saved with the
original FCS file name with _clustered.fcs added.
6. After the clustering is done, the data will appear in a new window(see below).
90
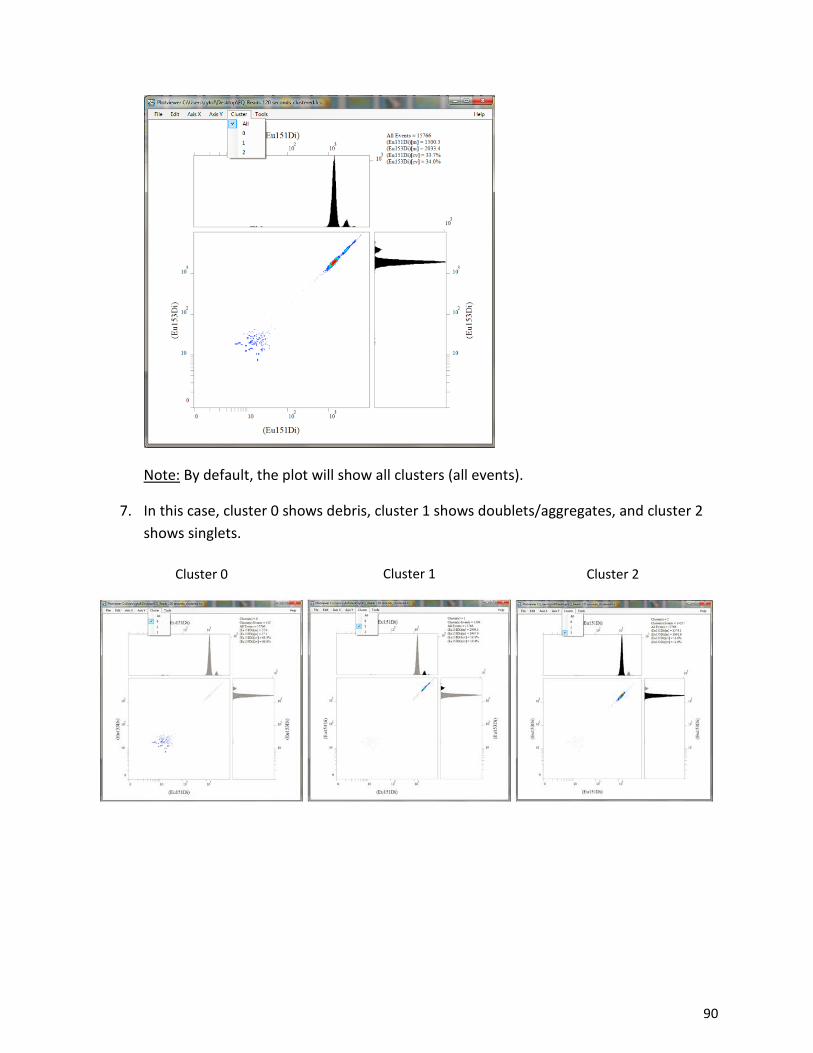
Note: By default, the plot will show all clusters (all events).
7. In this case, cluster 0 shows debris, cluster 1 shows doublets/aggregates, and cluster 2shows singlets.
Cluster 0 Cluster 1 Cluster 2
91
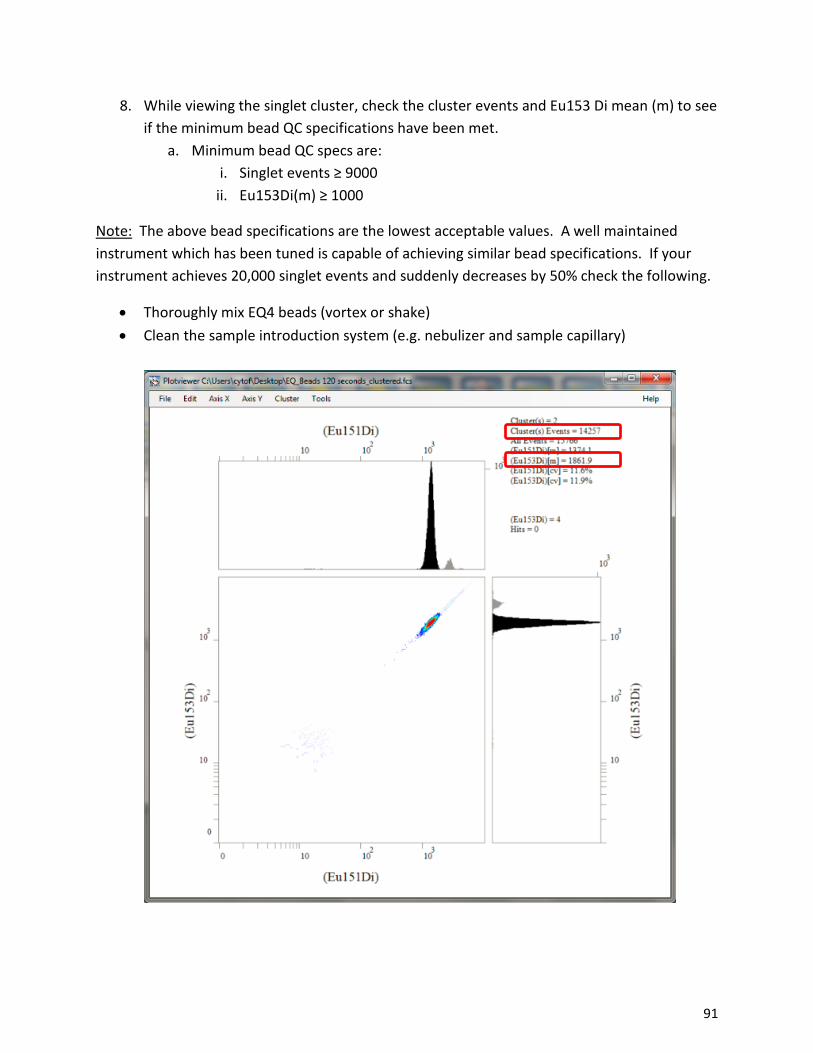
8. While viewing the singlet cluster, check the cluster events and Eu153 Di mean (m) to seeif the minimum bead QC specifications have been met.
a. Minimum bead QC specs are:i. Singlet events ≥ 9000
ii. Eu153Di(m) ≥ 1000
Note: The above bead specifications are the lowest acceptable values. A well maintained instrument which has been tuned is capable of achieving similar bead specifications. If your instrument achieves 20,000 singlet events and suddenly decreases by 50% check the following.
• Thoroughly mix EQ4 beads (vortex or shake)• Clean the sample introduction system (e.g. nebulizer and sample capillary)
92
Daily Cleaning
Cleaning after Running Tuning Solution
1. Inject 1mL of Washing Solution and click to switch the loop.
2. Wait 2-5 minutes to allow Washing Solution to run through.
3. Repeat steps 1-2 to clean the other loop.
4. Inject 1mL of DIW and click to switch the loop.
5. Wait 2-5 minutes to allow DIW to run through.
6. Repeat steps 4-5 to clean the other loop
7. Check the status by clicking “Preview” in the Control tab. This will display 10 snapshots ofany ion signal traces that are detected.
8. Repeat for the other loop.
Cleaning after Running Beads
1. Inject 1mL of DIW and click to switch the loop.
2. Wait 2-5 minutes to allow DIW to run through
3. Click “Re-Preview” to check for residual beads.
4. Repeat steps 1 -3 to clean the other loop.
5. If the beads are persistent in the loops, inject 500uL of Washing Solution and click to switch the loop.
6. Wait 2-5 minutes to allow Washing Solution to run through
7. Repeat steps 5-6 to clean the other loop
8. Flush the Washing Solution out by injecting 1mL of DIW and clicking to switch the loop.
9. Repeat to flush the other loop
10. Wait 2 minutes to allow DIW to run through.
11. Click “Preview” to check status for both of the loops before proceeding.
93
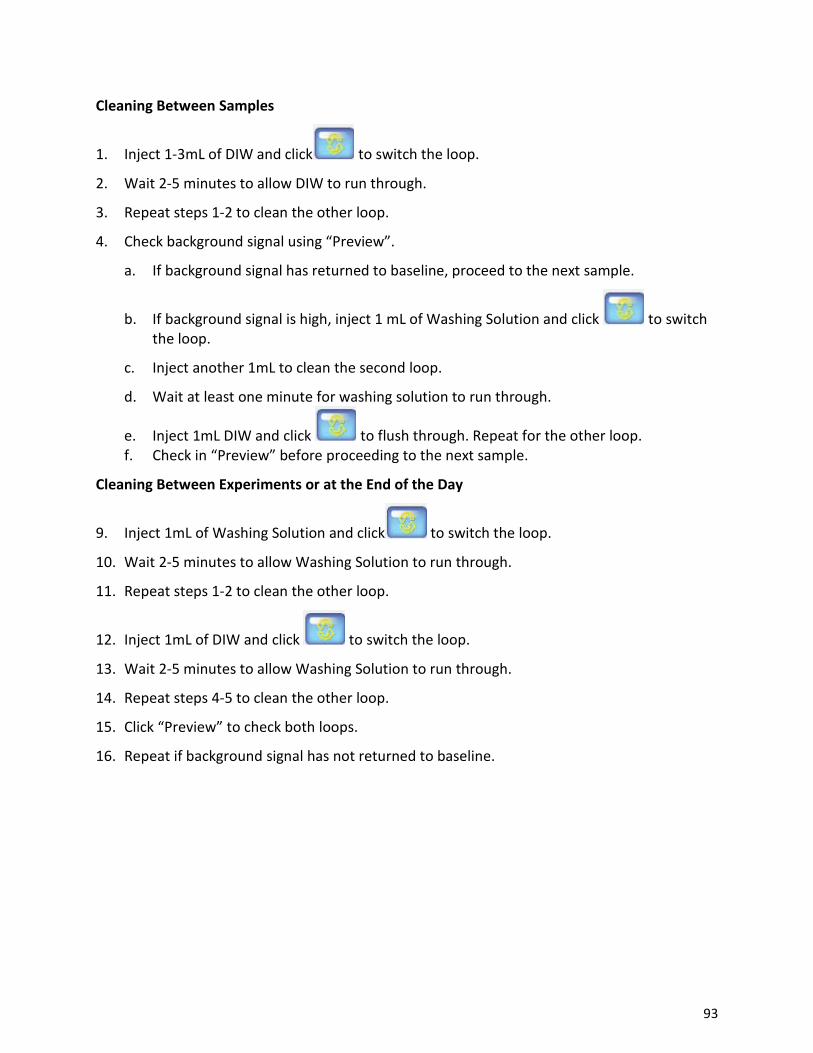
Cleaning Between Samples
1. Inject 1-3mL of DIW and click to switch the loop.
2. Wait 2-5 minutes to allow DIW to run through.
3. Repeat steps 1-2 to clean the other loop.
4. Check background signal using “Preview”.
a. If background signal has returned to baseline, proceed to the next sample.
b. If background signal is high, inject 1 mL of Washing Solution and click to switch the loop.
c. Inject another 1mL to clean the second loop.
d. Wait at least one minute for washing solution to run through.
e. Inject 1mL DIW and click to flush through. Repeat for the other loop. f. Check in “Preview” before proceeding to the next sample.
Cleaning Between Experiments or at the End of the Day
9. Inject 1mL of Washing Solution and click to switch the loop.
10. Wait 2-5 minutes to allow Washing Solution to run through.
11. Repeat steps 1-2 to clean the other loop.
12. Inject 1mL of DIW and click to switch the loop.
13. Wait 2-5 minutes to allow Washing Solution to run through.
14. Repeat steps 4-5 to clean the other loop.
15. Click “Preview” to check both loops.
16. Repeat if background signal has not returned to baseline.
94
Sample Acquisition
Sample Preparation
Please refer to Fluidigm protocols for sample preparation.
Before Acquisition
It is strongly recommended that users add diluted CyTOF EQ Beads to samples as an internal standard:
1. Vigorously shake or vortex the bottle with EQ Beads. Then dilute the EQ Beads 1/10 inDIW.
2. Add the diluted EQ Beads directly into the vial with the pelleted sample, and mix well.This will be the sample for acquisition.
3. The resulting files can be normalized with the Normalizer Tool in the CyTOF Software.Please see Bead Normalization Tool section for instructions.
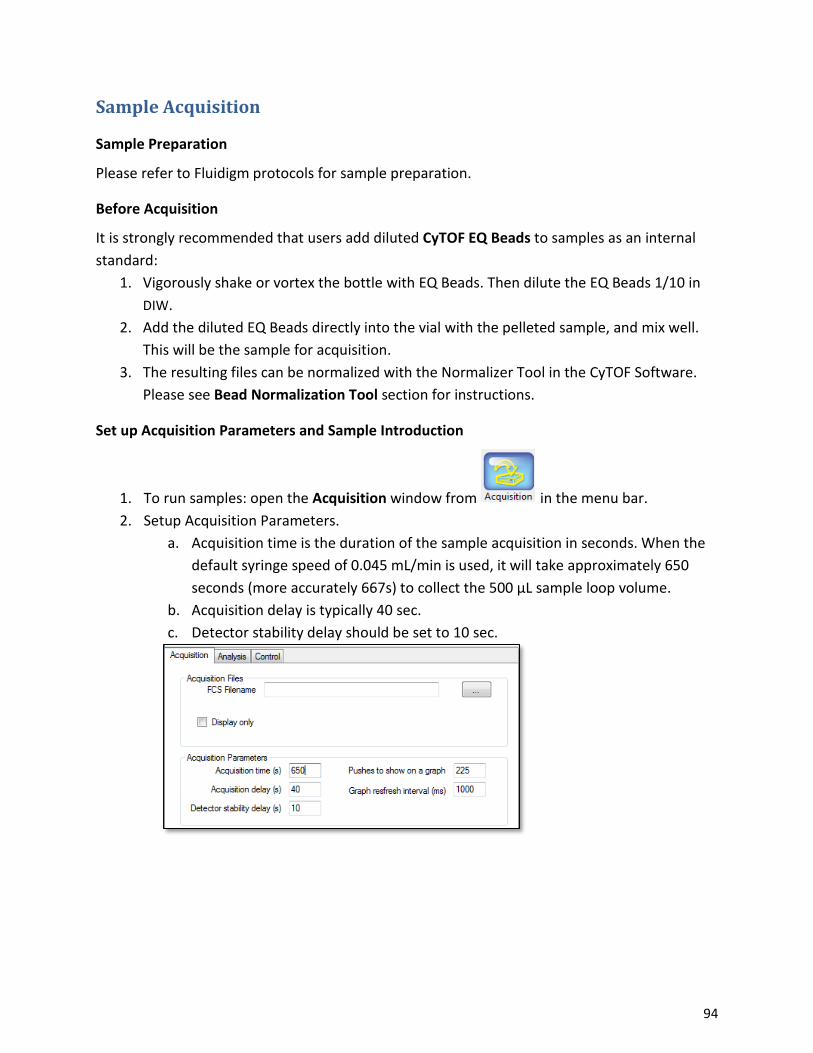
Set up Acquisition Parameters and Sample Introduction
1. To run samples: open the Acquisition window from in the menu bar. 2. Setup Acquisition Parameters.
a. Acquisition time is the duration of the sample acquisition in seconds. When thedefault syringe speed of 0.045 mL/min is used, it will take approximately 650seconds (more accurately 667s) to collect the 500 µL sample loop volume.
b. Acquisition delay is typically 40 sec.c. Detector stability delay should be set to 10 sec.
95
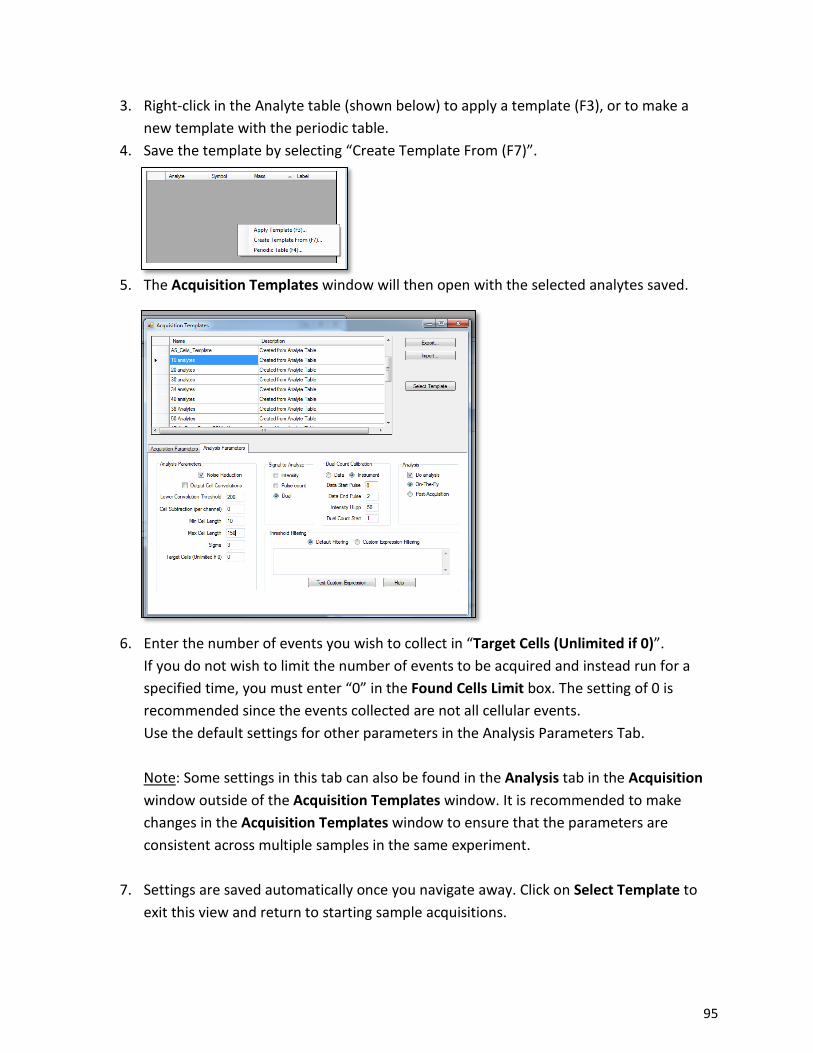
3. Right-click in the Analyte table (shown below) to apply a template (F3), or to make anew template with the periodic table.
4. Save the template by selecting “Create Template From (F7)”.
5. The Acquisition Templates window will then open with the selected analytes saved.
6. Enter the number of events you wish to collect in “Target Cells (Unlimited if 0)”.If you do not wish to limit the number of events to be acquired and instead run for aspecified time, you must enter “0” in the Found Cells Limit box. The setting of 0 isrecommended since the events collected are not all cellular events.Use the default settings for other parameters in the Analysis Parameters Tab.
Note: Some settings in this tab can also be found in the Analysis tab in the Acquisition window outside of the Acquisition Templates window. It is recommended to make changes in the Acquisition Templates window to ensure that the parameters are consistent across multiple samples in the same experiment.
7. Settings are saved automatically once you navigate away. Click on Select Template toexit this view and return to starting sample acquisitions.
96
8. Specify a pathway and filename to save an FCS file.9. Inject 500 µl of your filtered sample into the injection port and click “Run” in the Control
tab.10. Once the acquisition finishes, observe the data in Plotviewer, if desired.
Increased Sampling Efficiency
The CyTOF 2 Dual-Loop fluidics system is composed of a vertical sample loop (Loop 1) and a horizontal sample loop (Loop 2). Loop 2 consistently underperforms compared to Loop 1 due to its horizontal orientation which allows for quicker sedimentation in the loop. For increased sampling efficiency, it is recommended that only Loop 1 be used and the loop should be underfilled with 400-450 µL of sample.
Refer to Technical Note PN 101-1714 A1 “Impact of Fluidics on Mass Cytometry Sampling Efficiency” for more information.
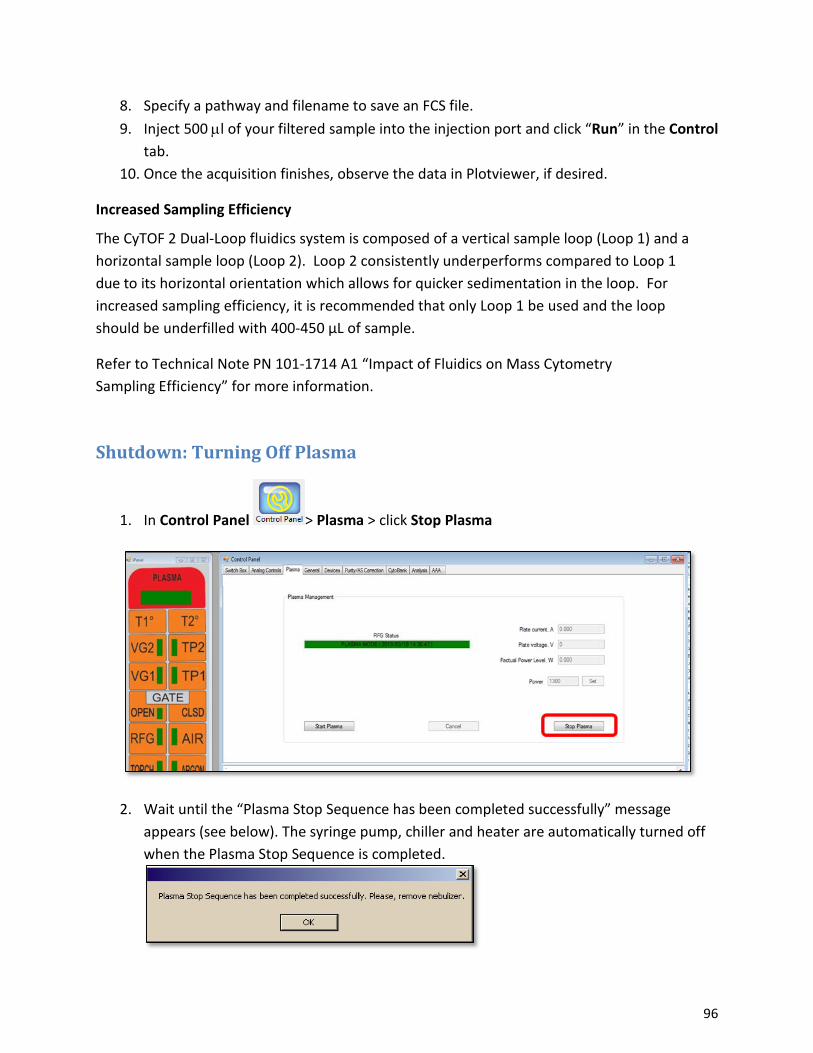
Shutdown: Turning Off Plasma
1. In Control Panel > Plasma > click Stop Plasma
2. Wait until the “Plasma Stop Sequence has been completed successfully” messageappears (see below). The syringe pump, chiller and heater are automatically turned offwhen the Plasma Stop Sequence is completed.
97
3. Remove the sample capillary from the nebulizer. Then remove the nebulizer from thenebulizer port.
4. Disconnect the nebulizer from the gas line.5. Using the Nebulizer Cleaning Kit, slowly draw 10% Contrad or Decon 90 through the side
arm and sample inlet of the nebulizer and soak for 15 min.6. Rinse the nebulizer 2 to 3 times with DIW (18.2 mΩ) using the same kit.7. Leave the nebulizer submerged in a DIW (18.2 mΩ) bath prior to next use.
See Chapter 6: Maintenance, Cleaning the Nebulizer After Plasma Shutdown, for detailed cleaning protocol.
Other Features
User Management
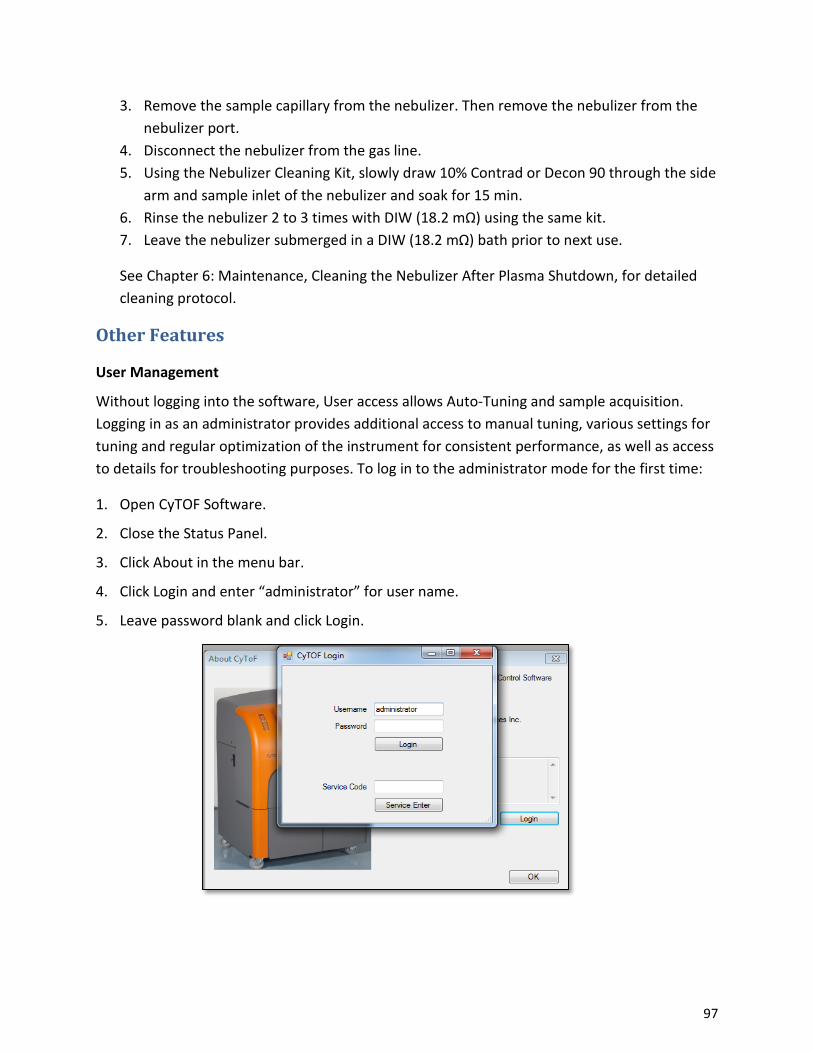
Without logging into the software, User access allows Auto-Tuning and sample acquisition. Logging in as an administrator provides additional access to manual tuning, various settings for tuning and regular optimization of the instrument for consistent performance, as well as access to details for troubleshooting purposes. To log in to the administrator mode for the first time:
1. Open CyTOF Software.
2. Close the Status Panel.
3. Click About in the menu bar.
4. Click Login and enter “administrator” for user name.
5. Leave password blank and click Login.
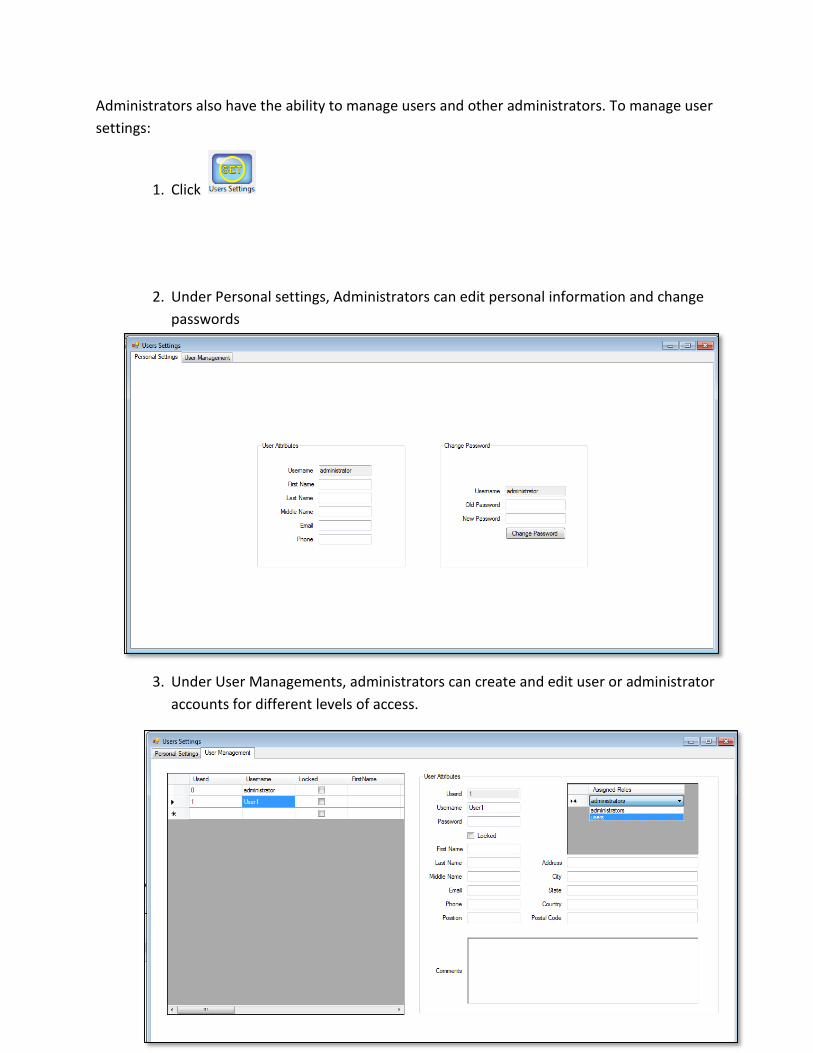
98
Administrators also have the ability to manage users and other administrators. To manage user settings:
1. Click
2. Under Personal settings, Administrators can edit personal information and changepasswords
3. Under User Managements, administrators can create and edit user or administratoraccounts for different levels of access.
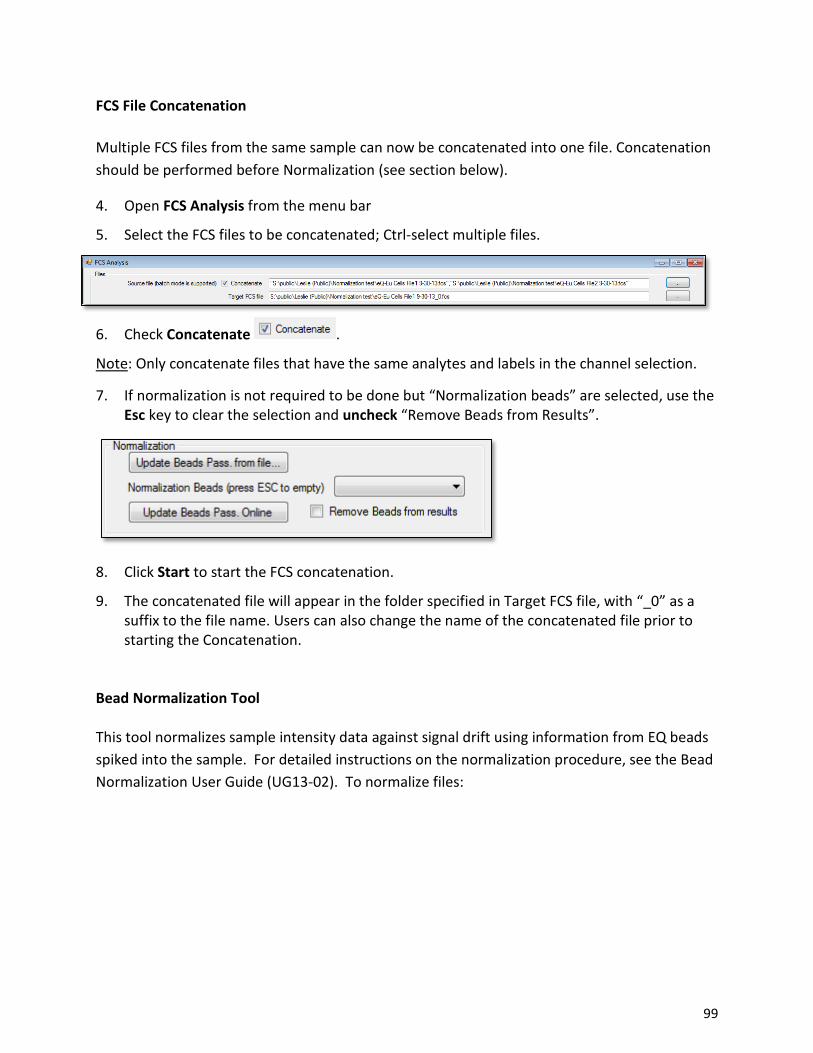
99
FCS File Concatenation
Multiple FCS files from the same sample can now be concatenated into one file. Concatenation should be performed before Normalization (see section below).
4. Open FCS Analysis from the menu bar
5. Select the FCS files to be concatenated; Ctrl-select multiple files.
6. Check Concatenate .
Note: Only concatenate files that have the same analytes and labels in the channel selection.
7. If normalization is not required to be done but “Normalization beads” are selected, use theEsc key to clear the selection and uncheck “Remove Beads from Results”.
8. Click Start to start the FCS concatenation.
9. The concatenated file will appear in the folder specified in Target FCS file, with “_0” as asuffix to the file name. Users can also change the name of the concatenated file prior tostarting the Concatenation.
Bead Normalization Tool
This tool normalizes sample intensity data against signal drift using information from EQ beads spiked into the sample. For detailed instructions on the normalization procedure, see the Bead Normalization User Guide (UG13-02). To normalize files:
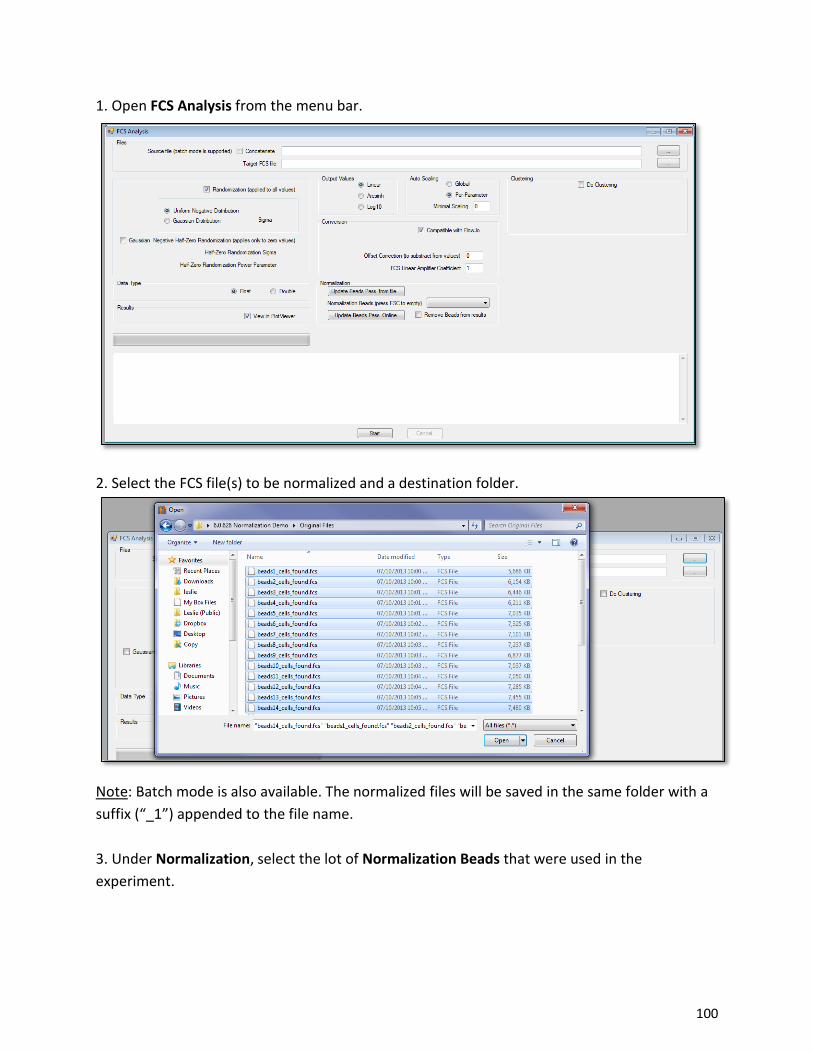
100
1. Open FCS Analysis from the menu bar.
2. Select the FCS file(s) to be normalized and a destination folder.
Note: Batch mode is also available. The normalized files will be saved in the same folder with a suffix (“_1”) appended to the file name.
3. Under Normalization, select the lot of Normalization Beads that were used in theexperiment.
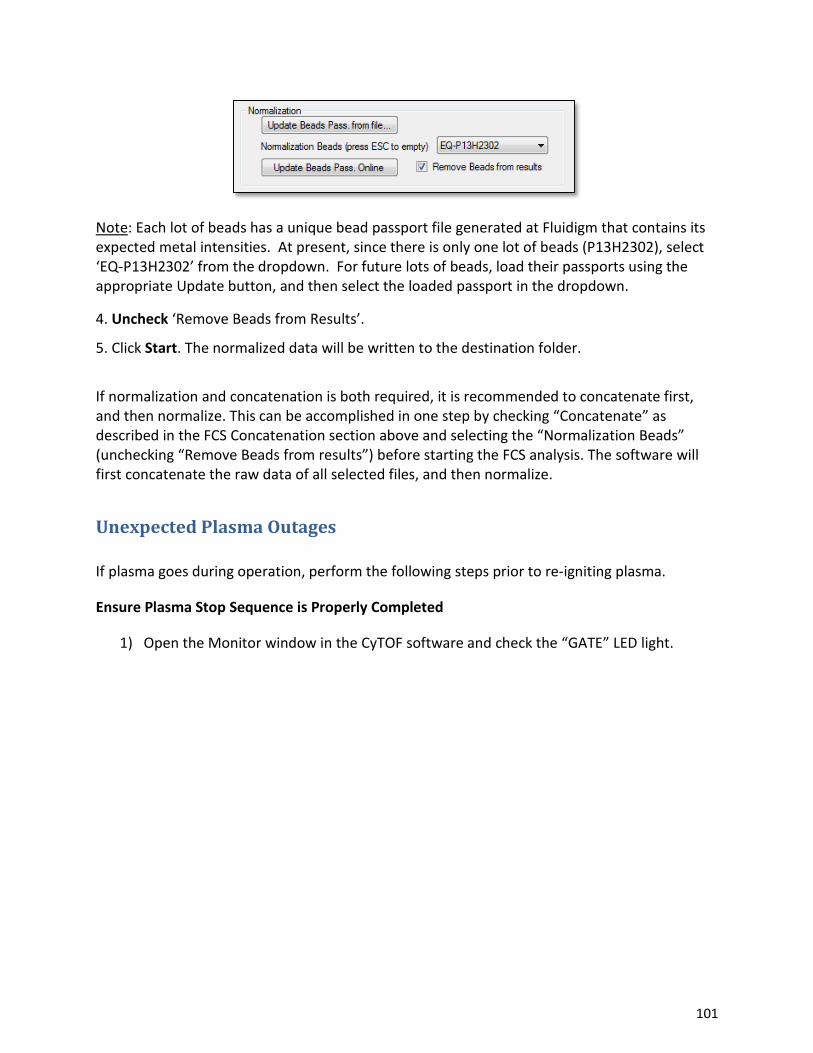
101
Note: Each lot of beads has a unique bead passport file generated at Fluidigm that contains its expected metal intensities. At present, since there is only one lot of beads (P13H2302), select ‘EQ-P13H2302’ from the dropdown. For future lots of beads, load their passports using the appropriate Update button, and then select the loaded passport in the dropdown.
4. Uncheck ‘Remove Beads from Results’.
5. Click Start. The normalized data will be written to the destination folder.
If normalization and concatenation is both required, it is recommended to concatenate first, and then normalize. This can be accomplished in one step by checking “Concatenate” as described in the FCS Concatenation section above and selecting the “Normalization Beads” (unchecking “Remove Beads from results”) before starting the FCS analysis. The software will first concatenate the raw data of all selected files, and then normalize.
Unexpected Plasma Outages
If plasma goes during operation, perform the following steps prior to re-igniting plasma.
Ensure Plasma Stop Sequence is Properly Completed
1) Open the Monitor window in the CyTOF software and check the “GATE” LED light.
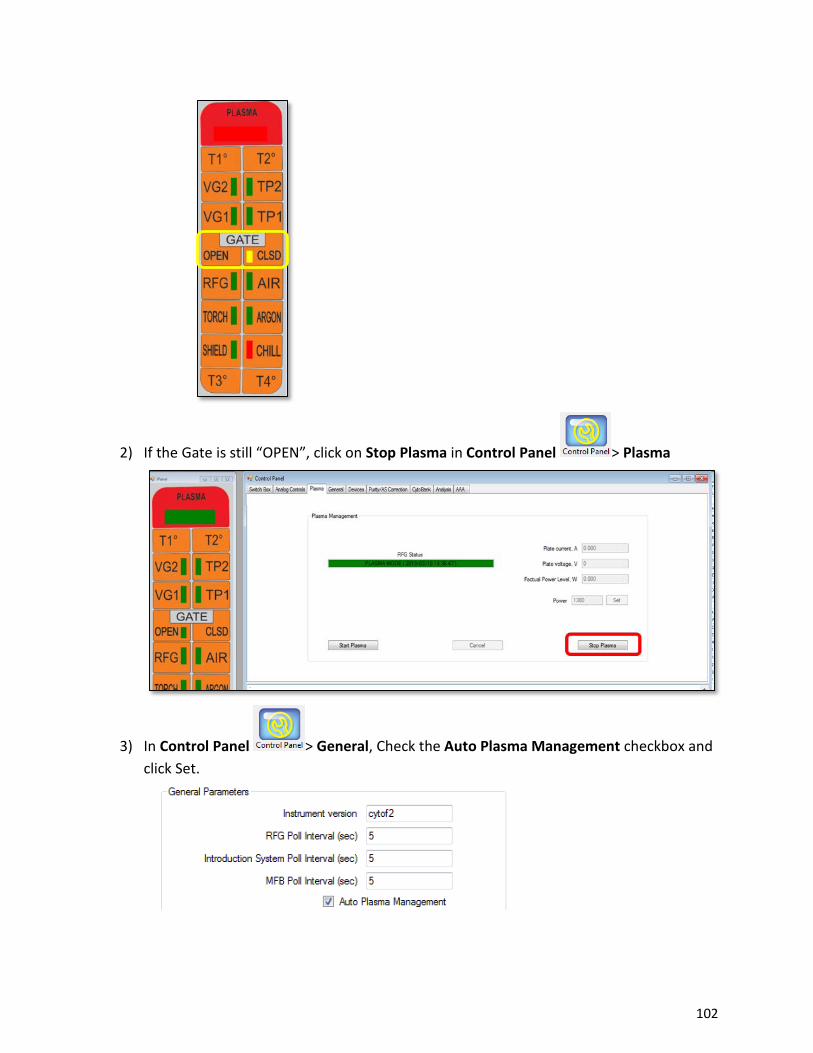
102
2) If the Gate is still “OPEN”, click on Stop Plasma in Control Panel > Plasma
3) In Control Panel > General, Check the Auto Plasma Management checkbox and click Set.
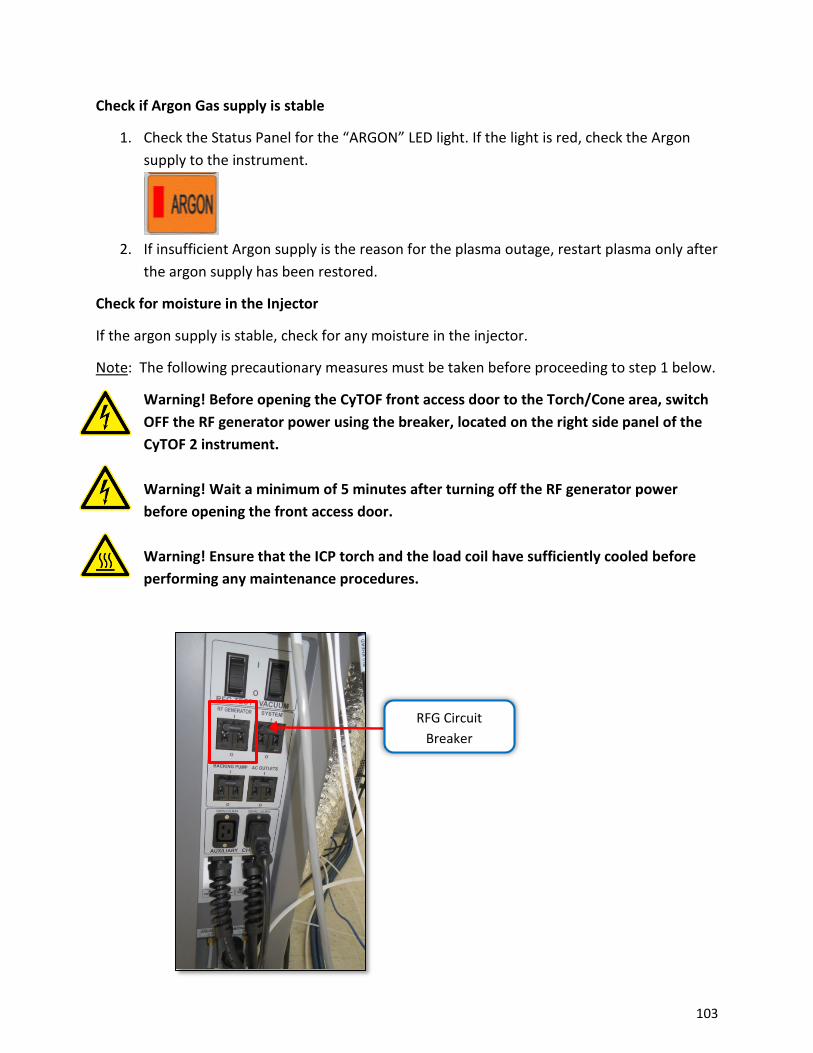
103
Check if Argon Gas supply is stable
1. Check the Status Panel for the “ARGON” LED light. If the light is red, check the Argonsupply to the instrument.
2. If insufficient Argon supply is the reason for the plasma outage, restart plasma only afterthe argon supply has been restored.
Check for moisture in the Injector
If the argon supply is stable, check for any moisture in the injector.
Note: The following precautionary measures must be taken before proceeding to step 1 below.
Warning! Before opening the CyTOF front access door to the Torch/Cone area, switch OFF the RF generator power using the breaker, located on the right side panel of the CyTOF 2 instrument.
Warning! Wait a minimum of 5 minutes after turning off the RF generator power before opening the front access door.
Warning! Ensure that the ICP torch and the load coil have sufficiently cooled before performing any maintenance procedures.
RFG Circuit Breaker
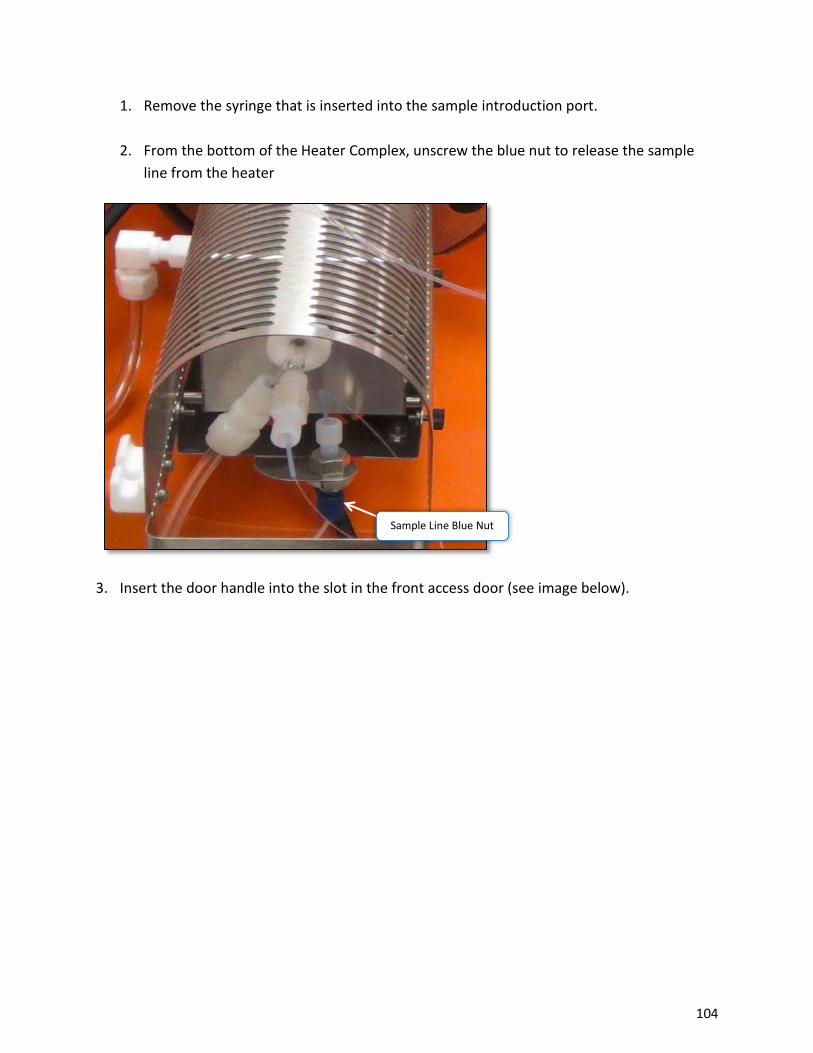
104
1. Remove the syringe that is inserted into the sample introduction port.
2. From the bottom of the Heater Complex, unscrew the blue nut to release the sampleline from the heater
3. Insert the door handle into the slot in the front access door (see image below).
Sample Line Blue Nut
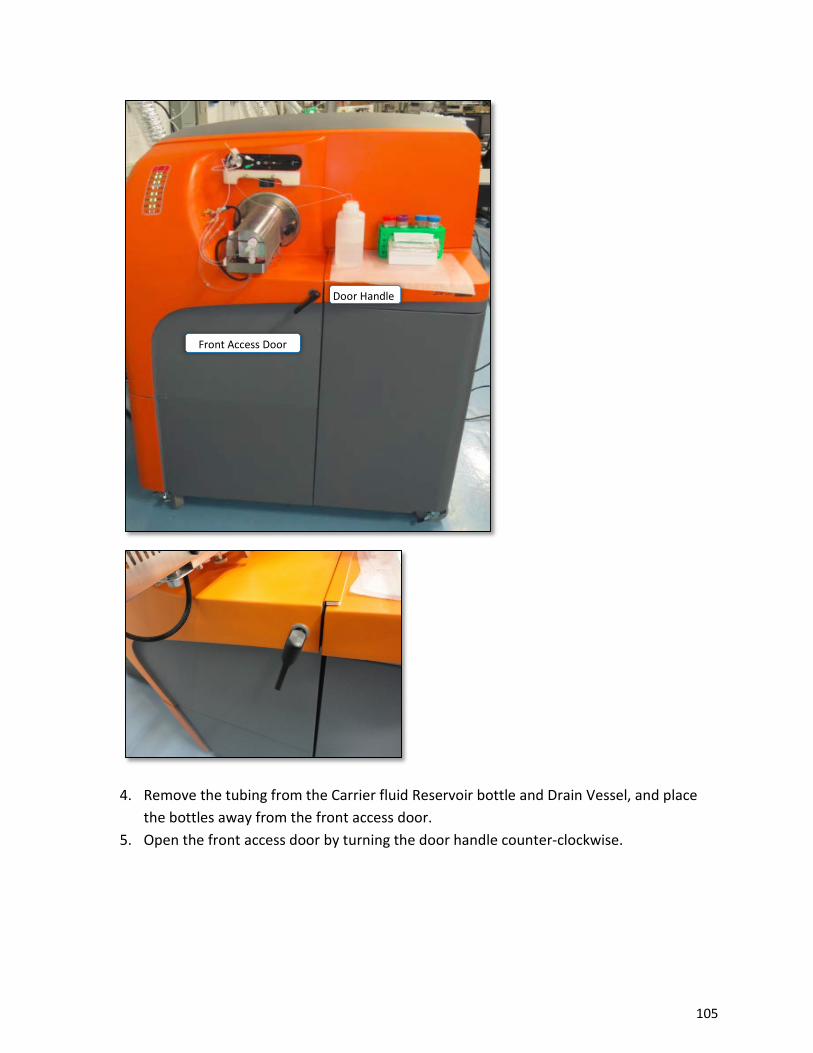
105
4. Remove the tubing from the Carrier fluid Reservoir bottle and Drain Vessel, and placethe bottles away from the front access door.
5. Open the front access door by turning the door handle counter-clockwise.
Door Handle
Front Access Door
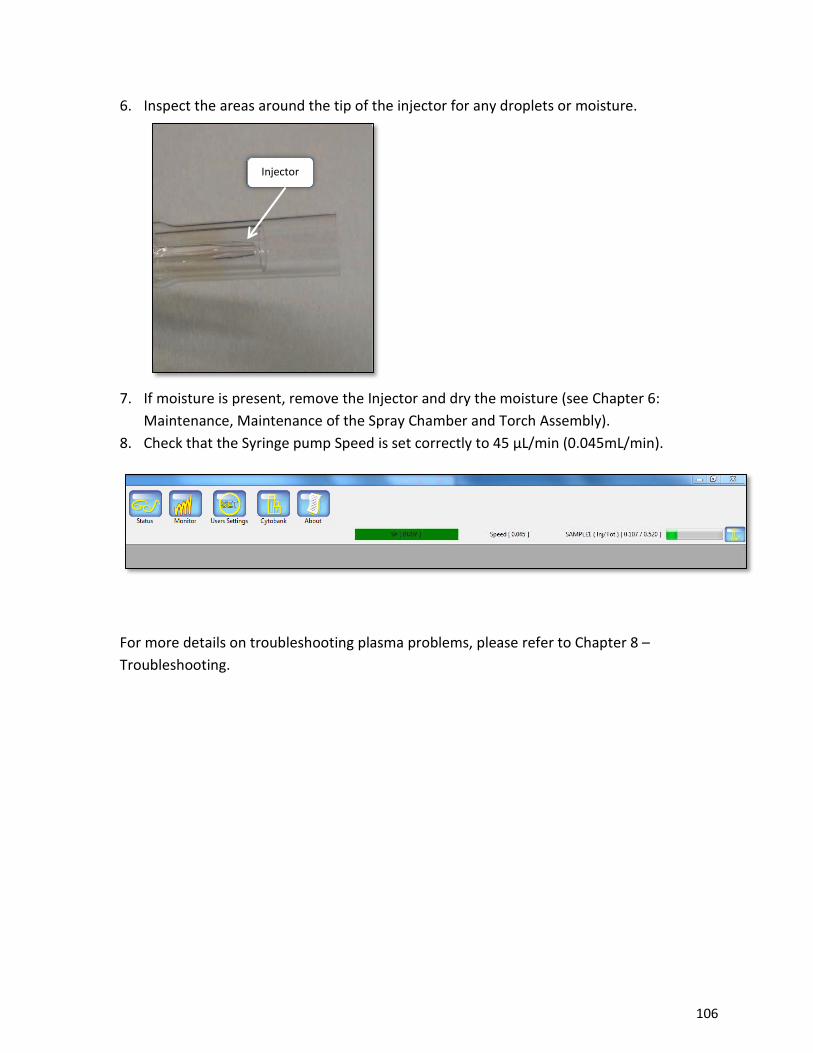
106
6. Inspect the areas around the tip of the injector for any droplets or moisture.
7. If moisture is present, remove the Injector and dry the moisture (see Chapter 6:Maintenance, Maintenance of the Spray Chamber and Torch Assembly).
8. Check that the Syringe pump Speed is set correctly to 45 µL/min (0.045mL/min).
For more details on troubleshooting plasma problems, please refer to Chapter 8 – Troubleshooting.
Injector
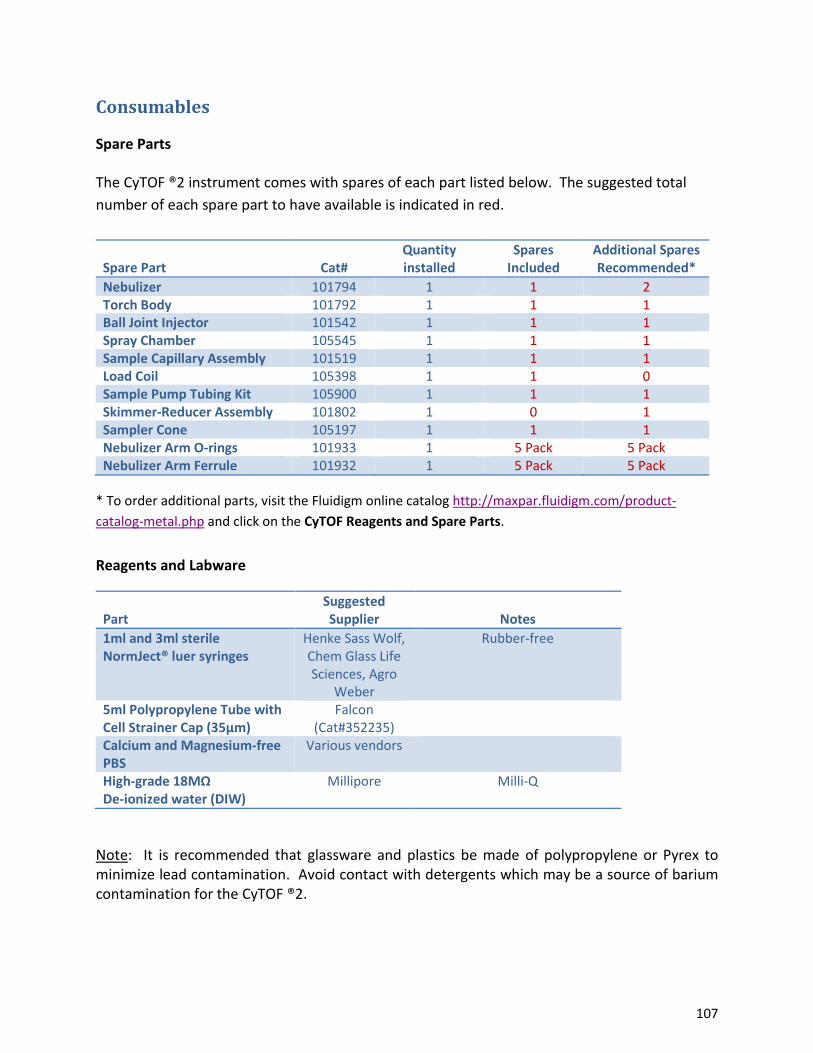
107
Consumables
Spare Parts
The CyTOF ®2 instrument comes with spares of each part listed below. The suggested total number of each spare part to have available is indicated in red.
Spare Part Cat# Quantity installed
Spares Included
Additional Spares Recommended*
Nebulizer 101794 1 1 2 Torch Body 101792 1 1 1 Ball Joint Injector 101542 1 1 1 Spray Chamber 105545 1 1 1 Sample Capillary Assembly 101519 1 1 1 Load Coil 105398 1 1 0 Sample Pump Tubing Kit 105900 1 1 1 Skimmer-Reducer Assembly 101802 1 0 1 Sampler Cone 105197 1 1 1 Nebulizer Arm O-rings 101933 1 5 Pack 5 Pack Nebulizer Arm Ferrule 101932 1 5 Pack 5 Pack
* To order additional parts, visit the Fluidigm online catalog http://maxpar.fluidigm.com/product-catalog-metal.php and click on the CyTOF Reagents and Spare Parts.
Reagents and Labware
Part Suggested Supplier Notes
1ml and 3ml sterile NormJect® luer syringes
Henke Sass Wolf, Chem Glass Life Sciences, Agro
Weber
Rubber-free
5ml Polypropylene Tube with Cell Strainer Cap (35µm)
Falcon (Cat#352235)
Calcium and Magnesium-free PBS
Various vendors
High-grade 18MΩ De-ionized water (DIW)
Millipore Milli-Q
Note: It is recommended that glassware and plastics be made of polypropylene or Pyrex to minimize lead contamination. Avoid contact with detergents which may be a source of barium contamination for the CyTOF ®2.
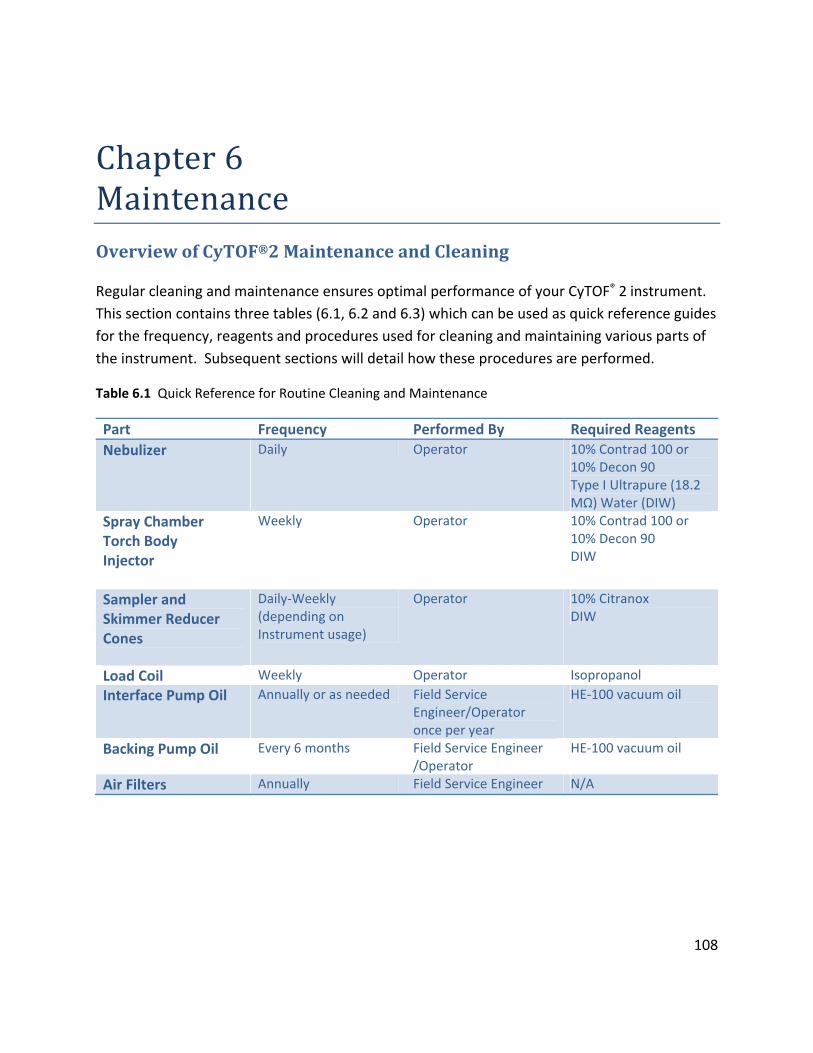
108
Chapter6MaintenanceOverviewofCyTOF®2MaintenanceandCleaning
Regular cleaning and maintenance ensures optimal performance of your CyTOF® 2 instrument.
This section contains three tables (6.1, 6.2 and 6.3) which can be used as quick reference guides
for the frequency, reagents and procedures used for cleaning and maintaining various parts of
the instrument. Subsequent sections will detail how these procedures are performed.
Table 6.1 Quick Reference for Routine Cleaning and Maintenance
Part Frequency Performed By Required Reagents
Nebulizer Daily Operator 10% Contrad 100 or 10% Decon 90 Type I Ultrapure (18.2 MΩ) Water (DIW)
Spray Chamber Torch Body Injector
Weekly Operator 10% Contrad 100 or 10% Decon 90 DIW
Sampler and Skimmer Reducer Cones
Daily‐Weekly (depending on Instrument usage)
Operator 10% Citranox DIW
Load Coil Weekly Operator Isopropanol Interface Pump Oil Annually or as needed Field Service
Engineer/Operator once per year
HE‐100 vacuum oil
Backing Pump Oil Every 6 months Field Service Engineer /Operator
HE‐100 vacuum oil
Air Filters Annually Field Service Engineer N/A
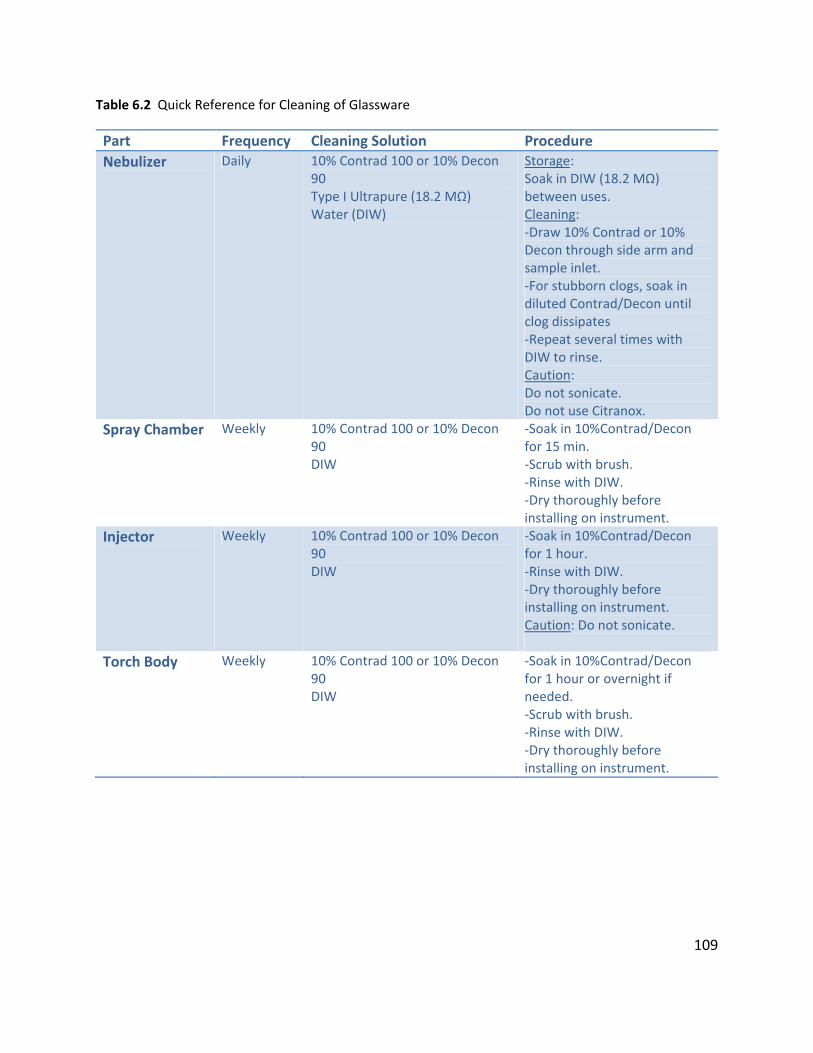
109
Table 6.2 Quick Reference for Cleaning of Glassware
Part Frequency Cleaning Solution Procedure
Nebulizer Daily 10% Contrad 100 or 10% Decon 90 Type I Ultrapure (18.2 MΩ) Water (DIW)
Storage: Soak in DIW (18.2 MΩ) between uses. Cleaning: ‐Draw 10% Contrad or 10% Decon through side arm and sample inlet. ‐For stubborn clogs, soak in diluted Contrad/Decon until clog dissipates ‐Repeat several times with DIW to rinse. Caution: Do not sonicate. Do not use Citranox.
Spray Chamber Weekly 10% Contrad 100 or 10% Decon 90 DIW
‐Soak in 10%Contrad/Decon for 15 min. ‐Scrub with brush. ‐Rinse with DIW. ‐Dry thoroughly before installing on instrument.
Injector Weekly 10% Contrad 100 or 10% Decon 90 DIW
‐Soak in 10%Contrad/Decon for 1 hour. ‐Rinse with DIW. ‐Dry thoroughly before installing on instrument. Caution: Do not sonicate.
Torch Body Weekly 10% Contrad 100 or 10% Decon 90 DIW
‐Soak in 10%Contrad/Decon for 1 hour or overnight if needed. ‐Scrub with brush. ‐Rinse with DIW. ‐Dry thoroughly before installing on instrument.
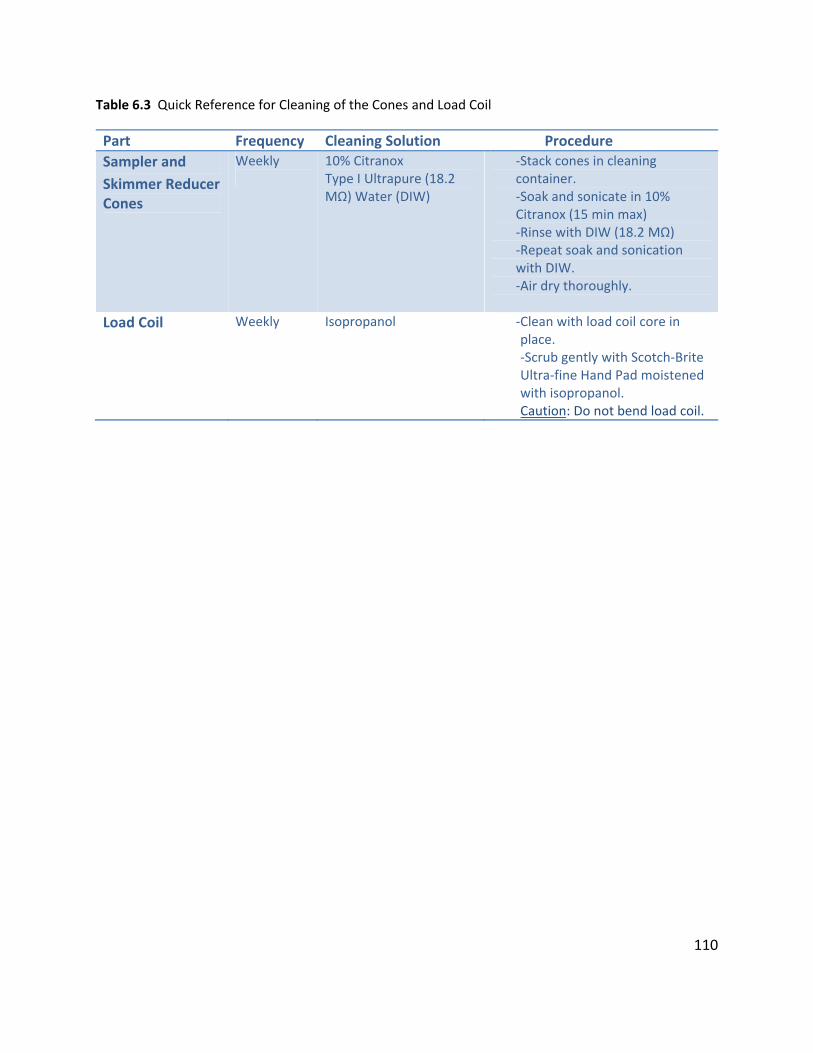
110
Table 6.3 Quick Reference for Cleaning of the Cones and Load Coil
Part Frequency Cleaning Solution Procedure
Sampler and
Skimmer Reducer Cones
Weekly 10% Citranox Type I Ultrapure (18.2 MΩ) Water (DIW)
‐Stack cones in cleaning container. ‐Soak and sonicate in 10% Citranox (15 min max) ‐Rinse with DIW (18.2 MΩ) ‐Repeat soak and sonication with DIW. ‐Air dry thoroughly.
Load Coil Weekly Isopropanol Clean‐ with load coil core in place. ‐Scrub gently with Scotch‐Brite Ultra‐fine Hand Pad moistened with isopropanol. Caution: Do not bend load coil.
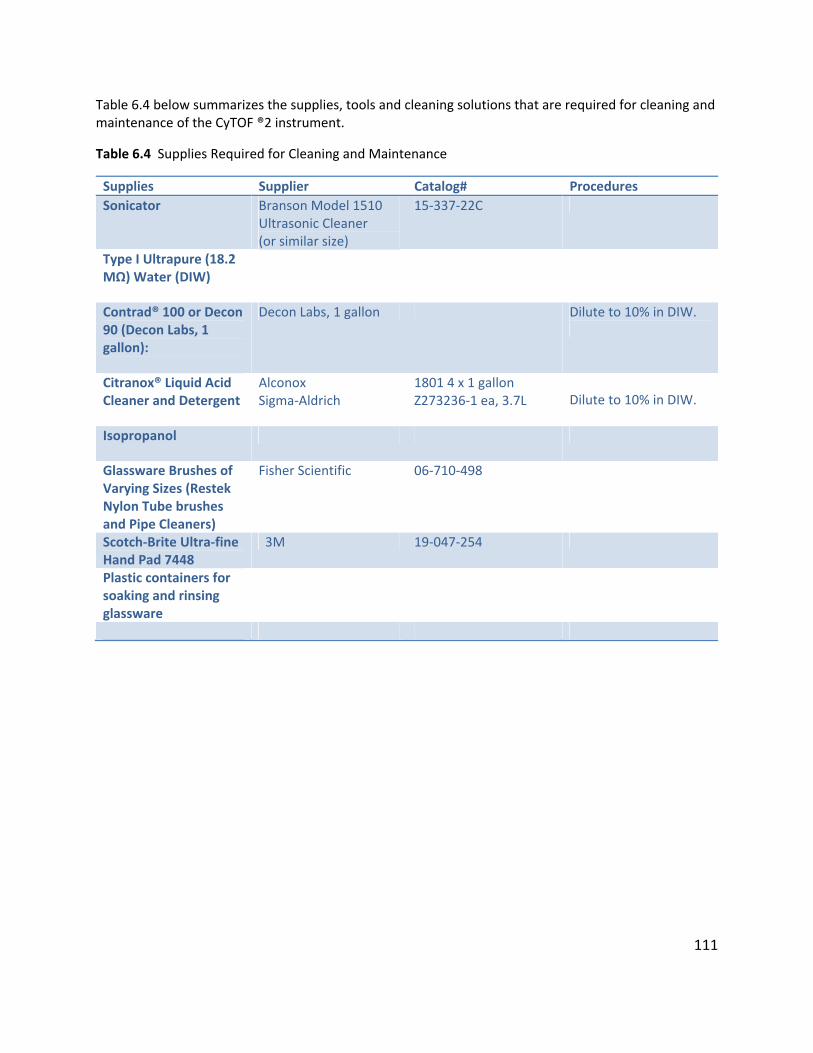
111
Table 6.4 below summarizes the supplies, tools and cleaning solutions that are required for cleaning and maintenance of the CyTOF ®2 instrument.
Table 6.4 Supplies Required for Cleaning and Maintenance
Supplies Supplier Catalog# ProceduresSonicator Branson Model 1510
Ultrasonic Cleaner (or similar size)
15‐337‐22C
Type I Ultrapure (18.2 MΩ) Water (DIW)
Contrad® 100 or Decon 90 (Decon Labs, 1 gallon):
Decon Labs, 1 gallon Dilute to 10% in DIW.
Citranox® Liquid Acid Cleaner and Detergent
Alconox Sigma‐Aldrich
1801 4 x 1 gallon Z273236‐1 ea, 3.7L Dilute to 10% in DIW.
Isopropanol
Glassware Brushes of Varying Sizes (Restek Nylon Tube brushes and Pipe Cleaners)
Fisher Scientific 06‐710‐498
Scotch‐Brite Ultra‐fine Hand Pad 7448
3M 19‐047‐254
Plastic containers for soaking and rinsing glassware
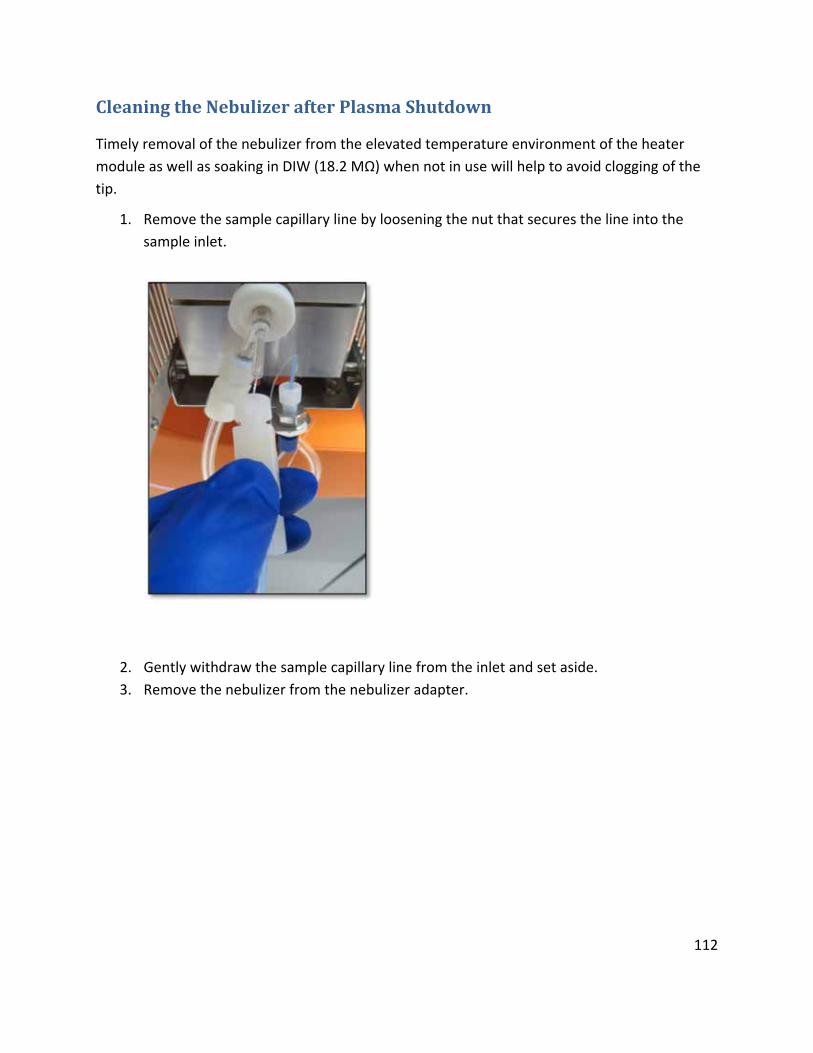
112
CleaningtheNebulizerafterPlasmaShutdown
Timely removal of the nebulizer from the elevated temperature environment of the heater
module as well as soaking in DIW (18.2 MΩ) when not in use will help to avoid clogging of the
tip.
1. Remove the sample capillary line by loosening the nut that secures the line into the
sample inlet.
2. Gently withdraw the sample capillary line from the inlet and set aside.
3. Remove the nebulizer from the nebulizer adapter.
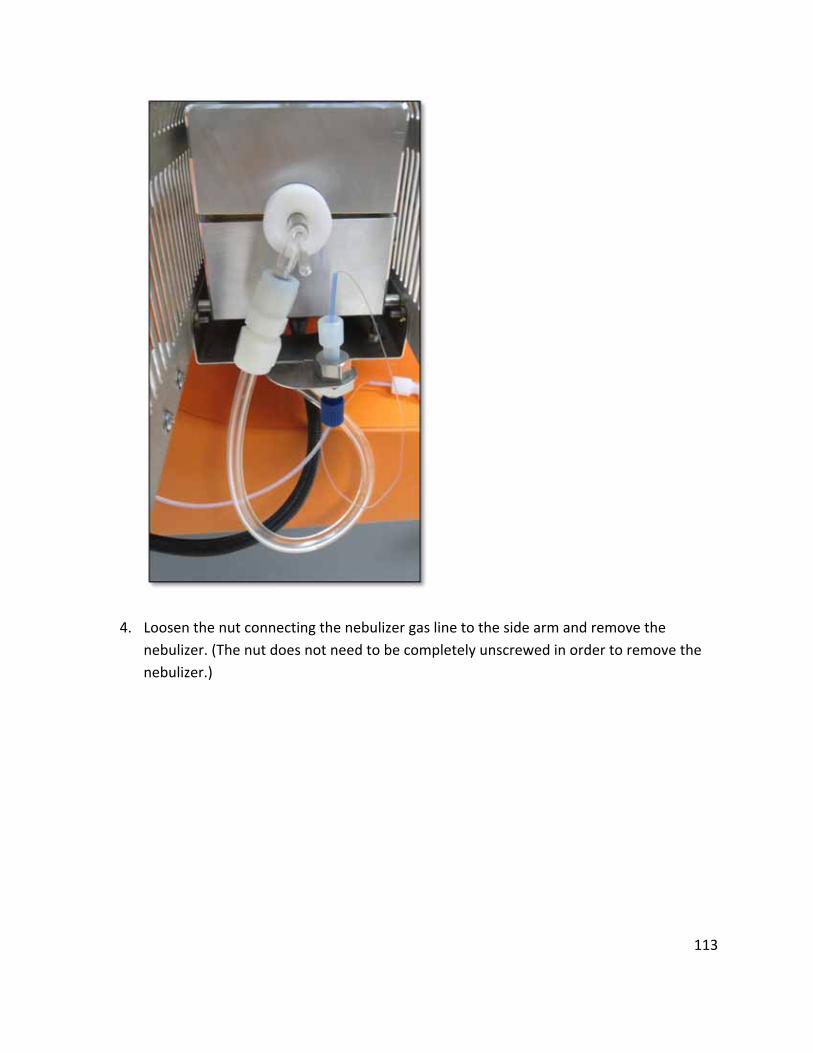
113
4. Loosen the nut connecting the nebulizer gas line to the side arm and remove the
nebulizer. (The nut does not need to be completely unscrewed in order to remove the
nebulizer.)
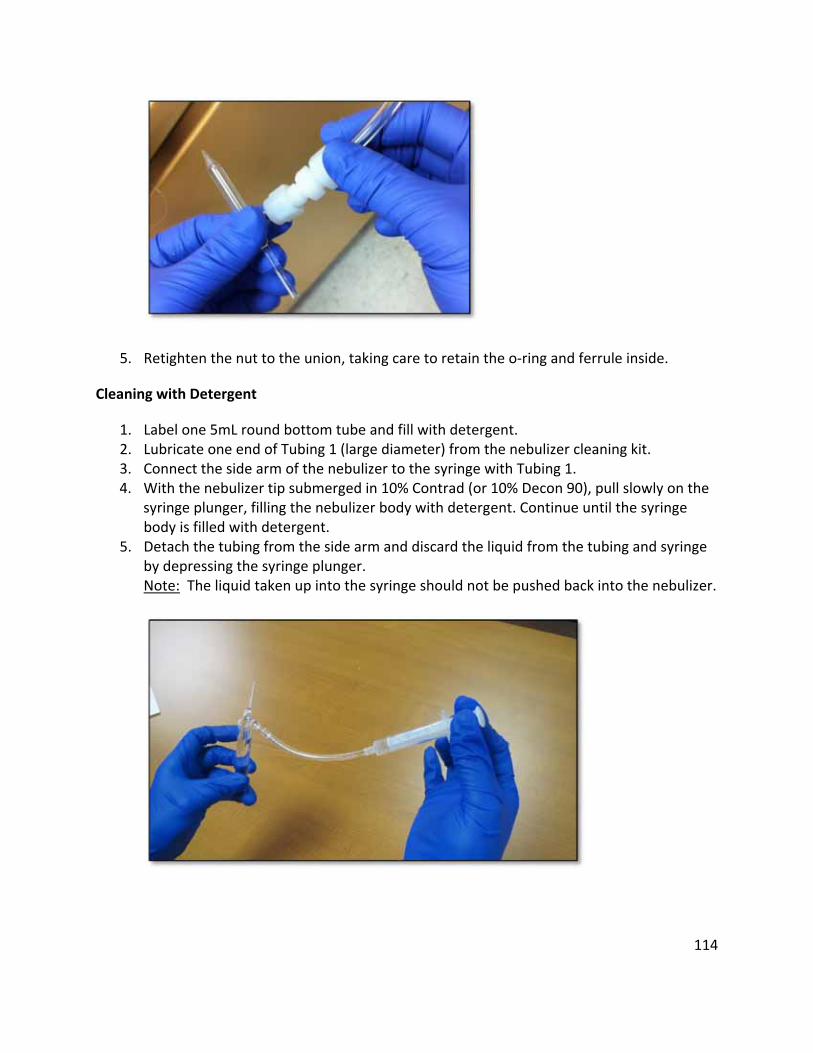
114
5. Retighten the nut to the union, taking care to retain the o‐ring and ferrule inside.
Cleaning with Detergent
1. Label one 5mL round bottom tube and fill with detergent.2. Lubricate one end of Tubing 1 (large diameter) from the nebulizer cleaning kit.3. Connect the side arm of the nebulizer to the syringe with Tubing 1.4. With the nebulizer tip submerged in 10% Contrad (or 10% Decon 90), pull slowly on the
syringe plunger, filling the nebulizer body with detergent. Continue until the syringebody is filled with detergent.
5. Detach the tubing from the side arm and discard the liquid from the tubing and syringeby depressing the syringe plunger.Note: The liquid taken up into the syringe should not be pushed back into the nebulizer.
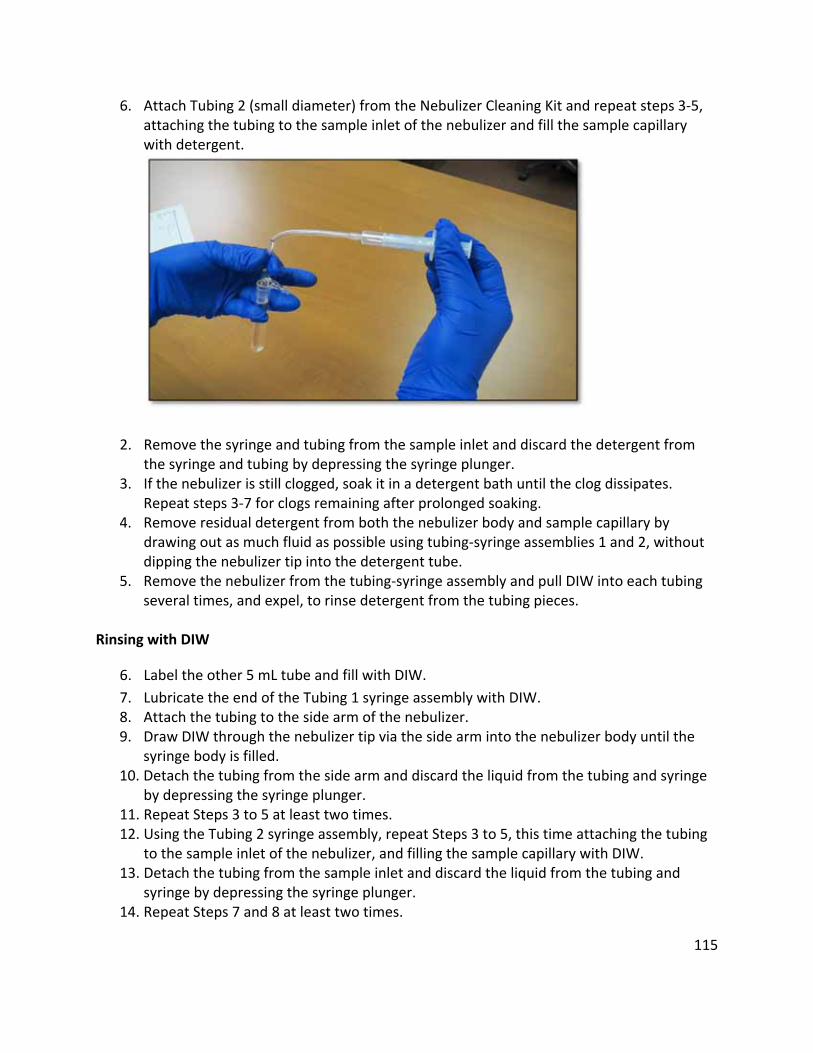
115
6. Attach Tubing 2 (small diameter) from the Nebulizer Cleaning Kit and repeat steps 3‐5,attaching the tubing to the sample inlet of the nebulizer and fill the sample capillarywith detergent.
2. Remove the syringe and tubing from the sample inlet and discard the detergent fromthe syringe and tubing by depressing the syringe plunger.
3. If the nebulizer is still clogged, soak it in a detergent bath until the clog dissipates.Repeat steps 3‐7 for clogs remaining after prolonged soaking.
4. Remove residual detergent from both the nebulizer body and sample capillary bydrawing out as much fluid as possible using tubing‐syringe assemblies 1 and 2, withoutdipping the nebulizer tip into the detergent tube.
5. Remove the nebulizer from the tubing‐syringe assembly and pull DIW into each tubingseveral times, and expel, to rinse detergent from the tubing pieces.
Rinsing with DIW
6. Label the other 5 mL tube and fill with DIW.
7. Lubricate the end of the Tubing 1 syringe assembly with DIW.8. Attach the tubing to the side arm of the nebulizer.9. Draw DIW through the nebulizer tip via the side arm into the nebulizer body until the
syringe body is filled.10. Detach the tubing from the side arm and discard the liquid from the tubing and syringe
by depressing the syringe plunger.11. Repeat Steps 3 to 5 at least two times.12. Using the Tubing 2 syringe assembly, repeat Steps 3 to 5, this time attaching the tubing
to the sample inlet of the nebulizer, and filling the sample capillary with DIW.13. Detach the tubing from the sample inlet and discard the liquid from the tubing and
syringe by depressing the syringe plunger.14. Repeat Steps 7 and 8 at least two times.
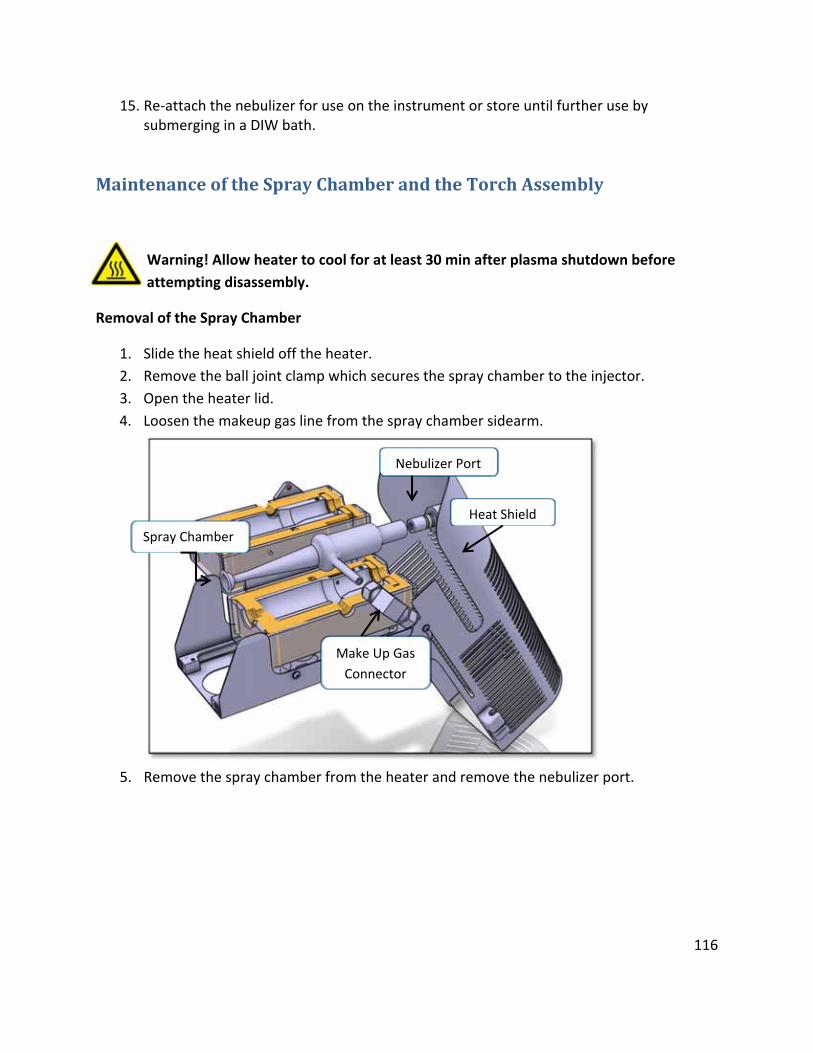
116
15. Re‐attach the nebulizer for use on the instrument or store until further use bysubmerging in a DIW bath.
MaintenanceoftheSprayChamberandtheTorchAssembly
Warning! Allow heater to cool for at least 30 min after plasma shutdown before
attempting disassembly.
Removal of the Spray Chamber
1. Slide the heat shield off the heater.
2. Remove the ball joint clamp which secures the spray chamber to the injector.
3. Open the heater lid.
4. Loosen the makeup gas line from the spray chamber sidearm.
5. Remove the spray chamber from the heater and remove the nebulizer port.
Nebulizer Port
Heat Shield
Make Up Gas
Connector
Spray Chamber
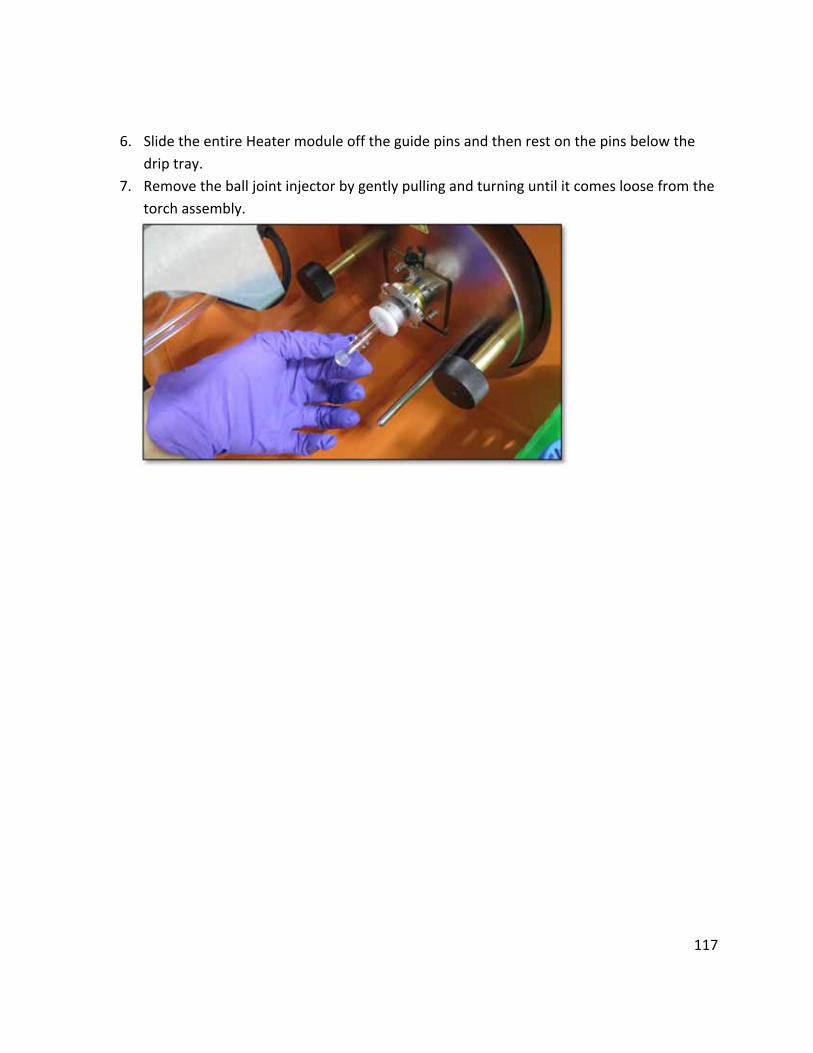
117
6. Slide the entire Heater module off the guide pins and then rest on the pins below the
drip tray.
7. Remove the ball joint injector by gently pulling and turning until it comes loose from the
torch assembly.
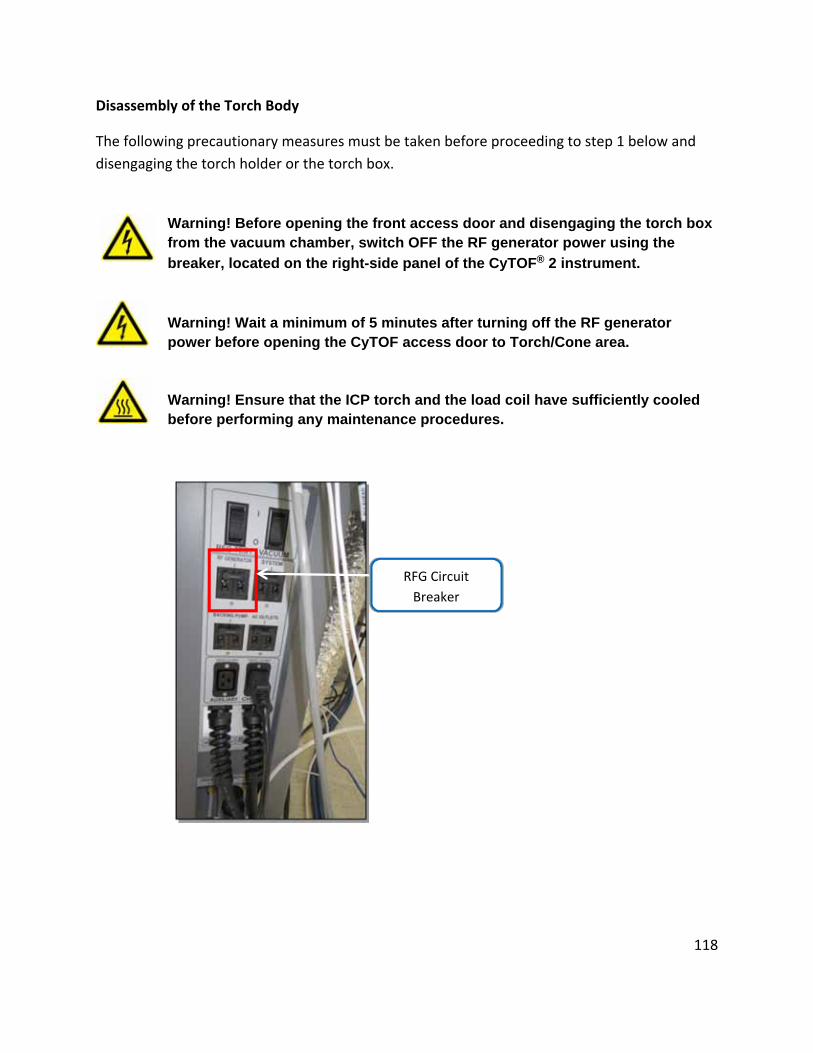
118
Disassembly of the Torch Body
The following precautionary measures must be taken before proceeding to step 1 below and
disengaging the torch holder or the torch box.
Warning! Before opening the front access door and disengaging the torch box from the vacuum chamber, switch OFF the RF generator power using the
breaker, located on the right-side panel of the CyTOF® 2 instrument.
Warning! Wait a minimum of 5 minutes after turning off the RF generator power before opening the CyTOF access door to Torch/Cone area.
Warning! Ensure that the ICP torch and the load coil have sufficiently cooled before performing any maintenance procedures.
RFG Circuit
Breaker

119
1. Loosen the two thumb screws at the front of the torch assembly making sure to loosen
in unison.
2. Slide the torch assembly off the torch box pins to access the torch body.
Thumb Screws
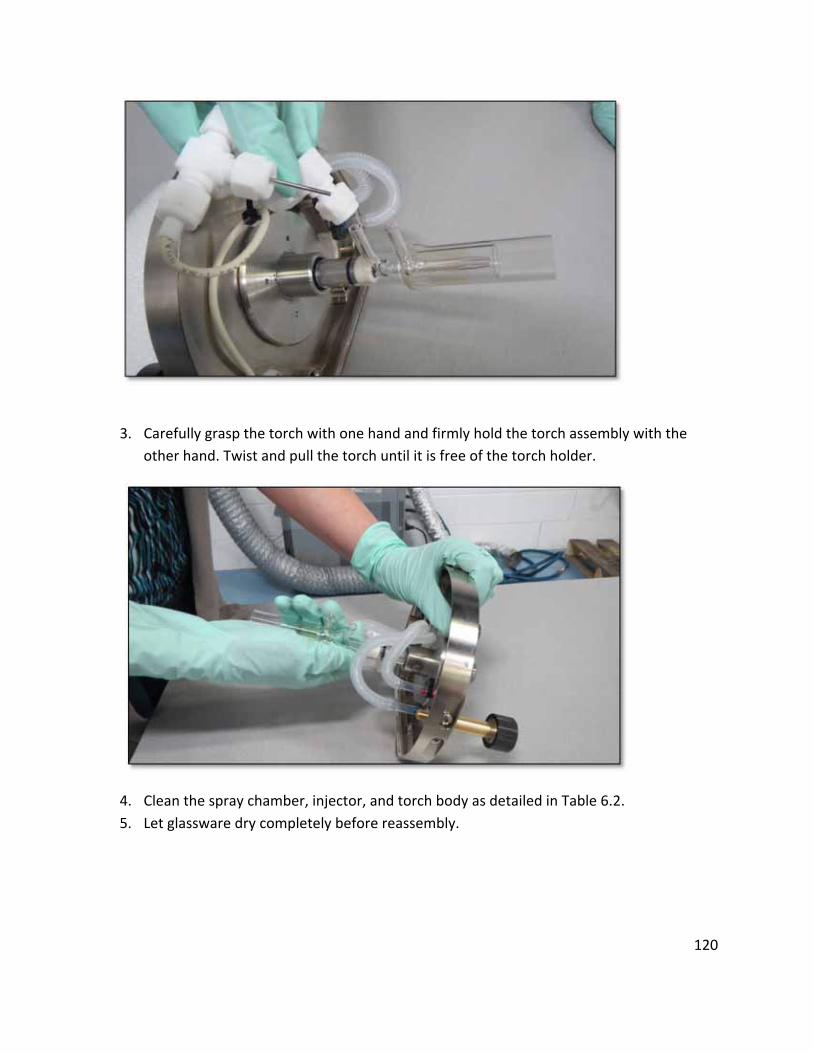
120
3. Carefully grasp the torch with one hand and firmly hold the torch assembly with the
other hand. Twist and pull the torch until it is free of the torch holder.
4. Clean the spray chamber, injector, and torch body as detailed in Table 6.2.
5. Let glassware dry completely before reassembly.
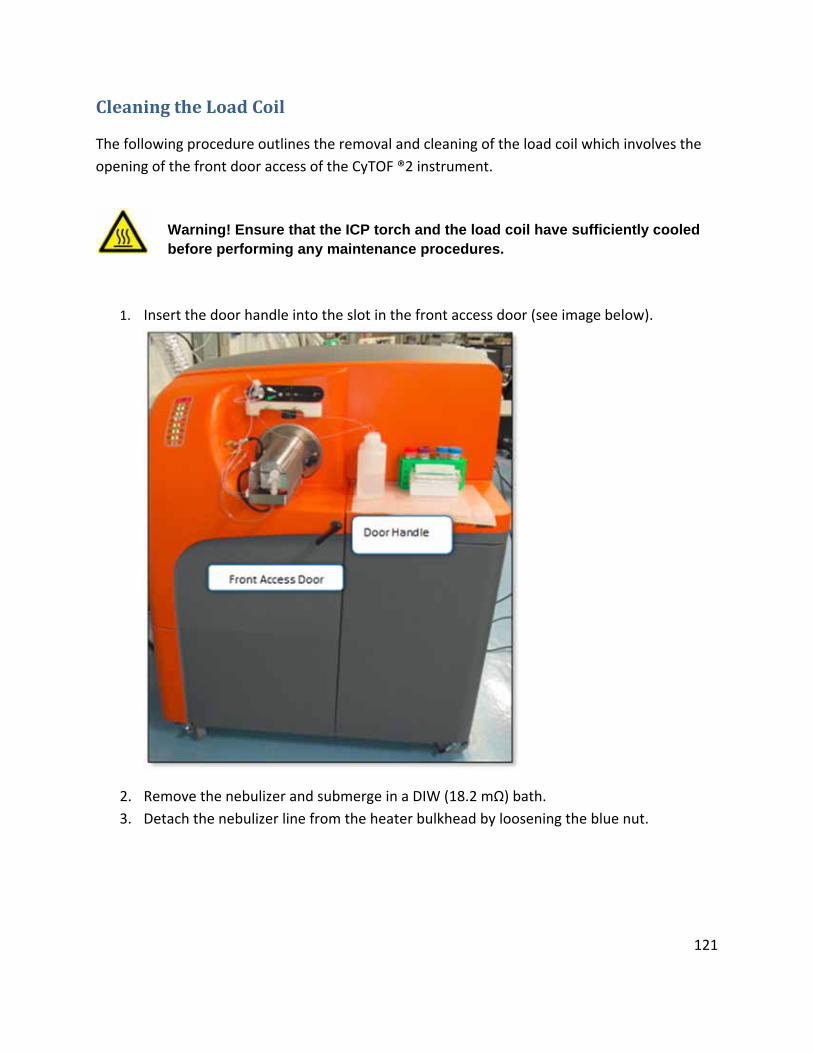
121
CleaningtheLoadCoil
The following procedure outlines the removal and cleaning of the load coil which involves the
opening of the front door access of the CyTOF ®2 instrument.
Warning! Ensure that the ICP torch and the load coil have sufficiently cooled before performing any maintenance procedures.
1. Insert the door handle into the slot in the front access door (see image below).
2. Remove the nebulizer and submerge in a DIW (18.2 mΩ) bath.
3. Detach the nebulizer line from the heater bulkhead by loosening the blue nut.
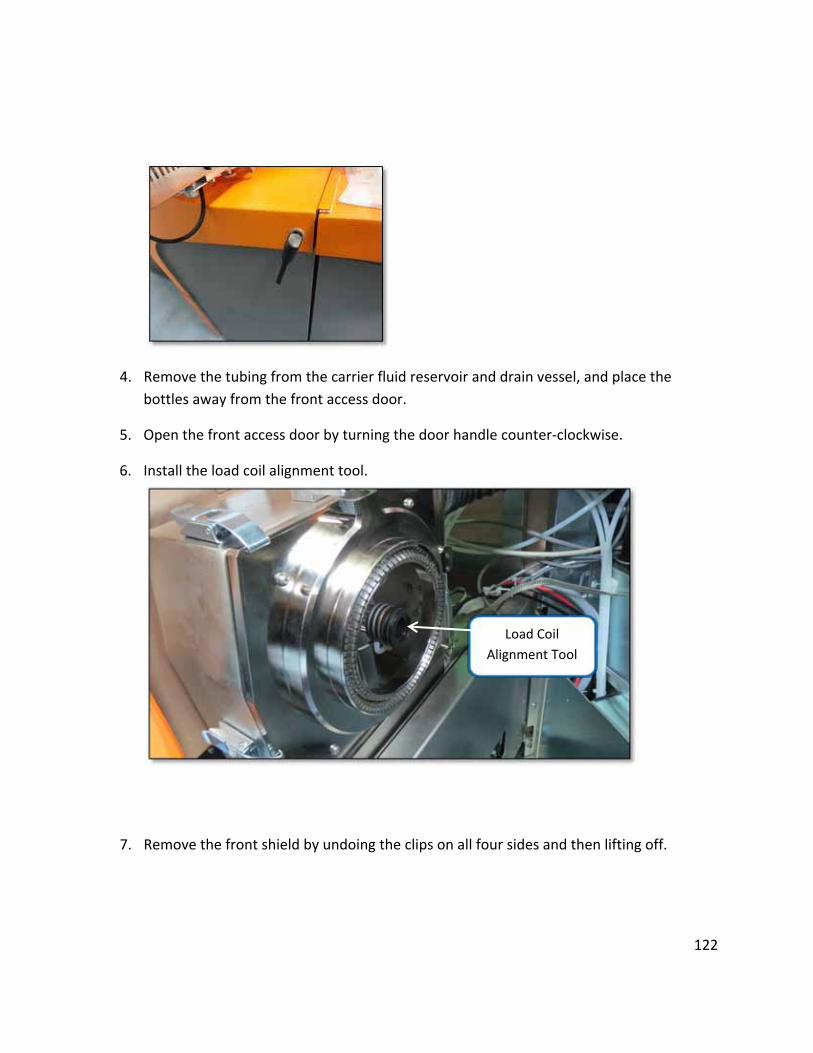
122
4. Remove the tubing from the carrier fluid reservoir and drain vessel, and place the
bottles away from the front access door.
5. Open the front access door by turning the door handle counter‐clockwise.
6. Install the load coil alignment tool.
7. Remove the front shield by undoing the clips on all four sides and then lifting off.
Load Coil
Alignment Tool
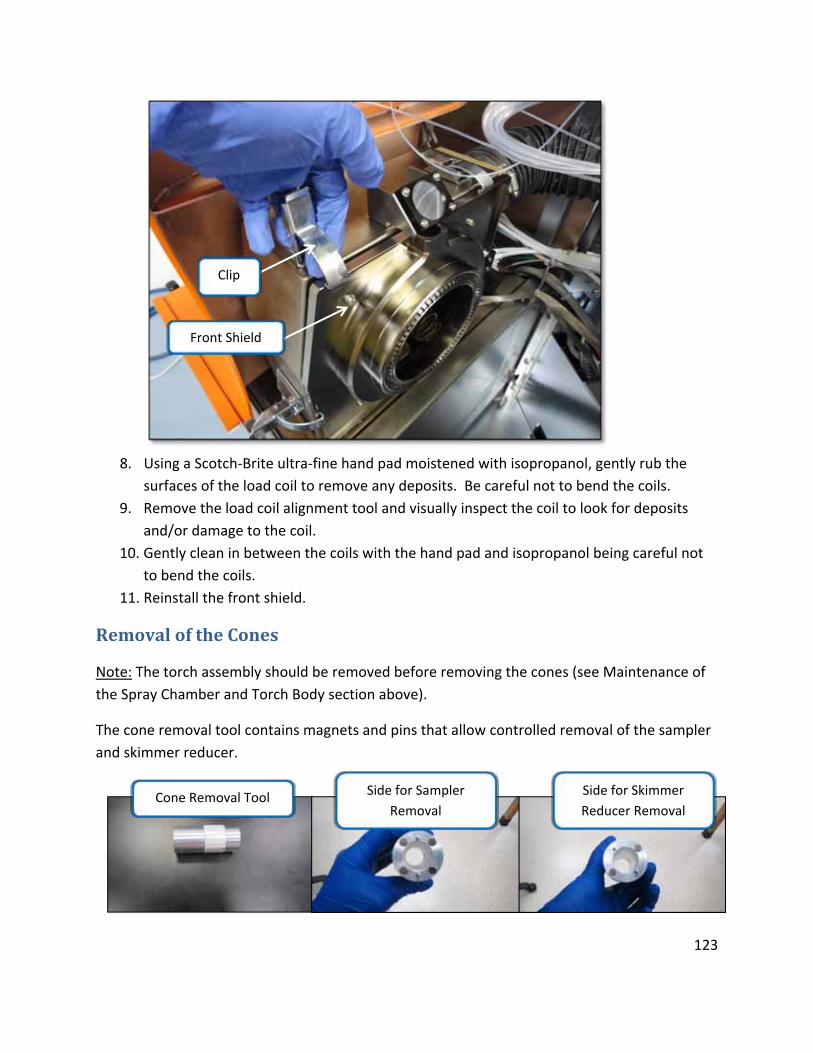
123
8. Using a Scotch‐Brite ultra‐fine hand pad moistened with isopropanol, gently rub thesurfaces of the load coil to remove any deposits. Be careful not to bend the coils.
9. Remove the load coil alignment tool and visually inspect the coil to look for deposits
and/or damage to the coil.
10. Gently clean in between the coils with the hand pad and isopropanol being careful notto bend the coils.
11. Reinstall the front shield.
RemovaloftheCones
Note: The torch assembly should be removed before removing the cones (see Maintenance of
the Spray Chamber and Torch Body section above).
The cone removal tool contains magnets and pins that allow controlled removal of the sampler
and skimmer reducer.
Front Shield
Clip
Cone Removal Tool Side for Sampler
Removal
Side for Skimmer
Reducer Removal
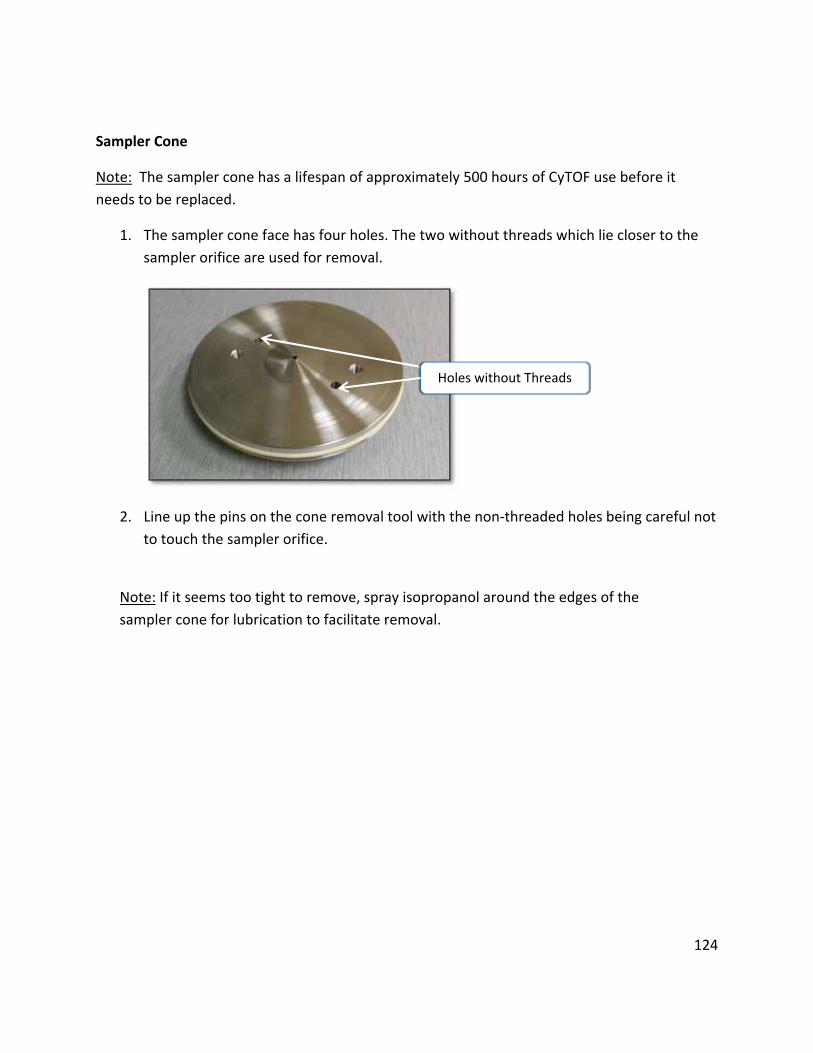
124
Sampler Cone
Note: The sampler cone has a lifespan of approximately 500 hours of CyTOF use before it
needs to be replaced.
1. The sampler cone face has four holes. The two without threads which lie closer to the
sampler orifice are used for removal.
2. Line up the pins on the cone removal tool with the non‐threaded holes being careful not
to touch the sampler orifice.
Note: If it seems too tight to remove, spray isopropanol around the edges of the sampler cone for lubrication to facilitate removal.
Holes without Threads
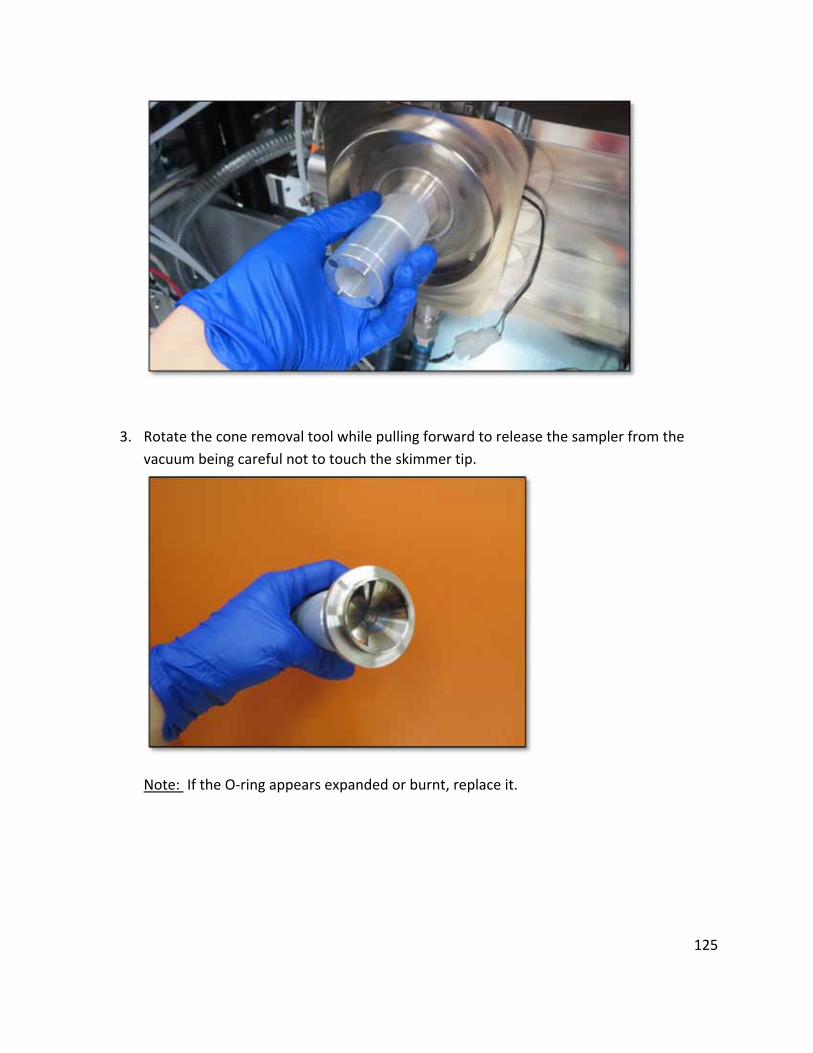
125
3. Rotate the cone removal tool while pulling forward to release the sampler from the
vacuum being careful not to touch the skimmer tip.
Note: If the O‐ring appears expanded or burnt, replace it.
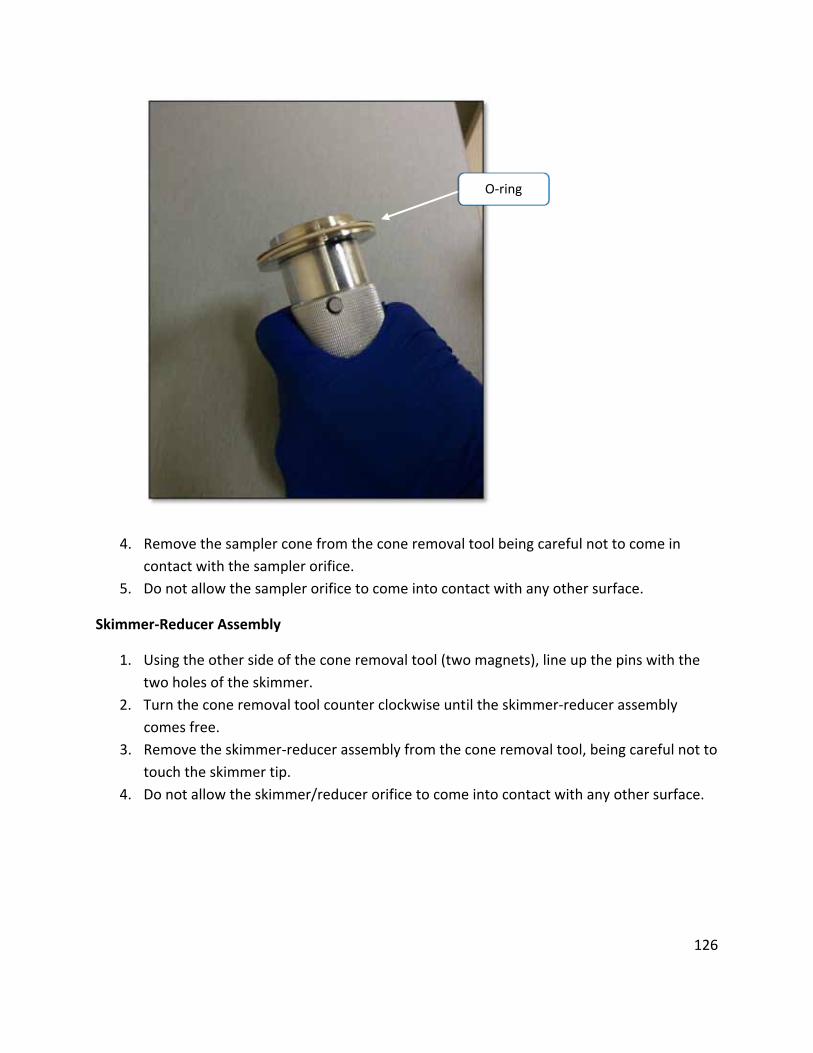
126
4. Remove the sampler cone from the cone removal tool being careful not to come in
contact with the sampler orifice.
5. Do not allow the sampler orifice to come into contact with any other surface.
Skimmer‐Reducer Assembly
1. Using the other side of the cone removal tool (two magnets), line up the pins with the
two holes of the skimmer.
2. Turn the cone removal tool counter clockwise until the skimmer‐reducer assembly
comes free.
3. Remove the skimmer‐reducer assembly from the cone removal tool, being careful not to
touch the skimmer tip.
4. Do not allow the skimmer/reducer orifice to come into contact with any other surface.
O‐ring
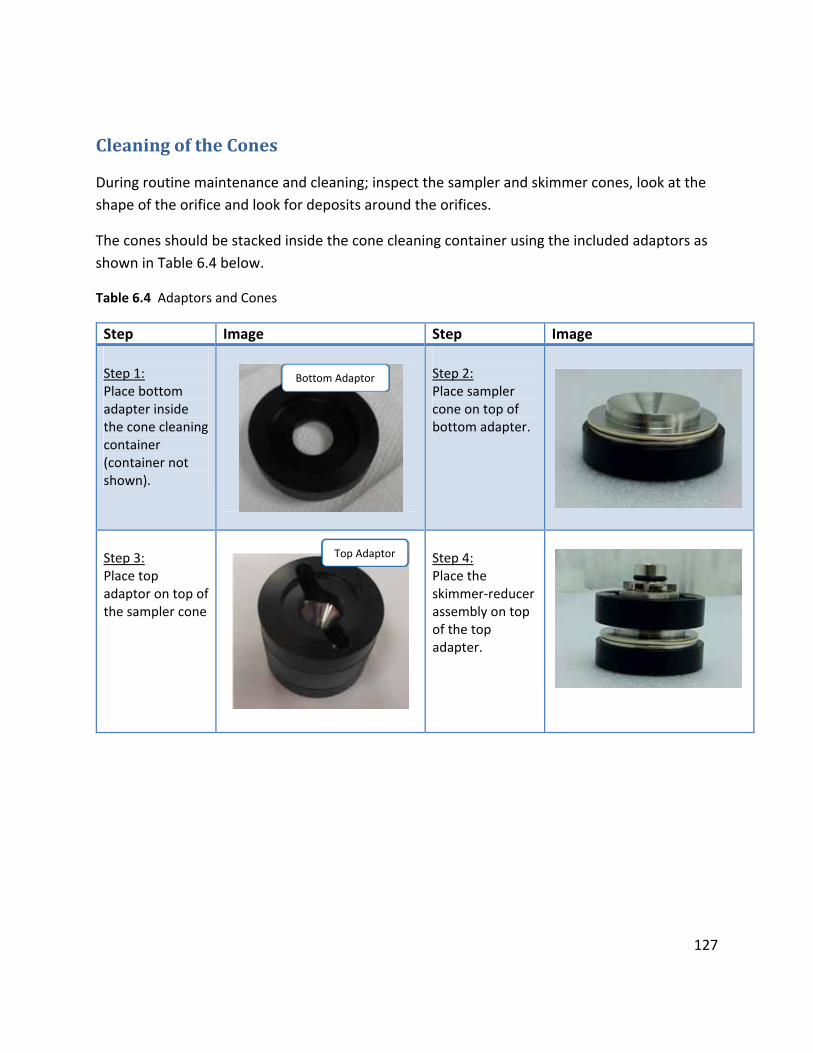
127
CleaningoftheCones
During routine maintenance and cleaning; inspect the sampler and skimmer cones, look at the
shape of the orifice and look for deposits around the orifices.
The cones should be stacked inside the cone cleaning container using the included adaptors as
shown in Table 6.4 below.
Table 6.4 Adaptors and Cones
Step Image Step Image
Step 1: Place bottom adapter inside the cone cleaning container (container not shown).
Step 2: Place sampler cone on top of bottom adapter.
Step 3: Place top adaptor on top of the sampler cone
Step 4: Place the skimmer‐reducer assembly on top of the top adapter.
Bottom Adaptor
Top Adaptor
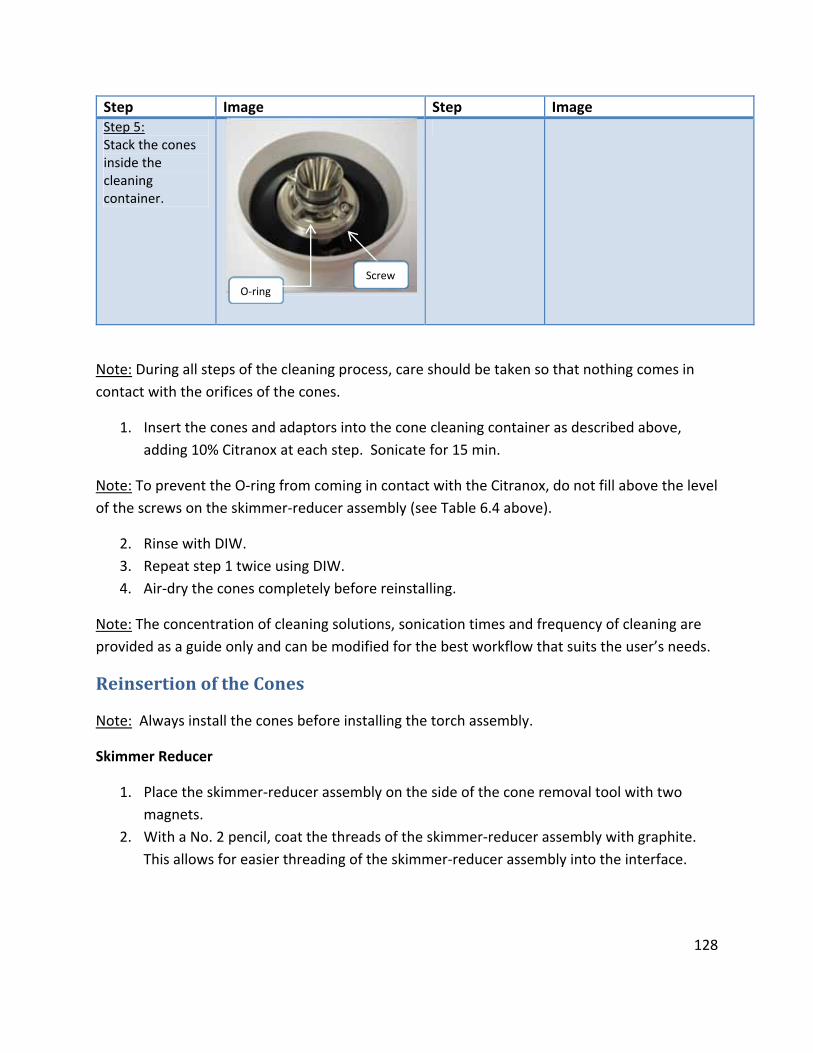
128
Step Image Step Image Step 5: Stack the cones inside the cleaning container.
Note: During all steps of the cleaning process, care should be taken so that nothing comes in
contact with the orifices of the cones.
1. Insert the cones and adaptors into the cone cleaning container as described above,
adding 10% Citranox at each step. Sonicate for 15 min.
Note: To prevent the O‐ring from coming in contact with the Citranox, do not fill above the level
of the screws on the skimmer‐reducer assembly (see Table 6.4 above).
2. Rinse with DIW.
3. Repeat step 1 twice using DIW.
4. Air‐dry the cones completely before reinstalling.
Note: The concentration of cleaning solutions, sonication times and frequency of cleaning are
provided as a guide only and can be modified for the best workflow that suits the user’s needs.
ReinsertionoftheCones
Note: Always install the cones before installing the torch assembly.
Skimmer Reducer
1. Place the skimmer‐reducer assembly on the side of the cone removal tool with two
magnets.
2. With a No. 2 pencil, coat the threads of the skimmer‐reducer assembly with graphite.
This allows for easier threading of the skimmer‐reducer assembly into the interface.
O‐ring
Screw
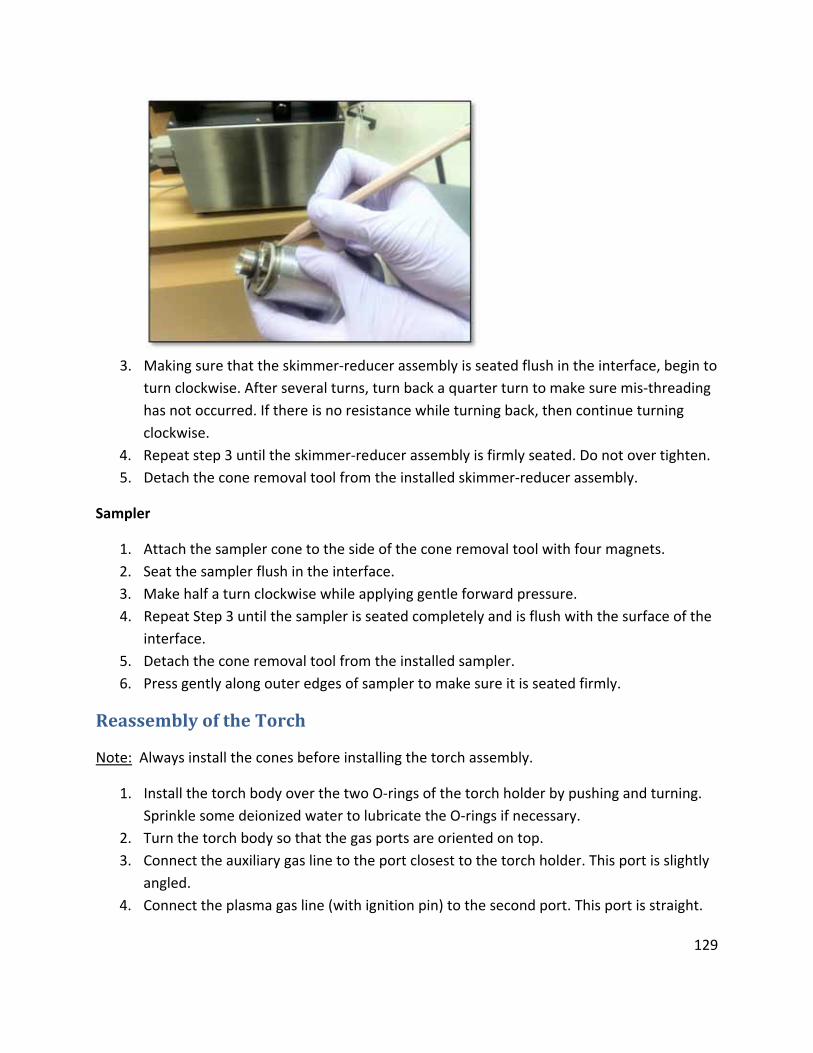
129
3. Making sure that the skimmer‐reducer assembly is seated flush in the interface, begin to
turn clockwise. After several turns, turn back a quarter turn to make sure mis‐threading
has not occurred. If there is no resistance while turning back, then continue turning
clockwise.
4. Repeat step 3 until the skimmer‐reducer assembly is firmly seated. Do not over tighten.
5. Detach the cone removal tool from the installed skimmer‐reducer assembly.
Sampler
1. Attach the sampler cone to the side of the cone removal tool with four magnets.
2. Seat the sampler flush in the interface.
3. Make half a turn clockwise while applying gentle forward pressure.
4. Repeat Step 3 until the sampler is seated completely and is flush with the surface of the
interface.
5. Detach the cone removal tool from the installed sampler.
6. Press gently along outer edges of sampler to make sure it is seated firmly.
ReassemblyoftheTorch
Note: Always install the cones before installing the torch assembly.
1. Install the torch body over the two O‐rings of the torch holder by pushing and turning.
Sprinkle some deionized water to lubricate the O‐rings if necessary.
2. Turn the torch body so that the gas ports are oriented on top.
3. Connect the auxiliary gas line to the port closest to the torch holder. This port is slightly
angled.
4. Connect the plasma gas line (with ignition pin) to the second port. This port is straight.
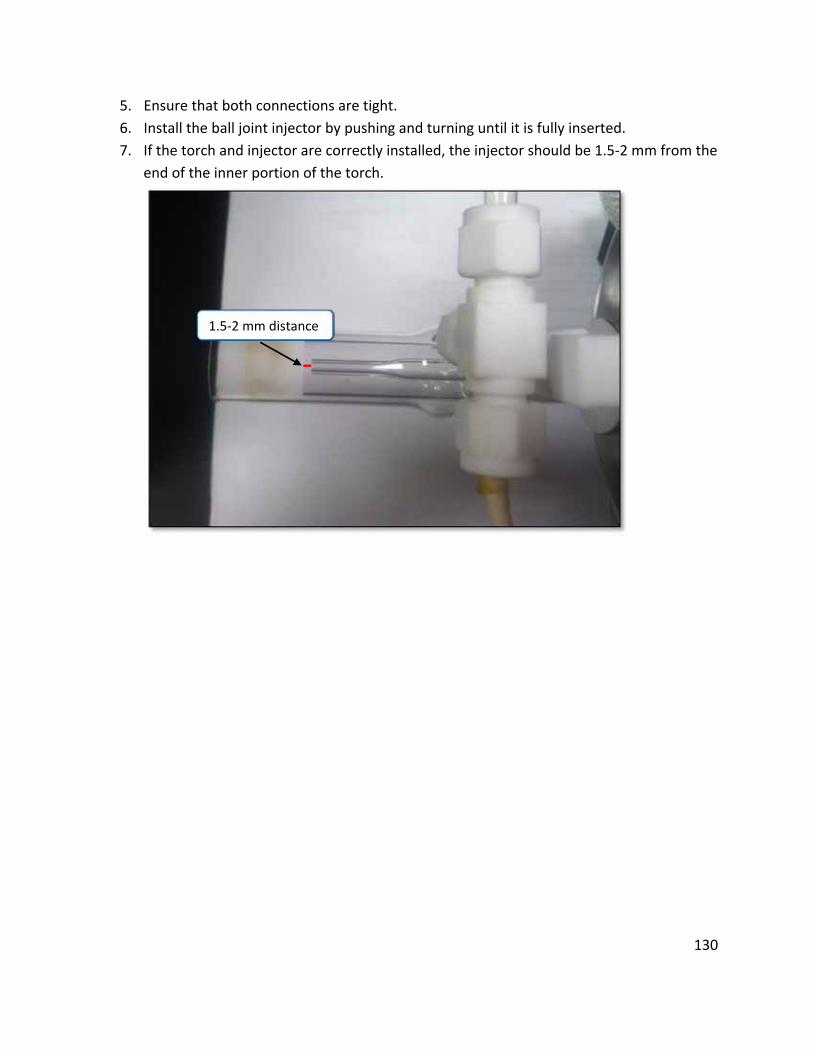
130
5. Ensure that both connections are tight.
6. Install the ball joint injector by pushing and turning until it is fully inserted.
7. If the torch and injector are correctly installed, the injector should be 1.5‐2 mm from the
end of the inner portion of the torch.
1.5‐2 mm distance
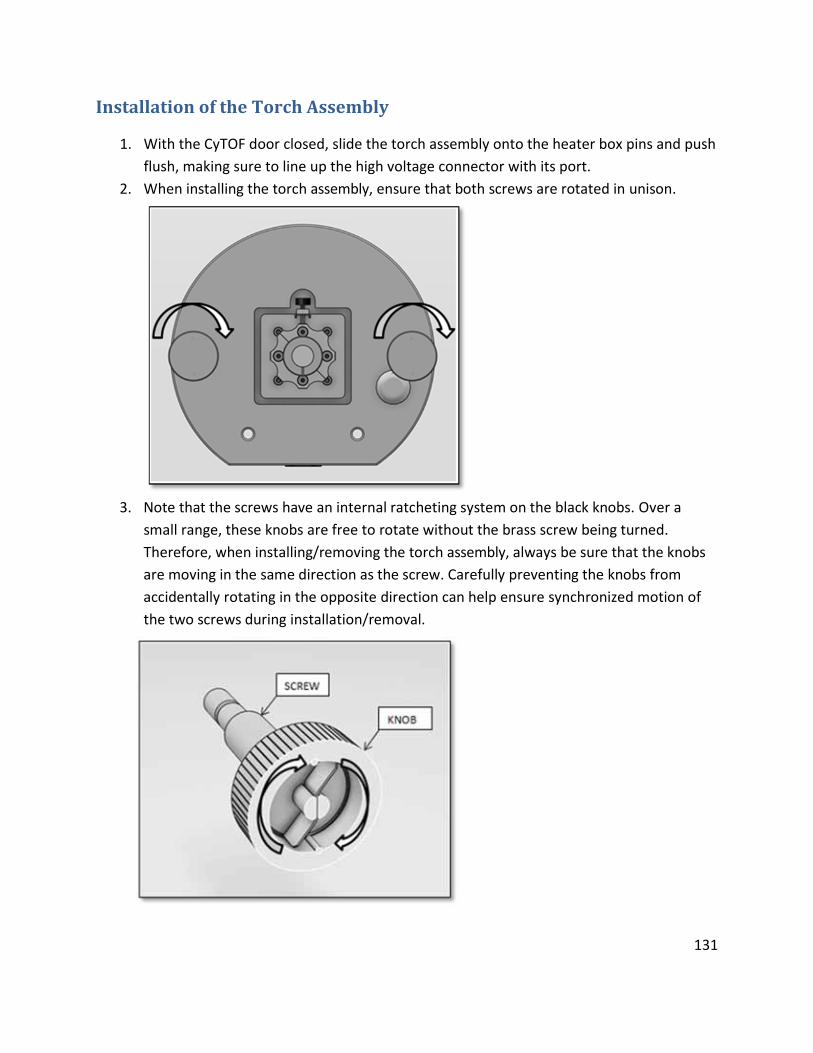
131
InstallationoftheTorchAssembly
1. With the CyTOF door closed, slide the torch assembly onto the heater box pins and push
flush, making sure to line up the high voltage connector with its port.
2. When installing the torch assembly, ensure that both screws are rotated in unison.
3. Note that the screws have an internal ratcheting system on the black knobs. Over a
small range, these knobs are free to rotate without the brass screw being turned.
Therefore, when installing/removing the torch assembly, always be sure that the knobs
are moving in the same direction as the screw. Carefully preventing the knobs from
accidentally rotating in the opposite direction can help ensure synchronized motion of
the two screws during installation/removal.
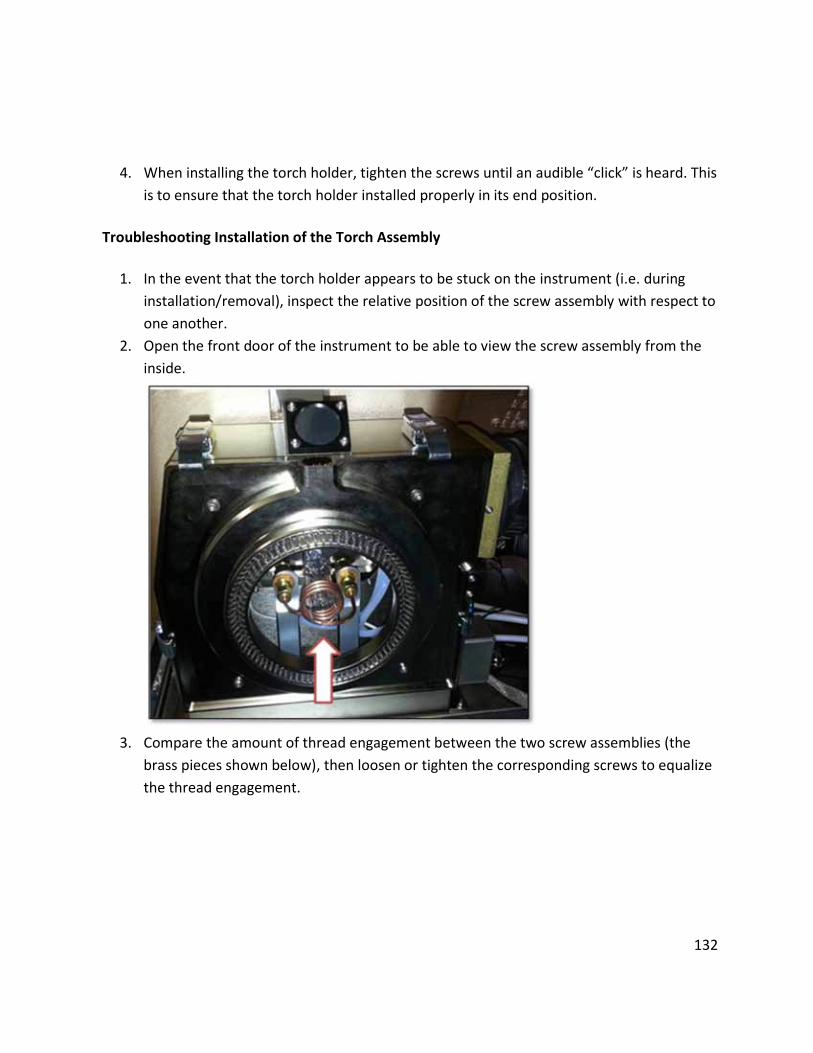
132
4. When installing the torch holder, tighten the screws until an audible “click” is heard. This
is to ensure that the torch holder installed properly in its end position.
Troubleshooting Installation of the Torch Assembly
1. In the event that the torch holder appears to be stuck on the instrument (i.e. during
installation/removal), inspect the relative position of the screw assembly with respect to
one another.
2. Open the front door of the instrument to be able to view the screw assembly from the
inside.
3. Compare the amount of thread engagement between the two screw assemblies (the
brass pieces shown below), then loosen or tighten the corresponding screws to equalize
the thread engagement.
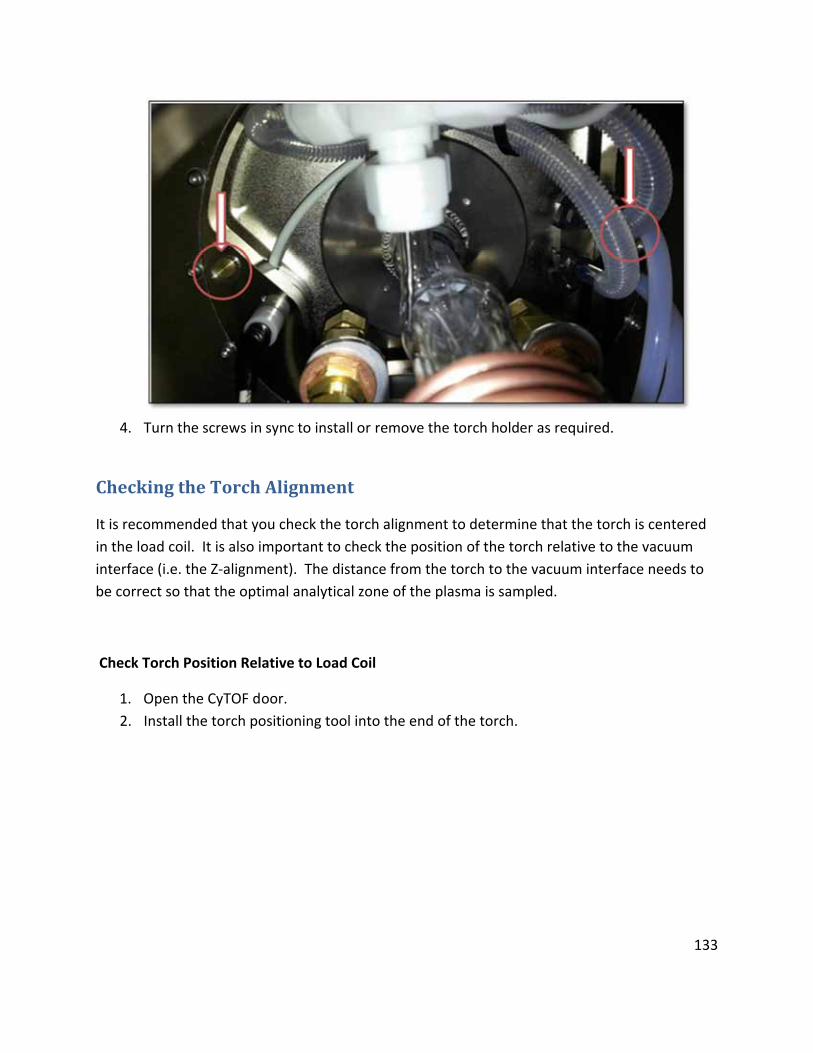
133
4. Turn the screws in sync to install or remove the torch holder as required.
CheckingtheTorchAlignment
It is recommended that you check the torch alignment to determine that the torch is centered
in the load coil. It is also important to check the position of the torch relative to the vacuum
interface (i.e. the Z‐alignment). The distance from the torch to the vacuum interface needs to
be correct so that the optimal analytical zone of the plasma is sampled.
Check Torch Position Relative to Load Coil
1. Open the CyTOF door.
2. Install the torch positioning tool into the end of the torch.
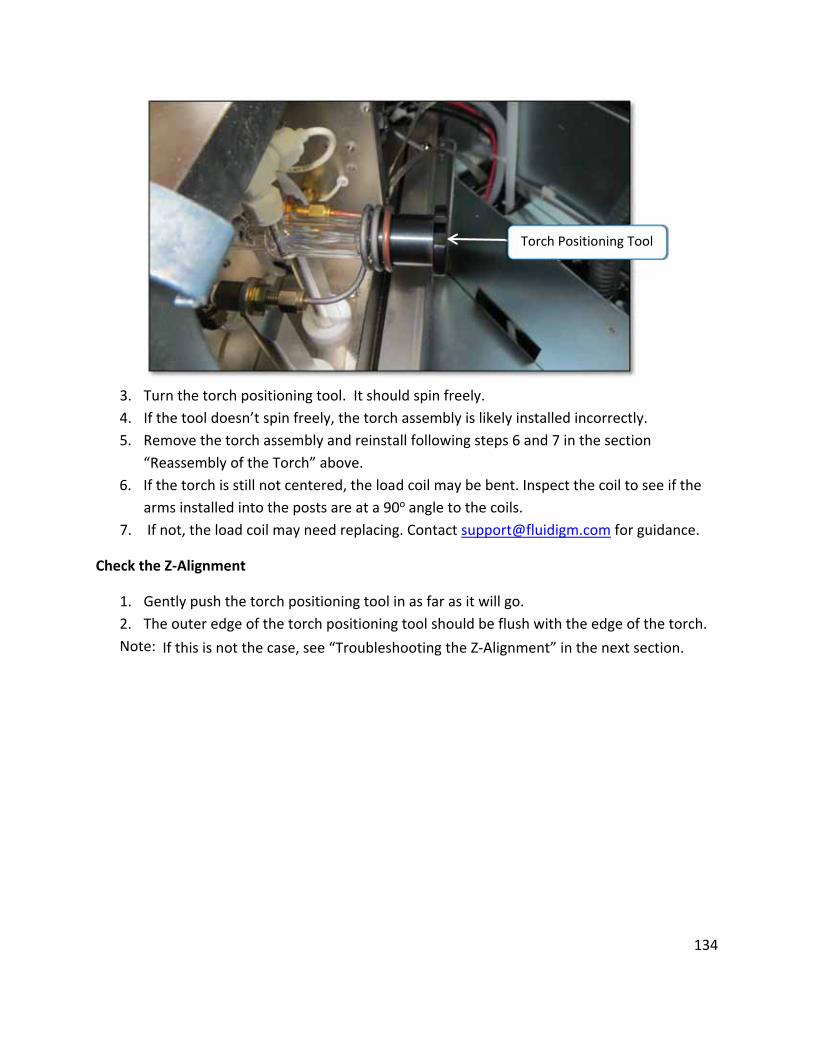
134
3. Turn the torch positioning tool. It should spin freely.
4. If the tool doesn’t spin freely, the torch assembly is likely installed incorrectly.
5. Remove the torch assembly and reinstall following steps 6 and 7 in the section
“Reassembly of the Torch” above.
6. If the torch is still not centered, the load coil may be bent. Inspect the coil to see if the
arms installed into the posts are at a 90o angle to the coils.
7. If not, the load coil may need replacing. Contact [email protected] for guidance.
Check the Z‐Alignment
1. Gently push the torch positioning tool in as far as it will go.
2. The outer edge of the torch positioning tool should be flush with the edge of the torch.
Note: If this is not the case, see “Troubleshooting the Z‐Alignment” in the next section.
Torch Positioning Tool
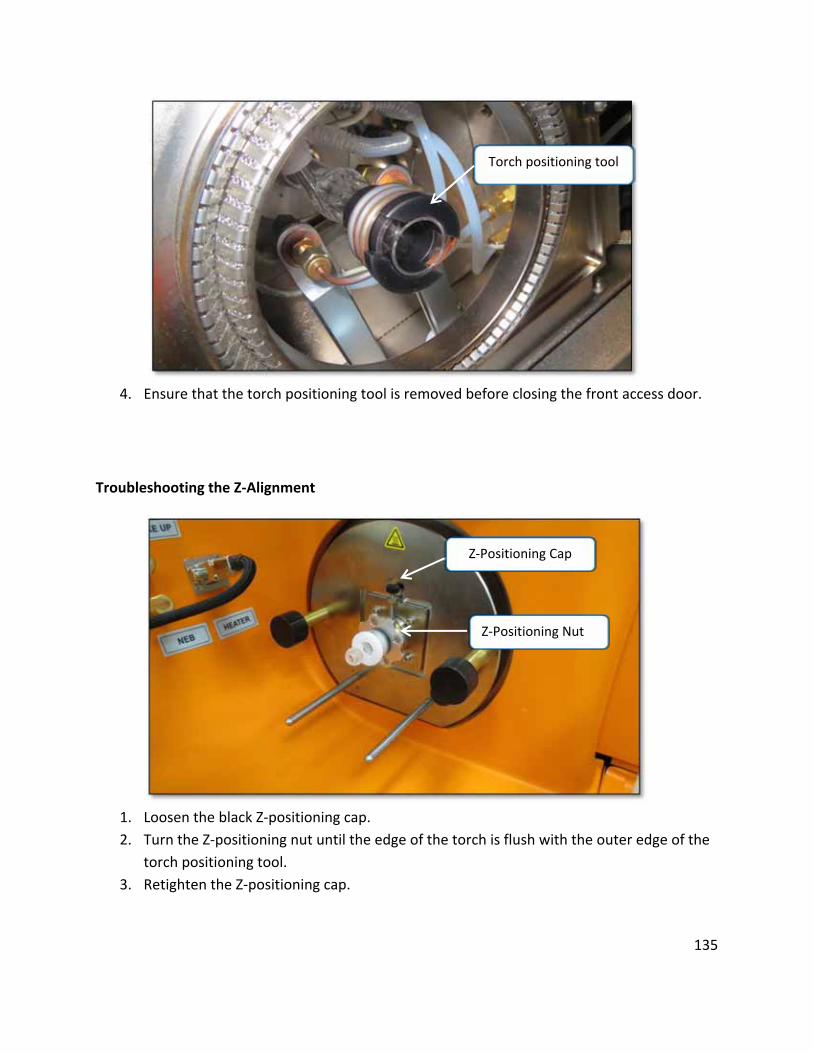
135
4. Ensure that the torch positioning tool is removed before closing the front access door.
Troubleshooting the Z‐Alignment
1. Loosen the black Z‐positioning cap.
2. Turn the Z‐positioning nut until the edge of the torch is flush with the outer edge of the
torch positioning tool.
3. Retighten the Z‐positioning cap.
Z‐Positioning Cap
Z‐Positioning Nut
Torch positioning tool
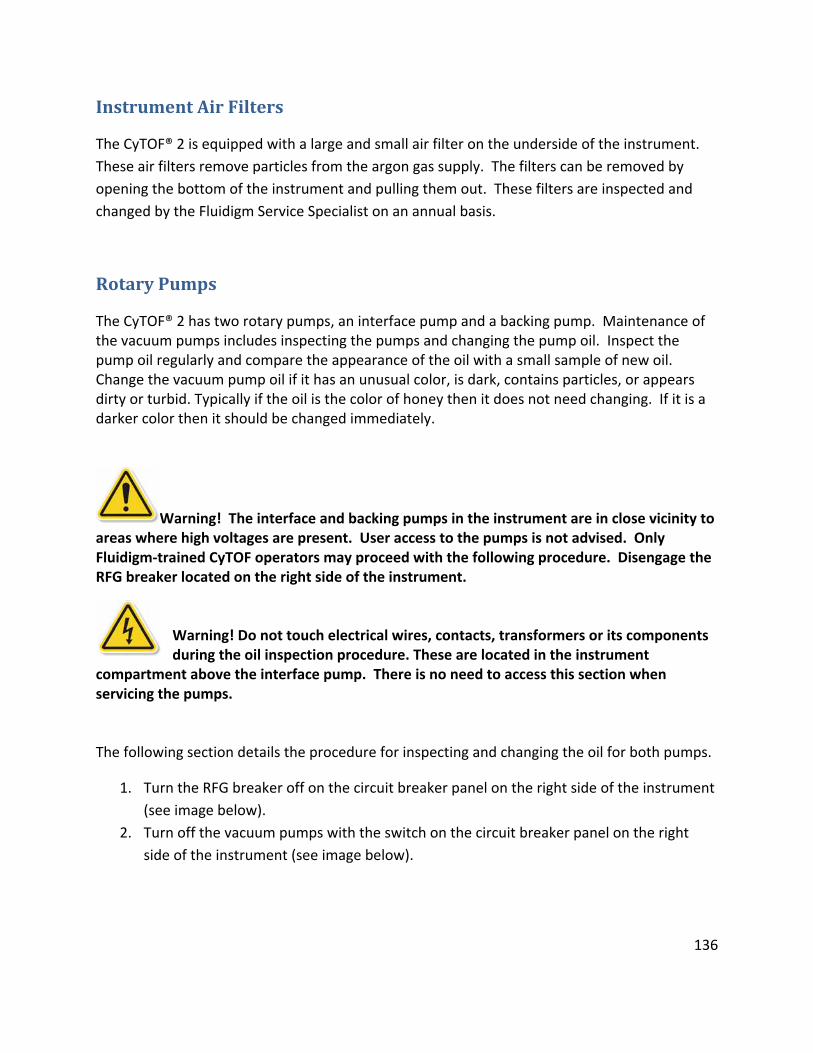
136
InstrumentAirFilters
The CyTOF® 2 is equipped with a large and small air filter on the underside of the instrument.
These air filters remove particles from the argon gas supply. The filters can be removed by
opening the bottom of the instrument and pulling them out. These filters are inspected and
changed by the Fluidigm Service Specialist on an annual basis.
RotaryPumps
The CyTOF® 2 has two rotary pumps, an interface pump and a backing pump. Maintenance of the vacuum pumps includes inspecting the pumps and changing the pump oil. Inspect the pump oil regularly and compare the appearance of the oil with a small sample of new oil. Change the vacuum pump oil if it has an unusual color, is dark, contains particles, or appears dirty or turbid. Typically if the oil is the color of honey then it does not need changing. If it is a darker color then it should be changed immediately.
Warning! The interface and backing pumps in the instrument are in close vicinity to areas where high voltages are present. User access to the pumps is not advised. Only Fluidigm‐trained CyTOF operators may proceed with the following procedure. Disengage the RFG breaker located on the right side of the instrument.
Warning! Do not touch electrical wires, contacts, transformers or its components during the oil inspection procedure. These are located in the instrument
compartment above the interface pump. There is no need to access this section when servicing the pumps.
The following section details the procedure for inspecting and changing the oil for both pumps.
1. Turn the RFG breaker off on the circuit breaker panel on the right side of the instrument
(see image below).
2. Turn off the vacuum pumps with the switch on the circuit breaker panel on the right
side of the instrument (see image below).
137
3. Remove the nebulizer and place in deionized water.
4. Detach the nebulizer line from the heater bulkhead by loosening the blue nut
connecting the nebulizer gas line to the side arm.
5. Remove the tubing from the carrier fluid reservoir and drain vessel, and place the
bottles away from the front access door.
6. Insert the handle into the front of the instrument. Open the front access door by
approximately 6 inches by turning the door handle counter clockwise.
Vacuum Pump Switch
RFG Test Button
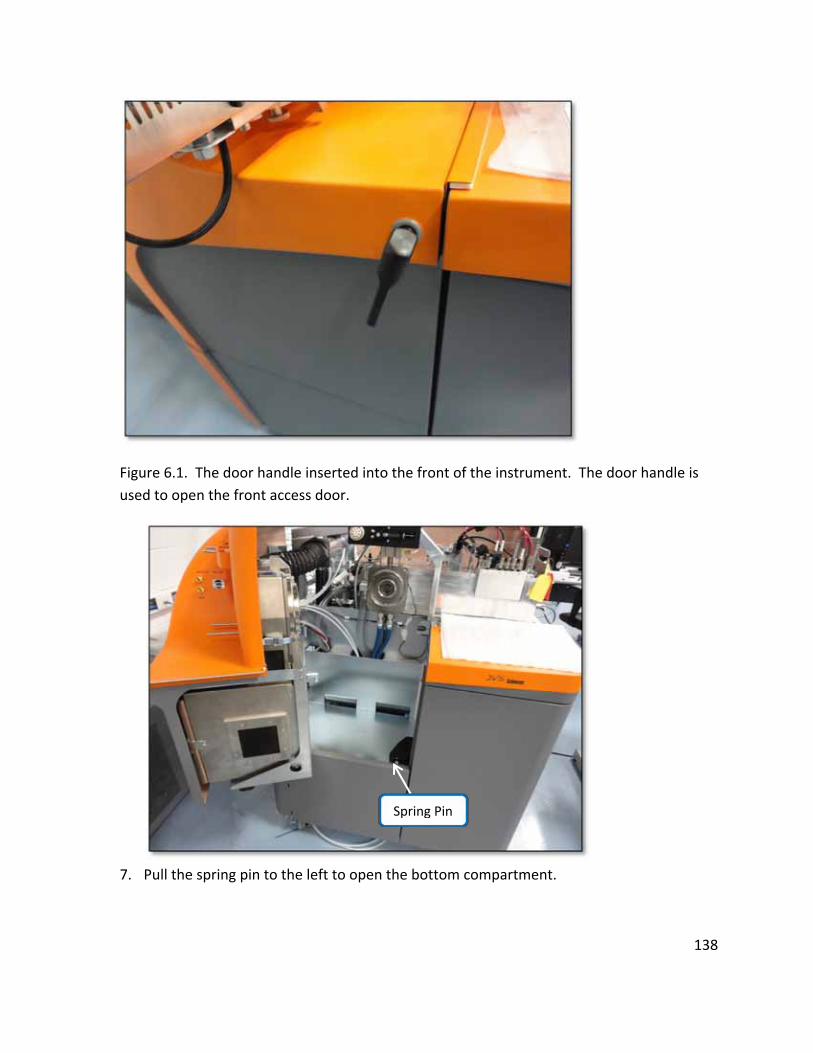
138
Figure 6.1. The door handle inserted into the front of the instrument. The door handle is
used to open the front access door.
7. Pull the spring pin to the left to open the bottom compartment.
Spring Pin
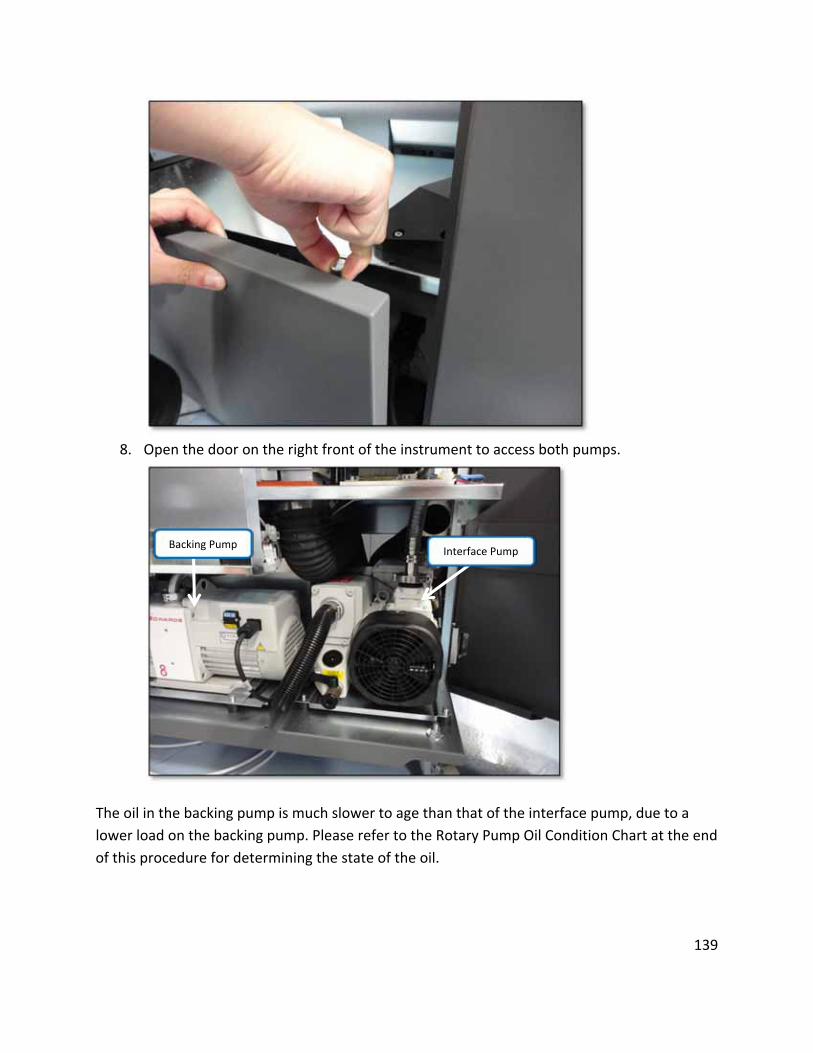
139
8. Open the door on the right front of the instrument to access both pumps.
The oil in the backing pump is much slower to age than that of the interface pump, due to a
lower load on the backing pump. Please refer to the Rotary Pump Oil Condition Chart at the end
of this procedure for determining the state of the oil.
Interface PumpBacking Pump
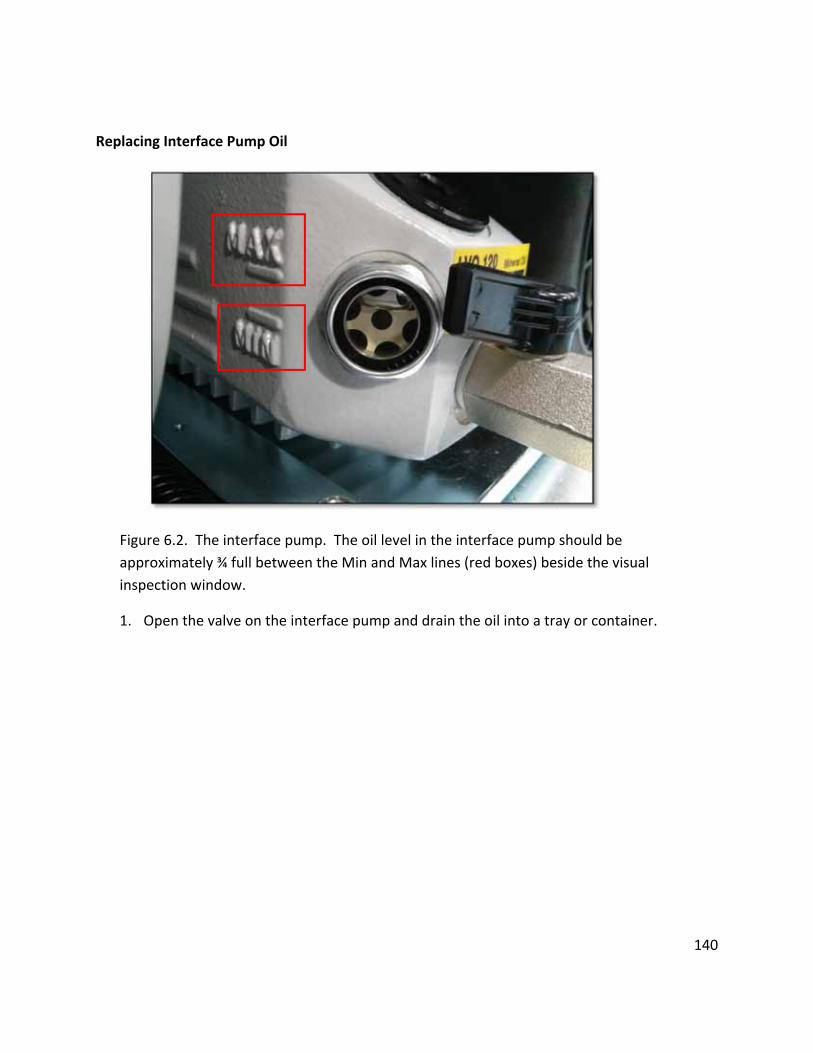
140
Replacing Interface Pump Oil
Figure 6.2. The interface pump. The oil level in the interface pump should be
approximately ¾ full between the Min and Max lines (red boxes) beside the visual
inspection window.
1. Open the valve on the interface pump and drain the oil into a tray or container.
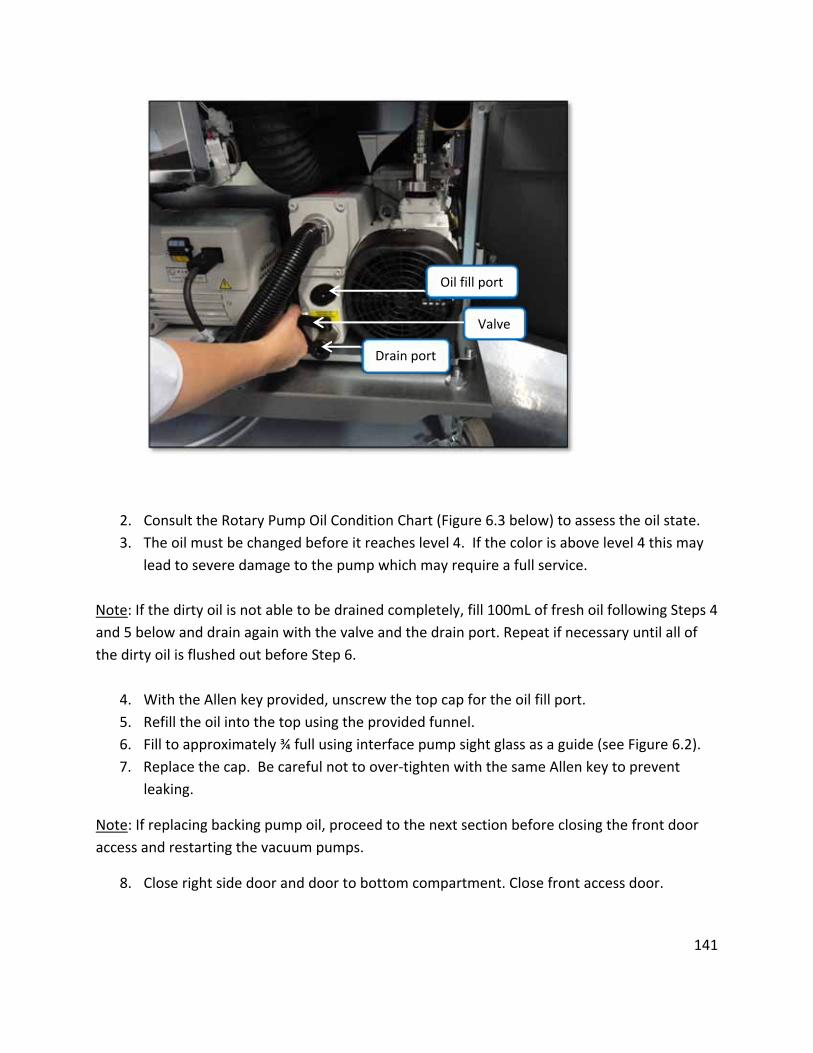
141
2. Consult the Rotary Pump Oil Condition Chart (Figure 6.3 below) to assess the oil state.
3. The oil must be changed before it reaches level 4. If the color is above level 4 this may
lead to severe damage to the pump which may require a full service.
Note: If the dirty oil is not able to be drained completely, fill 100mL of fresh oil following Steps 4
and 5 below and drain again with the valve and the drain port. Repeat if necessary until all of
the dirty oil is flushed out before Step 6.
4. With the Allen key provided, unscrew the top cap for the oil fill port.
5. Refill the oil into the top using the provided funnel.
6. Fill to approximately ¾ full using interface pump sight glass as a guide (see Figure 6.2).
7. Replace the cap. Be careful not to over‐tighten with the same Allen key to prevent
leaking.
Note: If replacing backing pump oil, proceed to the next section before closing the front door
access and restarting the vacuum pumps.
8. Close right side door and door to bottom compartment. Close front access door.
Valve
Drain port
Oil fill port
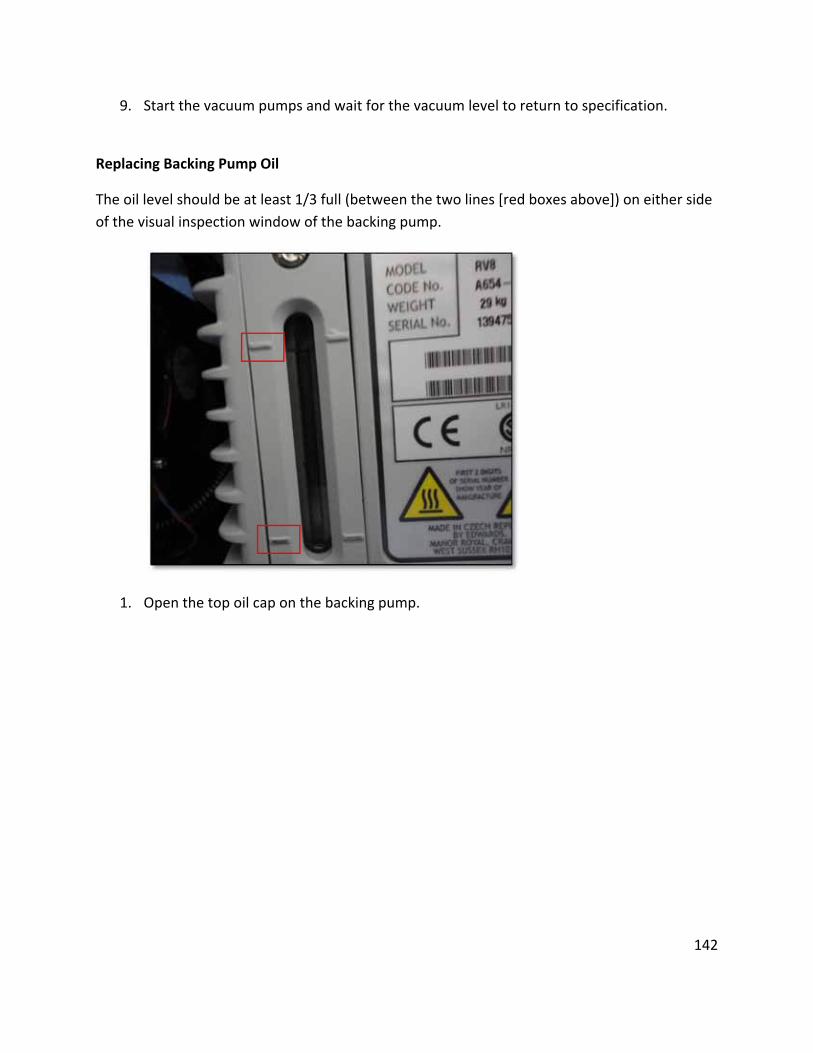
142
9. Start the vacuum pumps and wait for the vacuum level to return to specification.
Replacing Backing Pump Oil
The oil level should be at least 1/3 full (between the two lines [red boxes above]) on either side
of the visual inspection window of the backing pump.
1. Open the top oil cap on the backing pump.
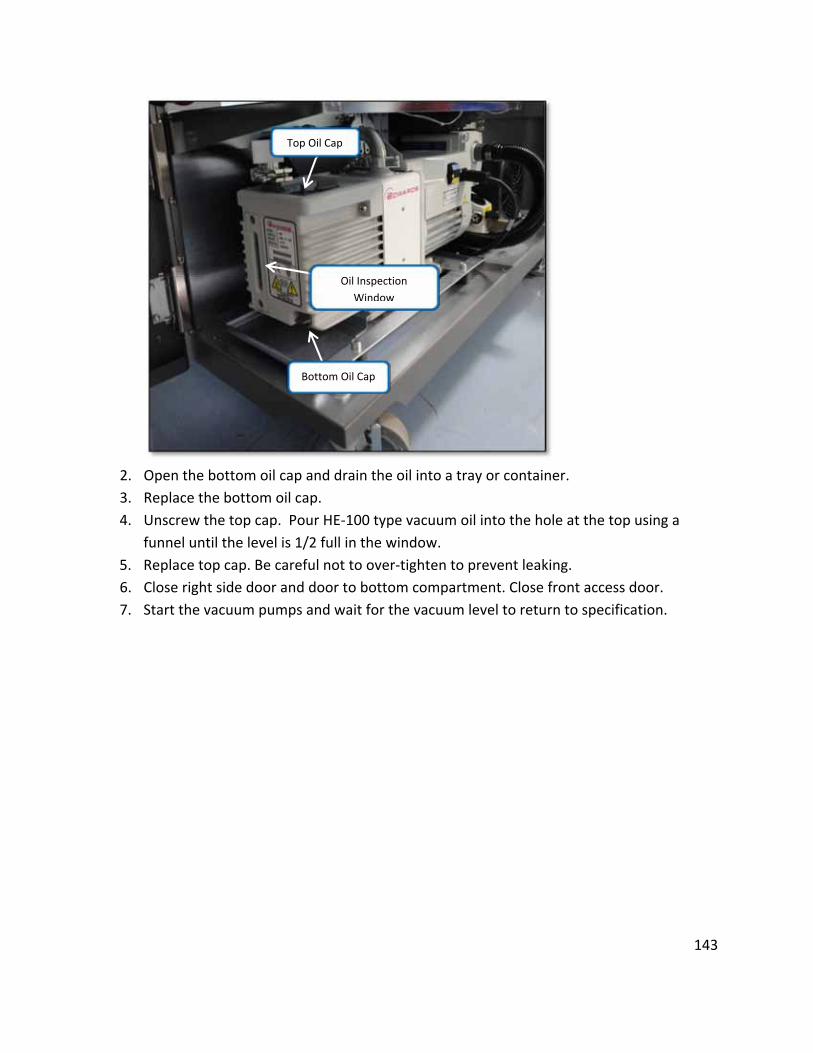
143
2. Open the bottom oil cap and drain the oil into a tray or container.
3. Replace the bottom oil cap.
4. Unscrew the top cap. Pour HE‐100 type vacuum oil into the hole at the top using a
funnel until the level is 1/2 full in the window.
5. Replace top cap. Be careful not to over‐tighten to prevent leaking.
6. Close right side door and door to bottom compartment. Close front access door.
7. Start the vacuum pumps and wait for the vacuum level to return to specification.
Bottom Oil Cap
Top Oil Cap
Oil Inspection
Window
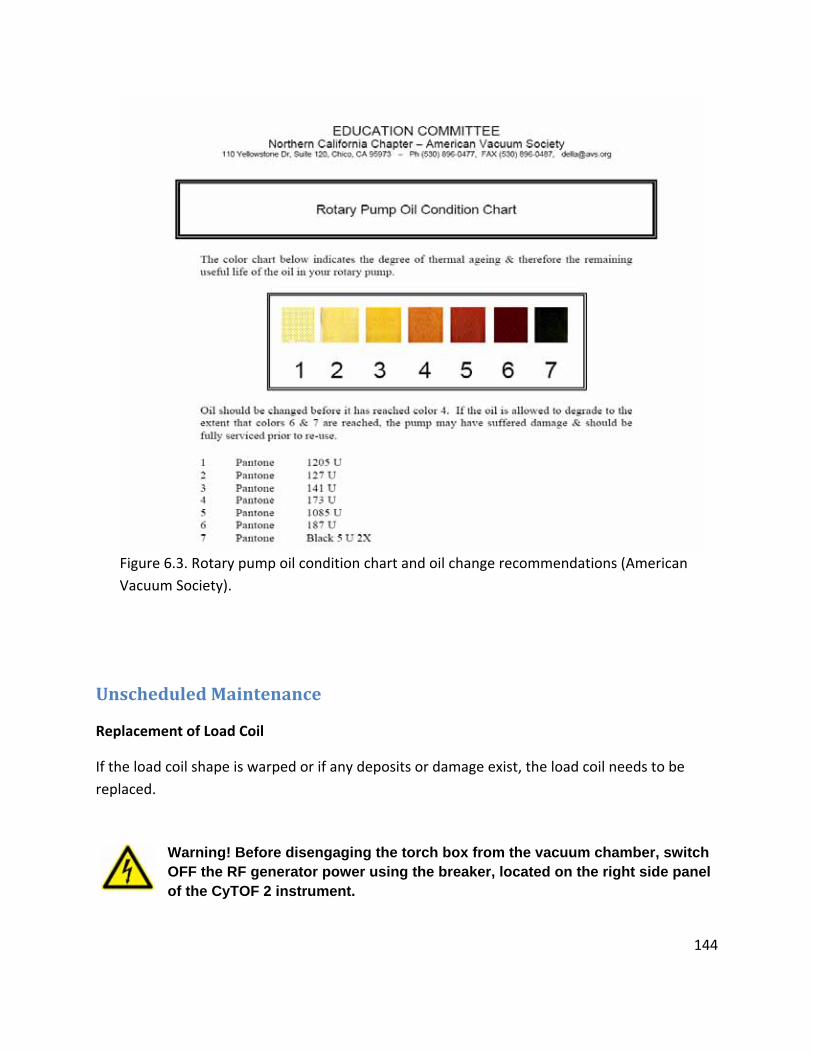
144
Figure 6.3. Rotary pump oil condition chart and oil change recommendations (American
Vacuum Society).
UnscheduledMaintenance
Replacement of Load Coil
If the load coil shape is warped or if any deposits or damage exist, the load coil needs to be
replaced.
Warning! Before disengaging the torch box from the vacuum chamber, switch OFF the RF generator power using the breaker, located on the right side panel of the CyTOF 2 instrument.
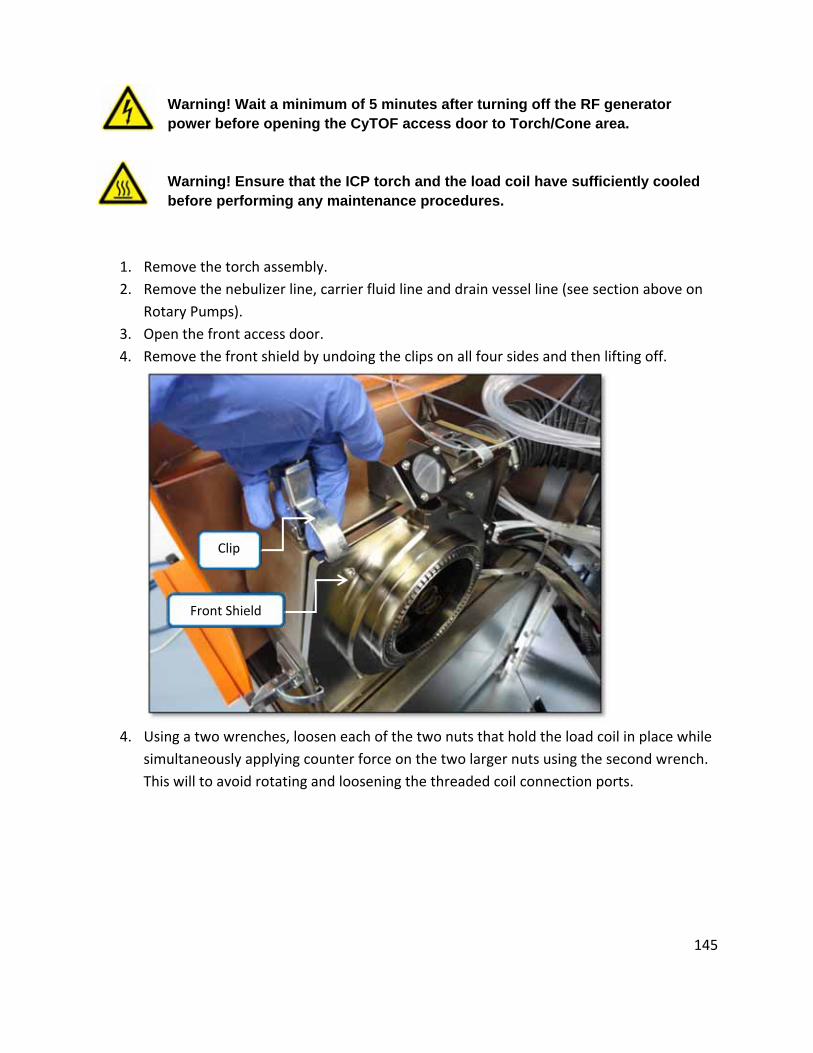
145
Warning! Wait a minimum of 5 minutes after turning off the RF generator power before opening the CyTOF access door to Torch/Cone area.
Warning! Ensure that the ICP torch and the load coil have sufficiently cooled before performing any maintenance procedures.
1. Remove the torch assembly.
2. Remove the nebulizer line, carrier fluid line and drain vessel line (see section above on
Rotary Pumps).
3. Open the front access door.
4. Remove the front shield by undoing the clips on all four sides and then lifting off.
4. Using a two wrenches, loosen each of the two nuts that hold the load coil in place while
simultaneously applying counter force on the two larger nuts using the second wrench.
This will to avoid rotating and loosening the threaded coil connection ports.
Front Shield
Clip
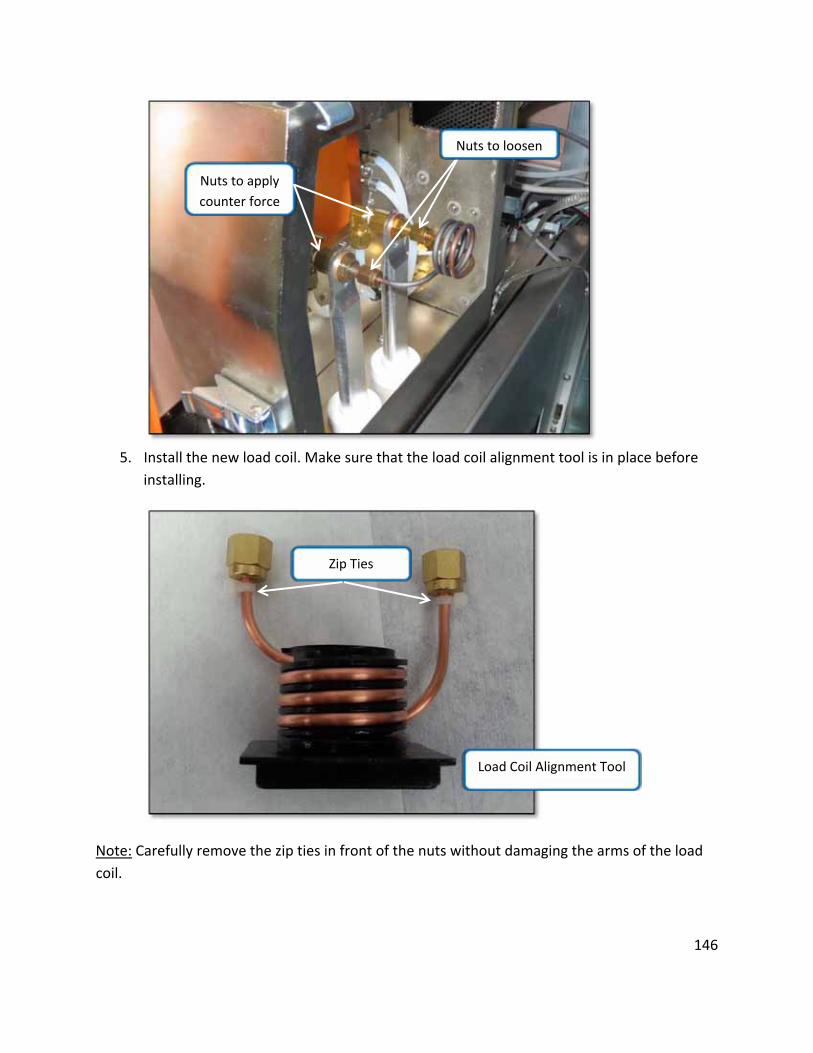
146
5. Install the new load coil. Make sure that the load coil alignment tool is in place before
installing.
Note: Carefully remove the zip ties in front of the nuts without damaging the arms of the load
coil.
Nuts to loosen
Nuts to apply
counter force
Zip Ties
Load Coil Alignment Tool
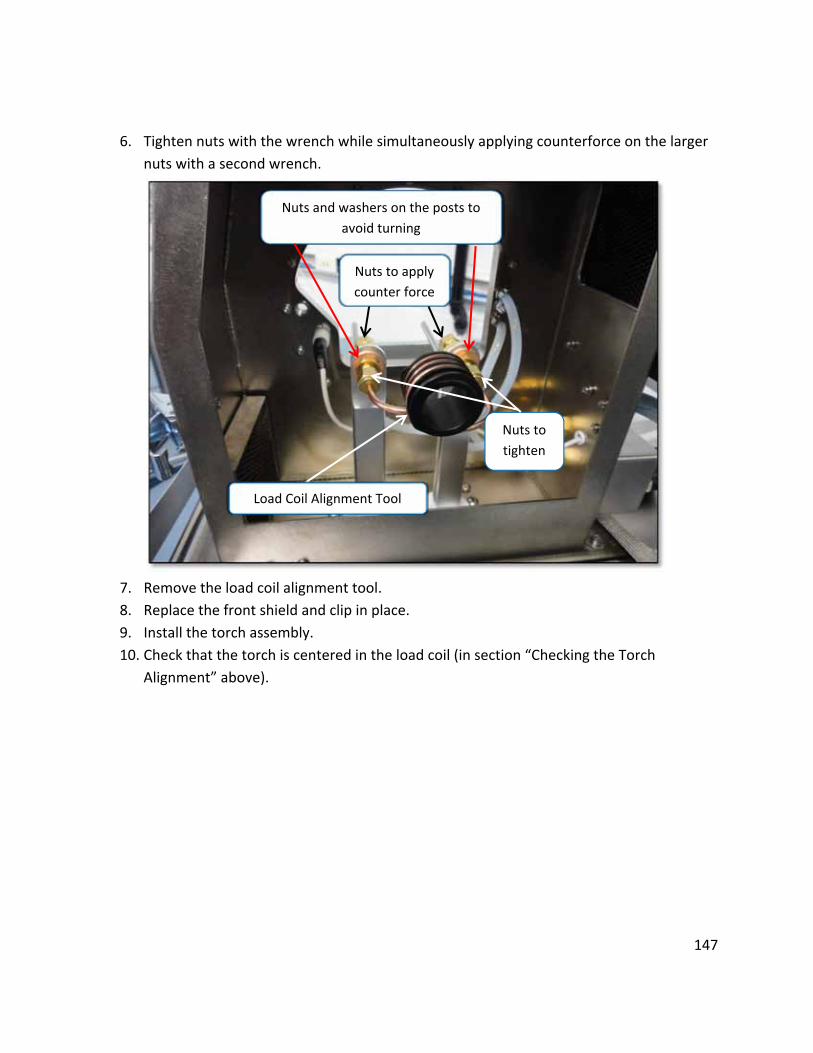
147
6. Tighten nuts with the wrench while simultaneously applying counterforce on the larger
nuts with a second wrench.
7. Remove the load coil alignment tool.
8. Replace the front shield and clip in place.
9. Install the torch assembly.
10. Check that the torch is centered in the load coil (in section “Checking the Torch
Alignment” above).
Nuts and washers on the posts to
avoid turning
Nuts to
tighten
Load Coil Alignment Tool
Nuts to apply
counter force
148
ProcedureforExpectedPowerOutages
When a power outage is scheduled for the facility, the CyTOF ®2 instrument needs to be properly shut down. Follow the steps below to shut down prior to the power outage and restart after power is restored.
Note: The following procedures may also be used for shutting down and restarting the instrument for other purposes.
CyTOF®2 Shutdown Procedure
1. Ensure that the system is connected to the argon supply for the vacuum chamber to befilled with argon when vented.
2. Press the Vacuum switch OFF on the side panel on the right side of the instrumentabove the circuit breakers.
3. Wait 10 minutes for the turbo‐pumps to gradually slow down. At this point, the ventingvalve opens and the chamber is slowly being filled with argon at a controlled pressure.
4. Shut off the instrument power by switching off the circuit breakers in the followingorder: AC Outlets, Backing Pump, RF Generator and System.
5. Leave argon supply on during shutdown if you plan to restart the CyTOF®2 immediately.
CyTOF®2 Startup Procedure
1. If argon supply is on during the instrument shutdown, proceed to the next step.Otherwise, turn on argon gas supply for 2 hours before restarting the instrument. Thiswill help with achieving the necessary vacuum levels.
2. Switch ON the circuit breakers in the following sequence: System, RF Generator,Backing Pump and AC Outlets.
3. Press the Vacuum ON switch. In the Status Panel on the instrument cover VG1 will turn
green, followed by TP1 and TP2 in approximately 6 minutes, and finally VG2 will turngreen in approximately 30 minutes.
4. Check in the monitor window to ensure the required vacuum levels are reached:
VGauge1a below 1E‐6 Torr and VGauge2a within the 1E‐4 Torr range before plasmastart. See image below.
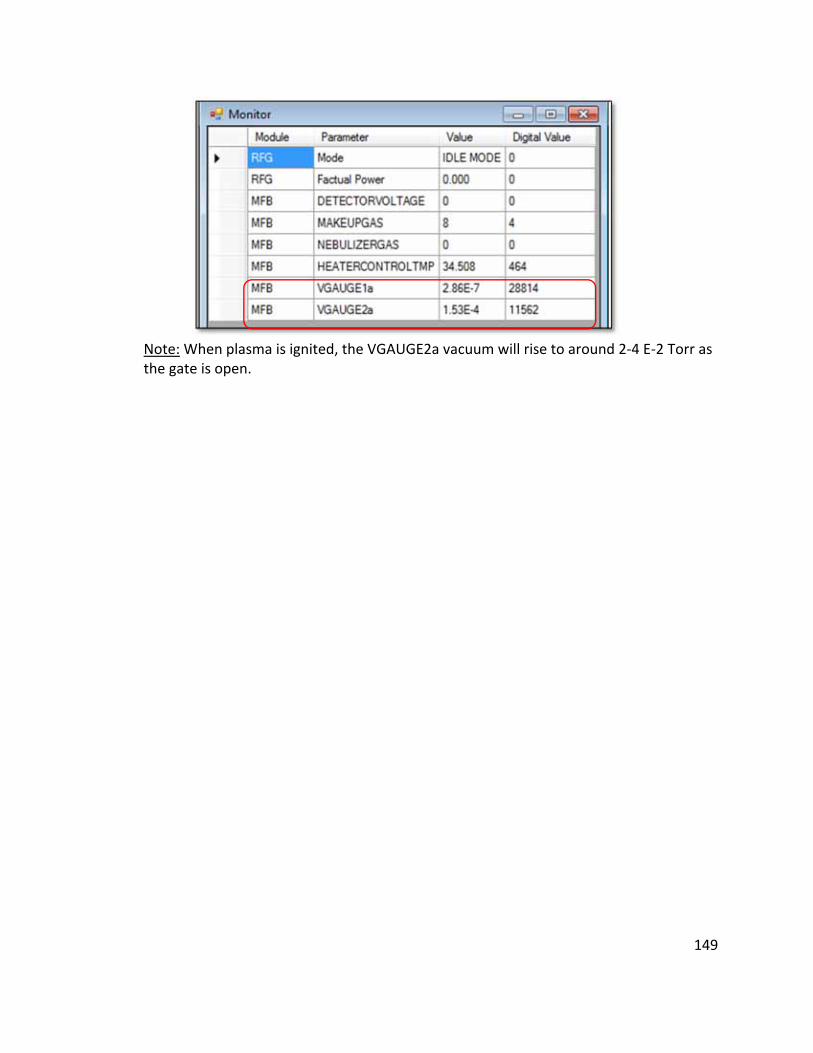
149
Note: When plasma is ignited, the VGAUGE2a vacuum will rise to around 2‐4 E‐2 Torr as the gate is open.
150
ICP-MASS SPECTROMETRY Chapter 7 Safety
Introduction
This document describes general practices designed to aid you in safely operating the CyTOF®2 and its accessories.
This advice is intended to supplement, not supersede, the normal safety codes in your country. The information provided does not cover every safety procedure that should be practiced. Ultimately, maintenance of a safe laboratory environment is the responsibility of the operator and the operator’s organization.
Please review all manuals supplied with the CyTOF®2 and accessories before you start working with the instrument to prevent personal injury or damage to the instrumentation. Carefully read the safety information in this chapter and in the other manuals supplied. When setting up the instrument or performing analyses or maintenance procedures, strictly follow the instructions provided.
Safety Alert Conventions
This guide uses specific conventions for presenting information that may require your attention. Refer to the following safety alert conventions.
Safety Alerts for Chemicals
Fluidigm follows the United Nations Globally Harmonized System of Classification and Labelling of Chemicals (GHS) for communicating chemical hazard information. GHS provides a common means of classifying chemical hazards and a standardized approach to chemical label elements and safety data sheets (SDSs). Key elements include:
• Pictograms that consist of a symbol on a white background within a red diamond-shaped frame. Refer to the individual SDS for the applicable pictograms and warningspertaining to the chemicals being used.
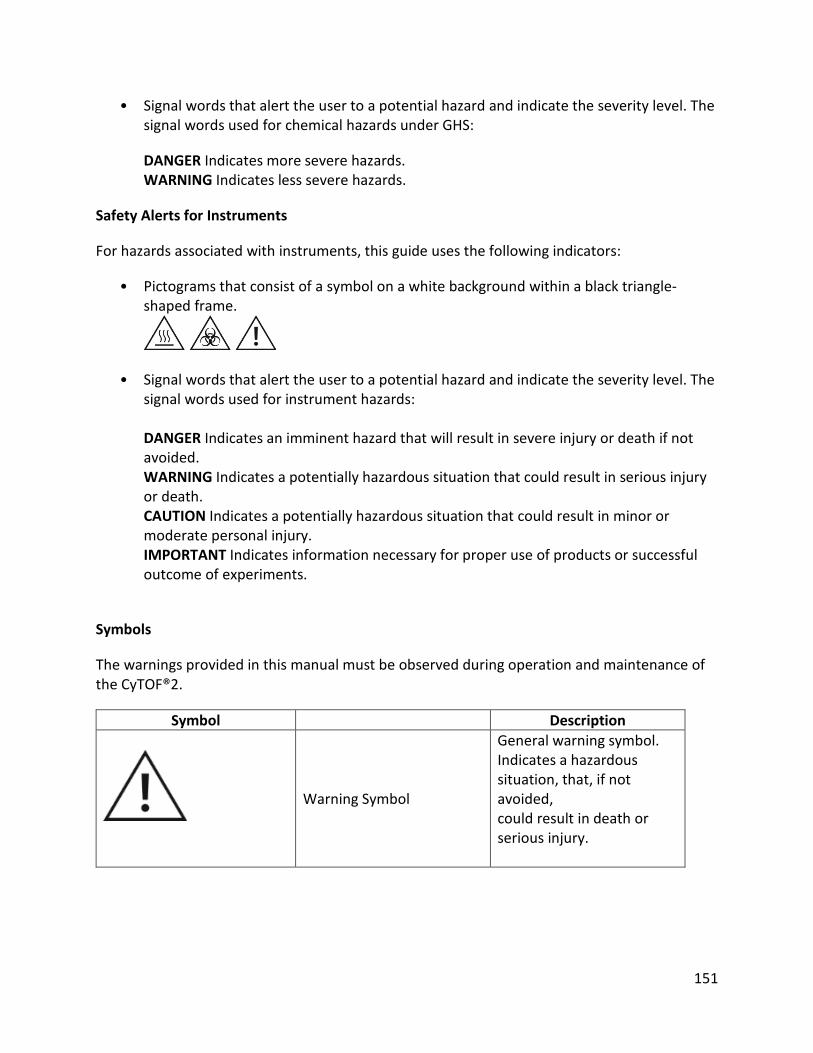
151
• Signal words that alert the user to a potential hazard and indicate the severity level. Thesignal words used for chemical hazards under GHS:
DANGER Indicates more severe hazards.WARNING Indicates less severe hazards.
Safety Alerts for Instruments
For hazards associated with instruments, this guide uses the following indicators:
• Pictograms that consist of a symbol on a white background within a black triangle-shaped frame.
• Signal words that alert the user to a potential hazard and indicate the severity level. Thesignal words used for instrument hazards:
DANGER Indicates an imminent hazard that will result in severe injury or death if notavoided.WARNING Indicates a potentially hazardous situation that could result in serious injuryor death.CAUTION Indicates a potentially hazardous situation that could result in minor ormoderate personal injury.IMPORTANT Indicates information necessary for proper use of products or successfuloutcome of experiments.
Symbols
The warnings provided in this manual must be observed during operation and maintenance of the CyTOF®2.
Symbol Description
Warning Symbol
General warning symbol. Indicates a hazardous situation, that, if not avoided, could result in death or serious injury.
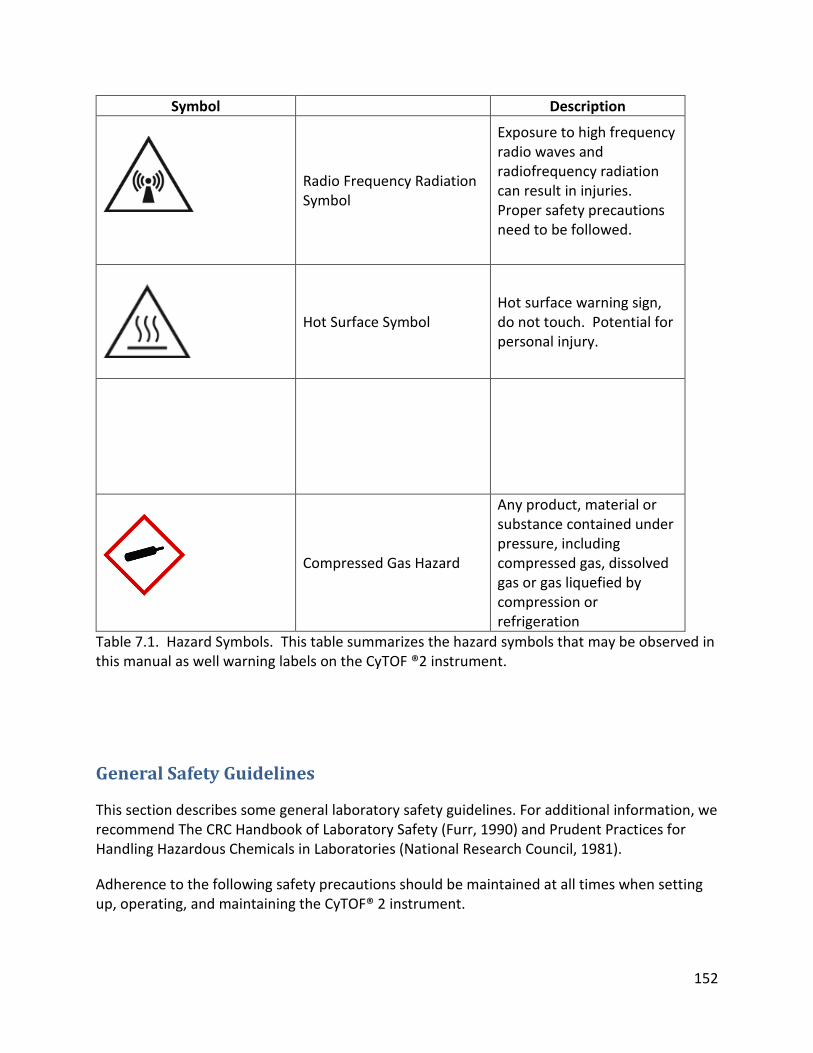
152
Symbol Description
Radio Frequency Radiation Symbol
Exposure to high frequency radio waves and radiofrequency radiation can result in injuries. Proper safety precautions need to be followed.
Hot Surface Symbol Hot surface warning sign, do not touch. Potential for personal injury.
Compressed Gas Hazard
Any product, material or substance contained under pressure, including compressed gas, dissolved gas or gas liquefied by compression or refrigeration
Table 7.1. Hazard Symbols. This table summarizes the hazard symbols that may be observed in this manual as well warning labels on the CyTOF ®2 instrument.
General Safety Guidelines
This section describes some general laboratory safety guidelines. For additional information, we recommend The CRC Handbook of Laboratory Safety (Furr, 1990) and Prudent Practices for Handling Hazardous Chemicals in Laboratories (National Research Council, 1981).
Adherence to the following safety precautions should be maintained at all times when setting up, operating, and maintaining the CyTOF® 2 instrument.
153
• ICP-based instruments generate high levels of radio frequency energy within the RF powersupply and the torch box. The RF energy is potentially hazardous if allowed to escape.Safety devices and safety interlocks should not be bypassed or disconnected.
• The power supplies of the CyTOF® 2 instrument are capable of generating potentially lethalvoltages. Store the removable instrument handle separately from the instrument. Nomaintenance should be performed by anyone other than a Fluidigm Service Specialist or bythe customer's own Fluidigm-trained and appropriately certified maintenance personnel.
• Do not allow smoking in the work area. Smoking is a source of significant contamination aswell as a potential route for ingesting harmful chemicals
• When installing or moving the instrument contact a Fluidigm Service Specialist forassistance. The total weight of the instrument is 295 kg (650 lbs).
• Food should not be stored, handled, or consumed in the work area.
Environmental Conditions
Refer to the “Chapter 2: Preparing Your Laboratory for the CyTOF ®2 Mass Cytometer” guide for the recommended environmental conditions.
Laboratory Ventilation
Toxic combustion products, metal vapor, and ozone can be generated by the CyTOF instrument, depending upon the type of analysis. Therefore, an efficient ventilation system must be provided for your instrument. When the plasma is on, hot gases are vented through two exhaust vents located at the back of the instrument. Detailed information on exhaust vents are described in the “Preparing Your Laboratory for the CyTOF® 2 Mass Cytometer” guide.
Warning! The use of CyTOF instruments without adequate ventilation to outside air may constitute a health hazard. Extreme care should be taken to vent exhaust gases properly.
Warning! The CyTOF instrument is designed for analysis of fixed/permealized, non-live cells only. Under normal operation, cells are completely combusted in the ICP. High levels of UV radiation inside the torch box are significantly above the lethal levels for most of single airborne cells. However, in the event of plasma shutdown, the undigested portion of a sample can enter the torch box exhaust gases. Extreme care should be taken to vent exhaust gases properly.

154
The CyTOF series products have been designed to protect the operator from potential electrical hazards. The following section describes recommended electrical safety guidelines.
Symbols Title Description
Electric Shock Hazard Symbol
This sign indicates high electricity, electric shock. Electrical machines and/or equipment in the vicinity. You may suffer severe injuries or even death.
Earth-Ground Symbol
The earth-ground symbol represents the any terminal which is intended for connection to an external conductor for protection against electric shock or the terminal of a protective earth.
Table 7.2. Electrical Hazard Symbols. This table represents the symbols you will see on the CyTOF ®2 instrument and its accessories.
Water lines should be located away from electrical connections. Condensation and potential leaks may create an unsafe environment in the proximity of electrical connections
• When the instrument is connected to line power, opening instrument covers is likely toexpose live parts.
• High voltages can still be present even when the power switch is in the off position.• Disengage the circuit breakers before performing any service or maintenance on the
cones or torch.
Warning! If this equipment is used in a manner not specified by Fluidigm Corporation the protection provided by the equipment may be compromised.
Warning! Lethal voltages are present at certain areas within the instrument. Installation and internal maintenance of the instrument should be performed only by a Fluidigm Service Specialist or similarly authorized and trained by Fluidigm personal.
Electrical Safety
155
• Capacitors inside the instrument may still be charged even if the instrument has beendisconnected from all voltage sources.
• The instrument must be correctly connected to a suitable electrical supply (see Chapter2: Preparing your Laboratory for the CyTOF ®2 Mass Cytometer for further details).
• For 50 Hz installations, a means of electrically grounding the instrument must beavailable.
• The power supply must have a correctly installed protective conductor (earth-ground)and must be installed or checked by a qualified electrician before connecting theinstrument.
• Connect the instrument to a correctly installed line power outlet that has a protectiveconductor connection (earth-ground).
• Do not operate the instrument with any covers or internal parts removed.Do not attempt to make internal adjustments or replacements except as directed in theuser manual.
• Disconnect the instrument from all voltage sources before opening it for anyadjustment, replacement, maintenance, or repair.
Warning! Before performing maintenance on the cones or torch, switch OFF the RF generator power using the breaker, located at the right rear of the CyTOF2 instrument. Wait at least 5 minutes for residual electrical charge to dissipate. Additional time is required to allow the ICP torch, cones and the load coil to reach room
Warning! Any interruption of the protective conductor (earth-ground) inside or outside the instrument or disconnection of the protective conductor terminal is likely to make the instrument dangerous.
Warning! The interface and backing pumps in the instrument are in close vicinity to areas where high voltages are present. User access to the pumps is not advised. Only qualified service personnel may proceed with the inspection.
156
• Use only fuses with the required current rating and of the specified type forreplacement.
• Do not use makeshift fuses or short-circuit the fuse holders.• If there are any signs that the instrument is no longer electrically safe for use, make the
instrument inoperative and secure it, with a lockout, against any unauthorized orunintentional operation. The electrical safety of the instrument is likely to becompromised if the instrument:
o Shows visible damageo Has been subjected to prolonged storage under unfavorable conditionso Has been subjected to severe stress during transportation.
Warning! The radio frequency (RF) power supply driving the plasma torch provides up to 1.6 kW. The resulting voltages may cause extensive burns - even death. Under no circumstances should you attempt any physical adjustments of the plasma torch when it is operating. The instrument must be operated with the RF generator in the locked position at all times.
Warning! Do not attempt to defeat the safety interlocks. This would place the operator’s safety at risk. All interlocks must be engaged before you ignite the plasma.
Warning! Do not touch electrical wires, contacts, transformers or its components during the oil inspection procedure. 240V AC is present on the terminals of the transformer located in a separate section of the instrument above the interface pump. There is no need to access this
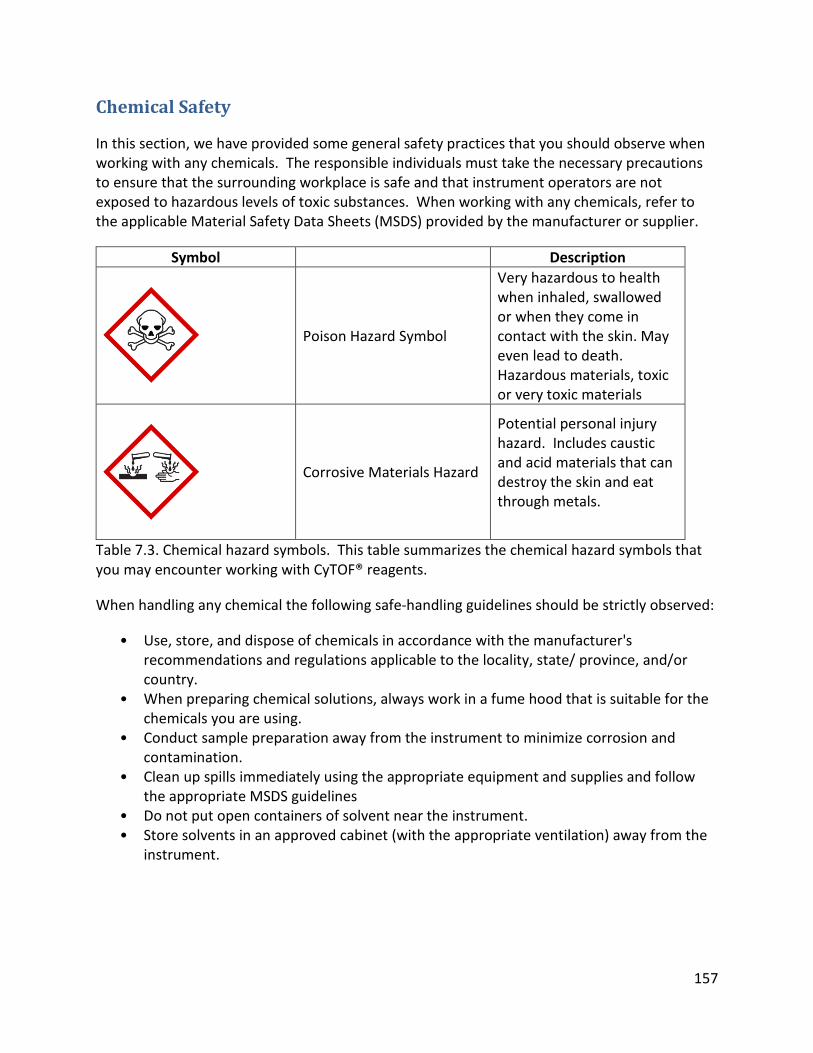
157
Chemical Safety
In this section, we have provided some general safety practices that you should observe when working with any chemicals. The responsible individuals must take the necessary precautions to ensure that the surrounding workplace is safe and that instrument operators are not exposed to hazardous levels of toxic substances. When working with any chemicals, refer to the applicable Material Safety Data Sheets (MSDS) provided by the manufacturer or supplier.
Symbol Description
Poison Hazard Symbol
Very hazardous to health when inhaled, swallowed or when they come in contact with the skin. May even lead to death. Hazardous materials, toxic or very toxic materials
Corrosive Materials Hazard
Potential personal injury hazard. Includes caustic and acid materials that can destroy the skin and eat through metals.
Table 7.3. Chemical hazard symbols. This table summarizes the chemical hazard symbols that you may encounter working with CyTOF® reagents.
When handling any chemical the following safe-handling guidelines should be strictly observed:
• Use, store, and dispose of chemicals in accordance with the manufacturer'srecommendations and regulations applicable to the locality, state/ province, and/orcountry.
• When preparing chemical solutions, always work in a fume hood that is suitable for thechemicals you are using.
• Conduct sample preparation away from the instrument to minimize corrosion andcontamination.
• Clean up spills immediately using the appropriate equipment and supplies and followthe appropriate MSDS guidelines
• Do not put open containers of solvent near the instrument.• Store solvents in an approved cabinet (with the appropriate ventilation) away from the
instrument.

158
• Wear the appropriate personal protective equipment (PPE) at all times while handlingchemicals. Use safety glasses (with side shields), goggles, or full-face shields, accordingto the types of chemicals you will be handling.
Drain Vessel
A drain vessel is supplied with the CyTOF®2 instrument. The vessel is made of HDPE and is used to gather the effluent from the Flow Injection Valve of the sample introduction system. For safe operation of your system, you should properly install and maintain the drain vessel and drain tubing. Waste disposal procedures must be in accordance with all national, state/provincial and local health and safety regulations and laws. Drain vessels may contain flammable, acidic, caustic, or organic solutions, cells debris and small amounts of the elements analyzed.
Warning! Some chemicals used with this instrument may be hazardous or may become hazardous after completion of an analysis.
Warning! Venting for fumes and disposal of waste must be in accordance with all national, state/provincial and local health and safety regulations and laws.
Warning! Wear suitable protective clothing, including gloves specifically resistant to the chemicals being handled.
Warning! Wear protective clothing and gloves. Some reagents are readily absorbed through the skin.
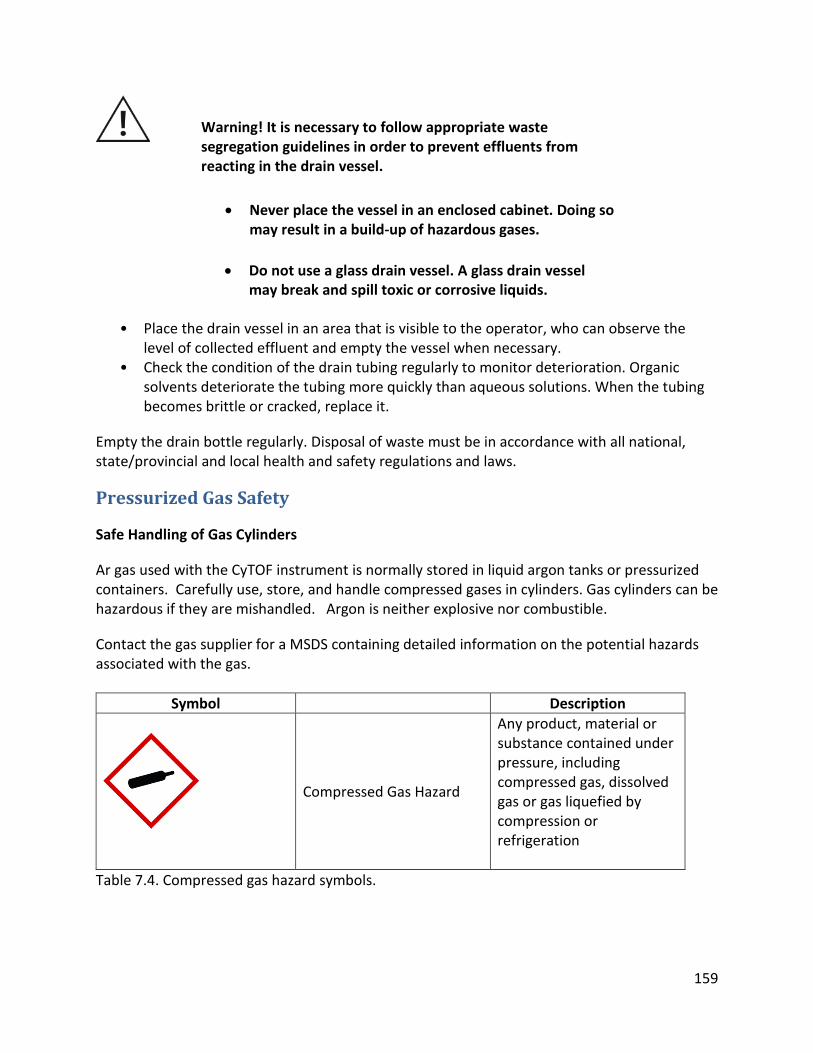
159
• Place the drain vessel in an area that is visible to the operator, who can observe thelevel of collected effluent and empty the vessel when necessary.
• Check the condition of the drain tubing regularly to monitor deterioration. Organicsolvents deteriorate the tubing more quickly than aqueous solutions. When the tubingbecomes brittle or cracked, replace it.
Empty the drain bottle regularly. Disposal of waste must be in accordance with all national, state/provincial and local health and safety regulations and laws.
Pressurized Gas Safety
Safe Handling of Gas Cylinders
Ar gas used with the CyTOF instrument is normally stored in liquid argon tanks or pressurized containers. Carefully use, store, and handle compressed gases in cylinders. Gas cylinders can be hazardous if they are mishandled. Argon is neither explosive nor combustible.
Contact the gas supplier for a MSDS containing detailed information on the potential hazards associated with the gas.
Symbol Description
Compressed Gas Hazard
Any product, material or substance contained under pressure, including compressed gas, dissolved gas or gas liquefied by compression or refrigeration
Table 7.4. Compressed gas hazard symbols.
• Never place the vessel in an enclosed cabinet. Doing somay result in a build-up of hazardous gases.
• Do not use a glass drain vessel. A glass drain vesselmay break and spill toxic or corrosive liquids.
Warning! It is necessary to follow appropriate waste segregation guidelines in order to prevent effluents from reacting in the drain vessel.
160
The following hazards are associated with pressurized containers of argon:
• Muscle strain
• Physical injury (i.e., from a bottle falling)
• Suffocation
The following are some general safety practices for the proper identification, storage, and handling of gas cylinders.
Legibly mark cylinders to identify their contents. Use the chemical name or commercially accepted name for the gas. In North America, as in most countries, all chemical or gas storage containers must be identified by means of approved labels (i.e., WHMIS labels).
Note: See the Preparing Your Laboratory for the CyTOF ®2 Mass Cytometer guide for detailed information on the correct storage of gas cylinders.
Handling Cylinders
• Move cylinders with a suitable hand truck after ensuring that the container cap issecured and the cylinder properly fastened to the hand truck.
• Never roll or drag a compressed gas cylinder. Use a wheel cart.• Always use a stand or safety strap while using or storing a cylinder.• Replace the protective cap on the valve when the cylinder is not in use. Use only
regulators, tubing, and hose connectors specifically approved by an appropriateregulatory agency to be used with the gas in the cylinder.
• Never lubricate regulators or fittings.
Warning! If liquid argon is used, the gas cylinder must be fitted with an overpressure regulator, which will vent the cylinder as necessary to prevent it from becoming a safety hazard.
Warning! Do not use electronic pressure regulator and auto switching valves as they may affect the plasma stability and may also result in frequent loss of plasma.
161
• Do not force caps off with tools. If stuck, contact the supplier.• Arrange gas hoses where they will not be damaged or stepped on, and where objects
will not be dropped on them.• Do not refill gas cylinders. Check the condition of pipes, hoses, and connectors regularly.• Perform gas leak tests at all joints and seals of the gas system regularly, using an
approved gas leak detection solution.• Close all gas cylinder valves tightly at the cylinder when the equipment is turned off.
Liquid Argon Handling
Carefully inspect argon tanks prior to use
• Ensure that good ventilation is maintained in the laboratory space that will contain theliquid argon cylinders
• Cryogenic liquid cylinders contain a vacuum that helps to maintain the integrity of theliquid argon in the cylinder. This vacuum may become compromised if the followingsymptoms are observed:
o The outer vessel shows signs of frostingo The outer vessel sweats in humid conditionso The pressure relief valve opens continuously until the vessel is emptied
• Never lay or store the cylinder on its side. Cylinders should be stored in a verticalposition.
• Do not roll a cryogenic liquid cylinder.• Cylinders may be moved using a cart, overhead crane or hoist.
Sample Handling and Preparation
Sample preparation for the CyTOF ®2 may require the handling of organic or corrosive solutions. MAXPAR® reagents that are used with CyTOF instruments are supplied in a solution form. Please refer to the information supplied with MAXPAR reagent Material Safety Data Sheets (MSDS) for safe handling of the reagents.
Warning! It is recommended to install an Oxygen sensor in the room where the operator and gas storage are located.
Warning! Liquid argon in the cylinder is maintained at extremely low temperatures. Personal protective equipment including gloves, safety glasses and long sleeved clothing should be worn when operating the cylinder.
162
Other Hazards
Protection from Heat
Hot Surface Temperatures
Protection from Radio Frequency Radiation
Warning! For better control of contamination, dedicate laboratory reagents and consumables to use with CyTOF instrument and MAXPAR reagent only.
Warning! A safety interlock is used to automatically shut off the plasma if the chamber and interface are not fully coupled. Do not defeat the interlock. Do not remove the shield which protects the sample introduction system, the heat shield is designed to protect users from burns from the heater.
Warning! Radio Frequency Radiation: The instrument generates high levels of Radio Frequency (RF) energy, which is potentially hazardous if allowed to escape. The instrument is designed to contain the RF energy within the shielded enclosures of the torch compartment and the RF power supply. Safety interlocks prevent you from operating the system without all covers, doors, and shields in place.
Warning! The torch components, the interface and the sample introduction system components remain hot for some time after the plasma has been shut off. Allow sufficient time for these items to cool to room temperature before you handle them.

163
References
Furr, K., ed., CRC Handbook of Laboratory Safety, 3rd ed., The Chemical Rubber Co. Press, Florida, USA, 1990.
National Research Council, Prudent Practices for Handling Hazardous Chemicals in Laboratories, National Academy Press, Washington, D.C., USA, 1981.
Compressed Gas Association (USA), “Safe Handling of Compressed Gases in Containers,” pamphlet no. P-1, 11th ed. August 2008
Compressed Gas Association (USA), “The Inert Gases - Argon, Nitrogen and Helium,” pamphlet no. P-9, 4th ed. March 2008.
Material Safety Data Sheets (MSDS), USA; DIN-Sicherheitsdatenblaetter (genormte Formular DIN-Nr 52900), FRG; Product Information Sheets, UK.
Other sources of information include: OSHA: Occupational Safety and Health Administration (United States) ACGIH: American Conference of Governmental Industrial Hygienists (United States) COSHH: Control of Substances Hazardous to Health (United Kingdom).
Helrich, K., ed., Official Methods of Analysis, 15th ed., Association of Official Analytical Chemists, Inc., Arlington, VA, USA, 1990.
Bretherick, L., Bretherick’s Handbook of Reactive Chemical Hazards, 4th ed., Butterworth & Co., Ltd., London, UK, 1990.
Sax, N., ed., Dangerous Properties of Industrial Materials, 7th ed., Van Nostrand Reinhold, New York, USA, 1989.
Bretherick, L., ed., Hazards in the Chemical Laboratory, 3rd ed., Royal Society of Chemistry, London, UK, 1981.
Wald P. H. and Stave G. M., eds. Physical and Biological Hazards of the Workplace, 2nd ed., Wiley, 2001.
164
Chapter8TroubleshootingThe following table presents recommended solutions for symptoms you may encounter. If additional help is required, contact technical support at [email protected] or by phone +1‐855‐DVS‐CYTO (+1‐855‐387‐2986).
Symptom Possible Causes Recommended Solutions
Plasma does not ignite/ plasma flickers
RFG Circuit Breaker is switched off.
Switch the circuit breaker on.
Vacuum Levels are not achieved.
Check the “Monitor” window.
VGAUGE 1 must be <1E‐6 Torr and VGAUGE2 must be within the E‐4 Torr range (when plasma is not lit).
If these are not met, a shutdown and restart of the instrument is required. Refer to the Chapter 6: Maintenance for further details.
Argon pressure is incorrectly set/ there is not enough argon.
Verify and adjust argon pressure on tank to around 100psi and CyTOF regulator pressure behind the instrument to around 50 psi. Also check level of argon in the tank and replace tank if necessary.
Exhaust is out. If the “EXHAUST” LED light is off, it indicates that there may be a problem with the exhaust fan within the building.
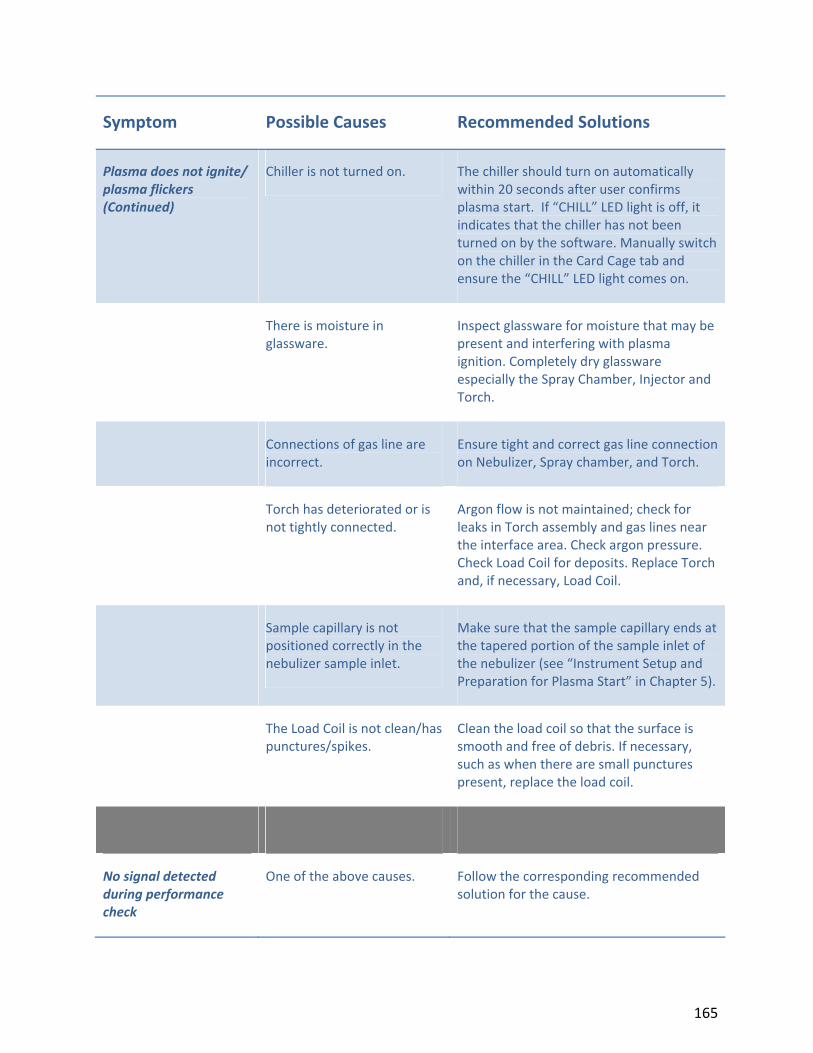
165
Symptom Possible Causes Recommended Solutions
Plasma does not ignite/ plasma flickers (Continued)
Chiller is not turned on. The chiller should turn on automatically within 20 seconds after user confirms plasma start. If “CHILL” LED light is off, it indicates that the chiller has not been turned on by the software. Manually switch on the chiller in the Card Cage tab and ensure the “CHILL” LED light comes on.
There is moisture in glassware.
Inspect glassware for moisture that may be present and interfering with plasma ignition. Completely dry glassware especially the Spray Chamber, Injector and Torch.
Connections of gas line are incorrect.
Ensure tight and correct gas line connection on Nebulizer, Spray chamber, and Torch.
Torch has deteriorated or is not tightly connected.
Argon flow is not maintained; check for leaks in Torch assembly and gas lines near the interface area. Check argon pressure. Check Load Coil for deposits. Replace Torch and, if necessary, Load Coil.
Sample capillary is not positioned correctly in the nebulizer sample inlet.
Make sure that the sample capillary ends at the tapered portion of the sample inlet of the nebulizer (see “Instrument Setup and Preparation for Plasma Start” in Chapter 5).
The Load Coil is not clean/has punctures/spikes.
Clean the load coil so that the surface is smooth and free of debris. If necessary, such as when there are small punctures present, replace the load coil.
No signal detected during performance check
One of the above causes. Follow the corresponding recommended solution for the cause.
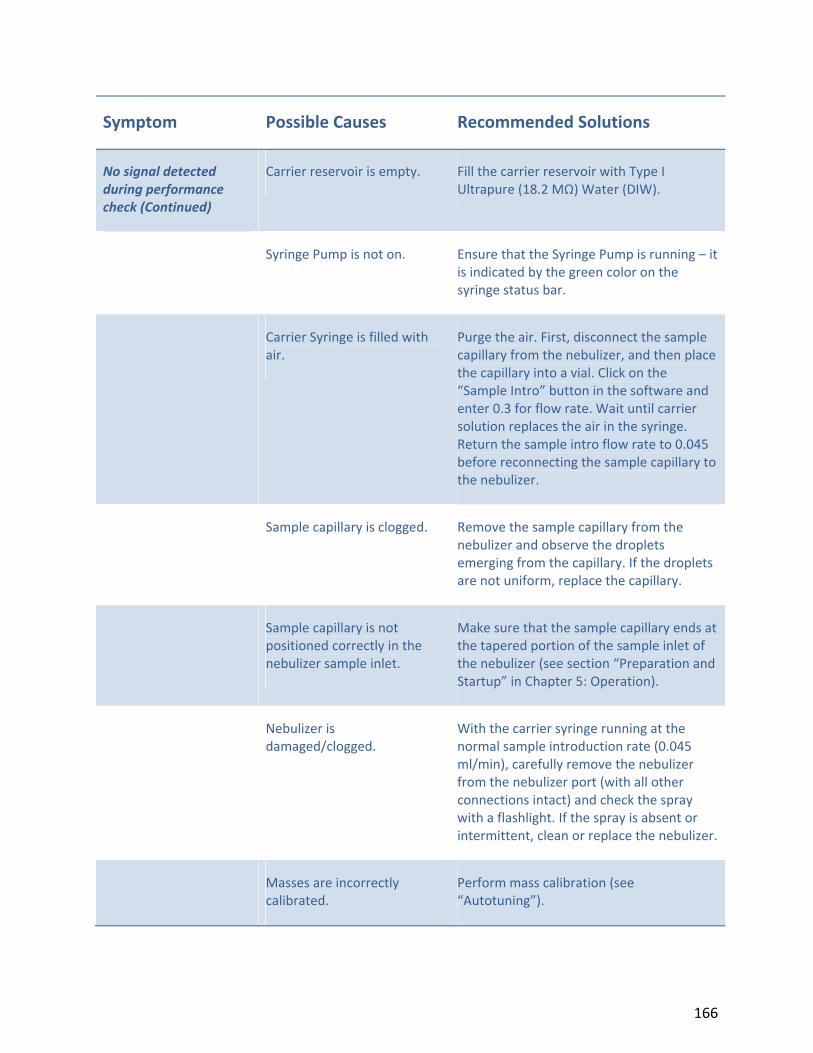
166
Symptom Possible Causes Recommended Solutions
No signal detected during performance check (Continued)
Carrier reservoir is empty. Fill the carrier reservoir with Type I Ultrapure (18.2 MΩ) Water (DIW).
Syringe Pump is not on. Ensure that the Syringe Pump is running – it is indicated by the green color on the syringe status bar.
Carrier Syringe is filled with air.
Purge the air. First, disconnect the sample capillary from the nebulizer, and then place the capillary into a vial. Click on the “Sample Intro” button in the software and enter 0.3 for flow rate. Wait until carrier solution replaces the air in the syringe. Return the sample intro flow rate to 0.045 before reconnecting the sample capillary to the nebulizer.
Sample capillary is clogged. Remove the sample capillary from the nebulizer and observe the droplets emerging from the capillary. If the droplets are not uniform, replace the capillary.
Sample capillary is not positioned correctly in the nebulizer sample inlet.
Make sure that the sample capillary ends at the tapered portion of the sample inlet of the nebulizer (see section “Preparation and Startup” in Chapter 5: Operation).
Nebulizer is damaged/clogged.
With the carrier syringe running at the normal sample introduction rate (0.045 ml/min), carefully remove the nebulizer from the nebulizer port (with all other connections intact) and check the spray with a flashlight. If the spray is absent or intermittent, clean or replace the nebulizer.
Masses are incorrectly calibrated.
Perform mass calibration (see “Autotuning”).
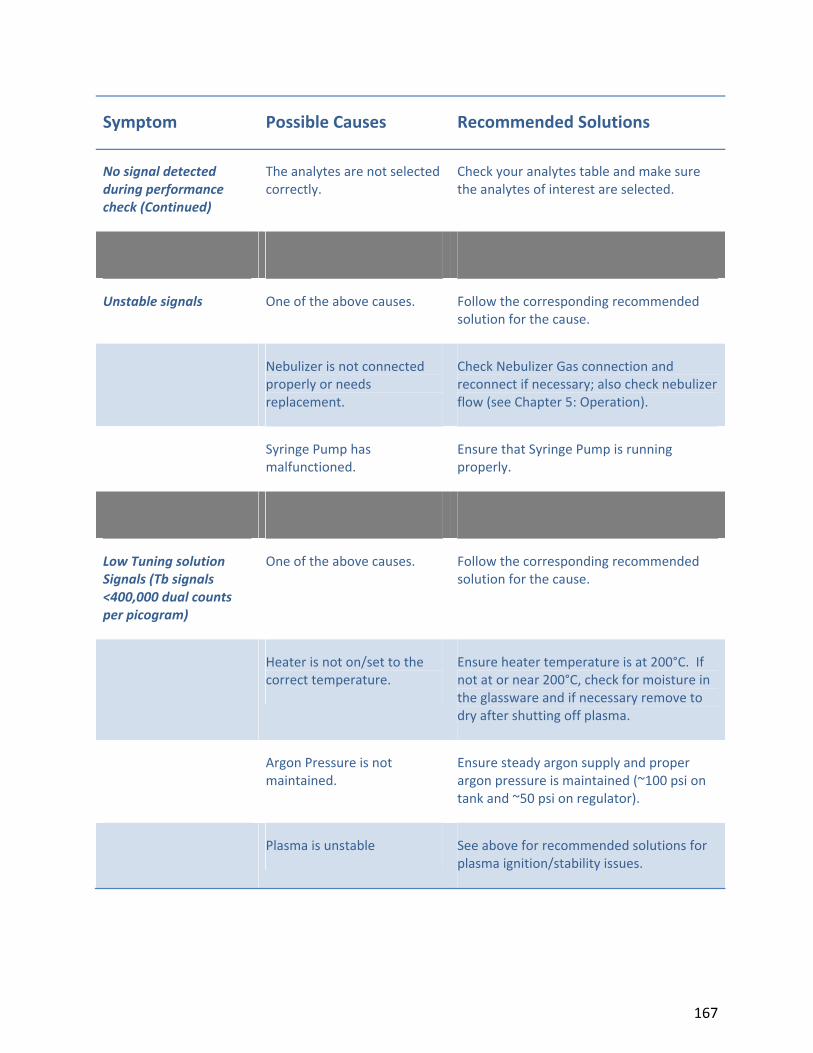
167
Symptom Possible Causes Recommended Solutions
No signal detected during performance check (Continued)
The analytes are not selected correctly.
Check your analytes table and make sure the analytes of interest are selected.
Unstable signals One of the above causes. Follow the corresponding recommended solution for the cause.
Nebulizer is not connected properly or needs replacement.
Check Nebulizer Gas connection and reconnect if necessary; also check nebulizer flow (see Chapter 5: Operation).
Syringe Pump has malfunctioned.
Ensure that Syringe Pump is running properly.
Low Tuning solution Signals (Tb signals <400,000 dual counts per picogram)
One of the above causes. Follow the corresponding recommended solution for the cause.
Heater is not on/set to the correct temperature.
Ensure heater temperature is at 200°C. If not at or near 200°C, check for moisture in the glassware and if necessary remove to dry after shutting off plasma.
Argon Pressure is not maintained.
Ensure steady argon supply and proper argon pressure is maintained (~100 psi on tank and ~50 psi on regulator).
Plasma is unstable See above for recommended solutions for plasma ignition/stability issues.

168
Symptom Possible Causes Recommended Solutions
Low Tuning solution Signals (Tb signals <400,000 dual counts per picogram) (Continued)
Sample capillary is not positioned correctly in the nebulizer sample inlet.
Make sure that the sample capillary ends at the tapered portion of the sample inlet of the nebulizer (see “Instrument Setup and Preparation for Plasma Start” in Chapter 5).
Masses are not correctly calibrated.
Perform mass calibration (see “Auto‐Tuning” in Chapter 5).
Nebulizer and Make up gas flows are not optimal.
Perform gas optimization (see “Auto‐Tuning” in Chapter 5).
Current is not optimal. Perform current optimization (see “Auto‐Tuning” in Chapter 5).
Detector Voltage is not optimal.
Perform detector voltage optimization (see “Auto‐Tuning” in Chapter 5).
One or more hardware parts of the instrument are not aligned properly.
See Chapter 6 “Maintenance” for proper alignment of parts and the “Auto‐Tuning” section in Chapter 5 for optimizing signals.
The glassware is not clean. Remove the glassware according to the instructions in Chapter 6: Maintenance.
The interface cones are not clean.
Remove the cones according to the instructions in Chapter 6: Maintenance and clean.
One or more hardware parts of the instrument need to be replaced.
Inspect all accessible hardware parts; if there are any signs (such as damage, clogging, and irremovable stains) that suggest the part is no longer functioning optimally, replace with a new one.

169
Symptom Possible Causes Recommended Solutions
Oxides are >3% Nebulizer and make up gas flows are too high
Perform gas optimization (see “Auto‐Tuning” in Chapter 5).
Unstable Signal or Oscillations from Tuning Solution
Proper exhaust level is not reached/maintained.
Ensure proper and consistent exhaust.
Nebulizer is damaged/clogged
With the carrier syringe running at the normal sample introduction rate (0.045 ml/min), carefully remove the nebulizer from the nebulizer port (with all other connections intact) and check the spray with a flashlight. If the spray is absent or intermittent, clean or replace the nebulizer.
Nebulizer gas line is not connected properly.
Check Nebulizer Gas connection and reconnect if necessary.
Sample capillary is not positioned correctly in the nebulizer sample inlet.
Make sure that the sample capillary ends at the tapered portion of the sample inlet of the nebulizer (see “Instrument Setup and Preparation for Plasma Start” in Chapter 5).
Syringe Pump has malfunctioned.
Ensure that the Syringe Pump is running properly.
No Signal from Sample Sample is not loaded into the sample loop.
Ensure the sample is injected from the syringe into the sample loop.
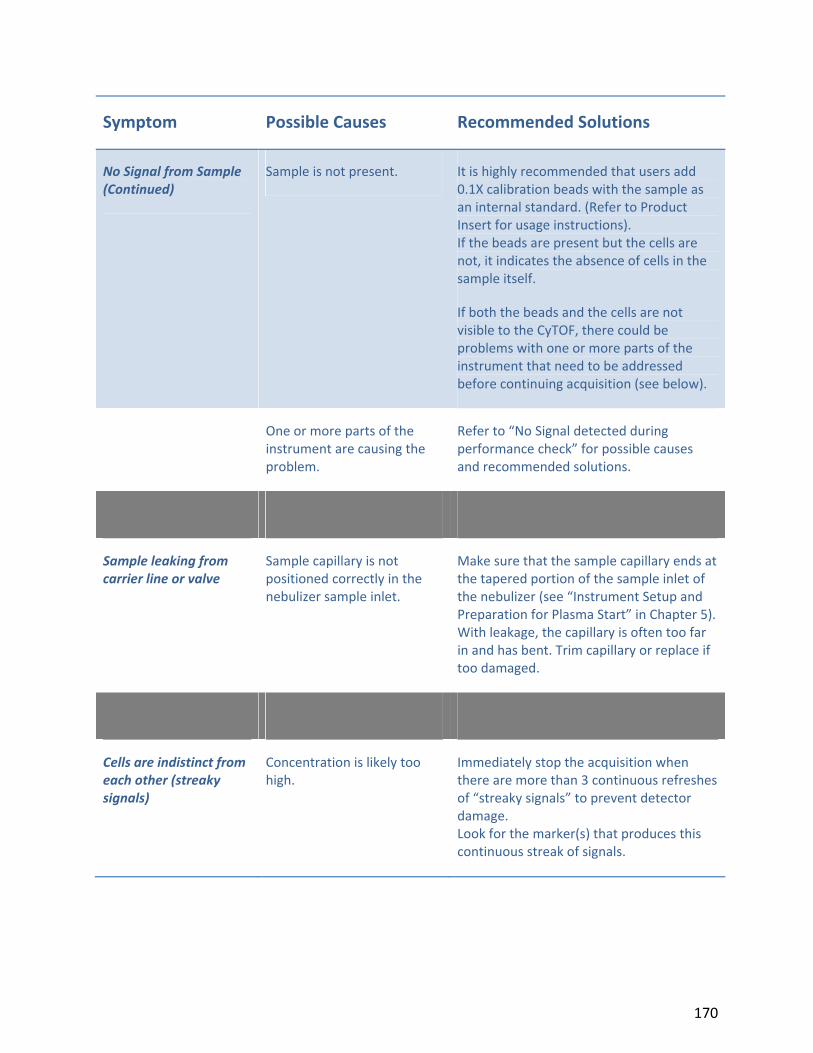
170
Symptom Possible Causes Recommended Solutions
No Signal from Sample (Continued)
Sample is not present. It is highly recommended that users add 0.1X calibration beads with the sample as an internal standard. (Refer to Product Insert for usage instructions). If the beads are present but the cells are not, it indicates the absence of cells in the sample itself.
If both the beads and the cells are not visible to the CyTOF, there could be problems with one or more parts of the instrument that need to be addressed before continuing acquisition (see below).
One or more parts of the instrument are causing the problem.
Refer to “No Signal detected during performance check” for possible causes and recommended solutions.
Sample leaking from carrier line or valve
Sample capillary is not positioned correctly in the nebulizer sample inlet.
Make sure that the sample capillary ends at the tapered portion of the sample inlet of the nebulizer (see “Instrument Setup and Preparation for Plasma Start” in Chapter 5). With leakage, the capillary is often too far in and has bent. Trim capillary or replace if too damaged.
Cells are indistinct from each other (streaky signals)
Concentration is likely too high.
Immediately stop the acquisition when there are more than 3 continuous refreshes of “streaky signals” to prevent detector damage. Look for the marker(s) that produces this continuous streak of signals.
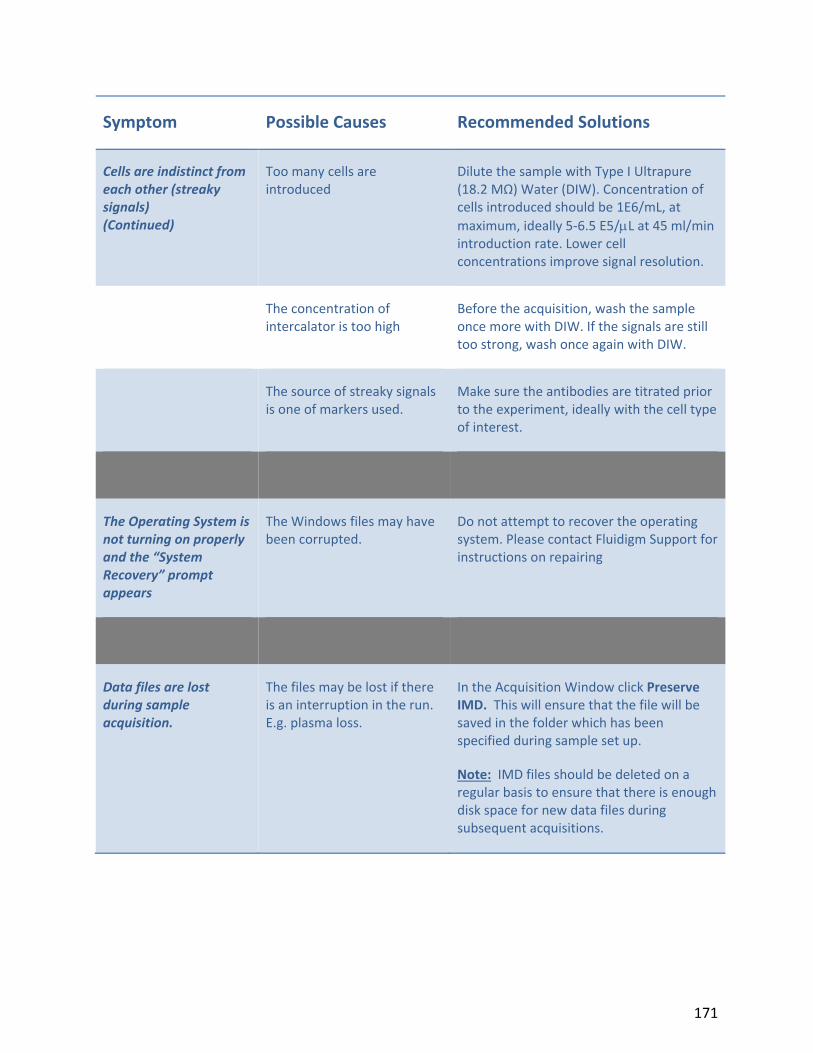
171
Symptom Possible Causes Recommended Solutions
Cells are indistinct from each other (streaky signals) (Continued)
Too many cells are introduced
Dilute the sample with Type I Ultrapure (18.2 MΩ) Water (DIW). Concentration of cells introduced should be 1E6/mL, at maximum, ideally 5‐6.5 E5/L at 45 ml/min introduction rate. Lower cell concentrations improve signal resolution.
The concentration of intercalator is too high
Before the acquisition, wash the sample once more with DIW. If the signals are still too strong, wash once again with DIW.
The source of streaky signals is one of markers used.
Make sure the antibodies are titrated prior to the experiment, ideally with the cell type of interest.
The Operating System is not turning on properly and the “System Recovery” prompt appears
The Windows files may have been corrupted.
Do not attempt to recover the operating system. Please contact Fluidigm Support for instructions on repairing
Data files are lost during sample acquisition.
The files may be lost if there is an interruption in the run. E.g. plasma loss.
In the Acquisition Window click Preserve IMD. This will ensure that the file will be saved in the folder which has been specified during sample set up.
Note: IMD files should be deleted on a regular basis to ensure that there is enough disk space for new data files during subsequent acquisitions.

172
173
For Research Use Only. Not for use in diagnostic procedures.
Limited License and Disclaimer for Fluidigm Systems with Fluidigm IFCs
Except as expressly set forth herein, no right to copy, modify, distribute, make derivative works of, publicly display, make, have made, offer to sell, sell,
use, or import a Fluidigm system or any other product is conveyed or implied with the purchase of a Fluidigm system (including the BioMark™ System, EP1
System, FC1 Cycler, or any components thereof), and Access Array IFCs, Dynamic Array IFCs and Digital Array IFCs (integrated fluidic circuits/microfluidic
chips with or without a carrier), IFC controller, software, reagents, or any other items provided hereunder. This limited license permits only the use by the
buyer of the particular product(s), in accordance with the written instructions provided therewith in the User Guide that the buyer purchases from
Fluidigm or its authorized representative(s). Except to the extent expressly approved in writing by Fluidigm or its authorized representative(s), the
purchase of any Fluidigm product(s) does not by itself convey or imply the right to use such product(s) in combination with any other product(s). In
particular, (i) no right to make, have made, or distribute other instruments, Access Array IFCs, Dynamic Array IFCs and Digital Array IFCs, software, or
reagents is conveyed or implied by the purchase of the Fluidigm system, (ii) no right to make, have made, import, distribute, or use the Fluidigm system is
conveyed or implied by the purchase of instruments, software, reagents, Digital Array IFCs from Fluidigm or otherwise, and (iii) except as expressly
provided in the User Guide, the buyer may not use and no right is conveyed to use the Fluidigm system in combination with instruments, software,
reagents, or Access Array IFCs, Dynamic Array IFCs and Digital Array IFCs unless all component parts have been purchased from Fluidigm or its authorized
representative(s). For example, purchase of a Fluidigm system and/or the IFC controller conveys no right or license to patents covering the Access Array
IFCs, Dynamic Array IFCs and Digital Array IFCs or their manufacture, such as 6,408,878, 6,645,432, 6,719,868, 6,793,753, 6,929,030, 7,494,555, 7,476,363,
7,601,270, 7,604,965, 7,666,361, 7,691,333, 7,749,737, 7,815,868, 7,867,454, 7,867,763; and EP Patent No. 1065378. Fluidigm IFCs may not be used with
any non‐Fluidigm reader, and Fluidigm readers may not be used with any chip other than Fluidigm IFCs. Fluidigm IFCs are single use only and may not be
reused unless otherwise specifically authorized in writing by Fluidigm. All Fluidigm products are licensed to the buyer for research use only. The products
do not have FDA or other similar regulatory body approval. The buyer may not use the Fluidigm system, any component parts thereof, or any other
Fluidigm products in any setting requiring FDA or similar regulatory approval or exploit the products in any manner not expressly authorized in writing by
Fluidigm in advance. No other licenses are granted, expressed or implied. Please refer to the Fluidigm website at www.fluidigm.com for updated license
terms.
Fluidigm, the Fluidigm logo, CyTOF, MAXPAR are trademarks or registered trademarks of Fluidigm Corporation in the U.S. and/or other countries. All other
trademarks are the property of their respective owners. © 2014 Fluidigm Corporation. All rights reserved.
Every effort has been made to avoid errors in the text, diagrams, illustrations, figures, and screen captures. However, Fluidigm assumes no responsibility
for any errors that may appear in this publication.
It is Fluidigm policy to improve products as new techniques and components become available. Therefore, Fluidigm reserves the right to change
specifications at any time.
Information in this manual is subject to change without notice. Fluidigm assumes no responsibility for any errors or omissions. In no event shall Fluidigm be
liable for any damages in connection with or arising from the use of this manual.
No right to modify, copy, use, or distribute software is provided except in conjunction with the instrument delivered hereunder and only by the end user
receiving such instrument. This software and the associated instrument are beta test systems. NO WARRANTIES ARE PROVIDED, EXPRESSED OR IMPLIED.
ALL WARRANTIES, INCLUDING THE IMPLIED WARRANTIES OF FITNESS FOR PURPOSE, MERCHANTABILITY, AND NON‐INFRINGMENT ARE EXPRESSLY
DISCLAIMED. By continuing the installation process, user agrees to these terms. Please refer to the full text of the software license agreement supplied
with the installation media for this application.

174
For technical support visit fluidigm.com/support.North America +1 650 266 6100 | Toll-free: +1 866 358 4354 in the US | [email protected] Europe +33 1 60 92 42 40 | [email protected] China (excluding Hong Kong) +86 21 3255 8368 | [email protected] Japan +81 3 3662 2150 | [email protected] other Asian countries +1 650 266 6100 | [email protected] Central and South America +1 650 266 6100 | [email protected]

175