Embed Size (px)
DESCRIPTION
Cynthia’s Weekly Redwood City Market Update for the Week of 1.18.16
Citation preview
Powered by Altos Research LLC | www.altosresearch.com | Copyright ©2005-2014 Altos Research LLC
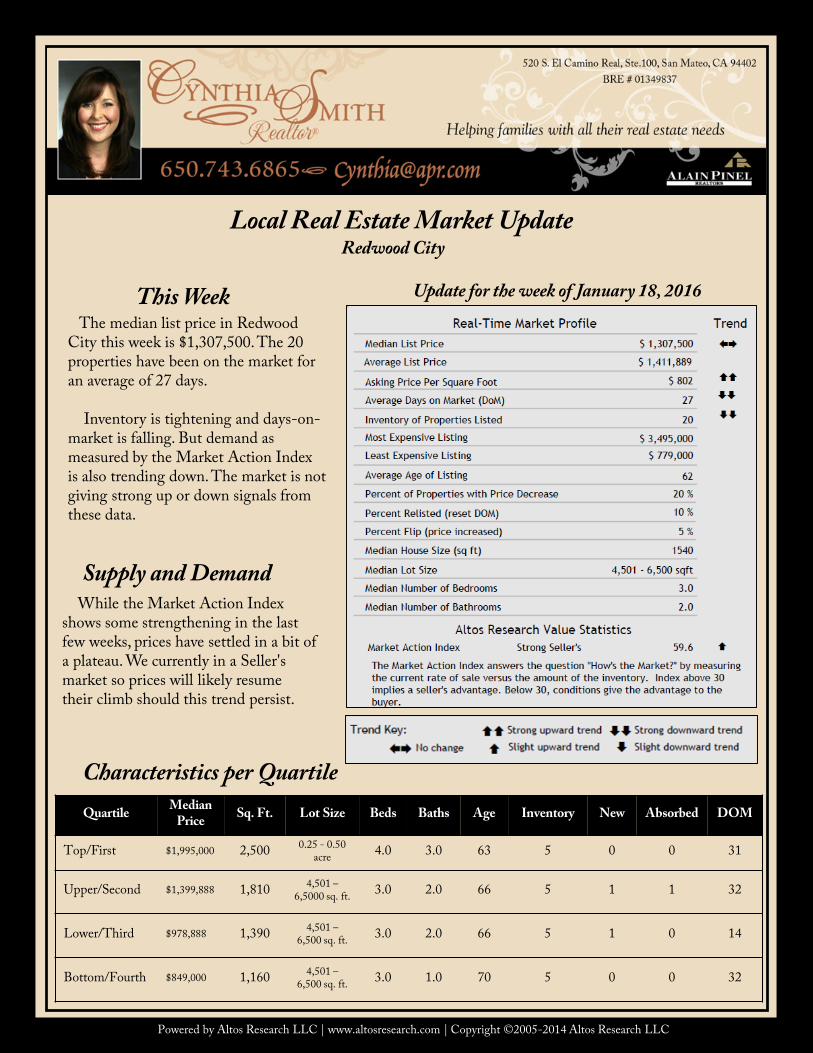
Local Real Estate Market UpdateRedwood City
The median list price in Redwood City this week is $1,307,500. The 20 properties have been on the market for an average of 27 days.
Inventory is tightening and days-on-market is falling. But demand as measured by the Market Action Indexis also trending down. The market is not giving strong up or down signals from these data.
This Week
While the Market Action Index shows some strengthening in the last few weeks, prices have settled in a bit ofa plateau. We currently in a Seller'smarket so prices will likely resumetheir climb should this trend persist.
Supply and Demand
Quartile Median Price Sq. Ft. Lot Size Beds Baths Age Inventory New Absorbed DOM
Top/First $1,995,000 2,500 0.25 - 0.50 acre 4.0 3.0 63 5 0 0 31
Upper/Second $1,399,888 1,810 4,501 –6,5000 sq. ft. 3.0 2.0 66 5 1 1 32
Lower/Third $978,888 1,390 4,501 –6,500 sq. ft. 3.0 2.0 66 5 1 0 14
Bottom/Fourth $849,000 1,160 4,501 –6,500 sq. ft. 3.0 1.0 70 5 0 0 32
Characteristics per Quartile
Update for the week of January 18, 2016
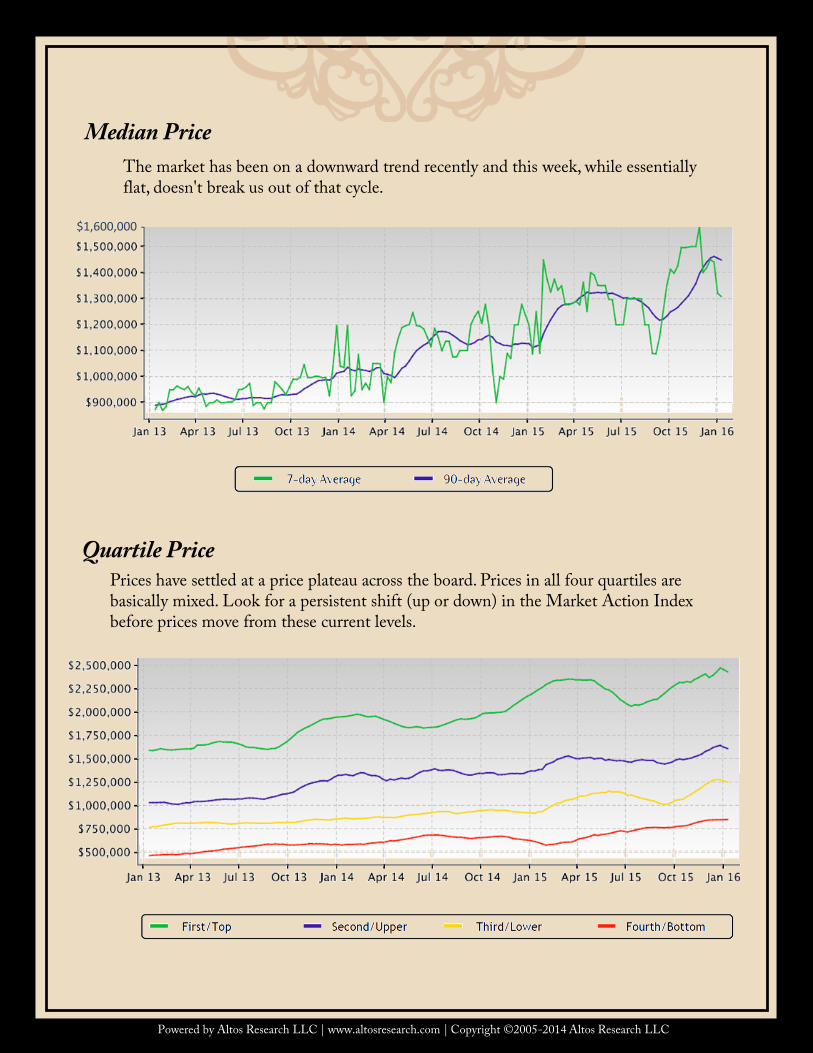
The market has been on a downward trend recently and this week, while essentially flat, doesn't break us out of that cycle.
Median Price
Prices have settled at a price plateau across the board. Prices in all four quartiles are basically mixed. Look for a persistent shift (up or down) in the Market Action Index before prices move from these current levels.
Quartile Price
Powered by Altos Research LLC | www.altosresearch.com | Copyright ©2005-2014 Altos Research LLC
$1,600,000 -
Powered by Altos Research LLC | www.altosresearch.com | Copyright ©2005-2014 Altos Research LLC
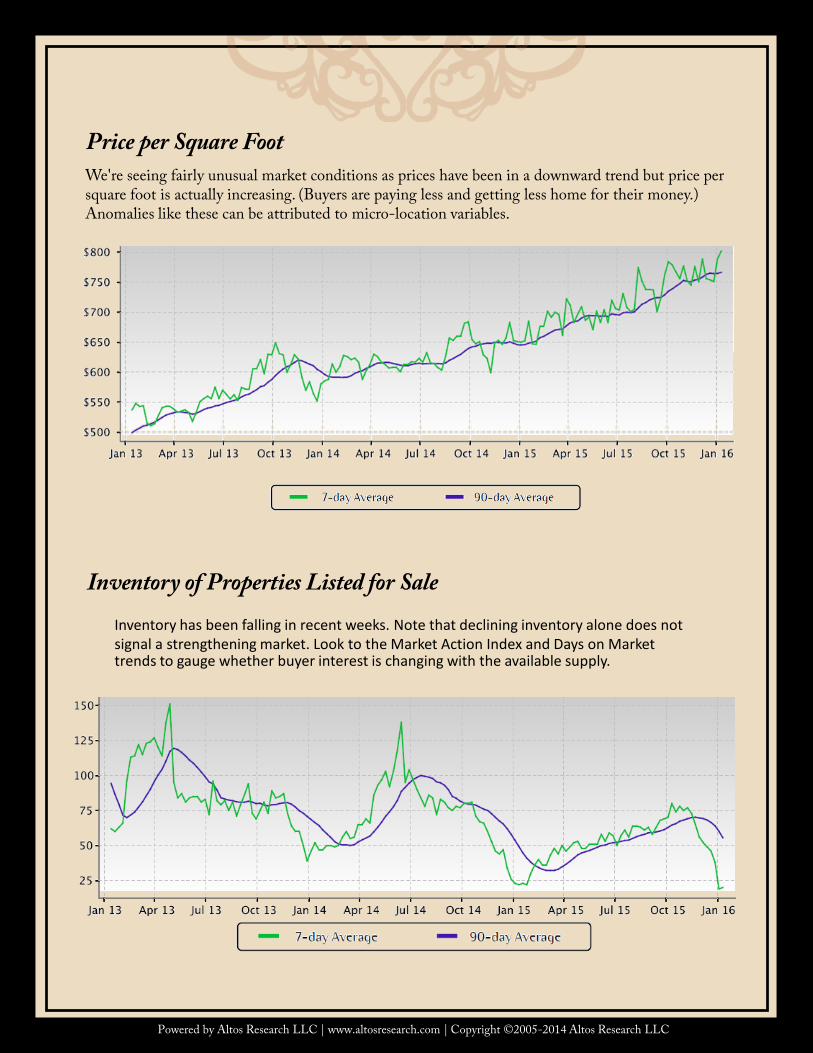
We're seeing fairly unusual market conditions as prices have been in a downward trend but price per square foot is actually increasing. (Buyers are paying less and getting less home for their money.) Anomalies like these can be attributed to micro-location variables.
Price per Square Foot
Inventory has been falling in recent weeks. Note that declining inventory alone does not signal a strengthening market. Look to the Market Action Index and Days on Market trends to gauge whether buyer interest is changing with the available supply.
Inventory of Properties Listed for Sale
Powered by Altos Research LLC | www.altosresearch.com | Copyright ©2005-2014 Altos Research LLC
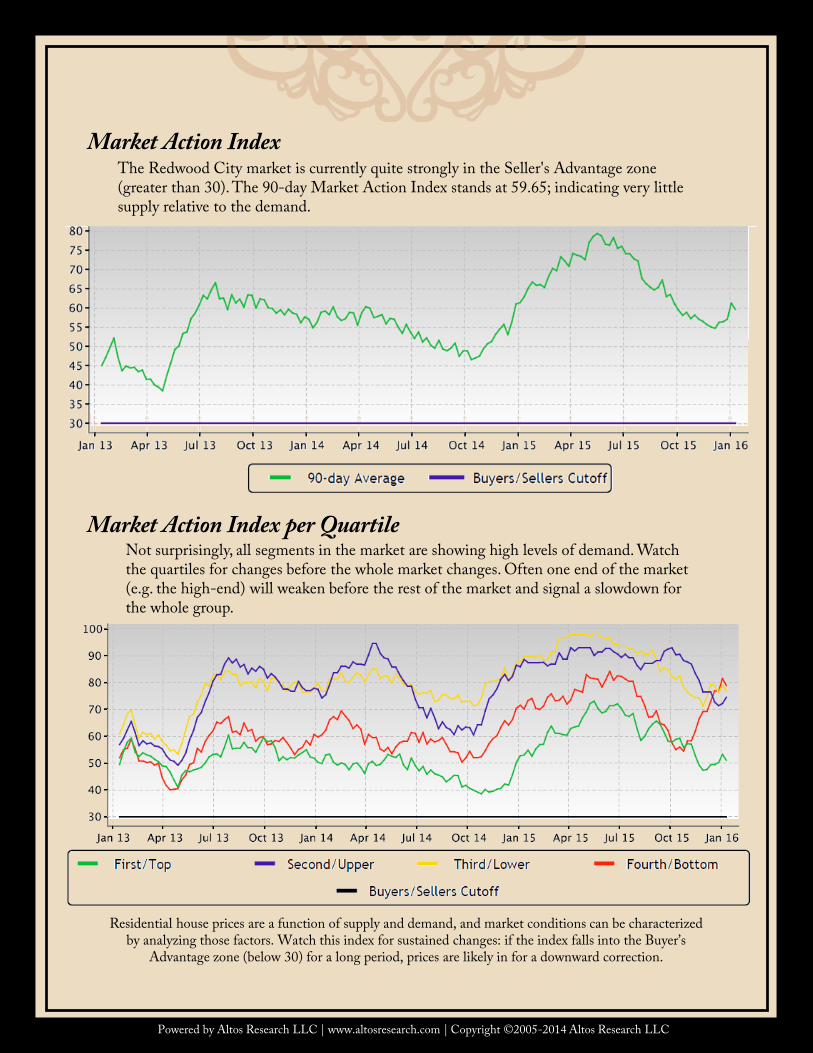
The Redwood City market is currently quite strongly in the Seller's Advantage zone (greater than 30). The 90-day Market Action Index stands at 59.65; indicating very little supply relative to the demand.
Market Action Index
Not surprisingly, all segments in the market are showing high levels of demand. Watch the quartiles for changes before the whole market changes. Often one end of the market (e.g. the high-end) will weaken before the rest of the market and signal a slowdown for the whole group.
Market Action Index per Quartile
Residential house prices are a function of supply and demand, and market conditions can be characterizedby analyzing those factors. Watch this index for sustained changes: if the index falls into the Buyer’s
Advantage zone (below 30) for a long period, prices are likely in for a downward correction.
Powered by Altos Research LLC | www.altosresearch.com | Copyright ©2005-2014 Altos Research LLC
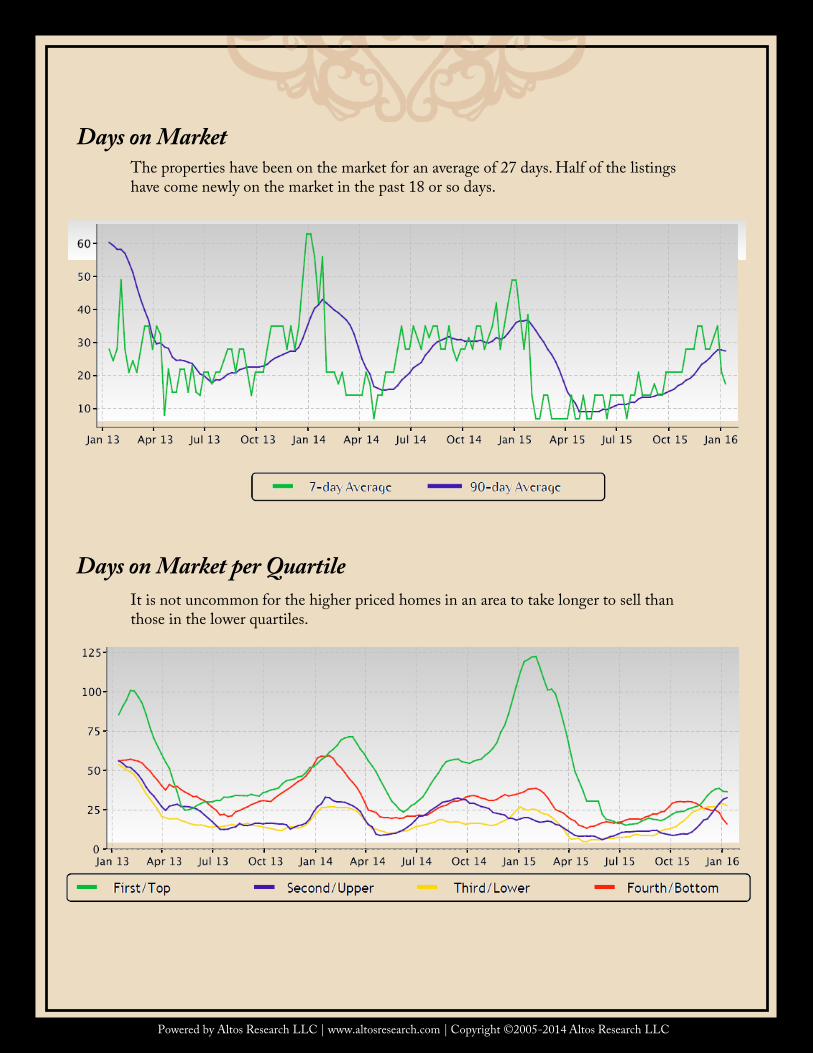
The properties have been on the market for an average of 27 days. Half of the listings have come newly on the market in the past 18 or so days.
Days on Market
It is not uncommon for the higher priced homes in an area to take longer to sell than those in the lower quartiles.
Days on Market per Quartile
![The Redwood gazette. (Redwood Falls, Minn.), 1925-06-17, [p ]. · 2019-10-27 · THE REDWOOD GAZETTE, REDWOOD FALLS, MINNESOTA The Redwood Gazette prints wedding an- nouncements or](https://img.pdfslide.us/doc/110x75/5fa04f2ead664330d06ddb4a/the-redwood-gazette-redwood-falls-minn-1925-06-17-p-2019-10-27-the.jpg)

![The Redwood gazette. (Redwood Falls, Minn.), 1921-10-05, [p ]](https://img.pdfslide.us/doc/110x75/61e75daafb034a33595cb385/the-redwood-gazette-redwood-falls-minn-1921-10-05-p-.jpg)

![The Redwood gazette. (Redwood Falls, Minn.), 1933-07-27, [p ]](https://img.pdfslide.us/doc/110x75/62986ea183583b25e317e403/the-redwood-gazette-redwood-falls-minn-1933-07-27-p-.jpg)


![The Redwood gazette. (Redwood Falls, Minn.), 1915-09-29, [p ]](https://img.pdfslide.us/doc/110x75/6173cad0f9943f0e6327a621/the-redwood-gazette-redwood-falls-minn-1915-09-29-p-.jpg)


![The Redwood gazette. (Redwood Falls, Minn.), 1909-05-19, [p ]](https://img.pdfslide.us/doc/110x75/61f3066c4fb1c01f2e62eb08/the-redwood-gazette-redwood-falls-minn-1909-05-19-p-.jpg)