Embed Size (px)
Citation preview
A design program for dilute phase pneumatic conveyorsl
K.H.K. Wodrich2 and T.'W. vorl Backstrcirn3(Rrceiued I,{ouember 1997; Final uersion Moy 1995)
A Windows-based cornputer program fo, designing dilutephase pressure and aacuuTn pneuTnatic conaeyors is intro-duced. The simulation prograrn is based on the nun'reri-cal integration of the fi,ue goaerning different'ial equation.s
fo, two-phase fl,ow. A summary of the equations and thernethod of solution are giuen. A detailed discussion is pre-sented on, the aduantages of the program results which in-clude ualues for the conueying gas uelocity, particle ueloc-
ity, pressure, density, and uoidage at any point along the
conaeying pipeline. The eualuation of the results is high-lighted in the presentation of coTnparison of simulationswith erperimental data fo, the conueying of cement and
tube ice. In conclusion a working erample of a pneurnaticconaeyor is giuen as analysed with the design progrt,rn.
Greek symbols
turning anglepipeline inclination anglegas friction coefficientsolids impact and frictioncoefficientalternative solids impact andfriction coefficienttotal friction coefficientgas viscositygas densityparticle density
Nomenclature
pipe cross-sectional areaparticle drag coefficientaverage solids velocitybend diameterpipe inner diameterparticle equivalent spherical diametervoidagesolids mass flow rategravitational ac celerationpipe Iengthpressure
air mass flow rateuniversal gas constantbend radiusradius to bend outer walltemperatureaverage air velocityinterstitial air velocityterminal velocity of cloud of particles
p
^s)r*
), '
)totp'Pg
Pt
kg/mskg/-tkg/-t
,2lgdPgudlP'GIQ
Dimensionless nurnbers
F r Froude numberRea Reynolds number
tt mass flow ratio
Introduction
Pneumatic conveying can be described as the transportof powdered and granular solid material by means of agas stream through a pipeline. Pneumatic conveying ofsolids is widespread in the mining, chemical, food, plastics,power generation, and wood treatment industries.
The two common types of pneumatic conveyors canbe classified as the positive pressure and the vacuum ornegative pressure conveyittg systems. The vacuum systemworks in a similar manner to a vacuum cleaner and is com-monly used to convey hazardous material as no leakage ofgas or material can occur to the atmosphere during con-veying. In the positive conveying system the solids arefed into a pipeline by means of an airlock system (rotaryvane feeder, tandem flup valves or a blow vessel). Theprime air mover supplies the conveying air at a pressureand flow rate required to transport the material along thepipeline to a receiver where the solids are separated fromthe air by means of filters or cyclones and the air ventedto the atmosphere. A prime air mover commonly used fordilute phase conveying is a positive displacement pump,the Roots blower.
A further distinction can be made between dilute anddense phase conveyittg modes. Dilute phase conveying canbe defined as conveying with a mass flow ratio less than15. Dense phase conveying can be defined as conveyingwith a mass flow ratio higher than 15.1
The objective in this paper is to present a computerprogram that can be used to determine the pressure drop
radrad
ACa
c
Dd
d,e
G
II
PaRT,I'O
TU
ue
ws
m2
il''kg/t
^l12mN/-'kg/t
#utnmKmlsm/sm/s
I This paper is reproduced with permission from BELTcoN 9, In-ternational Materials Handling Conference (22-24 October 1997),where it was first presented.
2Department of Mechanical Engineering, University of Stellen-bosch, Private B.g X1, Matieland, T60l South Africa
3Department of Mechanical Engineering, University of Stellen-bosch, Stellenbosch
R & D Journal, I998, I4(2) 30
ancl air florv ra,t,e requirements of a dilute phase conveyorfor both vacuur]I and pressure conveying systems. Thesepalanreters determine the specifications of the pritne airmover required to effect efficient conveying and hence havea direct irnpact on bhe power requirements and the associ-ated running costs. Another factor influencing the runningcosts is lvear reduct,ion in the pipeline, which can also be
addressed using the design program by reducing air andsolids velocities.
Design prograrn requirernents
An inrportant, r'equirenrerrt in the inrpletnentation of theclesign progranr is a user-friendly' interface. Computersare ('ulrerrtl-v used to sirnulate conrplex processes whichre(luire a high volume of calculations to he perfortned andtht' resrrlt is often a high r.'olunre of outptrt clata. Thesedata have to be interpretecl by'the clesigner anc] the mosteffective initial evaluation talies lrlat' visually' b;' Inea,rls
of graphical representation. Hand in hand with this goes
the efficient input of, for exatnple, t,he pipeline geornetryancl the required conveying pararneters. To be able to im-plement this requirernent it was decided to use DELPHI, anobiect orient,ated prograrnming language based on PASC-rAL.
['urther requirenrents can be identified as:
o Break up of the conrputer prograln into separateblocks such as t,he data input file generation by meansof a pipeline layout, generation prograrn, a programfor the input of the conveli ittg characteristics with thesubsequent two-phase flow simulation, and the outputdat a visua,lisat ion mo dule . In addition to this, sep-a,r'ate bloclis a,re added that include a, Root,s blowerselec t ion progranr and, in the future , also a solidsfeeding device selection and solids and gas separationequipment selection program.
o Logical input of the pipe layout by means of standardcomponents that are used in the industry, such as
bends and straight pipeline sections.
o Provision for a material database containing the re-quired parameters such as material density, particlediarneter, particle shape and friction coefficient corre-lations.
o Clalculation and graphical representation of the fiveprimary output pararneters: the average velocities ofsolids (c) and air ('u), the pressure ( P),, air density (po)and the voidage (e) along the length of the pipeline.The flow sirnulation rnust be able to handle single-phase flows up to the material feeding point and thenswitch to a two-phase flow analysis for the remaininglength of conveying pipe. It should also be possibleto rnodel stepped increases in pipeline diameter andallow for t,he provision of a,ir leakage at the materialfeed point,.
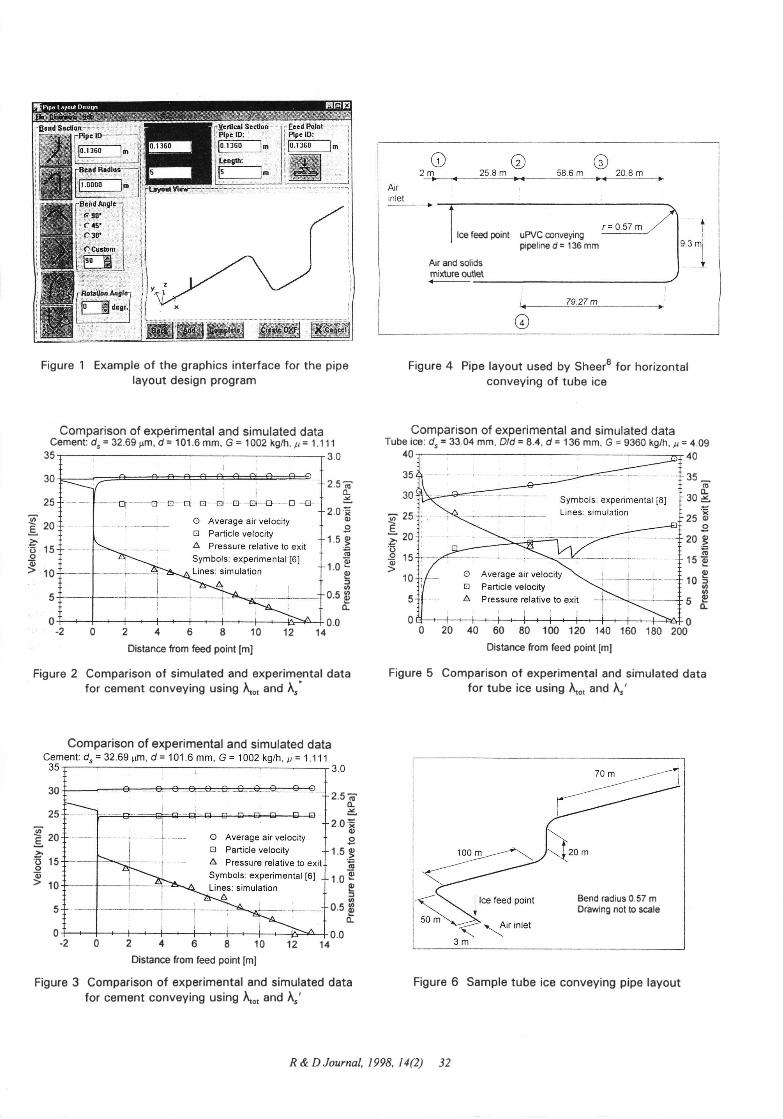
Pipeline layout generation
Figure 1 depicts an example of the pipeline generation win-dow. The components required to build up a pipelinelayout are represented visually. These include the sixbend orientations that are possible in pneumat,ic convey-ing rvhere vertical or horizontal pipelines are usecl. Duringtlte building process a visual representation of the layoutis presented in the layout view window with a provisionto delet,e errotreously added cotnponents. Dimension unitscan be changed as required and stepped pipelines are gen-erated by increasing the pipeline diameter.
A mathenratical model for two-phase flow
The trvo-phase flow differential equations have been usecl ina sitnplifiecl fornrl to nrodel pneurnatic convef ing with re-spect to the determitratiou of pressure drop and a,verage airvelocity'. In clilute phase conveying the voidage (the frac-tion of volutne of a conveying pipe elernent that is takenup by air) is close to unity and is in a simplified analysisoften taken as unity. This sirnplification implies that thesolids velocity is equal to the air velocity. This is not thec ase, particularly' in a,cceleration regions and in bends. Itis thus irnperative to introduce additional equations to ob-tain a rltore complete rnathenratical nrodel which incluclesthe solids velocity and the voidage as variables. Ferretti2presents a set of equations consisting of the state equa-tion for an ideal gas, two continuity equations, one for thesolid phase and one for the gaseous phase, a solids mo-tion equation, and the pressure drop equation which canbe derived by means of a power balance or an analysisof a finite pipe element. These equations are utilised b;,Saccaui3 to present a new design program for pneumaticcollveyors which is able to predict air and solids velocities,pressure drops, and the voidage. The work of Ferretti2and Saccani3 is used as a basis for the design programpresented here. The ideal gas equation in differential formfor an isothermal process can be written in the followingforrn:
dpg: dP 1 .\dl dl RT \^/
The renraiuing four differential equations can be de-rived frotrr the analysis of an elemental volume of con-veying pipe element at an arbitrary pipe inclination angle
13 measured from the horizontal axis. They are:
The solids continuity equation:
de (1 -e)dc, (1 -e)d,AdI
The gas continuity equation:
dzt" _l)edps _urde _urdAdl psdl edl Adl
(2)
3IR & D Journal, I 998, I 4(2)
(3)
lce feed point uPVC conveyingpipelined=136mm
Air and solidsmixture outlet
Figure 1 Example of the graphics interface for the pipelayout design program
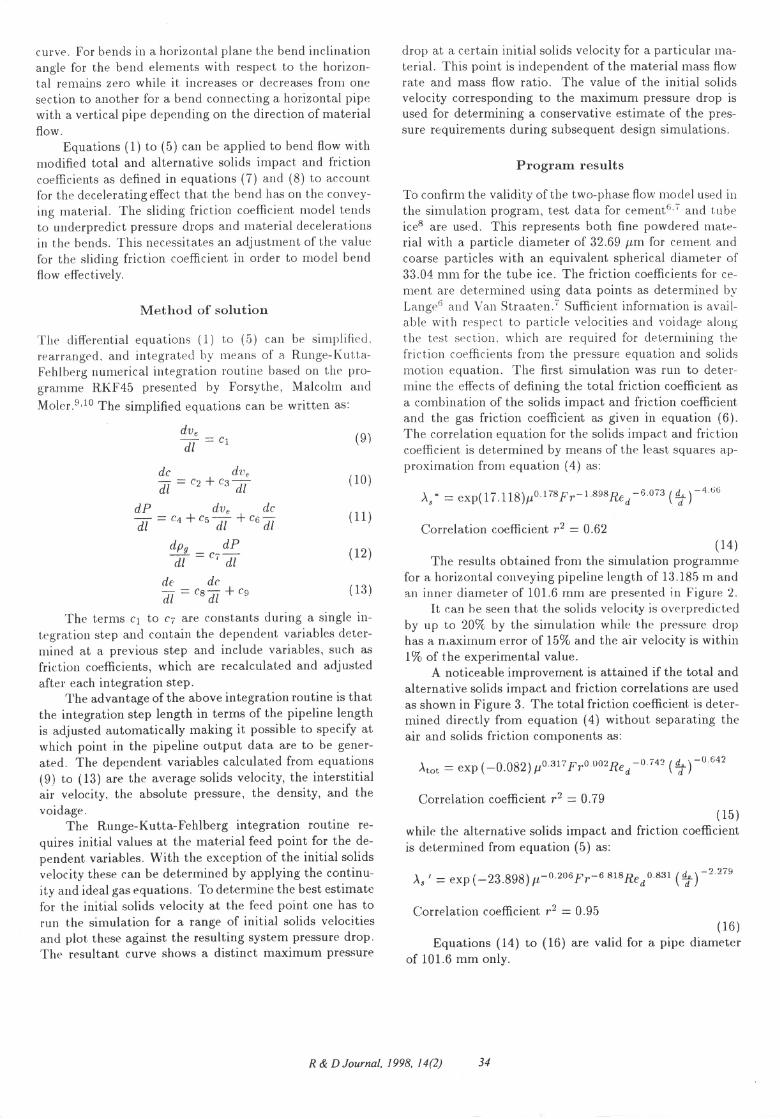
Comparison of experimental and simulated dataCement: 4 = 32.69 prr, d= 101.6 mm, G = 1002 kg/h,tt= 1.111
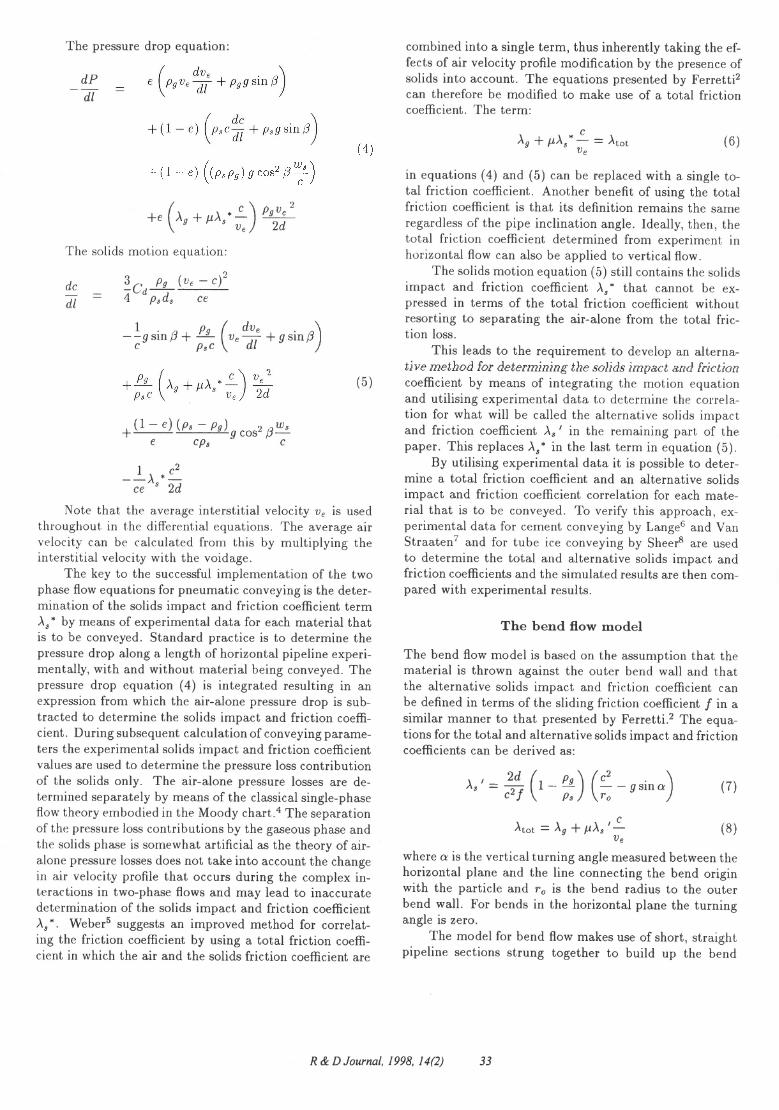
Figure 4 Pipe layout used by Sheers for horizontalconveying of tube ice
Comparison of experimental and simulated dataTube ice. d, = 33.04 mm, Dld = 8.4, d = 136 mm, G = 9360 kg/h, lt= 4.09
(E(LY
'xooo(!6Efooo0-
aE
C)oo
35
30
25
20
15
10
5
0
30
25
2.0
1.5
1.0
0.5
0.0
40
35
30
Q' 25E
;20o€15
10
5
0
40
35-(E
30g
25dI
209(E
15 Eo
10 5tnoFo)vo-
0-2 0 2 4 6 8 10 12 14
Distance from feed point [m]
Figure 2 Comparison of simulated and experimental datafor cement conveying using A,o, and Ar*
Comparison of experimental and simulated data
0 20 40 60 80 1 00 120 140 160
Distance from feed point [m]
1 80 200
-2 0 2 4 6 8 10 12 14
Distance from feed point [mJ
Figure 3 Comparison of experimental and sirnulated datafor cement conveying using I,o, and Ir'
Figure 5 Comparison of experimental and simulated datafor tube ice using A,o, and \'
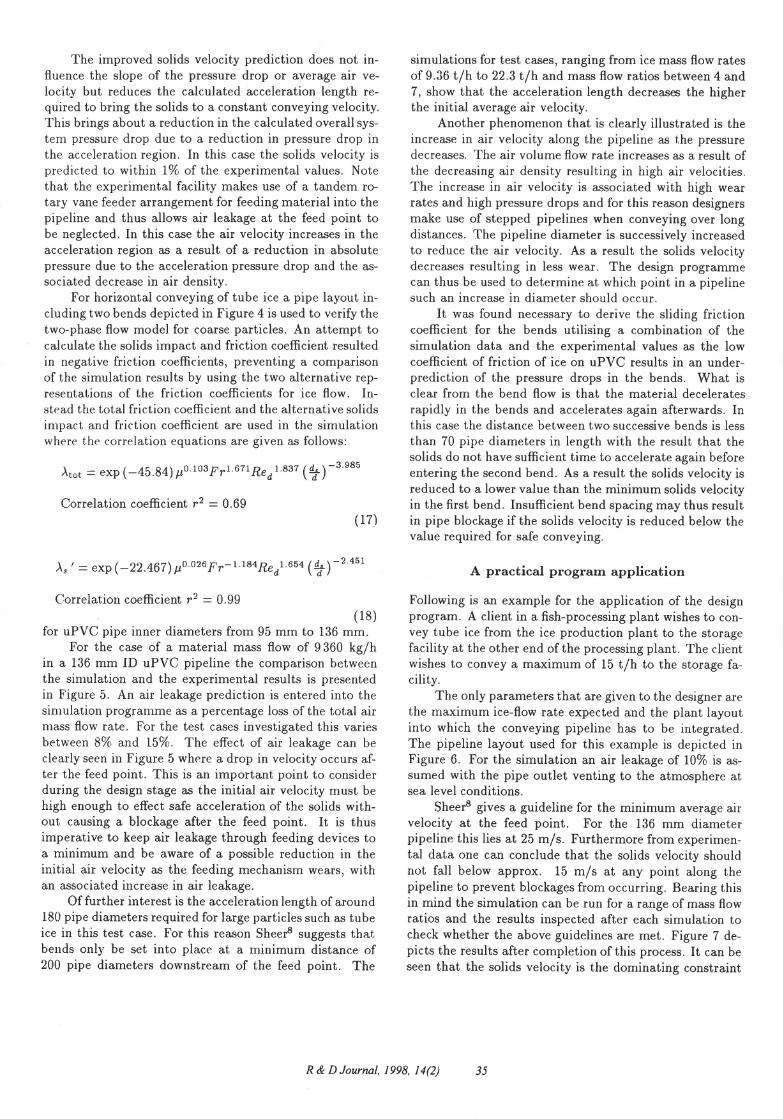
Figure 6 Sample tube ice conveying pipe layout
O E-4.-t (o(L5
2.0 EoI
1.5 g(U
10Eofo
0.5 E(L
0.0
aE
'oo(l)
30
25
20
15
10
5
0
Bend radius 0.57 mDrawing not to scale
R & D Journal, 1998, I4(2) 32
The pressure
dPdt
drop equation: combined into a single term, thus inherently taking the ef-fects of air velocity profile modification by the presence ofsolids into account. The equations presented by Ferretti2can therefore be modified to make use of a total frictioncoefficient. The term:
)n * F),.;: )tot (6)
* (1 - e) (p, - ps) g cos2 [jr,cPt c
1c2-;A'- 2cl
Note that the average interstitial velocity 't)e is usedthrourghout in the differential equations. The average air''u'erlocity can be calculated frorn this by multiplying theinterstitial velocity with the voidage.
The k.y to the successful implementation of the twophase flow equations for pneumatic conveying is the deter-mina,tion of the solids impact and friction coefficient term), * by means of experimental data for each material thatis to be conveyed. Standard practice is to determine thepressure drop along a length of horizontal pipeline experi-mentally, with and without material being conveyed. Thepressure drop equation (4) is integrated resulting in anexpression from which the air-alone pressure drop is sub-tracted to determine the solids impact and friction coeffi-cient. During subsequent calculation of conveying parame-ters the experimental solids impact and friction coefficientvalues are used to determine the pressure loss contributionof the solids only. The air-alone pressure losses are de-t,ernrined separately by means of the classical single-phaseflow theory ernbodied in the Moody chart.a The separationof the pressure loss contributions by the gaseous phase andtlte solids phase is sornewhat artificial as the theory of air-alone pressure losses does not take into account the changein air velocity profile that occurs during the complex in-teractions in two-phase flows and may lead to inaccuratedetertnination of the solids impact and friction coefficient), * . Webers suggests an improved method for correlat-ing the friction coefficient by using a total friction coeffi-cient in which the air and the solids friction coefficient are
in equations (4) and (5) can be replaced with a single to-tal friction coefficient. Another benefit of using the totalfriction coefficient is that its definition remains the sameregardless of the pipe inclination angle. Ideally, then, thetotal friction coefficient determined from experiment inhorizontal flow can also be applied to vertical flow.
The solids motiotr equation (5) still contains the solidsimpact and friction coefficient ), * that cannot be ex-pressed in terms of the total friction coefficient withoutresorting to separating the air-alone from the total fric-tion loss.
This leads to the requirement to develop an alterna-tive method for determining the soJids impact and frictioncoefficient by means of integrating the motion equationand utilising experimental data to determine the colrela-tion for what will be called the alternative solids inrpactand friction coefficient ), ' in the remaining part, of thepaper. This replaces Ar* in the last term in equation (5)
By utilising experimental data it is possible to deter-mine a total friction coefficient and an alternative solidsimpact and friction coefficient correlation for each mate-rial that is to be conveyed. To verify this approach, ex-perimental data for cement conveying by Lange6 and VanStraaten7 and for tube ice conveying by Sheer8 are usedto determine the total and alternative solids iurpact andfriction coefficients and the simulated results are then com-pared with experimental results.
The bend flow model
The bend flow model is based on the assumption that thematerial is thrown against the outer bend wall and thatthe alternative solids impact and friction coefficient canbe defined in terms of the sliding friction coefficient / in asimilar manner to that presented by Ferretti.2 The equa-tions for the total and alternative solids impact and frictioncoefficients can be derived as:
),':
*e(^, *tt^,.;) %The solids motion equation:
d,c '!rt , Ps (u' - 'La
lssino+ #(,,* * g, "p)
+ (1 - el (tr, pil gcos2 e?)(4)
(5)
#('- 9e-s,i",) s)
)ro, - ^s
t p,Ar' !ae
where a is the vertical turning angle measured between thehorizontal plane and the line connecting the bend originwith the particle and ro is the bend radius to the outerbend wall. For bends in the horizontal plane the turningangle is zero.
The model for bend flow makes use of short, straightpipeline sections strung together to build up the bend
(8)
R & D Journal, 1998, I4(2) 33
cul've. t-or bencls in a horizontal plane the bend inclinationangle for t,he bend elenrents with respect to the horizon-t al renrains zero while it increases or decreases frotn one
section to another for a, bend connecting a horizoutal pipewith a vertical pipe depending on the direction of materialflow.
Equatiorls ( 1 ) to (5 ) can be applied to bencl flow withnrodified total and alternative solids impact aud frictioncoefficients as defined in equations (7) and (8) to account
for the decelerating effect that the bencl has on the coltvey-
ing material. The sliding friction coeffic:ient nrodel tencls
to underpredict pressure drops and tnaterial deceleratiotts
ip the trends. This nec.essita,t,es an adjusturent of t,he value
for the sliding friction coefficient in order to model bend
flow effectivel,v.
Method of solution
The clifferential ecluations (1) to (5) caI] be siurplified.rea,rrangecl, and integratecl lry- nlealls of'a Runge-Iiutta-Fehlberg rlunlerical integratiou routiue llased olt the pro-
glarnrne RKF45 presented by Forsythe, Malcoltn attcl
Nfoler.s'10 The simplified equations can be written as:
drop at, a cert,ain initial solids velocity for a particular rna-terial. This point is independent of the tnaterial ma,ss flowrate and mass flow ratio. The value of the initial solidsvelocity corresponding to the maximum pressure drop is
used for determining a conservative estimate of the pres-
sure requirements during subsequent design simulations.
Prograrn results
To c.onfirrtr the validit)' of the two-phase flow nroclel usecl inthe sirnulation program., test data for cemenl,t_;'7 and t rrbr'
ice8 are used. This represents both fine powderec[ nrat,e-
rial with a, particle diameter of 32.69 prm for celnerlt andcoarse particles with an equivalent spherical dianreter of33.04 nlnr for the t,ube ice. The frictiou coefficient,s for ce-
nrent are detelmined using data points a,s deterurinecl lr)'Lange6 ancl \''an Straaten.T Sufficient infornration is avai l-
able lvith respect to particle r,'elocities atrcl r'oiclage aiorrgthc. tt.st section. lvhich a,r'e recluirerl for clet,ernrining thefriction coefficieuts from the pressure equation and solicls
motion equat,ion. The first simulation rvas run to deter-nrine t,he effects of defining the total frictiou coefficieut as
a cornbination of the solids impact and friction coefficientand the gas friction coef;ficient as given in equation (6)The correlation equation for the solids irnpact atrd frictioncoefficient is determined by means of t,he least squares ap-proxirnat,iou frotn equaLion (4) as:
).* * - exp(1i-.11S)po t78^F 't'-r 8e86. d-B
oir 1 # l-4
tjt;
Correlation coefficient r'2 - 0.62(14)
The results obtained fronr the sinrulation prograrnrlrefor a horizontal conveying pipeline length of 13.185 tn andan inner cliarnetel of 101.6 rnur are presented in Figure 2.
It can he seen that, the solids velocity is overpredic:tedby up to 20%, by the sirnulation while t,he pressure clrop
has a niaximum error of l5Trt and the air velocity is withinI% of the experimental value.
A noticeable improvement is attained if the total andalternative solids impact and friction correlat,ious are usecl
as shown in Figure 3. The total friction coefficient is deter-mined directly from equation (4) without separating theair and solids friction conlponents as:
)ro, - exp (-0.082 ) po'317 p''0 ur)26 ed 0 742 (+)-0 t;rt2
Correlation coefficient rz - 0.79(15)
while the alternative solids irnpact and frictiou coefficientis dr:termitred from equation (5) as:
), , - exp (-23.898 ) p-0 206 I-r-6 81 8Rer0 83' (+)-2 27s
(-lorrelation coefficient 'r2 = 0.95(16)
Equations (14) to (16) are valid for a pipe diameterof 101.6 Inm only.
'fhe t,ernrs c1 to c7 are constant,s during a single irt-t,egratiou st,ep ancl cont,aitt the dependetrt variables deter-
nrined at a previous step aud include variables, sttch as
frictiop coefficients, rvhich are recalculated and adjustedafter each integration st,eP.
The advantage of the above integration routine is thatthe integration step length in terms of the pipeline lengthis adjusted automatically rnaking it possible to specify at
which point in the pipeline output data are to be geller-
ated. The dependent variables calculated from equatiolts(g) r,o (13) are the average solids velocity, the interstitialair velocity. the absolute pressure, the density. aud the
voidage.The Runge-Kutta-Fehlberg integration routine re-
rluires initial values at t,he nraterial feed point for the de-
pendent variables. With the exception of the initial solids
velocity these can be detertnined by applying the continu-it,-v- arrd ideal gas equations. To deterurine the best estimatefbr the initial solids velocity a,t t,he feed point olle has torun the simulat,ion for a range of initial solids velocitiesa,nd plot these a,gainst the resulting system pressure drop,
The resultant curve shows a distinct ma,ximum pressure
(e)
(10)
(11)
(12)
(13)
du,
dI-C1
dc d,u,
dt-c2*cs dt
d, P du, dc
dt - c.q * cs ,II * ,u dl
d,g -- c=dPdl 'dl
rle dc:
,tt-csdt*'n
R & D Journal, I 998, I 4(2) 34
The improved solids velocity prediction does not in-fluence the slope of the pressure drop or average air ve-locity but reduces the calculated acceleration length re-quired to bring the solids to a c,onstant conveying velocity.This brings about a reduction in the calculated overall sys-tem pressure drop due to a reduction in pressure drop inthe acceleration region. In this case the solids velocity is
predicted to within l% of the experimental values. Notethat the experimental facility makes use of a tandem ro-tary vane feeder arrangement for feeding material into thepipeline and thus allows air leakage at the feed point tobe neglected. In this case the air velocity increases in theacceleration region as a result of a reduction in absolutepressure due to the acceleration pressure drop and the as-sociated decrease in air density.
For horizontal conveyir,g of tube ice a pipe layout in-cluding two bends depicted in Figure 4 is used to verify thetwo-phase flow model for coarse particles. An attempt tocalculate the solids impact and friction coefficient resultedin negative friction coefficients, preventing a comparisonof the simulation results by using the two alternative rep-resentations of the friction coefficients for ice flow. In-stead the total friction c,oefficient and the alternative solidsimpact and friction coefficient are used in the simulationwhere the correlation equations are given as follows:
)ro, - exp (-45.84) Po'ro3f'rL 67LRro1'837 (+)-3'e85
Correlation coefficient 12 :0.69( 17)
)* ' - exp (-22.467) po'026 pr-1'1"nR"01 654 (+) -2'45t
Clorrelation coefficient 12 - 0.99 (1g)
for uPVC pipe inner diameters from 95 mm to 136 mm.For the case of a material mass flow of I 360 kslh
in a 136 rnm ID uPVC pipeline the comparison betweenthe sinrulation and the experimental results is presentedin Figure 5. An air leakage prediction is entered into thesinrulation programme as a percentage loss of the total airnrass flow rate. For the test cases investigated this variesbetween 8To and I5%. The effect of air leakage can beclearly seen in Figure 5 where a drop in velocity occurs af-ter the feed point. This is atr i-portant point to considerduring the design stage as the initial air velocity must behigh enough to effect safe acceleration of the solids with-out causing a blockage after the feed point. It is thusi-perative to keep air leakage through feeding devices toa mitrimum and be aware of a possible reduction in theinitial air velocity as the feeding mechanism wears, withan associated increa,se in air leakage.
Of further interest is the acceleration length of around180 pipe diameters required for large particles such as tubeice in this test case. For this reason Sheers suggests thatbends only be set into place at a minimum distance of200 pipe diameters downstream of the feed point. The
simulations for test cases, ranging from ice mass flow ratesof 9.36 t/h to 22.3 tlh and mass flow ratios between 4 and7 , show that the acceleration length decreases the higherthe initial average air velocity.
Another phenomenon that is clearly illustrated is theincrease in air velocity along the pipeline as the pressuredecreases. The air volume flow rate increases as a result ofthe decreasing air density resulting in high air velocities.The increase in air velocity is associated with high wearrates and high pressure drops and for this reason designersmake use of stepped pipelines when conveyirrg over longdistances. The pipeline diameter is successively increasedto reduce the air velocity. As a result the solids velocitydecreases resulting in less wear. The design programmecan thus be used to determine at which point in a pipelinesuch an increase in diameter should occur.
It was found necessary to derive the sliding frictioncoefficient for the bends utilising a combination of thesimulation data and the experimental values as the lowcoefficient of friction of ice on uPVC results in an under-prediction of the pressure drops in the bends. What isclear from the bend flow is that the material deceleratesrapidly in the bends and accelerates again afterwards. Inthis case the distance between two successive bends is lessthan 70 pipe diameters in length with the result that thesolids do not have sufficient time to accelerate again beforeentering the second bend. As a result the solids velocity isreduced to a lower value than the minimum solids velocityin the first bend. Insufficient bend spacing may thus resultin pipe blockage if the solids velocity is reduced below thevalue required for safe conveyitrg.
A practical program application
Following is an example for the application of the designprogram. A client in a fish-processing plant wishes to con-vey tube ice from the ice production plant to the storagefacility at the other end of the processing plant. The clientwishes to convey a maximum of 15 tlh to the storage fa-cility.
The only parameters that are given to the designer arethe maximum ice-flow rate expected and the plant layoutinto which the conveying pipeline has to be integrated.The pipeline layout used for this example is depicted inFigure 6. For the simulation an air leakage of I0% is as-sumed with the pipe outlet venting to the atmosphere atsea level conditions.
Sheer8 gives a guideline for the minimum average airvelocity at the feed point. For the 136 mm diameterpipeline this lies at 25 m/s. Furthermore from experimen-tal data one can conclude that the solids velocity shouldnot fall below approx. 15 mls at any point along thepipeline to prevent blockages from occurrirrg. Bearing thisin mind the simulation can be run for a range of mass flowratios and the results inspected after each simulation tocheck whether the above guidelines are met. Figure T de-picts the results after completion of this process. It can beseen that the solids velocity is the dominating constraint
R & D Journal, I998, I4(2) 35
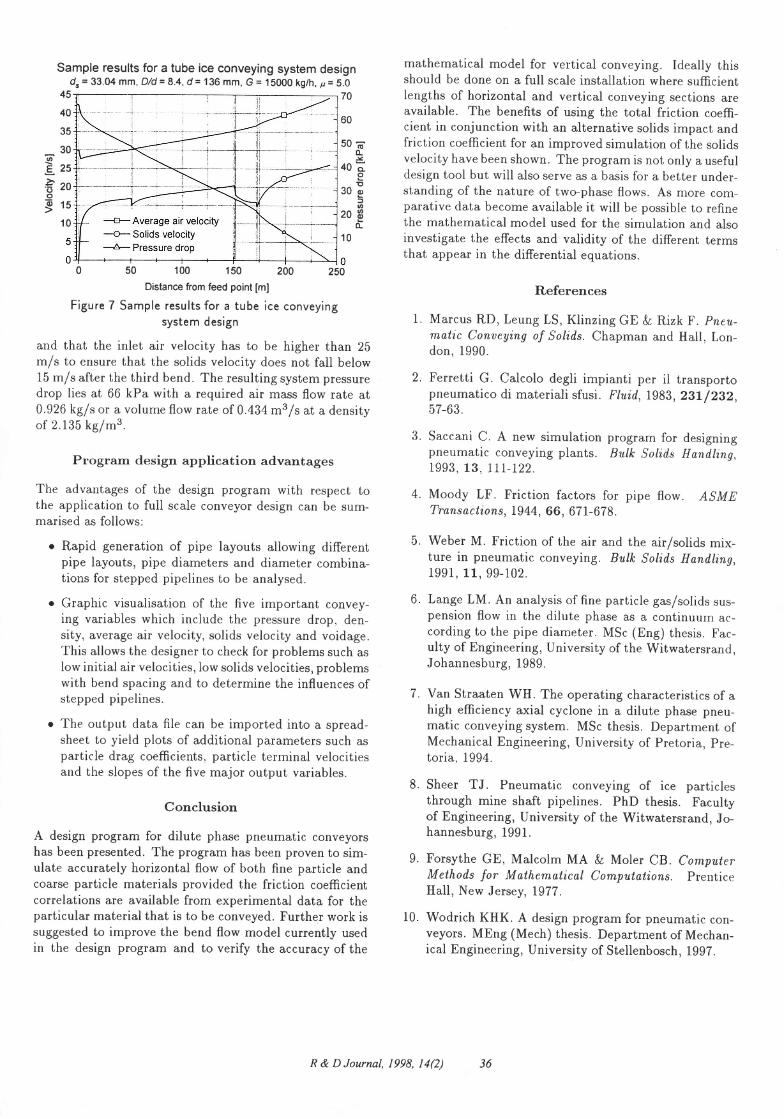
Sample results for a tube ice conveying system designd"= 33.04 mm, D/d=8.4,d = 136 mm, G= 15000 kg/h, tt=So-s
45r 70
4060
35
30
0 50 100 150 200 250
Distance from feed point [m]
Figu re 7 Sample results for a tube ice conveyingsystem d esign
and that the inlet air velocity has to be higher than 25rn/s to ensure that the solids velocity does not fall below15 rn/s after the third bend. The resulting system pressuredrop lies at 66 kPa with a required air mass flow rate at0.926 kg/r or a volume flow rate of 0 .434 m3/s at a densityof 2. 135 kg/-t.
Program design application advantages
The advantages of the design progranr with respect tothe application to full scale conveyor design can be sum-marised as follows:
o Rapid generation of pipe layouts allowing differentpipe layouts, pipe diameters and diameter combina-tions for stepped pipelines to be analysed.
o Graphic visualisation of the five important convey-ing variables which include the pressure drop, den-sity, average air velocity, solids velocity and voidage.This allows the designer to check for problems such as
low initial air velocities, Iow solids velocities, problemswith bend spacing and to determine the influences ofstepped pipelines.
o The output data file can be imported into a spread-sheet to yield plots of additional parameters such asparticle drag coefficients, particle terminal velocitiesand the slopes of the five major output variables.
Conclusion
A design program for dilute phase pneumatic conveyorshas been presented. The program has been proven to sim-ulate accurately horizontal flow of both fine particle andcoarse particle materials provided the friction coefficientcorrelations are available from experimental data for theparticular material that is to be conveyed. Further work issuggested to improve the bend flow model currently usedin the design program and to verify the accuracy of the
rnathematical model for vertical conveyirg. Ideally thisshould be done on a full scale installation where sufficientlengths of horrzontal and vertical conveying sections areavailable. The benefits of using the total friction coeffi-cient in conjunction with an alternative solids impact andfriction coefficient for an improved simulation of the solidsvelocity have been shown. The program is not only a usefuldesign tool but will also serve as a, basis for a better under-standing of the nature of two-phase flows. As more com-parative data become available it will be possible to refinethe mathematical model used for the simulation and alsoinvestigate the effects and validity of the different termsthat appear in the differential equations.
References
Marcus RD, Leung LS,Khnzing GE & Rizk F. pneu-matic Conueying of Solids. Chapman and Hall, Lon-don, 1990.
Ferretti G. Calcolo degli impianti per il transportopneumatico di materiali sfusi . Fluid, 1983 ,23Lf z3z,57-63.
3. Saccani C. A new simulation program for designingpneumatic conveyi.tg plants. Bulk Solids Handltng,1993, 13, 111-122.
oE2sA20o915
5o t'IL.Y
40 cLoE
30oJo
208(L10
10
1
2
5
4. Moody LF. Friction factors for pipe flow.Transactions, 1944, 66 , 671-678.
ASM E
Weber M. Friction of the air and the air/solids mix-ture in pneumatic conveying. Bulk Solids Handling,1991,11,99-102.
Lange LM. An analysis of fine particle gas/solids sus-pension flow in the dilute phase as a continuurR ac-cording to the pipe diameter. MSc (E"g) thesis. Fac-ulty of Engineering, University of the Witwatersrand,Johannesburg, 1989.
Van Straaten WH. The operating characteristics of ahigh efficiency axial cyclone in a dilute phase pneu-matic conveying system. MSc thesis. D.partment ofMechanical Engineering, University of Pretoria, Pre-toria, 1994.
Sheer TJ. Pneumatic conveyirg of ice particlesthrough mine shaft pipelines. PhD thesis. Facultyof Engineering, University of the Witwatersrand, Jo-hannesburg, 1991 .
Forsythe GE, Malcolm MA k Moler CB . ComputerMethods fo, Mathematical Computations. PrenticeHall, New Jersey, 1977 .
Wodrich KHK. A design program for pneumatic con-veyors. MEng (M.ch) thesis. Department of Mechan-ical Engineering, University of Stellenbosch, rggT.
6
7
8.
9
10
R & D Journal, I998, I4(2) 36