Embed Size (px)
Citation preview
12th Annual Conference of the International Association for the
History of Transport, Traffic and Mobility (T2M) Spinoffs of
Mobility: Technology, Risks & Innovation
Cycling infrastruture in São Paulo: Impacts of a leisure-oriented model
Letícia Lindenberg Lemos
MSc student in Urban and Regional Planning
University of São Paulo (USP)
Financial support by CAPES
Hélio Wicher Neto
MSc student in Planning and Management of Territory
Federal University of ABC (UFABC)
Financial support by UFABC
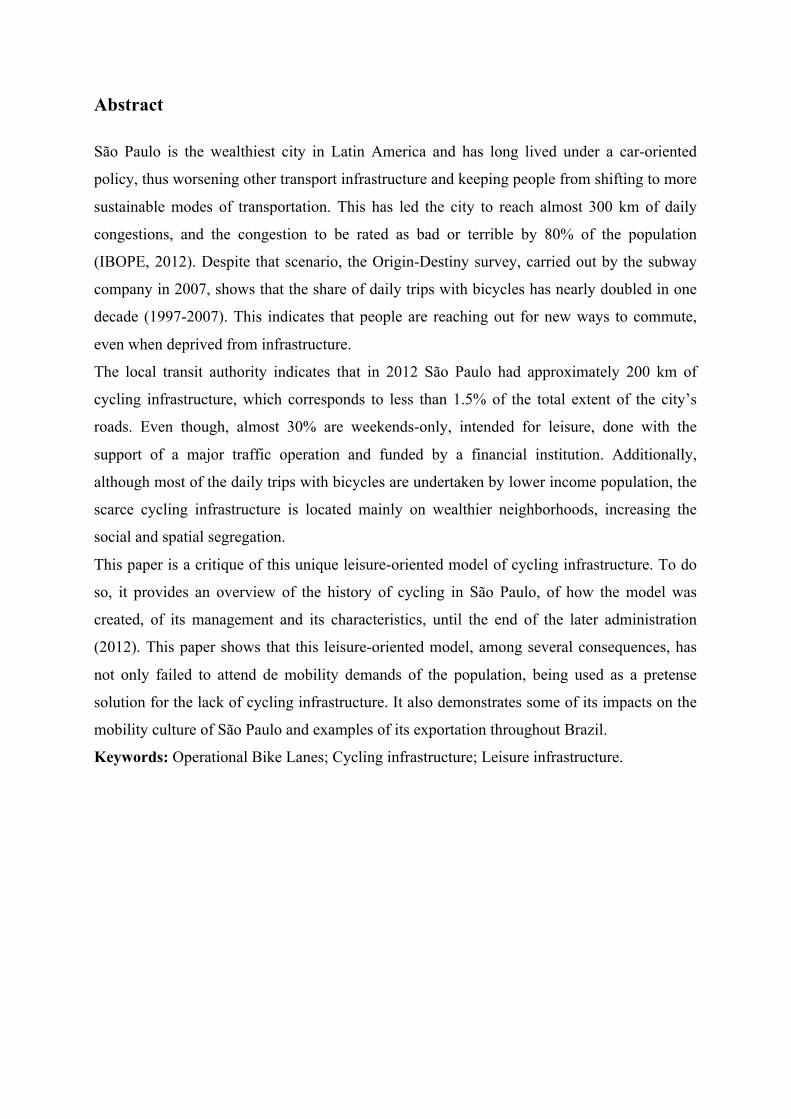
Abstract
São Paulo is the wealthiest city in Latin America and has long lived under a car-oriented
policy, thus worsening other transport infrastructure and keeping people from shifting to more
sustainable modes of transportation. This has led the city to reach almost 300 km of daily
congestions, and the congestion to be rated as bad or terrible by 80% of the population
(IBOPE, 2012). Despite that scenario, the Origin-Destiny survey, carried out by the subway
company in 2007, shows that the share of daily trips with bicycles has nearly doubled in one
decade (1997-2007). This indicates that people are reaching out for new ways to commute,
even when deprived from infrastructure.
The local transit authority indicates that in 2012 São Paulo had approximately 200 km of
cycling infrastructure, which corresponds to less than 1.5% of the total extent of the city’s
roads. Even though, almost 30% are weekends-only, intended for leisure, done with the
support of a major traffic operation and funded by a financial institution. Additionally,
although most of the daily trips with bicycles are undertaken by lower income population, the
scarce cycling infrastructure is located mainly on wealthier neighborhoods, increasing the
social and spatial segregation.
This paper is a critique of this unique leisure-oriented model of cycling infrastructure. To do
so, it provides an overview of the history of cycling in São Paulo, of how the model was
created, of its management and its characteristics, until the end of the later administration
(2012). This paper shows that this leisure-oriented model, among several consequences, has
not only failed to attend de mobility demands of the population, being used as a pretense
solution for the lack of cycling infrastructure. It also demonstrates some of its impacts on the
mobility culture of São Paulo and examples of its exportation throughout Brazil.
Keywords: Operational Bike Lanes; Cycling infrastructure; Leisure infrastructure.
Introduction
São Paulo is the wealthiest city in Latin America, with one of the highest GDP in the
world, and a population of over 10 million inhabitants. Historically this city has oriented its
transport infrastructure and policies towards motorized private vehicles (MPV)
(Vasconcellos, 1999; Rolnik & Klintowitz, 2011). Some of the actions taken include
enlarging roads and constructing bridges and tunnels exclusively for such vehicles, as well as
a rotating one-weekday ban on MPV, restricted hours for freight services, intelligent traffic
light system, among others, dedicating most of the municipal and state transportation budget
and human resources for such infrastructure (Vasconcellos, 1999; Rolnik & Klintowitz,
2011).
These actions aim at improving the traffic flow and level of service of roads and,
theoretically, the general mobility of the city. In 2012, the city's congestion was rated as bad
or terrible by 80% of its residents (IBOPE, 2012), nevertheless, the lack of adequate transport
infrastructure, e.g. bad conditions of public transport system and lack of commuting-oriented
cycling infrastructure, keeps people from shifting to more sustainable modes. Even though the
mobility model based on MPV has proven to be unsustainable and self-destructive, leading to
an increase of congestion to a point of collapse1, they continued to be implemented in the later
administrations (2009-2012).
In this scenario, the investment on cycling infrastructure in the city has been
secondary, leading to unsafe conditions for commuting cyclists. The Origin-Destiny survey
carried out in 2007 (OD-07)2 indicates that the share of daily trips using bicycles is still not
very representative in São Paulo (less than 1%). However it has increased almost 90% in a
ten-year period, while the total number of daily trips increased only approximately 20%3.
In 2012 the Traffic Engineering Company of São Paulo4 (CET-SP) indicated that the
city had around 200km of cycling infrastructure5. This accounts for less than 1.5% of the total
1 In 2009 the CET registered a historical record twice on the same day, 268 km and 294 km, half an hour apart. http://noticias.terra.com.br/transito/interna/0,,OI3817775-EI11777,00- Transito+bate+recorde+do+ano+em+SP+com+km.html 2 Origin/Destiny survey carried out by the subway company (Metrô SP) in 2007. 3 The purpose of this survey is to identify demand for the subway system, thus it is not totally accurate for measuring bicycle trips. Nevertheless, such increase is noteworthy. 4 Responsible for the planning and operating of the road system, under the Municipal Department of Transportation
extent of roads in the city and only nearly 70% on this extension is actually permanent, as will
be explained later on. Additionally, the permanent infrastructure lacks proper network
configuration and most of it has very poor access conditions. Furthermore, they were
implemented mainly on wealthier neighborhoods, even though the OD-07 shows that lower
income population is responsible for most of the daily trips with bicycles.
The remaining 30% of the alleged extension are intended for leisure, open only on
Sundays and national holidays, done with the support of a major traffic operation and funded
by a private financial institution. This paper debates this unique leisure-oriented model of
cycling infrastructure called Operational Bike Lanes. To do so, it is organized in three parts.
Initially, it gives an overview of the history of cycling policies in São Paulo. Then, it shows
how the Operational Bike Lanes were created and its alleged benefits. Finally, it discusses the
actual impacts that this model had on cycling policies and provision of infrastructure, as well
as on the relationship between drivers and cyclists.
Cycling in São Paulo
For analytical purpose, the history of the policies concerning the use of bicycles in
São Paulo can be divided into three main phases. These phases can be determined according
to level of institutionalization, organization and policies of the public sector and cycling
activism, as well as their approach on issues concerning the use of bicycle in the city.
The 1st phase, from early 1980 until early 1990, includes the first municipal plan
indicating a sectorial cycling infrastructure system and the first project for cycling
infrastructure (1981), both by the CET-SP. Those projects were strongly influenced by the
then newly published first Brazilian manual for planning cycling infrastructure, by the
GEIPOT6. (Malatesta, 2012, p. 17)
The 2nd phase, from early 1990 until late 2000, includes the first legal instruments
concerning cycling infrastructure, the first bicycle paths and the first version of the “Critical
Mass” in São Paulo7. On the federal level, in 1997 the new Brazilian Traffic Code (CTB),
5 http://www.cetsp.com.br/noticias/2012/10/04/ciclovia-na-avenida-braz-leme-foi-aberta-nesta-quinta- feira.aspx and http://sao-paulo.estadao.com.br/noticias/geral,com-sol-paulistanos-lotam-nova-ciclofaixa- imp-,958984 6 Governmental organ for the transportation policy integration within the Ministry of Transportation (Federal Government). It was a center for spreading projects, studies and consulting for transportation issues throughout Brazil. 7 Mass bicycle ride with the purpose of claiming better conditions, with a strong middle-class bias. It
Federal Law 9,503/1997, defined bicycles as vehicles and guaranteed cyclists the rights for
riding on streets and also instituted some rules for their circulation on traffic and a
requirement for minimum protection equipment. On the municipal level, three important laws
concerning cycling infrastructure were passed: (i) indicating a compulsory demarcation of
space for bike paths on new road infrastructure (Municipal Law 10,907/1990), (ii) The
Strategic Master Plan (Municipal Law 13,430/2002) defining that bike paths ought to be part
of the road system, and (iii) the Strategic Regional Plans (Municipal Law 13,885/2004) with
indication of a cycling network to be implemented. Additionally, in 2006, the first technical
work group within the city hall was created to attend cycling issues, initially led by
Municipal Department of Green and Environment (SVMA) and transferred to the Municipal
Department of Transportation (SMT) in 2009. Also during this period some small bike paths
were implemented on the median strip of avenues, yet without connection between each other
or with the public transport system, receiving criticism from the GEIPOT (2001, p. 76).
The 3rd phase, from late 2000 until the end of 20128, has seen a remarkable increase
on construction of cycling infrastructure, yet still unconnected, lacking proper network
configuration and most of it with very poor access. This period is also marked by the
foundation of the two major commuting-cycling advocacy organizations (Ciclocidade and
CicloBr) and the Cycling Infrastructure Planning Department (DCL) inside the CET-SP,
under supervision of SMT, all in 2009. Additionally, among the several fatal accidents with
cyclists that occurred during this phase, three had a major impact on the media because they
happened on major avenues of wealthy neighborhoods, involving middle class cyclists,
heating up the debate on cycling infrastructure in São Paulo.
In this context, the Operational Bike Lanes were created. Its initial goal was to create
a leisure space on Sundays, but it became a pretense solution for the cyclists demand. It was
also indicated by the CET-SP/DCL as an important tool to promote the use of bicycles and the
knowledge of regulations concerning it, as well as increase the perception of bicycle as a
vehicle, especially by drivers. According to them, it also contributed to the reduction of fatal
accidents with cyclists. (Malatesta, 2012, p. 50). It was also described as a “war operation”,
was inspired by the homonymous movement emerged in San Francisco, in the 1990s, and spread worldwide (Carlsson, 2012, p.10) for more information about the Critical Mass movement in São Paulo, see Benicchio, Thiago. Critical Mass is Dead. Long Live Critical Mass! IN: Carlsson, Chris (org.) (2012). Shift Happens! Critical Mass at 20. San Francisco: Full Enjoyment Books. 8 2012 was the last year of mayor Gilberto Kassab administration. It began in 2005, as vice mayor, being elected in 2008.
by a CET-SP/DCL coordinator at the 2011 ANTP9 congress, for it demands a major and
expensive traffic operation, among other measures, as will be discussed on the next item.
The Operational Bike Lanes
In mid-2008, the Municipal Department of Sports (SEME) designed a connection
between nine consolidated leisure areas in São Paulo. It mainly aimed at enlarging “the
number of sportsmen/women in the city” and promoting the use of public spaces by
pedestrians and cyclists (SEME, 2009, p.3). These connections would temporarily close some
streets for motorized traffic and turn them into leisure areas10. The circuit would sum up 22
km and had an estimated cost of circa USD$ 74,000.00 for initial infrastructure (signs,
paintings and traffic lights), and USD$ 8,700.00 per day of operation (more than 200
crossing/transit controllers)11. It aimed at addressing the scarcity of public leisure areas,
identified at the time by the population as one of the main deficits of the city (IBOPE, 2008).
Despite the fact that the operation to close the streets was intended to occur merely
on Sundays, from 7 A.M. to 1 P.M., the CET-SP issued a negative assessment due to the
“large impact to the mobility of the city” and to the blocking of access to businesses along the
closed lanes. The solution presented by them was to change the route to more suitable streets,
close only the lanes along the median strip, segregating them with traffic cones and specific
signs and ground painting, and restrict it only for cycling. According to the CET-SP/DCL
(Malatesta, 2012, p. 47), in this manner, the project would not only attend the leisure demand,
but also promote the coexistence of bicycles and the traffic of motorized vehicles and
pedestrians, hence an instrument to introduce bicycles as commuting-oriented vehicle.
In August 2009, the first Operational Bike Lane was implemented, with
approximately 5 km connecting the Ibirapuera and the Povo Parks. The operation was
restricted to Sundays, from 7 A.M. to 12 P.M. It was funded by the private bank Bradesco
through a cooperation agreement renewed every year, thus providing little assurance of its
continuity. As a counterpart, the financial institution was allowed to display their brand on
the cones, on stands and bicycles available for rental. It is important to note that this was an
9 National Public Transportation Association 10 This project was similar to the “Summer Streets” project, carried out in New York (for more information about the Summer Streets NY: http://www.nyc.gov/html/dot/summerstreets/html/about/about.shtml. 11 R$ 170,000.00 and R$ 20,000.00 respectively
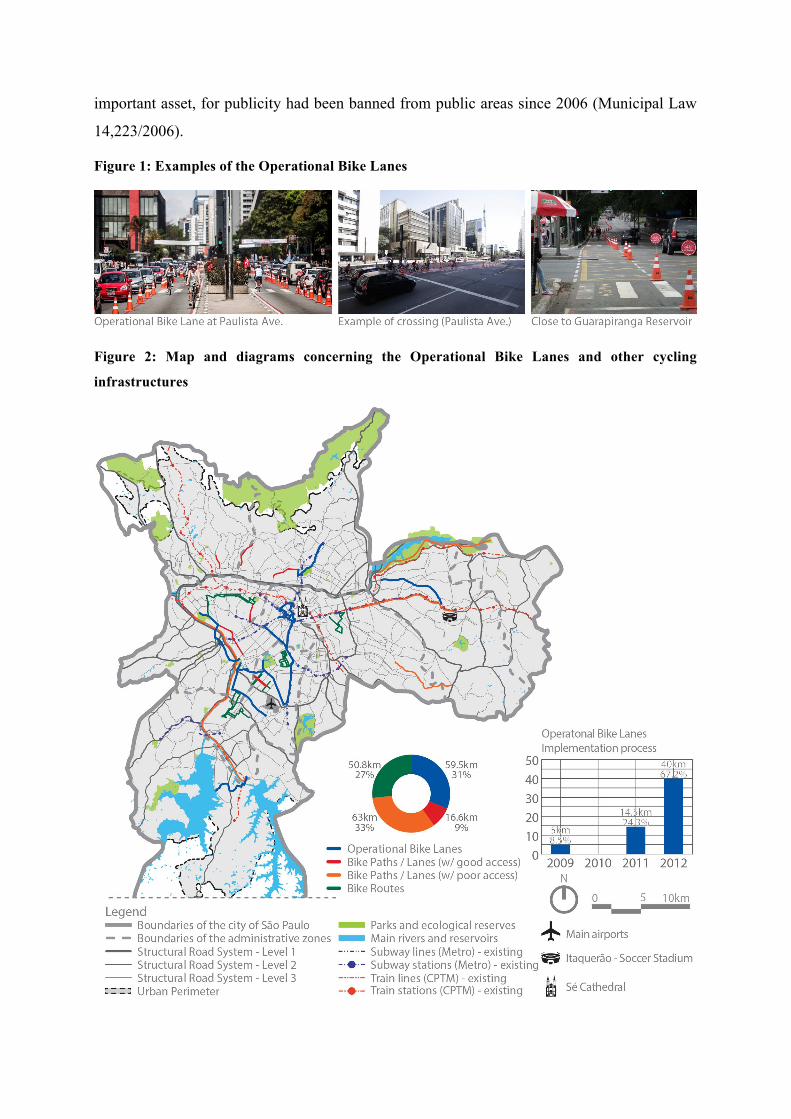
important asset, for publicity had been banned from public areas since 2006 (Municipal Law
14,223/2006).
Figure 1: Examples of the Operational Bike Lanes
Figure 2: Map and diagrams concerning the Operational Bike Lanes and other cycling
infrastructures
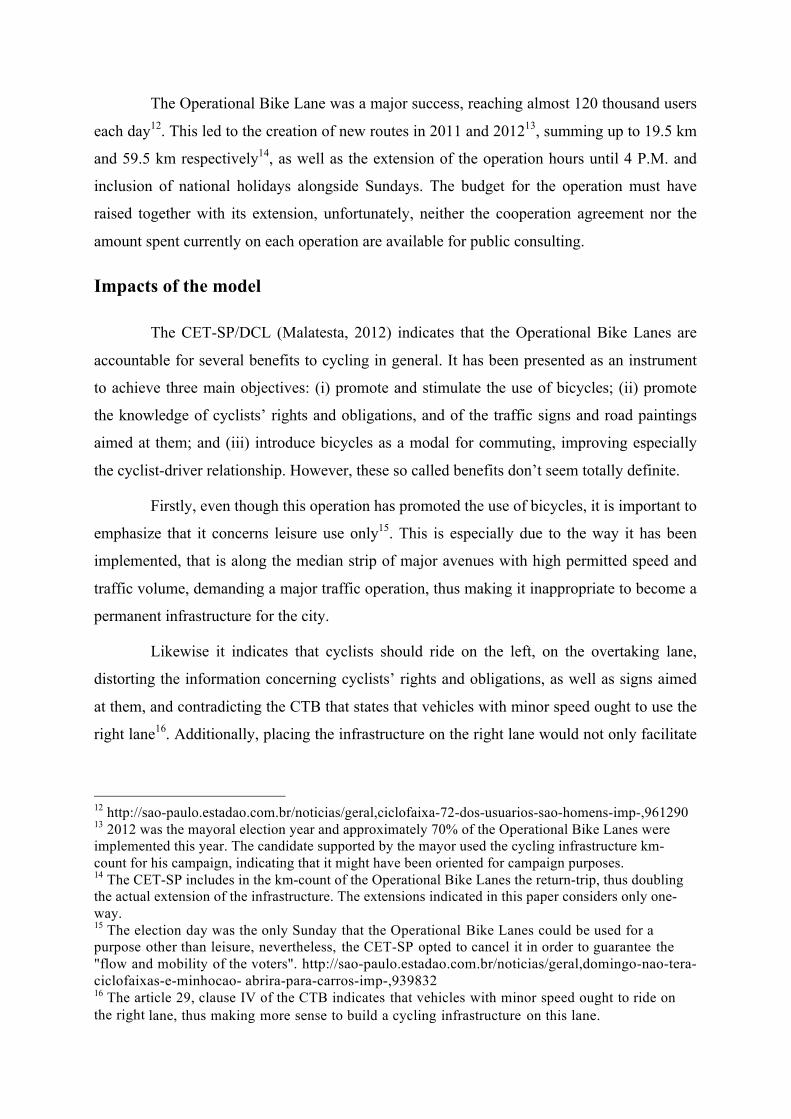
The Operational Bike Lane was a major success, reaching almost 120 thousand users
each day12. This led to the creation of new routes in 2011 and 201213, summing up to 19.5 km
and 59.5 km respectively14, as well as the extension of the operation hours until 4 P.M. and
inclusion of national holidays alongside Sundays. The budget for the operation must have
raised together with its extension, unfortunately, neither the cooperation agreement nor the
amount spent currently on each operation are available for public consulting.
Impacts of the model
The CET-SP/DCL (Malatesta, 2012) indicates that the Operational Bike Lanes are
accountable for several benefits to cycling in general. It has been presented as an instrument
to achieve three main objectives: (i) promote and stimulate the use of bicycles; (ii) promote
the knowledge of cyclists’ rights and obligations, and of the traffic signs and road paintings
aimed at them; and (iii) introduce bicycles as a modal for commuting, improving especially
the cyclist-driver relationship. However, these so called benefits don’t seem totally definite.
Firstly, even though this operation has promoted the use of bicycles, it is important to
emphasize that it concerns leisure use only15. This is especially due to the way it has been
implemented, that is along the median strip of major avenues with high permitted speed and
traffic volume, demanding a major traffic operation, thus making it inappropriate to become a
permanent infrastructure for the city.
Likewise it indicates that cyclists should ride on the left, on the overtaking lane,
distorting the information concerning cyclists’ rights and obligations, as well as signs aimed
at them, and contradicting the CTB that states that vehicles with minor speed ought to use the
right lane16. Additionally, placing the infrastructure on the right lane would not only facilitate
12 http://sao-paulo.estadao.com.br/noticias/geral,ciclofaixa-72-dos-usuarios-sao-homens-imp-,961290 13 2012 was the mayoral election year and approximately 70% of the Operational Bike Lanes were implemented this year. The candidate supported by the mayor used the cycling infrastructure km-count for his campaign, indicating that it might have been oriented for campaign purposes. 14 The CET-SP includes in the km-count of the Operational Bike Lanes the return-trip, thus doubling the actual extension of the infrastructure. The extensions indicated in this paper considers only one-way. 15 The election day was the only Sunday that the Operational Bike Lanes could be used for a purpose other than leisure, nevertheless, the CET-SP opted to cancel it in order to guarantee the "flow and mobility of the voters". http://sao-paulo.estadao.com.br/noticias/geral,domingo-nao-tera-ciclofaixas-e-minhocao- abrira-para-carros-imp-,939832 16 The article 29, clause IV of the CTB indicates that vehicles with minor speed ought to ride on the right lane, thus making more sense to build a cycling infrastructure on this lane.
cyclists’ access to bordering lots, but also serve as a protection for pedestrians against
motorized vehicles, especially at intersections.
The impact of the Operational Bike Lane on promoting commuting-oriented cycling
is difficult to measure. Nevertheless, it is possible to make some reflections based on the
observation. The way the operation is led, avoiding any point of negotiation between drivers
and cyclists, may pass on a message that riding bicycles in São Paulo is unsafe unless when
protected by a major operation, consequently inhibiting its use as commuting-oriented
vehicles under the present circumstances. Additionally, the Mobility Survey (2012) 17
indicates that during the five- year period that followed the OD-07, which corresponds to the
implementation of the model studied, the trips using bicycles didn't increase on the same rate
as the previous period.
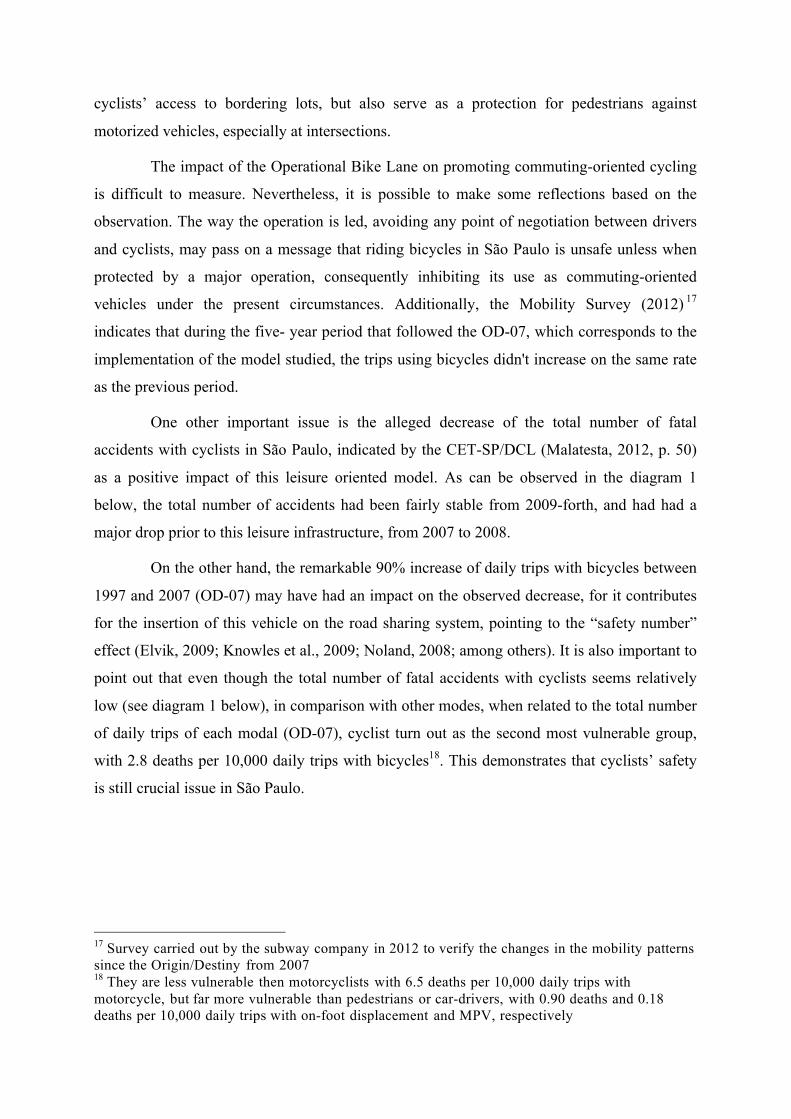
One other important issue is the alleged decrease of the total number of fatal
accidents with cyclists in São Paulo, indicated by the CET-SP/DCL (Malatesta, 2012, p. 50)
as a positive impact of this leisure oriented model. As can be observed in the diagram 1
below, the total number of accidents had been fairly stable from 2009-forth, and had had a
major drop prior to this leisure infrastructure, from 2007 to 2008.
On the other hand, the remarkable 90% increase of daily trips with bicycles between
1997 and 2007 (OD-07) may have had an impact on the observed decrease, for it contributes
for the insertion of this vehicle on the road sharing system, pointing to the “safety number”
effect (Elvik, 2009; Knowles et al., 2009; Noland, 2008; among others). It is also important to
point out that even though the total number of fatal accidents with cyclists seems relatively
low (see diagram 1 below), in comparison with other modes, when related to the total number
of daily trips of each modal (OD-07), cyclist turn out as the second most vulnerable group,
with 2.8 deaths per 10,000 daily trips with bicycles18. This demonstrates that cyclists’ safety
is still crucial issue in São Paulo.
17 Survey carried out by the subway company in 2012 to verify the changes in the mobility patterns since the Origin/Destiny from 2007 18 They are less vulnerable then motorcyclists with 6.5 deaths per 10,000 daily trips with motorcycle, but far more vulnerable than pedestrians or car-drivers, with 0.90 deaths and 0.18 deaths per 10,000 daily trips with on-foot displacement and MPV, respectively
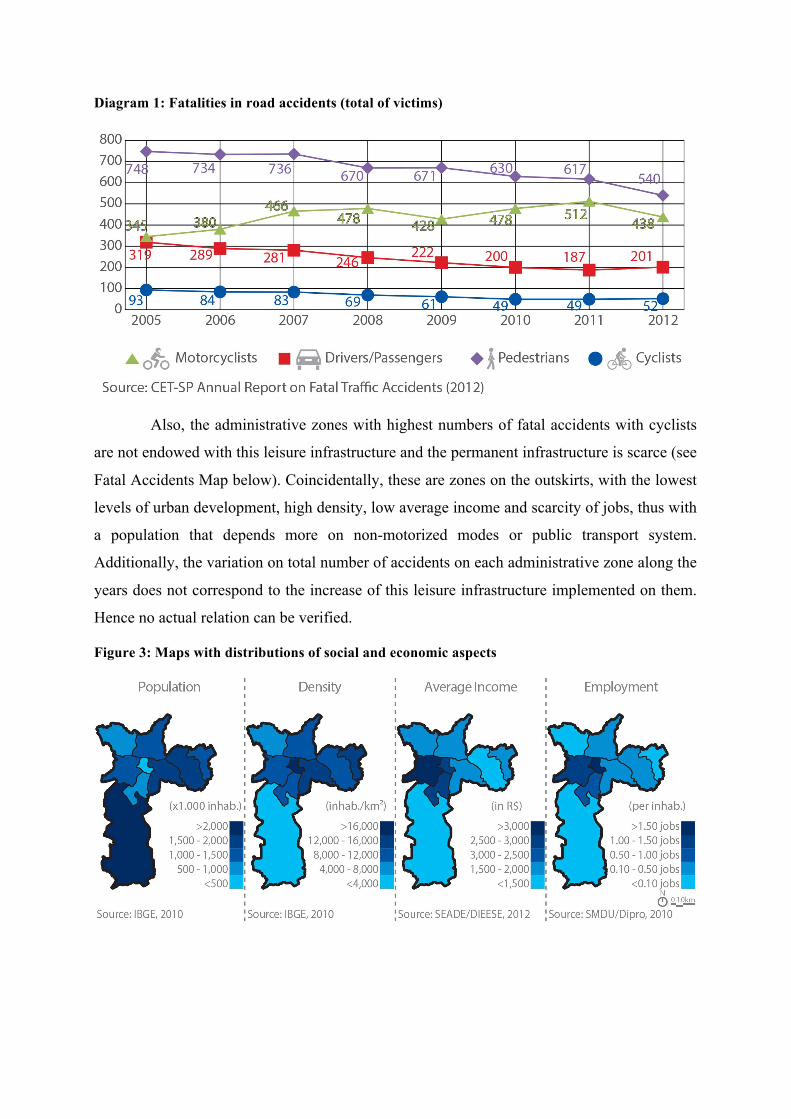
Diagram 1: Fatalities in road accidents (total of victims)
Also, the administrative zones with highest numbers of fatal accidents with cyclists
are not endowed with this leisure infrastructure and the permanent infrastructure is scarce (see
Fatal Accidents Map below). Coincidentally, these are zones on the outskirts, with the lowest
levels of urban development, high density, low average income and scarcity of jobs, thus with
a population that depends more on non-motorized modes or public transport system.
Additionally, the variation on total number of accidents on each administrative zone along the
years does not correspond to the increase of this leisure infrastructure implemented on them.
Hence no actual relation can be verified.
Figure 3: Maps with distributions of social and economic aspects
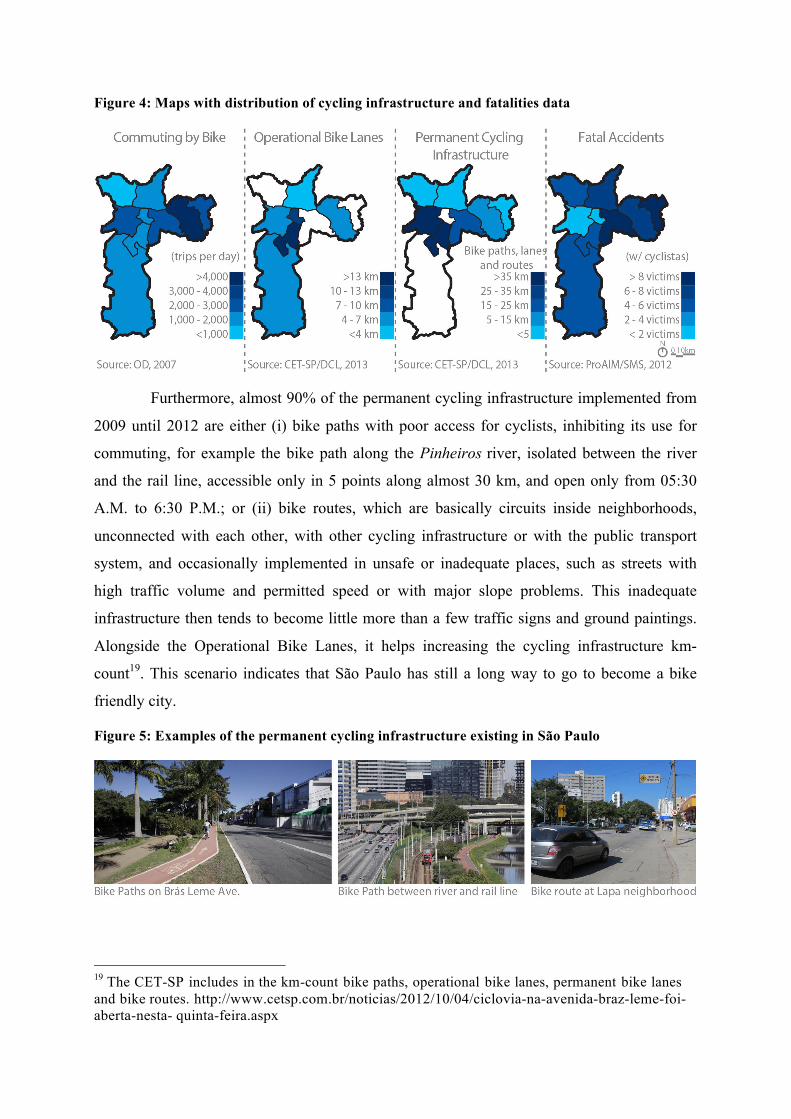
Figure 4: Maps with distribution of cycling infrastructure and fatalities data
Furthermore, almost 90% of the permanent cycling infrastructure implemented from
2009 until 2012 are either (i) bike paths with poor access for cyclists, inhibiting its use for
commuting, for example the bike path along the Pinheiros river, isolated between the river
and the rail line, accessible only in 5 points along almost 30 km, and open only from 05:30
A.M. to 6:30 P.M.; or (ii) bike routes, which are basically circuits inside neighborhoods,
unconnected with each other, with other cycling infrastructure or with the public transport
system, and occasionally implemented in unsafe or inadequate places, such as streets with
high traffic volume and permitted speed or with major slope problems. This inadequate
infrastructure then tends to become little more than a few traffic signs and ground paintings.
Alongside the Operational Bike Lanes, it helps increasing the cycling infrastructure km-
count19. This scenario indicates that São Paulo has still a long way to go to become a bike
friendly city.
Figure 5: Examples of the permanent cycling infrastructure existing in São Paulo
19 The CET-SP includes in the km-count bike paths, operational bike lanes, permanent bike lanes and bike routes. http://www.cetsp.com.br/noticias/2012/10/04/ciclovia-na-avenida-braz-leme-foi-aberta-nesta- quinta-feira.aspx
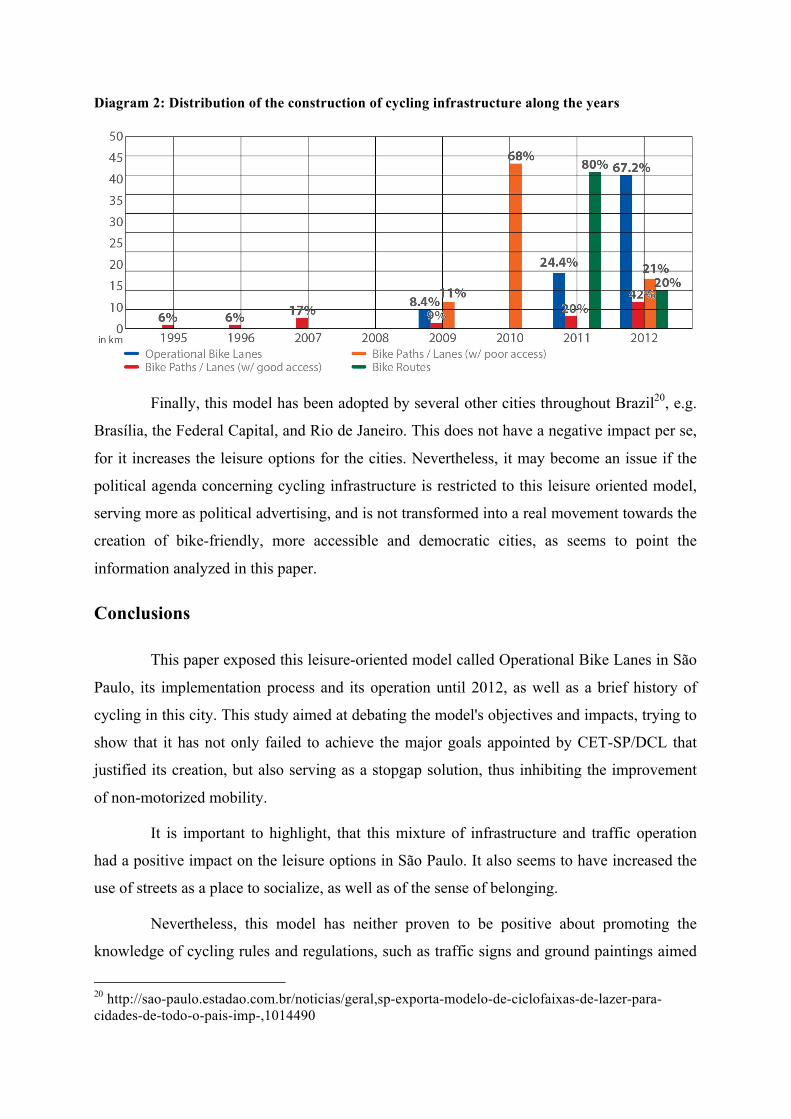
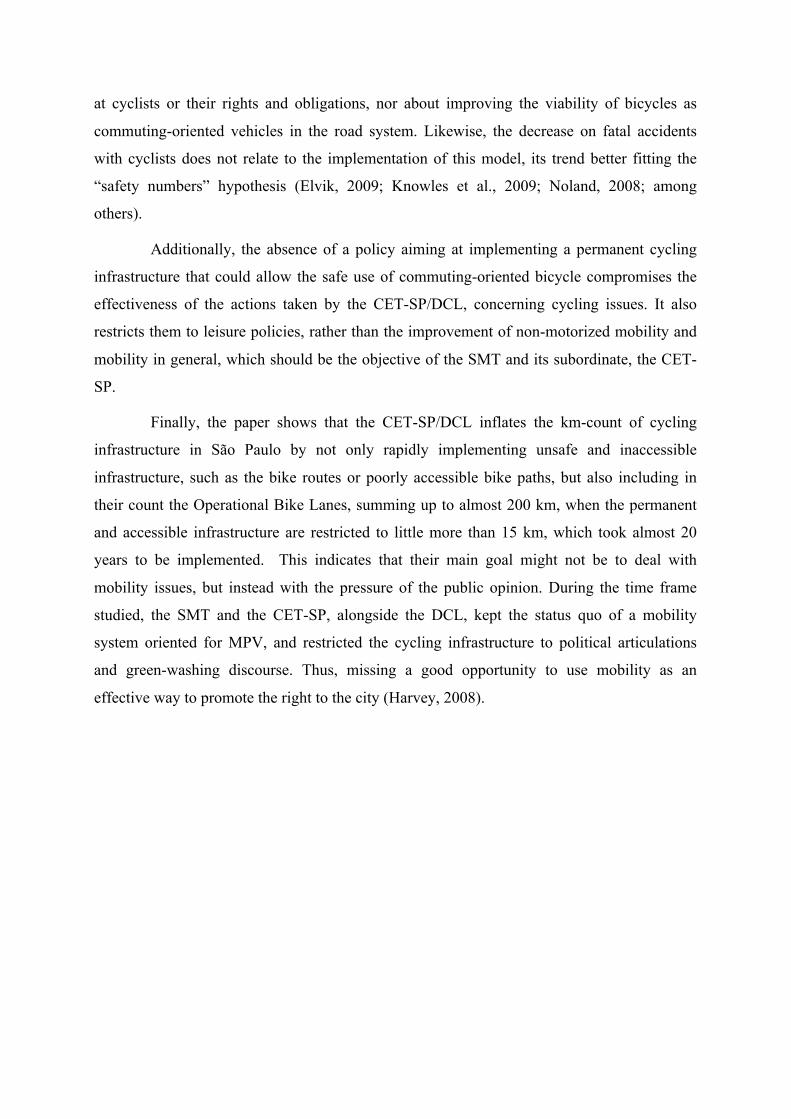
Diagram 2: Distribution of the construction of cycling infrastructure along the years
Finally, this model has been adopted by several other cities throughout Brazil20, e.g.
Brasília, the Federal Capital, and Rio de Janeiro. This does not have a negative impact per se,
for it increases the leisure options for the cities. Nevertheless, it may become an issue if the
political agenda concerning cycling infrastructure is restricted to this leisure oriented model,
serving more as political advertising, and is not transformed into a real movement towards the
creation of bike-friendly, more accessible and democratic cities, as seems to point the
information analyzed in this paper.
Conclusions
This paper exposed this leisure-oriented model called Operational Bike Lanes in São
Paulo, its implementation process and its operation until 2012, as well as a brief history of
cycling in this city. This study aimed at debating the model's objectives and impacts, trying to
show that it has not only failed to achieve the major goals appointed by CET-SP/DCL that
justified its creation, but also serving as a stopgap solution, thus inhibiting the improvement
of non-motorized mobility.
It is important to highlight, that this mixture of infrastructure and traffic operation
had a positive impact on the leisure options in São Paulo. It also seems to have increased the
use of streets as a place to socialize, as well as of the sense of belonging.
Nevertheless, this model has neither proven to be positive about promoting the
knowledge of cycling rules and regulations, such as traffic signs and ground paintings aimed
20 http://sao-paulo.estadao.com.br/noticias/geral,sp-exporta-modelo-de-ciclofaixas-de-lazer-para-cidades-de-todo-o-pais-imp-,1014490
at cyclists or their rights and obligations, nor about improving the viability of bicycles as
commuting-oriented vehicles in the road system. Likewise, the decrease on fatal accidents
with cyclists does not relate to the implementation of this model, its trend better fitting the
“safety numbers” hypothesis (Elvik, 2009; Knowles et al., 2009; Noland, 2008; among
others).
Additionally, the absence of a policy aiming at implementing a permanent cycling
infrastructure that could allow the safe use of commuting-oriented bicycle compromises the
effectiveness of the actions taken by the CET-SP/DCL, concerning cycling issues. It also
restricts them to leisure policies, rather than the improvement of non-motorized mobility and
mobility in general, which should be the objective of the SMT and its subordinate, the CET-
SP.
Finally, the paper shows that the CET-SP/DCL inflates the km-count of cycling
infrastructure in São Paulo by not only rapidly implementing unsafe and inaccessible
infrastructure, such as the bike routes or poorly accessible bike paths, but also including in
their count the Operational Bike Lanes, summing up to almost 200 km, when the permanent
and accessible infrastructure are restricted to little more than 15 km, which took almost 20
years to be implemented. This indicates that their main goal might not be to deal with
mobility issues, but instead with the pressure of the public opinion. During the time frame
studied, the SMT and the CET-SP, alongside the DCL, kept the status quo of a mobility
system oriented for MPV, and restricted the cycling infrastructure to political articulations
and green-washing discourse. Thus, missing a good opportunity to use mobility as an
effective way to promote the right to the city (Harvey, 2008).
References
CARLSSON, Chris (org.) (2012). Shift Happens! Critical Mass at 20. San Francisco: Full Enjoyment Books.
ELVIK, R. (2009). The non-linearity of risk and the promotion of environmentally sustainable transport. Accident Analysis and Prevention, Volume 41 (4), 849–855
GEIPOT (2001) Planejamento Cicloviário: Diagnóstico Nacional. Brasília, DF: Empresa Brasileira de Planejamento de Transportes, Ministério dos Transportes, Governo Federal. Retrieved July 16, 2013, from http://www.transportes.gov.br/
HARVEY, D. (2008). The Right to the City. New Left Review 53, 23-40. Retrieved Nov. 20, 2012, from http://newleftreview.org/II/53/david-harvey-the-right-to-the-city
IBOPE (2008). Indicadores de Percepção da Cidade de São Paulo (Interview survey). São Paulo, SP: IBOPE & Rede Nossa São Paulo. Retrieved July 26, 2013, from http://www.nossasaopaulo.org.br/portal/pesquisas
IBOPE (2012). Dia Mundial Sem Carro (Interview survey). São Paulo, SP: IBOPE & Rede Nossa São Paulo. Retrieved Nov. 05, 2012, from http://www.nossasaopaulo.org.br/ portal/pesquisas
KNOWLES, J., ADAMS, S., CUERDEN, R., SAVILL, T. REID, S., TIGHT, M. (2009).Collisions involving pedal cyclists on Britain’s roads: establishing the causes. Transport Research Laboratory Published Project. Report. PPR445
MALATESTA, M.E.B. (2012). A história dos estudos de bicicleta na CET (Boletim Técnico 50). São Paulo, SP: Companhia de Engenharia de Tráfego. Retrieved April 09, 2013, from http://www.cetsp.com.br/consultas/boletins-tecnicos.aspx
METRO (2008). Pesquisa Origem Destino 2007 Região Metropolitana de São Paulo. Retrieved May 28, 2013, from http://www.metro.sp.gov.br/metro/numeros-pesquisa/pesquisa-origem- destino-2007.aspx
NOLAND, R.B., QUDDUS, M.A., OCHIENG, W.Y. (2008). The effect of the London congestion charge on road casualties: an intervention analysis. Transportation 35 (1), 73–91
ROLNIK, Raquel and KLINTOWITZ, Danielle. (I)Mobilidade na cidade de São Paulo. Estudos Avançados. [online]. 2011, vol.25, n.71, p. 89-108.
SEME (2009) Ciclofaixa de Lazer no Fim de Semana (PowerPoint slides). Retrieved July 10, 2013, from http://www4.prefeitura.sp.gov.br/semebiblioteca/Arquivo_BLOG/ciclofaixa_ de_lazer.pdf.
VASCONCELLOS, E. A. de. Circular é preciso, viver não é preciso: a história do trânsito nacidade de São Paulo. São Paulo: Annablume: Fapesp, 1999.