Embed Size (px)
Citation preview

Cyclicality Has Not Been Repealed
Chemical Analysts of NYNovember 5, 2003
Dan Smith President and CEO

2
Safe Harbor Language
Statements in this presentation relating to matters that are not historical facts are forward-looking statements. These forward-looking statements are just predictions or expectations and are subject to risks and uncertainties. Actual results could differ materially, based on factors including but not limited to the cyclical nature of the chemical and refining industries; availability, cost and volatility of raw materials and utilities; governmental regulatory actions and political unrest; global economic conditions; industry production capacity and operating rates; the supply/demand balance for Lyondell's and its joint ventures' products; competitive products and pricing pressures; access to capital markets; and technological developments and other risk factors. For more detailed information about the factors that could cause our actual results to differ materially, please refer to Lyondell Chemical Company’s Annual Report on Form 10-K for the year ended December 31, 2002, filed in March 2003, and Lyondell’s Quarterly Report on Form 10-Q, which will be filed in November 2003.

3
You and your peers have raised several questions about the future of the ethylene industry
What will be the impact of future Asian/Middle East supply/demand balances?
– Will US operating rates remain depressed forever?
Are relatively high US polyethylene prices hastening the demise of the industry?
– Will the US become merely an importer of resins and products?
– Will the US lose its entire converter industry?
Do the economics of production allow US producers to survive?
– Has a change in energy costs made the US non-competitive?

4
0
1
2
3
4
5
1986 1989 1992 1995 1998 2001 2004 2007
There is a growing consensus that the global economy is beginning to emerge from a difficult period:
(Percent change in real GDP)Global GDP
Source: Global Insights

5
-8-7-6-5-4-3-2-10123456789
10
1987
1988
1989
1990
1991
1992
1993
1994
1995
1996
1997
1998
1999
2000
2001
2002
2003
2004
2005
2006
2007
2008
U.S
. Gro
wth
( Y
r/Y
r %
)
Ind Production GDP
US GDP and Industrial Production
It’s not atypical for industrial production to fall more than GDP but recovery is lagging
Source: Global Insights

6
The US economy should begin to benefit from economic stimulus
Δ GDP
Leads to After
Stimulus Change 1 Year 2 Years Actual Change
Fed Rate Reduction 100 BP 0.6 1.7 150 BP
Real Dollar Decline 10% 0.4 1.6 18%
Income Tax Reduction 1% of GDP 0.4 0.8 3%
Stock Price Increase 20% 0.4 0.8 Flat
Oil Price Decline $10/bbl 0.2 0.4 Up $8
* Source: Fed Reserve, Jan. 1999

7
We believe that global ethylene supply/demand is on a path to a tight balance
175
200
225
250
275
300
Current (2003) 2007 - Base '07 + 2% Growth '07 - 18 Mo Delay
Wo
rld
Eth
yle
ne
Su
pp
ly -
De
ma
nd
(bil
lio
n p
ou
nd
s/y
ea
r)
Effective Capacity Demand
Source: CMAI

8
The companies adding capacity have much at stake at their existing facilities
Company New Capacity* Existing Capacity*
Dow 360 24,970
ExxonMobil 300 18,510
Shell 1,890 14,370
Sabic 2,870 12,100
BP 1,920 10,230
Top 5 Total 7,340 80,180
* MM Lbs/Year per CMAI
Source: CMAI

9
0
20
40
60
80
100
120
0 5,000 10,000 15,000 20,000 25,000 30,000 35,000 40,000
2000 GDP/Capita
PE
Co
nsu
mp
tio
n/c
apit
a, lb
s
US
Korea
Taiwan
WE
Singapore
Japan
Thailand
Malaysia
ChinaIndiaIndonesia
The emergence of a middle class increases local demand for plastics
Source: CMAI 2001

10
Even forecasters that have recently developed negative outlooks continue to forecast growth in the US market
Quarterly U.S. Ethylene Demand Vs GDP
4
6
8
10
12
14
16
18
20
3.0 5.0 7.0 9.0 11.0 13.0
GDP - Trillion $ (constant 1996 $'s)
NPRA Quarterly Demand
CMAI Based Forecast
30-Year Trendline
2010
1970
2003
Source: SRI, CMAI, NPRA, US Govn.
Qu
arte
rly
Eth
ylen
e D
eman
d
(B
l. L
bs)

11
When all factors are considered, exporting is not always profitable
Basis: 1 B lbs Producer
Domestic Margin - 17¢ / lb
5% Exports
Export Margin
Export Profit
Neutral Domestic Market Response
¢ / lb $ MM / Yr% Returned
to US Price Impact,
¢ / lb
2 1 12% 0.1
5 2.5 30% 0.26
Source: Lyondell Chemical Company

12
We believe that resin importation growth is a temporary phenomena
0
5
10
15
20
25
30
35
40
HM
W H
DPE
Im
port
ed R
esin
MM
lbs.
0
10
20
30
40
50
60
Spr
ead
cent
s/lb
.
HMW HDPE Imported Resin MM lbs. HMW Price Spread to Feedstock
Source: CMAI

13
Labor costs are the primary driver behind the importation of bags and sheet
0
10
20
30
40
50
60
70
80
U.S. China to U.S. China to U.S. @ equal RM Cost
Bag
Pro
du
ctio
n C
ost
, cen
ts/lb
U.S. Domestic Freight
Ocean Freight
Conversion ex labor
Labor
Raw Material
Source: CMAI & Lyondell
14
You should not extrapolate bag imports to the demise of the US ethylene industry
Bag/Film Imports As Percent of N. American Ethylene
Demand
0
10
20
30
40
50
60
70
80
90
100
'96 '97 '98 '99 '00 '01 '02
%
US PE Bag Imports
0
100
200
300
400
500
600
700
NAFTA Asia w/oJapan
ROW
1997 2002$MM
Source: Global Trade Information ServicesSource: CMAI

15
Despite the pressure caused by resin prices some converters have maintained a reasonable margin
16
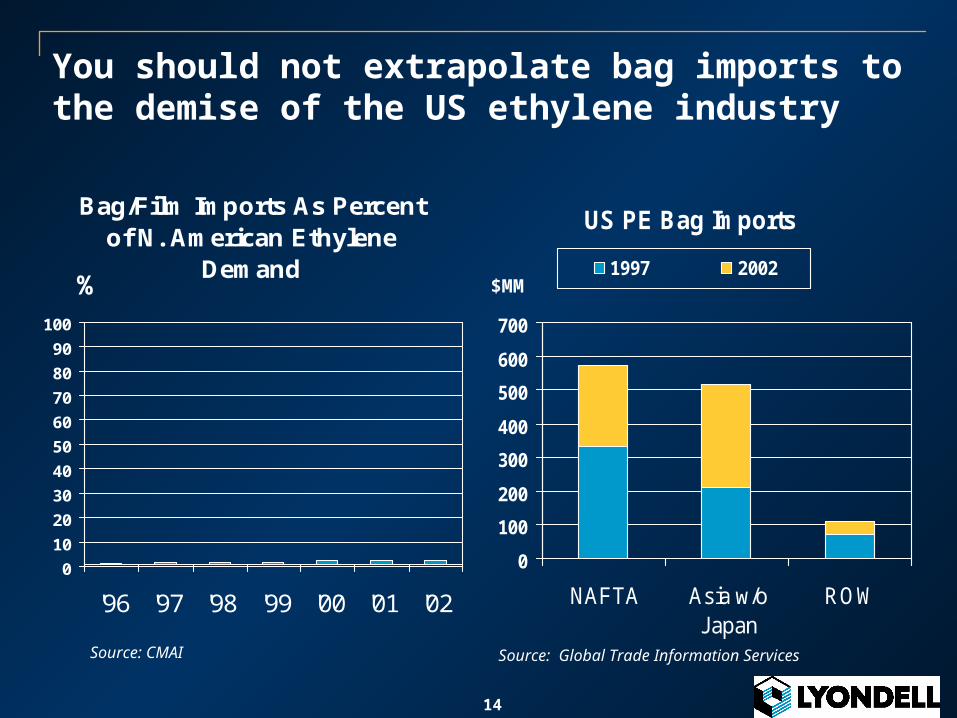
It is important to consider the economics of the incremental supplier as well as the full cost of the new capacity
Delivered to China
05
1015202530354045
Saudi - Ethane Asia - Naphtha NA - Ethane
Cash Costs w/Freight Capital Recovery
Po
lyet
hyl
ene
Cas
h C
ost
(ce
nts
/lb d
eliv
ered
)
Source: PACE, Lyondell estimate

17
Existing US capacity is competitive in its home market – E/P crackers are likely to be the high cost global facilities
Delivered to U.S.
05
1015202530354045
Saudi - Ethane Asia - Naphtha NA - Naphtha NA - Ethane
Cash Costs w/Freight Capital Recovery
Po
lyet
hyl
ene
Cas
h C
ost
(cen
ts/lb
del
iver
ed)
Source: PACE, Lyondell estimate

18
Growing global demand will increasingly be supplied by gas based raw materials
Global Ethylene Supply by Feed Type
0
20
40
60
80
100
120
140
Current (2003) Additions (2008)
Eth
ylen
e S
uppl
y - H
eavy
vs
Ligh
t (b
illio
n po
unds
/ ye
ar)
Heavy Liquid NGL Based
19
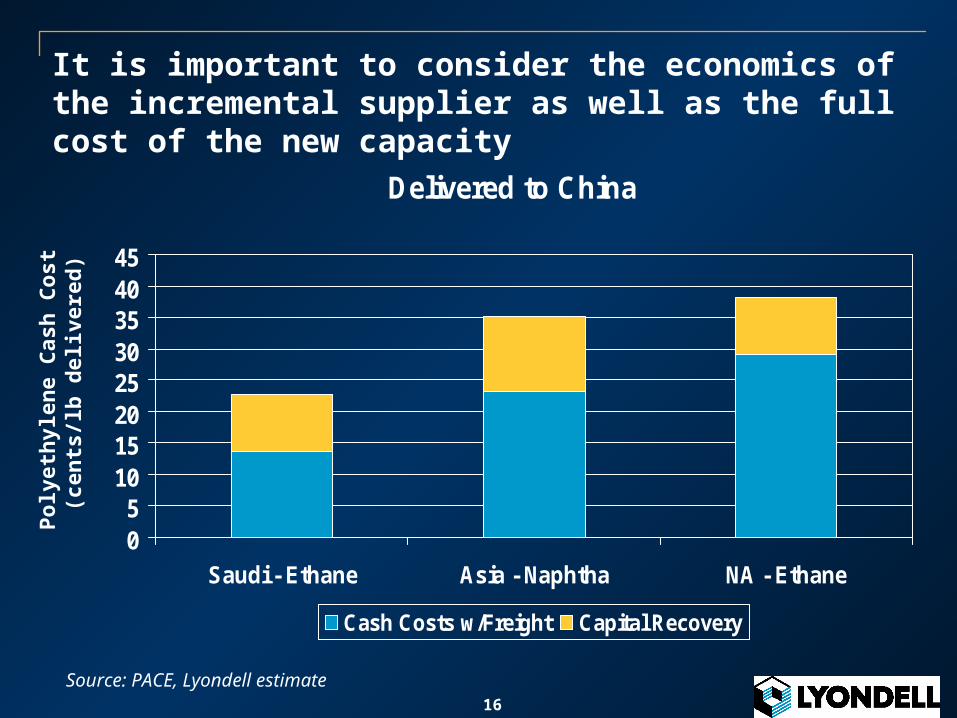
Future Ethylene Capacity Additions Favor a Growing Liquid Raw Material Advantage
2003 -- 2008 Current Demand Olefins Plant
Demand Growth Supply Growth ΔBlbs Blbs Blbs Blbs
Ethylene 213 52 51 (1)
Propylene 124 34 12 (22)
Source: CMAI September
20
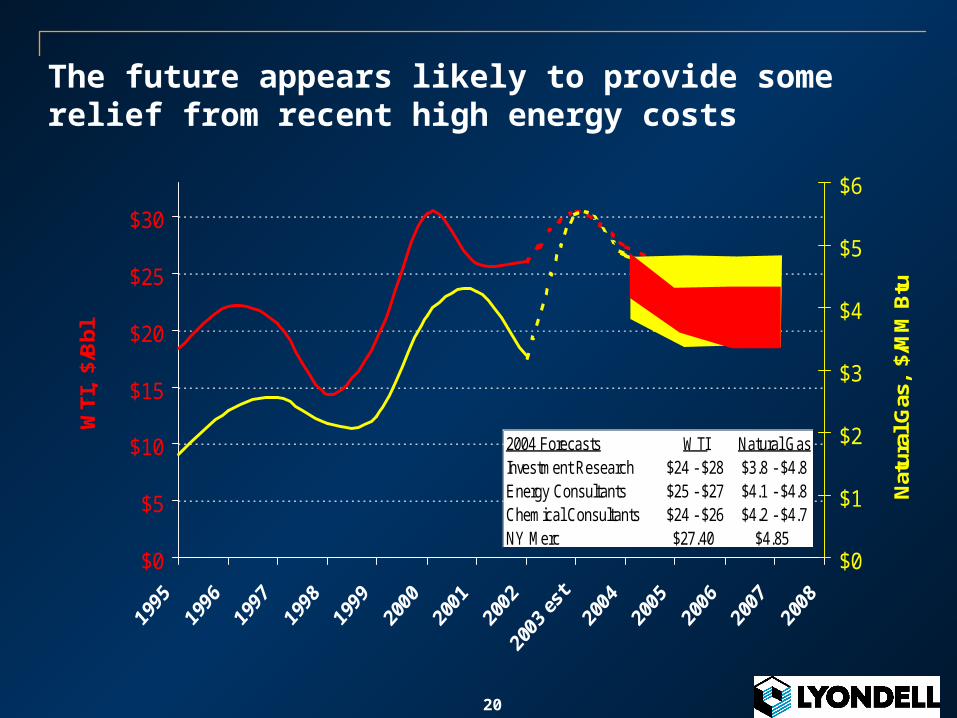
The future appears likely to provide some relief from recent high energy costs
$0
$5
$10
$15
$20
$25
$30
WTI
, $/
Bbl
$0
$1
$2
$3
$4
$5
$6
Nat
ural
Gas
, $/
MM
Btu
2004 Forecasts WTI Natural GasInvestment Research $24 - $28 $3.8 - $4.8Energy Consultants $25 - $27 $4.1 - $4.8Chemical Consultants $24 - $26 $4.2 - $4.7NY Merc $27.40 $4.85

21
It appears that natural gas in the US will be more closely coupled to global energy prices
Oct
Nov
Dec
Jan-03
Feb
Mar
Apr
May
Jun
Jul
Aug
Sep
Oct
Natural Gas & Substitutes Price Trend
$3
$4
$5
$6
$7
$8
$9
Oct
Nov
Dec
Jan-
03
Feb
Mar
Apr
May Jun
Jul
Aug Sep Oct
Nov
Dec
Jan-
04
Feb
Mar
$/M
MBtu
NYMEX
Natural Gas
Source: NYMEX
Distillate
Residual Fuel

22
It appears that natural gas in the US will be more closely coupled to global energy prices
0
2
4
6
8
10
12
14
16
18
1999 2000 2001 2002 2003 2004 2005 2006 2007 2008 2009
LNG
Cap
acity
- B
CF/
D
Existing Terminals
Announced North American Growth Actual
ImportsImport Capacity
Source: Platt's Publications
23
This analysis drives our industry view, actions, and strategy
Industry view
– Global and domestic industries will both continue to grow
– Demand will drive increased operating rates and the cycle will turn
– Liquid cracking offers significant leverage and value
– Chasing the incremental export sale generally destroys value
Actions
– Focus on domestic market
– Ethylene expansion must be advantaged and is not a priority
Strategy
– Operationally focus on Operational Excellence
– Financially focus on liquidity and debt reduction

24
We would like to leave you with some other thoughts to consider
Is there evidence that the global demand for plastics is decreasing? Or conversely will global development accelerate its usage?
Is there evidence that new ethylene plants are significantly more efficient than existing plants? Or does the investment in new capital mean they are less cost effective?
Are the middle east countries likely to give away the value of stranded ethane? Or is it more likely to follow the path of crude oil that at one time cost less than $3/bbl?
Will the major oil companies and your banks rush to subject their current investment exposure to excess incremental supply?
Has cyclicality been repealed?