Embed Size (px)
Citation preview
Cyclical Investing:Mr. Market Goes to Rehab
Bob RobottiRobotti & Company Advisors
Ben Graham Centre's 2019 Value Investing ConferenceApril 2, 2019

Our Foundation
Page 2
• Valuation is the foundation of our investment process.
• We believe that market prices of securities do not necessarily indicate their true economic worth.

Commonalities Among Value Investors
Page 3
Expensive
Quality
Graham and Dodd
Cheap
Valu
atio
n
Low High
Warren Buffett
“Ideal”
“To me, value investing is a big tent that accommodates many different people. At one end of the tent there isBen Graham, and at the other end of the tent there is Warren Buffett, who worked with Graham and then went outon his own and made adjustments to the teachings of Ben Graham.”
- Jean-Marie Eveillard (Graham and Doddsville – Winter 2007 Ed.)

Common Themes
Page 4
• Many value investors say they look for companies or industries that are beaten-up, out of favor, or out of fashion - ugly ducklings.
• However, we find it most common for investors to avoid near-term uncertainty at all cost and only invest once the dust has settled.
• We concentrate on understanding the long-term normalized earning power of a business well before it turns into a swan.
• Industries facing significant short-term headwinds / “unknowns.”
• Individual companies that are certainly not immune to the industry-wide issues and may even have more serious complications.
• The dynamics are in place for very long runways of growth once headwinds dissipate.
Ugly Ducklings
Long Runways

Understanding the Value of Economic Cycles
Source: Capital Returns, Edward Chancellor, editor (2015)Page 5
• Statistically Cheap
• Differentiated business / Competitive advantage
• Large inside ownership
• Ability to be opportunistic through the downturn
→ Improved earning power
Economic cycles resemble Schumpeter’s process of creative destruction:
New entrants attracted by prospect of high returns: Investors
Optimistic
Rising competition causes returns to fall below cost of capital:
Share Price Underperforms
Business investment declines, industry
consolidation, firms exit:
Investors Pessimistic
Improving supply side causes returns to rise above cost of capital:
Share Price Outperforms
Hunting ground for value investors

Cyclicals Amplify Mr. Market’s Manic Depressive Nature
Page 6
“A business which sells at a premium does so because it earns alarge return upon its capital; this large return attractscompetition; and generally speaking, it is not likely to continueindefinitely. Conversely in the case of a business selling at alarge discount because of abnormally low earnings. Theabsence of new competition, the withdrawal of old competitionfrom the field, and other natural economic forces should tendeventually to improve the situation and restore normal rate ofprofit on the investment.”
Security Analysis (1934 Edition)Benjamin Graham and David Dodd

Today’s Value Investor Bias
“If you want to have a better performance than thecrowd, you must do things differently from thecrowd.” - Sir John Templeton
Page 7
Investing Checklist
Is this company cyclical?
Is the business tied to commodity prices?
Is the business capital intensive?
Is the balance sheet levered?
Is there potential technological disruption?
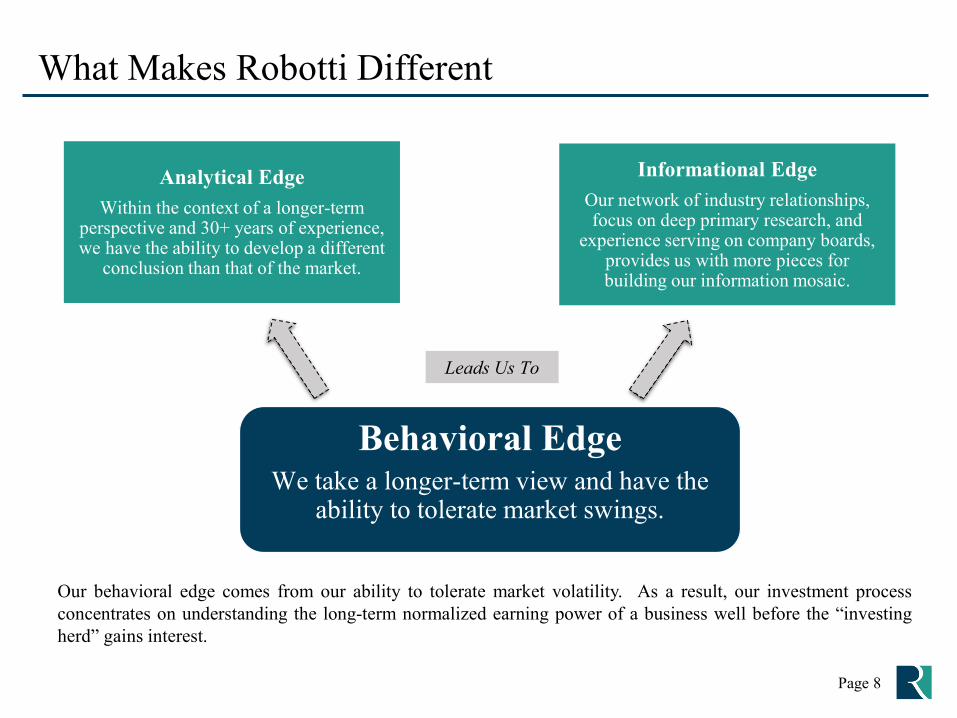
What Makes Robotti Different
Behavioral EdgeWe take a longer-term view and have the
ability to tolerate market swings.
Leads Us To
Our behavioral edge comes from our ability to tolerate market volatility. As a result, our investment processconcentrates on understanding the long-term normalized earning power of a business well before the “investingherd” gains interest.
Analytical EdgeWithin the context of a longer-term
perspective and 30+ years of experience, we have the ability to develop a different
conclusion than that of the market.
Informational EdgeOur network of industry relationships, focus on deep primary research, and
experience serving on company boards, provides us with more pieces for building our information mosaic.
Page 8

Stolt-Nielsen Limited (OB:SNI)
Source: Stolt-Nielsen 2018 Annual Report, S&P Capital IQ, Stolt-Nielsen websitePage 9
Consensus Est.(Annual) FY '17 FY '18 FY '19E FY '20ERevenue 1,997.1 2,125.5 2,159.6 2,240.0
growth 6.2% 6.4% 1.6% 3.7%ev/sales 1.5x 1.4x 1.4x 1.3x
EBITDA 447.3 435.3 494.9 544.1margin 22.4% 20.5% 22.9% 24.3%ev/EBITDA 6.7x 6.9x 6.1x 5.5x
Diluted EPS $0.81 $0.89 $1.79 $3.01p/e 15.4x 14.1x 7.0x 4.2x
• Stolt-Nielsen, the world’s largest provider oftransportation and storage for bulk liquidchemicals, was founded in 1959 by Jacob Stolt-Nielsen, a pioneer of the parcel tanker industry.
• Stolt’s three main business segments include:(1) Stolt Tankers, (2) Stolthaven Terminals, and(3) Stolt Tank Containers.
1 In 11/2016, 7mm treasury shares were used as collateral for a $60mm revolver. To comply with Bermuda law, ownership of these shares was transferred to Stolt-Nielsen Finance Ltd, a wholly owned subsidiary, which holds these shares on behalf of the lender. These shares are no longer included in Treasury shares and are included within Paid-In Surplus. For the purposes of IFRS EPS, these shares are considered as outstanding. Robotti Advisors adjusts for these shares when calculating market cap & enterprise value.
Market CapitalizationPrice $12.51
Dil Shrs⁽¹⁾ 54.3Market Cap $680
LT Debt 2,392Cash 65
Enterprise Value 3,007Net Debt 2,328Net Debt/EBTIDA (ttm) 5.3x52 Week Hi $16.8552 Week Lo $11.00$US as of March 28, 2019• Other segments include Sea Farm, and
Stolt-Nielsen Gas where the companyholds equity investments in Golar LNG& Avance Gas.
• At roughly 50% of book value webelieve shares of the stock are cheap.

Stolt-Nielsen Summary
Page 10
Stolt-Nielsen is the world leader of a niche oligopoly.
The chemical tanker business has certain dynamics that differentiate it from other segments of the shipping industry.
Complex assets necessary for segregated cargo limit the ease of industry entrance.
New build activity for chemical tankers is relatively limited.
Headwinds over the past ten years cloud underlying structural changes – creating an opportunity.
The terminal segment and container segment continue to provide high ROCE growth opportunities while creating strong synergies between the three primary segments.

Strong Synergies Between the Three Main Segments
Page 11Source: Stolt-Nielsen Investor Roadshow Presentation (5/8/2013)

Chemical Tankers: An Industry Niche
Source: Clarksons Platou “Good, awesome and mega” (2/12/18), Stolt-Nielsen Investor Presentation (4/2013)Page 12
• Specialized chemical tankers are complex and often purpose-builtdifferentiating them from other more commoditized ships.
• Historically, fragmentation created a very competitive environment whilethe industry’s inherent cyclicality led to volatile earnings.
Specialized Products Fleet Market Segmentation Basic Chemical Tanker
Complex Segregated Tanker

Super-Segregated Niche
Source: Odjfell Q4 2017 Earnings PresentationPage 13

Chemical Tanker Fleet Utilization
Page 14Source: Clarksons Platou Specialized Projects, Clarksons Platou Securities
Asia Financial Crisis: Overbuild leads to oversupply
Favorable supply/demand creates conditions for strong pricing –mitigated due to price fixing
Price fixing in response to oversupply
Overbuild due to PE entry

Chemical Tankers: Demand Outlook
Page 15Source: Chermbulk Investor Presentation (1/16/18)

Demand Tailwinds: Increasing Chemical Trade Flows
Page 16Source: Royal Vopak Q4 2017 Investor Roadshow Presentation
Increasing chemical trade flows will not only benefit the tanker business but will also provide a boost to the terminals and containers segments.

Stolthaven Terminals: Segment Overview
Page 17
Stolthaven Terminals is a global provider of high quality storage services for bulk-liquid chemicals, edible oils, acids and clean petroleum products.
• Stolthaven Terminals operates 17 owned & JV terminals with 4.7 million m3
of capacity.• With a similar global reach,
customer base and handlingexpertise Stolthaven Terminalsbenefits from synergies with StoltTankers and Stolt Containers.
• Over $1 billion has been investedin terminals since 2010 adding>800,000 cbm, almost doublingcapacity.
Source: Stolt-Nielsen 2018 Annual Report, Stolt-Nielsen Q4 2017 Earnings Presentation

Stolt Tank Containers: Segment Overview
Page 18
Stolt Tank Containers operates the world’s largest fleet of intermodaltanks designed to transport shipments of bulk-liquid chemicals and food-grade products door-to-door by road, rail and containership.
• Stolt Tank Containers operates 39,000 tank containers across a globalnetwork of 21 owned & JV depots.
• The tank containers segment has consistently earned double digitreturns on capital employed.
Source: Stolt-Nielsen 2018 Annual Report, Swedbank Report (2/27/18)
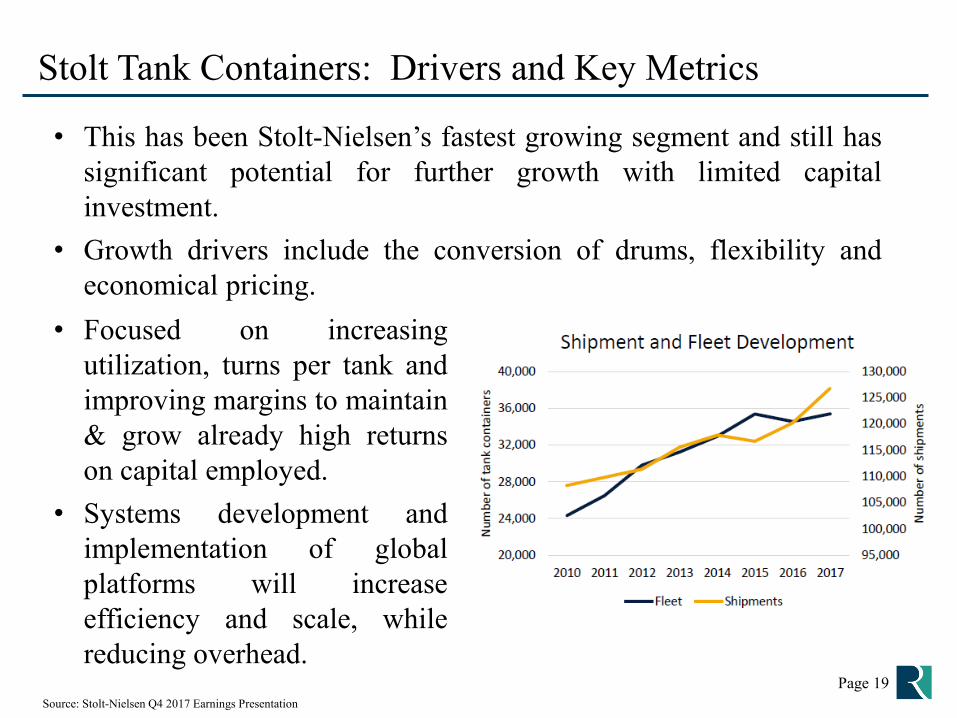
Stolt Tank Containers: Drivers and Key Metrics
Page 19
• This has been Stolt-Nielsen’s fastest growing segment and still hassignificant potential for further growth with limited capitalinvestment.
• Growth drivers include the conversion of drums, flexibility andeconomical pricing.
• Focused on increasingutilization, turns per tank andimproving margins to maintain& grow already high returnson capital employed.
• Systems development andimplementation of globalplatforms will increaseefficiency and scale, whilereducing overhead.
Source: Stolt-Nielsen Q4 2017 Earnings Presentation

Risks To Our Thesis
Page 20
• ROIC weakness may continue for longer than expected.
• Balance sheet leverage increases liquidity risk.
• Rising interest rates could lead to refinancing risk.
• Corporate governance issues may arise due to family control.
• Entry into the LNG business has hallmarks of prior missteps: An excellent business model but difficult operational execution and insufficient capital lead to the inability to realize profits and increase the risk of over-leveraging the entire enterprise.

Subsea 7 S.A. (OB:SUBC)• Subsea 7 (OB:SUBC) is a global leader in seabed-
to-surface engineering connecting seabed wellheadstructures to surface production facilities.
• Industry headwinds, revenue declines and margincompression in recent years have led to anoligopolistic market with barriers to entry thatcontinue to increase over time.
• Current energy prices are below the long-termsustainable price needed and will likely result inincreased project sanctions as the impact ofproduction decline manifests.
• The inventory of deep and ultra-deep waterdiscoveries not yet sanctioned continues to growcreating the potential for significant revenue growthand increased returns on capital.
Subsea 7 is our highest conviction energy investment idea. With a durable competitive advantage, long-term dynamics are in place for
significant growth.
Source: Subsea 7 Financial Statements, S&P Capital IQPage 21
Market CapitalizationPrice $12.26
Dil Shrs 327.2Market Cap $4,012
LT Debt 258Minority Interest 38Cash 765
Enterprise Value $3,544$US as of March 28, 2019
Consensus Est.(Annual) FY '17 FY '18 FY '19E FY '20ERevenue 3,986 4,074 3,891 4,263
growth 11.7% 2.2% (4.5%) 9.6%ev/sales 0.9x 0.9x 0.9x 0.8x
EBITDA 1,035 669 593 708margin 26.0% 16.4% 15.2% 16.6%ev/EBITDA 3.4x 5.3x 6.0x 5.0x
Diluted EPS $1.36 $0.56 $0.23 $0.52p/e 9.0x 21.9x 54.4x 23.4x

SURF and ConventionalEngineering, construction,installation and procurement ofsubsea umbilicals, risers andflowlines (SURF). Most SURFprojects involve fixed priceEPIC services agreements.Conventional includes thefabrication and installation offixed platforms and associatedpipelines
Renewables & Heavy LiftingServices over the life of a field’sproduction, including inspection,repair & maintenance
i-Tech ServicesInspection, maintenance andrepair (IMR) services, integritymanagement and remoteintervention
Core Business SegmentsSubsea 7 provides technical solutions for projects at all water depths and in challenging environments.
Source: Subsea 7 2015 Annual ReportPage 22
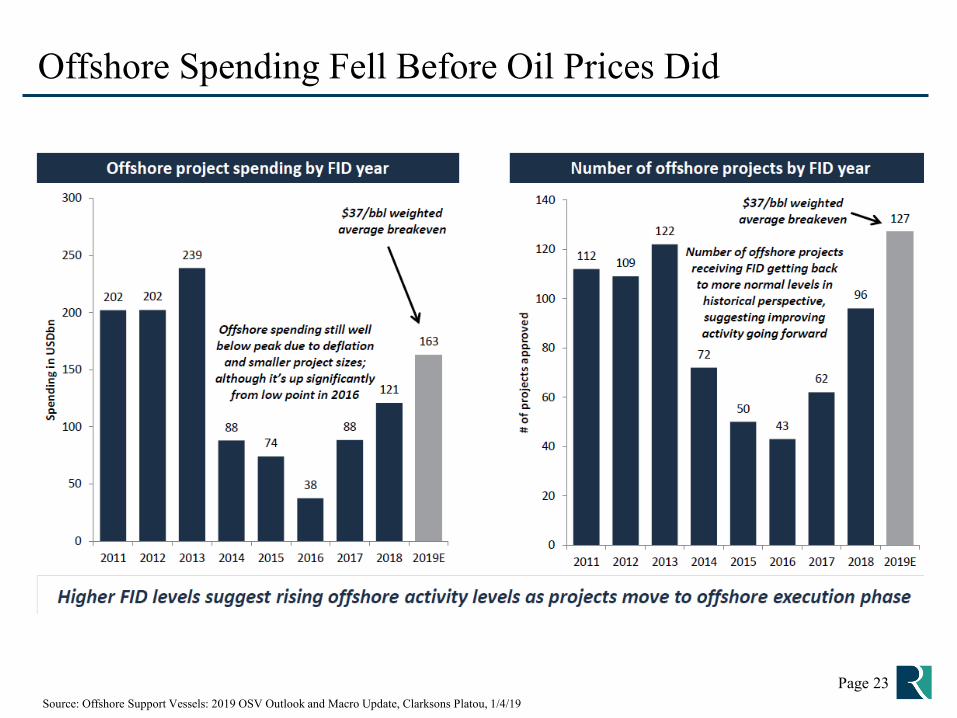
Offshore Spending Fell Before Oil Prices Did
Page 23Source: Offshore Support Vessels: 2019 OSV Outlook and Macro Update, Clarksons Platou, 1/4/19

Competitive Landscape Shifts as Industry Dwindles
Page 24Source: Subsea 7 February 2019 Investor Presentation
Competitors that have gone into administration or exited offshore oil services:• Ceona• Petrofac (exited SURF)• Reef Subsea• Harkand
• Hallin Marine • Specialist Subsea Svc• Red7 Marine• Cal Dive
• Cecon• Swiber• EMAS• Sea Trucks

Subsea 7: Actively Navigating the Downturn
Source: Subsea 7 Q4 2018 PresentationPage 25
Since 2014 Subsea 7 has:
• Reduced workforce by ~40%
• Returned six chartered vessels
• Stacked four owned vessels
• Retired two owned vessels withtwo more due to leave in 2017

Full Life Cycle Integrated Solutions Drive Lower Costs
Source: Subsea 7 Investor Presentation
Page 26
• Integrated optimized design of entire subsea facility
• Lower cost, reduced risk and shorter schedule improves EIPC economics
• Integrated technologies to extend tieback distance and improve recovery

Expanding Already Wide Moat
Type Source EvidenceSupply Advantage: • Proprietary Technology
• Engineering and Project Management Process
• Vessels (especially in certain ultra-deepwater and arctic areas)
History of increasingly complex engineering needs in deeper water requires a demonstrated track record of successful and safe execution.
Demand Advantage:
• Market Position• Skilled Engineers• Local Content (Africa,
Brazil)
In this case, the resource is skilled engineering talent.
Economies of Scale: • Size• Geographic Reach
The tangible and intangible costs of searching for someone who can complete a major ultra-deepwater project at or above the standard of “the big three” are very high.
Page 27

Proven Capital Allocation / Balance Sheet Strength
• As of December 31, 2018 Subsea 7 had $507 million in net-cash and an investment grade rating.
• A 5-year $650 million revolving credit facility providesfurther flexibility.
• The board had paid: Paid a $200 million (NOK 5.00 / $0.60 per share)
special dividend in April 2017 Paid a $200 million (NOK 5.00 / $0.62 per share)
dividend in May 2018 Declared a ~$55 million (NOK 1.50 / $0.17 per share)
special dividend will be payable in May 2019
• Subsea 7 has returned over $1.7 billion to shareholders in theform of cash dividends and share repurchases since the 2011merger with Acergy.
Source: Subsea 7 Financial ReportsPage 28
Kristian SiemChairman
Jean CahuzacCEO
Kristian Siem, and otherfamily members own 20% ofSubsea 7’s shares throughSiem Industries holdings.

Subsea 7’s Addressable Market
Source: Subsea 7 February 2019 Investor PresentationPage 29
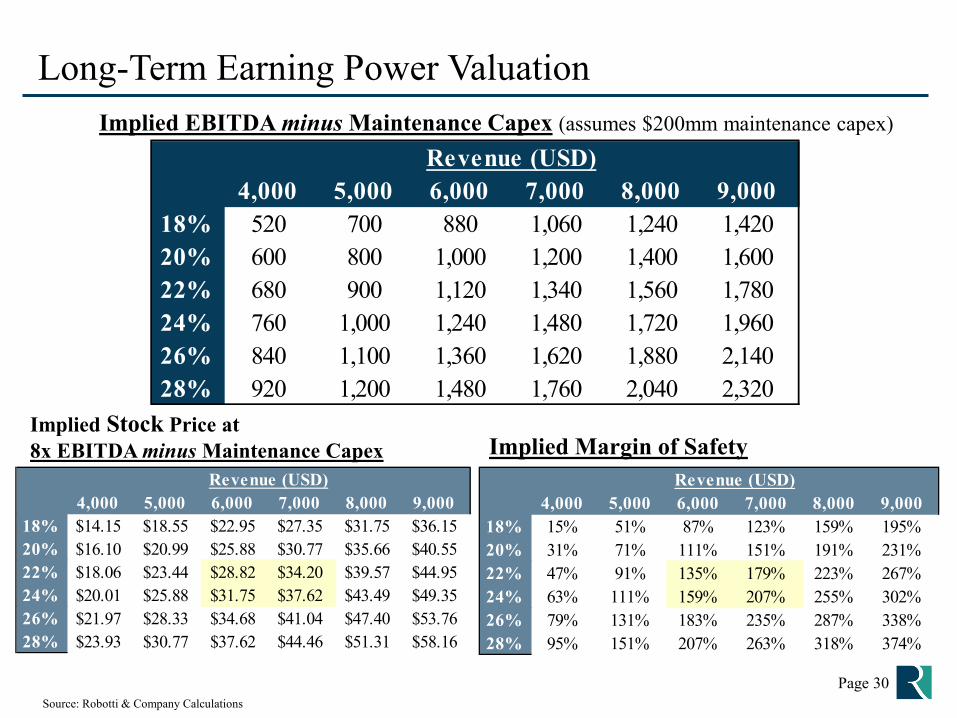
Long-Term Earning Power ValuationImplied EBITDA minus Maintenance Capex (assumes $200mm maintenance capex)
Implied Margin of SafetyImplied Stock Price at8x EBITDA minus Maintenance Capex
Source: Robotti & Company CalculationsPage 30
Revenue (USD)4,000 5,000 6,000 7,000 8,000 9,000
18% 520 700 880 1,060 1,240 1,42020% 600 800 1,000 1,200 1,400 1,60022% 680 900 1,120 1,340 1,560 1,78024% 760 1,000 1,240 1,480 1,720 1,96026% 840 1,100 1,360 1,620 1,880 2,14028% 920 1,200 1,480 1,760 2,040 2,320
Revenue (USD)4,000 5,000 6,000 7,000 8,000 9,000
18% $14.15 $18.55 $22.95 $27.35 $31.75 $36.1520% $16.10 $20.99 $25.88 $30.77 $35.66 $40.5522% $18.06 $23.44 $28.82 $34.20 $39.57 $44.9524% $20.01 $25.88 $31.75 $37.62 $43.49 $49.3526% $21.97 $28.33 $34.68 $41.04 $47.40 $53.7628% $23.93 $30.77 $37.62 $44.46 $51.31 $58.16
Revenue (USD)4,000 5,000 6,000 7,000 8,000 9,000
18% 15% 51% 87% 123% 159% 195%20% 31% 71% 111% 151% 191% 231%22% 47% 91% 135% 179% 223% 267%24% 63% 111% 159% 207% 255% 302%26% 79% 131% 183% 235% 287% 338%28% 95% 151% 207% 263% 318% 374%

Risks To Our Thesis
• Oil prices could fall further or remain at current levels for an extended period leading major oil companies to defer capital expenditures and delay deepwater developments.
• Increasing competition in shallower water could result in decreased profitability should well depth not continue to increase.
• The safe and successful execution of large, complex EPIC projects is a primary risk. Supply chain delays can reverberate throughout the entire project.
• Operations in deep water are subject to unpredictable events such as severe weather or harsh ocean environments.
Page 31

• Norbord is the world’s largest producerof oriented strand board (OSB) with 14mills in North America and 3 mills inthe UK and Europe.
• As the leading low cost producerNorbord is well positioned to takeadvantage of the North America’scontinued housing recovery.
• A focus on value-added and specialtyproducts, favorable geographicexposure and a history of prudentcapital allocation.
• A period of industry consolidation hascreated favorable supply / demanddynamics that will allow for a periodof above average free cash flowgeneration.
Norbord, Inc. (TSX:OSB / NYSE:OSB)
Source: Norbord Financial Statements, S&P Capital IQPage 32
Market CapitalizationPrice $26.99 Net Debt 456
Dil Shrs 86.9 Net Debt/EBTIDA 0.6xMarket Cap $2,345 Interest Coverage 15.8x
LT Debt 584Cash 128 52 Week Hi $45.45
Enterprise Value 2,801 52 Week Lo $24.18$US as of March 28, 2019
Consensus Est.(Annual) FY '16 FY '17 FY '18 FY '19E FY '20ERevenue 1,766.0 2,177 2,424 2,151 2,285
growth 17.0% 23.3% 11.3% (11.3%) 6.2%ev/sales 1.6x 1.3x 1.2x 1.3x 1.2x
EBITDA 373.0 667 719 433 495margin 21.1% 30.6% 29.7% 20.1% 21.7%ev/EBITDA 7.5x 4.2x 3.9x 6.5x 5.7x
Diluted EPS $2.13 $5.03 $4.27 $2.26 $2.86p/e 12.7x 5.4x 6.3x 11.9x 9.4x

Capital Cycle Case Study: The U.S. Housing Market
Source: Federal Reserve Bank of St. Louis, Robotti & Company Advisors Estimates Page 33
200210220230240250260270280290300310320330340350
200
400
600
800
1,000
1,200
1,400
1,600
1,800
2,000
Millions of People
Thou
sand
s of N
ew H
omes
U.S . Single Family Home StartsJanuary 1970 to Present
SFH Starts Average Single Family Home Starts Rolling 10 Year Average U.S. Population
Overbuild
Underbuild
Average = 1.1 million SFH Starts

A Map of the Homebuilding Industry
Page 34
Materials Manufacturer
Windows & Doors
Cabinetry & Fixtures
Roofing, Siding & Insulation
Flooring & Carpets
Structural Board
National Homebuilder
Regional Homebuilders
Big Box RetailPro-Segment
Specialty
Distributors
HVACWallboard
Plumbing
Lighting
Molding & Trim
Architectural Paint
Contractor
Homebuilders
Engineered Wood Panel / OSB
Source: Robotti & Company Advisors

Industry Consolidation
In 2002 the top 5 North American Producers accounted for 69% of North American Capacity.
Pre-Housing Crisis (~2006):• 11 OSB producers in North America • Top 5 = 74% market share
Today:• 9 OSB producers in North America• Top 5 = 81% market share• (Top 6 = 89% market share)
Page 35Source: Norbord February 2019 Investor Presentation, Norbord Annual Reports, Robotti & Company Advisors Calculations

Top Quartile ROCE Among Peers Over Cycle
Page 36Source: Norbord Q2 2017 Investor Presentation

Opportunity to Drive Further Substitution
Source: Norbord February 2019 Investor PresentationPage 37
• Reduced dependence onnew home construction
• More predictable, stablemargins over businesscycle
OSB Share of Structural Panels

North American OSB Industry Capacity
Source: Norbord February 2019 Investor PresentationPage 38

Long-Term OSB Supply/Demand Analysis
Source: Norbord February 2019 Investor PresentationPage 39

Relentless Focus on Cost: “Control the Controllables”
Page 40Source: Norbord February 2019 Investor Presentation
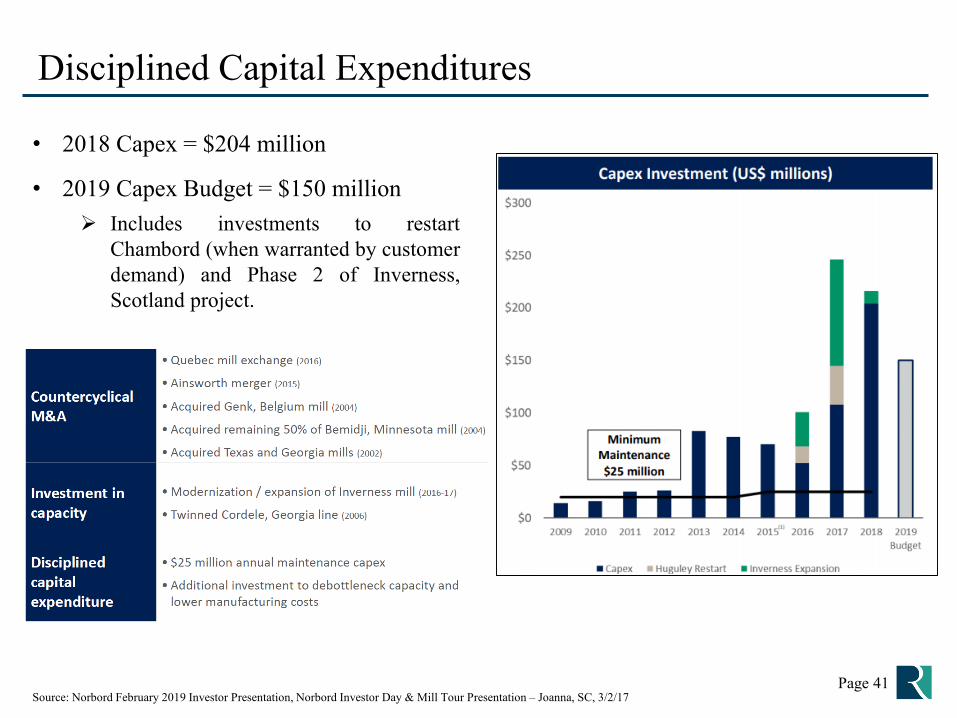
Disciplined Capital Expenditures
Page 41Source: Norbord February 2019 Investor Presentation, Norbord Investor Day & Mill Tour Presentation – Joanna, SC, 3/2/17
• 2018 Capex = $204 million
• 2019 Capex Budget = $150 million Includes investments to restart
Chambord (when warranted by customerdemand) and Phase 2 of Inverness,Scotland project.

Total Adjusted EBITDA Over the Cycle
Source: Norbord Q4 2018 Investor Presentation, S&P Capital IQ
$ US millions
15-year average OSB price: $236
Norbord Sensitivity to Realized North American OSB Price Changes:
$10/Msf 7/16” = +$64 million Adjusted EBITDA

Risks To Our Thesis
Page 43
• The housing recovery could stall or reverse causing liquidity issues as high interest debt is repaid and free cash flow falls.
• Management teams are unable to realize merger synergies.
• Commodity prices could fall for an extended period of time and pressure cash flow.
• Supply / Demand assumptions could be poorly timed or wrong.

Commonalities Among Value Investors
Page 44
Expensive
Quality
Graham and Dodd
Cheap
Valu
atio
n
Low High
Warren Buffett
“Ideal”
“To me, value investing is a big tent that accommodates many different people. At one end of the tent there isBen Graham, and at the other end of the tent there is Warren Buffett, who worked with Graham and then went outon his own and made adjustments to the teachings of Ben Graham.”
- Jean-Marie Eveillard (Graham and Doddsville – Winter 2007 Ed.)

Disclosure: Ownership Information
Disclosures Norbord(NYSE:OSB)
Subsea 7(OB:SUBC)
Stolt-Nielsen(OB:SNI)
Robert Robotti and/or members of his household has a financial interest in the following securities Yes Yes Yes
Robotti & Company or its affiliates beneficially own common equity of the following securities Yes Yes Yes
Robotti & Company or its affiliates beneficially own 1% or more of any class of common equity of the following securities
No Yes Yes
Robert Robotti serves as a Director or Officer or Advisory Board Member of the following securities
No No No
Disclaimer: Analyst Compensation: While this report is not a research report of any broker or dealer, compensation of analysts of the Firm isbased on: (1) the analyst’s productivity, including the quality of the analyst’s research and the analyst’s contribution to the growth anddevelopment of our overall research effort; (2) ratings and direct feedback from our investing clients, our sales force and from independentrating services. The Firm’s management is responsible for establishing these compensation guidelines and for reviewing and approvingcompensation. Analyst contribution (if any) to the investment banking business of any affiliate of the Firm is not a factor in determining his/hercompensation for either entity and compensation is not, directly or indirectly, related to the specific recommendations or views expressed in thereport.
Analyst Certification: The author certifies that the views expressed in this financial model accurately reflect his personal views about the subjectsecurities or issuers and that no part of his or her compensation was, is, or will be directly or indirectly related to the specific recommendationsor views contained in this presentation. The author, from time to time, may have long or short positions in, and buy or sell, the securities, orderivatives (including options) thereof, of companies mentioned herein. This is not a complete analysis of every material fact regarding anycompany, industry or security.

DisclaimerRobotti & Company Advisors, LLC (the “Firm”) is not providing investment advice through this material. This presentation is provided forinformational purpose only as an illustration of the firm’s investment philosophy and shall not be considered investment advice or arecommendation or solicitation to buy or sell any securities discussed herein, and does not contain enough information to be considered arecommendation or a research report.
As of the date of this presentation the firm continues to own the securities discussed herein. These opinions are not intended to be a forecast offuture events, a guarantee of future results, or investment advice. Past performance is not indicative of future results, and no representation orwarranty, express or implied, is made regarding future performance.
Robotti & Company Advisors, LLC or its affiliates may engage in securities transactions that are inconsistent with this communication and mayhave long or short positions in such securities. The information and any opinions contained herein are as of the date of this material, and the firmdoes not undertake any obligation to update them.
This material does not take into account individual client circumstances, objectives, or needs and is not intended as a recommendation to any personwho is not a client of the firm. Securities, financial instruments, products or strategies mentioned in this material may not be suitable for allinvestors. The Firm does not provide tax advice. Investors should seek tax advice based on their particular circumstances from an independent taxadvisor.
In reaching a determination as to the appropriateness of any proposed transaction or strategy, clients should undertake a thorough independentreview of the legal, regulatory, credit, accounting and economic consequences of such transaction in relation to their particular circumstances andmake their own independent decisions. By virtue of this publication, neither the Firm nor any of its employees shall be responsible for anyinvestment decision.
This confidential presentation contains information that has been compiled, by the Firm, from sources believed to be reliable; however, there can beno guarantee as to the accuracy or completeness of such information. It also contains statements, estimates and projections made by various thirdparty companies with respect to their historical and projected performance. There can be no assurance that such statements, estimates andprojections will be realized and actual results may vary materially from those indicated. Further, in any case, the Firm does not represent nor isaffiliated with any of the third party companies and other entities named and makes no representations as to the reasonableness of such assumptionsor the accuracy or completeness of the information contained herein. These materials are for the confidential use of only those persons to whom itis transmitted.
This report may discuss numerous securities, some of which may not be qualified for sale in certain states and may therefore not be offered toinvestors in such states. This document should not be construed as providing investment services. Investing in non-U.S. securities including ADRsinvolves significant risks such as fluctuation of exchange rates that may have adverse effects on the value or price of income derived from thesecurity. Securities of some foreign companies may be less liquid and prices more volatile than securities of U.S. companies. Securities of non-U.S.issuers may not be registered with or subject to Securities and Exchange Commission reporting requirements; therefore, information regarding suchissuers may be limited.

Questions
Bob RobottiPresident & CIO
Robotti & Company Advisors, LLC60 East 42nd Street
31st FloorNew York, NY 10065
+1 212 986 4800