Embed Size (px)
Citation preview
Journ
alof
Cell
Scie
nce
Cyclic AMP directs inositol (1,4,5)-trisphosphate-evoked Ca2+ signalling to different intracellular Ca2+
stores
Stephen C. Tovey and Colin W. Taylor*Department of Pharmacology, University of Cambridge, Tennis Court Road, Cambridge CB2 1PD, UK
*Author for correspondence ([email protected])
Accepted 15 February 2013Journal of Cell Science 126, 2305–2313� 2013. Published by The Company of Biologists Ltddoi: 10.1242/jcs.126144
SummaryCholesterol depletion reversibly abolishes carbachol-evoked Ca2+ release from inositol (1,4,5)-trisphosphate (IP3)-sensitive stores,without affecting the distribution of IP3 receptors (IP3R) or endoplasmic reticulum, IP3 formation or responses to photolysis of caged
IP3. Receptors that stimulate cAMP formation do not alone evoke Ca2+ signals, but they potentiate those evoked by carbachol. We showthat these potentiated signals are entirely unaffected by cholesterol depletion and that, within individual cells, different IP3-sensitiveCa2+ stores are released by carbachol alone and by carbachol combined with receptors that stimulate cAMP formation. We suggest thatmuscarinic acetylcholine receptors in lipid rafts deliver IP3 at high concentration to associated IP3R, stimulating them to release Ca2+.
Muscarinic receptors outside rafts are less closely associated with IP3R and provide insufficient local IP3 to activate IP3R directly. TheseIP3R, probably type 2 IP3R within a discrete Ca2+ store, are activated only when their sensitivity is increased by cAMP. Sensitization ofIP3R by cAMP extends the effective range of signalling by phospholipase C, allowing muscarinic receptors that are otherwise ineffective
to recruit additional IP3-sensitive Ca2+ stores.
Key words: Calcium signalling, Cholesterol, Cyclic AMP, IP3 receptor, Spatial organization
IntroductionMany cells respond to extracellular stimuli with an increase in
intracellular free Ca2+ concentration, [Ca2+]i. The complex
spatio-temporal organization of these Ca2+ signals provides the
versatility that allows them selectively to regulate many cellular
processes (Berridge et al., 2000). Inositol (1,4,5)-trisphosphate
(IP3), by stimulating Ca2+ release from the endoplasmic
reticulum (ER), provides a common link between receptors at
the plasma membrane and cytoplasmic Ca2+ signals. Diverse
stimuli, via their receptors, stimulate phospholipase C (PLC) and
so formation of IP3, which binds to IP3 receptors (IP3R) causing
Ca2+ to leak into the cytosol (Foskett et al., 2007; Taylor and
Tovey, 2010).
Parathyroid hormone (PTH) stimulates adenylyl cyclase (AC)
via G protein-coupled receptors (GPCR). The type 1 PTH
receptor (PTHR1) has attracted most attention because it has
essential roles in bone remodelling and plasma Ca2+ homeostasis,
and it is a target of drugs used to treat osteoporosis (Mannstadt
et al., 1999). PTHR1 can stimulate both AC and an increase in
[Ca2+]i, but the relationships between these events are complex
(reviewed in Taylor and Tovey, 2012). PTH invariably stimulates
AC, but it can also stimulate PLC directly when the signalling
proteins are expressed at high levels (Offermanns et al., 1996;
Schwindinger et al., 1998; Taylor and Tovey, 2012) or when
PTHR1 associates with the scaffold proteins, Na+-H+-exchanger
regulatory factors (NHERF) (Wang et al., 2010). Cyclic AMP
(cAMP), via exchange protein activated by cAMP (epac) and the
monomeric G protein Rap, can also stimulate PLCe (Schmidt
et al., 2001). We (Short and Taylor, 2000; Tovey et al., 2008;
Tovey et al., 2003) and others (Schwindinger et al., 1998) find
that in HEK 293 cells stably expressing physiological levels of
PTHR1 (HEK-PR1 cells), PTH stimulates AC, but it does not
alone evoke an increase in [Ca2+]i. However, PTH (or
endogenous b2-adrenoceptors) potentiates the Ca2+ signals
evoked by receptors that stimulate PLC (Kurian et al., 2009;
Tovey et al., 2008). This effect of PTH is entirely mediated by
cAMP, it requires activation of neither cAMP-dependent protein
kinase (PKA) nor epacs, and it results from cAMP binding to
IP3R directly or to a protein that tightly associates with IP3R
(Tovey et al., 2008; Tovey et al., 2010). Although cAMP
increases the sensitivity of all three IP3R subtypes to IP3 (Tovey
et al., 2010), in intact HEK-PR1 cells a specific association of
IP3R2 and AC6, an ‘AC-IP3R junction’, allows AC to deliver
cAMP directly and at high concentration to IP3R (Fig. 1A)
(Tovey et al., 2008).
Lipid rafts are ordered regions of the plasma membrane
in which the outer leaflet is enriched in cholesterol and
sphingolipids (Simons and Toomre, 2000). Many signalling
proteins, including GPCRs, G proteins, ACs, IP3Rs and PLCs,
associate with lipid rafts and are thereby organized into signalling
complexes (Isshiki and Anderson, 1999; Ostrom and Insel, 2004;
Simons and Toomre, 2000). Disruption of lipid rafts by
cholesterol depletion has been reported to inhibit IP3-evoked
Ca2+ release (Nagata et al., 2007; Singleton and Bourguignon,
2004; Weerth et al., 2007) and to disrupt selective regulation of
AC6 and AC8 by store-operated Ca2+ entry (Willoughby and
Research Article 2305
Journ
alof
Cell
Scie
nce
Cooper, 2007). Evidence that delivery of cAMP from AC6 to
IP3R2 mediates the effects of PTH on IP3-evoked Ca2+ signals in
HEK-PR1 cells (Tovey et al., 2008) alongside reports that AC5/6
(Head et al., 2005; Ostrom et al., 2002; Willoughby and Cooper,
2007) and IP3R2 (Weerth et al., 2007) can associate with
cholesterol-rich lipid rafts prompted us to examine the role of
lipid rafts in signalling by PTH.
ResultsLoss of cholesterol inhibits carbachol-evoked Ca2+
release, but not its potentiation by PTH
Carbachol (CCh), a stable analogue of acetylcholine that
stimulates IP3 formation via endogenous M3 muscarinic
receptors (M3R) (Luo et al., 2008), evoked Ca2+ release from
the intracellular stores of HEK 293 cells (Short et al., 2000). This
IP3-evoked Ca2+ release was potentiated by PTH in HEK-PR1
cells (Fig. 1B), by isoproterenol, which stimulates endogenous
b2-adrenoceptors (supplementary material Fig. S1A) (Kurian
et al., 2009), or by high concentrations of a membrane-
permeant analogue of cAMP, 8-bromo-cAMP (8-Br-cAMP)
(supplementary material Fig. S1B). Neither PTH nor
isoproterenol alone stimulated Ca2+ release (Fig. 1B and
supplementary material Fig. S1A). These results are consistent
with earlier work suggesting that AC6-IP3R2 junctions allow
cAMP to be delivered directly to IP3R at high concentrations to
cause an increase in their sensitivity to IP3 (Tovey et al., 2008;
Tovey et al., 2010). Subsequent experiments assess whether
cholesterol, an essential component of lipid rafts (Simons and
Ikonen, 1997), is required for this selective communication
(Fig. 1A).
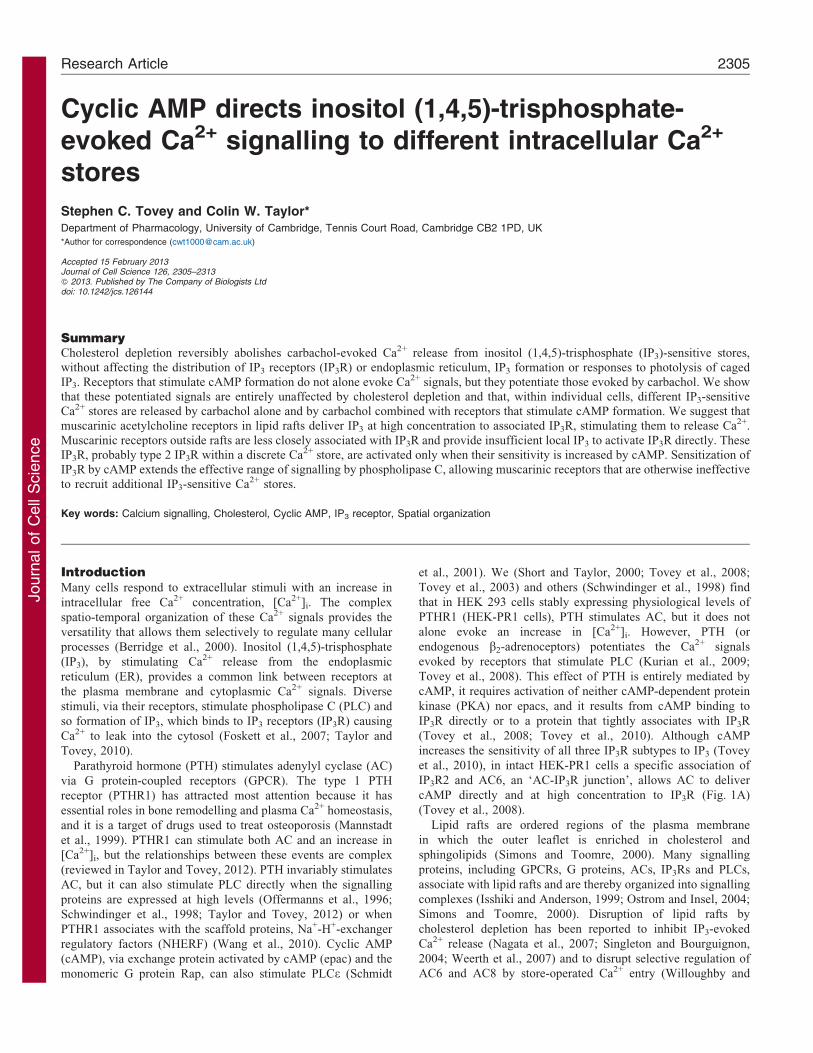
Filipin-staining established that most cholesterol was in the
plasma membrane and that exposure to b-methylcyclodextrin
(bMCD, 2% w/v, 2 hours at 20 C) caused loss of plasma
membrane cholesterol without perturbing cell morphology
(Fig. 1C,D). Similar results were obtained with brief exposure
(10 minutes) to bMCD (2% w/v) at 37 C (supplementary
material Fig. S2A–C). In most experiments, the more
prolonged (30 minutes to 2 hours) treatment at 20 C was used
because it was then easier to adjust incubation times to achieve
effective cholesterol depletion without causing cellular damage.
Pre-treatment of cells with bMCD at 20 C massively attenuated
the Ca2+ release evoked by CCh in populations of HEK-PR1 cells
(Fig. 1E). The peak increase in [Ca2+]i evoked by a maximal
concentration of CCh (1 mM) was reduced by 80611% from
234622 nM to 51626 nM (Fig. 1F). The sensitivity to CCh was
not significantly affected: the pEC50 (2logEC50, where EC50 is
Fig. 1. Cholesterol depletion reversibly inhibits CCh-evoked Ca2+
release. (A) Potentiation of CCh-evoked Ca2+ release by cAMP is
mediated by a close association of IP3R2 and AC6 that delivers high
concentrations of cAMP directly to IP3R (Tovey et al., 2008). PM,
plasma membrane. (B) Populations of HEK-PR1 cells in Ca2+-free
HBS were stimulated with a maximal concentration of CCh (1 mM)
alone (black) or after addition of PTH (100 nM) (red). Results show
means 6 s.e.m. for 3–4 wells from a single experiment, each typical of
at least three experiments. (C) Typical fields of cells showing filipin
staining (left) or differential interference contrast images (right) for
control cells, cells treated with bMCD (2%, 20 C), or unstained control
cells. Images are typical of at least three experiments. Scale bar applies
to all images. Free cholesterol levels in the plasma membrane were
quantified by measuring fluorescence intensities along lines drawn
across cells. Profiles, corresponding to white lines in panels, are shown
in the overlaid traces. (D) From the fluorescence transects, regions of
interest (ROI) corresponding to the plasma membrane (red boxes in C)
or cytosol (white boxes) were identified and the average fluorescence
intensities within each were calculated (FPM and Fcytosol, respectively).
The histogram shows the FPM/Fcytosol ratios from control cells and cells
treated with bMCD (2%, 20 C). Results are means 6 s.e.m. from three
experiments with 10 cells analysed in each field. *P,0.05. Similar
analysis of the effects of treatment with bMCD at 37 C is shown in
supplementary material Fig. S2. (E) Populations of HEK-PR1 cells in
Ca2+-free HBS were stimulated with the indicated concentrations of
CCh (left) and after pre-treatment with bMCD at 20 C (right). Results
are means 6 s.e.m. from a single experiment with three replicates for
each condition. (F) Summary of results shows concentration-
dependent effects of CCh on Ca2+ release with and without bMCD-
treatment. (G) Concentration-dependent effects of CCh on Ca2+ signals
under the conditions indicated. Cholesterol depletion with bMCD and
repletion with bMCD:cholesterol were performed at 37 C and before
loading cells with fluo-4/AM. Results in F and G are means 6 s.e.m.
from three experiments, each with matched control and treated cells.
Journal of Cell Science 126 (10)2306
Journ
alof
Cell
Scie
nce
the half-maximally effective concentration) was 4.3860.14 and
3.8861.07 for control and bMCD-treated cells, respectively
(Fig. 1F). CCh-evoked Ca2+ release was similarly inhibited by
brief treatment with bMCD (2% w/v, 10 minutes) at 37 C
(supplementary material Fig. S2D). The effects of cholesterol
depletion on CCh-evoked Ca2+-release were reversed by
cholesterol repletion (Fig. 1G).
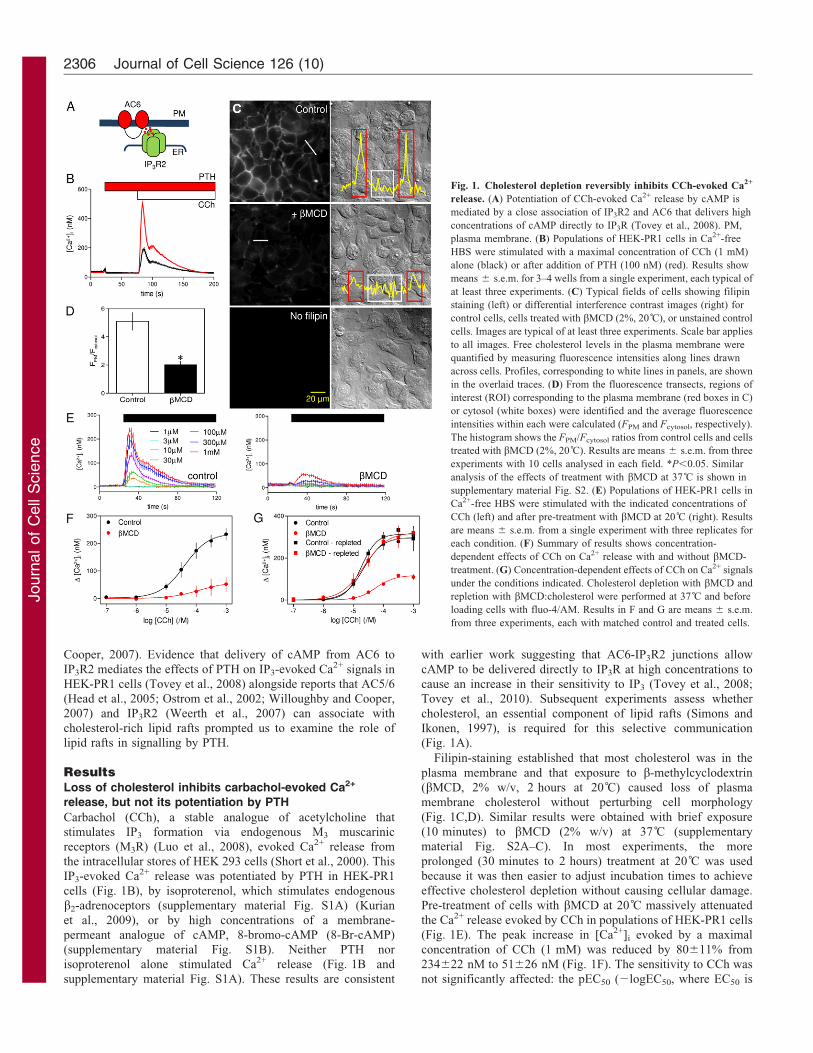
Although loss of cholesterol almost abolished responses to
CCh, it had no significant effect on the Ca2+ signals evoked by
subsequent addition of PTH (Fig. 2A–C). Neither the amplitude
of the Ca2+ signal evoked by addition of a maximal concentration
of PTH after CCh (229628 nM and 187630 nM, in control and
bMCD-treated cells, respectively) nor the sensitivity to PTH
(pEC5057.2560.21 and 7.1160.17) was affected by loss of
cholesterol (Fig. 2D). It is worth noting that in these and related
experiments (Figs 2, 3; supplementary material Figs S1, S3B and
S7), the Ca2+ signal evoked by addition of PTH directly reports
the potentiated response because although CCh is present
throughout, [Ca2+]i has returned to its basal level before PTH is
added. The results with cell populations were confirmed in single
cells, where a maximal concentration of CCh (1 mM) evoked a
transient release of Ca2+ in 9263% of cells, and subsequent
addition of PTH (100 nM) caused further Ca2+ release in 9762%
of cells (Fig. 2E–H). Pre-treatment with bMCD significantly
reduced both the number of cells responding to CCh alone (to
6367%, Fig. 2G) and the amplitude of the peak Ca2+ signal
(Fig. 2H). Even in those cells that responded to CCh, the
amplitude of the Ca2+ signal was reduced from 350652 nM to
19167 nM. However, bMCD had no effect on the number of
cells in which PTH potentiated CCh-evoked Ca2+ signals
(9861% of cells, Fig. 2G) or the amplitude of the peak
response to PTH (22968 nM and 278627 nM in control and
bMCD-treated cells, respectively). It is important to recall that
PTH evokes Ca2+ signals only when cells are co-stimulated with
CCh (Fig. 1B), yet after bMCD-treatment many cells (37%)
failed to respond to CCh alone, but almost all cells (98%)
responded to CCh with PTH (Fig. 2G). Many bMCD-treated
cells therefore responded to PTH with CCh despite not
responding to CCh alone.
Addition of ionomycin, a Ca2+ ionophore, to cells in Ca2+-free
HBS was used to define the amount of Ca2+ within intracellular
stores (Fig. 2E,F). The results demonstrate that loss of
cholesterol had no effect on the initial Ca2+ content of the
stores (Fig. 2H, red), but their residual Ca2+ content after
stimulation with CCh and PTH was significantly greater in
bMCD-treated cells (Fig. 2H). We conclude that cholesterol
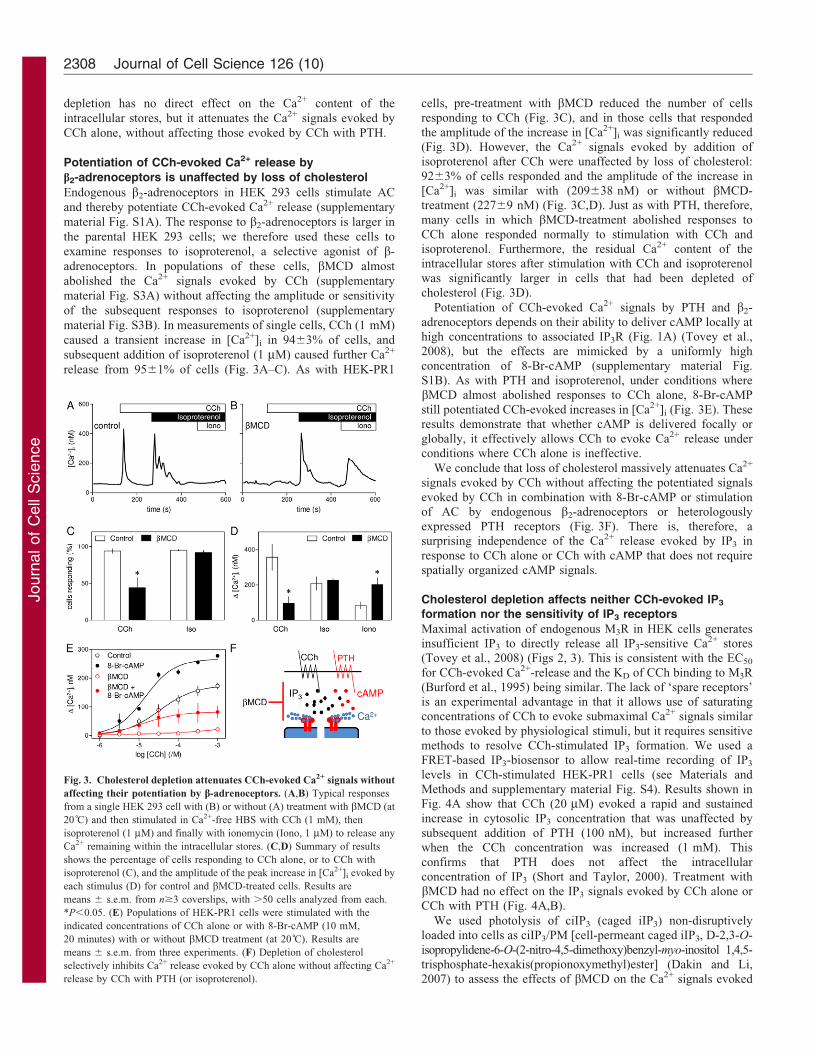
Fig. 2. Potentiation of CCh-evoked Ca2+ release by PTH is
unaffected by loss of cholesterol. (A) In Ca2+-free HBS, CCh (1 mM)
evoked a transient release of Ca2+ from the intracellular stores of
populations of HEK-PR1 cells. Addition of the indicated
concentrations of PTH in the continued presence of CCh then evoked a
further concentration-dependent Ca2+ release. (B) Similar experiments
in cells pre-treated with bMCD (at 20 C) inhibited the initial response
to CCh without significantly affecting the subsequent response to PTH.
Results in A and B are means 6 s.e.m. from a single experiment with
three replicates for each condition. The code applies to both panels.
(C,D) Summary of results (means 6 s.e.m. from three experiments)
shows peak increases in [Ca2+]i evoked by CCh (1 mM) (C) and the
concentration-dependent effects of a subsequent addition of PTH on
[Ca2+]i (D) in control and bMCD-treated cells. (E,F) Typical response
of a single HEK-PR1 cell in Ca2+-free HBS to CCh (1 mM) followed
by PTH (100 nM) and then ionomycin (Iono, 1 mM) treatment to
release any Ca2+ remaining within intracellular stores. Results are
shown for control cells (E) or after pre-treatment with bMCD (at 20 C)
(F). (G) Summary of results shows the percentage of all cells that
responded to CCh, or CCh with PTH. (H) Summary of results from
experiments similar to those shown in E and F, showing the Ca2+
signals evoked by addition of CCh or of PTH after CCh. Ionomycin
was added after stimulation with CCh and PTH to define the residual
Ca2+ content of the intracellular stores. In parallel experiments, the
initial Ca2+ content of the stores was defined by addition of ionomycin
to cells that had not been stimulated (naive, red). Results in G and H
are means 6 s.e.m. from at least three coverslips, with .50 cells
analyzed for each. *P,0.05.
Discrete IP3-sensitive Ca2+ stores 2307
Journ
alof
Cell
Scie
nce
depletion has no direct effect on the Ca2+ content of the
intracellular stores, but it attenuates the Ca2+ signals evoked by
CCh alone, without affecting those evoked by CCh with PTH.
Potentiation of CCh-evoked Ca2+ release by
b2-adrenoceptors is unaffected by loss of cholesterol
Endogenous b2-adrenoceptors in HEK 293 cells stimulate AC
and thereby potentiate CCh-evoked Ca2+ release (supplementary
material Fig. S1A). The response to b2-adrenoceptors is larger in
the parental HEK 293 cells; we therefore used these cells to
examine responses to isoproterenol, a selective agonist of b-
adrenoceptors. In populations of these cells, bMCD almost
abolished the Ca2+ signals evoked by CCh (supplementary
material Fig. S3A) without affecting the amplitude or sensitivity
of the subsequent responses to isoproterenol (supplementary
material Fig. S3B). In measurements of single cells, CCh (1 mM)
caused a transient increase in [Ca2+]i in 9463% of cells, and
subsequent addition of isoproterenol (1 mM) caused further Ca2+
release from 9561% of cells (Fig. 3A–C). As with HEK-PR1
cells, pre-treatment with bMCD reduced the number of cellsresponding to CCh (Fig. 3C), and in those cells that responded
the amplitude of the increase in [Ca2+]i was significantly reduced(Fig. 3D). However, the Ca2+ signals evoked by addition ofisoproterenol after CCh were unaffected by loss of cholesterol:
9263% of cells responded and the amplitude of the increase in[Ca2+]i was similar with (209638 nM) or without bMCD-treatment (22769 nM) (Fig. 3C,D). Just as with PTH, therefore,many cells in which bMCD-treatment abolished responses to
CCh alone responded normally to stimulation with CCh andisoproterenol. Furthermore, the residual Ca2+ content of theintracellular stores after stimulation with CCh and isoproterenol
was significantly larger in cells that had been depleted ofcholesterol (Fig. 3D).
Potentiation of CCh-evoked Ca2+ signals by PTH and b2-
adrenoceptors depends on their ability to deliver cAMP locally athigh concentrations to associated IP3R (Fig. 1A) (Tovey et al.,2008), but the effects are mimicked by a uniformly high
concentration of 8-Br-cAMP (supplementary material Fig.S1B). As with PTH and isoproterenol, under conditions wherebMCD almost abolished responses to CCh alone, 8-Br-cAMP
still potentiated CCh-evoked increases in [Ca2+]i (Fig. 3E). Theseresults demonstrate that whether cAMP is delivered focally orglobally, it effectively allows CCh to evoke Ca2+ release underconditions where CCh alone is ineffective.
We conclude that loss of cholesterol massively attenuates Ca2+
signals evoked by CCh without affecting the potentiated signals
evoked by CCh in combination with 8-Br-cAMP or stimulationof AC by endogenous b2-adrenoceptors or heterologouslyexpressed PTH receptors (Fig. 3F). There is, therefore, asurprising independence of the Ca2+ release evoked by IP3 in
response to CCh alone or CCh with cAMP that does not requirespatially organized cAMP signals.
Cholesterol depletion affects neither CCh-evoked IP3
formation nor the sensitivity of IP3 receptors
Maximal activation of endogenous M3R in HEK cells generatesinsufficient IP3 to directly release all IP3-sensitive Ca2+ stores(Tovey et al., 2008) (Figs 2, 3). This is consistent with the EC50
for CCh-evoked Ca2+-release and the KD of CCh binding to M3R(Burford et al., 1995) being similar. The lack of ‘spare receptors’is an experimental advantage in that it allows use of saturatingconcentrations of CCh to evoke submaximal Ca2+ signals similar
to those evoked by physiological stimuli, but it requires sensitivemethods to resolve CCh-stimulated IP3 formation. We used aFRET-based IP3-biosensor to allow real-time recording of IP3
levels in CCh-stimulated HEK-PR1 cells (see Materials andMethods and supplementary material Fig. S4). Results shown inFig. 4A show that CCh (20 mM) evoked a rapid and sustained
increase in cytosolic IP3 concentration that was unaffected bysubsequent addition of PTH (100 nM), but increased furtherwhen the CCh concentration was increased (1 mM). This
confirms that PTH does not affect the intracellularconcentration of IP3 (Short and Taylor, 2000). Treatment withbMCD had no effect on the IP3 signals evoked by CCh alone orCCh with PTH (Fig. 4A,B).
We used photolysis of ciIP3 (caged iIP3) non-disruptivelyloaded into cells as ciIP3/PM [cell-permeant caged iIP3, D-2,3-O-
isopropylidene-6-O-(2-nitro-4,5-dimethoxy)benzyl-myo-inositol 1,4,5-trisphosphate-hexakis(propionoxymethyl)ester] (Dakin and Li,2007) to assess the effects of bMCD on the Ca2+ signals evoked
Fig. 3. Cholesterol depletion attenuates CCh-evoked Ca2+ signals without
affecting their potentiation by b-adrenoceptors. (A,B) Typical responses
from a single HEK 293 cell with (B) or without (A) treatment with bMCD (at
20 C) and then stimulated in Ca2+-free HBS with CCh (1 mM), then
isoproterenol (1 mM) and finally with ionomycin (Iono, 1 mM) to release any
Ca2+ remaining within the intracellular stores. (C,D) Summary of results
shows the percentage of cells responding to CCh alone, or to CCh with
isoproterenol (C), and the amplitude of the peak increase in [Ca2+]i evoked by
each stimulus (D) for control and bMCD-treated cells. Results are
means 6 s.e.m. from n$3 coverslips, with .50 cells analyzed from each.
*P,0.05. (E) Populations of HEK-PR1 cells were stimulated with the
indicated concentrations of CCh alone or with 8-Br-cAMP (10 mM,
20 minutes) with or without bMCD treatment (at 20 C). Results are
means 6 s.e.m. from three experiments. (F) Depletion of cholesterol
selectively inhibits Ca2+ release evoked by CCh alone without affecting Ca2+
release by CCh with PTH (or isoproterenol).
Journal of Cell Science 126 (10)2308
Journ
alof
Cell
Scie
nce
by activation of IP3R directly. Photolysis of ciIP3 in HEK-PR1
cells caused transient increases in [Ca2+]i (Fig. 4C). The
amplitudes of these Ca2+ signals varied between cells
(supplementary material Fig. S5), perhaps reflecting differences
in loading and de-esterification of ciIP3/PM. However, in a large
sample (n.400 cells), the response to iIP3 was unaffected by
treatment with bMCD (Fig. 4C–E). Neither the fraction of cells
responding to photolysis of ciIP3 (7567% and 7767% for control
and bMCD-treated cells, respectively) nor the average amplitude
of the increase in fluo-4 fluorescence (DF/F0, 3.5260.40 and3.2260.26) was affected by bMCD.
Treatment with bMCD caused HEK-PR1 cells to becomeslightly more rounded (Fig. 1C; Fig. 4F), but there was no obviousredistribution of the ER and it remained associated with the plasma
membrane (Fig. 4F). Immunostaining for each of the three IP3Rsubtypes confirmed that their distributions, whether assessed bywidefield microscopy or total internal reflection fluorescence
microscopy (TIRFM), were also unaffected by cholesteroldepletion (Fig. 4G and supplementary material Fig. S6).
We conclude that selective inhibition of CCh-evoked Ca2+
release by cholesterol depletion occurs under conditions whereCCh-evoked increases in cytosolic IP3 are unaffected (Fig. 4B),intracellular Ca2+ stores are intact (Fig. 2H), IP3R respond
normally to IP3 (Fig. 4C–E) and there are no obvious changes inthe distribution of the ER (Fig. 4F) or IP3Rs (Fig. 4G;supplementary material Fig. S6). This suggests that for cells
stimulated with CCh alone cholesterol depletion disruptseffective delivery of IP3 to IP3R, yet it has no effect on IP3
delivery to IP3R that respond in the presence of either cAMP or8-Br-cAMP.
CCh mobilizes Ca2+ from different stores in the presenceof PTH
The ability of CCh with PTH to evoke Ca2+ release whenresponses to CCh alone are almost abolished by cholesterol
depletion is unexpected because PTH increases [Ca2+]i only whenpaired with a stimulus, like CCh, that stimulates IP3 production(Fig. 1B) (Tovey et al., 2008). How might loss of cholesterol
disrupt delivery of IP3 to IP3R when CCh alone is the stimuluswithout affecting IP3 delivery when CCh is combined withactivation of receptors that stimulate AC? The effect cannotsimply result from sensitization of IP3R by cAMP counteracting
inhibition of M3R coupling to PLC because there was nodetectable inhibition of IP3 production (Fig. 4A), and inhibitionof PLC with U73122 similarly inhibited responses to CCh alone
or CCh with PTH (supplementary material Fig. S7). In most ofour experiments, where cells were first stimulated with CChbefore addition of PTH, there was more Ca2+ in the intracellular
stores at the time of PTH addition for cells treated with bMCD(Fig. 2H; Fig. 3D). We had therefore to consider whether thelack of effect of bMCD on responses to CCh with PTH mightresult from a fortuitous combination of a larger intracellular Ca2+
pool together with PTH, via cAMP, increasing the sensitivity ofIP3R (Tovey et al., 2008). That explanation is unlikely becauseresponses to every concentration of PTH were insensitive to
bMCD (Fig. 2D). We nevertheless assessed the proposal directlyusing a protocol that allowed the CCh-sensitive Ca2+ stores to bedepleted before treatment with bMCD and then stimulation with
CCh and PTH.
Cells were first stimulated with CCh in nominally Ca2+-freeHBS to deplete the stores that respond to CCh alone. They were
then rapidly depleted of cholesterol by incubation with bMCD(2% w/v, 10 minutes, 37 C, supplementary material Fig. S2) andthen the effects of PTH with CCh on [Ca2+]i were assessed. The
results demonstrate that prior stimulation with CCh or bMCDmassively attenuated the Ca2+ signals evoked by subsequentaddition of CCh, and combining the treatments almost abolished
the response to CCh (Fig. 5A, black). However, the increase in[Ca2+]i evoked by CCh with PTH was entirely unaffected by anyof the treatments. Prior depletion of the CCh-sensitive Ca2+
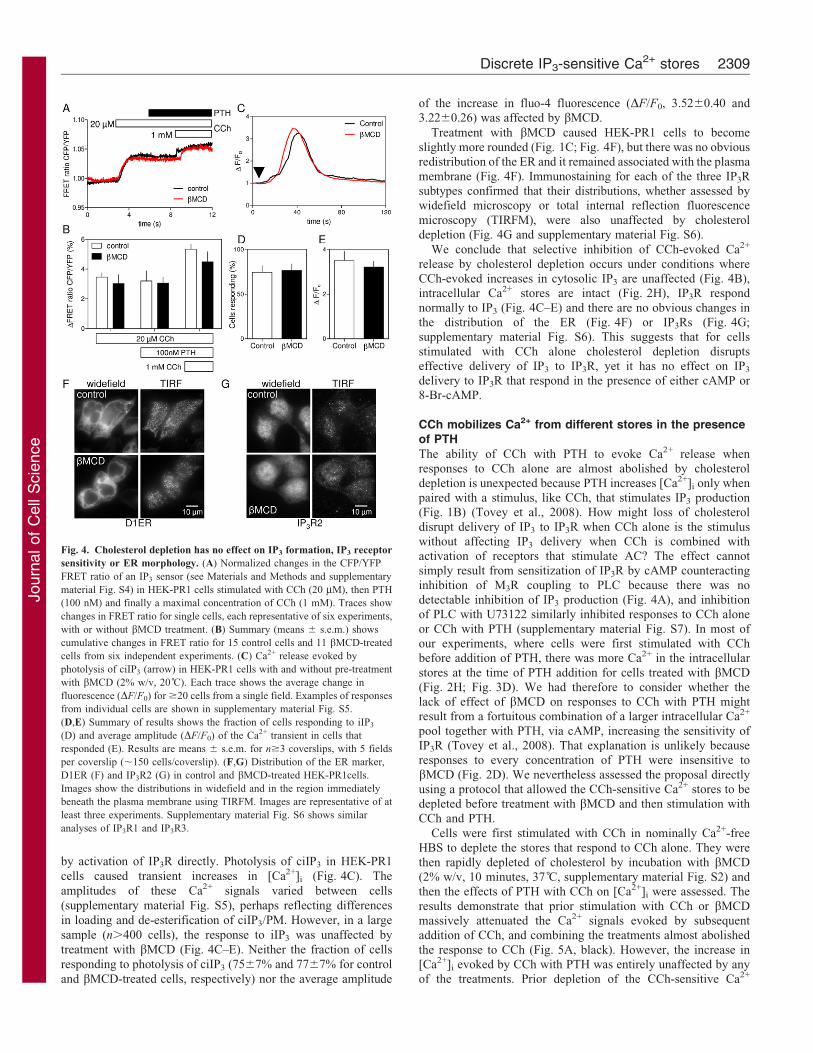
Fig. 4. Cholesterol depletion has no effect on IP3 formation, IP3 receptor
sensitivity or ER morphology. (A) Normalized changes in the CFP/YFP
FRET ratio of an IP3 sensor (see Materials and Methods and supplementary
material Fig. S4) in HEK-PR1 cells stimulated with CCh (20 mM), then PTH
(100 nM) and finally a maximal concentration of CCh (1 mM). Traces show
changes in FRET ratio for single cells, each representative of six experiments,
with or without bMCD treatment. (B) Summary (means 6 s.e.m.) shows
cumulative changes in FRET ratio for 15 control cells and 11 bMCD-treated
cells from six independent experiments. (C) Ca2+ release evoked by
photolysis of ciIP3 (arrow) in HEK-PR1 cells with and without pre-treatment
with bMCD (2% w/v, 20 C). Each trace shows the average change in
fluorescence (DF/F0) for $20 cells from a single field. Examples of responses
from individual cells are shown in supplementary material Fig. S5.
(D,E) Summary of results shows the fraction of cells responding to iIP3
(D) and average amplitude (DF/F0) of the Ca2+ transient in cells that
responded (E). Results are means 6 s.e.m. for n$3 coverslips, with 5 fields
per coverslip (,150 cells/coverslip). (F,G) Distribution of the ER marker,
D1ER (F) and IP3R2 (G) in control and bMCD-treated HEK-PR1cells.
Images show the distributions in widefield and in the region immediately
beneath the plasma membrane using TIRFM. Images are representative of at
least three experiments. Supplementary material Fig. S6 shows similar
analyses of IP3R1 and IP3R3.
Discrete IP3-sensitive Ca2+ stores 2309
Journ
alof
Cell
Scie
nce
stores, cholesterol depletion, or both together had no effect on the
ability of PTH to potentiate the increase in [Ca2+]i evoked by CCh
(Fig. 5A, blue). These results demonstrate that the Ca2+ stores
released by CCh alone and those released by CCh combined with
PTH are functionally independent (Fig. 5B). We conclude that
M3R communicate with different IP3R in different Ca2+ stores
when cells are activated by CCh alone or by CCh with stimuli that
increase cAMP. Cholesterol depletion distinguishes these two
pathways, and although cAMP is delivered focally to IP3R when
its production is stimulated by PTH (Tovey et al., 2008) globally
applied 8-Br-cAMP has the same effect (Fig. 3E and
supplementary material Fig. S1B). The two pathways from M3R
to IP3R are not, therefore, dependent on local delivery of cAMP,
they must differ in how they deliver IP3 to IP3R.
DiscussionFunctionally distinct IP3-sensitive Ca2+ stores respondindependently to CCh alone or to CCh delivered with stimuli,
like PTH, that activate AC (Fig. 5B). Cholesterol depletionalmost abolishes responses to CCh (Fig. 1) without affectingCa2+ signals evoked by CCh with PTH (Fig. 2), isoproterenol or
8-Br-cAMP (Fig. 3). Responses to PTH with CCh are unchangeddespite there being more Ca2+ within the intracellular stores aftercholesterol depletion (Fig. 2), and they are unaffected by
depletion of the Ca2+ stores that respond to CCh alone(Fig. 5A). These results establish that even when M3R aremaximally activated, a population of M3R stimulates Ca2+
release via IP3R from a store that is unaffected by cAMP or 8-Br-cAMP. Because cAMP increases the sensitivity of all IP3Rsubtypes to IP3 (Tovey et al., 2010), we conclude that the IP3
concentration to which these CCh-regulated IP3Rs are locally
exposed must be sufficient to cause their maximal activation.Evidence that bMCD massively attenuates CCh-evoked Ca2+
signals (Figs 1–3, Fig. 5A; supplementary material Figs S2, S3
and S7) without affecting IP3 formation (Fig. 4) is consistentwith such a spatially organized delivery of IP3 to IP3R that isdisrupted by cholesterol depletion (Fig. 5B, left). Responses to
CCh alone are attenuated by loss of IP3R1, but not ofIP3R2 (Tovey et al., 2008), suggesting that these locallyactivated IP3R are likely to be IP3R1 (or IP3R3). Depleting
cells, probably the plasma membrane (Fig. 1C), of cholesterol,disrupts communication between these M3R and IP3R (Fig. 1).Lipid rafts are enriched in M3R, Gaq and PLCb, they associatewith IP3R, and in many cells disrupting lipid rafts inhibits M3R-
evoked Ca2+ signals (Gosens et al., 2007; Lockwich et al., 2000).We propose that M3R within lipid rafts locally deliver saturatingconcentrations of IP3 to closely associated IP3R (Fig. 5B, left).
The concentration-dependent effects of CCh must then comelargely from all-or-nothing recruitment of these IP3R junctionsrather than from graded recruitment of IP3R within a junction.
The graded CCh signal is transduced into a digital recruitment ofIP3R junctions. Cholesterol depletion disrupts lipid rafts andthereby the interactions between M3R and IP3R that facilitatefocal delivery of IP3, so that diffusion and degradation of IP3
rapidly reduce its concentration to below the threshold for IP3Ractivation, thereby abolishing the CCh-evoked Ca2+ signals(Fig. 5B, left).
A second population of M3R is unaffected by cholesteroldepletion and less intimately associated with IP3R. Activation ofthese M3R provides insufficient IP3 to activate IP3R directly, but
these IP3R respond when they are co-stimulated with cAMP(Fig. 5B, right). Previous work showed that loss of IP3R2attenuated Ca2+ signals evoked by CCh and PTH without
affecting responses to CCh alone (Tovey et al., 2008). Thissuggests that IP3R2 populate the Ca2+ store from which CChevokes Ca2+ release only in the presence of cAMP (Fig. 5B,right).
We showed earlier that activation of M3R and P2Y receptors insingle HEK cells evokes Ca2+ release from functionally distinctIP3-sensitive stores (Short et al., 2000), suggesting that IP3 can be
locally delivered to IP3R. HEK cells are well-suited to addressingthis feature because even maximally activated M3R generateinsufficient IP3 to release Ca2+ from all IP3-sensitive stores.
Signalling from M3R to IP3R therefore remains focal even whenM3R are fully activated. In most cells with larger numbers ofreceptors, maximal activation is likely to generate high
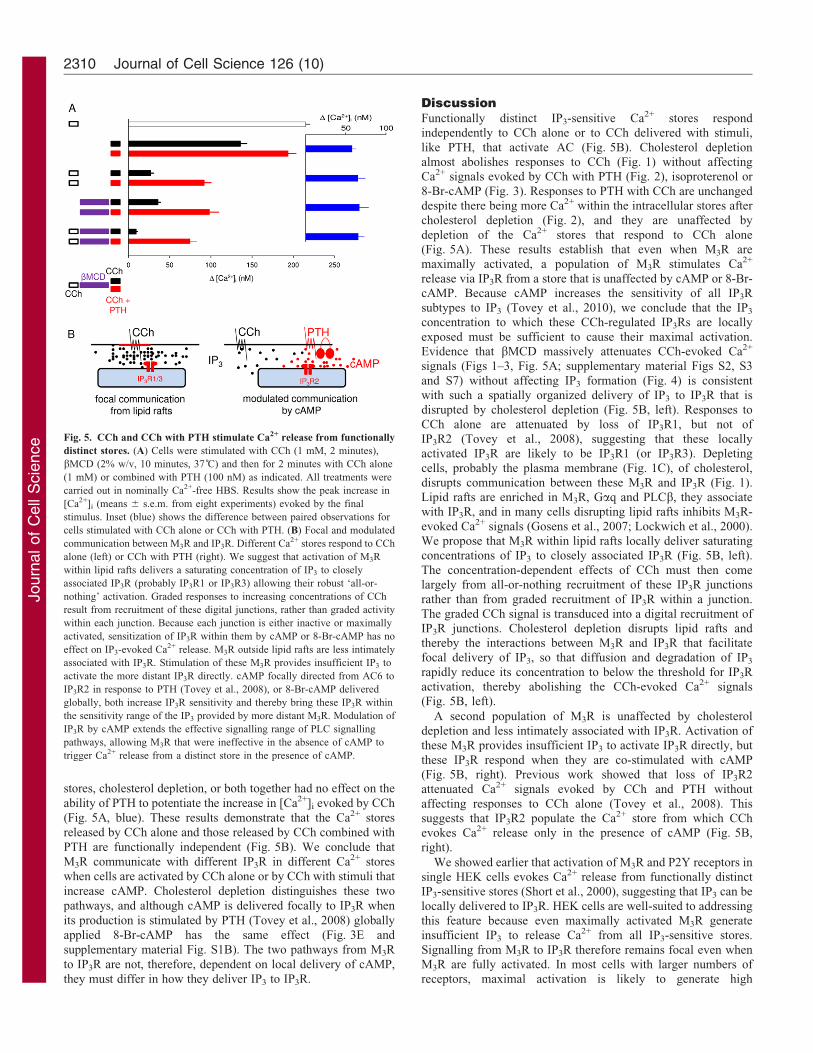
Fig. 5. CCh and CCh with PTH stimulate Ca2+ release from functionally
distinct stores. (A) Cells were stimulated with CCh (1 mM, 2 minutes),
bMCD (2% w/v, 10 minutes, 37 C) and then for 2 minutes with CCh alone
(1 mM) or combined with PTH (100 nM) as indicated. All treatments were
carried out in nominally Ca2+-free HBS. Results show the peak increase in
[Ca2+]i (means 6 s.e.m. from eight experiments) evoked by the final
stimulus. Inset (blue) shows the difference between paired observations for
cells stimulated with CCh alone or CCh with PTH. (B) Focal and modulated
communication between M3R and IP3R. Different Ca2+ stores respond to CCh
alone (left) or CCh with PTH (right). We suggest that activation of M3R
within lipid rafts delivers a saturating concentration of IP3 to closely
associated IP3R (probably IP3R1 or IP3R3) allowing their robust ‘all-or-
nothing’ activation. Graded responses to increasing concentrations of CCh
result from recruitment of these digital junctions, rather than graded activity
within each junction. Because each junction is either inactive or maximally
activated, sensitization of IP3R within them by cAMP or 8-Br-cAMP has no
effect on IP3-evoked Ca2+ release. M3R outside lipid rafts are less intimately
associated with IP3R. Stimulation of these M3R provides insufficient IP3 to
activate the more distant IP3R directly. cAMP focally directed from AC6 to
IP3R2 in response to PTH (Tovey et al., 2008), or 8-Br-cAMP delivered
globally, both increase IP3R sensitivity and thereby bring these IP3R within
the sensitivity range of the IP3 provided by more distant M3R. Modulation of
IP3R by cAMP extends the effective signalling range of PLC signalling
pathways, allowing M3R that were ineffective in the absence of cAMP to
trigger Ca2+ release from a distinct store in the presence of cAMP.
Journal of Cell Science 126 (10)2310
Journ
alof
Cell
Scie
nce
concentrations of IP3 that flood the cytosol and obscure spatialorganization. HEK cells provide the experimental convenience of
working with all M3R activated while retaining physiologicallyrelevant spatial organization. This experimental opportunity
allowed us to demonstrate that M3R in lipid rafts deliver IP3 athigh local concentration to associated IP3R (Fig. 5B, left). Such
digital communication is robust and analogous to the digitalsignalling we proposed for cAMP delivery from AC6 to IP3R2(Fig. 1A) (Tovey et al., 2008). M3R outside lipid rafts are less
intimately associated with IP3R and their activation fails todeliver enough IP3 to activate IP3R directly. Cyclic AMP, by
sensitizing IP3R (Tovey et al., 2008; Tovey et al., 2010), extendsthe range over which these M3R can signal, allowing M3R that
are otherwise ineffective to recruit additional IP3-sensitive Ca2+
stores. We conclude that M3R can signal directly to IP3R via
digital junctions or more loosely via IP3 diffusing over longerdistances. The latter is ineffective unless cAMP tunes IP3Rsensitivity, effectively extending the range of action of IP3
produced in response to these otherwise ineffective M3R.
Materials and MethodsMaterials
Cell culture media, Lipofectamine 2000, Alexa-488 conjugated secondaryantibodies, fluo-4/AM, fura-2/AM and Ca2+ standard solutions for calibration offura-2 fluorescence signals to [Ca2+]i were from Life Technologies (Paisley, UK).Ionomycin and 8-bromo-cAMP (8-Br-cAMP) were from Merck Bioscience(Nottingham, UK). 1,2-bis(o-aminophenoxy)ethane- N,N,N9,N9-tetraacetic acid(BAPTA) was from Molekula (Gillingham, UK). U73122 was from Tocris(Bristol, UK). Foetal bovine serum, carbamylcholine chloride (CCh), poly-L-lysine, b-methylcyclodextrin (bMCD), filipin and isoproterenol were from Sigma–Aldrich (Poole, UK). G418 was from ForMedium (Hunstanton, UK). Cholesterol(plant-derived) was from Avanti Polar Lipids Inc. (Alabaster, USA). A peptidecomprising residues 1–34 of human PTH (hereafter described as PTH) was fromBachem (St. Helens, UK). Cell-permeant caged iIP3 (ciIP3/PM) was from Sichem(Bremen, Germany). Inositol 1,4,5-trisphosphate (IP3) was from AlexisBiochemicals (Nottingham, UK) and 3H-IP3 (681Gbq/mmol) was from PerkinElmer (Cambridge, UK). Cell culture plastics and 96-well assay plates were fromGreiner (Stonehouse, UK). Imaging dishes (35-mm diameter with a 7-mm glassinsert) were from MatTek Corporation (Ashland, USA) or PAA laboratories(Yeovil, UK). VECTASHIELD mounting reagent was from Vector Laboratories(Peterborough, UK). A plasmid encoding a Ca2+-indicator protein targeted to theER lumen, D1ER, was a gift from R. Tsien (San Diego, USA) (Palmer et al.,2004). It was used to identify ER rather than to measure free [Ca2+]. An affinity-purified polyclonal antibody against the C-terminal of IP3R1 has been described(Cardy et al., 1997). D. Yule (University of Rochester, USA) provided affinity-purified antibodies to the N- (residues 320–338) and C-terminals (residues 2686–2702) of IP3R2 (Betzenhauser et al., 2009; Betzenhauser et al., 2008). Amonoclonal antibody against IP3R3 was from BD Transduction Laboratories(Oxford, UK). A polyclonal anti-GFP antibody was from Abcam (Cambridge,UK).
Cell culture and transfection
HEK 293 and HEK 293 cells stably transfected with the human type 1 PTHreceptor (HEK-PR1 cells) (Short and Taylor, 2000) were cultured at 37 C inDulbecco’s modified Eagle’s medium/Ham’s F12 with GlutaMAXTM-1,supplemented with foetal bovine serum (10%) and 800 mg/ml G418 (HEK-PR1cells only) in a humidified atmosphere containing 95% air and 5% CO2. Mediumwas replaced every third day, and cells were passaged when they reached about80% confluence. For experiments with cell populations, cells were seeded into 96-well plates (,26104 cells/well). For single-cell analyses, cells were seeded(1.26105 cells/well) onto either 35-mm imaging dishes with a 7-mm glass insert or22-mm round glass coverslips, each pre-coated with 0.01% poly-L-lysine. Cellswere grown for a further 2–3 days before experiments or transfection. The latterused Lipofectamine 2000 according to the manufacturer’s instructions with 1 mgDNA/well for cells in 35-mm imaging dishes.
Measurement of [Ca2+]iAlmost confluent cultures of HEK 293 or HEK-PR1 cells in 96-well plates werewashed, loaded with fluo-4/AM (2 mM), and [Ca2+]i was measured in populationsof cells using a FlexStation fluorescence plate-reader (MDS Analytical Devices,Wokingham, UK) (Tovey et al., 2008). All experiments were performed at 20 C inHBS, nominally Ca2+-free HBS or Ca2+-free HBS. HBS had the following
composition: 135 mM NaCl, 5.9 mM KCl, 1.2 mM MgCl2, 1.5 mM CaCl2,11.6 mM HEPES, 11.5 mM glucose, pH 7.3; CaCl2 was omitted from nominallyCa2+-free HBS; Ca2+-free HBS was supplemented with 10 mM BAPTA. Single-cell analyses of [Ca2+]i in HEK 293/HEK-PR1 cells loaded with fura-2/AM(2 mM) were performed as previously reported (Tovey et al., 2003). Fluorescenceratios were calibrated, after correction for background fluorescence, to [Ca2+]i byreference to Ca2+-calibration solutions.
To allow photolysis of ciIP3, HEK-PR1 cells were first incubated at 20 C for45 minutes in HBS containing ciIP3/PM (1 mM) (Dakin and Li, 2007; Smith andParker, 2009) and then for 45 minutes with HBS containing fluo-4/AM (2 mM)and ciIP3/PM (1 mM). After at least 60 minutes (during which any treatments usedto deplete cholesterol were applied), cells were used for single-cell imaging.Imaging dishes were mounted on the stage of an Olympus IX81 invertedfluorescence microscope (606 TIRF objective, numerical aperture 1.45).Excitation light was provided by a 488-nm diode-pumped solid-state laser(Olympus Digital Laser Systems, Milton Keynes, UK) and emitted fluorescence(500–550 nm) was captured with an eMCCD camera (Andor ixon 897, Andor,Belfast, UK). Two high-intensity flashes (,1 millisecond, 3000 mF, 300 V,,170 J) from a JML-C2 xenon flash-lamp (Rapp OptoElectronic, Hamburg,Germany) equipped with a 395-nm barrier filter were used to photolyse ciIP3.Photolysis of ciIP3 releases a form of IP3 (iIP3) in which the 2- and 3-hydroxylgroups are protected by an isopropylidene group. This does not prevent it fromactivating IP3R, but iIP3 is more resistant than IP3 to degradation by endogenousenzymes (Dakin and Li, 2007). For these measurements of [Ca2+]i using a non-ratiometric indicator (fluo-4), responses are reported as F/F0, where F0 is theaverage fluorescence intensity recorded from a defined region of interest (ROI) inthe 5 seconds immediately before flash photolysis, and F is the fluorescenceintensity from the same region after the flash.
Identification of endoplasmic reticulum and IP3 receptors
Total internal reflection fluorescence microscopy (TIRFM) using an OlympusIX81 inverted microscope with a triple-line TIRF combiner and a 1506 TIRFobjective (numerical aperture 1.45) was used to visualize the ER in HEK-PR1 cellsexpressing D1ER (Palmer et al., 2004). Fluorescence of EYFP was excited using a488-nm diode-pumped solid-state laser, with emitted fluorescence (500–550 nm)captured using an eMCCD camera (Andor ixon 897). Widefield images of D1ERwere obtained by excitation at 504 nm, with emission collected at 530–570 nm.
Endogenous IP3R were immunostained as described (Tovey et al., 2001), withall steps performed at 20 C in phosphate-buffered saline (PBS) unless statedotherwise. Cells on 35-mm imaging dishes were washed, fixed withparaformaldehyde (4% w/v in PBS) for 30 minutes, washed again andpermeabilized with Triton X-100 (0.2% v/v in PBS, 10 minutes). Cells werethen incubated in blocking medium (3% w/v BSA in PBS) for 1 hour, then withprimary antibody (1:100 in blocking medium) overnight at 4 C, washed(3610 minutes), incubated with Alexa-Fluor-488 conjugated secondary antibodyfor 1 hour (1:1000 in blocking medium) and washed (3610 minutes).Immunofluorescence was imaged as described for D1ER. PBS had the followingcomposition: 137 mM NaCl, 2.7 mM KCl, 10 mM Na2HPO4, 1.8 mM KH2PO4,pH 7.4.
Measurement of IP3
Intracellular IP3 was measured using a FRET-based IP3-sensor derived from theIP3-binding core (IBC) of IP3R1 tagged at its N- and C-termini with ECFP andEYFP, respectively, each attached by a short linker (supplementary material Fig.S4A). The sequence encoding residues 224–604 of IP3R1 was PCR-amplified froma full-length rat IP3R1(S1+) sequence (GenBank: GQ233032.1) using primers 1and 2. The sequences of all primers are provided in supplementary material TableS1. The fragment was cloned as a BamHI/XhoI fragment into the pENTR1 vector(Gateway) to generate the construct pENTR1-IBC. The open reading frame (ORF)of ECFP was PCR-amplified from the pECFP-ER vector (Clontech) using primers3 and 4 and cloned as a BamHI/MluI fragment into pENTR1-IBC to generate theconstruct pENTR1-ECFP-IBC. The ORF of EYFP was PCR-amplified from thepC1-EYFP vector (Clontech) using primers 3 and 5, and cloned as an EcoRI/XhoI
fragment into pENTR1-ECFP-IBC to generate the construct pENTR1-ECFP-IBC-EYFP. The latter was inserted into the expression vector pcDNA3.2 (Gateway) togenerate the IP3-sensor expression plasmid. Properties of the IP3-sensor are shownin supplementary material Fig. S4.
Cells on 35-mm imaging dishes were transfected with the plasmid encoding theIP3-sensor (1 mg/dish) using Lipofectamine 2000, and used 2 days later. AnOlympus IX81 inverted microscope equipped with a 606 TIRF objective(numerical aperture 1.45) and a 440/520 nm dual band-pass dichroic mirror wasused to record fluorescence using widefield excitation at 427 nm and simultaneouscollection of CFP (455–485 nm) and YFP (520–550 nm) emissions using anOlympus U-SIP split imaging TV port fitted with a 505-nm dichroic mirror(supplementary material Fig. S4E). Split images were obtained at 1-secondintervals using an eMCDD camera (Andor ixon 897). CFP and YFP emissionswere background corrected and a normalized CFP/YFP ratio was calculated for
Discrete IP3-sensitive Ca2+ stores 2311
Journ
alof
Cell
Scie
nce
each cell. IP3 binding causes an increase in CFP/YFP ratio, indicative of decreasedFRET (supplementary material Fig. S4D,E).
3H-IP3 binding and western blotting of the IP3-sensor
HEK cells transfected with the IP3-sensor in 6-well plates were washed, scrapedinto PBS containing protease inhibitors (1 tablet/10 ml, Roche Diagnostics,Mannheim, Germany) and centrifuged (650 g, 2 minutes). The pellet was lysed bytwo freeze–thaw cycles in liquid nitrogen, sonication (1 minute) and passagethrough a syringe needle. After centrifugation (12,000 g, 5 minutes), thesupernatant was used for western blotting or 3H-IP3 binding. For blotting,proteins (50 mg) were loaded onto NuPAGE 4–12% Bis Tris gels (LifeTechnologies) and blotted with an anti-GFP antibody (1:1000). Equilibrium-competition binding assays were performed as described (Rossi et al., 2009).Briefly, incubations (500 ml) at 4 C were performed in 50 mM Tris, 1 mM EDTA,pH 8.3 with 3H-IP3 (0.75 nM) and cell supernatant (150 mg protein). Reactionswere terminated after 5 minutes by addition of poly(ethylene glycol) 8000 (500 ml,30% w/v) and c-globulin (30 ml, 25 mg/ml) and centrifugation (20,000 g,5 minutes). Radioactivity was determined by liquid scintillation counting. Non-specific binding was determined by addition of 1 mM IP3.
Cholesterol depletion, repletion and measurement
After loading with a Ca2+ indicator (and, where appropriate, ciIP3), cells weredepleted of intracellular cholesterol by incubation with bMCD (2% w/v, ,15 mM)for either 10 minutes at 37 C or for up to 2 hours at 20 C (Rodal et al., 1999;Sampson et al., 2004). After washing, cells were used for experiments. Cholesterolwas restored as a bMCD:cholesterol complex (10:1, 0.26% w/v (,2 mM)bMCD:200 mM cholesterol) added to cells for 1 hour at 37 C. Briefly, a 100 mMsolution of cholesterol was prepared in methanol:chloroform (2:1) and complexesof bMCD:cholesterol were formed by drop-wise addition of cholesterol to acontinuously stirred (,2 hours) solution of 0.26% w/v bMCD in HBS maintainedat 80 C.
Free cholesterol was measured using filipin, a fluorescent antibiotic that binds tothe free 3b-hydroxyl of cholesterol (McCabe and Berthiaume, 2001). Cells werefixed with paraformaldehyde at 20 C (4% w/v, 30 minutes), washed three timeswith PBS, and then with PBS containing glycine (1.5 mg/ml, 10 minutes) toterminate fixation. Cells were stained with filipin (50 mg/ml) in PBS containingfoetal bovine serum (10%) for 2 hours at 20 C, washed with PBS (3610 minutes),and mounted (VECTASHIELD). Filipin staining was visualized using an OlympusIX81 inverted fluorescence microscope with excitation at 380 nm and emission at460–550 nm. Identical microscope and eMCCD camera settings were used tocapture each image. The method used to quantify filipin staining is described in thelegend to Fig. 1C.
Analysis
Concentration–effect relationships for each experiment were individually fitted toHill equations using non-linear curve-fitting (GraphPad Prism, version 5) and theresults obtained from each (pEC50, Hill coefficient h, maximal response) werepooled for statistical analysis and presentation. Student’s t-test was used forstatistical analyses.
AcknowledgementsWe thank Dr Ana Rossi for production and initial characterization ofthe IP3-sensor, and Roger Tsien and David Yule for gifts of theD1ER expression plasmid and antibodies to IP3R2, respectively.
Author contributionsS.C.T. completed all experimental work. Both authors devisedexperiments, analyzed data and wrote the manuscript.
FundingSupported by the Wellcome Trust [grant number 085295] andBiotechnology and Biological Sciences Research Council [grantnumber BB/H009736/1]. Deposited in PMC for release after 6months.
Supplementary material available online at
http://jcs.biologists.org/lookup/suppl/doi:10.1242/jcs.126144/-/DC1
ReferencesBerridge, M. J., Lipp, P. and Bootman, M. D. (2000). The versatility and universality
of calcium signalling. Nat. Rev. Mol. Cell Biol. 1, 11-21.
Betzenhauser, M. J., Wagner, L. E., 2nd, Iwai, M., Michikawa, T., Mikoshiba,
K. and Yule, D. I. (2008). ATP modulation of Ca2+ release by type-2 and type-3
InsP3R: Differing ATP sensitivities and molecular determinants of action. J. Biol.
Chem. 283, 21579-21587.
Betzenhauser, M. J., Fike, J. L., Wagner, L. E., 2nd and Yule, D. I. (2009). Proteinkinase A increases type-2 inositol 1,4,5-trisphosphate receptor activity by phosphor-ylation of serine 937. J. Biol. Chem. 284, 25116-25125.
Burford, N. T., Tobin, A. B. and Nahorski, S. R. (1995). Differential coupling of m1,m2 and m3 muscarinic receptor subtypes to inositol 1,4,5-trisphosphate and adenosine39,59-cyclic monophosphate accumulation in Chinese hamster ovary cells.J. Pharmacol. Exp. Ther. 274, 134-142.
Cardy, T. J. A., Traynor, D. and Taylor, C. W. (1997). Differential regulation oftypes-1 and -3 inositol trisphosphate receptors by cytosolic Ca2+. Biochem. J. 328,785-793.
Dakin, K. and Li, W. H. (2007). Cell membrane permeable esters of D-myo-inositol1,4,5-trisphosphate. Cell Calcium 42, 291-301.
Foskett, J. K., White, C., Cheung, K. H. and Mak, D. O. (2007). Inositol trisphosphatereceptor Ca2+ release channels. Physiol. Rev. 87, 593-658.
Gosens, R., Stelmack, G. L., Dueck, G., Mutawe, M. M., Hinton, M., McNeill, K. D.,Paulson, A., Dakshinamurti, S., Gerthoffer, W. T., Thliveris, J. A. et al. (2007).Caveolae facilitate muscarinic receptor-mediated intracellular Ca2+ mobilization andcontraction in airway smooth muscle. Am. J. Physiol. 293, L1406-L1418.
Head, B. P., Patel, H. H., Roth, D. M., Lai, N. C., Niesman, I. R., Farquhar, M. G.
and Insel, P. A. (2005). G-protein-coupled receptor signaling components localize inboth sarcolemmal and intracellular caveolin-3-associated microdomains in adultcardiac myocytes. J. Biol. Chem. 280, 31036-31044.
Isshiki, M. and Anderson, R. G. W. (1999). Calcium signal transduction fromcaveolae. Cell Calcium 26, 201-208.
Kurian, N., Hall, C. J., Wilkinson, G. F., Sullivan, M., Tobin, A. B. and Willars,
G. B. (2009). Full and partial agonists of muscarinic M3 receptors reveal single andoscillatory Ca2+ responses by b2-adrenoceptors. J. Pharmacol. Exp. Ther. 330, 502-512.
Lockwich, T. P., Liu, X., Singh, B. B., Jadlowiec, J., Weiland, S. and Ambudkar,I. S. (2000). Assembly of Trp1 in a signaling complex associated with caveolin-scaffolding lipid raft domains. J. Biol. Chem. 275, 11934-11942.
Lopez Sanjurjo, C. I., Tovey, S. C., Prole, D. L. and Taylor, C. W. (2013).Lysosomes shape Ins(1,4,5)P3-evoked Ca2+ signals by selectively sequestering Ca2+
released from the endoplasmic reticulum. J. Cell Sci. 126, 289-300.
Luo, J., Busillo, J. M. and Benovic, J. L. (2008). M3 muscarinic acetylcholine receptor-mediated signaling is regulated by distinct mechanisms. Mol. Pharmacol. 74, 338-347.
Mannstadt, M., Juppner, H. and Gardella, T. J. (1999). Receptors for PTH andPTHrP: their biological importance and functional properties. Am. J. Physiol. 277,F665-F675.
McCabe, J. B. and Berthiaume, L. G. (2001). N-terminal protein acylation conferslocalization to cholesterol, sphingolipid-enriched membranes but not to lipid rafts/caveolae. Mol. Biol. Cell 12, 3601-3617.
Nagata, J., Guerra, M. T., Shugrue, C. A., Gomes, D. A., Nagata, N. and Nathanson,
M. H. (2007). Lipid rafts establish calcium waves in hepatocytes. Gastroenterology
133, 256-267.
Offermanns, S., Iida-Klein, A., Segre, G. V. and Simon, M. I. (1996). G a q familymembers couple parathyroid hormone (PTH)/PTH-related peptide and calcitoninreceptors to phospholipase C in COS-7 cells. Mol. Endocrinol. 10, 566-574.
Ostrom, R. S. and Insel, P. A. (2004). The evolving role of lipid rafts and caveolae in Gprotein-coupled receptor signaling: implications for molecular pharmacology. Br. J.
Pharmacol. 143, 235-245.
Ostrom, R. S., Liu, X., Head, B. P., Gregorian, C., Seasholtz, T. M. and Insel, P. A.
(2002). Localization of adenylyl cyclase isoforms and G protein-coupled receptors invascular smooth muscle cells: expression in caveolin-rich and noncaveolin domains.Mol. Pharmacol. 62, 983-992.
Palmer, A. E., Jin, C., Reed, J. C. and Tsien, R. Y. (2004). Bcl-2-mediated alterationsin endoplasmic reticulum Ca2+ analyzed with an improved genetically encodedfluorescent sensor. Proc. Natl. Acad. Sci. USA 101, 17404-17409.
Rodal, S. K., Skretting, G., Garred, O., Vilhardt, F., van Deurs, B. and Sandvig,
K. (1999). Extraction of cholesterol with methyl-b-cyclodextrin perturbs formation ofclathrin-coated endocytic vesicles. Mol. Biol. Cell 10, 961-974.
Rossi, A. M., Riley, A. M., Tovey, S. C., Rahman, T., Dellis, O., Taylor, E. J. A.,
Veresov, V. G., Potter, B. V. L. and Taylor, C. W. (2009). Synthetic partial agonistsreveal key steps in IP3 receptor activation. Nat. Chem. Biol. 5, 631-639.
Sampson, L. J., Hayabuchi, Y., Standen, N. B. and Dart, C. (2004). Caveolae localizeprotein kinase A signaling to arterial ATP-sensitive potassium channels. Circ. Res.
95, 1012-1018.
Schmidt, M., Evellin, S., Weernink, P. A. O., vom Dorp, F., Rehmann, H.,
Lomasney, J. W. and Jakobs, K. H. (2001). A new phospholipase-C-calciumsignalling pathway mediated by cyclic AMP and a Rap GTPase. Nat. Cell Biol. 3,1020-1024.
Schwindinger, W. F., Fredericks, J., Watkins, L., Robinson, H., Bathon, J. M.,Pines, M., Suva, L. J. and Levine, M. A. (1998). Coupling of the PTH/PTHrPreceptor to multiple G-proteins. Endocrine 8, 201-209.
Short, A. D. and Taylor, C. W. (2000). Parathyroid hormone controls the size of theintracellular Ca2+ stores available to receptors linked to inositol trisphosphateformation. J. Biol. Chem. 275, 1807-1813.
Short, A. D., Winston, G. P. and Taylor, C. W. (2000). Different receptors use inositoltrisphosphate to mobilize Ca2+ from different intracellular pools. Biochem. J. 351,683-686.
Journal of Cell Science 126 (10)2312
Journ
alof
Cell
Scie
nce
Simons, K. and Ikonen, E. (1997). Functional rafts in cell membranes. Nature 387, 569-572.
Simons, K. and Toomre, D. (2000). Lipid rafts and signal transduction. Nat. Rev. Mol.
Cell Biol. 1, 31-39.Singleton, P. A. and Bourguignon, L. Y. (2004). CD44 interaction with ankyrin and IP3
receptor in lipid rafts promotes hyaluronan-mediated Ca2+ signaling leading to nitric oxideproduction and endothelial cell adhesion and proliferation. Exp. Cell Res. 295, 102-118.
Smith, I. F. and Parker, I. (2009). Imaging the quantal substructure of single IP3Rchannel activity during Ca2+ puffs in intact mammalian cells. Proc. Natl. Acad. Sci.
USA 106, 6404-6409.Taylor, C. W. and Tovey, S. C. (2010). IP3 receptors: toward understanding their
activation. Cold Spring Harb. Perspect. Biol. 2, a004010.Taylor, C. W. and Tovey, S. C. (2012). From parathyroid hormone to cytosolic Ca2+
signals. Biochem. Soc. Trans. 40, 147-152.Tovey, S. C., de Smet, P., Lipp, P., Thomas, D., Young, K. W., Missiaen, L., De
Smedt, H., Parys, J. B., Berridge, M. J., Thuring, J. et al. (2001). Calcium puffsare generic InsP3-activated elementary calcium signals and are downregulated byprolonged hormonal stimulation to inhibit cellular calcium responses. J. Cell Sci. 114,3979-3989.
Tovey, S. C., Goraya, T. A. and Taylor, C. W. (2003). Parathyroid hormone increases
the sensitivity of inositol trisphosphate receptors by a mechanism that is independent
of cyclic AMP. Br. J. Pharmacol. 138, 81-90.
Tovey, S. C., Dedos, S. G., Taylor, E. J. A., Church, J. E. and Taylor, C. W. (2008).
Selective coupling of type 6 adenylyl cyclase with type 2 IP3 receptors mediates direct
sensitization of IP3 receptors by cAMP. J. Cell Biol. 183, 297-311.
Tovey, S. C., Dedos, S. G., Rahman, T., Taylor, E. J. A., Pantazaka, E. and Taylor,
C. W. (2010). Regulation of inositol 1,4,5-trisphosphate receptors by cAMP
independent of cAMP-dependent protein kinase. J. Biol. Chem. 285, 12979-12989.
Wang, B., Ardura, J. A., Romero, G., Yang, Y., Hall, R. A. and Friedman, P. A.
(2010). Na/H exchanger regulatory factors control parathyroid hormone receptor
signaling by facilitating differential activation of Ga protein subunits. J. Biol. Chem.
285, 26976-26986.
Weerth, S. H., Holtzclaw, L. A. and Russell, J. T. (2007). Signaling proteins in raft-
like microdomains are essential for Ca2+ wave propagation in glial cells. Cell Calcium
41, 155-167.
Willoughby, D. and Cooper, D. M. F. (2007). Organization and Ca2+ regulation of
adenylyl cyclases in cAMP microdomains. Physiol. Rev. 87, 965-1010.
Discrete IP3-sensitive Ca2+ stores 2313


![OUTSIDE THE WELL - PerkinElmerCyclic GMP [125i]-Tracer Ria kit 200 assay tubes NEX133001kT inositol 1, 4, 5-trisphosphate, [3h]-Radioreceptor assay kit 192 assay tubes NEk064001kT](https://img.pdfslide.us/doc/110x75/5ec6afc80197281b667cc9d5/outside-the-well-perkinelmer-cyclic-gmp-125i-tracer-ria-kit-200-assay-tubes.jpg)


![PerkinElmer Life Sciences, Inc....PerkinElmer Life Sciences, Inc. Inositol-1,4,5-Trisphosphate [3H] Radioreceptor Assay Kit Catalog Number NEK064 For Laboratory Use Instruction Manual](https://img.pdfslide.us/doc/110x75/612240ec9a64295c1f4b5871/perkinelmer-life-sciences-inc-perkinelmer-life-sciences-inc-inositol-145-trisphosphate.jpg)


![Maturational 1,4,5-Trisphosphate Metabolism Airway Muscledm5migu4zj3pb.cloudfront.net/manuscripts/115000/... · AssaysofIns(1,4,5)P33'-kinaseandIns(],4,5)P3S'-phosphataseac-tivities](https://img.pdfslide.us/doc/110x75/5f05e1847e708231d4152ea4/maturational-145-trisphosphate-metabolism-airway-assaysofins145p33-kinaseandins45p3s-phosphataseac-tivities.jpg)

![Pathway inositol 1,3,4-trisphosphate and 1,4-bisphosphate … · 2005-04-22 · [3H]Ins(1,3,4-[3-32P])P3, which was separated from unreacted Ins(1,3,4,5)P4, was desalted as before](https://img.pdfslide.us/doc/110x75/5e388a335f9e8f38306611b0/pathway-inositol-134-trisphosphate-and-14-bisphosphate-2005-04-22-3hins134-3-32pp3.jpg)