Embed Size (px)
Citation preview
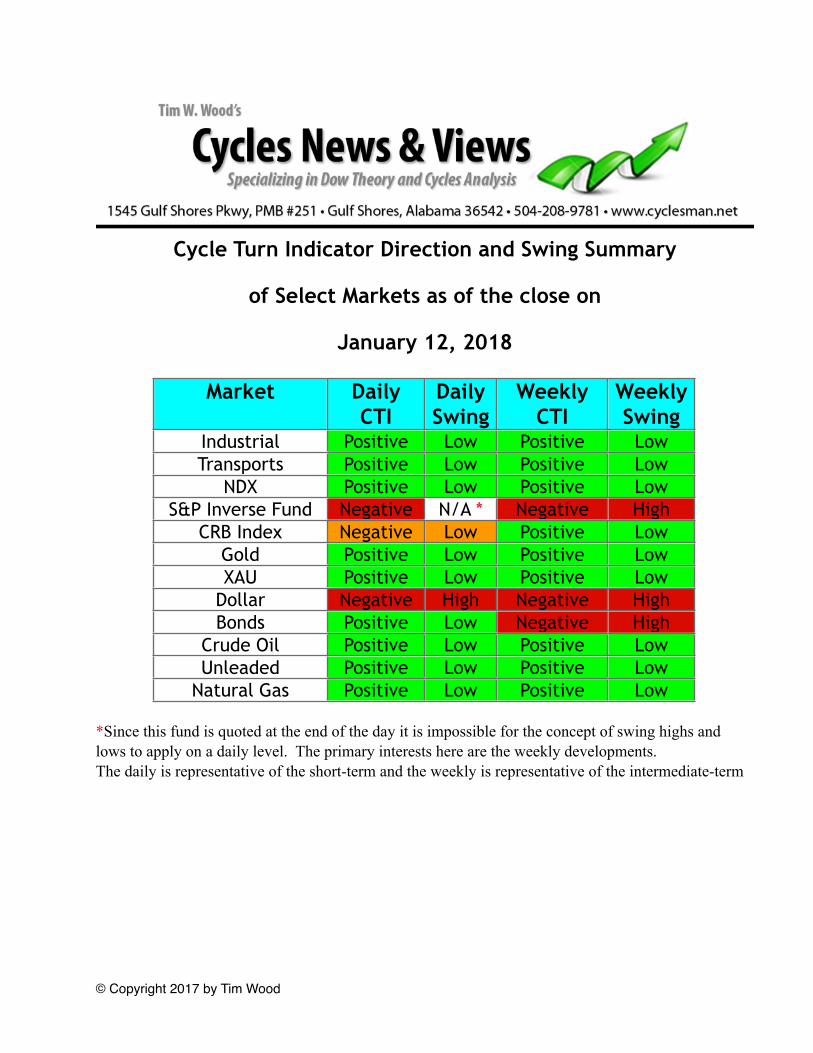
Cycle Turn Indicator Direction and Swing Summary
of Select Markets as of the close on
January 12, 2018
Market Daily CTI
Daily Swing
Weekly CTI
Weekly Swing
Industrial Positive Low Positive LowTransports Positive Low Positive Low
NDX Positive Low Positive LowS&P Inverse Fund Negative N/A * Negative High
CRB Index Negative Low Positive LowGold Positive Low Positive LowXAU Positive Low Positive Low
Dollar Negative High Negative HighBonds Positive Low Negative High
Crude Oil Positive Low Positive LowUnleaded Positive Low Positive Low
Natural Gas Positive Low Positive Low
*Since this fund is quoted at the end of the day it is impossible for the concept of swing highs and lows to apply on a daily level. The primary interests here are the weekly developments. The daily is representative of the short-term and the weekly is representative of the intermediate-term
© Copyright 2017 by Tim Wood
Short-term Updates
Note on the Cycle Turn Indicator
The most important indicator we have is the Cycle Turn Indicator and the most important timeframe, at least in my mind, is the intermediate-term. This indicator has proven itself time and time again. In reality, this is all we really need to know. Everything else is secondary. That being said, please be sure to monitor the "Cycle Turn Indicator Direction and Swing Summary" above. Red indicates that a swing high and down turn of the Cycle Turn Indicator has occurred and lower prices should follow. The only exception here is that on the daily stock market signals we also want to see both the slow cycle Turn Indicator and the New High/New Low Differential in agreement with the original Cycle Turn Indicator, which is what is covered in this summary above. Yellow, is cautionary meaning that the Cycle Turn Indicator and the swing are not in agreement, which is typically indicative of a trend change. Green, means that a swing low has occurred and that the Cycle Turn Indicator is positive, which should be followed by higher prices. Again, the only exception here is the daily stock market signals in that we want to see both the slow Cycle Turn Indicator and the New High/New Low Differential in agreement with the original Cycle Turn Indicator, which is what is covered in this summary above. For everything else, all that matters is the formation of a swing and the direction of the Cycle Turn Indicator.
All subscribers who do not understand cyclical translation should click here "Notes for New Subscribers." It is important that you read and understand the content found in both of the PDF files that you will find at this link.
© Copyright 2017 by Tim Wood
January 14, 2018
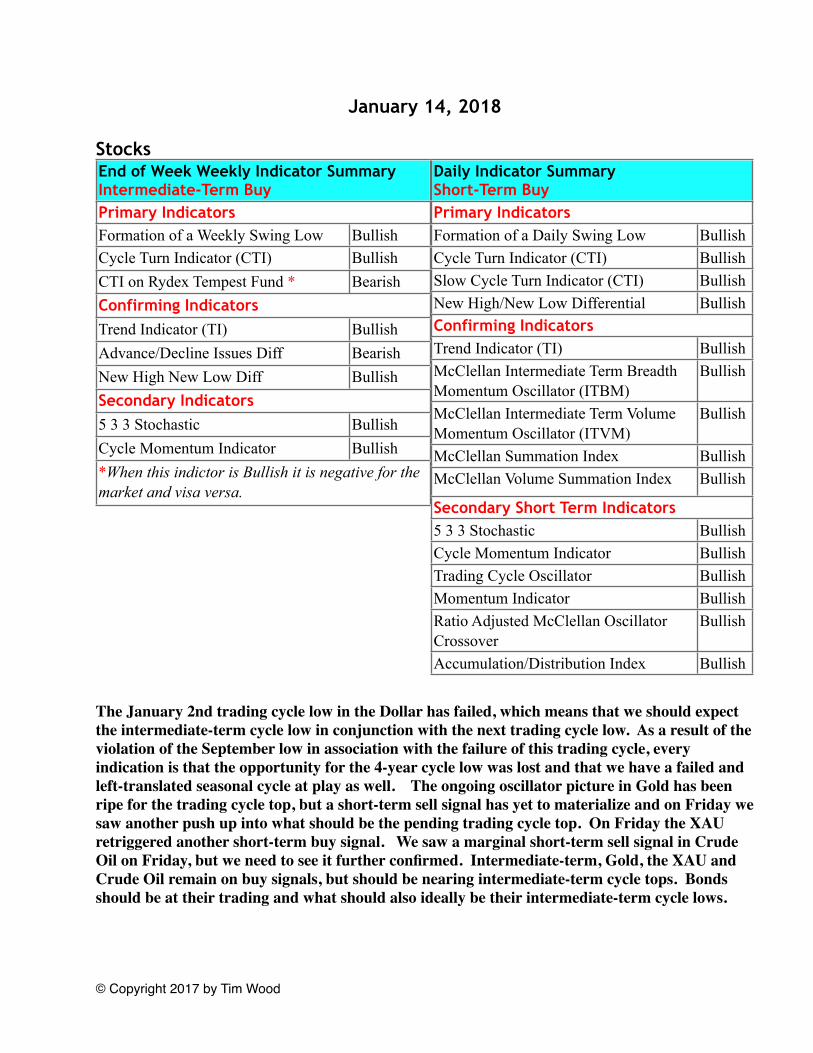
StocksEnd of Week Weekly Indicator Summary Intermediate-Term BuyEnd of Week Weekly Indicator Summary Intermediate-Term BuyPrimary Indicators Primary Indicators Formation of a Weekly Swing Low BullishCycle Turn Indicator (CTI) BullishCTI on Rydex Tempest Fund * BearishConfirming IndicatorsConfirming IndicatorsTrend Indicator (TI) BullishAdvance/Decline Issues Diff BearishNew High New Low Diff BullishSecondary IndicatorsSecondary Indicators5 3 3 Stochastic BullishCycle Momentum Indicator Bullish*When this indictor is Bullish it is negative for the market and visa versa.*When this indictor is Bullish it is negative for the market and visa versa.
Daily Indicator Summary Short-Term BuyDaily Indicator Summary Short-Term BuyPrimary Indicators Primary Indicators Formation of a Daily Swing Low BullishCycle Turn Indicator (CTI) BullishSlow Cycle Turn Indicator (CTI) BullishNew High/New Low Differential BullishConfirming IndicatorsConfirming IndicatorsTrend Indicator (TI) BullishMcClellan Intermediate Term Breadth Momentum Oscillator (ITBM)
Bullish
McClellan Intermediate Term Volume Momentum Oscillator (ITVM)
Bullish
McClellan Summation Index BullishMcClellan Volume Summation Index Bullish
Secondary Short Term IndicatorsSecondary Short Term Indicators5 3 3 Stochastic BullishCycle Momentum Indicator BullishTrading Cycle Oscillator BullishMomentum Indicator BullishRatio Adjusted McClellan Oscillator Crossover
Bullish
Accumulation/Distribution Index Bullish
The January 2nd trading cycle low in the Dollar has failed, which means that we should expect the intermediate-term cycle low in conjunction with the next trading cycle low. As a result of the violation of the September low in association with the failure of this trading cycle, every indication is that the opportunity for the 4-year cycle low was lost and that we have a failed and left-translated seasonal cycle at play as well. The ongoing oscillator picture in Gold has been ripe for the trading cycle top, but a short-term sell signal has yet to materialize and on Friday we saw another push up into what should be the pending trading cycle top. On Friday the XAU retriggered another short-term buy signal. We saw a marginal short-term sell signal in Crude Oil on Friday, but we need to see it further confirmed. Intermediate-term, Gold, the XAU and Crude Oil remain on buy signals, but should be nearing intermediate-term cycle tops. Bonds should be at their trading and what should also ideally be their intermediate-term cycle lows.
© Copyright 2017 by Tim Wood
The timing band for the current trading cycle low runs between December 27th and January 19th. The evidence continues to point toward the December 26th low as having marked the trading cycle low, but with price still operating within the timing band for this low, along with the overbought oscillator picture in association with this advance, it is still possible that we could see a quick decline into the trading cycle low this next week. Whatever the phasing of the trading cycle proves to be, this short-term buy signal will remain intact until it is reversed with a short-term sell signal and, given the timing for the intermediate-term cycle low, this trading cycle top should ideally mark the intermediate-term cycle top. Because of the closing window for the timing of this intermediate-term cycle low, there is now little time for the decline into the intermediate-term cycle low to coincide with a decline into the seasonal cycle low. Therefore, it is beginning to look as if this seasonal cycle may well stretch even further as this portion of the blowoff phase progresses. When I say this portion, I without question maintain that this is a massive bubble, but ever since the loss of the DNA Markers and in their ongoing absence, any top here, be it the intermediate-term and/or even a seasonal cycle top, is not likely to mark a top of more significance and should be followed by even higher prices.
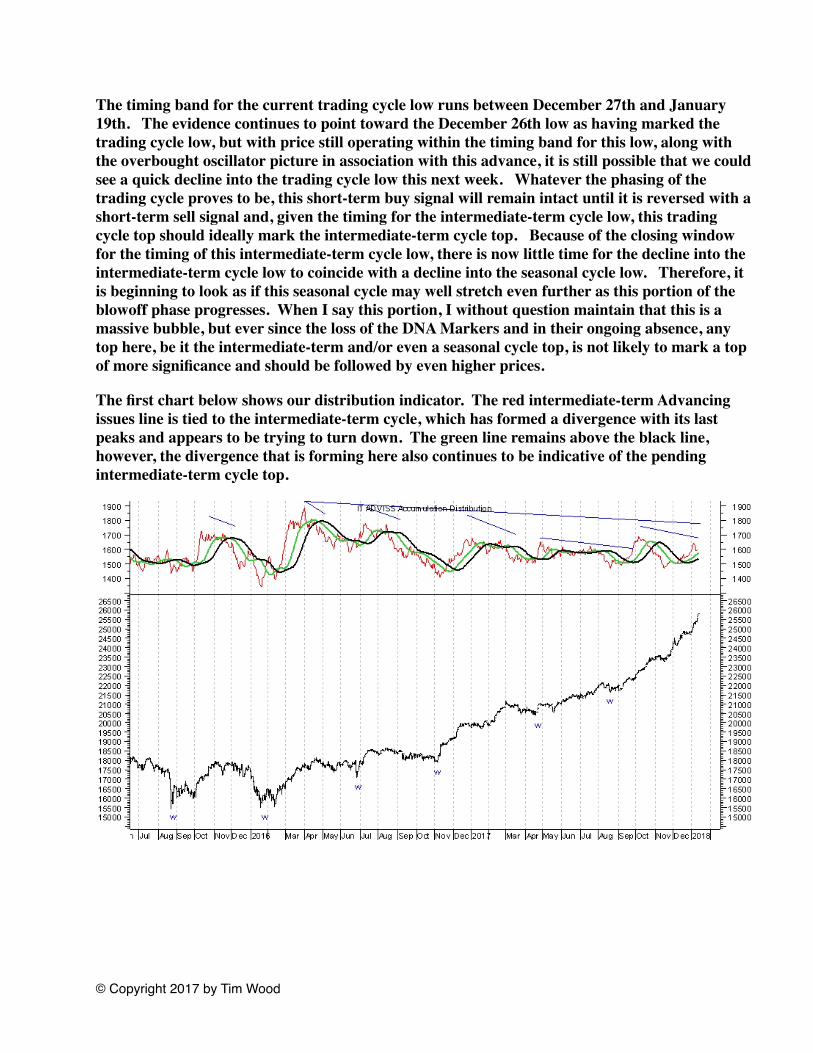
The first chart below shows our distribution indicator. The red intermediate-term Advancing issues line is tied to the intermediate-term cycle, which has formed a divergence with its last peaks and appears to be trying to turn down. The green line remains above the black line, however, the divergence that is forming here also continues to be indicative of the pending intermediate-term cycle top.
© Copyright 2017 by Tim Wood
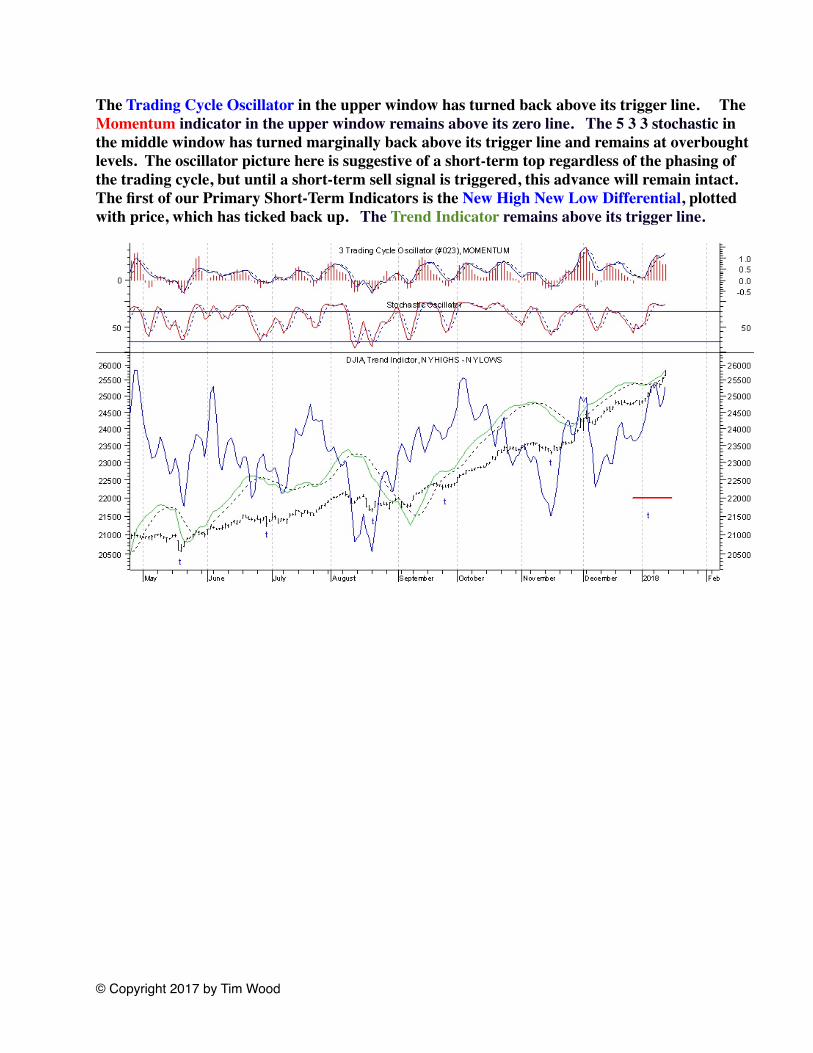
The Trading Cycle Oscillator in the upper window has turned back above its trigger line. The Momentum indicator in the upper window remains above its zero line. The 5 3 3 stochastic in the middle window has turned marginally back above its trigger line and remains at overbought levels. The oscillator picture here is suggestive of a short-term top regardless of the phasing of the trading cycle, but until a short-term sell signal is triggered, this advance will remain intact. The first of our Primary Short-Term Indicators is the New High New Low Differential, plotted with price, which has ticked back up. The Trend Indicator remains above its trigger line.
© Copyright 2017 by Tim Wood
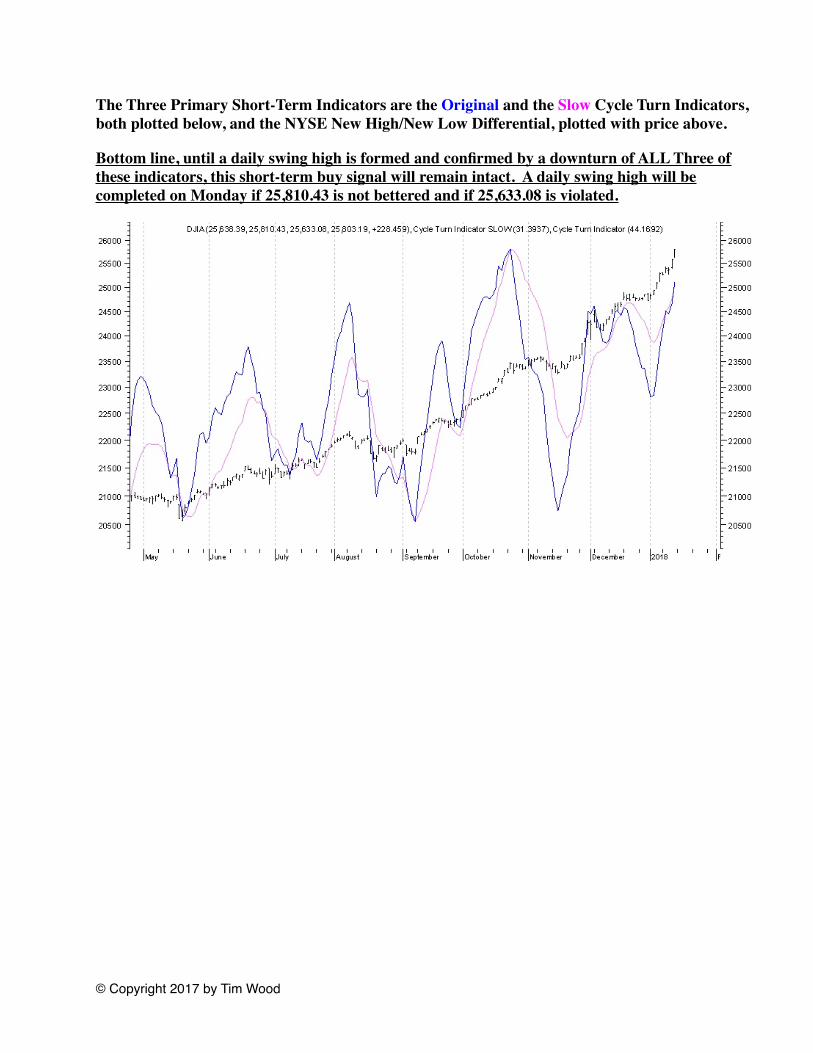
The Three Primary Short-Term Indicators are the Original and the Slow Cycle Turn Indicators, both plotted below, and the NYSE New High/New Low Differential, plotted with price above.
Bottom line, until a daily swing high is formed and confirmed by a downturn of ALL Three of these indicators, this short-term buy signal will remain intact. A daily swing high will be completed on Monday if 25,810.43 is not bettered and if 25,633.08 is violated.
© Copyright 2017 by Tim Wood
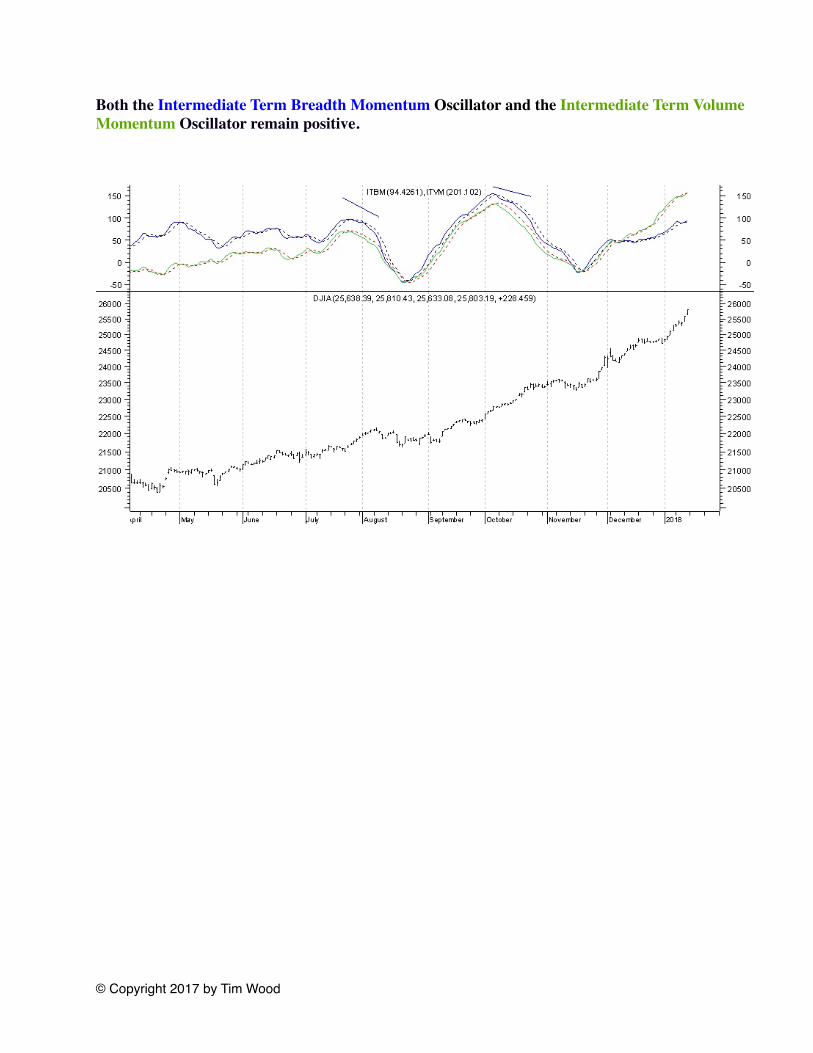
Both the Intermediate Term Breadth Momentum Oscillator and the Intermediate Term Volume Momentum Oscillator remain positive.
© Copyright 2017 by Tim Wood
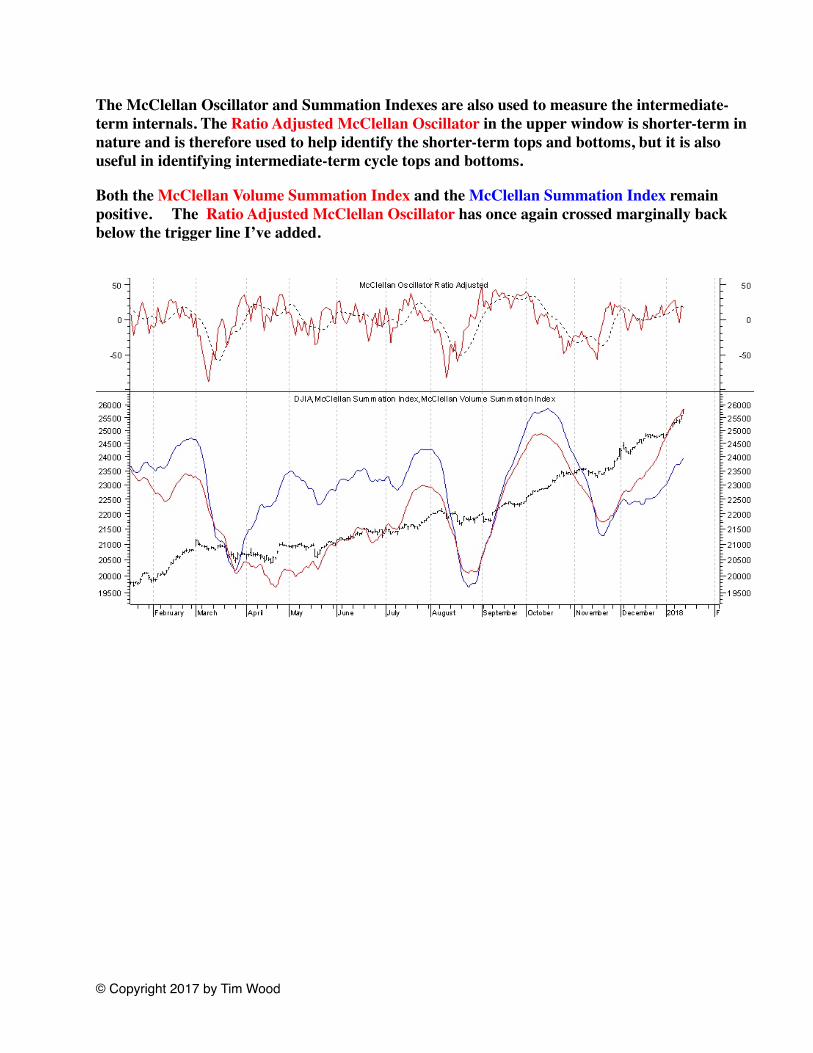
The McClellan Oscillator and Summation Indexes are also used to measure the intermediate- term internals. The Ratio Adjusted McClellan Oscillator in the upper window is shorter-term in nature and is therefore used to help identify the shorter-term tops and bottoms, but it is also useful in identifying intermediate-term cycle tops and bottoms.
Both the McClellan Volume Summation Index and the McClellan Summation Index remain positive. The Ratio Adjusted McClellan Oscillator has once again crossed marginally back below the trigger line I’ve added.
© Copyright 2017 by Tim Wood
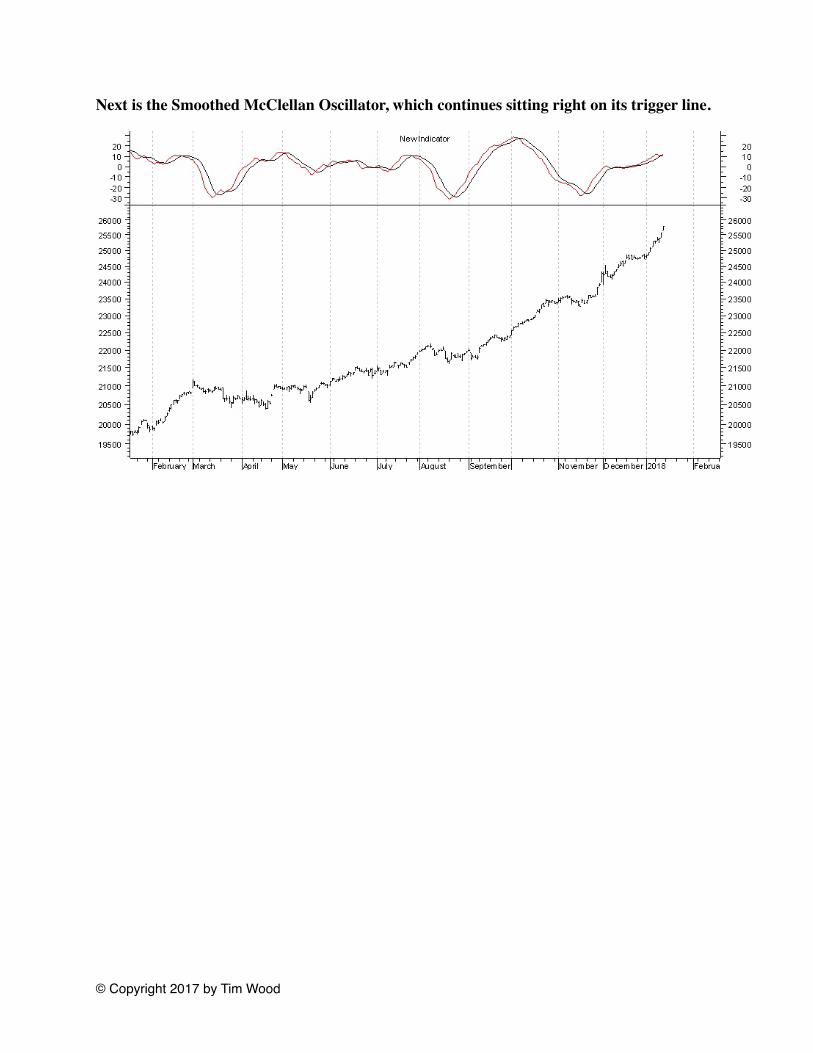
Next is the Smoothed McClellan Oscillator, which continues sitting right on its trigger line.
© Copyright 2017 by Tim Wood
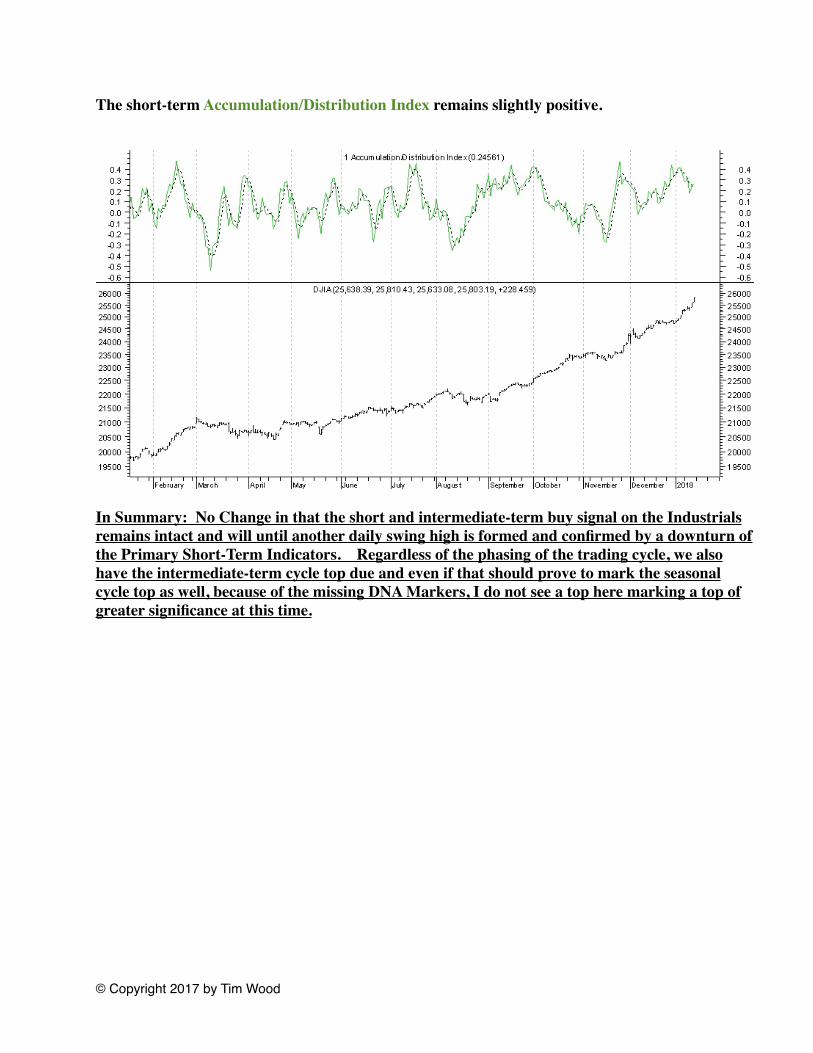
The short-term Accumulation/Distribution Index remains slightly positive.
In Summary: No Change in that the short and intermediate-term buy signal on the Industrials remains intact and will until another daily swing high is formed and confirmed by a downturn of the Primary Short-Term Indicators. Regardless of the phasing of the trading cycle, we also have the intermediate-term cycle top due and even if that should prove to mark the seasonal cycle top as well, because of the missing DNA Markers, I do not see a top here marking a top of greater significance at this time.
© Copyright 2017 by Tim Wood
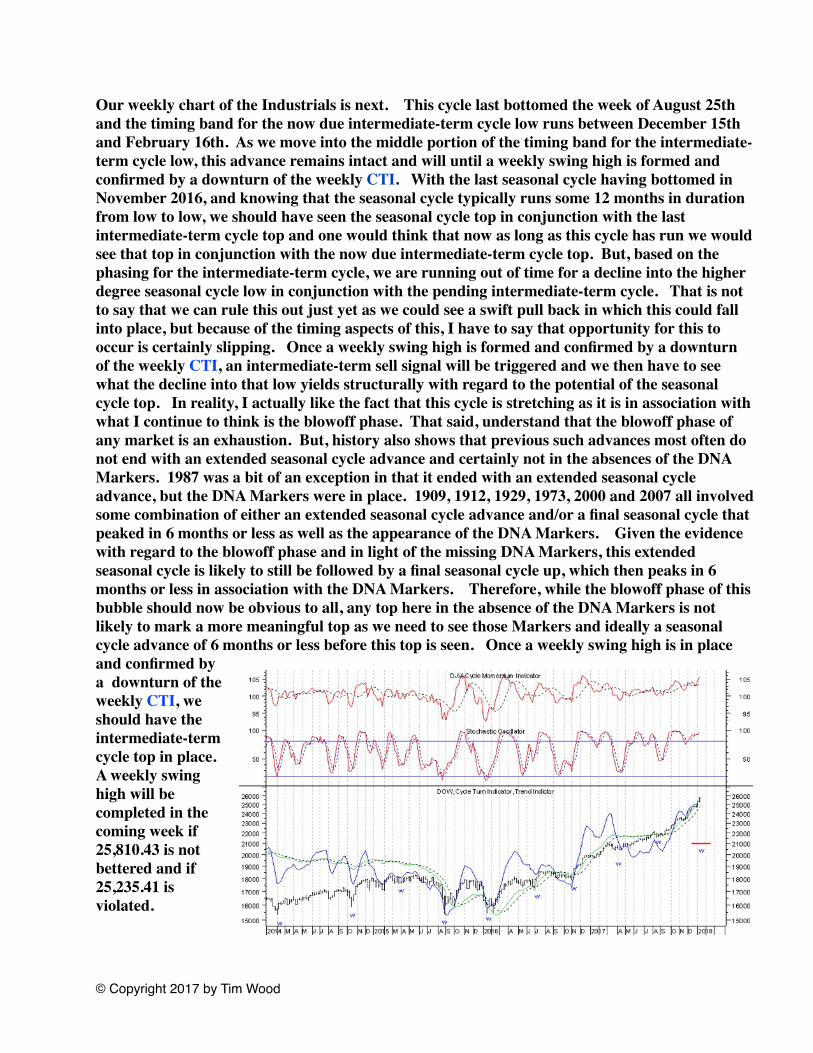
Our weekly chart of the Industrials is next. This cycle last bottomed the week of August 25th and the timing band for the now due intermediate-term cycle low runs between December 15th and February 16th. As we move into the middle portion of the timing band for the intermediate-term cycle low, this advance remains intact and will until a weekly swing high is formed and confirmed by a downturn of the weekly CTI. With the last seasonal cycle having bottomed in November 2016, and knowing that the seasonal cycle typically runs some 12 months in duration from low to low, we should have seen the seasonal cycle top in conjunction with the last intermediate-term cycle top and one would think that now as long as this cycle has run we would see that top in conjunction with the now due intermediate-term cycle top. But, based on the phasing for the intermediate-term cycle, we are running out of time for a decline into the higher degree seasonal cycle low in conjunction with the pending intermediate-term cycle. That is not to say that we can rule this out just yet as we could see a swift pull back in which this could fall into place, but because of the timing aspects of this, I have to say that opportunity for this to occur is certainly slipping. Once a weekly swing high is formed and confirmed by a downturn of the weekly CTI, an intermediate-term sell signal will be triggered and we then have to see what the decline into that low yields structurally with regard to the potential of the seasonal cycle top. In reality, I actually like the fact that this cycle is stretching as it is in association with what I continue to think is the blowoff phase. That said, understand that the blowoff phase of any market is an exhaustion. But, history also shows that previous such advances most often do not end with an extended seasonal cycle advance and certainly not in the absences of the DNA Markers. 1987 was a bit of an exception in that it ended with an extended seasonal cycle advance, but the DNA Markers were in place. 1909, 1912, 1929, 1973, 2000 and 2007 all involved some combination of either an extended seasonal cycle advance and/or a final seasonal cycle that peaked in 6 months or less as well as the appearance of the DNA Markers. Given the evidence with regard to the blowoff phase and in light of the missing DNA Markers, this extended seasonal cycle is likely to still be followed by a final seasonal cycle up, which then peaks in 6 months or less in association with the DNA Markers. Therefore, while the blowoff phase of this bubble should now be obvious to all, any top here in the absence of the DNA Markers is not likely to mark a more meaningful top as we need to see those Markers and ideally a seasonal cycle advance of 6 months or less before this top is seen. Once a weekly swing high is in place and confirmed by a downturn of the weekly CTI, we should have the intermediate-term cycle top in place. A weekly swing high will be completed in the coming week if 25,810.43 is not bettered and if 25,235.41 is violated.
© Copyright 2017 by Tim Wood
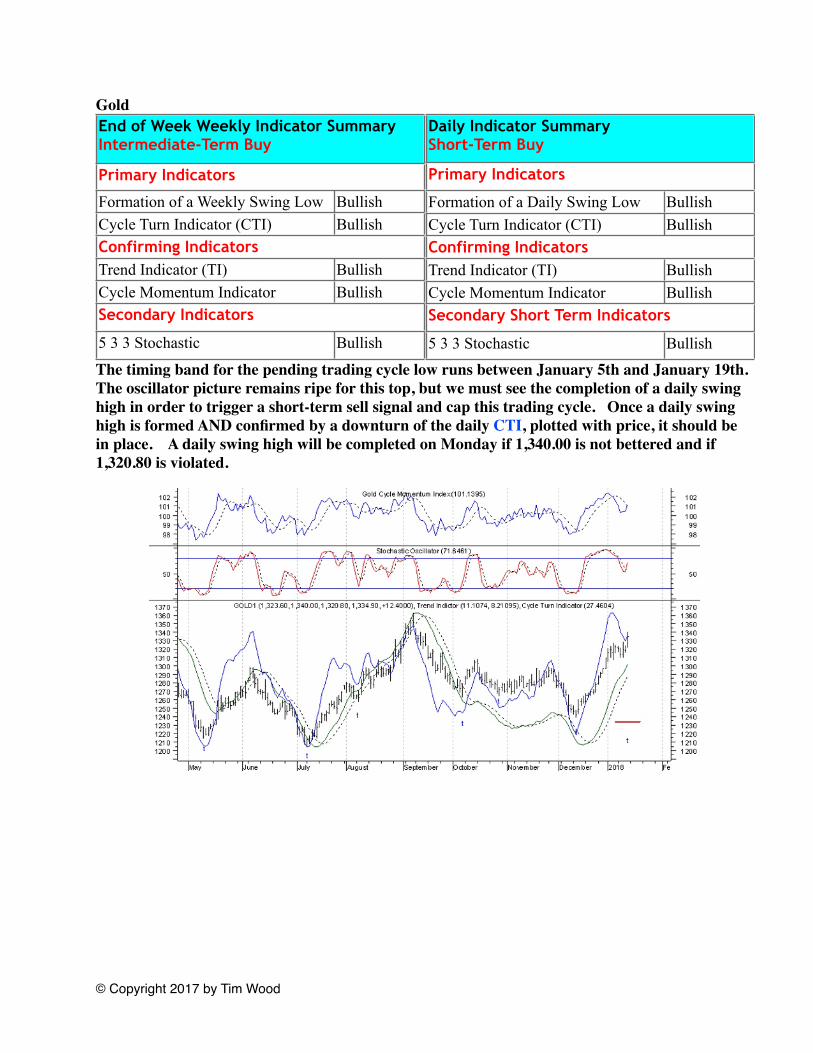
GoldEnd of Week Weekly Indicator Summary Intermediate-Term BuyEnd of Week Weekly Indicator Summary Intermediate-Term Buy
Primary Indicators Primary Indicators
Formation of a Weekly Swing Low BullishCycle Turn Indicator (CTI) BullishConfirming IndicatorsConfirming IndicatorsTrend Indicator (TI) BullishCycle Momentum Indicator BullishSecondary IndicatorsSecondary Indicators
5 3 3 Stochastic Bullish
Daily Indicator SummaryShort-Term BuyDaily Indicator SummaryShort-Term Buy
Primary Indicators Primary Indicators
Formation of a Daily Swing Low BullishCycle Turn Indicator (CTI) BullishConfirming IndicatorsConfirming IndicatorsTrend Indicator (TI) BullishCycle Momentum Indicator BullishSecondary Short Term IndicatorsSecondary Short Term Indicators
5 3 3 Stochastic Bullish
The timing band for the pending trading cycle low runs between January 5th and January 19th. The oscillator picture remains ripe for this top, but we must see the completion of a daily swing high in order to trigger a short-term sell signal and cap this trading cycle. Once a daily swing high is formed AND confirmed by a downturn of the daily CTI, plotted with price, it should be in place. A daily swing high will be completed on Monday if 1,340.00 is not bettered and if 1,320.80 is violated.
© Copyright 2017 by Tim Wood
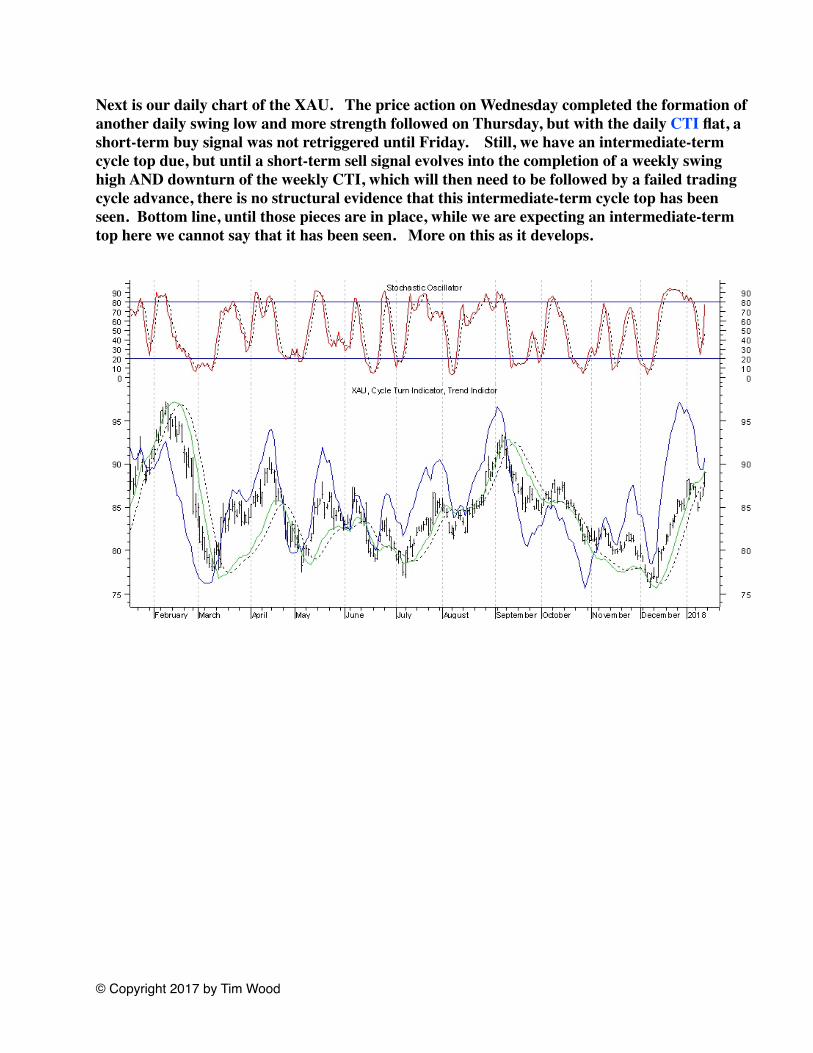
Next is our daily chart of the XAU. The price action on Wednesday completed the formation of another daily swing low and more strength followed on Thursday, but with the daily CTI flat, a short-term buy signal was not retriggered until Friday. Still, we have an intermediate-term cycle top due, but until a short-term sell signal evolves into the completion of a weekly swing high AND downturn of the weekly CTI, which will then need to be followed by a failed trading cycle advance, there is no structural evidence that this intermediate-term cycle top has been seen. Bottom line, until those pieces are in place, while we are expecting an intermediate-term top here we cannot say that it has been seen. More on this as it develops.
© Copyright 2017 by Tim Wood
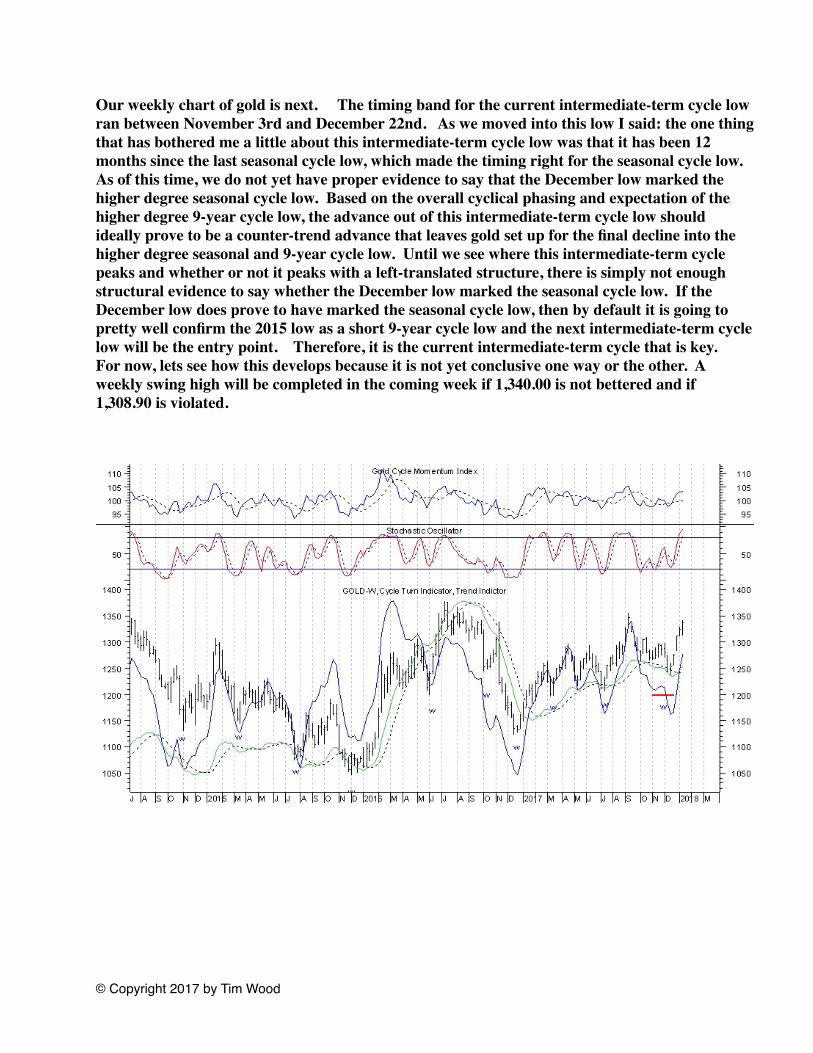
Our weekly chart of gold is next. The timing band for the current intermediate-term cycle low ran between November 3rd and December 22nd. As we moved into this low I said: the one thing that has bothered me a little about this intermediate-term cycle low was that it has been 12 months since the last seasonal cycle low, which made the timing right for the seasonal cycle low. As of this time, we do not yet have proper evidence to say that the December low marked the higher degree seasonal cycle low. Based on the overall cyclical phasing and expectation of the higher degree 9-year cycle low, the advance out of this intermediate-term cycle low should ideally prove to be a counter-trend advance that leaves gold set up for the final decline into the higher degree seasonal and 9-year cycle low. Until we see where this intermediate-term cycle peaks and whether or not it peaks with a left-translated structure, there is simply not enough structural evidence to say whether the December low marked the seasonal cycle low. If the December low does prove to have marked the seasonal cycle low, then by default it is going to pretty well confirm the 2015 low as a short 9-year cycle low and the next intermediate-term cycle low will be the entry point. Therefore, it is the current intermediate-term cycle that is key. For now, lets see how this develops because it is not yet conclusive one way or the other. A weekly swing high will be completed in the coming week if 1,340.00 is not bettered and if 1,308.90 is violated.
© Copyright 2017 by Tim Wood
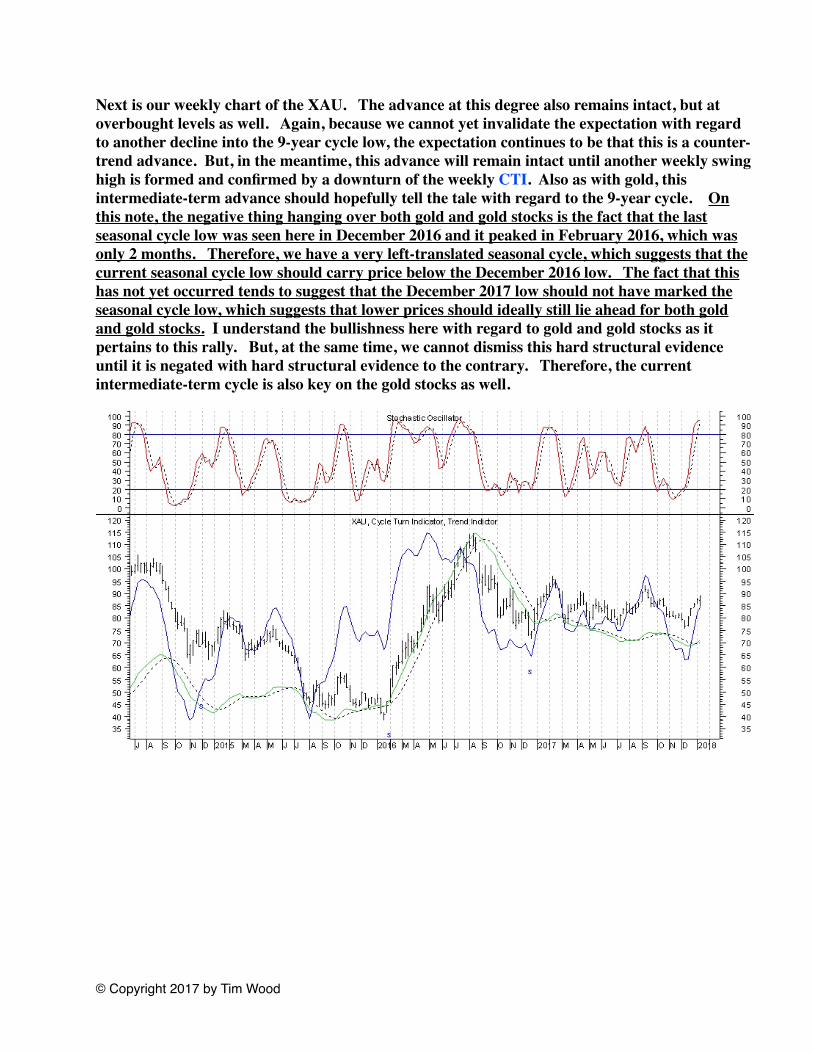
Next is our weekly chart of the XAU. The advance at this degree also remains intact, but at overbought levels as well. Again, because we cannot yet invalidate the expectation with regard to another decline into the 9-year cycle low, the expectation continues to be that this is a counter-trend advance. But, in the meantime, this advance will remain intact until another weekly swing high is formed and confirmed by a downturn of the weekly CTI. Also as with gold, this intermediate-term advance should hopefully tell the tale with regard to the 9-year cycle. On this note, the negative thing hanging over both gold and gold stocks is the fact that the last seasonal cycle low was seen here in December 2016 and it peaked in February 2016, which was only 2 months. Therefore, we have a very left-translated seasonal cycle, which suggests that the current seasonal cycle low should carry price below the December 2016 low. The fact that this has not yet occurred tends to suggest that the December 2017 low should not have marked the seasonal cycle low, which suggests that lower prices should ideally still lie ahead for both gold and gold stocks. I understand the bullishness here with regard to gold and gold stocks as it pertains to this rally. But, at the same time, we cannot dismiss this hard structural evidence until it is negated with hard structural evidence to the contrary. Therefore, the current intermediate-term cycle is also key on the gold stocks as well.
© Copyright 2017 by Tim Wood
DollarEnd of Week Weekly Indicator Summary Intermediate-Term SellEnd of Week Weekly Indicator Summary Intermediate-Term Sell
Primary Indicators Primary Indicators Formation of a Weekly Swing High BearishCycle Turn Indicator (CTI) Bearish
Confirming IndicatorsConfirming IndicatorsTrend Indicator (TI) Bearish
Cycle Momentum Indicator BearishSecondary IndicatorsSecondary Indicators5 3 3 Stochastic Bearish
Daily Indicator SummaryShort-Term SellDaily Indicator SummaryShort-Term Sell
Primary Indicators Primary Indicators Formation of a Daily Swing High BearishCycle Turn Indicator (CTI) Bearish
Confirming IndicatorsConfirming IndicatorsTrend Indicator (TI) Bearish
Cycle Momentum Indicator BearishSecondary IndicatorsSecondary Indicators5 3 3 Stochastic Bearish
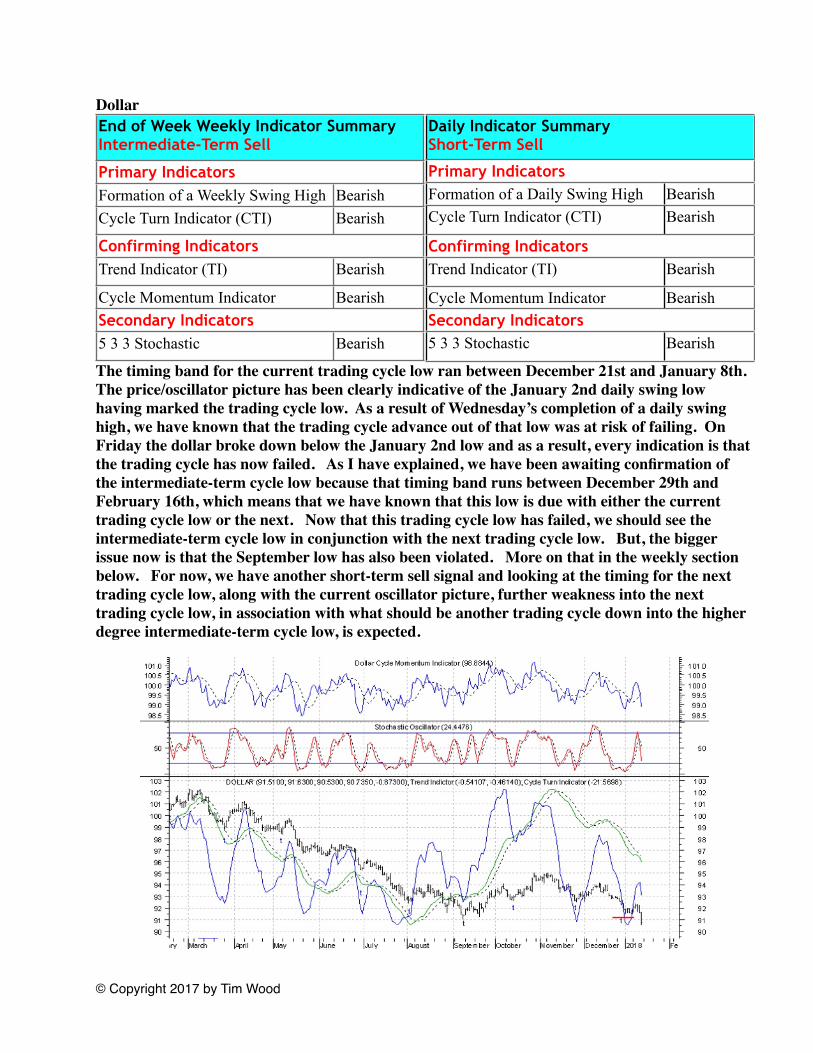
The timing band for the current trading cycle low ran between December 21st and January 8th. The price/oscillator picture has been clearly indicative of the January 2nd daily swing low having marked the trading cycle low. As a result of Wednesday’s completion of a daily swing high, we have known that the trading cycle advance out of that low was at risk of failing. On Friday the dollar broke down below the January 2nd low and as a result, every indication is that the trading cycle has now failed. As I have explained, we have been awaiting confirmation of the intermediate-term cycle low because that timing band runs between December 29th and February 16th, which means that we have known that this low is due with either the current trading cycle low or the next. Now that this trading cycle low has failed, we should see the intermediate-term cycle low in conjunction with the next trading cycle low. But, the bigger issue now is that the September low has also been violated. More on that in the weekly section below. For now, we have another short-term sell signal and looking at the timing for the next trading cycle low, along with the current oscillator picture, further weakness into the next trading cycle low, in association with what should be another trading cycle down into the higher degree intermediate-term cycle low, is expected.
© Copyright 2017 by Tim Wood
Next is our weekly chart of the Dollar. We know that the 4-year cycle in the dollar has averaged 45 months in duration. We also knew that the September seasonal cycle low marked the 40th month of the 4-year cycle, which we knew was a little short, but at the same time we also knew that another seasonal cycle of normal duration would take this 4-year cycle out to about 52 months, which is long. Bottom line, we have known that the September seasonal cycle low did indeed mark an opportunity for the higher degree 4-year cycle low, which I really expected would prove to be the case. However, in the process of this additional trading cycle down into the intermediate-term cycle low, we have now seen a violation of the September low, which suggests that we now have a failed and left-translated seasonal cycle at play, which in turn suggests that we are seeing another seasonal cycle down into the higher degree 4-year cycle low after all. But, this does not necessarily mean that we automatically hit the panic button. Let me explain. I have no doubt that the dollar is moving into the 4-year cycle low as January marks the 44th month of this cycle and the divergent oscillator picture on the monthly chart is also clearly telegraphing that pending low. However, at the same time please do not misunderstand that the evidence clearly suggests that we have a failed and left-translated seasonal cycle at play, which is clearly bearish and clearly suggests that we should now be seeing another seasonal cycle down into that low. Therefore, I want to be clear that I am not minimizing nor dismissing this development as we do now have the dollar in a position structurally to decline hard. But, while further weakness should now follow, this does not automatically mean that the dollar is going to collapse. Let me be clear, this is no doubt a bearish setup, but the dollar is also moving into the 4-year cycle low and while we could certainly see further overall weakness into the 4-year cycle low, another trait with the formation of the 4-year cycle lows are somewhat abbreviated seasonal cycle lows in association with the final seasonal cycle down. For example, it 1987 the final seasonal cycle low down into the 4-year cycle low was 8 months in duration as was the seasonal cycle low down into the 1992 4-year cycle low. In 1995 the final seasonal cycle down was 6 months in duration, which was also the case in 2011, whereas in 2014 the final seasonal cycle down was 7 months in duration. Point being, given that we are now in month 44 of the seasonal cycle and that the norm is 45 months, along with the propensity of the dollar to form somewhat abbreviated seasonal cycles in conjunction with the 4-year cycle low, I fully expect that this is now what we are seeing. Both time and the oscillator picture are telling us that we are moving into the 4-year cycle low. But, in the meantime, as a result of the violation of the September seasonal cycle low, YES, every indication is that we have a failed and left-translated seasonal cycle at play and that the dollar has further weakness to go before that low is seen. Whether this comes with a hard push down or a more modest push down remains to be seen, but either way further weakness into the 4-year cycle low in conjunction with the next seasonal cycle low should be expected. Given that January is only the 4th month of the current seasonal cycle, we should look for the advance out of the pending intermediate-term cycle low to be a failure that is followed by one more intermediate-term cycle down, which I suspect will then mark the seasonal and 4-year cycle low. We will have to see what the oscillator picture looks like when we get there, but based on the overall timing, this logically fits as it would make the seasonal cycle 8 to 9 months in duration and it would make the 4-year cycle some 48 to 49 months in duration.
© Copyright 2017 by Tim Wood
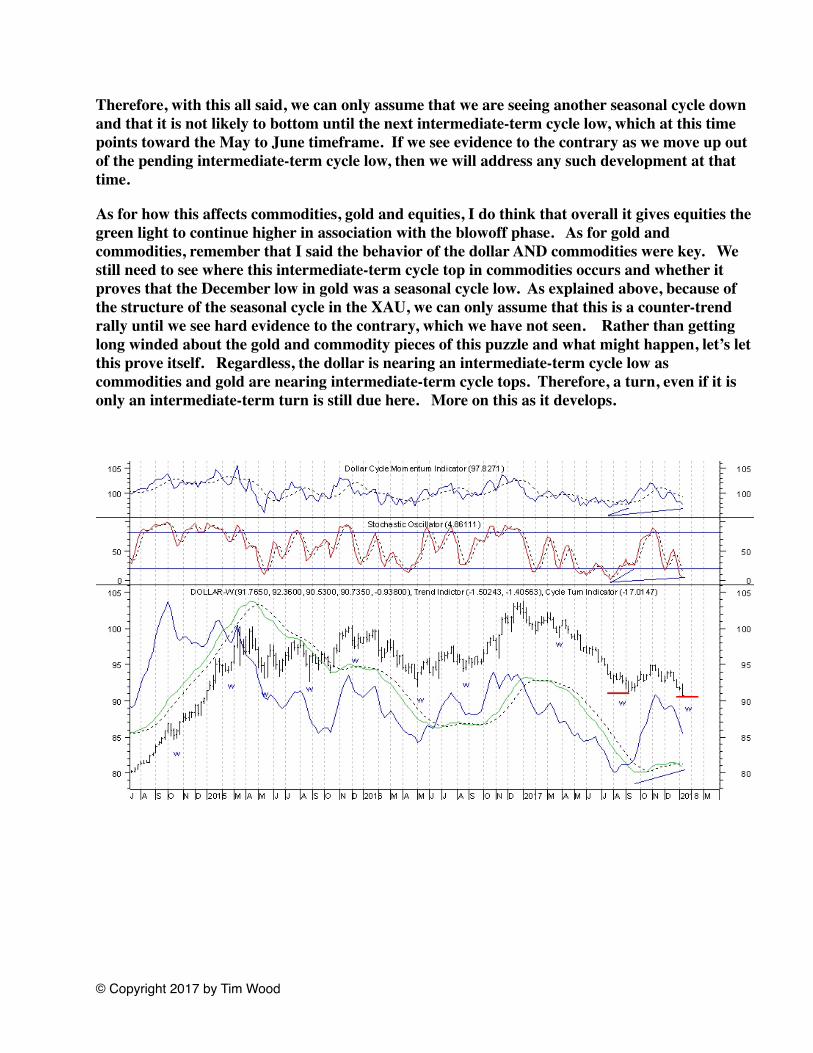
Therefore, with this all said, we can only assume that we are seeing another seasonal cycle down and that it is not likely to bottom until the next intermediate-term cycle low, which at this time points toward the May to June timeframe. If we see evidence to the contrary as we move up out of the pending intermediate-term cycle low, then we will address any such development at that time.
As for how this affects commodities, gold and equities, I do think that overall it gives equities the green light to continue higher in association with the blowoff phase. As for gold and commodities, remember that I said the behavior of the dollar AND commodities were key. We still need to see where this intermediate-term cycle top in commodities occurs and whether it proves that the December low in gold was a seasonal cycle low. As explained above, because of the structure of the seasonal cycle in the XAU, we can only assume that this is a counter-trend rally until we see hard evidence to the contrary, which we have not seen. Rather than getting long winded about the gold and commodity pieces of this puzzle and what might happen, let’s let this prove itself. Regardless, the dollar is nearing an intermediate-term cycle low as commodities and gold are nearing intermediate-term cycle tops. Therefore, a turn, even if it is only an intermediate-term turn is still due here. More on this as it develops.
© Copyright 2017 by Tim Wood
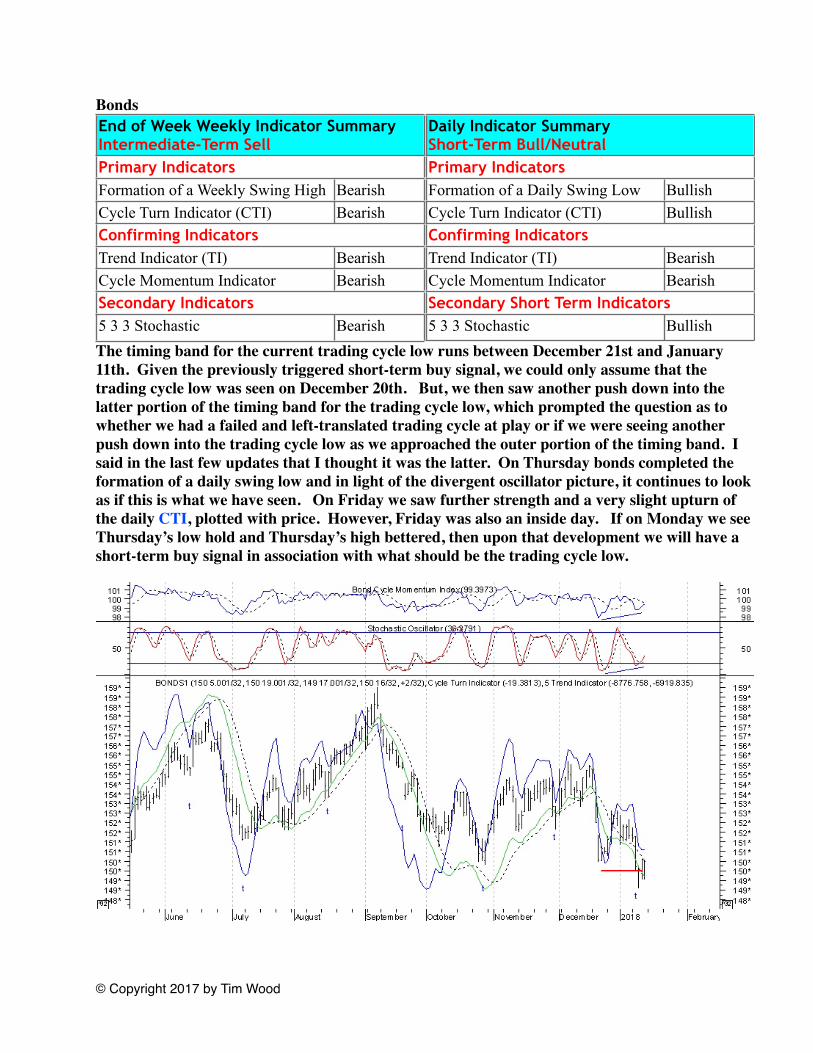
BondsEnd of Week Weekly Indicator Summary Intermediate-Term SellEnd of Week Weekly Indicator Summary Intermediate-Term SellPrimary Indicators Primary Indicators Formation of a Weekly Swing High BearishCycle Turn Indicator (CTI) BearishConfirming IndicatorsConfirming IndicatorsTrend Indicator (TI) BearishCycle Momentum Indicator BearishSecondary IndicatorsSecondary Indicators5 3 3 Stochastic Bearish
Daily Indicator SummaryShort-Term Bull/NeutralDaily Indicator SummaryShort-Term Bull/NeutralPrimary Indicators Primary Indicators Formation of a Daily Swing Low BullishCycle Turn Indicator (CTI) BullishConfirming IndicatorsConfirming IndicatorsTrend Indicator (TI) BearishCycle Momentum Indicator BearishSecondary Short Term IndicatorsSecondary Short Term Indicators5 3 3 Stochastic Bullish
The timing band for the current trading cycle low runs between December 21st and January 11th. Given the previously triggered short-term buy signal, we could only assume that the trading cycle low was seen on December 20th. But, we then saw another push down into the latter portion of the timing band for the trading cycle low, which prompted the question as to whether we had a failed and left-translated trading cycle at play or if we were seeing another push down into the trading cycle low as we approached the outer portion of the timing band. I said in the last few updates that I thought it was the latter. On Thursday bonds completed the formation of a daily swing low and in light of the divergent oscillator picture, it continues to look as if this is what we have seen. On Friday we saw further strength and a very slight upturn of the daily CTI, plotted with price. However, Friday was also an inside day. If on Monday we see Thursday’s low hold and Thursday’s high bettered, then upon that development we will have a short-term buy signal in association with what should be the trading cycle low.
© Copyright 2017 by Tim Wood
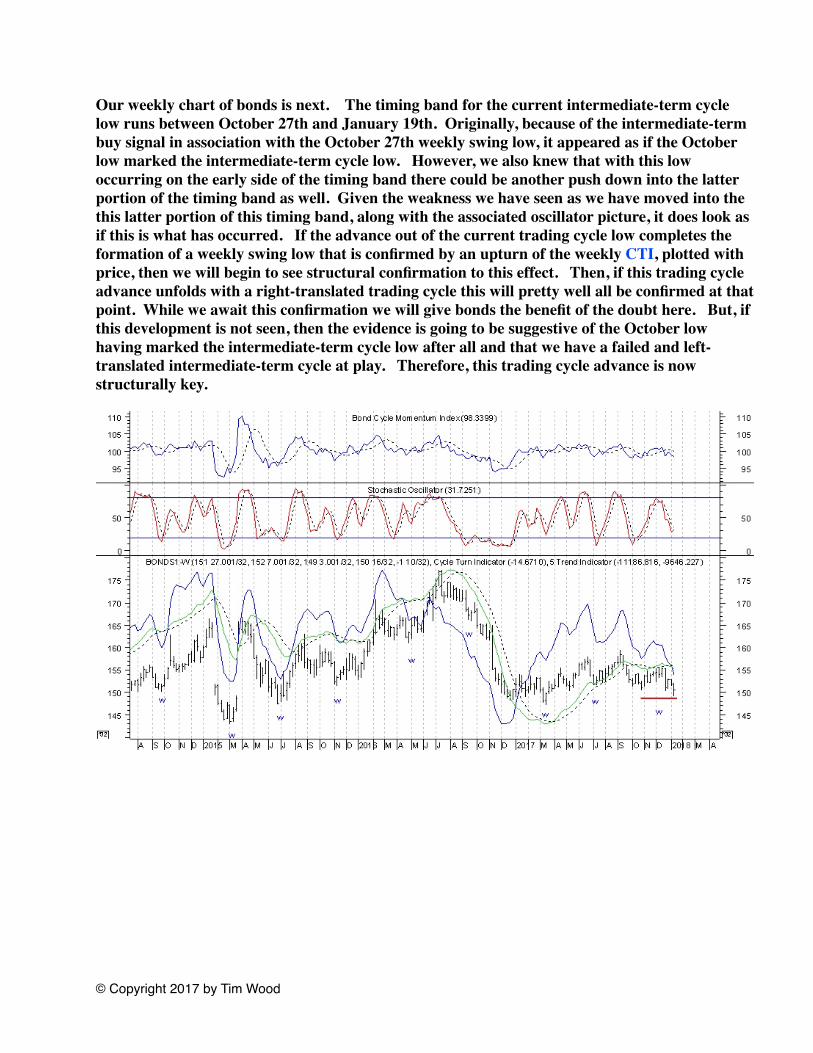
Our weekly chart of bonds is next. The timing band for the current intermediate-term cycle low runs between October 27th and January 19th. Originally, because of the intermediate-term buy signal in association with the October 27th weekly swing low, it appeared as if the October low marked the intermediate-term cycle low. However, we also knew that with this low occurring on the early side of the timing band there could be another push down into the latter portion of the timing band as well. Given the weakness we have seen as we have moved into the this latter portion of this timing band, along with the associated oscillator picture, it does look as if this is what has occurred. If the advance out of the current trading cycle low completes the formation of a weekly swing low that is confirmed by an upturn of the weekly CTI, plotted with price, then we will begin to see structural confirmation to this effect. Then, if this trading cycle advance unfolds with a right-translated trading cycle this will pretty well all be confirmed at that point. While we await this confirmation we will give bonds the benefit of the doubt here. But, if this development is not seen, then the evidence is going to be suggestive of the October low having marked the intermediate-term cycle low after all and that we have a failed and left-translated intermediate-term cycle at play. Therefore, this trading cycle advance is now structurally key.
© Copyright 2017 by Tim Wood
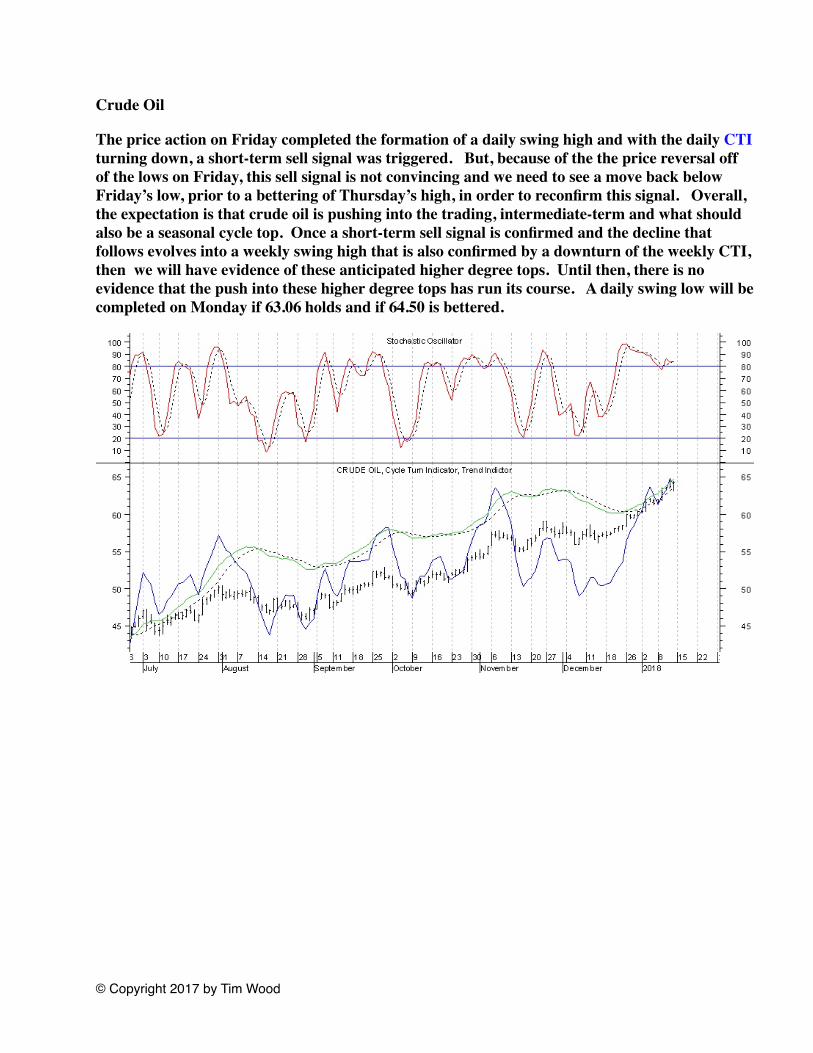
Crude Oil
The price action on Friday completed the formation of a daily swing high and with the daily CTI turning down, a short-term sell signal was triggered. But, because of the the price reversal off of the lows on Friday, this sell signal is not convincing and we need to see a move back below Friday’s low, prior to a bettering of Thursday’s high, in order to reconfirm this signal. Overall, the expectation is that crude oil is pushing into the trading, intermediate-term and what should also be a seasonal cycle top. Once a short-term sell signal is confirmed and the decline that follows evolves into a weekly swing high that is also confirmed by a downturn of the weekly CTI, then we will have evidence of these anticipated higher degree tops. Until then, there is no evidence that the push into these higher degree tops has run its course. A daily swing low will be completed on Monday if 63.06 holds and if 64.50 is bettered.
© Copyright 2017 by Tim Wood
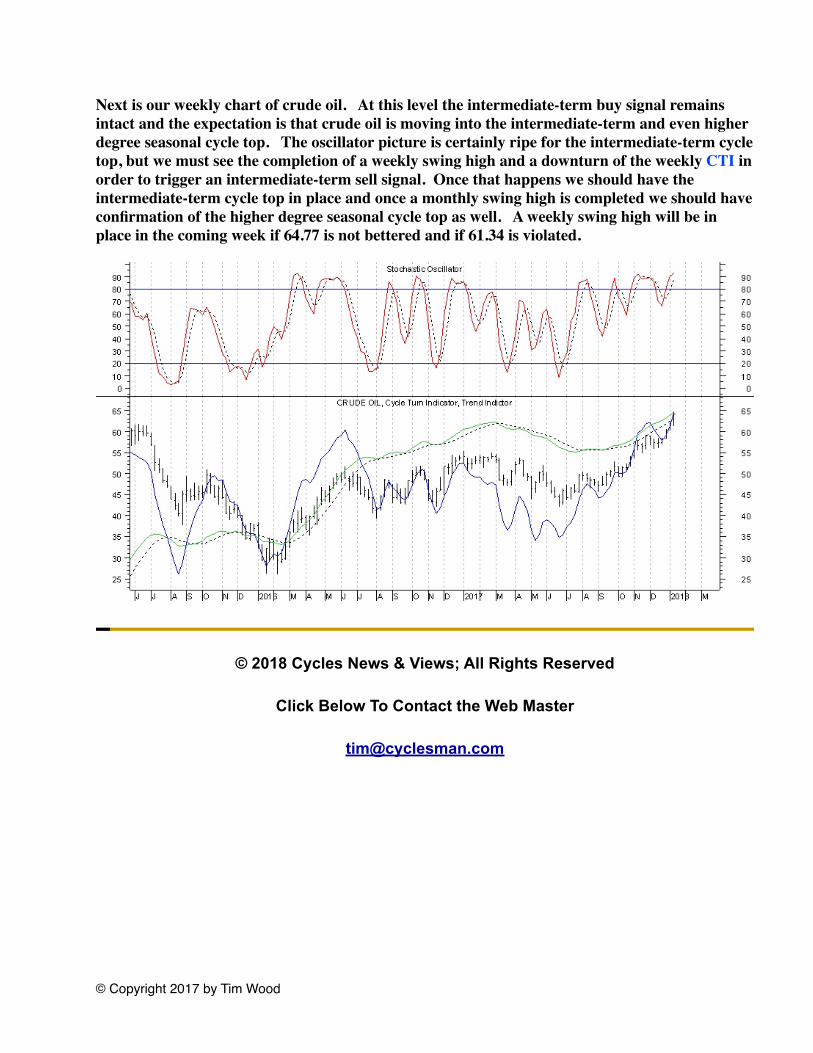
Next is our weekly chart of crude oil. At this level the intermediate-term buy signal remains intact and the expectation is that crude oil is moving into the intermediate-term and even higher degree seasonal cycle top. The oscillator picture is certainly ripe for the intermediate-term cycle top, but we must see the completion of a weekly swing high and a downturn of the weekly CTI in order to trigger an intermediate-term sell signal. Once that happens we should have the intermediate-term cycle top in place and once a monthly swing high is completed we should have confirmation of the higher degree seasonal cycle top as well. A weekly swing high will be in place in the coming week if 64.77 is not bettered and if 61.34 is violated.
© 2018 Cycles News & Views; All Rights Reserved
Click Below To Contact the Web Master
© Copyright 2017 by Tim Wood