Embed Size (px)
Citation preview
Cybersecurity Insights2020

CONTENTS1 Executive Summary ············································································································································2
2 Overview of DDoS Attacks in 2019 ····················································································································42.1 2019 vs. 2018 ·············································································································································································· 5
2.2 Key Findings ················································································································································································ 5
3 Analysis of DDoS Attacks in 2019 ·····················································································································73.1 DDoS Attack Counts and Peak Sizes ······································································································································· 8
3.1.1 Distribution of Peak Sizes ········································································································································································· 83.1.2 Attack Counts and Traffic ·······································································································································································103.1.3 Maximum and Average Peak Sizes of Individual Attacks ··················································································································12
3.2 DDoS Attack Type Analysis ····················································································································································· 143.2.1 Proportions of Different Attack Types···················································································································································14
3.2.2 Distribution of Attack Types by Consumed Bandwidth ··································································································· 173.2.3 Reflection Attacks ····················································································································································································18
3.3 DDoS Attack Time Profiling ····················································································································································· 193.3.1 Attack Distribution by Duration ······························································································································································193.3.2 Temporal Distribution of Attack Activities Intraday ····························································································································203.3.3 Temporal Distribution of Attack Activities Intraweek ··························································································································213.4.2 DDoS Attack Targets················································································································································································22
3.4 Geographical Distribution of DDoS Attacks ·························································································································· 223.4.1 Controlled DDoS Attack Sources ···························································································································································223.4.3 DDoS Control Servers ··············································································································································································23
3.5 Behavioral Analysis of Attack Sources ·································································································································· 233.5.1 Activity of Attack Sources ·······································································································································································233.5.2 Geographical Distribution of Active Attack Sources ···························································································································243.5.3 "Recidivist" Attack Sources ·····································································································································································253.5.4 Anomalous Behavior ···············································································································································································263.5.5 Analysis of Attack Group Behaviors ······················································································································································27
3.6 Analysis of IoT Attack Resources··········································································································································· 363.6.1 Participation of IoT Devices in DDoS Attacks ······································································································································363.6.2 Geographical Distribution of IoT Devices Involved in DDoS Attacks ································································································373.6.3 Distribution of IoT Devices Involved in DDoS Attacks by Type ··········································································································38
3.7 DDoS Botnets ············································································································································································393.7.1 Overview ····································································································································································································393.7.2 Active Families ·························································································································································································42
4 Looking Forward ···············································································································································45
About NSFOCUS
NSFOCUS, Inc., a global network and cyber security leader, protects enterprises and carriers from advanced cyber attacks. The company's Intelligent Hybrid Security strategy utilizes both cloud and on-premises security platforms, built on a foundation of real-time global threat intelligence, to provide multi-layered, unified and dynamic protection against advanced cyber attacks.
NSFOCUS works with Fortune Global 500 companies, including four of the world's five largest financial institutions, organizations in insurance, retail, healthcare, critical infrastructure industries as well as government agencies. NSFOCUS has technology and channel partners in more than 60 countries, is a member of both the Microsoft Active Protections Program (MAPP), and the Cloud Security Alliance (CSA).
A wholly owned subsidiary of NSFOCUS Technologies Group Co., Ltd., the company has operations in the Americas, Europe, the Middle East and Asia Pacific.
Special Statement
All data used for analysis has been anonymized and no customer information appears in this report to avoid information disclosure per GDPR.

I
2020 Cybersecurity Insights
CONTENTS
CONTENTS1 Executive Summary ············································································································································2
2 Overview of DDoS Attacks in 2019 ····················································································································42.1 2019 vs. 2018 ·············································································································································································· 5
2.2 Key Findings ················································································································································································ 5
3 Analysis of DDoS Attacks in 2019 ·····················································································································73.1 DDoS Attack Counts and Peak Sizes ······································································································································· 8
3.1.1 Distribution of Peak Sizes ········································································································································································· 83.1.2 Attack Counts and Traffic ·······································································································································································103.1.3 Maximum and Average Peak Sizes of Individual Attacks ··················································································································12
3.2 DDoS Attack Type Analysis ····················································································································································· 143.2.1 Proportions of Different Attack Types···················································································································································14
3.2.2 Distribution of Attack Types by Consumed Bandwidth ··································································································· 173.2.3 Reflection Attacks ····················································································································································································18
3.3 DDoS Attack Time Profiling ····················································································································································· 193.3.1 Attack Distribution by Duration ······························································································································································193.3.2 Temporal Distribution of Attack Activities Intraday ····························································································································203.3.3 Temporal Distribution of Attack Activities Intraweek ··························································································································213.4.2 DDoS Attack Targets················································································································································································22
3.4 Geographical Distribution of DDoS Attacks ·························································································································· 223.4.1 Controlled DDoS Attack Sources ···························································································································································223.4.3 DDoS Control Servers ··············································································································································································23
3.5 Behavioral Analysis of Attack Sources ·································································································································· 233.5.1 Activity of Attack Sources ·······································································································································································233.5.2 Geographical Distribution of Active Attack Sources ···························································································································243.5.3 "Recidivist" Attack Sources ·····································································································································································253.5.4 Anomalous Behavior ···············································································································································································263.5.5 Analysis of Attack Group Behaviors ······················································································································································27
3.6 Analysis of IoT Attack Resources··········································································································································· 363.6.1 Participation of IoT Devices in DDoS Attacks ······································································································································363.6.2 Geographical Distribution of IoT Devices Involved in DDoS Attacks ································································································373.6.3 Distribution of IoT Devices Involved in DDoS Attacks by Type ··········································································································38
3.7 DDoS Botnets ············································································································································································393.7.1 Overview ····································································································································································································393.7.2 Active Families ·························································································································································································42
4 Looking Forward ···············································································································································45
1 Executive Summary ................................................................................................. 1
2 Key Findings ............................................................................................................. 3
3 Insight into Threats .................................................................................................. 6
3.1 Malicious IP Addresses .................................................................................................. 73.1.1 Distribution of Attacks by Type ........................................................................................... 73.1.2 Geographical Distribution ................................................................................................... 7
3.2 Vulnerabilities ................................................................................................................. 93.2.1 Overall Trends ...................................................................................................................... 93.2.2 Exploits ............................................................................................................................... 113.2.3 Server Vulnerabilities ......................................................................................................... 123.2.4 Application Vulnerabilities ................................................................................................ 13
3.3 Malware......................................................................................................................... 143.3.1 Impact of COVID-19 on Cybersecurity .............................................................................. 143.3.2 Email Trojans ...................................................................................................................... 153.3.3 IoT Botnet Families ............................................................................................................ 20
3.4 Malicious Traffic ........................................................................................................... 243.4.1 Web Threats ........................................................................................................................ 243.4.2 DDoS Threats ...................................................................................................................... 273.4.3 Cryptojacking ..................................................................................................................... 34
4 Biggest Trends in 2020 ........................................................................................... 38
4.1 Advanced Persistent Threats ....................................................................................... 394.1.1 Activity Tracking ................................................................................................................. 394.1.2 Intelligence About APT Groups ......................................................................................... 41
目录 CONTENTS
1.历史漏洞回顾……………………………………………………………4
1.1漏洞数量逐年显著增长…………………………………………………4
1.2漏洞数量逐年显著增长…………………………………………………5
1.2.1漏洞数量逐年显著增长……………………………………………………………8
1.2.2漏洞数量逐年显著增长……………………………………………………………9
2.漏洞利用情况……………………………………………………………4
2.1典型漏洞攻击事件监测举例……………………………………………4
2.2实际攻击中常用到Nday漏洞……………………………………………5
3.漏洞发展趋势……………………………………………………………4
3.1浏览器漏洞种类复杂多样……………………………………………4
3.2文档类型漏洞是鱼叉攻击的重要载体……………………………………5
摘要………………………………………………………………………2
II
2020 Cybersecurity Insights
CONTENTS
4.2 IoT Security ................................................................................................................... 454.2.1 Exploits ............................................................................................................................... 464.2.2 Reflection Attacks .............................................................................................................. 48
4.3 Industrial Internet Security ......................................................................................... 484.3.1 Exposure of ICS Assets ....................................................................................................... 484.3.2 ICS Vulnerabilities and Attacks .......................................................................................... 514.3.3 Major Events ....................................................................................................................... 52
4.4 5G Security .................................................................................................................... 544.4.1 SDN Controller ................................................................................................................... 544.4.2 NFV Technology ................................................................................................................. 554.4.3 Multi-access Edge Computing ........................................................................................... 554.4.4 Network Slicing Technology ............................................................................................. 564.4.5 Network Exposure Function .............................................................................................. 58
4.5 AI Security ..................................................................................................................... 584.5.1 Training Data ...................................................................................................................... 594.5.2 Algorithmic Model .............................................................................................................. 604.5.3 AI Abuse .............................................................................................................................. 60
4.6 Data Security ................................................................................................................ 614.6.1 Data Breaches .................................................................................................................... 614.6.2 Regulations and Policies ................................................................................................... 634.6.3 Technological Development Trend .................................................................................. 64
5 Conclusion .............................................................................................................. 68

1
2020 Cybersecurity Insights
Executive Summary
1 Executive Summary
#
!
Executive Summary
1
2
2020 Cybersecurity Insights
Executive Summary
In 2020, COVID-19 reached almost every corner of the world. Amid this pandemic, security incidents
leveraging pandemic-related information streamed in. In the past year, NSFOCUS kept close tabs on
hacking activities conducted by crafting pandemic-related trending topics. We noticed that hackers
usually incorporated information about the novel coronavirus disease into the kill chain and industry
chain of the Internet-enabled underground economy, as demonstrated in the significant increase in
social engineering attacks related to COVID-19.
During the past year, national conflicts in the cyberspace against the global geopolitical background
kept escalating, with critical information infrastructure becoming a top concern in cybersecurity
assurance. NSFOCUS is committed to providing insights into the security of the Internet of things (IoT),
industrial Internet, 5G, artificial intelligence (AI), and data.
🅙 NSFOCUS has been continuing to delve into assets and related risks and threats in the IoT
and industrial Internet. As for exposure of assets, the actual number of IPv4 and IPv6 assets
exposed on the IoT and industrial Internet is updated, and related threats are analyzed from
the perspectives of exploits and protocol attacks. Such analysis covers the latest threats of
reflection attacks and ransomware attacks.
🅙 5G-related security is analyzed from the perspectives of incidents, 5G security standard
updates, and 5G security risks. Upon a thorough analysis of potential security threats and attack
surfaces of the new 5G technology, NSFOCUS makes it clear that a comprehensive defense
system is key to cybersecurity.
🅙 NSFOCUS finds that the adoption rate of AI soared during cybersecurity improvement in
2020, mainly resulting from the widespread use of AI for threat detection, malicious execution
prevention, and enhancement of security operations. On the other hand, AI provides good
opportunities for hackers. Adversarial examples have become the biggest threat facing AI
security, followed by backdoor attacks and training data poisoning.
🅙 According to data collected by NSFOCUS about the biggest data breaches around the world,
data and privacy disclosure incidents scaled up in 2020, with more devastating impacts that
may even disrupt the stability of the whole society.

3
2020 Cybersecurity Insights
Key Findings
2 Key Findings
Key Findings2

4
2020 Cybersecurity Insights
Key Findings
1. Following the outbreak of the COVID-19 pandemic in 2020, cyberattacks leveraging this event
have sprawled into every corner of the globe, with an escalating frequency of occurrence. The
rapid development of new infrastructure, such as the IoT, industrial Internet, 5G networks, and
AI networks, gives rise to new cybersecurity requirements, accelerating transformations in the
world's cybersecurity industry.
2. [Vulnerabilities] Compared with 2019, the number of vulnerabilities decreased in 2020.
Specifically, CWE-79 (cross-site scripting) vulnerabilities were ranked first in terms of the
quantity, Windows MS17-010 vulnerabilities were most frequently exploited in scanning attacks,
and web servers were the biggest target because of containing various vulnerabilities, especially
those in the Common Gateway Interface (CGI).
3. [Malware] COVID-19 phishing was a trending phrase in the cybersecurity realm in the first half
of 2020. Related topics became a convenient bait for malicious email attacks. Variants of Mirai
and Gafgyt, the two major IoT DDoS families, were emerging on end, attempting to exploit new
vulnerabilities for lateral movement.
4. [Malicious traffic] While the number and traffic volume of distributed denial-of-service (DDoS)
attacks decreased in 2020, the bandwidth of such attacks in 5G environments increased, with
small-medium attacks overtaking small ones to become the mainstream.
5. [APTs] In 2020, Lazarus and Kimsuky, the two advanced persistent threat (APT) groups from
North Korea, were mostly frequently named, followed by APT-C-35, APT32, and Dropping
Elephant, three Southeast Asian groups. APT groups showed a new interest in launching
attacks by leveraging the pandemic, especially attacks that used COVID-19 information as
the decoy. Typical examples of such groups in 2020 include Dropping Elephant (India), APT32
(Vietnam), Operation C-Major (Pakistan), TA505, Sidewinder (India), Lazarus Group (North
Korea), and Wizard Spider (Russia).
6. [IPv6 security threats] Education institutions and carriers continued to be the major targets of
malicious actors, together receiving over 90% of cyberattacks. Cryptojacking and worms were
still the major attack methods used in IPv6 environments. A significant increase was spotted in

5
2020 Cybersecurity Insights
Key Findings
exploits targeting IPv6 websites.
7. [Dark web data breaches] Data breaches in 2020 happened frequently, but with a limited impact,
characteristic of less capable attackers. Of all personal information leaked, most was stolen by
intercepting mobile texts with pseudo base stations. Therefore, it is recommended that users
set the network mode of their handsets to use of 4G or 5G only as a workaround.
8. [IoT] In 2020, top 3 IoT assets exposed on the Internet were routers, VoIP phones, and video
surveillance devices. Globally, remote command execution (RCE) vulnerabilities were most
frequently exploited in IoT attacks, especially WS-Discovery reflection attacks. Such reflection
attacks related to the IoT pose a severe challenge to DDoS mitigation.
9. [Industrial Internet] In 2020, security incidents targeting industrial control systems (ICSs)
on the Internet were on the rise. The major threat to ICS environments and operations was
ransomware. Of all ICS assets worldwide, those using the Ethernet Industrial Protocol (ENIP)
were most exposed, followed by assets using Modbus.
10. [5G security threats] Many countries have raised the development of 5G to the strategic level.
5G security standards are focused on the business security of 5G networks, and 5G security
protocols highlight the importance of encryption, mutual authentication, integrity protection,
and enhanced privacy and availability.
11. [AI security threats] The major security risks facing AI are from network infrastructure, training
data, algorithmic models, and AI application abuses. Adversarial examples are the biggest
security threat facing AI systems, followed by backdoor attacks and training data poisoning.
12. [Data security] In 2020, data breaches continued to be a serious issue worldwide.
Misconfiguration and hacking were two major contributors to massive data breaches. Most
countries have developed data security and privacy laws, urging enterprises and users to raise
their awareness of privacy and data protection.
6
2020 Cybersecurity Insights
Insight into Threats
3 Insight into Threats
Insight into Threats
3

7
2020 Cybersecurity Insights
Insight into Threats
3.1 Malicious IP Addresses
3.1.1 Distribution of Attacks by TypeAccording to data collected by NSFOCUS Threat Intelligence (NTI), in terms of attack types1, spam was
ranked first because of involving the largest proportion (48.9%) of malicious IP addresses. Zombies and
exploits came in second and third. Besides, about 30% of IP addresses were involved in more than one
type of attacks, a bit higher than the percentage in 2019, indicating a minor increase in the resource
reuse rate.
0.0%
0.0%
0.2%
1.1%
2.3%
2.4%
2.5%
7.4%
10.7%
11.0%
13.1%
30.1%
48.9%
Mining pool
Cryptojacking
Phishing
Malware
Others
Brute force
Proxy
Scanning
Web attack
DDoS
Exploit
Botnet
Spam
Figure 3-1 Distribution of attacks by type
3.1.2 Geographical DistributionIn terms of the geographical distribution of source IP addresses, China, the USA, India, and Japan were
four countries grabbing the top spots.
1 As an IP address may launch more than one type of attacks, the sum of all percentages indicated in the following figure is greater than 100%.

8
2020 Cybersecurity Insights
Insight into Threats
66.5%
18.4%
1.4%
1.4%
1.0%
0.8%
0.8%
0.7%
0.7%
0.7%
China
USA
India
Japan
Thailand
Russia
Vietnam
Germany
Brazil
UK
Figure 3-2 Global distribution of attack sources
In terms of the geographical distribution of target IP addresses, China and the USA were two biggest
targets, together suffering around 76% of attacks.

9
2020 Cybersecurity Insights
Insight into Threats
55.6%
20.3%
2.8%
2.1%
1.8%
1.4%
1.3%
1.2%
1.0%
1.0%
China
USA
Russia
India
Unknown
Japan
Germany
Thailand
UK
South Africa
Figure 3-3 Global distribution of attack targets
3.2 Vulnerabilities
3.2.1 Overall TrendsBy December 31, 2020, 14,443 vulnerabilities found in 2020 had been added to the National Vulnerability
Database (NVD). The following figure shows the annual number of vulnerabilities recorded in the NVD

10
2020 Cybersecurity Insights
Insight into Threats
over a 22-year period from 1999 to 2020. Compared with 2019, the number of new vulnerabilities in
2020 decreased.
0
2000
4000
6000
8000
10000
12000
14000
16000
1800019
9920
0020
0120
0220
0320
0420
0520
0620
0720
0820
0920
1020
1120
1220
1320
1420
1520
1620
1720
1820
1920
20
历年漏洞数量统计
Figure 3-4 Annual number of vulnerabilities from 1999 to 2020
CVSS 3.1 rates vulnerabilities into four levels in terms of the severity: critical (9.0–10.0), high (7.0–8.9),
medium (4.0–6.9), and low (0.1–3.9). By December 31, 2021, CVSS 3.1 scores had been assigned
to 14,169 vulnerabilities, more than half of which (56.66%) were either critical (14.07%) or high-level
(42.59%) ones. These vulnerabilities can be exploited to remotely execute arbitrary commands or code.
Some can even allow for remote code execution without requiring user interactions.
2.39%
40.95%
42.59%
14.07%
漏洞CVSS 3.1按数量分布
LOW MEDIUM HIGH CRITICAL
Figure 3-5 Distribution of CVSS 3.1 vulnerabilities

11
2020 Cybersecurity Insights
Insight into Threats
3.2.2 ExploitsBased on data collected by NTI through ongoing monitoring, we picked exploit attacks from alerts
logged throughout 2020 and identified top 10 vulnerabilities most frequently alerted, as shown in the
following table.
Table 3-1 Top 10 vulnerabilities alerted in 2020
Vulnerability ID Vulnerability Name Number of Alerts
ms17-010 Windows MS17-010 Vulnerability Scanning Attack 10,694,163
CVE-2003-0486 phpBB viewtopic.php topic_id Remote SQL Injection Vulnerability 7,413,032
CVE-2016-0800 OpenSSL SSLv2 Weak Encryption Communication Method DROWN Attack Vulnerability 2,991,082
CVE-2005-2678 Microsoft IIS "500-100.asp" Source Code Disclosure Vulnerability 2,119,380
EDB-ID 45978 ThinkPHP 5.x Remote Command Execution Vulnerability 2,076,446
CVE-2015-5311 PowerDNS Authoritative Server DNS TKey Unknown Record Denial-of-Service Vulnerability 1,856,060
CVE-2017-0144 Windows SMB Remote Code Execution Vulnerability (Shadow Brokers EternalBlue) 1,827,316
CVE-2003-0132 Apache HTTP Server Line Feed Memory Leak Denial-of-Service Vulnerability 1,508,481
CVE-2017-5638 Apache Struts 2 Remote Command Execution Vulnerability (S2-045/S2-046) 1,497,304
CVE-2014-6271 GNU Bash Environment Variables Remote Command Execution Vulnerability 836,630
According to data in the preceding table, old vulnerabilities found before 2010 were still frequently
exploited in the wild, indicating that a large number of out-of-date software applications and
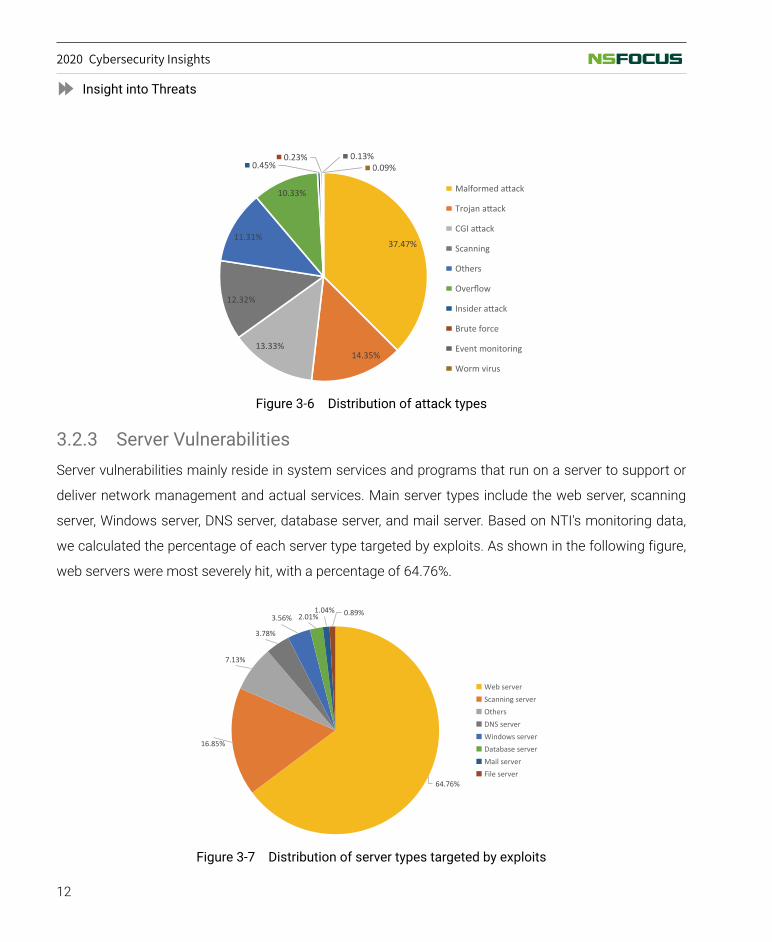
systems were left unpatched on the Internet. We classified exploits found in 2020 and named
malformed attacks, trojan attacks, and CGI attacks as the top 3 attack types, as shown in the
following figure.
12
2020 Cybersecurity Insights
Insight into Threats
37.47%
14.35%13.33%
12.32%
11.31%
10.33%
0.45%0.23% 0.13%
0.09%
Scanning
Others
Brute force
Event monitoring
Worm virus
Figure 3-6 Distribution of attack types
3.2.3 Server VulnerabilitiesServer vulnerabilities mainly reside in system services and programs that run on a server to support or
deliver network management and actual services. Main server types include the web server, scanning
server, Windows server, DNS server, database server, and mail server. Based on NTI's monitoring data,
we calculated the percentage of each server type targeted by exploits. As shown in the following figure,
web servers were most severely hit, with a percentage of 64.76%.
64.76%
16.85%
7.13%
3.78%
3.56% 2.01%1.04% 0.89%
Web serverScanning serverOthersDNS serverWindows serverDatabase serverMail serverFile server
Figure 3-7 Distribution of server types targeted by exploits

13
2020 Cybersecurity Insights
Insight into Threats
Our analysis goes further into specific services, which are ranked in terms of the total number of
exploits. As shown in the following figure, CGI is the No. 1 service targeted by the most exploits. CGI
vulnerabilities are mainly due to misconfigurations, improper input validation, and boundary condition
errors, allowing attackers to leak information, execute code, and perform other operations.
254916
340142
490185
558589
3002495
3003139
13168419
18357813
24858863
35274114
SQL
FTP
SMTP
SUNRPC
DNS
SSH
SAMBA
MISC
WWW
CGI
TOP10漏洞利用服务类型
Figure 3-8 Top 10 services targeted by exploits
3.2.4 Application VulnerabilitiesTypical application software types include the browser, Office suite, Flash player, PDF reader, and
mobile software. The following figure shows the percentage of each application type in exploits. In
actual attacks, browsers are a good point to start and so are favored by attackers, involved in 48.54% of
attacks in 2020, which is on a par with the figure in 2019.
Figure 3-9 Distribution of applications targeted by exploits

14
2020 Cybersecurity Insights
Insight into Threats
From 2018 to 2020, the percentage of Flash vulnerabilities targeted by exploits continuously decreased.
The root cause is that Flash-related exploits cannot be achieved independently by SWF files. For the
purpose of attacks, Flash must be embedded in browsers, Office software, or PDF files as a plug-
in. Besides, Adobe began to phase out the Flash plug-in, and major vendors have adopted measures
to block its use. Predictably, exploitation of Flash vulnerabilities will become something only in our
memory someday.
3.3 Malware
3.3.1 Impact of COVID-19 on CybersecurityThe outbreak of the COVID-19 pandemic in early 2020 imposed a tremendous impact on cybersecurity.
According to NSFOCUS's observation, "COVID-19 phishing" was a trending phrase in the cybersecurity
realm in the first half of 2020. Hacker groups and malware operators around the world all used
COVID-19 as a convenient decoy for malicious mail attacks by adding related information in email
messages, documents, or even attached images, in hopes of successfully compromising victims by
taking advantage of Internet users' sensitivity to such information amid the pandemic.
97.37%
1.52%
0.58%
0.53%
2.63%
Others COVID Corona Pandemic
Figure 3-10 Distribution of keywords related to COVID-19 in malicious emails
Of all decoy emails regarding COVID-19 detected by NSFOCUS, most were sent by active trojan
families with a global presence, such as Formhook, Emotet, SmokeLoader, NetWire, and Warzone. The

15
2020 Cybersecurity Insights
Insight into Threats
following figure shows an email intercepted by NSFOCUS in March 2020. It was a spearphishing email
sent by a malicious email botnet controller against Italian users. The email body is a COVID-19 update
from the World Health Organization (WHO) in Italian, and the attachment is a decoy newsletter, which
contains the Emotet trojan that will download and execute various malicious programs for privacy theft,
keylogging, remote controls, and cryptojacking once executed by the email receiver.
Figure 3-11 Emotet's spearphishing email leveraging COVID-19 in March 2020
3.3.2 Email Trojans3.3.2.1 Emotet banking trojan
We performed clustering analysis of some suspected malicious emails and identified major threat

16
2020 Cybersecurity Insights
Insight into Threats
types. According to our data, Emotet was still the most dangerous email trojan in the world in 2020. Of
all emails alerted, 13% were connected to the Emotet trojan.
MalUrl15%
Emotet13%
AgentTesla12%
Unknown10%
NoThreat8%
Lokibot7%
BetaBot7%
MalHtml6%
Shortmsg5%
RTM3%
Macro43%
Hawkeye2%
Gozi2%
MailUrl2%
Figure 3-12 Distribution of trojans responsible for malicious email activities in 2020 Q2
The Emotet family, first spotted in 2014, is a banking trojan mainly propagated via spam to infect
Windows hosts and compromise users' email accounts for theft of important personal financial
information.
Emotet underwent a major change in its operation model in 2020. Besides using COVID-19 information
to trap users, the Emotet team started cooperation with the QBot operator, as demonstrated in the crazy
delivery of the QBot program through its email network after August. By far, NSFOCUS has discovered
up to eight types of mainstream trojan programs that Emotet is bound with, including banking trojans,
spyware, ransomware, and DDoS trojans.
3.3.2.2 Agent Tesla banking trojan
Agent Tesla was the email trojan that grew fastest in the number of victims in 2020. According to the
analysis, this trojan appeared in over 12% of all emails alerted, overtaking Lokibot to become the second
largest email trojan.

17
2020 Cybersecurity Insights
Insight into Threats
As a typical spyware trojan, Agent Tesla of major versions can steal credentials stored in various
browsers, user information in FTP client applications, host keystroke records, and texts in Windows
programs. They can also regularly take desktop screenshots of the controlled hosts and then deliver
such screenshots to the attacker's email address. During the process, C&C communications are done
via the Simple Mail Transfer Protocol (SMTP).
In 2020, Agent Tesla demonstrated a higher level of diversity than previous years in terms of the kill
chain. For example, some samples attempted to have themselves downloaded by using documents
that contained such vulnerabilities as CVE-2017-11882 and CVE-2017-8570; some samples disguised
themselves as applications with a document icon, usually an AutoIt executable. All samples should go
through a multilevel drop procedure. The payload at each level uses garbage code, open-source code,
code obfuscation, antivirus, or other adversarial methods to improve the rate of survival.
3.3.2.3 Maze ransomware
The inundation of phishing emails with epidemic information as the decoy contributed a lot to the
spread of ransomware. An example of such ransomware is Maze, a new variant that has attracted
much attention for its extensive impact and high-profile marketing. The main difference between Maze
and previous mainstream ransomware families is that its developer tends to add new adversarial
methods in new versions and write defiant text messages for victims to read, as a response to security
professionals' analysis and disclosure. This deviates a lot from the common understanding that
ransomware usually lies in wait for the chance to attack.
The Maze creator maintains several websites, including newsmaze.net, mazedecrypt.top, and
corresponding dark web pages, and calls the ransomware "Maze support system" on these web pages,
claiming that it can "help detect security issues." On these websites, Maze updates victim information
and parts of stolen files in real time and threatens that it will release these files if the ransom fails to be
paid on time. Maze also declares that some other ransomware families, such as SunCrypt, REvil, and
LockBit, have joined to work under the new operations model.
The following figure shows a threat message displayed on Maze websites, indicating that a website has
been attacked and 5% of the stolen data has been published.

18
2020 Cybersecurity Insights
Insight into Threats
Figure 3-13 Victim information published on Maze websites
In early November, the Maze ransomware group announced on the dark web that "the project is closed".
Currently, it is unclear whether this announcement was some kind of smokescreen. A sure thing is that
the wicked operation model of combining extortion with data leaks, a typical model adopted by Maze,
will be copied by more ransomware families in future.
The following figure shows Maze's announcement made in November.

19
2020 Cybersecurity Insights
Insight into Threats
Figure 3-14 The Maze team's announcement
3.3.2.4 BitRAT
In the past few years, as TinyNuke, Gozi, and other remote access trojans (RATs) have their source code
disclosed on the Internet, hackers can develop new RATs at a greatly reduced cost. In 2020, Warzone,
BitRAT, and other malware families that use the hidden virtual network computing (hVNC) feature, the
core of TinyNuke, gained popularity on hacker forums, becoming new favorites of malicious email
attackers.
BitRAT first spotted in the third quarter typically represents the current trend of RAT creation. Usually,
BitRAT is delivered by, for example, executing scripts in a form, a not very complex method. Besides,
such delivery involves only a few levels and the RAT will execute immediately upon delivery.
BitRAT is a multi-purpose trojan that supports remote desktop, video recording, audio recording, agent
communication, keylogging, cryptojacking, process and file control, and credential theft. However, it
was a rough product pieced together, with core code borrowed from open-source projects, including
its hVNC feature derived from TinyNuke, audio recording from WAVE, as well as video recording
implemented via the OpenCV API.

20
2020 Cybersecurity Insights
Insight into Threats
In the future, BitRAT may make its kill chain more complicated by reference to the Warzone trojan and
enter into a phase of fast expansion. These general-purpose RATs, represented by Warzone and BitRAT,
will engage in price wars because of delivering similar functions in a foreseeable future when malicious
emails carrying the trojans will also experience a fast growth.
3.3.3 IoT Botnet Families3.3.3.1 Mirai/Gafgyt
Because of their particularity in the use of network resources, IoT devices are always a magnet that
attracts various DDoS trojans. Over time, Mirai and Gafgyt, two major DDoS trojan families, have
grabbed the lion's share of compromised IoT devices. The two families, by virtue of their open-source
code, ease of use, high scalability, and cross-platform capabilities, have been popular among hackers,
especially young ones.
According to NSFOCUS's statistics, the activity of Mirai varied greatly from month to month in 2020. In
the third quarter when the botnet was the most active, 5987 nodes were added to the botnet on average
each month. In contrast, the Gafgyt botnet was relatively stable, with 2186 nodes added on average
each month.
Figure 3-15 Monthly increase in active nodes of Mirai

21
2020 Cybersecurity Insights
Insight into Threats
Figure 3-16 Monthly increase in active nodes of Gafgyt
Because of their easy access, Mirai and Gafgyt have built up huge user bases, which in turn, stimulates
hackers to work relentlessly on development of more variants. Inspired by the new Mirai variant Echobot
that emerged at the end of 2019, many new variants in 2020 chose to carry exploit payloads. We find
that, as far as Mirai is concerned, the variant craziest about exploits in 2020 was fetch, which carried
up to 56 different exploit payloads targeting vulnerabilities in a wide range of IoT devices from different
vendors. Other variants, such as dark (29), Toaster (21), and Loligang (19), also made aggressive
attempts to exploit new vulnerabilities for lateral movement. Some Mirai/Gafgyt variants even carried
suspected 0-day vulnerabilities, showing some IoT botnet operators' capabilities of discovering
vulnerabilities.
The following figure shows exploit payloads of the fetch trojan.

22
2020 Cybersecurity Insights
Insight into Threats
Figure 3-17 Exploit payloads of fetch
3.3.3.2 Mozi
Mozi, as a new botnet trojan first appearing at the end of 2019, grew rapidly in the first two quarters of
2020.
It has been years since the inception of IoT botnets. Today, their controllers are no longer contented
with the traditional TCP-based model, but turn their eyes to other network models of high anonymity. As
an example of IoT botnets' extension to peer-to-peer (P2P), Mozi uses the distributed hash table (DHT)
for network construction, creating a Mozi-DHT botnet within the DHT network. Since its first appearance
in 2019, Mozi has been continuously expanding its scale. Our ongoing monitoring finds that the daily
number of nodes that Mozi tried to recruit has exceeded 10,000 on average since the first quarter of
2020, accounting for over 1% of the entire DHT network. This indicates that Mozi has evolved into a
botnet of the medium size, capable of launching nasty attacks against worldwide targets.
From the code composition, Mozi, obviously, is not a product of independent development. Its
persistence module and attack module reuse parts of the code of Gafgyt trojans and variants, delivering
such functions as renaming instances, monitoring watchdogs, and adding iptables rules, and supporting
launch of common DDoS attacks, including UDP, TCP, and HTTP flood attacks.

23
2020 Cybersecurity Insights
Insight into Threats
For propagation, Mozi also uses common methods. It leverages vulnerabilities and weak Telnet
password cracking to attack random or specified IP addresses. Its common exploit payloads are
effective for compromise of IoT devices of certain models from Netgear, Realtek, D-Link, Huawei, GPON,
Vacron, and Zyxel.
The following figure shows the process of a Mozi node from joining the DHT network to executing the
attacker's instruction.
Figure 3-18 Mozi-DHT network communication model
We find that the Mozi botnet is mostly active in East Asia, Europe, and North America. It also has some
nodes distributed in Australia and Brazil. China hosts 25.3% of Mozi nodes, becoming the largest source
of the Mozi botnet. The USA and South Korea come in second and third, with 10.3% and 7.9% of nodes
respectively. In Europe, Mozi nodes are mostly found in Russia, Germany, France, and Poland.
Based on the P2P model, Mozi will be more difficult to detect and address than traditional botnets. As
Mozi employs a propagation mode common to IoT botnets, someday it will probably scale up to the
same size as notorious botnets like Mirai and Gafgyt.

24
2020 Cybersecurity Insights
Insight into Threats
3.4 Malicious Traffic
3.4.1 Web Threats3.4.1.1 Web Attack Trend
Of all web attacks detected in 2020, 90% used regular attack methods, including HTTP access control,
server information disclosure, resource leech, cookie poisoning, and SQL injection. HTTP access control
events were ranked first in number, calling for special attention.
Figure 3-19 Percentages of web attack types in 2020
A breakdown of web attacks finds that web server/middleware exploits accounted for 66% of all web
attacks, much higher than web framework exploits (34%). Unlike web frameworks, large servers/
middleware systems boast huge user bases, with a great number of deployments, therefore becoming
a magnet to hackers, who keep eyes on any vulnerabilities disclosed.

25
2020 Cybersecurity Insights
Insight into Threats
Figure 3-20 Distribution of web attacks by type in 2020
As for exploits against web servers/middleware, most targeted Apache Tomcat, Microsoft IIS, Nginx,
and Lighttpd, all of which are mainstream products receiving over 75% of attacks. As for how to
implement attacks, hackers still vote for conventional means. They may exploit vulnerabilities to obtain
information from servers, such as source code, host information, and website configuration files.
They may exploit servers' flaws in parsing URLs and file names to upload malicious web shell files to
servers for execution via the file upload API. They may even exploit servers' weaknesses to directly run
executables outside of the web directory.
Tomcat32%
IIS28%
Nginx13%
3%
Others24%
Figure 3-21 Distribution of targeted web servers/middleware

26
2020 Cybersecurity Insights
Insight into Threats
Among attacks targeting web servers/middleware in 2020, most exploited "antique" vulnerabilities,
which have existed for so long that many mature methods and automatic tools are available on the
Internet. Once discovering servers of a legacy version, hackers can quickly exploit such vulnerabilities
for malicious purposes.
The following table lists top 5 CVE vulnerabilities exploited against web servers/middleware in 2020.
Table 3-2 Top 5 CVE vulnerabilities exploited against web servers/middleware
Vulnerability ID Vulnerability Description Product
CVE-2008-5519If a malicious client submits a malicious request with an empty Content-Length header to the mod_jk module of the Apache Tomcat server, or submits the same request repeatedly in a short time, the attacker can view responses to other user requests.
Apache Tomcat
CVE-2000-0884 IIS 4.0 and 5.0 are prone to a vulnerability in Unicode decoding, allowing users to execute arbitrary commands. Microsoft IIS
CVE-1999-0253 IIS is prone to a vulnerability in ASP file name extension parsing, allowing direct display of file contents by adding special characters in an extension. Microsoft IIS
CVE-2000-0886Microsoft IIS 4.0 and 5.0, when handling the CGI application (.exe, .pl, .php, and so on), do not perform a proper security check of CGI file names requested by users. This may cause IIS to mistakenly open or run a file if a special character is contained in the file name.
Microsoft IIS
CVE-2020-1899The script handling code in IIS contains a stack overflow vulnerability in handling of repeated parameter requests. By sending a crafted URI request to the ASP page of the website carried by IIS, a remote attacker could exploit this vulnerability to crash the service.
Microsoft IIS
Compared with 2019, web framework exploits targeting Apache Struts2 soared in 2020, as shown in the
following figure. Being historically vulnerable, this framework was ranked first in terms of exploits for
four consecutive years.
Figure 3-22 Web frameworks mostly targeted in 2020
27
2020 Cybersecurity Insights
Insight into Threats
3.4.1.2 Web Exploits
In 2020, a number of unauthorized remote code execution vulnerabilities were disclosed, including
some in widely used web servers and frameworks, such as WebLogic, Tomcat, and Dubbo. Hackers
are especially interested in such vulnerabilities and usually develop related exploits immediately after
they are disclosed. By using these tools to automatically scan for and exploit vulnerabilities, hackers
can identify vulnerable hosts on the Internet, thus putting all related vulnerable websites at risk of
compromise. Administrators should be duly attentive to website vulnerabilities and act promptly to
update and remediate the affected systems after receiving related alerts.
3.4.2 DDoS Threats3.4.2.1 DDoS Attack Counts and Peak Sizes
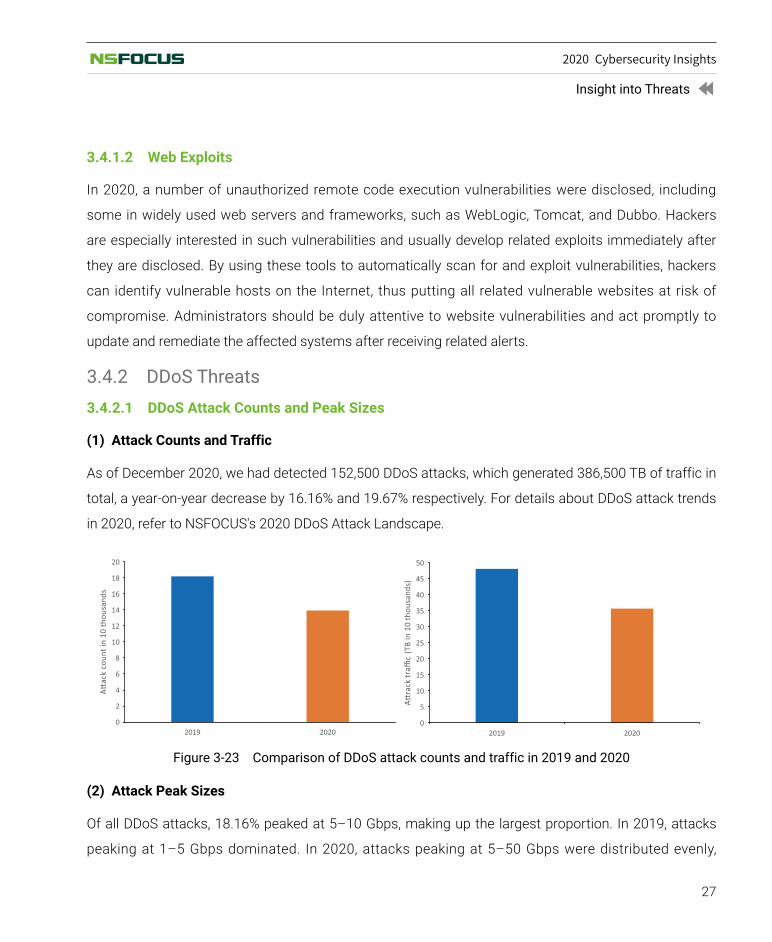
(1)ᅠAttack Counts and Traffic
As of December 2020, we had detected 152,500 DDoS attacks, which generated 386,500 TB of traffic in
total, a year-on-year decrease by 16.16% and 19.67% respectively. For details about DDoS attack trends
in 2020, refer to NSFOCUS's 2020 DDoS Attack Landscape.
Figure 3-23 Comparison of DDoS attack counts and traffic in 2019 and 2020
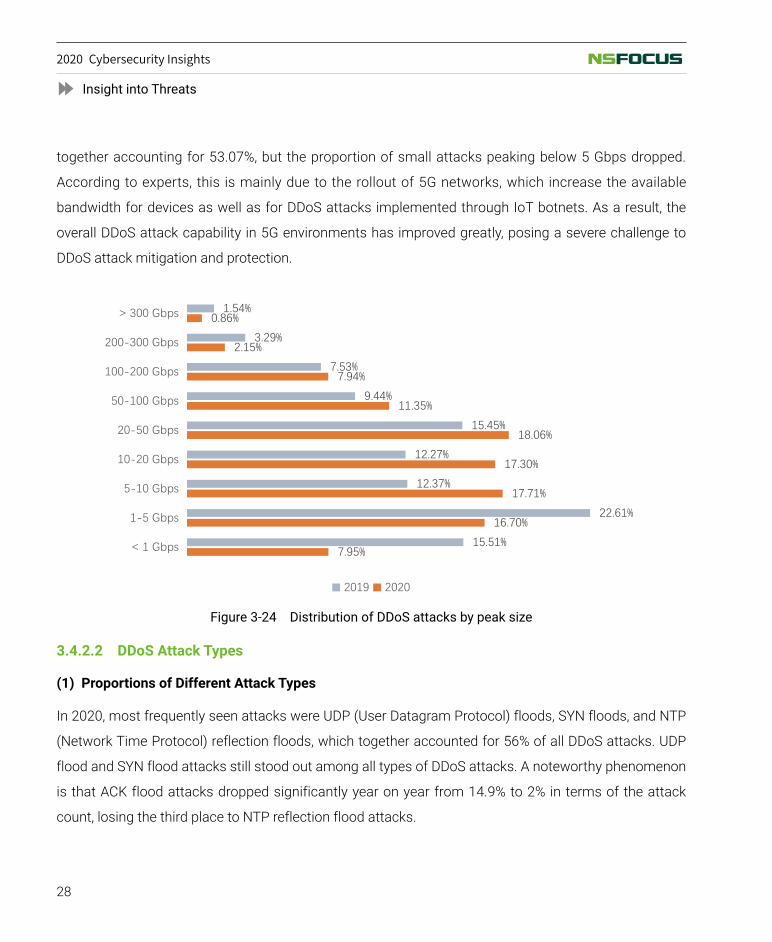
(2)ᅠAttack Peak Sizes
Of all DDoS attacks, 18.16% peaked at 5–10 Gbps, making up the largest proportion. In 2019, attacks
peaking at 1–5 Gbps dominated. In 2020, attacks peaking at 5–50 Gbps were distributed evenly,
28
2020 Cybersecurity Insights
Insight into Threats
together accounting for 53.07%, but the proportion of small attacks peaking below 5 Gbps dropped.
According to experts, this is mainly due to the rollout of 5G networks, which increase the available
bandwidth for devices as well as for DDoS attacks implemented through IoT botnets. As a result, the
overall DDoS attack capability in 5G environments has improved greatly, posing a severe challenge to
DDoS attack mitigation and protection.
Figure 3-24 Distribution of DDoS attacks by peak size
3.4.2.2 DDoS Attack Types
(1)ᅠProportions of Different Attack Types
In 2020, most frequently seen attacks were UDP (User Datagram Protocol) floods, SYN floods, and NTP
(Network Time Protocol) reflection floods, which together accounted for 56% of all DDoS attacks. UDP
flood and SYN flood attacks still stood out among all types of DDoS attacks. A noteworthy phenomenon
is that ACK flood attacks dropped significantly year on year from 14.9% to 2% in terms of the attack
count, losing the third place to NTP reflection flood attacks.

29
2020 Cybersecurity Insights
Insight into Threats
Figure 3-25 Proportions of different attack types by count and traffic
(2)ᅠMulti-Vector Attack
Compared with 2019, 2020 saw more multi-vector DDoS attacks. In actual attacks, hackers tend to employ
multiple vectors simultaneously and exploit flaws in protocols and systems to achieve the best effect.
Figure 3-26 Distribution of multi-vector attacks

30
2020 Cybersecurity Insights
Insight into Threats
(3)ᅠReflection Attacks
In 2020, reflection attacks made up 34% of all DDoS attacks. Compared with 2019, the number of
reflection attacks increased significantly in 2020, and so did their proportion. In this year, NTP reflection,
DNS (Domain Name System) reflection, and SSDP (Simple Service Discovery Protocol) reflection
attacks stood out among all reflection attacks. To be more specific, NTP reflection attacks made up the
largest proportion in both the number (80%) and traffic volume (53%).
Figure 3-27 Proportions of various reflection attacks by count and traffic volume
3.4.2.3 DDoS Attack Time Profiling
(1)ᅠAttack Distribution by Duration
In 2020, the average duration of DDoS attacks was registered at 42 minutes, a 21% decrease from 2019.
We noticed that the longest DDoS attack in 2020 lasted around 13 days, far shorter than the longest
attacks detected in previous years.
In 2020, DDoS attacks lasting less than 30 minutes accounted for 80%, 5 percentage points higher
than the previous year (75%). The high proportion of short attacks signals that attackers are
attaching more and more importance to the attack cost and efficiency and are more inclined to
overwhelm the target service with floods of traffic in a short time, getting users offline and causing
high latency and jitters.

31
2020 Cybersecurity Insights
Insight into Threats
Figure 3-28 Proportions of attacks by duration
(2)ᅠTemporal Distribution of Attack Activities Within One Day
In one day from 0:00 to 24:00, busy hours (10:00–22:00) of services were the peak period of DDoS
attacks, when 73.4% of attacks were spotted. The coincidence of busy hours of online service access
with the peak period of DDoS attacks indicates that attackers intended to maximize their attack effect
and impact.
Figure 3-29 Temporal distribution of DDoS attacks within one day in 2019 and 2020

32
2020 Cybersecurity Insights
Insight into Threats
3.4.2.4 Geographical Distribution of DDoS Attacks
(1)ᅠControlled DDoS Attack Sources
According to statistics, China was still home to the largest number of controlled DDoS attack sources
(59.7%) in 2020, followed by the USA (7.8%) and Russia (3.4%).
Figure 3-30 Global distribution of attack source IP addresses
33
2020 Cybersecurity Insights
Insight into Threats
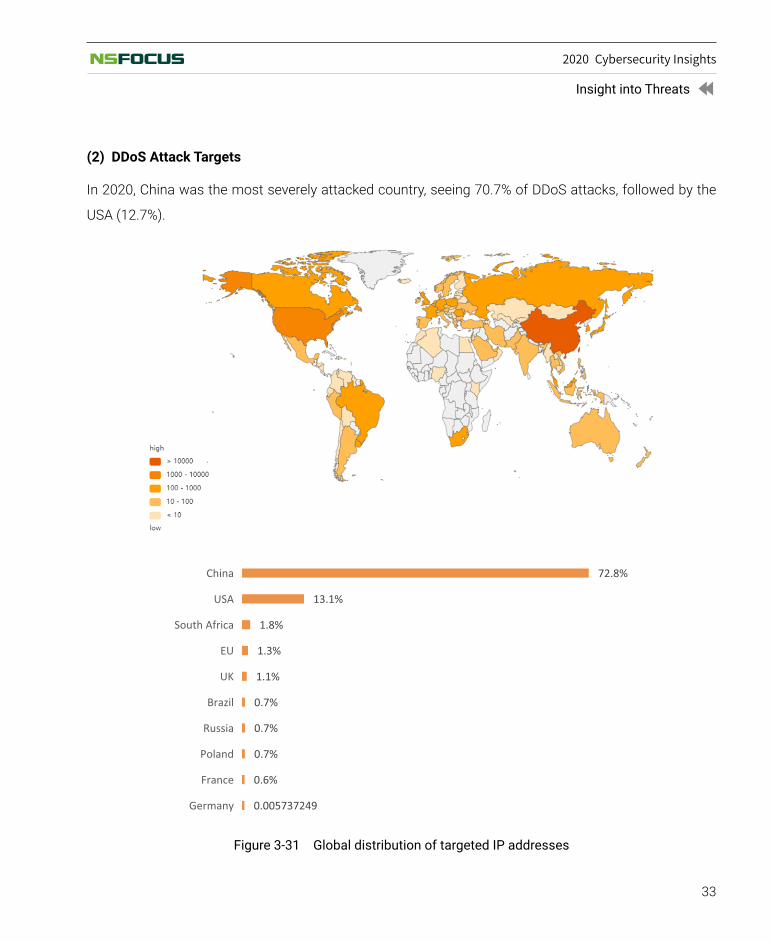
(2)ᅠDDoS Attack Targets
In 2020, China was the most severely attacked country, seeing 70.7% of DDoS attacks, followed by the
USA (12.7%).
Figure 3-31 Global distribution of targeted IP addresses

34
2020 Cybersecurity Insights
Insight into Threats
3.4.3 Cryptojacking3.4.3.1 Internal Cryptojacking
We counted the number of cryptojacking events and hosts within enterprises in 2020 based on data of
various alerts collected by NSFOCUS.
The cryptomining market pattern has undergone some changes since Bitcoin halved in May 2020 for
the third time. A Bitcoin halving event means that the reward for mining Bitcoin transactions is cut in
half. Overall, cryptojacking within enterprises trended down in 2020, with both the number of events
and the number of hosts declining, indicating that enterprises pay more and more attention to internal
cryptojacking and take corresponding protective measures.
Figure 3-32 Trend of cryptojacking activities within enterprises in 2020

35
2020 Cybersecurity Insights
Insight into Threats
Figure 3-33 Distribution of cryptomining behaviors
As shown in the preceding figure, 54% of cryptojacking activities were conducted by the WannaMine
worm for communication with DNS servers. WannaMine evolved to WannaMine 4.0 in 2019, having
some new antivirus evasion techniques and being able to rapidly spread laterally within the local area
network (LAN). For this reason, this new variant merits our attention.
33%
30%
10%
6% 5%
2%1% 1% 1% 1%
0%
5%
10%
15%
20%
25%
30%
35%
3333 13531 14444 5555 8080 7777 5559 1166 1188 8888
Figure 3-34 Common ports used in cryptojacking activities

36
2020 Cybersecurity Insights
Insight into Threats
Besides ports 53, 80, and 443, attackers tend to use less common ports to connect to the mining pool.
As shown in the preceding figure, port 3333 is the most favored port of cryptojackers, followed by
ports 13531 and 14444. As specific ports and mining pool addresses are signatures of cryptojacking
activities, enterprises can prevent this kind of activities by blocking these ports.
3.4.3.2 Cryptojacking Botnets
According to statistics about monthly active bots, we can learn how active a cryptojacking botnet was
in 2020. As shown in the following figure, this botnet became increasingly active in 2020, especially in
October when 17,684 bots were spotted.
Figure 3-35 Activity of a cryptojacking botnet in 2020
We conducted a geographical analysis of cryptojacking bots before identifying top 10 countries with the
most bots. As shown in the following figure, China was ranked first, with 16,394 cryptojacking bots that
accounted for 38% of the world's total.

37
2020 Cybersecurity Insights
Insight into Threats
Figure 3-36 Top 10 countries with the most cryptojacking bots

38
2020 Cybersecurity Insights
Biggest Trends in 2020
4 Biggest Trends in 2020
Biggest Trends in 2020
4

39
2020 Cybersecurity Insights
Biggest Trends in 2020
4.1 Advanced Persistent ThreatsFor years, NSFOCUS has been continuing to track and analyze advanced persistent threats (APTs),
including attack activities and their tactical and technical features as well as attacker groups behind
these activities.
4.1.1 Activity Tracking4.1.1.1 Impact of APT Groups
Through ongoing monitoring, NSFOCUS discovered 21 APT groups in 2020 suspected to engage in APT
activities. The following figure shows top 10 active APT groups in terms of the number of compromised
hosts.
Figure 4-1 Top 10 active APT groups in 2020 in terms of the number of compromised hosts
4.1.1.2 Activity Duration
According to related data on hand, most APT groups in 2020 were active for only a short period, as
shown in the following figure.

40
2020 Cybersecurity Insights
Biggest Trends in 2020
Figure 4-2 Distribution of APT activities by duration
4.1.1.3 Targeted Sectors
From the perspective of targeted sectors, websites and hosts of government and education sectors
were the major targets of APT attacks, as shown in the following figure.
Figure 4-3 Major targeted sectors of APT attacks

41
2020 Cybersecurity Insights
Biggest Trends in 2020
4.1.1.4 Technical Methods
As for attack methods, APT groups mainly used watering holes and web exploits, as shown in the
following figure.
Figure 4-4 Major attack methods of APT groups
4.1.2 Intelligence About APT GroupsFrom February 17 to November 13, 2020, we collected 98 threat intelligence analysis reports
regarding 60 APT groups. The following figure ranks major APT groups in terms of the number of
exposures.

42
2020 Cybersecurity Insights
Biggest Trends in 2020
Figure 4-5 Ranking of APT groups by the number of exposures
Of all these groups listed in the preceding figure, Lazarus and Kimsuky, the two North Korean APT
groups, took top 2 spots with 6 and 5 times of exposure respectively. Other APT groups making it into
top 5 are APT-C-35, APT32, and Dropping Elephant, all located in Southeast Asia.
In April 2020, Lazarus used COVID-19 as a lure to deliver phishing emails and had malicious macro-

43
2020 Cybersecurity Insights
Biggest Trends in 2020
embedded documents obtained from remote servers executed by means of template injection, thus
bypassing antivirus detection. In the following month, researchers found that the TinkaOTP application
looked like the Dacls trojan developed by the Lazarus group, indicating the group's extension of targeted
platforms from Windows and Linux to MacOS. In September and November, the Lazarus group's Crat
trojan was found to rapidly evolve from V1 to V2, adding new functions such as malware download,
obfuscation of strings, API names, and C&C links, and identification of security check processes,
network adapters, and detection tools to evade security checks.
Kimsuky is trying to enhance antivirus evasion techniques. In an October campaign against the
forthcoming 2020 American presidential election, Kimsuky attempted to bypass antivirus detection by
embedding VBS scripts into HWP documents. In November, the backdoor component dropped in an
attack that leveraged the WSF script component installed itself as a Windows Defender update.
After analyzing changes in tactics, techniques, and procedures (TTPs) employed by the 60 APT groups,
we have the following findings:
1. APT groups showed an inclination to launch campaigns by leveraging trending events,
especially the COVID-19 pandemic.
Most such attacks used COVID-19 information as the decoy. Typical examples of such groups
in 2020 include Dropping Elephant (India), APT32 (Vietnam), Operation C-Major (Pakistan),
TA505, Sidewinder (India), Lazarus Group (North Korea), and Wizard Spider (Russia).
2. Command and control (C&C) communication means and channels are difficult to detect. Such
groups include Death Stalker, APT-C-35, APT41, and Turla Group.
- Death Stalker leverages a variety of public services, such as Google+, Imgur, Reddit,
ShockChan, Tumblr, Twitter, YouTube, and WordPress, as the storage media and inserts
strings in posts, comments, and user profiles before reassembling these strings into C&C
addresses.
- APT-C-35 abuses Google Firestarter messages for delivery of their payloads. Even if
hardcoded C&C servers are shut down, the group can proceed with C&C communication by

44
2020 Cybersecurity Insights
Biggest Trends in 2020
this means.
- APT41 uses iodine to establish DNS tunnels.
- Turla Group uses HTTP/HTTPS status codes for C&C communication.
3. Lateral movement and data exfiltration methods are varying, as is true, for example, of
UNC1945, APT34, and Gamaredon Group.
- UNC1945 attempts to move laterally by loading and executing virtual machines.
- APT34 leverages DNS over HTTPS (DoH) for lateral movement and data exfiltration.
- Gamaredon Group injects malicious macros or remote templates into documents already
present on the compromised system for lateral movement.
4. Attacks are extended to or even mainly target mobile devices. Groups acting like this include
Lazarus, APT-C-44, Arid Viper, Confucius, PhantomLance, Roaming Mantis, and APT-C-35.
- The Dacls trojan of the Lazarus group has evolved to target MacOS.
- Arid Viper disguises as chat software to trick victims into downloading it. It may also forge
Android app markets and official websites for delivery of malicious applications.
- PhantomLance available on Google Play does not contain any malicious payload initially
until the release of subsequent updates.
5. Attack detection evasion techniques keep iterating and evolving, as is the case with Lazarus,
SideWinder, SWEED, PROMETHIUM, Hellsing, Roaming Mantis, Dropping Elephant, APT-C-35,
APT-C-36, APT37, and The Gorgon Group.
- The Gorgon Group saves malicious samples on Pastebin, a code hosting platform, to evade
detection.
- Roaming Mantis looks for the strings "Emulator" and "x86" and checks for the device
ID, phone number, and International Mobile Station Equipment Identity (IMEI) to evade
sandbox detection.
45
2020 Cybersecurity Insights
Biggest Trends in 2020
- SWEED's Guloader has the capabilities of sandbox escape, code obfuscation, anti-
debugging, C&C/URL encryption, and payload encryption.
- Lazarus's CratV2 trojan detects security software by querying process names and network
adapter names.
- Hellsing uses legitimate application signatures, such as wsc_proxy.exe (Avast remediation
service), qcconsol.exe, and mcvsshld.exe (McAfee component), and legitimate Microsoft
and Google utilities to evade detection.
6. Groups pursuing economic benefits are undergoing industrial transformation. Examples of
such groups are TA2101, TA505, FIN6, and Evilnum. To be specific, FIN6 and Evilnum both have
purchased some toolkits from the malware as a service (MaaS) provider Golden Chickens.
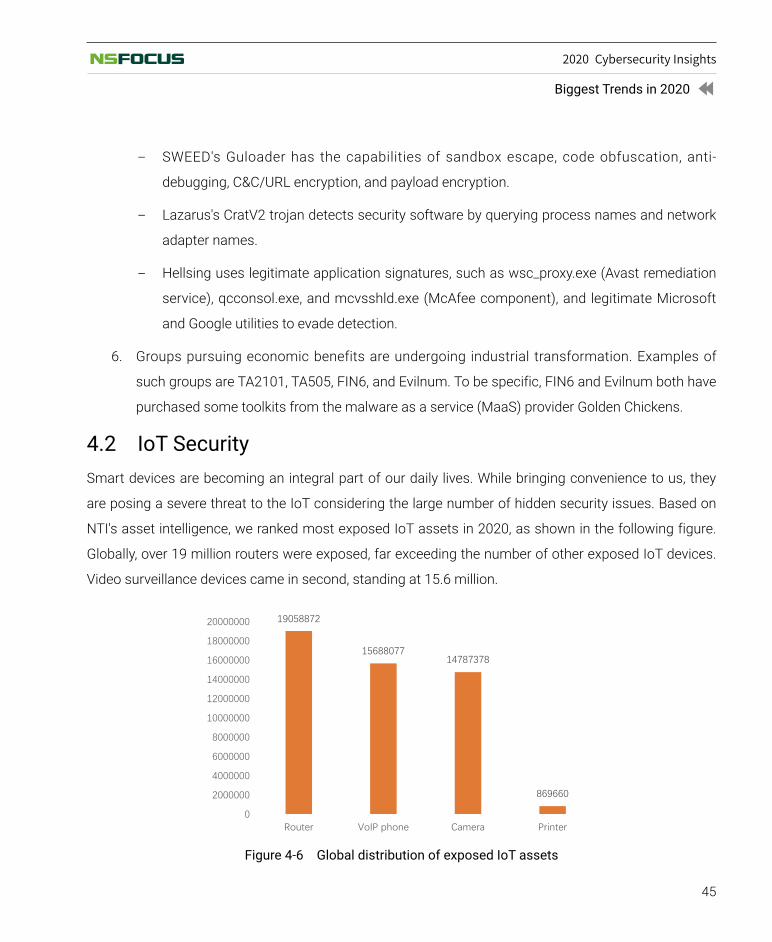
4.2 IoT SecuritySmart devices are becoming an integral part of our daily lives. While bringing convenience to us, they
are posing a severe threat to the IoT considering the large number of hidden security issues. Based on
NTI's asset intelligence, we ranked most exposed IoT assets in 2020, as shown in the following figure.
Globally, over 19 million routers were exposed, far exceeding the number of other exposed IoT devices.
Video surveillance devices came in second, standing at 15.6 million.
Figure 4-6 Global distribution of exposed IoT assets
46
2020 Cybersecurity Insights
Biggest Trends in 2020
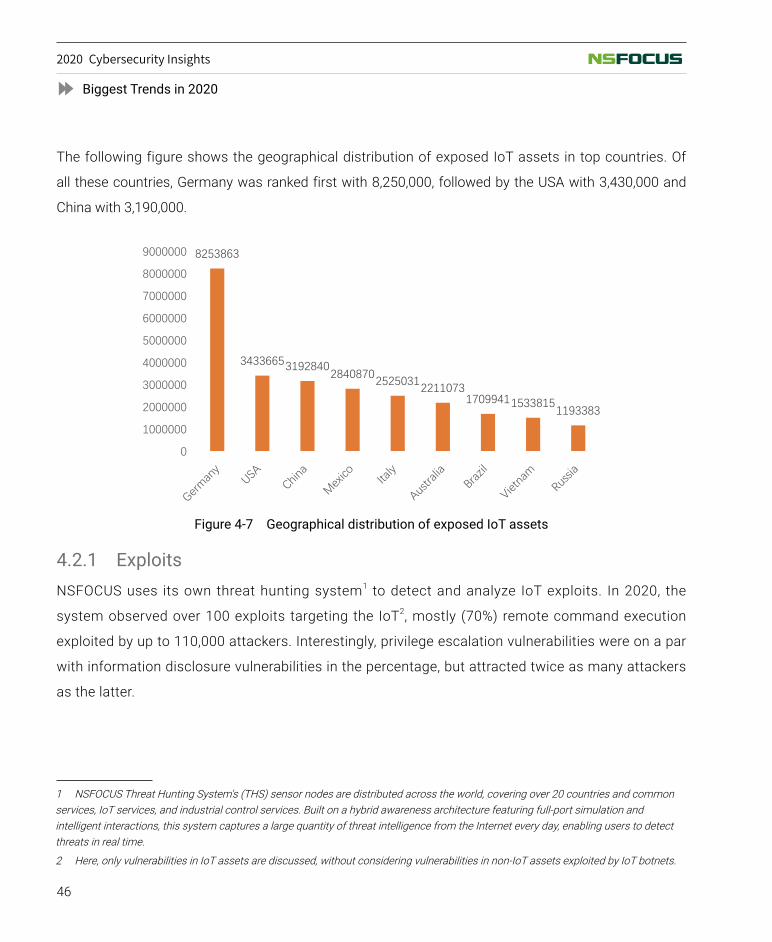
The following figure shows the geographical distribution of exposed IoT assets in top countries. Of
all these countries, Germany was ranked first with 8,250,000, followed by the USA with 3,430,000 and
China with 3,190,000.
Figure 4-7 Geographical distribution of exposed IoT assets
4.2.1 ExploitsNSFOCUS uses its own threat hunting system1 to detect and analyze IoT exploits. In 2020, the
system observed over 100 exploits targeting the IoT2, mostly (70%) remote command execution
exploited by up to 110,000 attackers. Interestingly, privilege escalation vulnerabilities were on a par
with information disclosure vulnerabilities in the percentage, but attracted twice as many attackers
as the latter.
1 NSFOCUS Threat Hunting System's (THS) sensor nodes are distributed across the world, covering over 20 countries and common services, IoT services, and industrial control services. Built on a hybrid awareness architecture featuring full-port simulation and intelligent interactions, this system captures a large quantity of threat intelligence from the Internet every day, enabling users to detect threats in real time.
2 Here, only vulnerabilities in IoT assets are discussed, without considering vulnerabilities in non-IoT assets exploited by IoT botnets.

47
2020 Cybersecurity Insights
Biggest Trends in 2020
Figure 4-8 Distribution of IoT vulnerabilities by type
The following figure shows device types that exploits of these IoT vulnerabilities mainly targeted.
Obviously, routers and cameras were often targeted, together accounting for 90%. Besides, network
storage devices and VoIP phones began to attract attention from attackers.
Figure 4-9 Distribution of IoT devices targeted by IoT exploits

48
2020 Cybersecurity Insights
Biggest Trends in 2020
4.2.2 Reflection AttacksAccording to NTI's survey data and THS's threat data, more and more protocols exploitable for UDP
reflection attacks come into view, including the Constrained Application Protocol (CoAP), Ubiquiti, WS-
Discovery, OpenVPN, DHDiscover, and Advanced Disconnection Detection Protocol (ADDP). Different
from well-known DNS, SSDP, NTP, and Memcached reflection attacks, these attacks target the IoT,
posing challenges to DDoS protection. As shown in the following figure, WS-Discovery, OpenVPN,
and CoAP were each found on over 700,000 devices. Following them was DHDiscover, found on over
300,000 devices.
Figure 4-10 Global exposure of IoT services
4.3 Industrial Internet SecurityThe industrial Internet is an emerging industry of large scale, having various players on the long chain.
Security is crucial to the sound development of the industrial Internet. The following sections analyze
industrial Internet security respectively from the exposure of industrial control system (ICS) assets, ICS
vulnerabilities and attacks, and major ICS security incidents in 2020.
4.3.1 Exposure of ICS AssetsTo minimize the chance of ICS devices being hit by cyberattacks, ICSs should run in a physically isolated
environment. However, this is rarely implemented in actual production environments. The following
figures show the distribution of global ICS assets detected by NTI based on common protocols.

49
2020 Cybersecurity Insights
Biggest Trends in 2020
Figure 4-11 Top 10 countries by the number of ICS devices using Modbus
As shown in the preceding figure, the USA is home to the most ICS assets using Modbus, followed by
China and Germany, both with over 5000 assets. Evidently, the number of ICS devices exposed is in
direct proportion to the industrial automation level of a country.
Figure 4-12 Top 10 countries by the number of ICS devices using the S7 protocol

50
2020 Cybersecurity Insights
Biggest Trends in 2020
Figure 4-13 Top 10 countries by the number of ICS devices using CODESYS
Figure 4-14 Top 10 countries by the number of ICS devices using ENIP

51
2020 Cybersecurity Insights
Biggest Trends in 2020
ENIP Modbus S7 codesysNumber of devices 88605 88321 44272 8684
0
10000
20000
30000
40000
50000
60000
70000
80000
90000
100000
Figure 4-15 Ranking of common protocols used by ICS assets
Of these common ICS protocols, ENIP was ranked first because of being used by the largest number of
exposed ICS assets, and Modbus came in second.
For attackers, all these ICS devices exposed on the Internet have the potential to become stepping
stones for their penetration into industrial control networks. Some vulnerable ICS devices, if unpatched
in time, are very likely to be targeted by attackers once that vulnerability is disclosed.
4.3.2 ICS Vulnerabilities and AttacksAccording to information available on the Internet, more ICS security events happened in 2020 than
in 2019. The public concern about ICS events was at a level a bit lower than the annual average at the
beginning of the year, and then steadily rose over time until the end of the year, a trend coinciding with
those in previous years. Among all ICS events in 2020, the proportion of events other than exploits
and attacks increased, including but not limited to policy interpretation, expert analysis, and general
introduction to ICSs. This, to some extent, reflects people's increasing concern about ICSs and interest
in knowing more about this field.

52
2020 Cybersecurity Insights
Biggest Trends in 2020
Figure 4-16 Industries involved in ICS events
A marked phenomenon in 2020 is that, ICS events, especially security-related events, mostly involved
the mixed industry. Besides, the proportion of attacks targeting smart manufacturing was on the rise,
making the industry the biggest target of ICS attacks.
4.3.3 Major EventsIn 2020, the major threat to ICS environments and operations was from ransomware. Owing to the
nature of ICSs, perpetrators are not particular about vulnerabilities when conducting ransomware
attacks. It is enough to cause the system to crash, which will impose a great impact on the overall
operations of ICSs. Victims are often taken unawares, not knowing what to do when hit by a
ransomware attack. This makes ransomware attacks an especially serious threat. In February 2020,
NTI observed that the US Cybersecurity and Infrastructure Security Agency (CISA) released a report,
saying that an unidentified natural gas operator had its gas compression facility shut down for two
days because of a ransomware attack. Two months later, EDP, a Portuguese energy company, suffered
a ransomware attack and was demanded to pay 1580 BTC (approximately USD 10,900,000 or EUR
9,900,000) as ransom.

53
2020 Cybersecurity Insights
Biggest Trends in 2020
With the accelerated development of the IoT, more and more ICS assets are exposed on the Internet,
making it easier for attackers to compromise the targeted systems for subsequent attacks. According
to rough statistics, nearly 60% of ICS attacks start with compromise of assets exposed on the Internet,
followed by attackers penetrating the targeted network before moving laterally within the intranet
and directly targeting ICS devices by obtaining routing configurations. Data from NTI shows that,
in April 2020, supervisory control and data acquisition (SCADA) systems of waste water treatment,
pump stations, and sewage treatment facilities in Israel were repeatedly hacked. These attacks were
successfully implemented because of programmable logic controllers (PLCs) exposed on the Internet.
After compromising these PLCs, hackers took direct control of water facilities and caused a devastating
impact.
At the same time, hackers began to turn their eyes to supply chain attacks so as to escalate the impact
and efficiency of attacks. Once an upstream component comes with a hidden hazard, a large number
of downstream products using this component are all potentially vulnerable. A typical example of this
is Ripple20 disclosed in 2020. Ripple20 is a collective name of vulnerabilities found in the Treck TCP/IP
protocol stack. These vulnerabilities are common in embedded devices from different vendors, including
HP, Schneider Electric, Intel, Rockwell Automation, Caterpillar, and Baxter. Successful exploitation of
these vulnerabilities may allow remote code execution or disclosure of sensitive information. Medical,
aviation, transportation, home appliance, enterprise, energy (oil/gas), telecom, and retail sectors are
affected by Ripple20. By leveraging the trust formed between vendors and ICS operators, hackers can
directly break into the targeted system through an external network via social engineering like phishing.
Some APT groups are especially interested in this type of attacks. After compromising a system, they
usually lie low, collecting information stealthily, and will jump at the chance of attack when the occasion
arises to achieve their malignant purposes.
Besides malicious attacks and demands for ransom, attackers may conduct espionage, such as
intellectual property theft. When conducting these activities, hackers are often economically motivated.
But sometimes, they may be sponsored by governments, stealing design drawings or core algorithms
for political purposes.

54
2020 Cybersecurity Insights
Biggest Trends in 2020
4.4 5G Security5G networks employ new technologies, such as network functions virtualization (NFV), network slicing,
edge computing, and network exposure function, which will definitely bring new security threats and
risks, posing challenges to security protection and operations1.
4.4.1 SDN ControllerA software-defined networking (SDN) controller, as the brain of the transport network and core network
for scheduling, contains many security vulnerabilities. After compromising an SDN controller, an
attacker can send instructions to all network facilities, thus easily paralyzing the whole network. Therefore, it
is essential to design a secure and reliable SDN controller for mobile communication networks2.
Table 4-1 SDN's security risks and countermeasures
Asset Risk CountermeasureApplication plane (1) Impersonation. For example, an attacker may
impersonate an SDN controller to obtain sensitive data of applications.(2) Applications are not securely isolated from each other. Disclosure of information from one application may lead to the same attack on other applications.(3) Applications themselves are vulnerable.
Authenticate the SDN controller and applications and harden applications.
Control plane (1) The SDN controller is vulnerable to application-plane and forwarding-plane attacks, such as DDoS caused by large quantities of access requests or data exchanges between applications and forwarding devices and malicious applications' bypass of security policies by leveraging flow table conflicts.(2) As a centralized control point, the SDN controller is prone to penetration attacks.
Authenticate the SDN controller and forwarding devices, mitigate DDoS attacks by using rate limiting and other mechanisms, prioritize flow table entries to prevent policy conflicts, encrypt sensitive data, and harden the controller software and the server that hosts the controller.
Forwarding plane (1) Controller impersonation attacks for, for example, disclosure of sensitive data or unauthorized access.(2) Flow table attacks such as injection of malicious/bogus flow rules and flow table overflows.
Authenticate the controller, set an appropriate flow table expiry time, and mitigate DDoS attacks by using rate limiting and other mechanisms.
Southbound and northbound interfaces
Data in transit may be intercepted, tampered with, or replayed.
Encrypt data in transit and protect the confidentiality and integrity of hash-based message authentication codes (HMACs) and timestamps to prevent replay attacks.
1 Exploration into and Practice of 5G Network Security in the Context of New Infrastructure Construction, 2020 West Lake Cybersecurity Conference.
2 Whitepaper of 5G Security Requirements and Architecture for Smart Cities, IMT-2020 (5G) Promotion Group, May 2020.

55
2020 Cybersecurity Insights
Biggest Trends in 2020
4.4.2 NFV TechnologyThe NFV technology is key to dynamic and flexible deployment of elements of core networks. However,
the NFV platform itself is vulnerable and has insecure interfaces, and virtual security functions (such as
elements of 5G core networks) that it carries are at the risks of remote debugging and data theft and
tampering. Therefore, NFV security should be considered from various aspects, as listed in the following
table.
Table 4-2 NFV's security risks and countermeasures
Asset Risk CountermeasureNetworking The infrastructure consists of the cloud management
network, storage network, service network, and out-of-band management network. Failure to isolate management, control, and storage traffic or failure to set security zones may lead to one threat in one network affecting other networks.
Physically isolate management, control, and storage traffic by, for example, deploying different leaf switches for different networks and connecting an out-of-band management switch to the out-of-band management port. Set security zones and use virtual local area networks (VLANs) to separate security zones of different security levels.
NFVI Security risks regarding Network Functions Virtualization Infrastructure (NFVI) are similar to those facing cloud computing infrastructure, including virtualization software vulnerabilities, host and virtual machine (VM) system vulnerabilities, VM escape, inter-VM attacks or information theft, and container security issues.
Harden virtualization software and host and VM operating systems (OSs). Isolate and protect VMs to prevent inter-VM attacks.
VNF (1) Virtualized network functions (VNFs) themselves are vulnerable.(2) VNFs share underlying resources. If one VNF is attacked, the impact may extend to other VNFs.
Harden VNF network elements (NEs). Isolate NEs and protect their interactions and properly enforce authentication. Encrypt critical data of VNFs in transit and storage and protect users' privacy. Manage VNFs throughout their lifecycles.
MANO (1) The management and orchestration (MANO) system itself contains exploitable vulnerabilities.(2) Internal interfaces of MANO or interfaces between MANO and other systems may be illegally invoked, and exchanged data may be intercepted, tampered with, or replayed.(3) Virtualization and elastic scaling add to the complexity of NFV account and password management.
Harden MANO entities by adopting mutual authentication for communication between MANO entities and communication between a MANO entity and external entities and by protecting the confidentiality and integrity of data in transit.
4.4.3 Multi-access Edge ComputingMulti-access edge computing (MEC) provides services at the edge of the network, specifically access
equipment rooms close to base stations, edge equipment rooms at the aggregation points of a
metropolitan area network (MAN), and edge equipment rooms at core nodes of a MAN. A number of
edge nodes form an edge cloud. Edge clouds at access equipment rooms are usually small, prone to
physical attacks. Nevertheless, they are closest to user devices and can guarantee ultra-low latency.

56
2020 Cybersecurity Insights
Biggest Trends in 2020
Edge clouds at edge equipment rooms are larger, with higher latency, but are more reliable and secure.
While facilitating the implementation of 5G technology, MEC gives rise to new security requirements, as
listed in the following table.
Table 4-3 MEC's security risks and countermeasures
Asset Risk CountermeasurePhysical environment and network architecture
Close to the network edge, MEC nodes are in relatively insecure physical environments, vulnerable to unauthorized access, sensitive data disclosure, DDoS, and physical attack threats. Besides, a single MEC node is limited in security capabilities, so it is often necessary to leverage multiple MEC nodes in collaboration.
Emphasize physical security, set up zones/domains (management, core network, basic service, third-party applications), and add various virtual security capabilities (access control, intrusion detection, anomalous traffic analysis, anti-APT, …). As distributed edge nodes have limited capabilities, it is advisable to deploy detection devices at multiple MEC nodes to implement collaborative protection. Where MEC nodes are deployed on premises, isolation measures should be adopted to prevent these nodes from launching attacks on the core network.
UPF The user plane function (UPF), when hit by a physical contact attack, may have its diversion policies tampered with, leading to a data transmission error. An attacker may further attack the core network by first taking down the UPF. A malicious application may also initiate a DDoS attack against the UPF.
Enhance the UPF security. Sensitive data of the UPF, such as diversion policies, should be encrypted for storage. Use mechanisms like role-based access control (RBAC) for access control. Enforce rate limiting for data sent by mobile edge (ME) applications.
NFV system This system faces risks from the NFVI, service communication system, and management system, and is vulnerable to virtualization-related security issues.
Incorporate countermeasures for the NFVI, service communication system, and management system.
MEC platform The MEC platform itself is vulnerable, the MEC platform software or image is tampered with, sensitive data stored on the MEC platform is disclosed, or the MEC platform is accessed by unauthorized ME applications, leading to a DoS attack or data disclosure.
Harden the MEC platform and software, protect the integrity of MEC software and image, encrypt sensitive data and protect the integrity of such data, authenticate ME applications, and grant access only to authorized applications.
MEC orchestration management system
Similar to MANO, this system consists of the MEC platform manager, MEC application orchestrator, and virtual infrastructure manager.
Similar to countermeasures for MANO.
ME App ME applications' vulnerabilities are exploited, ME applications or images are tampered with, sensitive data is disclosed, unauthorized users access applications, and internal applications of MEC are diverse, with complicated privileges that are difficult to manage.
Harden ME applications, protect the integrity of these applications or images, encrypt sensitive data for storage and protect the integrity of such data, authenticate users who intend to access ME applications, and properly isolate and manage internal applications.
4.4.4 Network Slicing TechnologyThe International Telecommunication Union (ITU) divides 5G businesses into three types: Enhanced
Mobile Broadband (eMBB), Ultra Reliable Low Latency Communications (URLLC), and Massive Machine
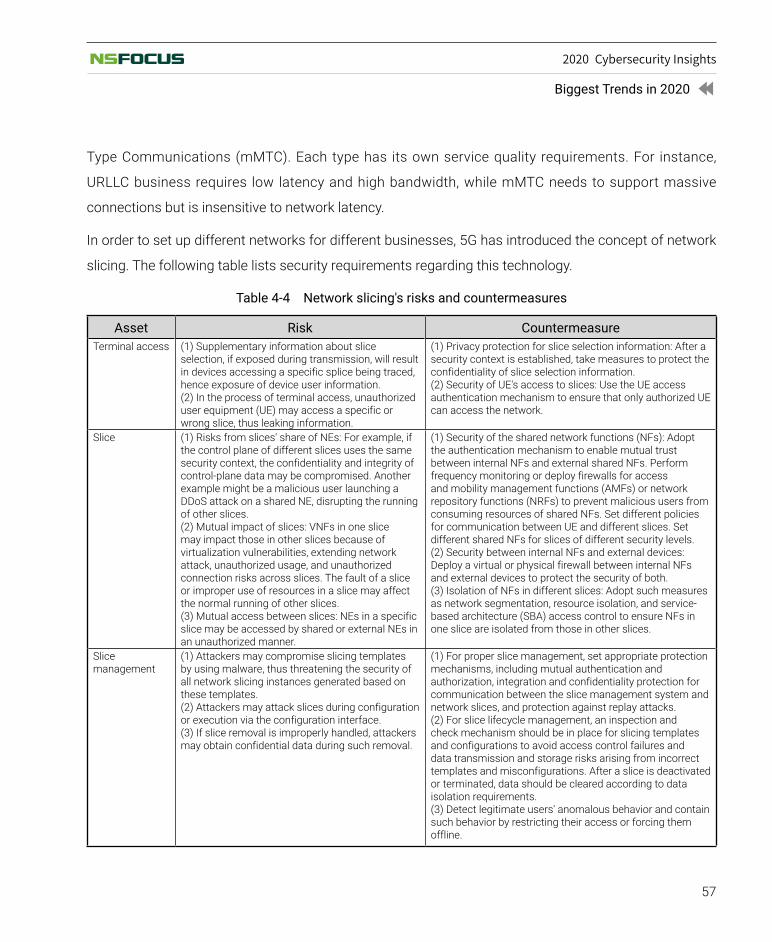
57
2020 Cybersecurity Insights
Biggest Trends in 2020
Type Communications (mMTC). Each type has its own service quality requirements. For instance,
URLLC business requires low latency and high bandwidth, while mMTC needs to support massive
connections but is insensitive to network latency.
In order to set up different networks for different businesses, 5G has introduced the concept of network
slicing. The following table lists security requirements regarding this technology.
Table 4-4 Network slicing's risks and countermeasures
Asset Risk CountermeasureTerminal access (1) Supplementary information about slice
selection, if exposed during transmission, will result in devices accessing a specific splice being traced, hence exposure of device user information.(2) In the process of terminal access, unauthorized user equipment (UE) may access a specific or wrong slice, thus leaking information.
(1) Privacy protection for slice selection information: After a security context is established, take measures to protect the confidentiality of slice selection information.(2) Security of UE's access to slices: Use the UE access authentication mechanism to ensure that only authorized UE can access the network.
Slice (1) Risks from slices' share of NEs: For example, if the control plane of different slices uses the same security context, the confidentiality and integrity of control-plane data may be compromised. Another example might be a malicious user launching a DDoS attack on a shared NE, disrupting the running of other slices.(2) Mutual impact of slices: VNFs in one slice may impact those in other slices because of virtualization vulnerabilities, extending network attack, unauthorized usage, and unauthorized connection risks across slices. The fault of a slice or improper use of resources in a slice may affect the normal running of other slices.(3) Mutual access between slices: NEs in a specific slice may be accessed by shared or external NEs in an unauthorized manner.
(1) Security of the shared network functions (NFs): Adopt the authentication mechanism to enable mutual trust between internal NFs and external shared NFs. Perform frequency monitoring or deploy firewalls for access and mobility management functions (AMFs) or network repository functions (NRFs) to prevent malicious users from consuming resources of shared NFs. Set different policies for communication between UE and different slices. Set different shared NFs for slices of different security levels.(2) Security between internal NFs and external devices: Deploy a virtual or physical firewall between internal NFs and external devices to protect the security of both.(3) Isolation of NFs in different slices: Adopt such measures as network segmentation, resource isolation, and service-based architecture (SBA) access control to ensure NFs in one slice are isolated from those in other slices.
Slice management
(1) Attackers may compromise slicing templates by using malware, thus threatening the security of all network slicing instances generated based on these templates.(2) Attackers may attack slices during configuration or execution via the configuration interface.(3) If slice removal is improperly handled, attackers may obtain confidential data during such removal.
(1) For proper slice management, set appropriate protection mechanisms, including mutual authentication and authorization, integration and confidentiality protection for communication between the slice management system and network slices, and protection against replay attacks.(2) For slice lifecycle management, an inspection and check mechanism should be in place for slicing templates and configurations to avoid access control failures and data transmission and storage risks arising from incorrect templates and misconfigurations. After a slice is deactivated or terminated, data should be cleared according to data isolation requirements.(3) Detect legitimate users' anomalous behavior and contain such behavior by restricting their access or forcing them offline.

58
2020 Cybersecurity Insights
Biggest Trends in 2020
4.4.5 Network Exposure Function5G provides some network function (mobility, session, quality of service (QoS), billing, …) interfaces
for third-party applications, enabling them to independently implement some basic network
functions. Besides, 5G provides MANO for third-party service providers to independently implement
network orchestration, such as network deployment, updates, and capacity expansion, for the
ultimate purpose of dynamic network customization. This is what we call network exposure
function (NEF) of 5G networks. Risks and security requirements of NEF are listed in the following
table.
Table 4-5 NEC's risks and countermeasures
Asset Risk CountermeasurePrivacy information NEF releases users' personal information, network
data, and service data from network operators' internal platforms, incurring risks of data leaks.
Enhance protection of 5G network data as well as threat monitoring and disposal, for example, encryption of data in transit and at rest, protection of data integrity, and protection against replay attacks.
NEF interface The NEF interface uses common Internet protocols and may introduce existing security risks in the current Internet to 5G networks.
Enhance protection of the NEF interface to prevent attackers from compromising an operator's network through an open interface, for example, privilege management for access to APIs.
4.5 AI SecurityArtificial intelligence (AI) is a core driver to the new round of industrial transformation, accelerating the
upgrade of digital economies and industries worth trillion of yuan. This raises new requirements for the
stability and security of network infrastructure. On the one hand, attacks in network infrastructure, such
as DDoS and exploits, could cause network problems, which, in turn, will result in data exchange failures
between the AI cloud service platform and the developer and user, thus exposing data on the cloud side
and device side to more complicated security challenges than in traditional information systems. On
the other hand, algorithm infrastructure represented by AI-enabled, open-source frameworks/platforms
and pretrained model libraries is prone to backdoors and code vulnerabilities because of developers'
sabotage or poor code implementations.

59
2020 Cybersecurity Insights
Biggest Trends in 2020
4.5.1 Training DataWith the accelerated convergence of different systems and services, sharing data across organizations,
industries, and regions is becoming a pressing need. AI is currently at the stage of learning driven by
massive data. AI training datasets formed by collecting data shared by other parties are at the risks
of data unbalance, data poisoning, and data leaks. NSFOCUS observed that multiple AI-related data
security events happened in 2020, especially data leaks, which brought uncontrollable risks to sensitive
personal data and other critical data. The following table lists top 5 AI-related data leaks in 2020.
Table 4-6 Top 5 AI-related data leaks in 2020
Time Event DescriptionApril 2020 The World Health
Organization (WHO) suffered five times more cyberattacks during the pandemic than the same period in the previous year.
The WHO claimed that the number of cyberattacks that it suffered during the pandemic rose sharply and about 450 WHO organizations and thousands of WHO employees had their email accounts and passwords leaked.
October 2020 A Greek telecom tycoon was hacked, resulting in a leak of massive personal information of users.
Cosmote, the largest telecom company in Greece, encountered a critical data breach, which resulted in a leak of massive user information, potentially having a major impact on "national security issues". It is reported that this data breach was caused by a cyberattack launched by foreign hackers, who stole phone data and other information from September 1 to 5, 2020. According to Cosmote, the stolen files did not include phone (chat) or short message contents, user names or addresses, credit card numbers, or bank accounts, and users did not need to take any action. At the time of writing, the investigation was ongoing, without any signs showing that the stolen information had been disclosed or exploited in any other ways.
June 2020 Over 200 judicial and law enforcement agencies in the USA had 296 GB of data leaked.
The activist group Distributed Denial of Secrets (DDoSecrets) claimed that they stole 296 GB of data from US law enforcement agencies (an event known as BlueLeaks), involving reports, security bulletins, and law enforcement guides of over 200 police departments and fusion centers. Some of the files stolen supposedly contain sensitive and personal information, such as names, bank account numbers, and phone numbers.
April 2020 The AI-assisted COVID-19 detection technology of a Chinese medical company was hacked.
According to a media report, a hacker was selling the source code and experimental data of a technology from Huiying Medical. This technology, with the assistance of AI, can detect the COVID-19 virus. A hacker with the screen name of "THE0TIME" was suspected to be the threat actor. The hacker, in his or her post, claimed that he or she had obtained the source code of the COVID-19 detection technology and the experimental data of COVID-19, and asked for a price of 4 BTC. The data on sale included 1.5 MB of user data, 1 GB of technology-related content and source code for detection technology, and 150 MB of lab research on the novel coronavirus.
May 2020 The Swiss railway vehicle maker Stadler was hit by a cyberattack.
Stadler, a Swiss railway vehicle maker, disclosed that it was hit by a cyberattack, where the attacker managed to penetrate into its IT network and used malware to infect some computers, possibly obtaining some data.

60
2020 Cybersecurity Insights
Biggest Trends in 2020
4.5.2 Algorithmic ModelIn 2020, adversarial example attacks, backdoor attacks on algorithms, model stealing attacks, feedback
weaponization, and other new types of attacks aiming to damage AI algorithm models emerged on
end. Among these attacks, adversarial example attacks are the major type of threat to AI systems.
For example, an attacker may use adversarial examples to poison AI/ML training data in business
applications so as to cripple the decision-making and operations capabilities. In the driverless scenario,
self-driving cars need to be always aware of road conditions and traffic signs. An adversarial example
may cause such cars to misread their environments, resulting in traffic accidents. Therefore, AI needs
to be robust enough against malicious adversarial examples.
Backdoor attacks and training data poisoning are also serious threats facing AI systems. For AI models
trained offline in laboratories, such threats have a limited impact. But in actual usage scenarios, these
threats may be devastating. Self-driving cars can learn other successful driving cases in real time and
rapidly adapt to unexpected and dangerous road conditions. But when the model's training results
deviate from the actual conditions because of a backdoor or poisoning, self-driving cars may misjudge
the situation. Therefore, mission-critical AI systems must be equipped with the capabilities of promptly
identifying malicious training examples and detecting intrusions.
4.5.3 AI AbuseIn August 2020, the University College London (UCL) released a report, identifying 20 ways AI could be
used to facilitate crime in years to come. As AI-synthesized audio and video contents are hard to detect
and defeat, DeepFake was ranked first because of its risk of abuse. The open-source project DeepFake
can swap faces in images or videos and create fake images or videos that look very genuine. As great
strides are made in the computing power, network transmission is accelerating. Besides, with the
increasing demand for data sharing, disinformation is generated and spread at a higher speed. In this
process, AI may become a handy weapon for false information, fraudulence, and other forms of crime.
These problems, if left unresolved, will put AI-assisted services in jeopardy.
61
2020 Cybersecurity Insights
Biggest Trends in 2020
4.6 Data SecurityWhen it comes to data breaches, 2020 was an eventful year, seeing great losses arising therefrom.
According to NSFOCUS's observation, more and more ransomware families have established their own
data leak websites on the dark web, and data and privacy leaks are growing in scale, with increasingly
serious consequences.
4.6.1 Data BreachesIn 2020, data breaches continued to be a ghost haunting people and organizations around the globe.
According to the 2020 Q3 Report – Data Breach QuickView from Risk Based Security (RBS), there were
2953 publicly reported breaches from January to September 2020, a 51% decrease from 2019's 6021
in the same period, but the number of records exposed reached 36.107 billion, a 332.21%1 increase
compared with the same period of the previous year (8.354 billion), hitting a new record high. Generally
speaking, data breaches were still a serious problem that affected many organizations and users in
2020.
NSFOCUS collected information about massive data breaches around the world in 2020 and
identified seven typical ones, as shown in the following table. A look into the scale found three
breaches that leaked hundreds of millions of records, including one that involved a staggering
10 billion. From the perspective of causes, misconfiguration and hacking stood out as major
contributors. For example, event 1 was caused by misconfiguration of Elasticsearch clusters2 and
event 3 by cloud misconfiguration issues3, both of which led servers to expose unprotected or
unencrypted sensitive data. Events 2, 4, and 5 were caused by hacking such as server breaches4
and brute-force matching5.
1 https://pages.riskbasedsecurity.com/hubfs/Reports/2020/2020%20Q3%20Data%20Breach%20QuickView%20Report.pdf
2 https://www.wired.com/story/cam4-adult-cam-data-leak-7tb/
3 https://www.hackread.com/worlds-most-secure-online-backup-provider-exposes-records/
4 https://www.upguard.com/blog/biggest-data-breaches
5 https://www.sohu.com/a/381339588_161795

62
2020 Cybersecurity Insights
Biggest Trends in 2020
To mitigate data breach risks, organizations should attach importance to the protection of database
servers and assets by promptly loading software patches and regularly scanning systems for
vulnerabilities and checking configurations. In addition, they should do a good job in the lifecycle
management of sensitive data by taking such technical measures as sensitive data identification,
classification, and masking as well as masking effect evaluation.1234567
Table 4-7 World's biggest data breaches in 2020 (sorted by the scale of data leaked)
Event Time Scale Event Description Cause1 March
202010.88 billion CAM4, an adult website, had 10.88 billion records of sensitive user
information and log data exposed1.Exposure on the Internet and misconfiguration
2 February 2020
538 million Sina Weibo had accounts and associated mobile numbers of 538 million users leaked and sold on the dark web2.
Hacking
3 April 2020 135 million SOS Online Backup, a US cloud-based backup provider, had personal records of nearly 135 million customers exposed3.
Exposure on the Internet and misconfiguration
4 February 2020
10.6 million MGM Grand, a US hotel, had 10.6 million guest records leaked4. Hacking
5 May 2020 9 million easyJet, a British airline group, had personal information and credit card details of 9 million customers leaked5.
Hacking
6 March 2020
5.2 million Marriott, a US hotel, detected a data breach that affected nearly 5.2 million guests6.
Unknown
7 March 2020
4.9 million Personal details of more than 4.9 million Georgians (almost the whole population) were disclosed and published on a hacking forum7.
Unknown
1 https://www.wired.com/story/cam4-adult-cam-data-leak-7tb/
2 https://www.sohu.com/a/381339588_161795
3 https://www.hackread.com/worlds-most-secure-online-backup-provider-exposes-records/
4 https://www.upguard.com/blog/biggest-data-breaches
5 https://www.upguard.com/blog/biggest-data-breaches
6 https://www.upguard.com/blog/biggest-data-breaches
7 https://www.zdnet.com/article/personal-details-for-the-entire-country-of-georgia-published-online/

63
2020 Cybersecurity Insights
Biggest Trends in 2020
4.6.2 Regulations and PoliciesBy 2020, most countries had enacted data and privacy protection laws. According to data collected by
the United Nations Conference on Trade and Development (UNCTAD) as of November 24, 20201, 128
out of 194 countries (66%) had put in place legislation to secure the protection of data and privacy,
including the EU, the USA, China, Russia, India, Australia, Canada, and Japan.
The EU promulgated the General Data Protection Regulation (GDPR) on May 25, 2018. As a
comprehensive framework for personal information protection, GDPR has a far-reaching effect on many
countries' new legislation concerning data privacy. In 2020, data privacy legislation activities were seen
everywhere: On June 5, 2020, Japan passed the amendments to the Act on the Protection of Personal
Information; on July 1, South Africa's Protection of Personal Information Act came into force; Singapore
amended the Personal Data Protection Act (PDPA); Pakistan introduced a new draft of the Personal
Data Protection Bill; Indonesia submitted the Personal Data Protection Bill to the legislature; South
Korea revised the Personal Information Protection Act.
GDPR enforcement has been in full swing since the promulgation of the regulation, turning out one after
another big fine. According to statistics on the GDPR Enforcement Tracker website2, by November 27,
2020, EU member states had imposed 415 fines since 2018. The number over a two-year period from
2018 to 2019 was only 152, but climbed to 263 in 2020.
At the time of writing, GDPR Enforcement Tracker recorded a total of EUR 260 million of GDPR fines and
penalties, or EUR 638,000 on average3. Most of these fines were imposed for the following reasons: (1)
insufficient legal basis for data processing; (2) insufficient technical and organizational measures to
ensure information security; (3) non-compliance with general data processing principles; (4) insufficient
fulfilment of data subjects rights.
1 https://unctad.org/page/data-protection-and-privacy-legislation-worldwide
2 https://www.enforcementtracker.com/
3 https://www.enforcementtracker.com/

64
2020 Cybersecurity Insights
Biggest Trends in 2020
GDPR not only is binding on local enterprises of EU member states but also affects cross-border
enterprises doing business with EU member states. To lower non-compliance risks, enterprises
should, on the one hand, proactively make organization-wide efforts to promote GDPR compliance,
for example, adding a user rights response page and handling process on their websites; on the
other hand, take such measures as data encryption, masking, and audits to protect sensitive data
from being leaked.
4.6.3 Technological Development TrendDriven by privacy legislation, data security technologies and products have gained momentum for
fast development, divided into small segments around regulatory compliance. In a report released
in November 2020, Gartner predicts that, before year-end 2023, more than 80% of companies
worldwide will be facing at least one privacy-focused data protection regulation and the privacy-
driven spending on compliance tooling will break through to over USD 8 billion worldwide.
Obviously, compliance with data protection regulations will be a promising field where security
vendors have a lot to do. We predict that data technologies will march towards the following
directions in the future:
1. Driven by the GDPR and California Consumer Privacy Act (CCPA), techniques of automating
response to user data rights and other related technologies will grow rapidly.
Some privacy regulations grant data subjects (users) the rights to access, modify, and delete
personal data, and so require enterprises to handle and respond to users' such requests within
a stipulated period of time. For example, GDPR sets the time limit to one month, while CCPA's
limit is 45 days. Fast response to data subject rights requests (SRRs) is a big challenge for
most enterprises. According to a survey, about two-thirds of organizations should spend more
than two weeks handling a single SRR manually, and the average cost is as high as USD 1400.
In a word, the traditional manual way is unfeasible for handling of highly concurrent SRRs within
a reasonable time.
Securiti.AI, a winner of the Innovation Sandbox Contest at RSA Conference 2020, engages in

65
2020 Cybersecurity Insights
Biggest Trends in 2020
R&D of automated SRR and CPM response products. BigID, another "Most Innovative Startup"
named at the same event in 2018, also focuses on development of privacy compliance
products. OneTrust, another well-known startup, takes privacy compliance as its major
area of interest, and delivers products of the same nature as Securiti.AI. The three security
startups have raised more than USD 60 million in total. This, to some extent, reflects the
popularity of SRR response products, which are now in steady demand in the security
market.
These products mainly employ process automation and various AI technologies. Process
automation automates routine work within an enterprise, freeing the data security operations
team from such trivial matters as repeated response to requests. This can not only lower the
operations expenses but also reduce the non-compliance risk arising from prolonged response.
When it comes to AI, natural language processing (NLP) is used to identify unstructured
sensitive data, knowledge graphs are used to link all information related to a data subject, and
chatbots are used to automatically handle some queries.
2. The underlying technologies of compliance products, such as sensitive data identification and
data masking, are maturing.
The EU's GDPR and the USA's CCPA both state that the data objects to be protected are
personal data (or personal information) and it is enterprises' obligations to protect such
data.
For the purpose of compliance, the first step is to identify various types of sensitive data at
rest and in transit, including not only personal information (names, ID card numbers, mobile
numbers,…) but also privacy data (medical privacy, financial privacy, network behavior
privacy like cookies, …). Currently, multiple methods have been developed to identify sensitive
data based on: (1) regular expressions; (2) keyword library; (3) data similarity; (4) machine
learning. The first two methods are relatively mature in the industry and players usually have
comprehensive rule libraries or dictionaries. The last two methods are usually used in scenarios

66
2020 Cybersecurity Insights
Biggest Trends in 2020
where the first two methods are not applicable, such as when it is difficult to define rules or
keywords. As for the third method, signatures are first extracted from reference data, then the
same process is conducted for other data, and finally a comparison is made to determine their
similarity. When a predefined threshold is exceeded, the two groups of data are deemed to be of
the same type. The fourth method leverages the robust learning and prediction capabilities of
machine learning to collect enough examples for classification and model training. After that, a
model is deployed to automatically identify the types of new data.
After being identified, sensitive data needs to be masked to avoid legal risks arising from the
secondary use and during the circulation (non-production environments, such as data analysis
and testing). Data masking can be reversible or irreversible, depending on whether the data can
be transformed back to the original. Reversible data masking can be understood as a process
of replacing sensitive data with insensitive data based on enterprises' internal sensitive and
insensitive data mapping tables. Using the same table, the replacement can be transformed
back to the original data. Irreversible masking can be achieved by various means, including
rounding, quantization, generalization, masking out, truncation, hashing, and perturbation. For
different usage scenarios, static data masking (SDM) or dynamic data masking (DDM) can be
adopted. The former is usually for non-production environments (testing, statistical analysis, …)
and the latter for production environments. SDM techniques are now quite mature, and DDM is
also implemented in some products.
3. Balancing regulatory compliance and data uses, privacy-enhanced computation techniques and
applications are emerging.
The big data era is characterized by the frequent use and fast circulation of sensitive data.
On the one hand, data should be secured; on the other hand, data should be available for
convenient use. This poses a big challenge to traditional data security techniques that focus on
encryption. In response to compliance requirements and the needs to use data, a series of novel
data security techniques specific to business scenarios have been developed and implemented,
including homomorphic encryption, secure multiparty computation (MPC), federated learning,

67
2020 Cybersecurity Insights
Biggest Trends in 2020
and differentiated privacy. These techniques can not only ensure that the original data is not
leaked (invisible) but also ensure the availability of data for particular business scenarios
(aggregation, set operation, and AI modeling). For this reason, they are called "availability +
invisibility" techniques. Gartner refers to these techniques as privacy-enhanced computation
and lists it as one of the top strategic technology trends in 2021 together with anywhere
operations and AI engineering.

68
2020 Cybersecurity Insights
Conclusion
5 Conclusion
Conclusion
5

69
2020 Cybersecurity Insights
Conclusion
2020 witnessed an unprecedented impact on cybersecurity from the COVID-19 pandemic. With
the construction and development of the IoT, industrial Internet, 5G networks, AI, and data security
come new cybersecurity requirements. To keep pace with the booming digital economy, NSFOCUS
will intensify its efforts in cybersecurity research, continuing to develop and deliver enterprise-grade
cybersecurity products, solutions, and operations services around its core competitiveness.

www.nsfocusglobal.com
SECURITY MADE SMART & SIMPLE