Embed Size (px)
Citation preview

Södertörn University | Life Science
Bachelor Thesis 7.5 hp | Neuroimmunology | Spring 2010
Molecular Biology
CXCL13: A Prognostic Marker in Multiple Sclerosis
By: Carolina Havervall Supervisor: Prof. Fredrik Piehl

Södertörn University
Neuroimmunology
CXCL13: A Prognostic Marker
in Multiple Sclerosis
Bachelor Thesis VT 2010
Carolina Havervall
Supervisor: Prof. Fredrik Piehl

In the demyelinating autoimmune disease multiple sclerosis (MS) there is a great need
for validated prognostic biomarkers that can give information about both prognosis and
disease course. So far only clinical parameters have been shown to predict future out-
come. CXCL13 is a potent B cell chemoattractant that has been suggested to be a poten-
tial biomarker candidate. The aim of this study was to investigate the usefulness of
CXCL13 as a prognostic biomarker for MS.
Clinical, paraclinical, laboratory and MRI data about a large group of MS
patients and controls were collected. CXCL13 levels in cerebrospinal fluid (CSF) sam-
ples from these patients were determined by standard enzymelinked immunosorbent
assay (ELISA).
In general CXCL13 were increased in CSF in MS, especially in relapsing-
remitting MS during relapses, i.e. with ongoing inflammations in the central nervous
system. CXCL13 is a good candidate prognostic marker for MS, since newly diagnosed
MS with high CXCL13 levels showed worsened disease course within five years. Most
importantly, MS conversion occurred in higher rate in possible MS patients with high
concentrations of CXCL13 in CSF, and in a shorter time point. This observation may
support an early treatment decision in these patients.
In conclusion, this study provides support for an association between
CXCL13 levels in the CSF and later development of disease severity in MS.
Key words: CXCL13, multiple sclerosis, cerebrospinal fluid, prognostic marker, biomarker
“The brain is not an organ. The brain is simply you.”

Table of Contents
1 Introduction ........................................................................................................................ 6
1.1 Multiple Sclerosis ...................................................................................................... 6
1.1.1 Treatments ............................................................................................................. 7
1.1.2 The brain ............................................................................................................... 7
1.1.3 Diagnosis ............................................................................................................... 8
1.1.4 Disease course ..................................................................................................... 10
1.1.5 Genetics ............................................................................................................... 11
1.1.6 Environmental factors ......................................................................................... 11
1.2 Biomarkers .............................................................................................................. 11
1.2.1 CXCL13 .............................................................................................................. 12
1.3 Laboratory methods ................................................................................................. 13
1.3.1 Enzymelinked immunosorbent assay .................................................................. 13
2 Hypothesis ....................................................................................................................... 14
3 Aim .................................................................................................................................. 15
4 Materials .......................................................................................................................... 16
4.1 Databases ................................................................................................................. 16
4.2 Laboratory kit .......................................................................................................... 16
4.3 Samples ................................................................................................................... 16
4.4 Program for statistical analysis ............................................................................... 17
5 Methods ........................................................................................................................... 18
5.1 Collecting data ......................................................................................................... 18
5.2 Enzymelinked immunosorbent assay (ELISA) ....................................................... 19
5.3 Statistical analysis ................................................................................................... 19
6 Results .............................................................................................................................. 20
6.1 CXCL13 in cerebrospinal fluid in MS and controls ............................................... 20

6.2 CXCL13 in cerebrospinal fluid versus number of relapses during five years, EDSS
and number of lesions in RRMS .......................................................................................... 20
6.3 CXCL13, cell counts and IgG-index in cerebrospinal fluid in MS ......................... 21
6.4 Cell counts and IgG-index in cerebrospinal fluid versus number of relapses during
five years and EDSS in RRMS ............................................................................................ 21
6.5 CXCL13 and oligoclonal bands in cerebrospinal fluid in MS and CIS .................. 21
6.6 CXCL13 in cerebrospinal fluid and conversion to MS ........................................... 21
7 Discussion ........................................................................................................................ 23
8 Conclusions ...................................................................................................................... 28
9 Acknowledgments ........................................................................................................... 29
10 References ........................................................................................................................ 30
11 Figures ............................................................................................................................. 37

1 Introduction
1.1 Multiple Sclerosis
Multiple Sclerosis (MS) is an autoimmune inflammatory demyelinating disease of the central
nervous system (CNS) 1. The CNS includes the brain and spinal cord and together with the
peripheral nervous system (PNS) it constitutes our nervous system 2. Loss of CNS tissue inte-
grity is associated with microglial activation, cytokine production, gliosis, i.e. proliferation of
astrocytes in damaged areas of CNS and infiltration of leukocytes in the brain 3, 4.
MS causes inflammation in the CNS with subsequent neurodegeneration, result-
ing in a variable degree of neurological handicap depending on extent and location of the
damage. MS has extremely heterogeneous disease course, ranging from the benign, with mi-
nimal disability after 10-20 years, to the most severe, with major disability within a few year 5.
Autoimmune disorders arise when physiological tolerance to ”self” antigens is
lost 6, i.e. in MS myelin antigen. Modifications of local innate immune response results in
changes in the inflammatory milieu in CNS 7. However, this does not mean that the immune
system is the initiating factor of the disease. Many trigger factors have been suggested for
explaining the development of MS and most likely a mix of these, i.e. genetics and environ-
mental factors, can be the answer 8, 9.
MS disease leads to demyelination, tissue damage, loss of neurons and oligo-
dendrocytes, gliosis, remyelination and inflammation involving B cells, T cells, macrophages
and activated microglia 9. High concentrations of antibodies, secreted by B cells, are found in
the brain and CSF of patients with MS 10 and B cells are shown to be crucially involved in the
pathogenesis of MS 11, 12.
At the moment the prevalence of MS in Sweden is approximately 140/100 000
citizen 13.
6

1.1.1 Treatments
MS was recognized as a separate disease in the late 1800s 14 and for long there has not been
no effective treatments. However, since the mid 90-ties several immunomodulatory drugs
have been available to treat patients in the subgroup relapsing-remitting MS (RRMS) 14. The
therapeutic goal is to avoid disease progression. Thus, broken nerve connections are in most
cases irreversible, resulting in a variable degree of neurological handicaps.
1.1.2 The brain
A nerve cell consists of cell body, axon and dendrites. By release of neurotransmitters in the
synaptic cleft in the end of the axon, signals diffuse across the next cell, making up an enorm-
ous network of the brain. For faster signaling myelin, consisting of a type of gliacells known
as oligodendrocytes, surrounds the axons. These myelin layers are the main focus of attack by
leukocytes in MS. In the brain, the nerve cell bodies are located in the outer part of the brain,
referred to as the grey matter or the cortex, while the white matter consists of the extremely
long nerve outgrowths. The vertebrate brain has three layers cover known as meninges and
below these the cerebrospinal fluid (CSF) is gathered in the ventricles. CSF surrounds, flows,
permeates, and forms an integral component of the brain and spinal cord 15, 16. CSF gives me-
chanical protection, compensates for changes in the intracranial pressure and provides circula-
tion of metabolites, nutrients, toxins and signaling substances 17. The CSF is totally exchange
three to four times a day in the adult 18, 19.
Another type of gliacells are the microglia. Microglia are the immune cells of
the brain since leukocytes, macrophages and other immune cells present in the peripheral
blood are separated from the CSF by the blood-brain barrier (BBB) 20. These cells are not
allowed in CSF. However, in MS, leukocytes can infiltrate CSF due to leaks in the BBB 10, 21,
22, 23. BBB is an endothelial barrier maintaining homeostasis in CSF 24. The endothelial cells
are connected with tight junctions and control transport between cerebral capillaries and neu-
ronal tissue 24.
7

1.1.3 Diagnosis
Laboratory data, magnetic resonance imaging (MRI) and clinical data are equally regarded
when diagnosing MS.
1.1.3.1 Laboratory data
CSF samples of MS patients collected by lumbar puncture (LP), i.e. tapping of the fluid sur-
rounding the spinal cord, provide important diagnostic data by telling about presence of im-
munoglobulin gamma (IgG), oligoclonal bands (OCB), mononuclear cell quantity, albumin
quotient etc. in the CSF. Serum samples are not good for diagnosing MS since periphery
blood is separated from CSF by the BBB. However, several studies have indicates increased
levels of immune cells even in blood in MS and other inflammatory diseases 25, 26. The mainly
compartments of normal CSF are water, glucose, proteins (primarily albumin), immunoglobu-
lins and a very low numbers of mononuclear cells are the main compartments of normal 27.
1.1.3.1.1 Immunoglobulin gamma
IgG are antibody molecules synthesized by B cells and they are presented in high concentra-
tions in the brain and CSF in patients with MS 10, 28, 29, 30. By measuring levels in the CSF of
IgG and albumin protein, a standard known as IgG-index is obtained, validating the relative
ratio of IgG to albumin. IgG-index is standard praxis in diagnosing MS today.
1.1.3.1.2 Oligoclonal bands
Bands of IgG molecules, i.e. OCB, are measured in CSF of MS patients. Since presence of
these bands are highly characteristic for MS 31, 32. IgG-index and OCB provides information
about leak of the BBB 33 and intrathecal production of antibodies in CSF 34. Under normal
conditions there is no intrathecal production of immunoglobulins in CSF 35. Thus, IgG-index
and OCB are important aspects of inflammation apart from inflammatory cell numbers. How-
ever, studies indicate that all MS patients share the same clinical outcome, despite presence of
OCB 36. The disease lacks a god diagnostic biomarker and totally lacks any prognostic mark-
er, except for clinical propositions.
8

1.1.3.1.3 Mononuclear cells
There is an association of myelin destruction and infiltration of T and B leukocytes and ma-
crophages in the CSF in MS 37, 38. Therefore, CSF mononuclear cell numbers provide impor-
tant information about ongoing inflammations in the CNS.
1.1.3.2 Magnetic resonance imagining
MRI reflects disruption of the BBB with associated infiltrations of leukocytes from the blood 39. MRI lesions, most often found in the white matter areas of the brain, indicate ongoing in-
flammation or scars, scleros, i.e. old inflammations 40. The lesions are visualized due to
changes in density of water molecules in areas of inflammation. Lesions are seen as white
spots on black background.
However, the correlation between number, location and quantity of MRI lesions,
and patient symptoms or degree of disease is weak 41, 42. This clinical / radiological paradox
complicates the diagnosing of the MS. Individuals with no sign of inflammation, when re-
garded as MRI lesions, can have extremely severe disease course showing many clinical
symptoms and vice verse.
1.1.3.3 Clinical data
The diagnosis and subtyping of MS follows McDonald criteria 43. McDonald focus on disse-
mination in time and space. MS diagnosis is fulfilled when two clinical episodes suggestive of
MS, separated in time and space, are presented by clinical or paraclinical data 43. The ex-
panded disability status scale (EDSS) 44 is used during diagnosis for describing degree of neu-
rological handicap in patients, as a result of damaged neurons and CNS inflammation. EDSS
is an important measurement of clinical disease severity used in pharmaceutical trials, but also
in routine clinical praxis. The higher EDSS numbers, in the 0-10 scale, represents a more se-
vere degree of disease. The clinical findings regarding patient history and neurological ex-
amination is still the most important in diagnosing MS.
9

1.1.4 Disease course
MS can be divided into four subgroups; relapsing-remitting MS (RRMS), secondary progres-
sive MS (SPMS), primary progressive MS (PPMS) and clinically isolated syndrome (CIS).
1.1.4.1 Clinically isolated syndrome
CIS is pre stage for MS, describing individuals only fulfilling the diagnosis criteria in space,
however, not in time, i.e. one clinical episode indicative of MS has occurred 45. A majority of
CIS patients convert to RRMS within a mean of 1.7 years 45.It has been demonstrated that
early treatment initiation in CIS patients is effective in delaying conversion to MS 46, 47, 48.
This is of high importance, as the response to therapy is unpredictable at its initiation.
1.1.4.2 Relapsing-remitting multiple sclerosis
In most cases MS starts with a relapsing-remitting disease course, with shifting periods with
and without clinical relapses, in majority of the cases (80-90%) 49. Relapses are clinically de-
tectable and depending on the location of the neuroinflammation completely different symp-
toms occur. The most common symptoms are sensory loss, loss of vision, muscle weakness,
balance disturbance and ataxia 50. RRMS is driven by inflammation and axonal loss can hap-
pen already in a early stage of disease 51, 52.
1.1.4.3 Progressive multiple sclerosis
The two distinct forms of progressive MS; primary progressive MS (PPMS) and secondary
progressive MS (SPMS), differs in some aspects. Thus, PPMS patients display fewer inflam-
matory cells, more pronounced oligodendrocytes loss and axonal reduction 53, 54.
RRMS can over time convert to a stable progression of neurological defects,
diagnosed SPMS 55. The conversion usually takes place after 10 years of RRMS onset, in
50% of RRMS patients 56. However, the disease course can already from onset increase conti-
nuously with no repairments. This happens in approximately 15% of all MS patients and is
diagnosed PPMS 57.
10

1.1.5 Genetics
There is solid evidence for a genetic influence in MS 58. The most important genes associated
with increased risk for disease development are human leukocyte antigen (HLA)-DRB1 59, 60,
61, 62, HLA-A 63, METTL1 60, CYP27B1 60, CD58 59, HLA-B 60, TNFRSF1A 60, IL2RA 59, 62,
IL7R, IL2R, CLEC16A, CD58, EVI5-RPL5 and VAV1 59, 60, 63, 64, 65, 66, 67 and there are more
constantly being evaluated for confirmation or rejection. The high amount of important genes
maybe indicate that each of those contribute only a modest effect 68. The heterogeneous genet-
ic may also be explained by studies demonstrating heterogeneity in the initial immunological
patterns of demyelination in MS 69. Finding the causative genes could reveal key pathways
influencing the disease 67.
An animal model of MS, known as experimental autoimmune encephalomyelitis
(EAE), was established 80 years ago 70. EAE is a useful tool for understanding disease me-
chanism and detecting genetic control of neuroinflammation 71, 72, 73, 74. For example a region
on rat chromosome 9 has been shown to regulate EAE 67.
1.1.6 Environmental factors
Vitamin D deficiency 75, low sunlight exposure 76 and cigarette smoking 77, 78 are suggested to
be involved in development of MS. Involvement of common childhood infections, e.g. Eps-
tein-Barr virus, have also been introduced as possible factors 79, 80. However, there are also
opposite theories rejecting this 81, 82.
1.2 Biomarkers
A biological marker or biomarker is “a characteristic that is objectively measured and eva-
luated as an indicator of normal biologic processes, pathogenic progresses, or pharmacolog-
ic responses to the therapeutic intervention” 83. The ideal biomarker should be reproducible,
reliable, simple to use and non-invasive 84. Several types of biomarkers, all with different pur-
poses; diagnostic, prognostic, estimating hereditary risk or evaluating response to treatments,
are of where importance when studying diseases.
11

A validated prognostic biomarker for MS informing about prognosis and disease
course, is of paramount importance. So far only clinical parameters, such as degree of restitu-
tion of function after first bout, relapse frequency the first year and age at onset, have been
shown to predict future outcome 5.
Salzer et. al. 2009, showed that neurofilament light in CSF is a good candidate
for a prognostic biomarker for MS 85. However, other diseases also showed significantly in-
creased concentrations of neurofilament light in CSF 86.
Another important question is whether all MS patients really need lifelong immunotherapy
and may drug holidays be introduced based on prognostic facts.
1.2.1 CXCL13
B cells are known to be crucially involved in the pathogenesis of MS 11, 12 and leukocytes
have been found in MRI lesions, i.e. areas of inflammation 9. Leukocytes express chemokine
receptors and leukocyte recruitment is tightly mediated by specific adhesions molecules,
known as chemokines 87.
CXCL13, also known as B lymphocyte chemoattractant (BLC) or B Cell-
Attracting chemokine 1 (BCA-1) 88, 89 is a small cytokine strongly attracting B cells and in
small numbers T cells and macrophages 90. CXCL13 belongs to the CXC chemokine family.
In CNS CXCL13 is expressed by cells in perivascula, inflammatory lesions and scattered pa-
renchymal cells 91. CXCL13 and its receptor CXCR5, also known as Burkitt´s lymphoma re-
ceptor 1 (BLR-1), are expressed by almost all B cells in CSF from patients with MS 92, 93.
Likewise, EAE have also reported high amount of CXCL13 in CNS of mice with RRMS and
SPMS like inflammations 94. Patients with viral and bacterial infections, e.g. Lyme borreli-
osis, have also shown increased levels of CXCL13 in CSF 95, 96, 97.
12

1.3 Laboratory methods
1.3.1 Enzymelinked immunosorbent assay
Enzymelinked immunosorbent assay (ELISA) is a molecular biologic assay designed to
measure antibody or antigen levels in e.g. serum, plasma, saliva and cell cultures 98. A monoc-
lonal antibody specific for an antigen is pre-coated onto a 96-hold microplate. Standards and
samples are pipetted into the wells and any antigen present is bounded by the immobilized
antibody. Unbound substances are washed away and an enzyme-linked monoclonal antibody
specific for the antigen is added to the wells. Another wash follows to wash away unbound
antibody-enzym reagents. Substrate solution is added to the wells and colour developed in
proportion to the amount of antigen bound in the initial step. Development of the colour is
stopped and finally the intensity of the colour is measured 98.
13

2 Hypothesis
The B cell chemoattractant CXCL13 is a good candidate for being a prognostic marker for
MS.
14

3 Aim
The aim of this study was to collect data about a large group of MS patients, CIS patients and
controls, from different databases, to measure levels of CXCL13 in CSF samples from these
patients, ant to investigate whether there is a correlation between CXCL13 levels in CSF pa-
tients and MS disease activity.
15

4 Materials
4.1 Databases
Take Care (Journal System of Karolinska University Hospital)
Swedish MS-registry (www.msreg.net)
Stockholms Läns Landsting (SLL) electronic clinical records database
4.2 Laboratory kit
ELISA R&D Systems Quantikine Kit Human CXCL13/BLC/BCA-1
4.3 Samples
Cerebrospinal fluid samples of 387 MS patients:
322 relapsing-remitting MS (RRMS)
40 secondary progressive MS (SPMS)
24 primary progressive MS (PPMS)
87 clinically isolated syndrome (CIS)
Cerebrospinal fluid samples of 340 controls:
181 other neurological disease (OND)
145 inflammatory other neurological disease (iOND)
24 viral/bacterial central nervous system infections
14 healthy control (HC)
16

4.4 Program for statistical analysis
GraphPad Prism 3.0, San Diego, CA
17

5 Methods
5.1 Collecting data
Clinical, paraclinical, laboratory and MRI data on 387 MS patients (322 RRMS, 40 SPMS, 24
PPMS, 87 CIS) and 340 controls (181 OND, 145 iOND, 24 viral/bacterial infections, 14 HC)
were collected from three databases; Take Care (Journal System of Karolinska University
Hospital), the Swedish MS-register (www.msreg.net) and SLL (Stockholms Läns Landsting).
In point of crucial data missing or being unclear, neurologist Fredrik Piehl updated patients’
journals. The majority of data was gathered from Take Care and SLL.
The following parameters were included as potential early predictors of disability in MS
• CSF cell counts, i.e. mononuclear cell quantity
• CSF immunoglobulin G index
• CSF oligoclonal bands
• Latest diagnosis
• Latest expanded disability status scale (EDSS)
• EDSS date
• Number of relapses
• Year of onset
• Magnetic resonance imaging lesions
Following parameters were included in the raw data file, as parameters for future studies on
biomarkers in MS
• CSF IgG
• CSF albumin quotient
• Plasma IgG
18

• Sex
• Age
• Ethnicity
• Heredity
• Haplotype
• Immunomodulating treatments
5.2 Enzymelinked immunosorbent assay (ELISA)
CXCL13 levels in cerebrospinal fluid were determined by standard enzymelinked immuno-
sorbent assay (ELISA) R&D Systems Quantikine Kit, according to the manufacturer’s in-
structions (R&D Systems), on cerebrospinal fluid samples from 387 MS patients and 340 con-
trols collected in association with patients visiting the neurological clinic, Karolinska Univer-
sity Hospital, Solna or Huddinge.
CSF had been drawn collected in plastic tubes, centrifuged and stored as frozen
cell pellet and cell-free CSF, respectively, at -80°C until analysis. Lumbar puncture (LP) and
CSF sample preparation had been done by doctors, nurses and laboratory personal at the neu-
rological clinic, Karolinska University Hospital, Solna or Huddinge.
Due to the fact that lumbar puncture is an invasive procedure, with risk of at-
tracting head ache, controls mainly consisted of samples obtained from patients investigated
for possible neurological disease (iOND, OND). However, also 14 healthy controls (HC) were
studied.
5.3 Statistical analysis
Differences in relative levels of CXCL in CSF in MS and controls (iOND, OND and HC), and
correlation analysis were tested for significance with the non-parametric Kruskal-Wallis test
and Dunn´s correlation for multiple testing (GraphPad Prism 3.0, San Diego, CA).
19

6 Results
6.1 CXCL13 in cerebrospinal fluid in MS and controls
Comparing levels of CXCL13 in CSF with ELISA, indicated that CSF CXCL13 were overall
increased in MS (including CIS) compared to control groups (figure 1A), except for vir-
al/bacterial central nervous system infections cohort (figure 1B). Among different subgroups
of MS (RRMS, PPMS, SPMS and CIS) highest levels of CXCL13 CSF were shown during
clinical relapses, i.e. inflammations in the central nervous system (figure 1C).
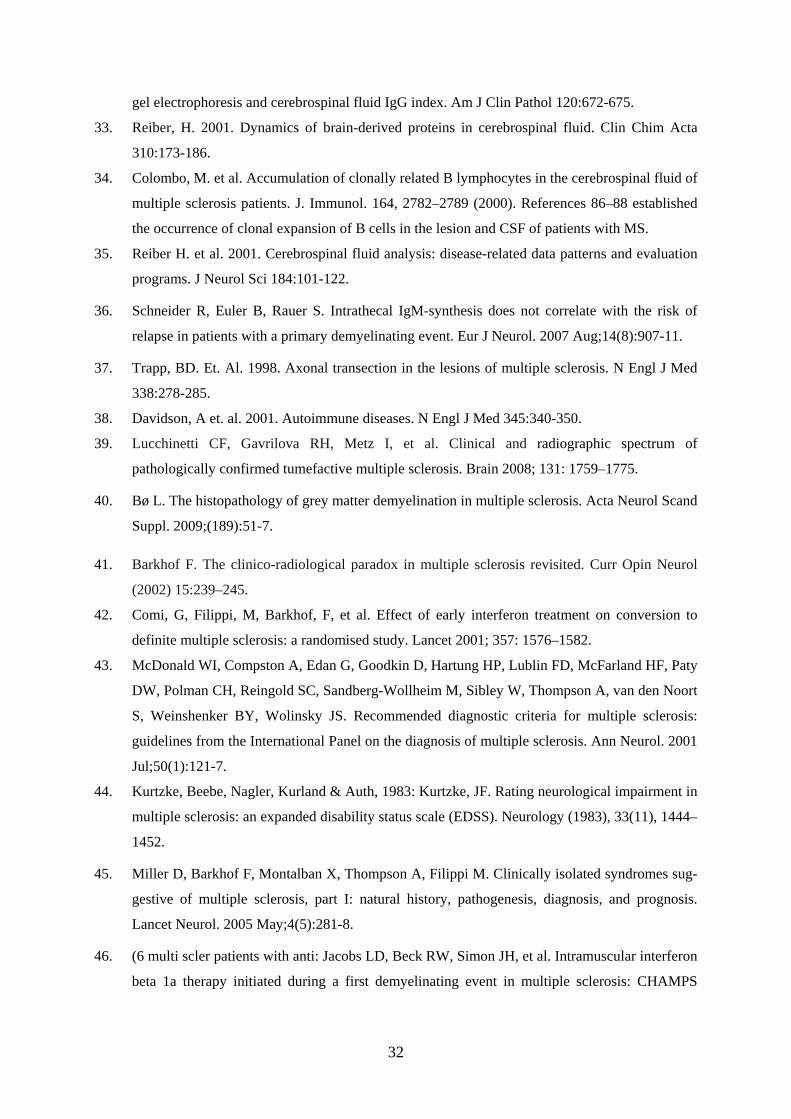
6.2 CXCL13 in cerebrospinal fluid versus number of relapses during five years, EDSS and number of lesions in RRMS
RRMS cohort was used for analyzes between CSF CXCL13 and MS disease activity and pro-
gression. CSF CXCL13 in 52 RRMS patients, followed up five years from disease onset, in-
dicated an association between high levels of CXCL13 in CSF and high EDSS (figure 2A).
Furthermore, in analyzes including 322 RRMS patients, correlations between CSF CXCL13,
EDSS and MRI lesions were obtained. The results showed that worsen disease outcome and
larger quantity of MRI lesions were associated with higher amounts of CXCL13 in CSF (fig-
ure 2B, 2C). Summarized, CSF CXCL13 levels followed MRI lesion quantity and MS disease
worsening (EDSS and relapse quantity) when a period of five years from onset was regarded.
20

6.3 CXCL13, cell counts and IgG-index in cerebrospinal fluid in MS
CSF CXCL13 showed significant positive correlation with CSF cell counts and CSF IgG-
index (figure 3A, 3B). High levels of CXCL13 were associated with high quantity of cell
numbers and IgG-index, and vice verse. However as shown by the correlation coefficient,
CXCL13 versus cell counts presented a slightly better correlation than CXCL13 versus IgG-
index.
6.4 Cell counts and IgG-index in cerebrospinal fluid versus number of relapses during five years and EDSS in RRMS
A RRMS cohort with 52 patients, followed up for five years from disease onset, were used for
analyzes considering relapses quantity. The RRMS cohort for EDSS and MRI lesion analyzes
consisted of 322 RRMS patients. High CSF cell counts correlated with high relapse frequency
(figure 4). However, no correlation with EDSS was shown (figure 5). Considering IgG-index,
neither EDSS nor relapse frequency showed any correlation (figure 6, figure 7).
6.5 CXCL13 and oligoclonal bands in cerebrospinal fluid in MS and CIS
High CXCL13 levels in CSF were related to the presence of oligoclonal bands (OCB) in MS
patients (including CIS) (figure 8).
6.6 CXCL13 in cerebrospinal fluid and conversion to MS
A possible correlation regarding CXCL13 in CSF and conversion to MS was examined in two
different analyses, including and not including time limitation. With time excluded, disease
development occurred in at a significantly higher rate in the CIS cohort with higher levels of
CXCL13 in CSF (figure 9A). With time included, conversion to MS showed a trend towards a
21

correlation with CXCL13 (figure 9B). Summarized, CSF CXCL13 was related to MS conver-
sion and trend to conversion time.
22
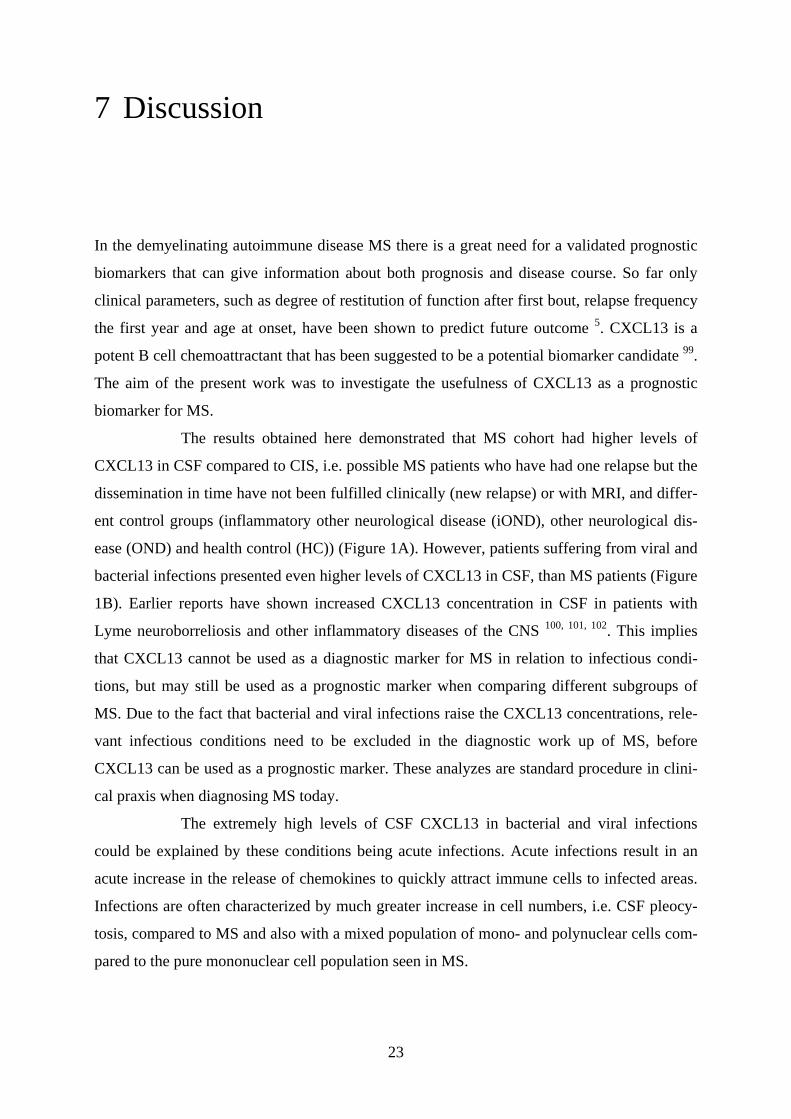
7 Discussion
In the demyelinating autoimmune disease MS there is a great need for a validated prognostic
biomarkers that can give information about both prognosis and disease course. So far only
clinical parameters, such as degree of restitution of function after first bout, relapse frequency
the first year and age at onset, have been shown to predict future outcome 5. CXCL13 is a
potent B cell chemoattractant that has been suggested to be a potential biomarker candidate 99.
The aim of the present work was to investigate the usefulness of CXCL13 as a prognostic
biomarker for MS.
The results obtained here demonstrated that MS cohort had higher levels of
CXCL13 in CSF compared to CIS, i.e. possible MS patients who have had one relapse but the
dissemination in time have not been fulfilled clinically (new relapse) or with MRI, and differ-
ent control groups (inflammatory other neurological disease (iOND), other neurological dis-
ease (OND) and health control (HC)) (Figure 1A). However, patients suffering from viral and
bacterial infections presented even higher levels of CXCL13 in CSF, than MS patients (Figure
1B). Earlier reports have shown increased CXCL13 concentration in CSF in patients with
Lyme neuroborreliosis and other inflammatory diseases of the CNS 100, 101, 102. This implies
that CXCL13 cannot be used as a diagnostic marker for MS in relation to infectious condi-
tions, but may still be used as a prognostic marker when comparing different subgroups of
MS. Due to the fact that bacterial and viral infections raise the CXCL13 concentrations, rele-
vant infectious conditions need to be excluded in the diagnostic work up of MS, before
CXCL13 can be used as a prognostic marker. These analyzes are standard procedure in clini-
cal praxis when diagnosing MS today.
The extremely high levels of CSF CXCL13 in bacterial and viral infections
could be explained by these conditions being acute infections. Acute infections result in an
acute increase in the release of chemokines to quickly attract immune cells to infected areas.
Infections are often characterized by much greater increase in cell numbers, i.e. CSF pleocy-
tosis, compared to MS and also with a mixed population of mono- and polynuclear cells com-
pared to the pure mononuclear cell population seen in MS.
23

Correlation analysis of CXCL13 levels in CSF and CSF cell counts showed that these
parameters are significantly correlated. However, it is important to keep in mind that in MS
the high levels of CSF CXCL13 is a result of a chronic CNS inflammatory process. It is im-
portant to discriminate between inflammation caused by infections and autoimmunity as
treatment differs.
Earlier studies have shown that CSF concentration of the B cell chemokine CXCL13
differs in patients with CIS, relapsing-remitting MS (RRMS), primary progressive MS
(PPMS) and secondary progressive MS (SPMS) 99. Thus, RRMS present the highest levels of
CSF CXCL13. However, this study was performed in a limited number of patients and it is
unclear if these results reflect true differences. My aim with the present work was to validate
these findings in a much larger cohort. The results were largely similar with RRMS having
the highest concentration of CXCL13 in CSF (Figure 1C), especially during periods of clini-
cal relapses, probably as a reflection of a flare in ongoing inflammatory activity.
The RRMS cohort was used to analyze correlations between CSF CXCL13 and MS
disease activity, indicated as number of relapses during five years, EDSS and MRI lesion
quantity. These different parameters likely reflect partly different aspects of MS disease, i.e.
inflammatory activity and the degree of damage to nervous system. Thus, disease activity and
disease progression are two different parameters, where the former can be assessed by relapse
frequency and number of MRI lesions and the latter by EDSS, showing degree of neurologi-
cal disability. The RRMS cohort was chosen for these analyzes, since both these parameters
are reflected and that it by far is the largest MS subgroup in this material.
CSF CXCL13 levels correlated to both MRI lesion number and MS disease
worsening (EDSS and relapse frequency) during a period of five years from follow up (Figure
2A-C). Considering this CXCL13 may be used as a biomarker for autoimmune CNS inflam-
mation. These results are of importance, since currently there is no prognostic marker for MS.
All MS treatments today act as immunomodulators, but does not reverse already ac-
quired neurological disability, i.e. healing of already damaged nerve connections. The ques-
tion of interest is to what degree CXCL13 at sampling can predict future disease activity as
this can help with treatment decisions. Another relevant question is if CXCL13 levels can
predict treatment response or even be used as a marker of treatment response. However, larger
longitudinal studies with repeated CSF sampling will be needed to answer these questions.
CXCL13 is a chemoattractant for lymphocytes and especially B cells 90. B lympho-
cytes synthesize IgG, i.e. antibody molecules. Analyzing IgG-index and OCB provides infor-
24

mation about intrathecal production of antibodies, which is one important aspect of inflamma-
tion apart from inflammatory cell numbers. In the present work CSF CXCL13 showed signif-
icant positive correlation with CSF cell counts and CSF IgG-index (Figure 3A-B). However,
as shown by the correlation coefficient, CSF CXCL13 versus CSF cell counts presented a
slightly better correlation than CSF CXCL13 versus CSF IgG-index.
CSF cell counts primarily reflect T cell quantity being the largest population in
CSF, whereas, B cells and monocytes constitute much smaller proportions. It would be of
interest to measure also B cell numbers in CSF, due to the fact that CXCL13 is a B cell che-
moattractant (ref). Flow cytometry is standard to differentiate T and B cells. However, this is
difficult to do in CSF due to the fact that cell numbers are a 1000 fold lower than in blood.
This is not performed in normal clinical praxis.
CXCL13 and CSF cell counts provided partly overlapping information on in-
flammatory disease activity in MS. Patients with high CXCL13 levels and high CSF cell
numbers both showed increased risk for a worse disease outcome (when indicated as relapse
frequency) (Figure 2A, 4). Patients with the highest numbers of relapses during five years
from onset presumably had the highest inflammatory activity and vice verse. This is the larg-
est study ever made on CSF cell counts in MS. This signifies that the result of CSF cell counts
correlating with clinical disease activity also is novel, and constitutes an interesting subject
for future analysis. Even if CSF cell counts correlated with relapse quantity, no correlation
with EDSS was shown (Figure 5). Thus, for now these findings suggests that it is more rele-
vant to use CXCL13 rather than cell counts, when predicting disease activity, since CXCL13
correlated with all parameters including EDSS, relapse frequency and MRI lesion quantity
(Figure 2A-C). Another issue is that cell counts can be performed in different ways using au-
tomated machines or manually by using cell counts chambers. It is therefore more difficult to
standardize than validating an ELISA, where standards can be used to validate the measure-
ments.
Considering IgG-index, neither EDSS nor relapse frequency showed any associ-
ation with risk for worse MS disease outcome (Figure 6, Figure 7). These possible associa-
tions were of interest to analyze due to the obtained results in Figure 3A and B, showing sig-
nificant positive correlations between CXCL13, cell counts and IgG-index in CSF.
High CXCL13 levels in CSF were related to the presence of oligoclonal bands
(OCB) in MS patients (including CIS) (Figure 8). The presence to OCB is believed to reflect
an autoimmune inflammation, even if it may also occur as a post-infectious phenomenon.
25

However, the presence of OCB is not a good prognostic marker for disease activity, due to
OCB being difficult to characterize. Furthermore, earlier studies have indicated that all MS
patients share the same clinical outcome, despite presence of OCB.
CIS is a pre stage for MS and majority of patients diagnosed CIS convert to MS
within a mean of 1.7 years 45. A possible correlation regarding disease conversion and
CXCL13 in CSF was of high importance for the present work. In the first analysis time to
conversion was not regarded. With time excluded, disease development occurred in at a sig-
nificantly higher rate in the CIS cohort with higher levels of CXCL13 in CSF (Figure 9A).
Considering the fact that CIS patients usually convert to MS within a mean of 1.7 years I
chose a time limit of 2 years for disease development in the second analysis. With time in-
cluded, conversion to MS showed a trend towards a correlation with CXCL13 (Figure 9B). In
summary, CSF CXCL13 was related to MS conversion and trend to conversion time.
In conclusion, this study showed that CXCL13 levels are elevated in MS pa-
tients displaying higher disease activity. Even if these findings need replication in other co-
horts data so far suggest that CXCL13 can be used as a prognostic marker, especially in
RRMS.
These results are of importance since they shed light on underlying disease processes
in MS, where there is a great need of biomarkers. There have been prior reports on biomark-
ers reflecting inflammation and impact on neurons in MS. Xx et al 2009, showed that neurofi-
lament light could be used as a prognostic biomarker for MS 85. However, other diseases also
showed significantly increased concentrations of neurofilament light in CSF 86, i.e. neurofila-
ment light is unreliable as a diagnostic MS biomarker. The conclusion is that it may be diffi-
cult to find a single prognostic marker that reflects all different aspects of MS. Instead the use
of several different biomarkers together (such as CSF CXCL13 and neurofilament light) could
give reliable prognostic information on disease activity and risk of future disability in MS. An
important use of such biomarkers would be to aid treatment decisions in MS.
In future work on prognostic and diagnostic biomarkers, response to treatments
etc, the file containing data on MS patients and controls made here can be of great value, pro-
viding critical information for these important and valuable studies on MS.
Starting this work I hoped if gaining valuable results on CSF CXCL13 as a
prognostic biomarker, analyzing levels of this chemokine may be done in hospitals all over
the world. With this thought in mind I wanted to use an easy and eligible method for the ana-
26

lyze. A method that is available in laboratories worldwide. Therefore, as a method for measur-
ing CXCL13 levels in CSF I chose enzymelinked immunosorbent assay (ELISA).
MS causes inflammation in the CNS with subsequent neurodegeneration, resulting in a
variable degree of neurological handicaps. CXCL13 may be a potential biomarker on inflam-
mation in MS. As inflammation is a treatable parameter, the disease pathway could be tar-
geted, consequently leading to prevention of handicap.
In conclusion, this study provides support for an association between CXCL13 levels
in the CSF and later development of disease severity in MS.
27

8 Conclusions
• In general CXCL13 is increased in CSF in MS, especially in RRMS during relapses.
•
• Levels of CSF CXCL13 correlates with CSF cell counts and CSF IgG-index.
•
• CXCL13 is a good candidate prognostic marker in MS, since newly diagnosed MS
with high CXCL13 levels show worsened disease course within five years.
• Individuals with oligoclonal bands (OCB) in CSF show much higher levels of
CXCL13 in CSF, compared to those without OCB.
•
• Most importantly, MS conversion occurs in higher rate in CIS patients with high
concentrations of CXCL13 in CSF, and in a shorter time point. This observation may
support an early treatment decision in these patients.
• These findings also support the use of CXCL13 as a biomarker in studies seeking to
identify the role of genetic risk factors for the development of intrathecal
inflammatory responses.
28

9 Acknowledgments
I am very grateful to Prof. Fredrik Piehl for his wonderful guidance and help as my supervi-
sor. I also would like to thank Mohsen Khademi for helping me with the laboratory work and
figures.
My further thanks go to Leszek Stawiarz for introducing me to Prof. Fredrik Piehl, Fre-
drick H. for always believing in me, Mom and Dad for all your love and push, Farmor for
always wanting to make her proud and Angela for being the best friend in the world.
29

10 References
1. Sadovnick, AD. Familial recurrence risks and inheritance of multiple sclerosis. Current Opinion
in Neurology & Neurosurgery (1993), 6(2) 189–194.
2. Lassmann, H., Raine, C. S., Antel, J. & Prineas, J. W. Immunopathology of multiple sclerosis:
report on an international meeting held at the Institute of Neurology of the University of
Vienna. J. Neuroimmunol. 86, 213–217 (1998).
3. Allan, S. M. & Rothwell, N. J. Cytokines and acute neurodegeneration. Nature Rev. Neurosci.
2, 734–744 (2001).
4. Zoppo, G. et al. Inflammation and stroke: putative role for cytokines, adhesion molecules and
iNOS in brain response to ischemia. Brain Pathol. 10, 95–112 (2000).
5. Yamout B, Itani S, Arabi A, Hamzeh D, Yaghi S. Prognostic factors of multiple sclerosis in
Lebanon. Int J Neurosci. 2010 Mar;120(3):206-10.
6. Baranzin, SE. The genetics of autoimmune diseases: a networked perspective. Current Opinion
in Immunology 2009, 21:596–605.
7. Nguyen, M. H., Julien, J.-P. & Rivest, S. Innate immunity: the missing link in neuroprotection
and neurodegeneration? Nature Rev. Neurosci. 3, 216–228 (2002).
8. De Jager PL, et. al. Integration of genetic risk factors into a clinical algorithm for multiple
sclerosis susceptibility: a weighted genetic risk score. Lancet Neurol. 2009 Dec;8(12):1111-9.
9. Hemmer B, Archelos JJ, Hartung HP. New concepts in the immunopathogenesis of multiple
sclerosis. Nat Rev Neurosci. 2002 Apr;3(4):291-301.
10. Kabat, E. A., Moore, D. H. & Landow, H. An electrophoretic study of the protein components
in cerebrospinal fluid and their relationship to the serum proteins. J. Clin. Invest. 21, 571–577
(1942).
11. Bar-Or A, Calabresi PA, Arnlod D, et al. Rituximab in relapsing-remitting multiple sclerosis: a
72-week, open-label, phase I trial. Ann Neurol 2008;63:395–400.
12. Hauser SL, Waubant E, Arnold DL, et al. B-cell depletion with rituximab in relapsing-remitting
multiple sclerosis. N Engl J Med 2008;358:676–688.
13. Swedish MS-registry www.msreg.net
14. Rieckmann P. Clinical trials in multiple sclerosis: Current and future requirements – potential
pitfalls. J Neurol (2008) 255 [Suppl 6]:66–68.
15. Gideon P, Thomsen C, Gjerris F, Sørensen PS, Henriksen O. Increased self-diffusion of brain
30
water in hydrocephalus measured by MR imaging. Acta Radiol. 1994 Nov;35(6):514-9.
16. Brown PD, Davies SL, Speake T, Millar ID. Molecular mechanisms of cerebrospinal fluid
production. Neuroscience. 2004;129(4):957-70.
17. Goetz, C.G. 2003. Textbook of Clinical Neurology. Elsevier Science Saunders, Philadelphia,
Pennsylvania.
18. May, C, JA. et al. 1990. Cerebrospinal fluid production is reduced in healthy aging. Neurology
40:500-503.
19. Strike, C. et. al. Intracranial oscillations of cerebrospinal fluid and blood flows: analysis with
magnetic resonance imaging. J Magn Reson Imaging 15:251-258.
20. Weller RO, et. al. 2009. Lymphatic drainage of the brain and the pathophysiology of
neurological disease. Acta Neuropathol 117:1-14.
21. Ransohoff, RM. Et. Al. 2003. Three or more routes of leukocyte migration inte the central
nervous system. Nat Rev Immunol 3:569-581.
22. Ewengelhardt, B. 2008. The blood-central nervous system barriers actively control immune cell
entry into the central nervous system. Curr Pharm Des 14:1555-1565.
23. Woodfin, A. et. al. 2009. Endothelial cell activation leads to neutrophil transmigration as
supported by the sequential roles of ICAM-2, JAM-A, and PECAM-1. Blood 113:6246-6257.
24. Engelhardt, B. et al. 2009. The blood-brain and the blood-cerebrospinal fluid barriers: function
and dysfunction. Semin Immunopathol.
25. Trapp, BD. Et. Al. 1998. Axonal transection in the lesions of multiple sclerosis. N Engl J Med
338:278-285.
26. Davidson, A et. al. 2001. Autoimmune diseases. N Engl J Med 345:340-350.
27. Reiber, H. 2003. Proteins in cerebrospinal fluid and blood: barriers, CSF flow rate and source-
related dynamics. Restor Neurol Neurosci 21:79-96.
28. Obermeier B, Mentele R, Malotka J, et al. Matching of oligoclonal immunoglobulin
transcriptomes and proteomes of cerebrospinal fluid in multiple sclerosis. Nat Med
2008;14:688–693.
29. Olsson T, Baig S, Hojeberg B, Link H. Antimyelin basic protein and antimyelin antibody-
producing cells in multiple sclerosis. Ann Neurol 1990;27:132–136.
30. von Budingen HC, Harrer MD, Kuenzle S, Meier M, Goebels N. Clonally expanded plasma
cells in the cerebrospinal fluid of MS patients produce myelin-specific antibodies. Eur J
Immunol 2008;38:2014–2023.
31. Andersson MJ. Et. al. 1994. Cerebrospinal fluid in the diagnosis of multiple sclerosis: a
consensus report. J Neurol Neurosurg Psychatry 57:897-902.
32. Fortini, AS. Et. al. 2003. Cerebrospinal fluid oligoclonal bands in the diagnosis of multiple
sclerosis. Isoelectric focusing with IgG immunoblotting compared with high-resolution agarose
31
gel electrophoresis and cerebrospinal fluid IgG index. Am J Clin Pathol 120:672-675.
33. Reiber, H. 2001. Dynamics of brain-derived proteins in cerebrospinal fluid. Clin Chim Acta
310:173-186.
34. Colombo, M. et al. Accumulation of clonally related B lymphocytes in the cerebrospinal fluid of
multiple sclerosis patients. J. Immunol. 164, 2782–2789 (2000). References 86–88 established
the occurrence of clonal expansion of B cells in the lesion and CSF of patients with MS.
35. Reiber H. et al. 2001. Cerebrospinal fluid analysis: disease-related data patterns and evaluation
programs. J Neurol Sci 184:101-122.
36. Schneider R, Euler B, Rauer S. Intrathecal IgM-synthesis does not correlate with the risk of
relapse in patients with a primary demyelinating event. Eur J Neurol. 2007 Aug;14(8):907-11.
37. Trapp, BD. Et. Al. 1998. Axonal transection in the lesions of multiple sclerosis. N Engl J Med
338:278-285.
38. Davidson, A et. al. 2001. Autoimmune diseases. N Engl J Med 345:340-350.
39. Lucchinetti CF, Gavrilova RH, Metz I, et al. Clinical and radiographic spectrum of
pathologically confirmed tumefactive multiple sclerosis. Brain 2008; 131: 1759–1775.
40. Bø L. The histopathology of grey matter demyelination in multiple sclerosis. Acta Neurol Scand
Suppl. 2009;(189):51-7.
41. Barkhof F. The clinico-radiological paradox in multiple sclerosis revisited. Curr Opin Neurol
(2002) 15:239–245.
42. Comi, G, Filippi, M, Barkhof, F, et al. Effect of early interferon treatment on conversion to
definite multiple sclerosis: a randomised study. Lancet 2001; 357: 1576–1582.
43. McDonald WI, Compston A, Edan G, Goodkin D, Hartung HP, Lublin FD, McFarland HF, Paty
DW, Polman CH, Reingold SC, Sandberg-Wollheim M, Sibley W, Thompson A, van den Noort
S, Weinshenker BY, Wolinsky JS. Recommended diagnostic criteria for multiple sclerosis:
guidelines from the International Panel on the diagnosis of multiple sclerosis. Ann Neurol. 2001
Jul;50(1):121-7.
44. Kurtzke, Beebe, Nagler, Kurland & Auth, 1983: Kurtzke, JF. Rating neurological impairment in
multiple sclerosis: an expanded disability status scale (EDSS). Neurology (1983), 33(11), 1444–
1452.
45. Miller D, Barkhof F, Montalban X, Thompson A, Filippi M. Clinically isolated syndromes sug-
gestive of multiple sclerosis, part I: natural history, pathogenesis, diagnosis, and prognosis.
Lancet Neurol. 2005 May;4(5):281-8.
46. (6 multi scler patients with anti: Jacobs LD, Beck RW, Simon JH, et al. Intramuscular interferon
beta 1a therapy initiated during a first demyelinating event in multiple sclerosis: CHAMPS
32

Study Group. New England Journal of Medicine 2000; 343: 898– 904.
47. 7 multi scler patients with anti:Comi G, Filippi M, Barkhof F, et al. Early treatment of multiple
sclerosis study group: effect of early interferon treatment on the conversion to definite multiple
sclerosis; a randomized study. Lancet 2001; 357: 1576–1582.
48. 8, multi scler patients with anti:Kappos L, Polman CH, Freedman MS, et al. Treatment with
interferon beta-1b delays conversion to clinically definite and McDonald MS in patients with
clinically isolated syndromes. Neurology 2006; 67: 1242–1249.
49. Noseworhty, JH. Et. al. 2000. Multiple Sclerosis. N Engl J Med 343:938-952.
50. Lublin, FD. 2005. Clinical features and diagnosis of multiple sclerosis. Neurol Clin 23:1-15, v.
51. Kuhlman, TG. Et. al. 2002. Acute axonal damage in multiple sclerosis is the most extensive in
early disease stages and decreases over time. Brain. 125:2202-2212.
52. Trapp, BD. Et. Al. 1998. Axonal transection in the lesions of multiple sclerosis. N Engl J Med
338:278-285.
53. Lucchinettei, CF. et. al. 2004. Evidence for pathogenic heterogeneity in multiple sclerosis. Ann
Neurol 56:308.
54. Lucchinetti, C. et. al. 2004. The pathology primary progressive multiple sclerosis. Mult Scler 10
Suppl 1:23-30.
55. Lublin, FD. Et. al. 1996. Defining the clinical course of multiple sclerosis: results of an
international survey. National Multiple Sclerosis Society (USA) Advisory Committee on
Clinical Trials of New Agents in Multiple Sclerosis. Neurology 46:907:911.
56. Weinshenker, JH. Et. al. 2000. Multiple Sclerosis. N Engl J Med 343:938-952.
57. Miller DH. Et. al. 2007. Primary-progressive multiple sclerosis. Lancet Neurol 6:903-912.
58. Sadovnick AD, Baird PA, Ward RH. Multiple sclerosis: Updated risks for relatives. Am. J.
Med. Genet. 29, 533–541 (1988).
59. De Jager PL, Jia X, Wang J, de Bakker PI, Ottoboni L, Aggarwal NT, Piccio L, Raychaudhuri
S, Tran D, Aubin C et al. Meta-analysis of genome scans and replication identify CD6 IRF8 and
TNFRSF1A as new multiple sclerosis susceptibility loci. Nat Genet 2009, 41:776-782.
60. ANZgene. Genome-wide association study identifies new multiple sclerosis susceptibility loci
on chromosomes 12 and 20. Nat Genet 2009, 41:824-828.
61. Comabella M, Craig DW, Camina-Tato M, Morcillo C, Lopez C, Navarro A, Rio J, Montalban
X, Martin R. Identification of a novel risk locus for multiple sclerosis at 13q31.3 by a pooled
genome-wide scan of 500,000 single nucleotide polymorphisms. PLoS One 2008, 3:e3490.
62. Hafler DA, Compston A, Sawcer S, Lander ES, Daly MJ, De Jager PL, de Bakker PI, Gabriel
SB, Mirel DB, Ivinson AJ et al. Risk alleles for multiple sclerosis identified by a genomewide
study. N Engl J Med 2007, 357:851-862.
33

63. Hillert, J. 2009. The Genetics of Multiple Sclerosis. Results Probl Cell Differ.
64. International Multiple Sclerosis Genetics Consortium, D. A. Hafler, A. Compston, S. Sawcer, E.
S. Lander, M. J. Daly, P. L. De Jager, P. I. de Bakker, S. B. Gabriel, D. B. Mirel, A. J. Ivinson,
M. A. Pericak-Vance, S. G. Gregory, J. D. Rioux, J. L.McCauley, J. L. Haines, L. F. Barcellos,
B. Cree, J. R. Oksenberg, S. L. Hauser, Risk alleles for multiple sclerosis identified by a
genomewide study. N. Engl. J. Med. 357, 851–862 (2007).
65. M. R. Lincoln, A. Montpetit,M. Z. Cader, J. Saarela, D. A. Dyment, M. Tiislar, V. Ferretti, P. J.
Tienari, A. D. Sadovnick, L. Peltonen, G. C. Ebers, T. J. Hudson, A predominant role for the
HLA class II region in the association of the MHC region with multiple sclerosis. Nat. Genet.
37, 1108–1112 (2005).
66. F. Lundmark, K. Duvefelt, E. Iacobaeus, I. Kockum, E.Wallström, M. Khademi, A. Oturai, L.
P. Ryder, J. Saarela, H. F. Harbo, E. G. Celius, H. Salter, T. Olsson, J. Hillert, Variation in
interleukin 7 receptor a chain (IL7R) influences risk of multiple sclerosis. Nat. Genet. 39, 1108–
1113 (2007).
67. Jagodic M, et. al. A Role for VAV1 in Experimental Autoimmune Encephalomyelitis and
Multiple Sclerosis. Sci Transl Med 1, 10ra21 (2009).
68. Sawcer S et. al. International Multiple Sclerosis Genetics Consortium, A high-density screen for
linkage in multiple sclerosis. Am. J. Hum. Genet. 77, 454–467 (2005).
69. (4,ms patient with antilipid..:
70. Rivers, T. M., Sprunt, D. H. & Gerry, B. P. Observations on attempts to produce acute
disseminated encephalomyelitis in monkeys. J. Exp. Med. 58, 39–53 (1933).
71. I. Dahlman, L. Jacobsson, A. Glaser, J. C. Lorentzen, M. Andersson, H. Luthman, T. Olsson,
Genome-wide linkage analysis of chronic relapsing experimental autoimmune
encephalomyelitis in the rat identifies a major susceptibility locus on chromosome9. J.
Immunol. 162, 2581–2588 (1999).
72. I. Dahlman, E.Wallström, R.Weissert,M. Storch, B. Kornek, L. Jacobsson, C. Linington, H.
Luthman, H. Lassmann, T. Olsson, Linkage analysis of myelin oligodendrocyte glycoprotein-
induced experimental autoimmune encephalomyelitis in the rat identifies a locus controlling
demyelination on chromosome 18. Hum. Mol. Genet. 8, 2183–2190 (1999).
73. K. Bergsteinsdottir, H. T. Yang, U. Pettersson, R. Holmdahl, Evidence for common
autoimmune disease genes controlling onset, severity, and chronicity based on experimental
models for multiple sclerosis and rheumatoid arthritis. J. Immunol. 164, 1564–1568 (2000).
74. K. Becanovic, E. Wallstrom, B. Kornek, A. Glaser, K. W. Broman, I. Dahlman, P. Olofsson, R.
Holmdahl, H. Luthman, H. Lassmann, T. Olsson, New loci regulating rat myelin
oligodendrocyte glycoprotein-induced experimental autoimmune encephalomyelitis. J.
Immunol. 170, 1062–1069 (2003).
34

75. Acheson, ED. Et. al. 1960. Some comments on the relationship of the distribution of multiple
sclerosis to latitude, solar radiation, and other variables. Acta Psychiatr Scand Suppl 35:132-
147.
76. Pierrot-Deseilligny, C. 2009. Clinical implications of a possible role of vitamine D in multiple
sclerosis. J Neurol 256:1468-1479.
77. Hedstrom, AK. Et. al. 2009. Tobacco smoking, but not Swedish snuff use, increase the risk of
multiple sclerosis. Neurology 73:696-701.
78. Ascherio, A. et. al. 2007. Enviromental risk factors for multiple sclerosis. Part II: Noninfectious
factors. Ann Neurol 61:504-513.
79. Compston, DA. Et. al. 2002. Elimination of childhood diseases: possible influence on the
incidence of multiple sclerosis soon detectable. Neuroepidemiology 21:306-309.
80. Ascherio A, Munger KL. Epstein-Barr Virus Infection and Multiple Sclerosis: A Review. J
Neuroimmune Pharmacol. 2010 Apr 6. [Epub ahead of print]
81. Sundstrom, P. et. al. 2004. An altered immune response to Epstein-Barr virus in multiple
sclerosis: a prospective study. Neurology 62:2277-2282.
82. Ahlgren, CJ. Et. al. 2002. Elimination of childhood diseases: possible influence on the incidence
of multiple sclerosis soon detectable. Neuroepidemiology 21:306-309.
83. Martin, RB. Et. al. 2006. Biomarkers in multiple sclerosis. Dis Markers 22:183-185.
84. Teunissen, CEC. Et. al. 2005. Biological markers in CSF and blood axonal degregation in
multiple sclerosis. Lancet Neurol 4:32-41.
85. Salzer, J. et. al. 2010. Neurofilament light as a prognostic marker in multiple sclerosis. Mult
Scler 2010; 16; 287-292.
86. Elevated neurofilament levels in neurological diseases.Norgren N, Rosengren L, Stigbrand
T.Brain Res. 2003 Oct 10;987(1):25-31.
87. Hemmer B, Archelos JJ, Hartung HP. New concepts in the immunopathogenesis of multiple
sclerosis. Nat Rev Neurosci. 2002 Apr;3(4):291-301.
88. Gunn MD, Ngo VN, Ansel KM, Ekland EH, Cyster JG, Williams LT. A B-cell-homing
chemokine made in lymphoid follicles activates Burkitt's lymphoma receptor-1. Nature. 1998
Feb 19;391(6669):799-803.
89. Legler DF, Loetscher M, Roos RS, Clark-Lewis I, Baggiolini M, Moser B. B cell-attracting
chemokine 1, a human CXC chemokine expressed in lymphoid tissues, selectively attracts B
lymphocytes via BLR1/CXCR5. J Exp Med. 1998 Feb 16;187(4):655-60.
90. Gunn MD, Ngo VN, Ansel KM, et al. A B-cell-homing chemokine made in lymphoid follicles
activates burkitt’s lymphoma receptor-1. Nature 1998; 391: 799–803.
91. Ransohoff RM, Kivisakk P, Kidd G. Three or more routes for leukocyte migration into the
central nervous system. Nat Rev Immunol 2003;3:569–581.
35

92. Sellebjerg F, Börnsen L, Khademi M, Krakauer M, Olsson T, Frederiksen JL, Sørensen PS.
Increased cerebrospinal fluid concentrations of the chemokine CXCL13 in active MS.
Neurology. 2009 Dec 8;73(23):2003-10.
93. Dobner T, Wolf I, Emrich T, Lipp M. Differentiation-specific expression of a novel G protein-
coupled receptor from Burkitt's lymphoma. Eur J Immunol. 1992 Nov;22(11):2795-9.
94. Magliozzi R, Columba-Cabezas S, Serafini B, Aloisi F. Intracerebral expression of CXCL13
and BAFF is accompanied by formation of lymphoid follicle-like structures in the meninges of
mice with relapsing experimental autoimmune encephalomyelitis. J Neuroimmunol 2004; 148:
11–23.
95. Krumbholz M, Theil D, Cepok M, et al. Chemokines in multiple sclerosis: CXCL12 and
CXCL13 Up-regulation is differentially linked to CNS immune cell recruitment. Brain 2006;
129: 200–211.
96. Ljostad U, Mygland A. CSF B-lymphocyte chemoattractant (CXCL13) in the early diagnosis of
acute lyme neuroborreliosis. J Neurol 2008; 255: 732–737.
97. Rupprecht TA, Pfister HW, Angele B, et al. The chemokine CXCL13 (BLC): a putative
diagnostic marker for neuroborreliosis. Neurology 2005; 65: 448–450.
98. R&D Systems Quantikine Human CXCL13/BLCBCA-1. Catalog Number DCX130.
99. Sellebjerg F, Börnsen L, Khademi M, Krakauer M, Olsson T, Frederiksen JL, Sørensen PS.
Increased cerebrospinal fluid concentrations of the chemokine CXCL13 in active MS. Neurolo-
gy. 2009 Dec 8;73(23):2003-10.
100. Duddy M, Niino M, Adatia F, et al. Distinct effector cytokine profiles of memory and naive
human B cell subsets and implication in multiple sclerosis. J Immunol 2007; 178:6092– 6099.
101. Krumbholz M, Theil D, Cepok S, et al. Chemokines in multiple sclerosis: CXCL12 and
CXCL13 up-regulation is differentially linked to CNS immune cell recruitment. Brain
2006;129:200 –211.
102. Rupprecht TA, Pfister HW, Angele B, et al. The chemokine CXCL13 (BLC): a putative diagnos-
tic marker for neuroborreliosis. Neurology 2005;65:448–450.
36

11 Figures
Figure 1A CXCL13 in CSF (all cohorts)
37
Figure 1B CXCL13 in CSF (all MS cohorts and viral/bacterial central nervous system infections cohort)

Figure 1C CXCL13 in CSF (all MS cohorts)
Figure 2A CSF CXCL13 versus number of relapses during 5 years (RRMS cohort)
38
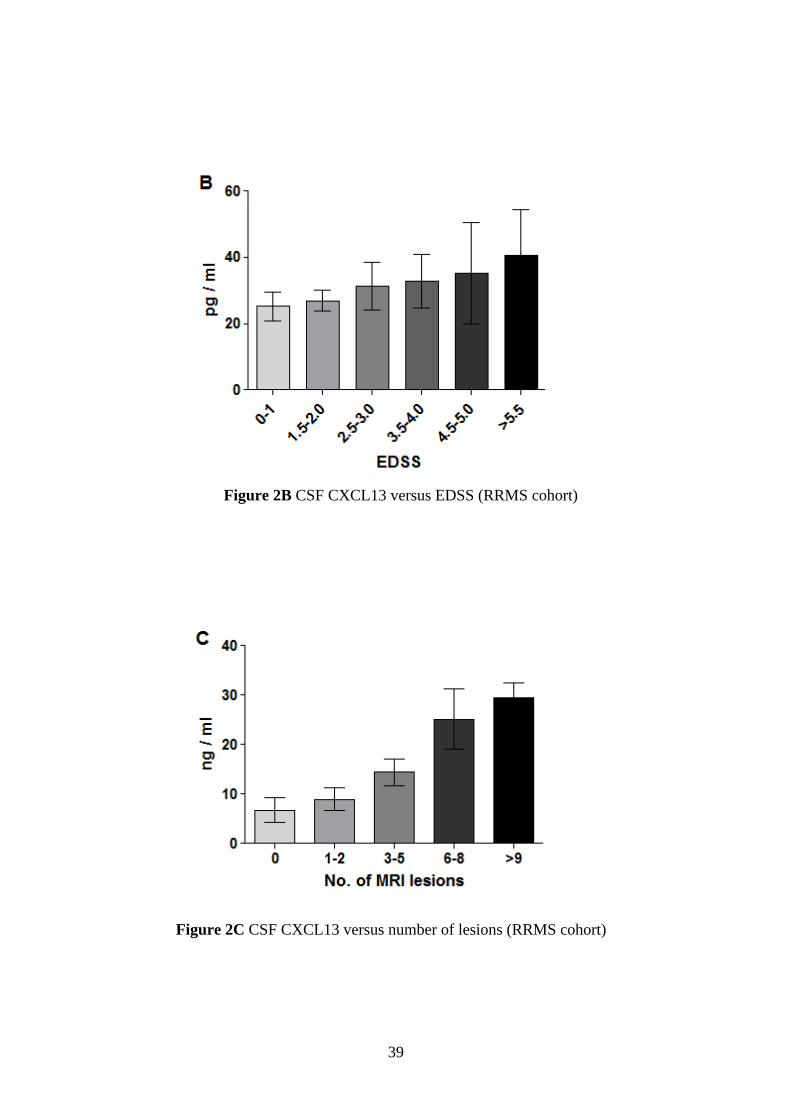
Figure 2B CSF CXCL13 versus EDSS (RRMS cohort)
Figure 2C CSF CXCL13 versus number of lesions (RRMS cohort)
39
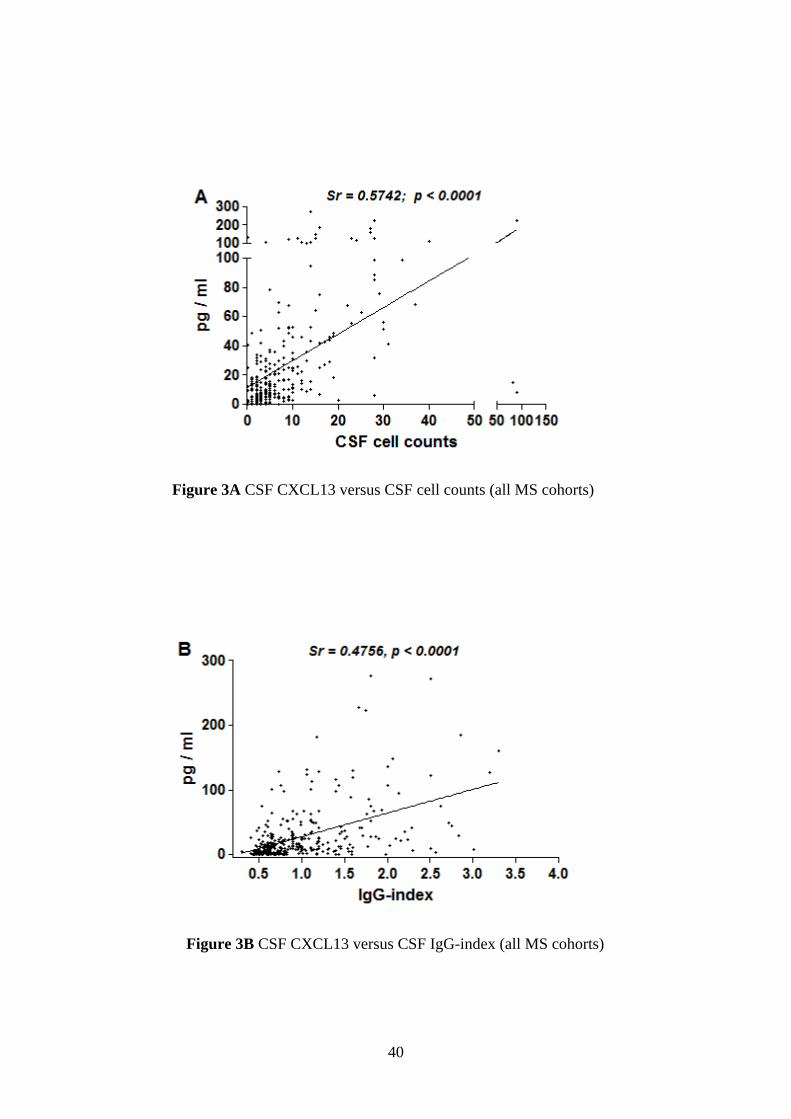
Figure 3A CSF CXCL13 versus CSF cell counts (all MS cohorts)
Figure 3B CSF CXCL13 versus CSF IgG-index (all MS cohorts)
40

Figure 4 CSF cell counts versus number of relapses during 5 years (RRMS cohort)
Figure 5 CSF cell counts versus EDSS (RRMS cohort)
41

Figure 6 CSF IgG-index versus number of relapses during 5 years (RRMS cohort)
Figure 7 CSF IgG-index versus EDSS (RRMS cohort)
42

Figure 8 CSF CXCL13 versus oligoclonal bands (OCB (all MS cohort and CIS cohort)
Figure 9A CSF CXCL13 versus conversion to MS (CIS cohort)
43

Figure 9B CXCL13 in CSF versus conversion time to MS (CIS cohort)
44