Embed Size (px)
Citation preview
7/27/2019 Cwo of Phenol in an Trickle
http://slidepdf.com/reader/full/cwo-of-phenol-in-an-trickle 1/10
Water Research 37 (2003) 319–328
Catalytic wet oxidation of phenol in a trickle bed reactor over a
Pt/TiO2 catalyst
Clayton B. Maugans, Aydin Akgerman*
Chemical Engineering Department, Texas A&M University, College Station, TX 77843-3122, USA
Received 1 January 2002; received in revised form 1 June 2002; accepted 14 June 2002
Abstract
Catalytic wet oxidation of phenol was studied in a batch and a trickle bed reactor using 4.45% Pt/TiO2 catalyst in the
temperature range 150–2051C. Kinetic data were obtained from batch reactor studies and used to model the reaction
kinetics for phenol disappearance and for total organic carbon disappearance. Trickle bed experiments were then
performed to generate data from a heterogeneous flow reactor. Catalyst deactivation was observed in the trickle bed
reactor, although the exact cause was not determined. Deactivation was observed to linearly increase with the
cumulative amount of phenol that had passed over the catalyst bed. Trickle bed reactor modeling was performed using
a three-phase heterogeneous model. Model parameters were determined from literature correlations, batch derived
kinetic data, and trickle bed derived catalyst deactivation data. The model equations were solved using orthogonal
collocations on finite elements. Trickle bed performance was successfully predicted using the batch derived kinetic
model and the three-phase reactor model. Thus, using the kinetics determined from limited data in the batch mode, it is
possible to predict continuous flow multiphase reactor performance.
r 2002 Elsevier Science Ltd. All rights reserved.
Keywords: Phenol; Trickle bed reactors; Wet oxidation; Catalytic wet oxidation; Multiphase reactors
1. Introduction
Organic compounds are common pollutants in
industrial waste streams and waste sites. To remove
the pollutants there are many remediation technologies,
of which only reactive destruction results in the
mineralization of the waste. Bioremediation and incin-eration are two typical examples of reactive destruction
technologies. However, both these remediation technol-
ogies have their limitations and are not always the
optimal solution. Bioremediation is ideally suited for
low concentrations, with maximum concentrations as
low as 50 ppm in some examples [1]. Incineration is ideal
for highly concentrated liquid streams, typically around
350,000ppm or higher chemical oxygen demand (COD)
content before the energy requirements become self-
sustaining [2]. Neither process is optimal when the toxic
organic compound concentration falls between the
extremes. Some alternative destruction technologies
have also been studied in the field including wet air
oxidation (WAO), and supercritical water oxidation
(SCWO). WAO involves treating the aqueous organicswith air at elevated temperature and pressures [3–12]
and SCWO is the same, but occurring above the critical
point of water [13–20].
A natural extension to WAO is catalytic wet oxidation
(CWO), which is similar to WAO but with the addition
of a catalyst. The catalyst allows milder operating
conditions than WAO while yielding similar if not
superior kinetic performance. CWO research has been
conducted on a variety of organic compounds using
numerous catalysts with varying results [21–39]. CWO is
in use today as a treatment technology in certain
applications such as coal gas effluent oxidation in Japan
*Corresponding author. Tel.: +1-979-845-3375; fax: +1-
979-845-6446.
E-mail address:[email protected] (A. Akgerman).
0043-1354/02/$ - see front matter r 2002 Elsevier Science Ltd. All rights reserved.
PII: S 0 0 4 3 - 1 3 5 4 ( 0 2 ) 0 0 2 8 9 - 0
7/27/2019 Cwo of Phenol in an Trickle
http://slidepdf.com/reader/full/cwo-of-phenol-in-an-trickle 2/10
and Britain, as well as for cyanide wastewater oxidation
in Japan [27], and for destroying organic undesirables
in an ammonium sulfate crystal production facility in
Italy [9].
In this research heterogeneous CWO was studied as
an organic wastewater treatment technology using
phenol as a model compound. Phenol was selected
because it is a common industrial pollutant, is toxic, and
is difficult to biodegrade at high-concentration levels.
This model compound was studied in two different
reactor configurations; first a batch reactor was used to
determine technology viability as well as determination
of the reaction kinetics, then a flow reactor system was
developed primarily for model confirmation and scale-
up, but also to evaluate this technology in a industrially
more practical flow reactor system. One of the objectives
of this study was to determine whether trickle bedreactor operation can be predicted from kinetics in terms
of lumped parameters, such as total organic carbon
(TOC), determined in a batch reactor by a limited
number of experiments.
2. Reaction kinetics from batch experiments: phenol
destruction
Batch experiments originally performed using pow-
dered catalyst yielded the kinetic expression reported in
Maugans and Akgerman [30]. A reevaluation of
those data in this paper suggests that Eq. (1) is a more
suitable kinetic model. The rate expression was reder-
ived using the following mechanism based on reaction
between adsorbed phenol and disassociatively adsorbed
oxygen.
I: Ph þ SÃ"PhSÃ;
II: O2 þ 2SÃ"2OSÃ;
III: PhSÃ þ OSÃ-ASÃ þ SÃ;
IV: ASÃ"A þ SÃ:
If it is assumed that the surface reaction, reaction III is
the rate determining step, all other reactions are in
dynamic equilibrium, and rate IV is very fast, then the
following rate expression is obtained:
ratePh;intrinsic ¼qC Ph
W
V L
qt
¼ÀK 1C Ph
ffiffiffiffiffiffiffiffiffiffiC Oxy
p ð1 þ K PhC Ph þ
ffiffiffiffiffiffiffiffiffiffiffiffiffi ffiffiffiffiffiffiffiK OxyC Oxy
p Þ2
: ð1Þ
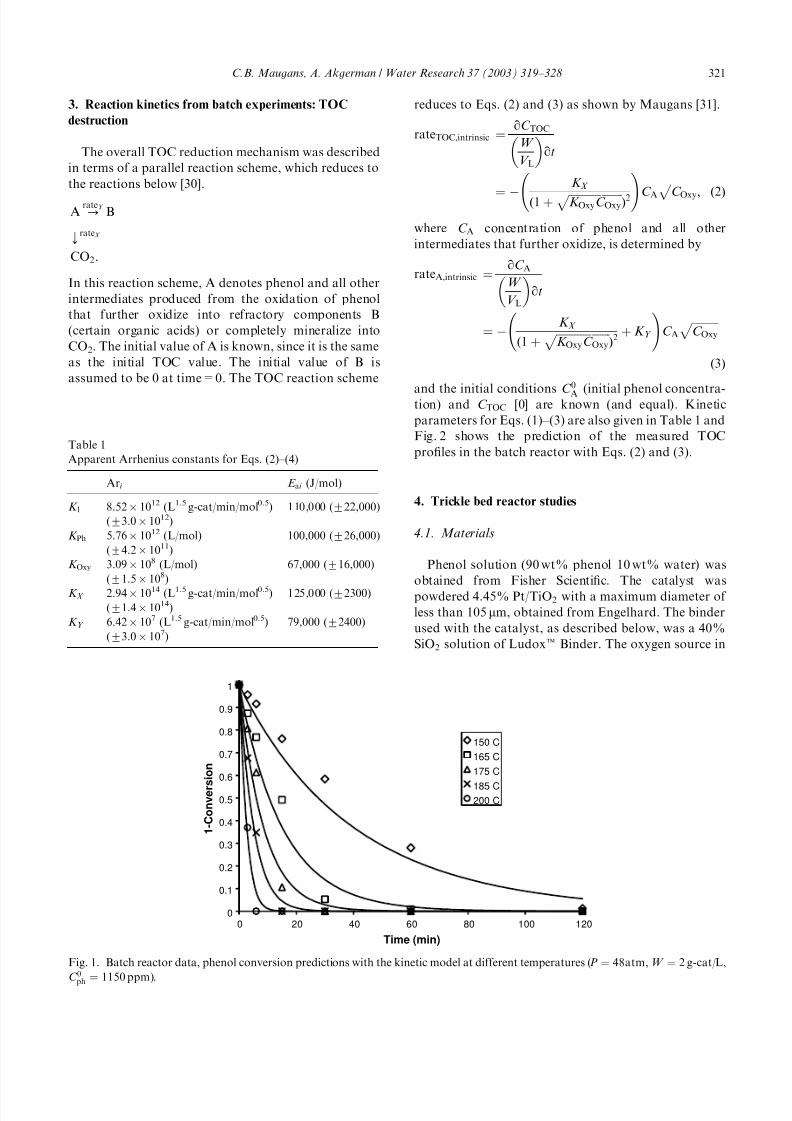
Parameters were determined from the original
batch reactor data reported by Maugans and Akgerman
[30–31] and are given in Table 1. Fig. 1 shows prediction
of experimental phenol conversion in the batch reactor
with Eq. (1).
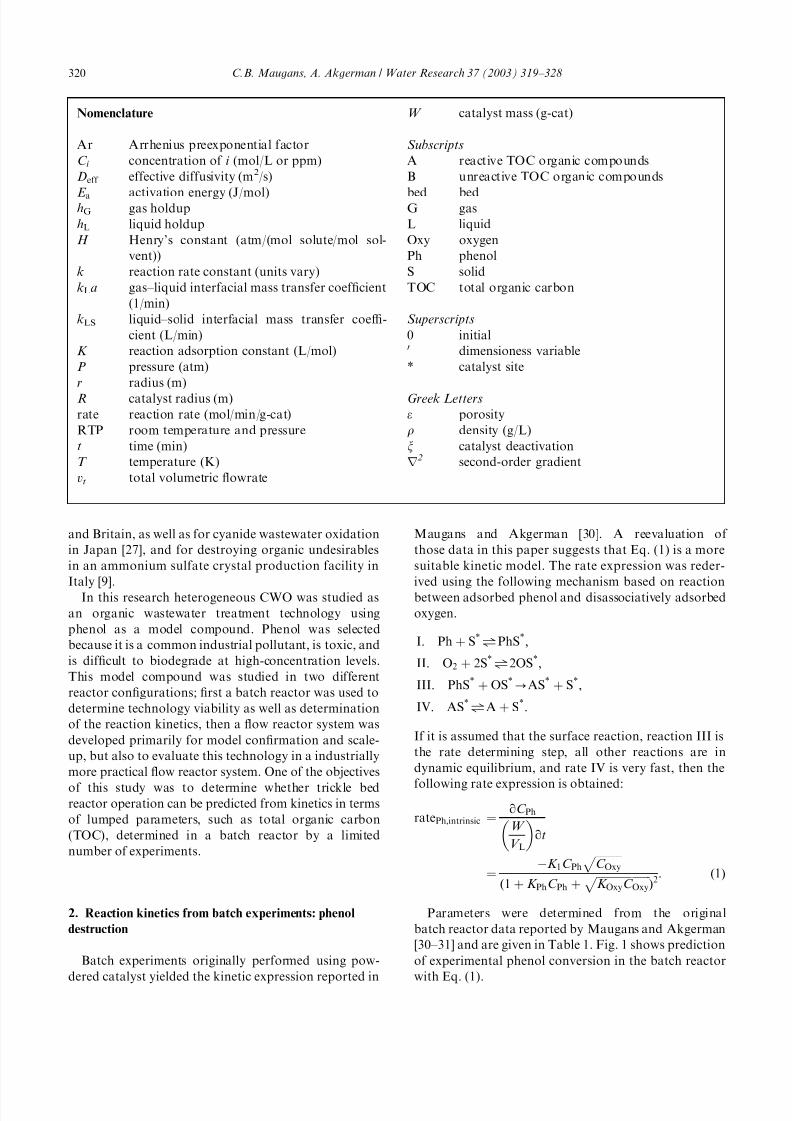
Nomenclature
Ar Arrhenius preexponential factor
C i concentration of i (mol/L or ppm)
Deff effective diffusivity (m2/s)
E a activation energy (J/mol)hG gas holdup
hL liquid holdup
H Henry’s constant (atm/(mol solute/mol sol-
vent))
k reaction rate constant (units vary)
k La gas–liquid interfacial mass transfer coefficient
(1/min)
k LS liquid–solid interfacial mass transfer coeffi-
cient (L/min)
K reaction adsorption constant (L/mol)
P pressure (atm)
r radius (m)
R catalyst radius (m)
rate reaction rate (mol/min/g-cat)
RTP room temperature and pressure
t time (min)
T temperature (K)
vt total volumetric flowrate
W catalyst mass (g-cat)
Subscripts
A reactive TOC organic compounds
B unreactive TOC organic compounds
bed bedG gas
L liquid
Oxy oxygen
Ph phenol
S solid
TOC total organic carbon
Superscripts
0 initial0 dimensioness variable
* catalyst site
Greek Letters
e porosity
r density (g/L)
x catalyst deactivation
r 2 second-order gradient
C.B. Maugans, A. Akgerman / Water Research 37 (2003) 319–328320
7/27/2019 Cwo of Phenol in an Trickle
http://slidepdf.com/reader/full/cwo-of-phenol-in-an-trickle 3/10
3. Reaction kinetics from batch experiments: TOC
destruction
The overall TOC reduction mechanism was described
in terms of a parallel reaction scheme, which reduces to
the reactions below [30].
A -rateY
B
krateX
CO2:
In this reaction scheme, A denotes phenol and all other
intermediates produced from the oxidation of phenol
that further oxidize into refractory components B
(certain organic acids) or completely mineralize into
CO2. The initial value of A is known, since it is the same
as the initial TOC value. The initial value of B is
assumed to be 0 at time=0. The TOC reaction scheme
reduces to Eqs. (2) and (3) as shown by Maugans [31].
rateTOC;intrinsic ¼qC TOC
W
V L
qt
¼ À
K X
ð1 þ ffiffiffiffiffiffiffiffiffiffiffiffi ffiffiffiffiffiffiffiffi
K OxyC Oxy
p Þ2
!C A
ffiffiffiffiffiffiffiffiffiffiC Oxy
p ;
ð2Þ
where C A concentration of phenol and all other
intermediates that further oxidize, is determined by
rateA;intrinsic ¼qC AW
V L
qt
¼ ÀK X
ð1 þ ffiffiffiffiffiffiffiffiffiffiffiffiffi ffiffiffiffiffiffiffi
K OxyC Oxy
p Þ2þ K Y
!C A
ffiffiffiffiffiffiffiffiffiffiC Oxy
p ð3Þ
and the initial conditions C 0
A (initial phenol concentra-tion) and C TOC [0] are known (and equal). Kinetic
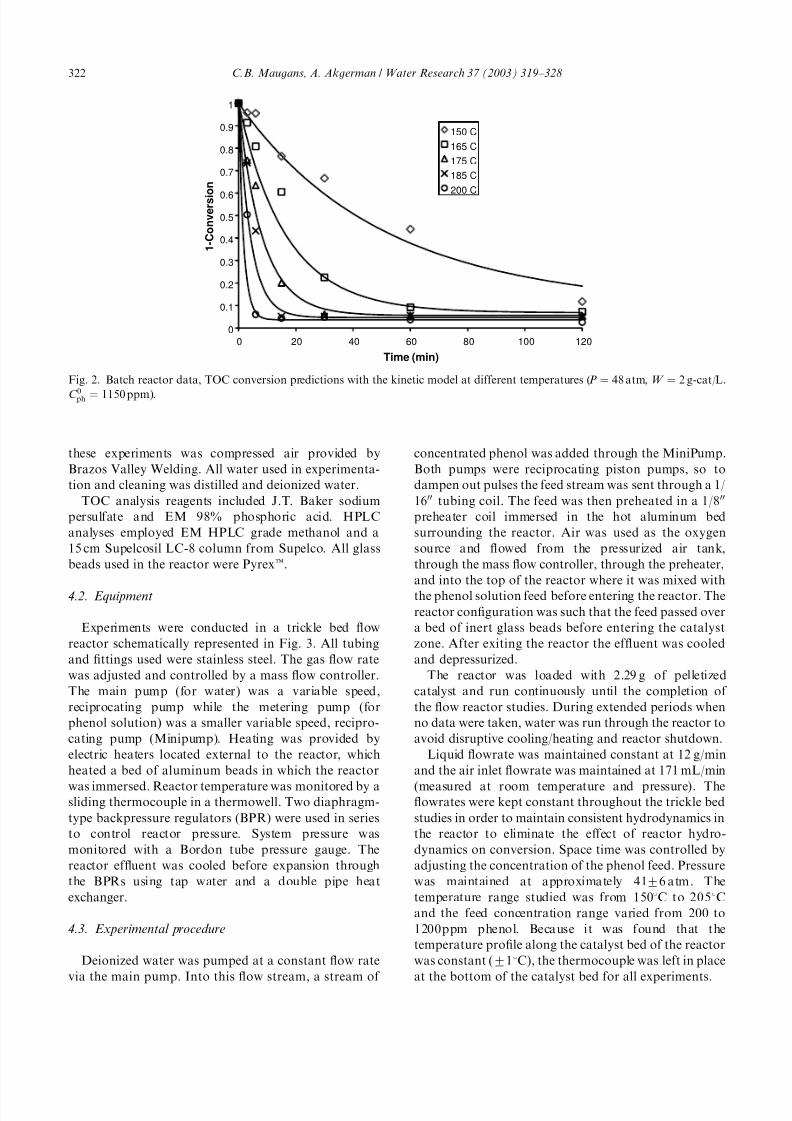
parameters for Eqs. (1)–(3) are also given in Table 1 and
Fig. 2 shows the prediction of the measured TOC
profiles in the batch reactor with Eqs. (2) and (3).
4. Trickle bed reactor studies
4.1. Materials
Phenol solution (90 wt% phenol 10 wt% water) was
obtained from Fisher Scientific. The catalyst was
powdered 4.45% Pt/TiO2 with a maximum diameter of
less than 105 mm, obtained from Engelhard. The binder
used with the catalyst, as described below, was a 40%
SiO2 solution of Ludoxt Binder. The oxygen source in
Table 1
Apparent Arrhenius constants for Eqs. (2)–(4)
Ari E ai (J/mol)
K 1 8.52Â 1012 (L1.5 g-cat/min/mol0.5) 110,000 (722,000)
(73.0Â 1012)
K Ph 5.76Â 1012 (L/mol) 100,000 (726,000)
(74.2Â 1011)
K Oxy 3.09Â 108 (L/mol) 67,000 (716,000)
(71.5Â 108)
K X 2.94Â 1014 (L1.5 g-cat/min/mol0.5) 125,000 (72300)
(71.4Â 1014)
K Y 6.42Â 107 (L1.5 g-cat/min/mol0.5) 79,000 (72400)
(73.0Â 107)
0
0.1
0.2
0.3
0.4
0.5
0.6
0.7
0.8
0.9
1
0 20 40 60 80 100 120
Time (min)
1 - C o n v e r s i o n
150 C
165 C
175 C
185 C200 C
Fig. 1. Batch reactor data, phenol conversion predictions with the kinetic model at different temperatures (P ¼ 48atm, W ¼ 2 g-cat/L,
C
0
ph ¼ 1150 ppm).
C.B. Maugans, A. Akgerman / Water Research 37 (2003) 319–328 321
7/27/2019 Cwo of Phenol in an Trickle
http://slidepdf.com/reader/full/cwo-of-phenol-in-an-trickle 4/10
these experiments was compressed air provided by
Brazos Valley Welding. All water used in experimenta-
tion and cleaning was distilled and deionized water.
TOC analysis reagents included J.T. Baker sodium
persulfate and EM 98% phosphoric acid. HPLC
analyses employed EM HPLC grade methanol and a
15 cm Supelcosil LC-8 column from Supelco. All glass
beads used in the reactor were Pyrext.
4.2. Equipment
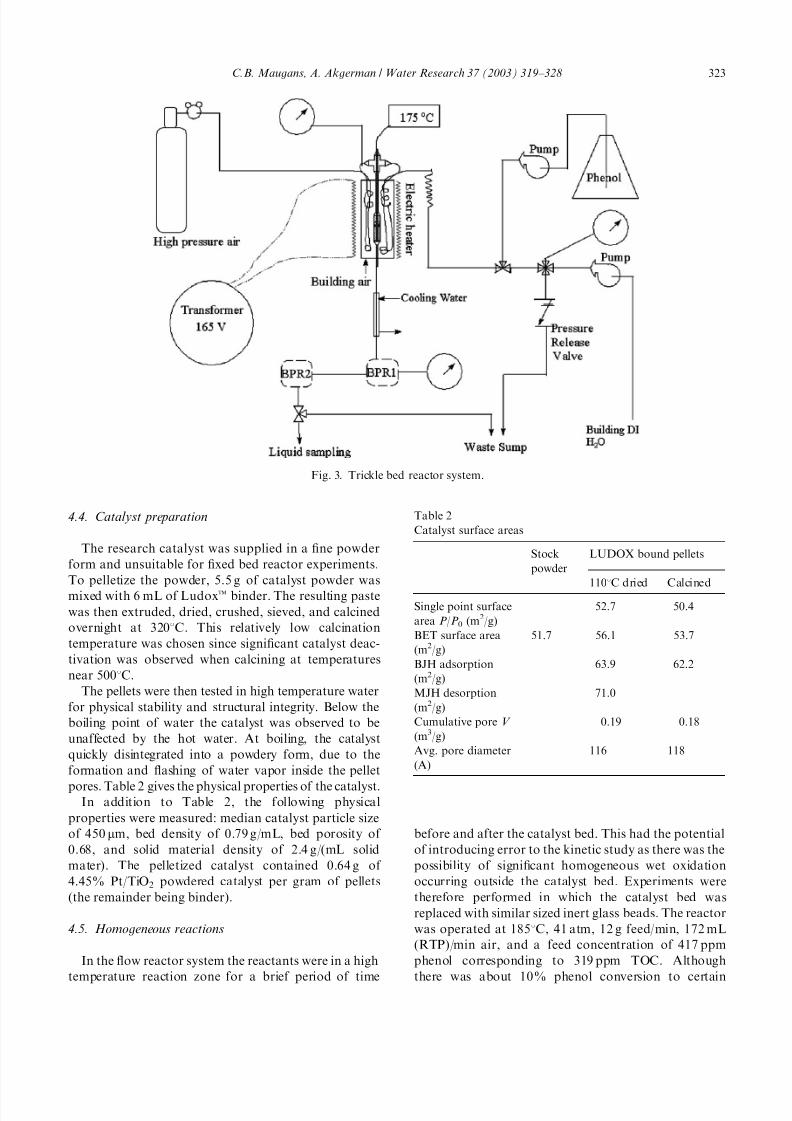
Experiments were conducted in a trickle bed flow
reactor schematically represented in Fig. 3. All tubing
and fittings used were stainless steel. The gas flow rate
was adjusted and controlled by a mass flow controller.
The main pump (for water) was a variable speed,
reciprocating pump while the metering pump (for
phenol solution) was a smaller variable speed, recipro-
cating pump (Minipump). Heating was provided by
electric heaters located external to the reactor, which
heated a bed of aluminum beads in which the reactor
was immersed. Reactor temperature was monitored by asliding thermocouple in a thermowell. Two diaphragm-
type backpressure regulators (BPR) were used in series
to control reactor pressure. System pressure was
monitored with a Bordon tube pressure gauge. The
reactor effluent was cooled before expansion through
the BPRs using tap water and a double pipe heat
exchanger.
4.3. Experimental procedure
Deionized water was pumped at a constant flow rate
via the main pump. Into this flow stream, a stream of
concentrated phenol was added through the MiniPump.
Both pumps were reciprocating piston pumps, so to
dampen out pulses the feed stream was sent through a 1/
1600 tubing coil. The feed was then preheated in a 1/800
preheater coil immersed in the hot aluminum bed
surrounding the reactor. Air was used as the oxygen
source and flowed from the pressurized air tank,
through the mass flow controller, through the preheater,
and into the top of the reactor where it was mixed with
the phenol solution feed before entering the reactor. The
reactor configuration was such that the feed passed over
a bed of inert glass beads before entering the catalyst
zone. After exiting the reactor the effluent was cooled
and depressurized.
The reactor was loaded with 2.29 g of pelletized
catalyst and run continuously until the completion of
the flow reactor studies. During extended periods when
no data were taken, water was run through the reactor to
avoid disruptive cooling/heating and reactor shutdown.
Liquid flowrate was maintained constant at 12 g/min
and the air inlet flowrate was maintained at 171 mL/min
(measured at room temperature and pressure). Theflowrates were kept constant throughout the trickle bed
studies in order to maintain consistent hydrodynamics in
the reactor to eliminate the effect of reactor hydro-
dynamics on conversion. Space time was controlled by
adjusting the concentration of the phenol feed. Pressure
was maintained at approximately 4176 atm. The
temperature range studied was from 1501C to 2051C
and the feed concentration range varied from 200 to
1200ppm phenol. Because it was found that the
temperature profile along the catalyst bed of the reactor
was constant (711C), the thermocouple was left in place
at the bottom of the catalyst bed for all experiments.
0
0.1
0.2
0.3
0.4
0.5
0.6
0.7
0.8
0.9
1
0 20 40 60 80 100 120
Time (min)
1 - C o n v e r s i o n
150 C
165 C
175 C
185 C
200 C
Fig. 2. Batch reactor data, TOC conversion predictions with the kinetic model at different temperatures (P ¼ 48 atm, W ¼ 2 g-cat/L.
C 0ph ¼ 1150 ppm).
C.B. Maugans, A. Akgerman / Water Research 37 (2003) 319–328322
7/27/2019 Cwo of Phenol in an Trickle
http://slidepdf.com/reader/full/cwo-of-phenol-in-an-trickle 5/10
4.4. Catalyst preparation
The research catalyst was supplied in a fine powder
form and unsuitable for fixed bed reactor experiments.
To pelletize the powder, 5.5 g of catalyst powder was
mixed with 6 mL of Ludoxt binder. The resulting paste
was then extruded, dried, crushed, sieved, and calcined
overnight at 3201C. This relatively low calcination
temperature was chosen since significant catalyst deac-
tivation was observed when calcining at temperatures
near 5001C.
The pellets were then tested in high temperature water
for physical stability and structural integrity. Below the
boiling point of water the catalyst was observed to be
unaffected by the hot water. At boiling, the catalyst
quickly disintegrated into a powdery form, due to the
formation and flashing of water vapor inside the pellet
pores. Table 2 gives the physical properties of the catalyst.In addition to Table 2, the following physical
properties were measured: median catalyst particle size
of 450 mm, bed density of 0.79 g/mL, bed porosity of
0.68, and solid material density of 2.4 g/(mL solid
mater). The pelletized catalyst contained 0.64 g of
4.45% Pt/TiO2 powdered catalyst per gram of pellets
(the remainder being binder).
4.5. Homogeneous reactions
In the flow reactor system the reactants were in a high
temperature reaction zone for a brief period of time
before and after the catalyst bed. This had the potential
of introducing error to the kinetic study as there was the
possibility of significant homogeneous wet oxidation
occurring outside the catalyst bed. Experiments were
therefore performed in which the catalyst bed was
replaced with similar sized inert glass beads. The reactor
was operated at 1851C, 41 atm, 12 g feed/min, 172 mL
(RTP)/min air, and a feed concentration of 417 ppm
phenol corresponding to 319 ppm TOC. Although
there was about 10% phenol conversion to certain
Fig. 3. Trickle bed reactor system.
Table 2
Catalyst surface areas
Stock
powder
LUDOX bound pellets
1101C dried Calcined
Single point surface
area P /P 0 (m2/g)
52.7 50.4
BET surface area
(m2/g)
51.7 56.1 53.7
BJH adsorption
(m2/g)
63.9 62.2
MJH desorption
(m2/g)
71.0
Cumulative pore V
(m3/g)
0.19 0.18
Avg. pore diameter
( (A)
116 118
C.B. Maugans, A. Akgerman / Water Research 37 (2003) 319–328 323
7/27/2019 Cwo of Phenol in an Trickle
http://slidepdf.com/reader/full/cwo-of-phenol-in-an-trickle 6/10
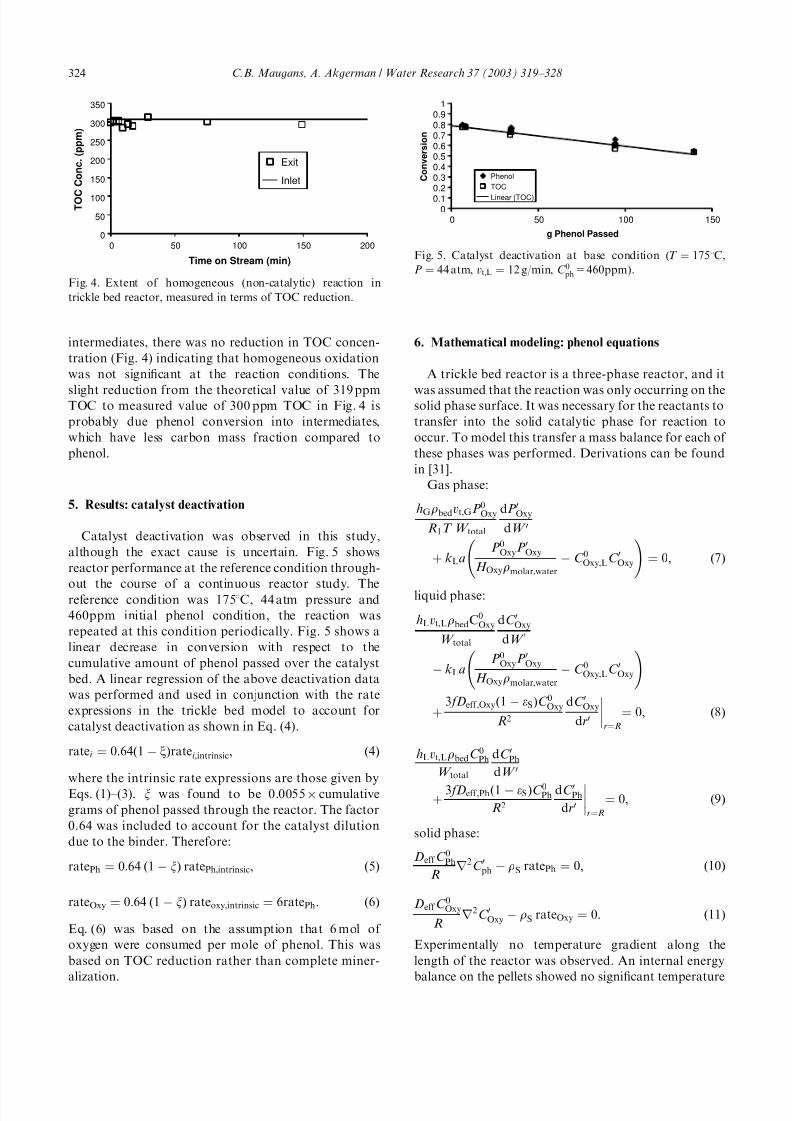
intermediates, there was no reduction in TOC concen-
tration (Fig. 4) indicating that homogeneous oxidation
was not significant at the reaction conditions. The
slight reduction from the theoretical value of 319 ppmTOC to measured value of 300 ppm TOC in Fig. 4 is
probably due phenol conversion into intermediates,
which have less carbon mass fraction compared to
phenol.
5. Results: catalyst deactivation
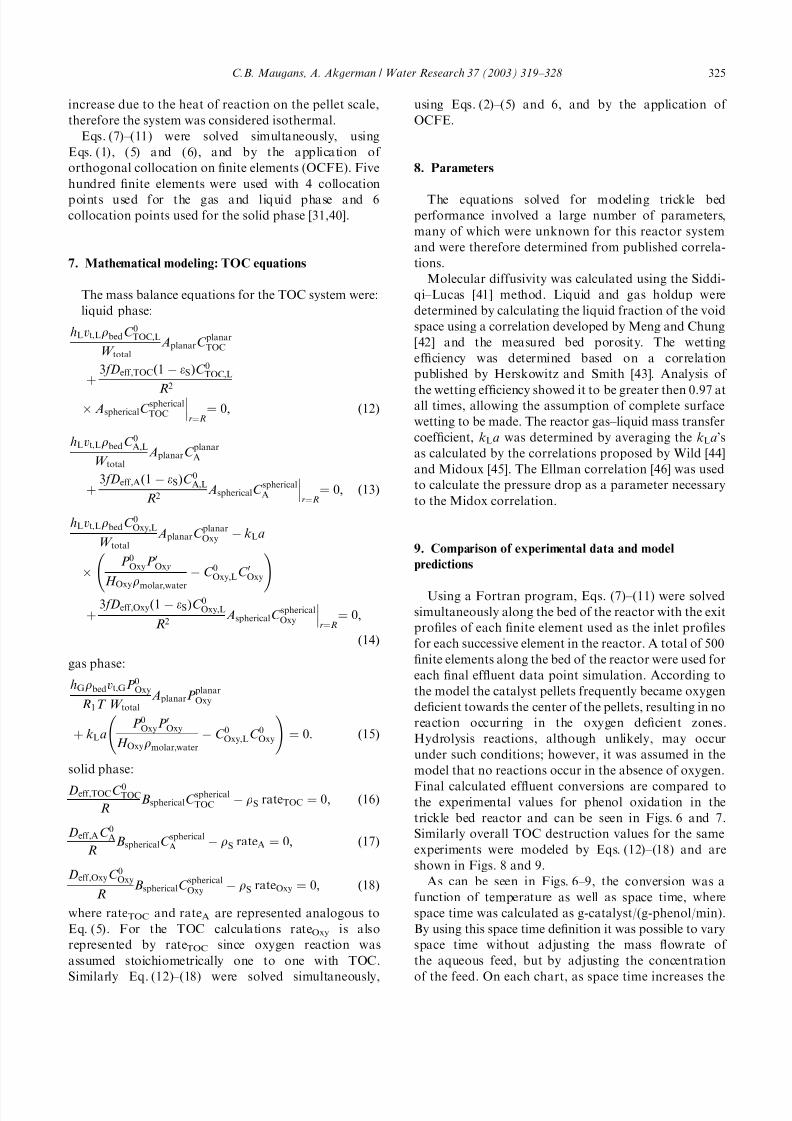
Catalyst deactivation was observed in this study,
although the exact cause is uncertain. Fig. 5 shows
reactor performance at the reference condition through-
out the course of a continuous reactor study. Thereference condition was 1751C, 44 atm pressure and
460ppm initial phenol condition, the reaction was
repeated at this condition periodically. Fig. 5 shows a
linear decrease in conversion with respect to the
cumulative amount of phenol passed over the catalyst
bed. A linear regression of the above deactivation data
was performed and used in conjunction with the rate
expressions in the trickle bed model to account for
catalyst deactivation as shown in Eq. (4).
ratei ¼ 0:64ð1 À xÞratei ;intrinsic; ð4Þ
where the intrinsic rate expressions are those given by
Eqs. (1)–(3). x was found to be 0.0055Â cumulative
grams of phenol passed through the reactor. The factor
0.64 was included to account for the catalyst dilution
due to the binder. Therefore:
ratePh ¼ 0:64 ð1 À xÞ ratePh;intrinsic; ð5Þ
rateOxy ¼ 0:64 ð1 À xÞ rateoxy;intrinsic ¼ 6ratePh: ð6Þ
Eq. (6) was based on the assumption that 6 mol of
oxygen were consumed per mole of phenol. This was
based on TOC reduction rather than complete miner-
alization.
6. Mathematical modeling: phenol equations
A trickle bed reactor is a three-phase reactor, and it
was assumed that the reaction was only occurring on thesolid phase surface. It was necessary for the reactants to
transfer into the solid catalytic phase for reaction to
occur. To model this transfer a mass balance for each of
these phases was performed. Derivations can be found
in [31].
Gas phase:
hGrbedvt;GP 0Oxy
R1T W total
dP 0Oxy
dW 0
þ k LaP 0OxyP 0Oxy
H Oxyrmolar;water
À C 0Oxy;LC 0Oxy
!¼ 0; ð7Þ
liquid phase:
hLvt;LrbedC0Oxy
W total
dC 0Oxy
dW 0
À k LaP 0OxyP 0Oxy
H Oxyrmolar;water
À C 0Oxy;LC 0Oxy
!
þ3 fDeff ;Oxyð1 À eSÞC 0Oxy
R2
dC 0Oxy
dr0
r¼R
¼ 0; ð8Þ
hLvt;LrbedC 0Ph
W total
dC 0Ph
dW 0
þ3 fDeff ;Phð1 À eSÞC 0Ph
R2
dC 0Ph
dr0
r¼R
¼ 0; ð9Þ
solid phase:
Deff C 0Ph
Rr2C 0ph À rS ratePh ¼ 0; ð10Þ
Deff C 0Oxy
Rr2C 0Oxy À rS rateOxy ¼ 0: ð11Þ
Experimentally no temperature gradient along the
length of the reactor was observed. An internal energy
balance on the pellets showed no significant temperature
00.1
0.20.30.40.50.60.70.80.9
1
0 50 100 150
g Phenol Passed
C o n v e r s i o n
Phenol
TOC
Linear (TOC)
Fig. 5. Catalyst deactivation at base condition (T ¼ 1751C,
P ¼ 44 atm, vt;L ¼ 12 g/min, C 0ph=460ppm).
0
50
100
150
200
250
300
350
0 50 100 150 200
Time on Stream (min)
T O C
C o n c .
( p p m )
Exit
Inlet
Fig. 4. Extent of homogeneous (non-catalytic) reaction in
trickle bed reactor, measured in terms of TOC reduction.
C.B. Maugans, A. Akgerman / Water Research 37 (2003) 319–328324
7/27/2019 Cwo of Phenol in an Trickle
http://slidepdf.com/reader/full/cwo-of-phenol-in-an-trickle 7/10
increase due to the heat of reaction on the pellet scale,
therefore the system was considered isothermal.
Eqs. (7)–(11) were solved simultaneously, using
Eqs. (1), (5) and (6), and by the application of
orthogonal collocation on finite elements (OCFE). Five
hundred finite elements were used with 4 collocation
points used for the gas and liquid phase and 6collocation points used for the solid phase [31,40].
7. Mathematical modeling: TOC equations
The mass balance equations for the TOC system were:
liquid phase:
hLvt;LrbedC 0TOC;L
W total
AplanarC planarTOC
þ3 fDeff ;TOCð1 À eSÞC 0TOC;L
R2
 AsphericalC sphericalTOC
r¼R
¼ 0; ð12Þ
hLvt;LrbedC 0A;L
W total
AplanarC planarA
þ3 fDeff ;Að1 À eSÞC 0A;L
R2AsphericalC
sphericalA
r¼R
¼ 0; ð13Þ
hLvt;LrbedC 0Oxy;L
W total
AplanarC planarOxy À k La
ÂP 0OxyP 0Ox y
H Oxyrmolar
;
water
À C 0Oxy;LC 0Oxy !þ
3 fDeff ;Oxyð1 À eSÞC 0Oxy;L
R2AsphericalC
sphericalOxy
r¼R
¼ 0;
ð14Þ
gas phase:
hGrbedvt;GP 0Oxy
R1T W total
AplanarP planarOxy
þ k LaP 0OxyP 0Oxy
H Oxyrmolar;water
À C 0Oxy;LC 0Oxy
!¼ 0: ð15Þ
solid phase:
Deff ;TOCC 0TOC
RB sphericalC
sphericalTOC À rS rateTOC ¼ 0; ð16Þ
Deff ;AC 0AR
B sphericalC sphericalA À rS rateA ¼ 0; ð17Þ
Deff ;OxyC 0Oxy
RB sphericalC
sphericalOxy À rS rateOxy ¼ 0; ð18Þ
where rateTOC and rateA are represented analogous to
Eq. (5). For the TOC calculations rateOxy is also
represented by rateTOC since oxygen reaction was
assumed stoichiometrically one to one with TOC.
Similarly Eq. (12)–(18) were solved simultaneously,
using Eqs. (2)–(5) and 6, and by the application of
OCFE.
8. Parameters
The equations solved for modeling trickle bedperformance involved a large number of parameters,
many of which were unknown for this reactor system
and were therefore determined from published correla-
tions.
Molecular diffusivity was calculated using the Siddi-
qi–Lucas [41] method. Liquid and gas holdup were
determined by calculating the liquid fraction of the void
space using a correlation developed by Meng and Chung
[42] and the measured bed porosity. The wetting
efficiency was determined based on a correlation
published by Herskowitz and Smith [43]. Analysis of
the wetting efficiency showed it to be greater then 0.97 atall times, allowing the assumption of complete surface
wetting to be made. The reactor gas–liquid mass transfer
coefficient, k La was determined by averaging the k La’s
as calculated by the correlations proposed by Wild [44]
and Midoux [45]. The Ellman correlation [46] was used
to calculate the pressure drop as a parameter necessary
to the Midox correlation.
9. Comparison of experimental data and model
predictions
Using a Fortran program, Eqs. (7)–(11) were solved
simultaneously along the bed of the reactor with the exit
profiles of each finite element used as the inlet profiles
for each successive element in the reactor. A total of 500
finite elements along the bed of the reactor were used for
each final effluent data point simulation. According to
the model the catalyst pellets frequently became oxygen
deficient towards the center of the pellets, resulting in no
reaction occurring in the oxygen deficient zones.
Hydrolysis reactions, although unlikely, may occur
under such conditions; however, it was assumed in the
model that no reactions occur in the absence of oxygen.
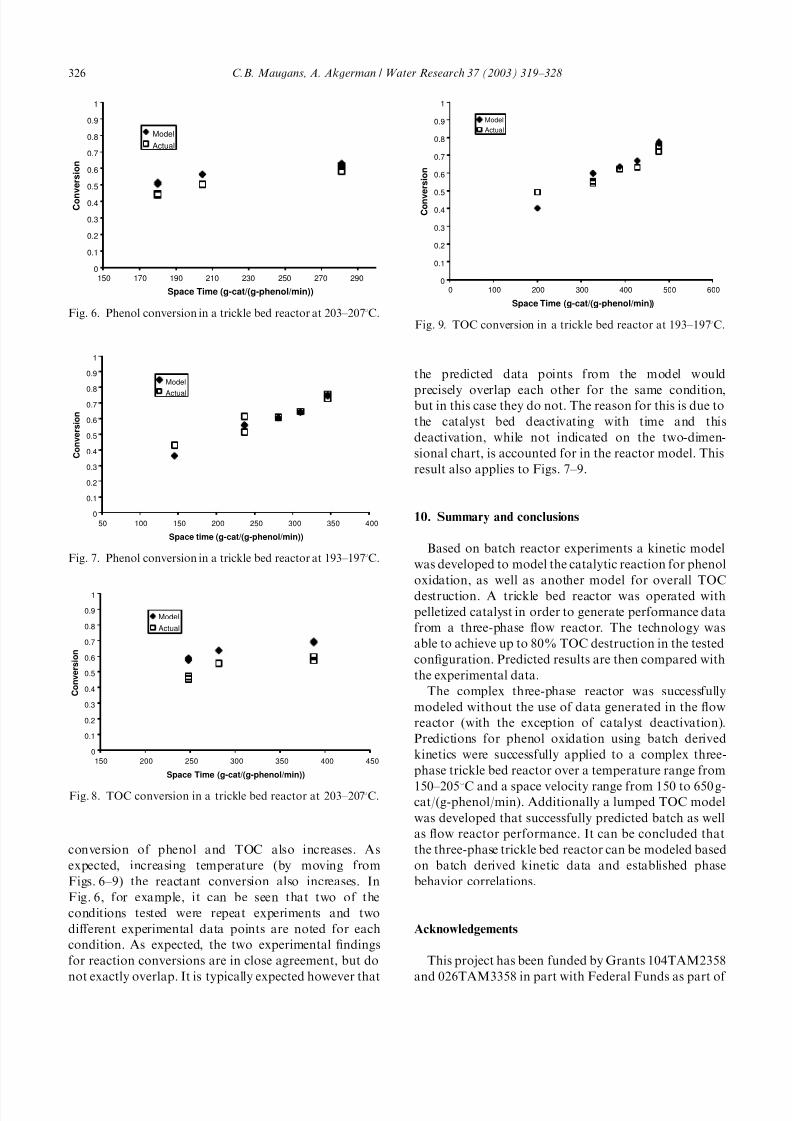
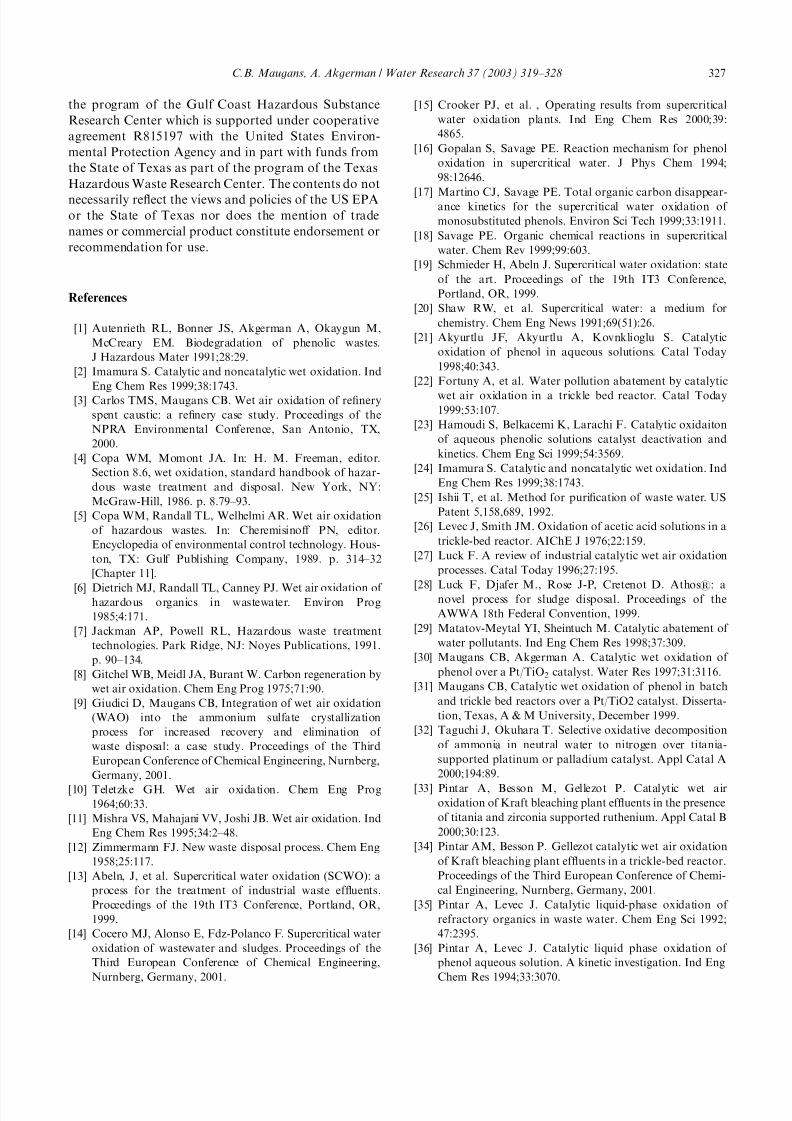
Final calculated effluent conversions are compared tothe experimental values for phenol oxidation in the
trickle bed reactor and can be seen in Figs. 6 and 7.
Similarly overall TOC destruction values for the same
experiments were modeled by Eqs. (12)–(18) and are
shown in Figs. 8 and 9.
As can be seen in Figs. 6–9, the conversion was a
function of temperature as well as space time, where
space time was calculated as g-catalyst/(g-phenol/min).
By using this space time definition it was possible to vary
space time without adjusting the mass flowrate of
the aqueous feed, but by adjusting the concentration
of the feed. On each chart, as space time increases the
C.B. Maugans, A. Akgerman / Water Research 37 (2003) 319–328 325
7/27/2019 Cwo of Phenol in an Trickle
http://slidepdf.com/reader/full/cwo-of-phenol-in-an-trickle 8/10
conversion of phenol and TOC also increases. As
expected, increasing temperature (by moving from
Figs. 6–9) the reactant conversion also increases. In
Fig. 6, for example, it can be seen that two of the
conditions tested were repeat experiments and two
different experimental data points are noted for each
condition. As expected, the two experimental findings
for reaction conversions are in close agreement, but do
not exactly overlap. It is typically expected however that
the predicted data points from the model would
precisely overlap each other for the same condition,but in this case they do not. The reason for this is due to
the catalyst bed deactivating with time and this
deactivation, while not indicated on the two-dimen-
sional chart, is accounted for in the reactor model. This
result also applies to Figs. 7–9.
10. Summary and conclusions
Based on batch reactor experiments a kinetic model
was developed to model the catalytic reaction for phenol
oxidation, as well as another model for overall TOC
destruction. A trickle bed reactor was operated with
pelletized catalyst in order to generate performance data
from a three-phase flow reactor. The technology was
able to achieve up to 80% TOC destruction in the tested
configuration. Predicted results are then compared with
the experimental data.
The complex three-phase reactor was successfully
modeled without the use of data generated in the flow
reactor (with the exception of catalyst deactivation).
Predictions for phenol oxidation using batch derived
kinetics were successfully applied to a complex three-
phase trickle bed reactor over a temperature range from
150–2051C and a space velocity range from 150 to 650 g-cat/(g-phenol/min). Additionally a lumped TOC model
was developed that successfully predicted batch as well
as flow reactor performance. It can be concluded that
the three-phase trickle bed reactor can be modeled based
on batch derived kinetic data and established phase
behavior correlations.
Acknowledgements
This project has been funded by Grants 104TAM2358
and 026TAM3358 in part with Federal Funds as part of
0
0.1
0.2
0.3
0.4
0.5
0.6
0.7
0.8
0.9
1
150 170 190 210 230 250 270 290
Space Time (g-cat/(g-phenol/min))
C o n
v e r s i o n
Model
Actual
Fig. 6. Phenol conversion in a trickle bed reactor at 203–2071C.
0
0.1
0.2
0.3
0.4
0.5
0.6
0.70.8
0.9
1
50 100 150 200 250 300 350 400
Space time (g-cat/(g-phenol/min))
C o n v e r s i o n
Model
Actual
Fig. 7. Phenol conversion in a trickle bed reactor at 193–1971C.
0
0.1
0.2
0.3
0.4
0.5
0.6
0.7
0.8
0.9
1
150 200 250 300 350 400 450
Space Time (g-cat/(g-phenol/min))
C o n v e r s i o n
Model
Actual
Fig. 8. TOC conversion in a trickle bed reactor at 203–2071C.
0
0.1
0.2
0.3
0.4
0.5
0.6
0.7
0.8
0.9
1
0 100 200 300 400 500 600
Space Time (g-cat/(g-phenol/min))
C o n v
e r s i o n
Model
Actual
Fig. 9. TOC conversion in a trickle bed reactor at 193–1971C.
C.B. Maugans, A. Akgerman / Water Research 37 (2003) 319–328326
7/27/2019 Cwo of Phenol in an Trickle
http://slidepdf.com/reader/full/cwo-of-phenol-in-an-trickle 9/10
the program of the Gulf Coast Hazardous Substance
Research Center which is supported under cooperative
agreement R815197 with the United States Environ-
mental Protection Agency and in part with funds from
the State of Texas as part of the program of the Texas
Hazardous Waste Research Center. The contents do not
necessarily reflect the views and policies of the US EPAor the State of Texas nor does the mention of trade
names or commercial product constitute endorsement or
recommendation for use.
References
[1] Autenrieth RL, Bonner JS, Akgerman A, Okaygun M,
McCreary EM. Biodegradation of phenolic wastes.
J Hazardous Mater 1991;28:29.
[2] Imamura S. Catalytic and noncatalytic wet oxidation. Ind
Eng Chem Res 1999;38:1743.
[3] Carlos TMS, Maugans CB. Wet air oxidation of refinery
spent caustic: a refinery case study. Proceedings of the
NPRA Environmental Conference, San Antonio, TX,
2000.
[4] Copa WM, Momont JA. In: H. M. Freeman, editor.
Section 8.6, wet oxidation, standard handbook of hazar-
dous waste treatment and disposal. New York, NY:
McGraw-Hill, 1986. p. 8.79–93.
[5] Copa WM, Randall TL, Welhelmi AR. Wet air oxidation
of hazardous wastes. In: Cheremisinoff PN, editor.
Encyclopedia of environmental control technology. Hous-
ton, TX: Gulf Publishing Company, 1989. p. 314–32
[Chapter 11].
[6] Dietrich MJ, Randall TL, Canney PJ. Wet air oxidation of hazardous organics in wastewater. Environ Prog
1985;4:171.
[7] Jackman AP, Powell RL, Hazardous waste treatment
technologies. Park Ridge, NJ: Noyes Publications, 1991.
p. 90–134.
[8] Gitchel WB, Meidl JA, Burant W. Carbon regeneration by
wet air oxidation. Chem Eng Prog 1975;71:90.
[9] Giudici D, Maugans CB, Integration of wet air oxidation
(WAO) into the ammonium sulfate crystallization
process for increased recovery and elimination of
waste disposal: a case study. Proceedings of the Third
European Conference of Chemical Engineering, Nurnberg,
Germany, 2001.
[10] Teletzke GH. Wet air oxidation. Chem Eng Prog
1964;60:33.
[11] Mishra VS, Mahajani VV, Joshi JB. Wet air oxidation. Ind
Eng Chem Res 1995;34:2–48.
[12] Zimmermann FJ. New waste disposal process. Chem Eng
1958;25:117.
[13] Abeln, J, et al. Supercritical water oxidation (SCWO): a
process for the treatment of industrial waste effluents.
Proceedings of the 19th IT3 Conference, Portland, OR,
1999.
[14] Cocero MJ, Alonso E, Fdz-Polanco F. Supercritical water
oxidation of wastewater and sludges. Proceedings of the
Third European Conference of Chemical Engineering,
Nurnberg, Germany, 2001.
[15] Crooker PJ, et al. , Operating results from supercritical
water oxidation plants. Ind Eng Chem Res 2000;39:
4865.
[16] Gopalan S, Savage PE. Reaction mechanism for phenol
oxidation in supercritical water. J Phys Chem 1994;
98:12646.
[17] Martino CJ, Savage PE. Total organic carbon disappear-ance kinetics for the supercritical water oxidation of
monosubstituted phenols. Environ Sci Tech 1999;33:1911.
[18] Savage PE. Organic chemical reactions in supercritical
water. Chem Rev 1999;99:603.
[19] Schmieder H, Abeln J. Supercritical water oxidation: state
of the art. Proceedings of the 19th IT3 Conference,
Portland, OR, 1999.
[20] Shaw RW, et al. Supercritical water: a medium for
chemistry. Chem Eng News 1991;69(51):26.
[21] Akyurtlu JF, Akyurtlu A, Kovnklioglu S. Catalytic
oxidation of phenol in aqueous solutions. Catal Today
1998;40:343.
[22] Fortuny A, et al. Water pollution abatement by catalytic
wet air oxidation in a trickle bed reactor. Catal Today1999;53:107.
[23] Hamoudi S, Belkacemi K, Larachi F. Catalytic oxidaiton
of aqueous phenolic solutions catalyst deactivation and
kinetics. Chem Eng Sci 1999;54:3569.
[24] Imamura S. Catalytic and noncatalytic wet oxidation. Ind
Eng Chem Res 1999;38:1743.
[25] Ishii T, et al. Method for purification of waste water. US
Patent 5,158,689, 1992.
[26] Levec J, Smith JM. Oxidation of acetic acid solutions in a
trickle-bed reactor. AIChE J 1976;22:159.
[27] Luck F. A review of industrial catalytic wet air oxidation
processes. Catal Today 1996;27:195.
[28] Luck F, Djafer M., Rose J-P, Cretenot D. Athoss: anovel process for sludge disposal. Proceedings of the
AWWA 18th Federal Convention, 1999.
[29] Matatov-Meytal YI, Sheintuch M. Catalytic abatement of
water pollutants. Ind Eng Chem Res 1998;37:309.
[30] Maugans CB, Akgerman A. Catalytic wet oxidation of
phenol over a Pt/TiO2 catalyst. Water Res 1997;31:3116.
[31] Maugans CB, Catalytic wet oxidation of phenol in batch
and trickle bed reactors over a Pt/TiO2 catalyst. Disserta-
tion, Texas, A & M University, December 1999.
[32] Taguchi J, Okuhara T. Selective oxidative decomposition
of ammonia in neutral water to nitrogen over titania-
supported platinum or palladium catalyst. Appl Catal A
2000;194:89.
[33] Pintar A, Besson M, Gellezot P. Catalytic wet airoxidation of Kraft bleaching plant effluents in the presence
of titania and zirconia supported ruthenium. Appl Catal B
2000;30:123.
[34] Pintar AM, Besson P. Gellezot catalytic wet air oxidation
of Kraft bleaching plant effluents in a trickle-bed reactor.
Proceedings of the Third European Conference of Chemi-
cal Engineering, Nurnberg, Germany, 2001.
[35] Pintar A, Levec J. Catalytic liquid-phase oxidation of
refractory organics in waste water. Chem Eng Sci 1992;
47:2395.
[36] Pintar A, Levec J. Catalytic liquid phase oxidation of
phenol aqueous solution. A kinetic investigation. Ind Eng
Chem Res 1994;33:3070.
C.B. Maugans, A. Akgerman / Water Research 37 (2003) 319–328 327
7/27/2019 Cwo of Phenol in an Trickle
http://slidepdf.com/reader/full/cwo-of-phenol-in-an-trickle 10/10
[37] Sadana A, Katzer J. Involvement of free radicals in the
aqueous-phase catalytic oxidation of phenol over copper
oxide. J Catal 1975;35:140.
[38] Santos A, et al. Catalytic wet oxidation of phenol: kinetics
of the mineralization rate. Ind Eng Chem Res 2001;40:
2773.
[39] Tukac V, Hanika J. Catalytic wet oxidation of substitutedphenols in the trickle bed reactor. 1998; 71: 262.
[40] Finlayson B. Nonlinear analysis in chemical engineering.
New York: McGraw-Hill, 1980.
[41] Siddiqi MA, Lucas K. Correlations for prediction of
diffusion in liquid. Canad J Chem Eng 1986;64:839.
[42] Meng SF, Chung T. Liquid holdup and axial dispersion in
trickle-bed reactors. Chem Eng Sci 1996;51:5357.
[43] Herskowitz M, Smith JM. Trickle bed reactors: a review.
AIChE J 1983;29:1.
[44] Wild G, Larachi F, Charpentier JC. Heat and mass
transfer in gas–liquid-sold fixed bed reactors. In: Quintard
M, Todorovic M, editors. Heat and mass transfer in
porous media. Elsevier: Amsterdam, The Netherlands,
1992. p. 616.[45] Midoux N, Morsi BI, Purwasasmita M, Laurent A,
Charpentier JC. Interfacial area and liquid side mass
transfer coefficient in trickle bed reactors operating with
organic liquids. Chem Eng Sci 1984;39:781.
[46] Ellman MJ, Midoux N, Laurent A, Charpentier JC. A
new, improved pressure drop correlation for trickle-bed
reactors. Chem Eng Sci 1988;43:2201.
C.B. Maugans, A. Akgerman / Water Research 37 (2003) 319–328328