Embed Size (px)
Citation preview

CWE Flow Factor Competition Study
CWE Consultative Group
Munich, 10 April 2018
Dr. Sven Christian Müller, René Beune, Oliver Obert

Next steps5
CWE Flow-based market coupling - Monitoring web tool4
Task 2: Modelling of alternative design polices and fairness assessment3
Task 1: Analysis and monitoring of flow factor competition in CWE2
Overview and objective of CWE FFC study1
Agenda
CWE FFC Study | CWE Consultative Group | 10 Apr 2018 (Munich) 2
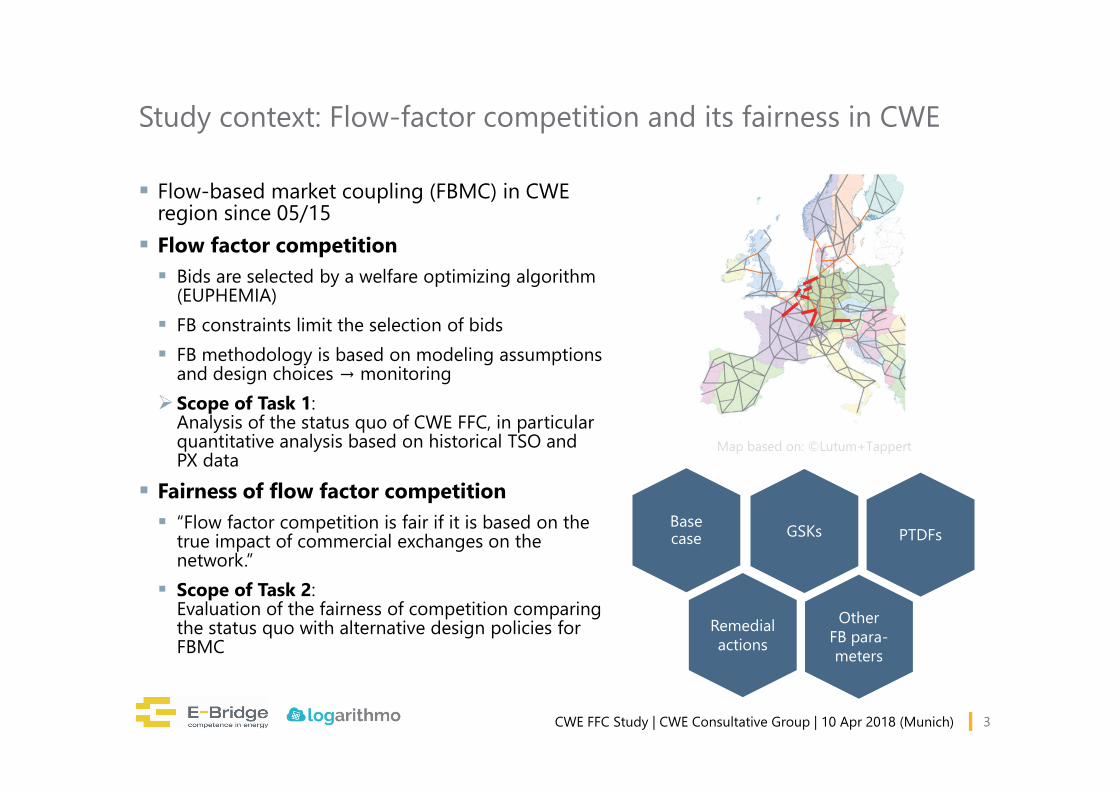
Study context: Flow-factor competition and its fairness in CWE
Flow-based market coupling (FBMC) in CWE region since 05/15 Flow factor competition Bids are selected by a welfare optimizing algorithm
(EUPHEMIA) FB constraints limit the selection of bids FB methodology is based on modeling assumptions
and design choices → monitoringScope of Task 1:
Analysis of the status quo of CWE FFC, in particular quantitative analysis based on historical TSO and PX data
Fairness of flow factor competition “Flow factor competition is fair if it is based on the
true impact of commercial exchanges on the network.”
Scope of Task 2: Evaluation of the fairness of competition comparing the status quo with alternative design policies for FBMC
CWE FFC Study | CWE Consultative Group | 10 Apr 2018 (Munich)
OtherFB para-meters
Remedialactions
GSKs PTDFsBasecase
3
Map based on: ©Lutum+Tappert

Next steps5
CWE Flow-based market coupling - Monitoring web tool4
Task 2: Modelling of alternative design polices and fairness assessment3
Task 1: Analysis and monitoring of flow factor competition in CWE2
Overview and objective of CWE FFC study1
Agenda
CWE FFC Study | CWE Consultative Group | 10 Apr 2018 (Munich) 4

Task 1: Analysis of status quo of CWE FFC(1) Qualitative analysis of FBMC processes What are drivers and design choices? Impact on RAM, PTDFs and scope of managed congestion
What are alternative design options?
(2) Definition of indicators for monitoring FFC Indicators for frequency, severity and systematics of
FFC
(3) Extensive evaluation of TSO and PX data Monitor decisive FB parameters such as active
constraints, FRMs, external constraints by TSO/zone Monitor impact of LTA inclusion, FBI patch and pre-
congestion Monitor modelling accuracy of the base case and GSKs
Task 1: Monitoring
CWE FFC Study | CWE Consultative Group | 10 Apr 2018 (Munich) 5
Sketch of selected monitoring results

Task 1: Analysis of status quo of CWE FFCHow often are different types of constraints decisive for constraining the market?
6
Task 1: Monitoring
CWE FFC Study | CWE Consultative Group | 10 Apr 2018 (Munich)
Monitoring period:May 31st, 2015 to August 31st, 2016

Task 1: Analysis of status quo of CWE FFCWhich constraints are most frequently constraining the market outcome?
Task 1: Monitoring
CWE FFC Study | CWE Consultative Group | 10 Apr 2018 (Munich) 7
Monitoring period:May 31st, 2015 to August 31st, 2016

Task 1: Analysis of status quo of CWE FFCAre there significant differences between bidding zones / TSOs in modelling FB parameters? Example: Flow-Reliability Margin (FRM)
Task 1: Monitoring
CWE FFC Study | CWE Consultative Group | 10 Apr 2018 (Munich) 8
Monitoring period:May 31st, 2015 to August 31st, 2016

Task 1: Analysis of status quo of CWE FFCFurther findings: Base case accuracy Significant deviations between D2CF forecasts
(base case) and DACF Some forecasting deviations structural for longer
periods
GSK modelling Significant deviations between observed
generation shift and modelled GSKs GSK application varies significantly among TSOs
FBI patch Partially extreme effect on prices (up to >300
EUR/MWh) Partially extreme effect on net positions (up to
2.900 MW)
Task 1: Monitoring
CWE FFC Study | CWE Consultative Group | 10 Apr 2018 (Munich) 9
Base case monitoring
GSK monitoring
FBI monitoring

Next steps5
CWE Flow-based market coupling - Monitoring web tool4
Task 2: Modelling of alternative design polices and fairness assessment3
Task 1: Analysis and monitoring of flow factor competition in CWE2
Overview and objective of CWE FFC study1
Agenda
CWE FFC Study | CWE Consultative Group | 10 Apr 2018 (Munich) 10

Task 2: Analysis of alternative design policies and fairness(1) Definition of a fairness indicator Fairness indicator evaluates impact of a design policy on zonal welfare
shares in relation to a benchmark
Two benchmarks defined:a) Nodal optimal power flow (OPF)b) “Reference PTDF” scenario
(2) Modelling and simulation of alternative design policies Modelling of 6 alternative policies Market simulations for each policy for 144 hours
(6 selected days) with the original FBMC model with the two benchmark models
Evaluation of impact of individual policies on welfare, location of congestion, net positions,…
Evaluation of the fairness indicator
Task 2: Fairness assessment
CWE FFC Study | CWE Consultative Group | 10 Apr 2018 (Munich)
Net position impact of exemplary alternative design policy
11
Quantitative fairness assessment methodology

Task 2: Findings – Results for individual design policies (selected days only)
Scenario „Seasonal Fmax“: Increase of market welfare Higher exports from DE/AT to FR, shift of congestion to
interconnectors Scenario „Alternative CBCO selection“ Increase of market welfare (note: increased redispatch
costs required) Higher exports from DE/AT to FR, more
interconnectors become restricting for the market Scenario „Improved base case“: Decrease of market welfare Shift of congestion to interconnectors Scenario „No LTA inclusion“ Decrease of market welfare, frequent infeasibility Reduced exchanges, increase of all tyes of constraints
being restricting for the market Scenario „With/without FBI patch“ Very limited welfare effect of FBI patch Small impact on net positions, FBI patch reduces
exports from DE/AT Scenario „Alternative GSK“ Decrease of market welfare More internal branches become restricting for the
market
Task 2: Fairness assessment
CWE FFC Study | CWE Consultative Group | 10 Apr 2018 (Munich) 12
Key indicators for impact of exemplary policy
Effect on location of congestion of exemplary policy

Task 2: Findings – Results of fairness assessment Qualitative assessment Potential drivers of unfairness: policies that cause a not
physically related adaptation of the FB domain LTA inclusion FBI patch
Quantitative assessment based on simulations Tentatively, policies enlarging the FB domain led to an
increase of fairness indicators Frequently fairness impact was not structural (sometimes
advantages / sometimes disadvantages for zones) Consistent increase of fairness indicator in case of policies
„seasonal Fmax“ and „alternative CBCO selection”
Nodal OPF insights Nodal OPF optimizes selection of individual bids
considering their bid price and their topological location Nodal OPF led to higher exchanges and net positions
than current FBMC given the same CBCO constraints Nodal OPF manages different scope of congestion
Task 2: Fairness assessment
CWE FFC Study | CWE Consultative Group | 10 Apr 2018 (Munich) 13
Exemplary fairness impact of alternative design policies for different days

Next steps5
CWE Flow-based market coupling - Monitoring web tool4
Task 2: Modelling of alternative design polices and fairness assessment3
Task 1: Analysis and monitoring of flow factor competition in CWE2
Overview and objective of CWE FFC study1
Agenda
CWE FFC Study | CWE Consultative Group | 10 Apr 2018 (Munich) 14

Web-based CWE Monitoring Tool
CWE FFC Study | CWE Consultative Group | 10 Apr 2018 (Munich)
Development of a web-based CWE Monitoring Tool Makes extensive data analyses of study
available to users Enables ongoing monitoring of CWE FBMC
Features for CWE Monitoring Tool Visualizations and analyses of Prices, net positions and energy mix CBCO information in a network map CWE FBMC indicators RAMs, active constraints, LTA inclusion
New live version based on public data Automatic integration of latest data from
JAO and ENTSO-E Can as well be provided to stakeholders
15
Screenshot of CWE Monitoring Tool

Next steps5
CWE Flow-based market coupling - Monitoring web tool4
Task 2: Modelling of alternative design polices and fairness assessment3
Task 1: Analysis and monitoring of flow factor competition in CWE2
Overview and objective of CWE FFC study1
Agenda
CWE FFC Study | CWE Consultative Group | 10 Apr 2018 (Munich) 16
Next steps Publication of project results Executive summary and full report will be available
on NRAs websites or JAO Dialogue with CWE stakeholders and further studies NRAs are in discussion with TSOs and market
participants for ongoing improvement of CWE FBMC
NRAs will set focus for future studies Access to CWE monitoring web-tool Interested stakeholders can request access to the
latest CWE FBMC monitoring tool Contact: [email protected]
Possibly a free public version will be released
CWE FFC Study | CWE Consultative Group | 10 Apr 2018 (Munich) 17