Embed Size (px)
Citation preview

1
CVC IN JAPAN:
CORPORATE VENTURE CAPITAL
ACTIVITIES BY JAPANESE
COMPANIES
Masato Sasaki
Hitotsubashi University
Ulrike Schaede
University of California, San Diego
JFIT/STAJE conference May 2016
Our Research Project
HQ
Division A
R&D
Division B Division C
Corporate R&D
Finance
CVC?
CVC?
CVC?
• Study of Japanese “open innovation” activities through corporate investments in startups
• Goal: Evaluate long-term effects on innovation streams and new business development in Japan
• Today: • Data overview
• Who are the investors? , Who are the targets? • Any difference between Corporate investment and CVC Fund?
• Lay out research design
Who manages
CVC? Characteristics Innovation Impact
Finance Goal is ROI? none?
Corporate
R&D
OI? Wide
range, long
horizon?
Long term?
Product
division Clear target,
needs- based? Short term?
Locus of CVC and its effect on innovation
2
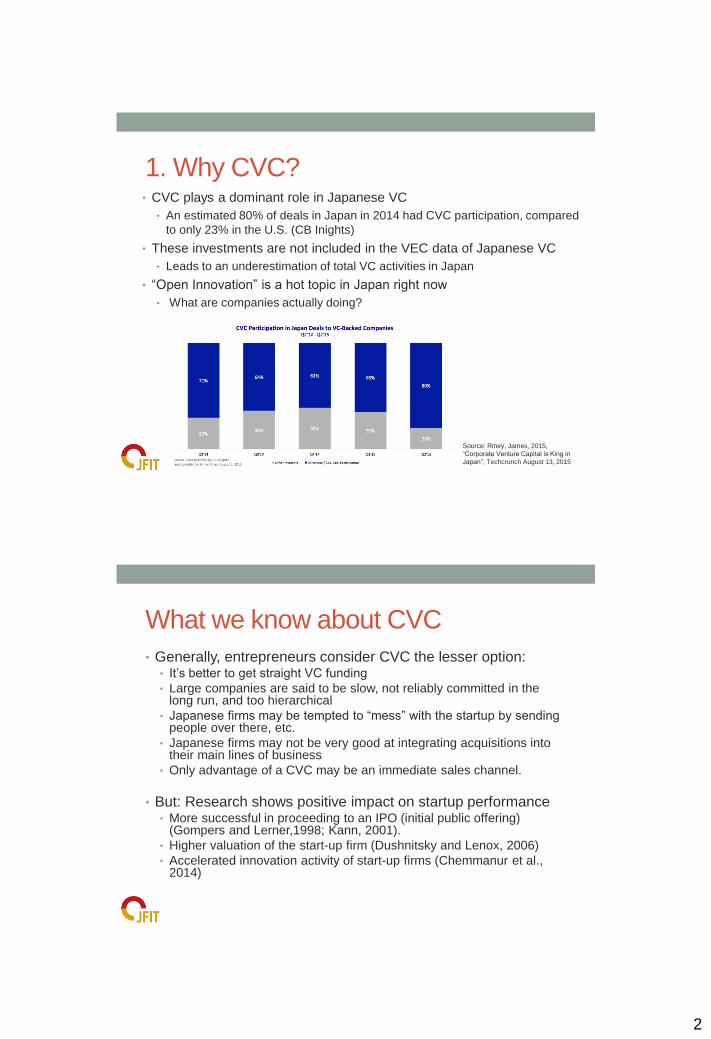
1. Why CVC? • CVC plays a dominant role in Japanese VC
• An estimated 80% of deals in Japan in 2014 had CVC participation, compared
to only 23% in the U.S. (CB Inights)
• These investments are not included in the VEC data of Japanese VC
• Leads to an underestimation of total VC activities in Japan
• “Open Innovation” is a hot topic in Japan right now
• What are companies actually doing?
Source: Riney, James, 2015,
“Corporate Venture Capital is King in
Japan”, Techcrunch August 13, 2015
What we know about CVC
• Generally, entrepreneurs consider CVC the lesser option: • It’s better to get straight VC funding
• Large companies are said to be slow, not reliably committed in the long run, and too hierarchical
• Japanese firms may be tempted to “mess” with the startup by sending people over there, etc.
• Japanese firms may not be very good at integrating acquisitions into their main lines of business
• Only advantage of a CVC may be an immediate sales channel.
• But: Research shows positive impact on startup performance • More successful in proceeding to an IPO (initial public offering)
(Gompers and Lerner,1998; Kann, 2001).
• Higher valuation of the start-up firm (Dushnitsky and Lenox, 2006)
• Accelerated innovation activity of start-up firms (Chemmanur et al., 2014)
3
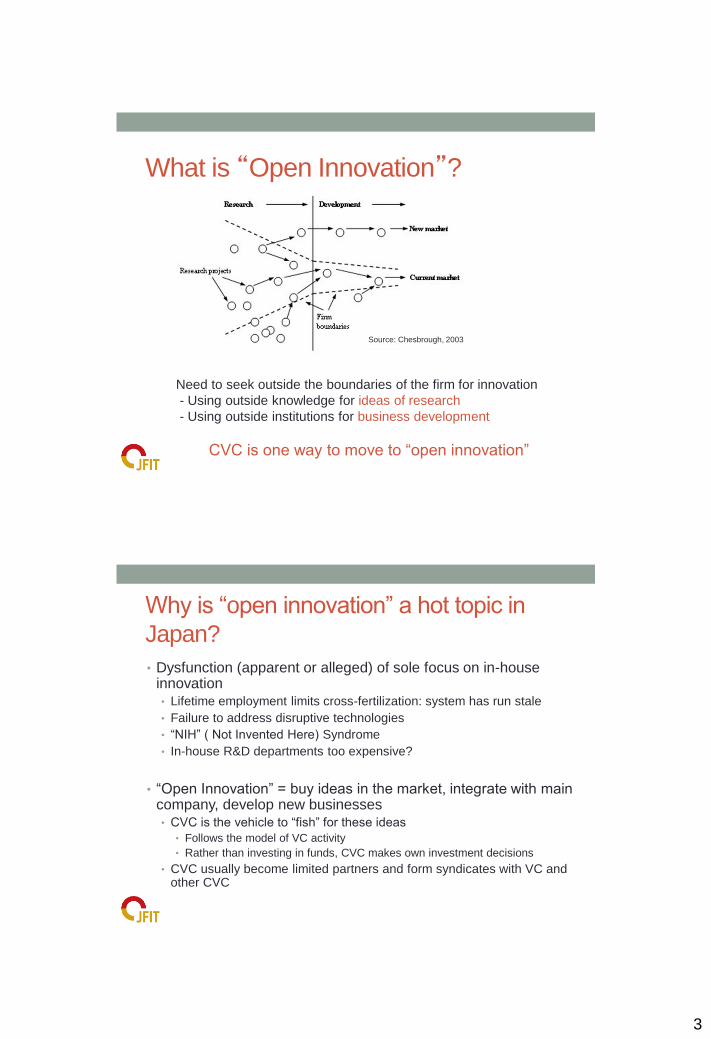
What is “Open Innovation”?
Need to seek outside the boundaries of the firm for innovation
- Using outside knowledge for ideas of research
- Using outside institutions for business development
CVC is one way to move to “open innovation”
Source: Chesbrough, 2003
Why is “open innovation” a hot topic in
Japan?
• Dysfunction (apparent or alleged) of sole focus on in-house innovation • Lifetime employment limits cross-fertilization: system has run stale
• Failure to address disruptive technologies
• “NIH” ( Not Invented Here) Syndrome
• In-house R&D departments too expensive?
• “Open Innovation” = buy ideas in the market, integrate with main company, develop new businesses • CVC is the vehicle to “fish” for these ideas
• Follows the model of VC activity
• Rather than investing in funds, CVC makes own investment decisions
• CVC usually become limited partners and form syndicates with VC and other CVC
4
Research Question of our project
• Exploring the characteristics of investment behavior of
Japanese CVC
• Who are they?
• What do they aim for?
• Return on investment?
• New ideas for new business development, regardless of returns?
• How do they manage their investment targets?
• How successful are they?
• Finding the impact of “open innovation” through CVC on
corporate renewal and change in Japanese companies.
• Is “open innovation” a promising approach?
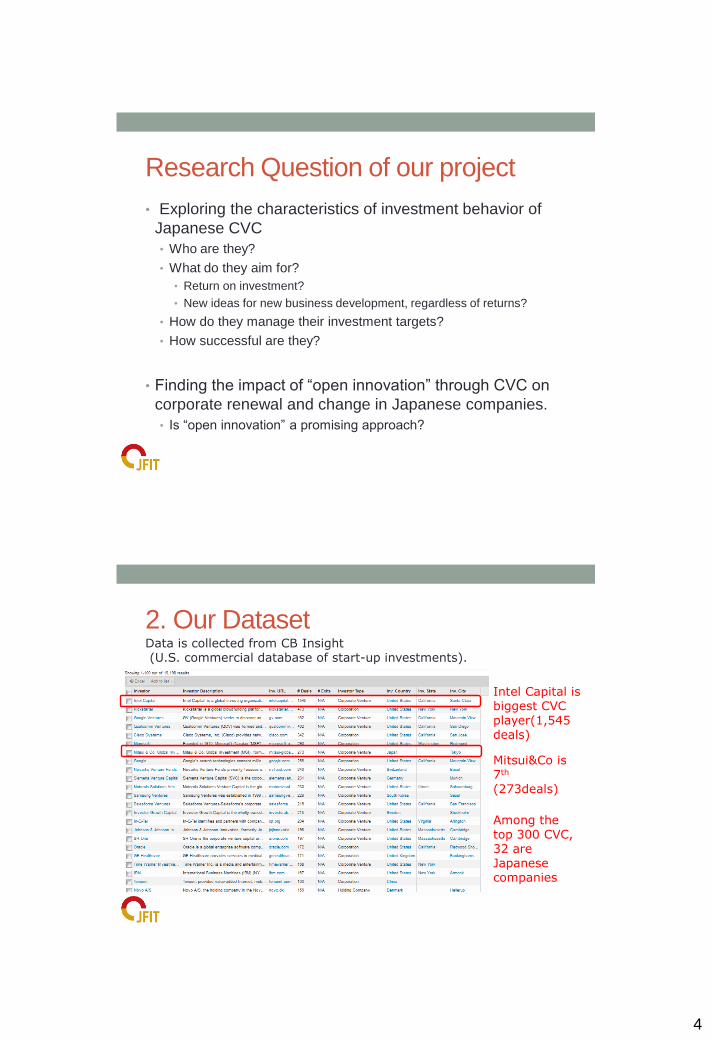
2. Our Dataset
Among the top 300 CVC, 32 are Japanese companies
Intel Capital is biggest CVC player(1,545 deals)
Mitsui&Co is 7th (273deals)
Data is collected from CB Insight (U.S. commercial database of start-up investments).
5
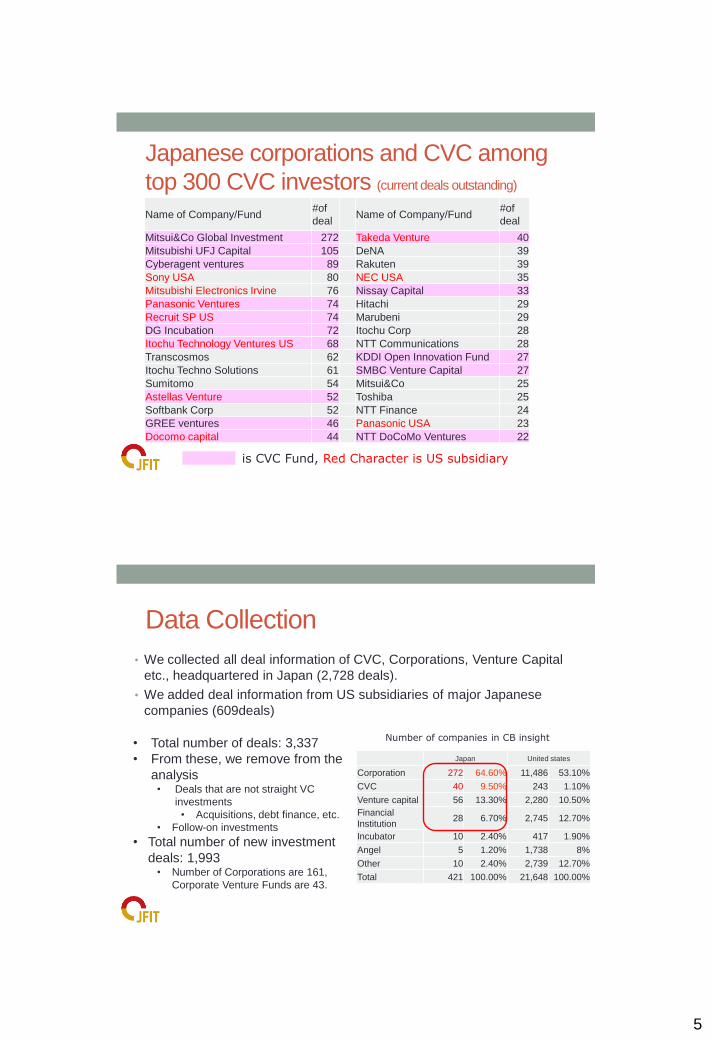
Japanese corporations and CVC among
top 300 CVC investors (current deals outstanding)
Name of Company/Fund #of
deal Name of Company/Fund
#of
deal
Mitsui&Co Global Investment 272 Takeda Venture 40 Mitsubishi UFJ Capital 105 DeNA 39 Cyberagent ventures 89 Rakuten 39 Sony USA 80 NEC USA 35 Mitsubishi Electronics Irvine 76 Nissay Capital 33 Panasonic Ventures 74 Hitachi 29 Recruit SP US 74 Marubeni 29 DG Incubation 72 Itochu Corp 28 Itochu Technology Ventures US 68 NTT Communications 28 Transcosmos 62 KDDI Open Innovation Fund 27 Itochu Techno Solutions 61 SMBC Venture Capital 27 Sumitomo 54 Mitsui&Co 25 Astellas Venture 52 Toshiba 25 Softbank Corp 52 NTT Finance 24 GREE ventures 46 Panasonic USA 23 Docomo capital 44 NTT DoCoMo Ventures 22
is CVC Fund, Red Character is US subsidiary
Data Collection
• We collected all deal information of CVC, Corporations, Venture Capital
etc., headquartered in Japan (2,728 deals).
• We added deal information from US subsidiaries of major Japanese
companies (609deals)
Japan United states
Corporation 272 64.60% 11,486 53.10%
CVC 40 9.50% 243 1.10%
Venture capital 56 13.30% 2,280 10.50%
Financial
Institution 28 6.70% 2,745 12.70%
Incubator 10 2.40% 417 1.90%
Angel 5 1.20% 1,738 8%
Other 10 2.40% 2,739 12.70%
Total 421 100.00% 21,648 100.00%
Number of companies in CB insight • Total number of deals: 3,337
• From these, we remove from the
analysis • Deals that are not straight VC
investments
• Acquisitions, debt finance, etc.
• Follow-on investments
• Total number of new investment
deals: 1,993 • Number of Corporations are 161,
Corporate Venture Funds are 43.
6
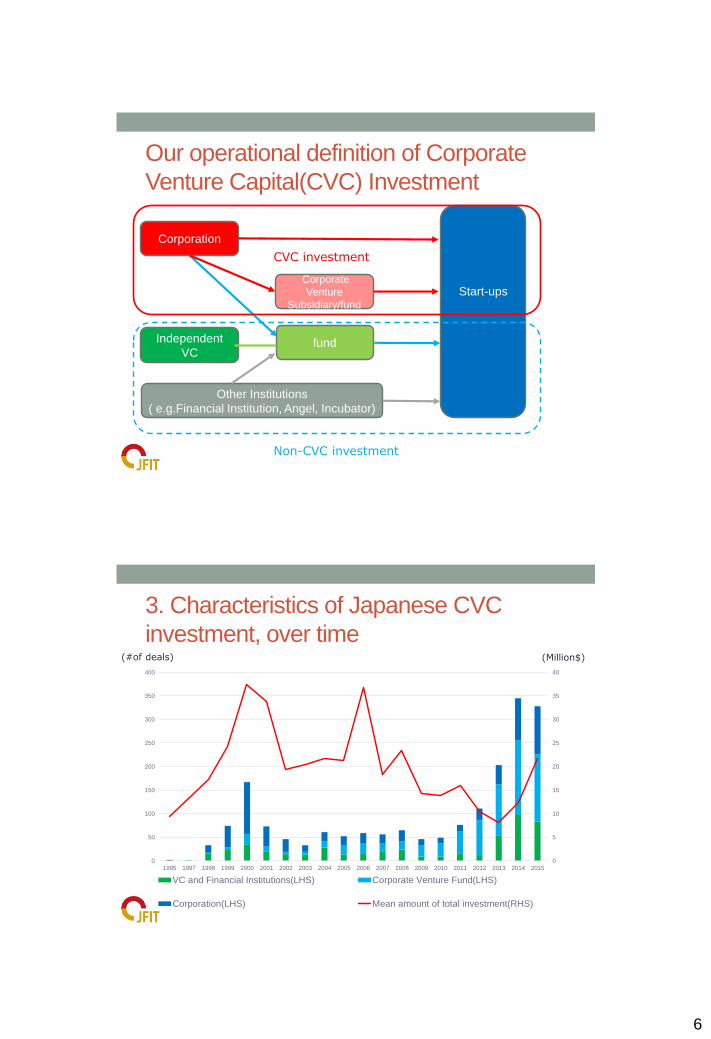
Our operational definition of Corporate
Venture Capital(CVC) Investment
Start-ups
fund Independent
VC
Corporate
Venture
Subsidiary/fund
Corporation
CVC investment
Other Institutions
( e.g.Financial Institution, Angel, Incubator)
Non-CVC investment
3. Characteristics of Japanese CVC
investment, over time (Million$)
0
5
10
15
20
25
30
35
40
0
50
100
150
200
250
300
350
400
1995 1997 1998 1999 2000 2001 2002 2003 2004 2005 2006 2007 2008 2009 2010 2011 2012 2013 2014 2015
VC and Financial Institutions(LHS) Corporate Venture Fund(LHS)
Corporation(LHS) Mean amount of total investment(RHS)
(#of deals)
7
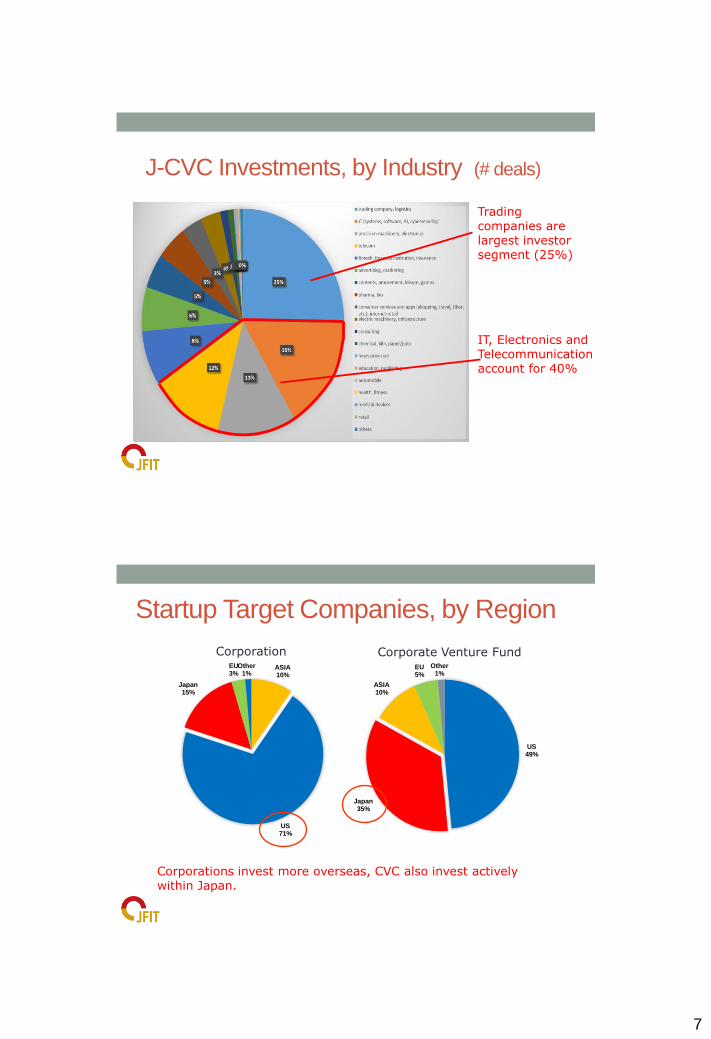
J-CVC Investments, by Industry (# deals)
Trading companies are largest investor segment (25%)
IT, Electronics and Telecommunication account for 40%
US 49%
Japan 35%
ASIA 10%
EU 5%
Other 1%
ASIA 10%
US 71%
Japan 15%
EU 3%
Other 1%
Startup Target Companies, by Region
Corporations invest more overseas, CVC also invest actively within Japan.
Corporate Venture Fund Corporation
8
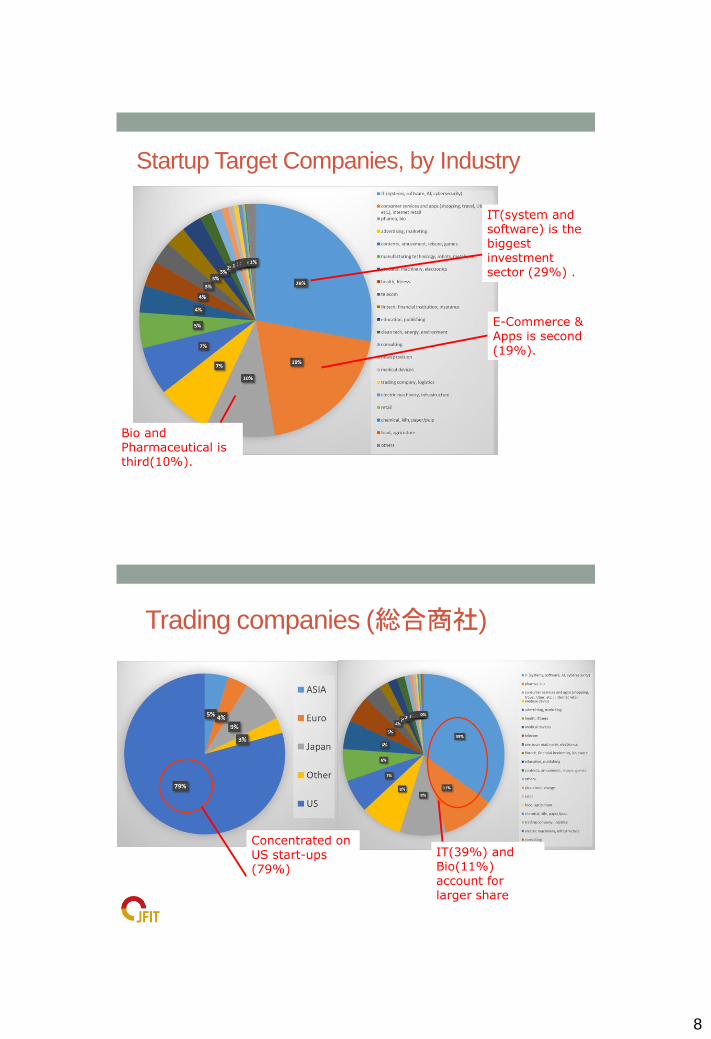
Startup Target Companies, by Industry
IT(system and software) is the biggest investment sector (29%) .
E-Commerce & Apps is second (19%).
Bio and Pharmaceutical is third(10%).
Trading companies (総合商社)
Concentrated on US start-ups (79%)
IT(39%) and Bio(11%) account for larger share

9
4. Investment behavior of Corporation and CVC fund
Mean financial
round* Number of co-investors in
each deal
Mean amount of
investment in each
deal ( in total)
Corporation 3.05 5.12
( companies)
30.19
( million$)
Corporate Venture
Fund
2.42 3.40 13
Independent VC and
Financial Service
2.58 4.04 14.75
* We coded financial round of each deal as Seed =1, Series A =2, Series B=3, Series C =4, and so on
Corporate Venture Funds are more early stage-oriented; Corporations (direct investments) are more later stage-oriented.
Patterns of Exit
Probability of
Exit* Proportion of
IPO in Exit Mean time for exit
Corporation 25.40% 13.40% 6.08
(years)
Corporate Venture
Fund 18.40% 19.30% 4.76
VC and Financial
institution 19.60% 26.00% 5.63
Corporations (direct investments) shows slightly high probability of exit, They prefer M&A and has much longer time period for exit
*We calculated probability of Exit as follows; (Number of IPO + Number of M&A) / Total number of deals

10
Difference between Young and
Established Companies
N mean SD Number of
Deals 20years+ 975 72.66 84.698 *** <20years 414 42.19 33.276
Amount of
Total
Investment
20years+ 840 27.24 78.293 *** <20years 315 7.81 13.545
Finance
Round 20years+ 821 3.05 1.368 *** <20years 383 1.94 1.112
Number of
Co-investors 20years+ 975 4.74 4.371 *** <20years 414 3.00 3.350
Exit (M&A
and IPO) 20years+ 975 .26 .439 *** <20years 414 .11 .318
Exit (M&A or
IPO) 20years+ 254 .15 .357 <20years 47 .21 .414
Divide investor (corporation) by age. Cut-off point is 20years
Established companies have experienced more deals, with larger investments, focusing on later stage, and with more co-investors
* p<0.1, ** p<0.05, *** p<0.01
Difference between Japan and US
N mean SD Number of
Deals JP 1098 65.08 83.093 US 294 57.34 21.694
Amount of
Funding JP 905 20.50 66.496 US 253 26.88 71.346
Finance
Round JP 965 2.60 1.402 *** US 242 3.08 1.288
Number of
Co-investors JP 1098 4.04 4.152 *** US 294 4.85 4.157
Exit (M&A
and IPO) JP 1098 .18 .386 *** US 294 .34 .476
Exit (M&A or
IPO) JP 200 .17 .372 US 101 .15 .357
US CV and CVC are focused more on later stage, with more co-investors, and higher probability of exit.
Divide investor(corporation) by location of Head-quarter.
* p<0.1, ** p<0.05, *** p<0.01

11
5. Findings
• By industry, trading companies, IT/Electronics and
Telecommunications are major CVC players in Japan.
• Their targets are in IT, E-commerce/Apps, and Biotechnology
• Corporations and CVC display different investment behavior
• Corporations (direct investment) are more US oriented, CVC also invest
heavily with Japan
• Corporations engage more in later-stage, larger investments than CVC,
which are more early-stage oriented.
• NB: The larger the company, the more pronounced this effect
• Possibility of different effect on innovation
• Corporate investments are closer tied/related to current businesses?
• CVC investments are more future-oriented, disruptive innovation?
Research Design going forward
• Our interest: how are Japanese companies integrating “open innovation” into new business development, and with what success? • Identify the core businesses (industries) of the CVC/company
• Identify where in the company the CVC is located • Central R&D, product divisions, Finance, etc.
• Identify the industries of the target investments • What is the company buying? Is it an extension? Is there a pattern?
• True effect on innovation may only be visible in a few years; in the meantime we can • Evaluate the investment portfolio patterns
• E.g., are all companies in one industry investment in the same thing?
• Observe how the targets are managed?
• Add qualitative research of companies (surveys, interviews) to identify goals and processes for each company
12
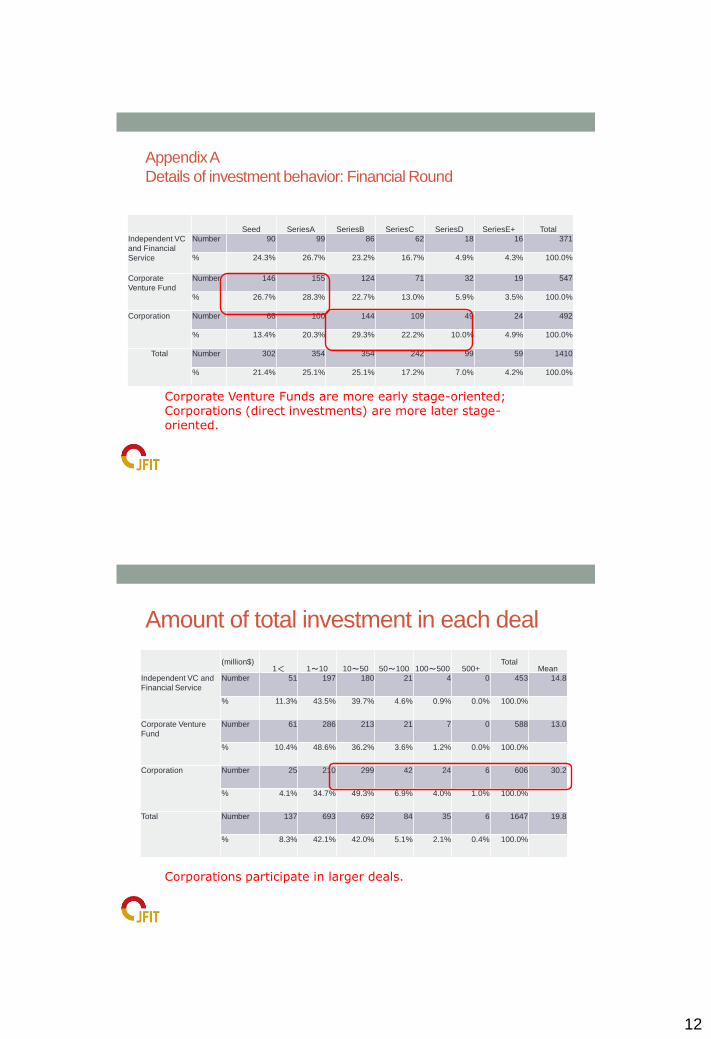
Appendix A
Details of investment behavior: Financial Round
Seed SeriesA SeriesB SeriesC SeriesD SeriesE+ Total
Independent VC
and Financial
Service
Number 90 99 86 62 18 16 371
% 24.3% 26.7% 23.2% 16.7% 4.9% 4.3% 100.0%
Corporate
Venture Fund Number 146 155 124 71 32 19 547
% 26.7% 28.3% 22.7% 13.0% 5.9% 3.5% 100.0%
Corporation Number 66 100 144 109 49 24 492
% 13.4% 20.3% 29.3% 22.2% 10.0% 4.9% 100.0%
Total Number 302 354 354 242 99 59 1410
% 21.4% 25.1% 25.1% 17.2% 7.0% 4.2% 100.0%
Corporate Venture Funds are more early stage-oriented; Corporations (direct investments) are more later stage-oriented.
Amount of total investment in each deal
(million$) 1< 1~10 10~50 50~100 100~500 500+
Total Mean
Independent VC and
Financial Service Number 51 197 180 21 4 0 453 14.8
% 11.3% 43.5% 39.7% 4.6% 0.9% 0.0% 100.0%
Corporate Venture
Fund Number 61 286 213 21 7 0 588 13.0
% 10.4% 48.6% 36.2% 3.6% 1.2% 0.0% 100.0%
Corporation Number 25 210 299 42 24 6 606 30.2
% 4.1% 34.7% 49.3% 6.9% 4.0% 1.0% 100.0%
Total Number 137 693 692 84 35 6 1647 19.8
% 8.3% 42.1% 42.0% 5.1% 2.1% 0.4% 100.0%
Corporations participate in larger deals.
13
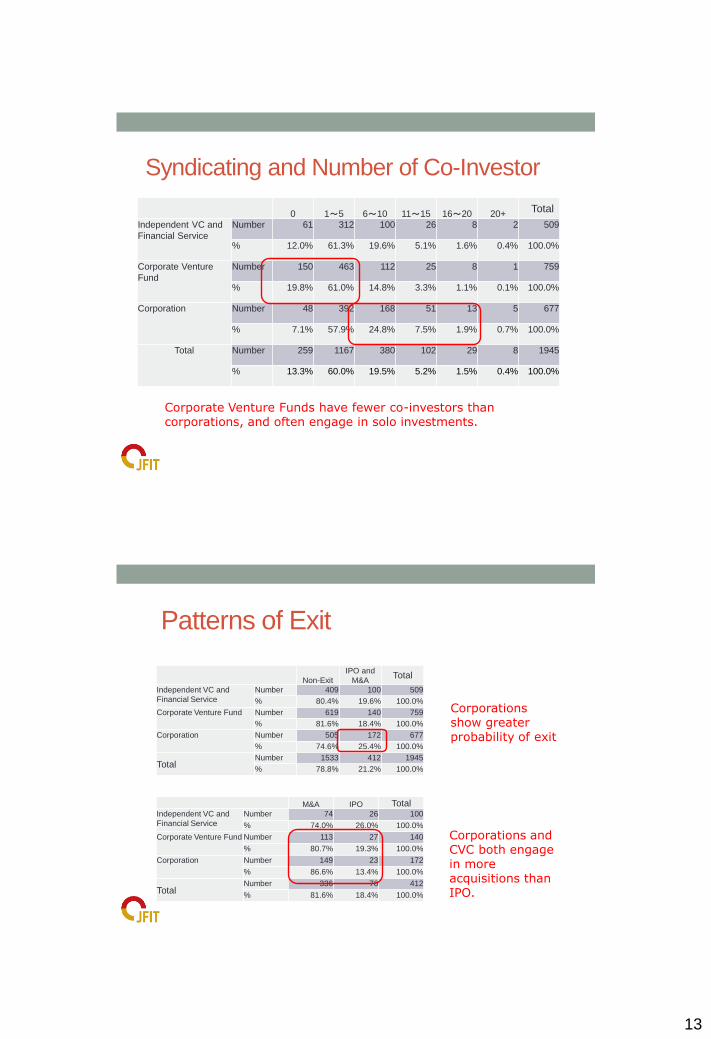
Syndicating and Number of Co-Investor
0 1~5 6~10 11~15 16~20 20+
Total
Independent VC and
Financial Service Number 61 312 100 26 8 2 509
% 12.0% 61.3% 19.6% 5.1% 1.6% 0.4% 100.0%
Corporate Venture
Fund Number 150 463 112 25 8 1 759
% 19.8% 61.0% 14.8% 3.3% 1.1% 0.1% 100.0%
Corporation Number 48 392 168 51 13 5 677
% 7.1% 57.9% 24.8% 7.5% 1.9% 0.7% 100.0%
Total Number 259 1167 380 102 29 8 1945
% 13.3% 60.0% 19.5% 5.2% 1.5% 0.4% 100.0%
Corporate Venture Funds have fewer co-investors than corporations, and often engage in solo investments.
Patterns of Exit
Non-Exit
IPO and
M&A Total
Independent VC and
Financial Service Number 409 100 509
% 80.4% 19.6% 100.0%
Corporate Venture Fund Number 619 140 759
% 81.6% 18.4% 100.0%
Corporation Number 505 172 677
% 74.6% 25.4% 100.0%
Total Number 1533 412 1945
% 78.8% 21.2% 100.0%
M&A IPO Total Independent VC and
Financial Service Number 74 26 100
% 74.0% 26.0% 100.0%
Corporate Venture Fund Number 113 27 140
% 80.7% 19.3% 100.0%
Corporation Number 149 23 172
% 86.6% 13.4% 100.0%
Total Number 336 76 412
% 81.6% 18.4% 100.0%
Corporations show greater probability of exit
Corporations and CVC both engage in more acquisitions than IPO.

14
Time of Exit
<1year 1-3year 3-5year 5-10year 10year+ Total Mean
VC and Financial
institusion 5 41 22 26 6 100 5.63
5.0% 41.0% 22.0% 26.0% 6.0% 100.0%
Corporate Venture
Fund 5 70 38 19 5 137 4.76
3.6% 51.1% 27.7% 13.9% 3.6% 100.0%
Corporation 3 71 33 39 16 162 6.08
1.9% 43.8% 20.4% 24.1% 9.9% 100.0%
Total 13 182 93 80 27 395
3.3% 46.1% 23.5% 20.3% 6.8% 100.0%
CVC have shorter period to exit (avg 4.76 years) than Corporations (avg. 6.08).
Appendix B: Factors affecting on Exit( IPO and M&A)
• Result of logistic regression analysis
• In investments by corporation, investors located in Japan and Japanese startups are less successful in Exit.
• In investments by Corporate Venture, pharmaceutical and trading company are more successful in Exit.
• For overall tendency, number of total deals of investor and number of co-investor is positively associated with probability of exit.
CorporationCorporate Venture
All
b/t b/t b/tInvestor JapanHQ -0.80 -0.39 -0.51information [-2.15]** [-1.07] [-2.25]**
age 20years+ 0.35 -0.47 0.00[0.80] [-0.80] [0.01]
Number of Deals 0.00 0.00 0.00[0.85] [0.46] [2.80]***
IT Industry? 0.14 -0.07 -0.04[0.30] [-0.12] [-0.10]
Pharma industry? 0.65 1.27 0.59[0.78] [2.22]** [1.46]
Trading company? -0.56 0.85 -0.26[-1.62] [1.74]* [-0.86]
Deal Financial Round 0.19 0.43 0.30information [1.89]* [4.58]*** [4.57]***
Number of Co-Investor 0.09 0.04 0.08[3.31]*** [1.41] [3.96]***
Start-up JAPAN startups -2.77 -0.47 -1.18information [-2.59]*** [-1.07] [-3.12]***
US startups 0.25 0.41 0.41[0.68] [1.26] [1.75]*
Bio startups? -0.41 -0.11 -0.15[-0.89] [-0.23] [-0.49]
IT startups? -0.47 -0.04 -0.19[-1.80]* [-0.13] [-1.01]
Constant -1.76 -2.88 -2.54[-2.66]*** [-4.33]*** [-5.83]***
N 495 666 1161* p<0.1, ** p<0.05, *** p<0.01