Embed Size (px)
Citation preview

ENVIRONMENTAL
TECHNOLOGY
BEST PRACTICE
PROGRAMME
GG38CGUIDE
CUTTING COSTS BY REDUCING WASTE: A self-help guide for growing businesses
S U M M A R Y
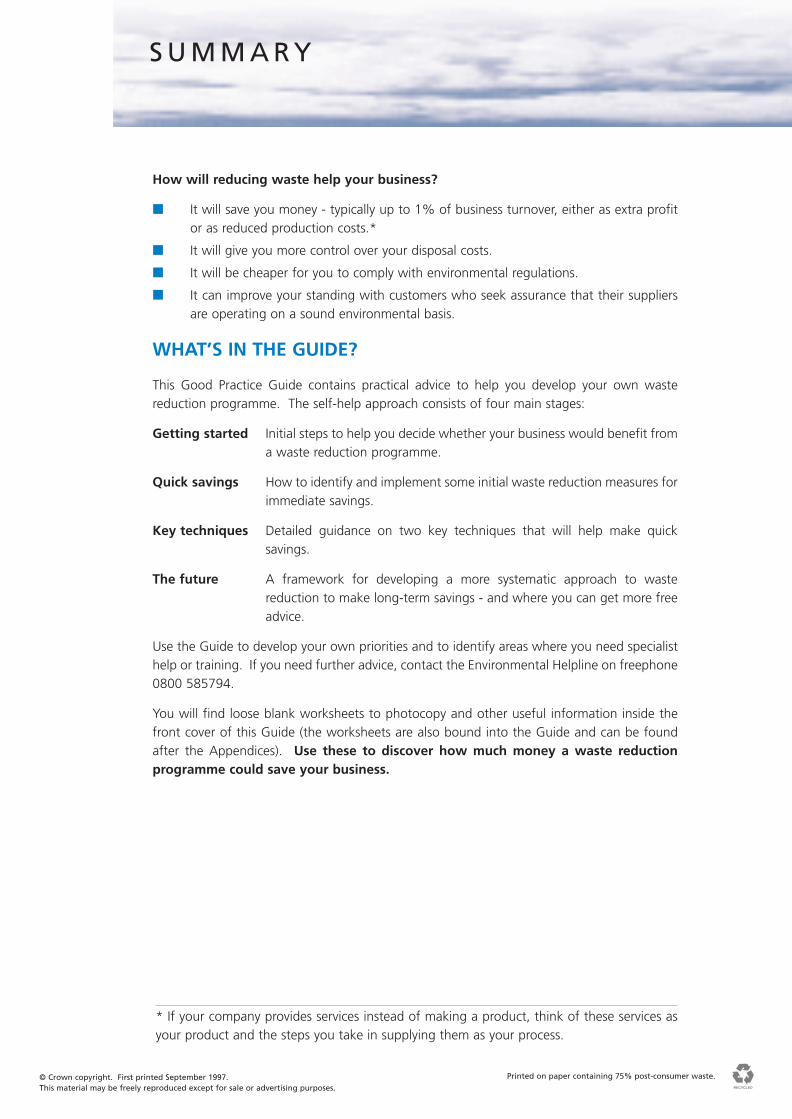
How will reducing waste help your business?
■ It will save you money - typically up to 1% of business turnover, either as extra profitor as reduced production costs.*
■ It will give you more control over your disposal costs.
■ It will be cheaper for you to comply with environmental regulations.
■ It can improve your standing with customers who seek assurance that their suppliersare operating on a sound environmental basis.
WHAT’S IN THE GUIDE?
This Good Practice Guide contains practical advice to help you develop your own wastereduction programme. The self-help approach consists of four main stages:
Getting started Initial steps to help you decide whether your business would benefit froma waste reduction programme.
Quick savings How to identify and implement some initial waste reduction measures forimmediate savings.
Key techniques Detailed guidance on two key techniques that will help make quicksavings.
The future A framework for developing a more systematic approach to wastereduction to make long-term savings - and where you can get more freeadvice.
Use the Guide to develop your own priorities and to identify areas where you need specialisthelp or training. If you need further advice, contact the Environmental Helpline on freephone0800 585794.
You will find loose blank worksheets to photocopy and other useful information inside thefront cover of this Guide (the worksheets are also bound into the Guide and can be foundafter the Appendices). Use these to discover how much money a waste reductionprogramme could save your business.
* If your company provides services instead of making a product, think of these services asyour product and the steps you take in supplying them as your process.
© Crown copyright. First printed September 1997. This material may be freely reproduced except for sale or advertising purposes.
Printed on paper containing 75% post-consumer waste.
The Environmental Technology Best Practice Programme is a joint Department of Trade and Industryand Department of the Environment, Transport and the Regions programme. It is managed by AEA Technology plc through ETSU and the National Environmental Technology Centre.
The Programme offers free advice and information for UK businesses and promotes environmentalpractices that:
■ increase profits for UK industry and commerce;
■ reduce waste and pollution at source.
To find out more about the Programme please call the Environmental Helpline on freephone 0800 585794. As well as giving information about the Programme, the Helpline has access to awide range of environmental information. It offers free advice to UK businesses on technicalmatters, environmental legislation, conferences and promotional seminars. For smaller companies,a free counselling service may be offered at the discretion of the Helpline Manager.
This Guide was prepared with assistance from:
William Battle Associates
ENVIRONMENTAL
TECHNOLOGY
BEST PRACTICE
PROGRAMME
For more information about the Programme please phone the Environmental Helpline on 0800 585794
Section Page
1 Getting started 1
Why do it? 1
Winning support 1
Choosing a co-ordinator 2
2 Quick savings - making immediate savings or ‘fast starts’ 3
STEP 1 Gathering available information 3
STEP 2 Identifying priorities 5
STEP 3 Making the first savings 5
STEP 4 Measuring savings 6
STEP 5 Achieving more savings 6
3 Key techniques for measuring your wastes and quantifying 7their real costs
Key technique 1 - using a process flowsheet 7
Key technique 2 - using the ‘cause and effect’ method 9
4 The future and additional help 12
Appendices
Appendix 1 Waste reduction prompts 13
Appendix 2 Inventory management 16
C O N T E N T S
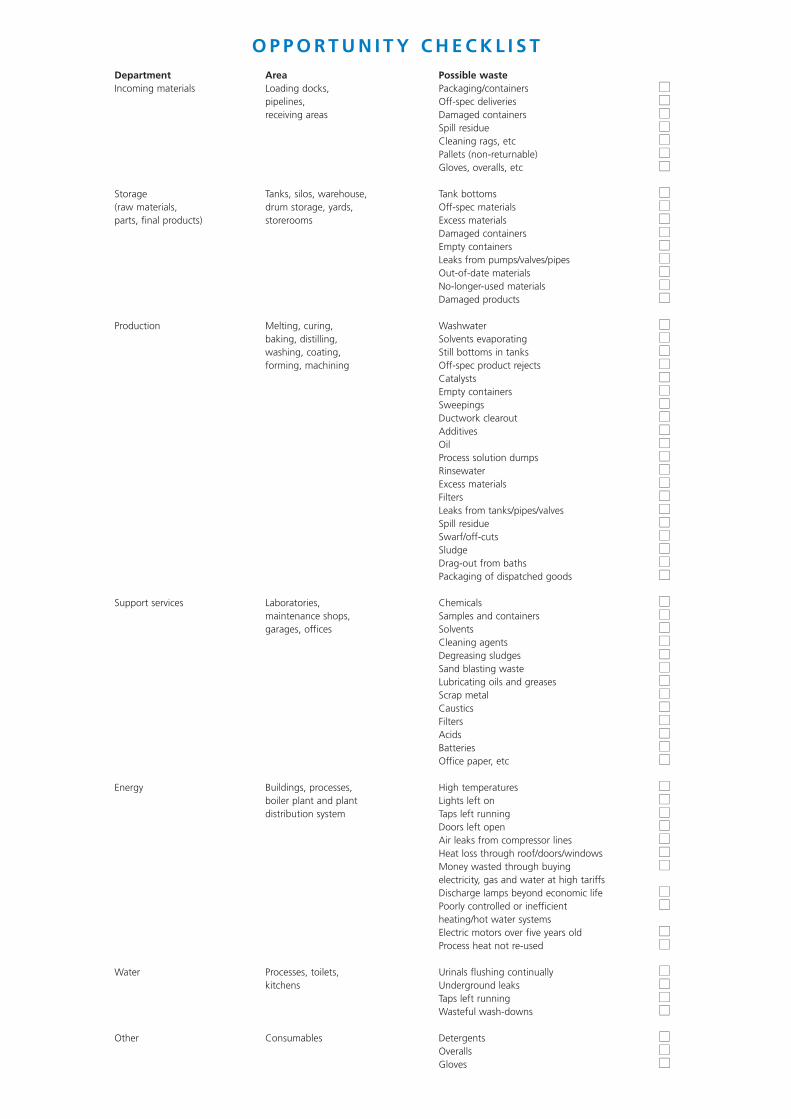
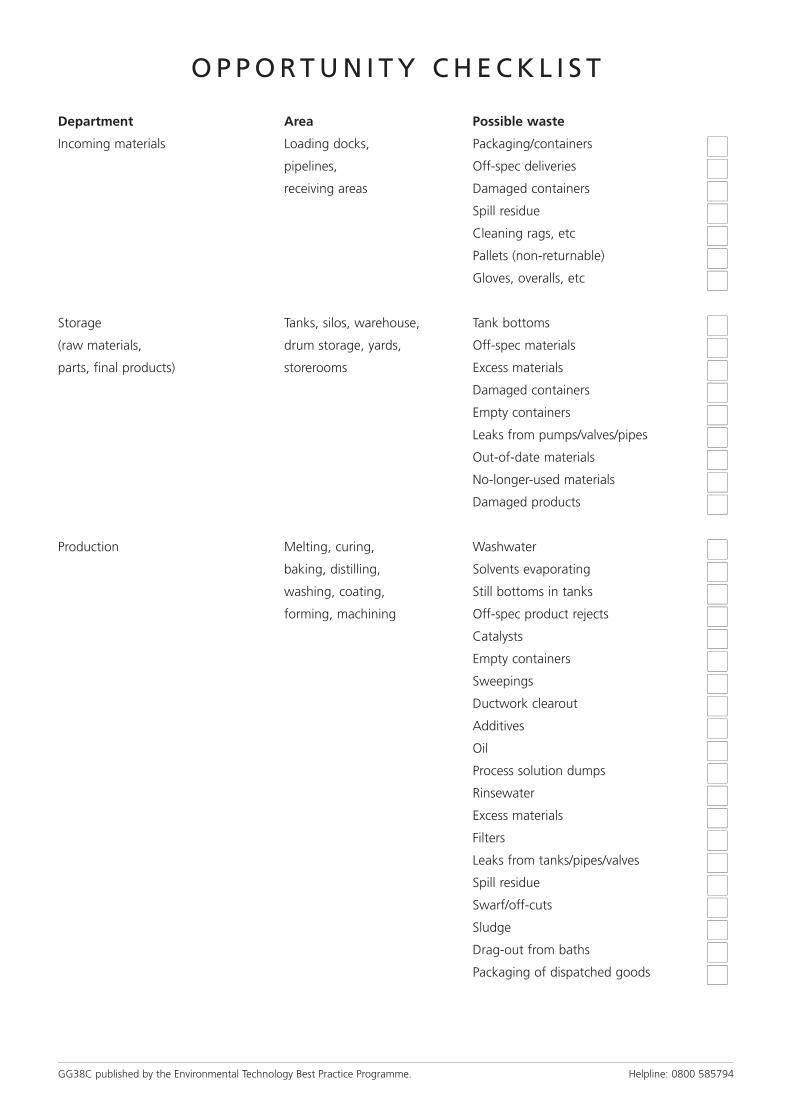
O P P O R T U N I T Y C H E C K L I S T Department Area Possible wasteIncoming materials Loading docks, Packaging/containers ■■
pipelines, Off-spec deliveries ■■receiving areas Damaged containers ■■
Spill residue ■■Cleaning rags, etc ■■Pallets (non-returnable) ■■Gloves, overalls, etc ■■
Storage Tanks, silos, warehouse, Tank bottoms ■■(raw materials, drum storage, yards, Off-spec materials ■■parts, final products) storerooms Excess materials ■■
Damaged containers ■■Empty containers ■■Leaks from pumps/valves/pipes ■■Out-of-date materials ■■No-longer-used materials ■■Damaged products ■■
Production Melting, curing, Washwater ■■baking, distilling, Solvents evaporating ■■washing, coating, Still bottoms in tanks ■■forming, machining Off-spec product rejects ■■
Catalysts ■■Empty containers ■■Sweepings ■■Ductwork clearout ■■Additives ■■Oil ■■Process solution dumps ■■Rinsewater ■■Excess materials ■■Filters ■■Leaks from tanks/pipes/valves ■■Spill residue ■■Swarf/off-cuts ■■Sludge ■■Drag-out from baths ■■Packaging of dispatched goods ■■
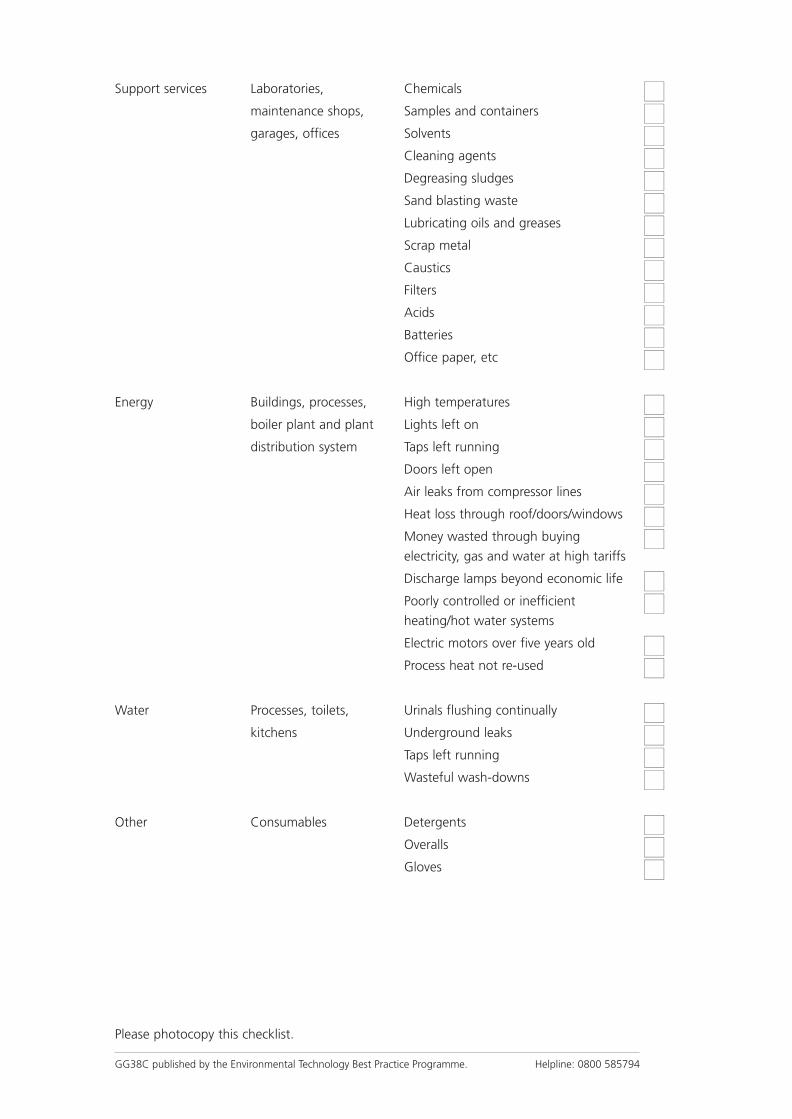
Support services Laboratories, Chemicals ■■maintenance shops, Samples and containers ■■garages, offices Solvents ■■
Cleaning agents ■■Degreasing sludges ■■Sand blasting waste ■■Lubricating oils and greases ■■Scrap metal ■■Caustics ■■Filters ■■Acids ■■Batteries ■■Office paper, etc ■■
Energy Buildings, processes, High temperatures ■■boiler plant and plant Lights left on ■■distribution system Taps left running ■■
Doors left open ■■Air leaks from compressor lines ■■Heat loss through roof/doors/windows ■■Money wasted through buying ■■electricity, gas and water at high tariffsDischarge lamps beyond economic life ■■Poorly controlled or inefficient ■■heating/hot water systemsElectric motors over five years old ■■Process heat not re-used ■■
Water Processes, toilets, Urinals flushing continually ■■kitchens Underground leaks ■■
Taps left running ■■Wasteful wash-downs ■■
Other Consumables Detergents ■■Overalls ■■Gloves ■■

O P P O R T U N I T Y C H E C K L I S T
Department Area Possible waste
Incoming materials Loading docks, Packaging/containers ■■pipelines, Off-spec deliveries ■■receiving areas Damaged containers ■■
Spill residue ■■Cleaning rags, etc ■■Pallets (non-returnable) ■■Gloves, overalls, etc ■■
Storage Tanks, silos, warehouse, Tank bottoms ■■(raw materials, drum storage, yards, Off-spec materials ■■parts, final products) storerooms Excess materials ■■
Damaged containers ■■Empty containers ■■Leaks from pumps/valves/pipes ■■Out-of-date materials ■■No-longer-used materials ■■Damaged products ■■
Production Melting, curing, Washwater ■■baking, distilling, Solvents evaporating ■■washing, coating, Still bottoms in tanks ■■forming, machining Off-spec product rejects ■■
Catalysts ■■Empty containers ■■Sweepings ■■Ductwork clearout ■■Additives ■■Oil ■■Process solution dumps ■■Rinsewater ■■Excess materials ■■Filters ■■Leaks from tanks/pipes/valves ■■Spill residue ■■Swarf/off-cuts ■■Sludge ■■Drag-out from baths ■■Packaging of dispatched goods ■■
GG38C published by the Environmental Technology Best Practice Programme. Helpline: 0800 585794

■ Demonstrate to senior management that waste reduction is an excellent cost-savingopportunity. Stress that it can also:
- help the company comply with environmental legislation;
- enhance product quality;
- improve the efficiency of the whole business operation.
Strong personal commitment from senior management can:
■ demonstrate visible leadership;
■ encourage employee participation;
■ set clear waste reduction targets;
■ draw up an environmental policy statement to promote a company-wide waste-reduction programme;
■ lead to including environmental information in the company’s annual report.
CHOOSING A CO-ORDINATOR
Someone from the staff should be selected to co-ordinate your waste reduction programme,since reducing waste in one area of the business may require action in other areas.
The co-ordinator needs three essential qualities:
■ management seniority/authority or direct access to senior management;
■ enthusiasm and the ability to motivate people;
■ a working knowledge of waste management or a willingness to learn.
Depending on the type and size of your company, this person could be the ManagingDirector, Production Manager or Quality Manager.
The co-ordinator’s main responsibilities are:
■ co-ordinating waste segregation and measurement;
■ identifying opportunities to prevent waste;
■ locating priority action areas within the business;
■ setting up waste reduction team(s);
■ allocating the ‘ownership of waste’ to various departments or individuals;
■ raising waste reduction awareness within the workplace;
■ creating monitoring systems that provide regular feedback to both managers and theworkforce - this is essential for success;
■ working with suppliers to identify areas for materials reduction or recovery.
This may sound a lot of work, but remember that the co-ordinator’s role is to co-ordinateand facilitate. It will be your waste reduction team, or teams, who will actually achieve theresults.
If you have been chosen to be a programme co-ordinator, you may find it helpful to readGood Practice Guide (GG27) Saving Money Through Waste Minimisation: Teams andChampions. This Guide, which describes the role of team leader or ‘champion’ in more detail,is available free through the Environmental Helpline on 0800 585794.
2
section
1
GG38C published by the Environmental Technology Best Practice Programme. Helpline: 0800 585794
GG38C published by the Environmental Technology Best Practice Programme. Helpline: 0800 585794
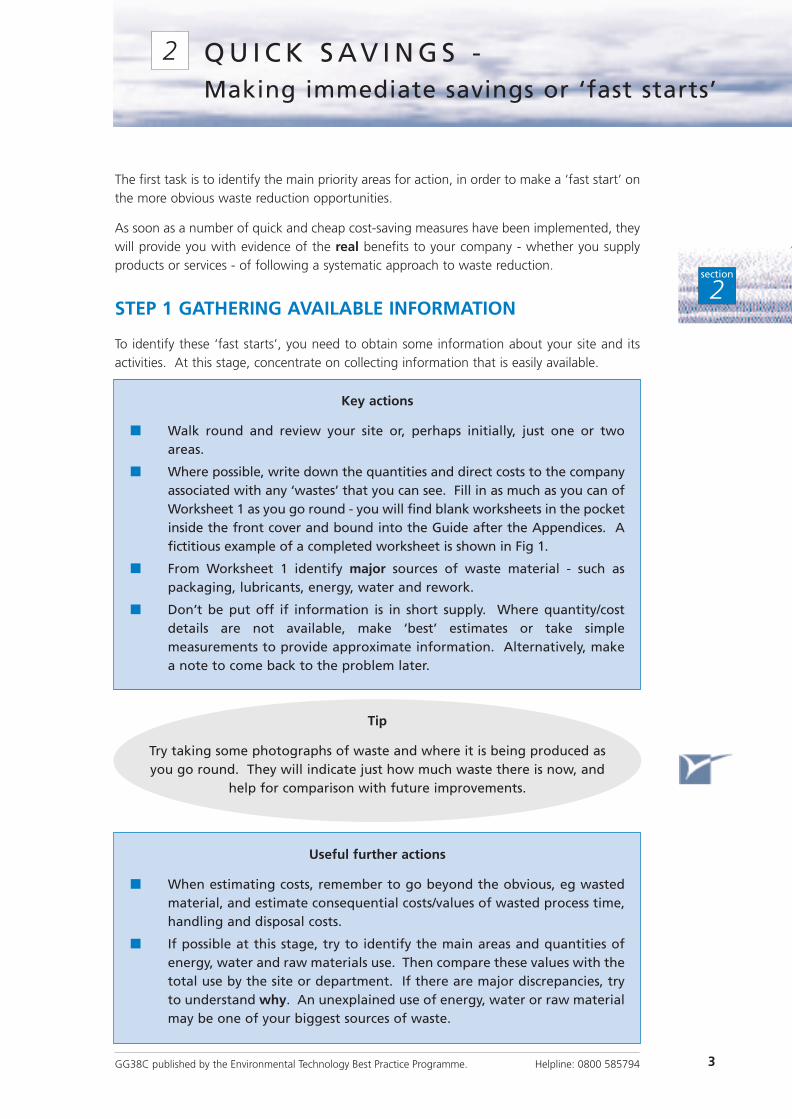
The first task is to identify the main priority areas for action, in order to make a ‘fast start’ onthe more obvious waste reduction opportunities.
As soon as a number of quick and cheap cost-saving measures have been implemented, theywill provide you with evidence of the real benefits to your company - whether you supplyproducts or services - of following a systematic approach to waste reduction.
STEP 1 GATHERING AVAILABLE INFORMATION
To identify these ‘fast starts’, you need to obtain some information about your site and itsactivities. At this stage, concentrate on collecting information that is easily available.
3
section
2
Q U I C K S AV I N G S - Making immediate savings or ‘fast starts’
2
Key actions
■ Walk round and review your site or, perhaps initially, just one or twoareas.
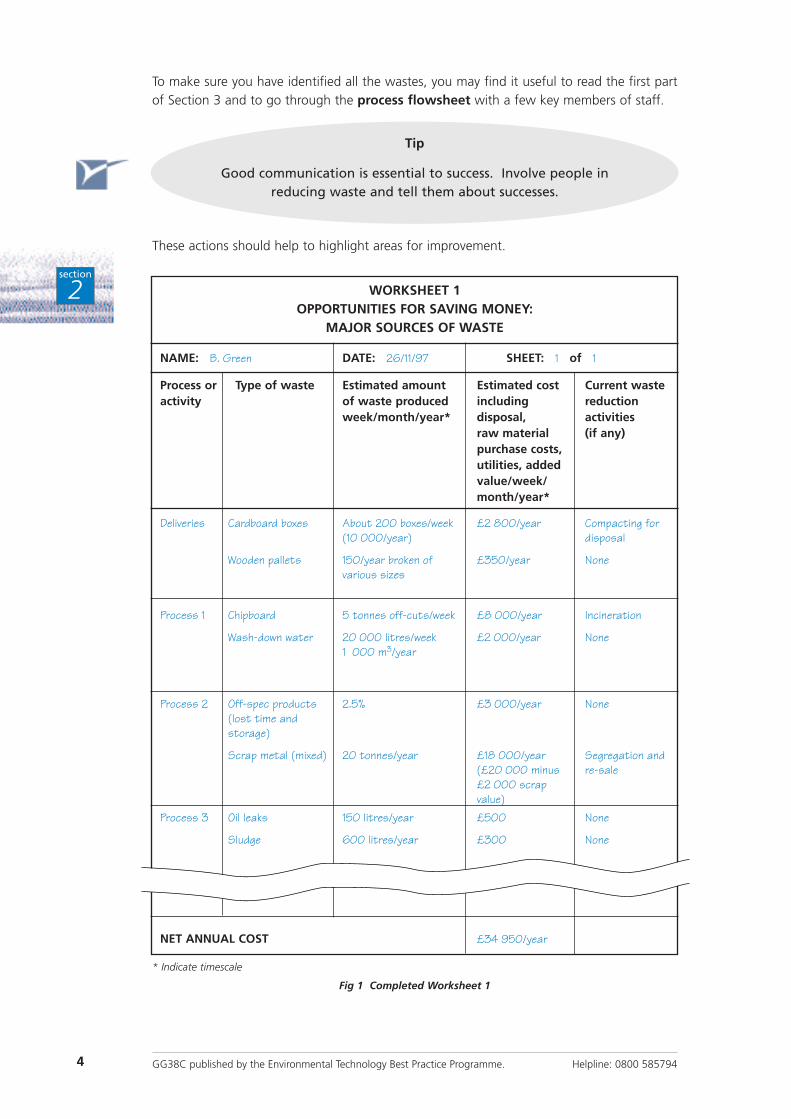
■ Where possible, write down the quantities and direct costs to the companyassociated with any ‘wastes’ that you can see. Fill in as much as you can ofWorksheet 1 as you go round - you will find blank worksheets in the pocketinside the front cover and bound into the Guide after the Appendices. Afictitious example of a completed worksheet is shown in Fig 1.
■ From Worksheet 1 identify major sources of waste material - such aspackaging, lubricants, energy, water and rework.
■ Don’t be put off if information is in short supply. Where quantity/costdetails are not available, make ‘best’ estimates or take simplemeasurements to provide approximate information. Alternatively, makea note to come back to the problem later.
Tip
Try taking some photographs of waste and where it is being produced asyou go round. They will indicate just how much waste there is now, and
help for comparison with future improvements.
Useful further actions
■ When estimating costs, remember to go beyond the obvious, eg wastedmaterial, and estimate consequential costs/values of wasted process time,handling and disposal costs.
■ If possible at this stage, try to identify the main areas and quantities ofenergy, water and raw materials use. Then compare these values with thetotal use by the site or department. If there are major discrepancies, tryto understand why. An unexplained use of energy, water or raw materialmay be one of your biggest sources of waste.
GG38C published by the Environmental Technology Best Practice Programme. Helpline: 0800 585794
To make sure you have identified all the wastes, you may find it useful to read the first partof Section 3 and to go through the process flowsheet with a few key members of staff.
These actions should help to highlight areas for improvement.
4
section
2
Tip
Good communication is essential to success. Involve people in reducing waste and tell them about successes.
WORKSHEET 1OPPORTUNITIES FOR SAVING MONEY:
MAJOR SOURCES OF WASTE
NAME: B. Green DATE: 26/11/97 SHEET: 1 of 1
Process or Type of waste Estimated amount Estimated cost Current wasteactivity of waste produced including reduction
week/month/year* disposal, activitiesraw material (if any)purchase costs,utilities, addedvalue/week/month/year*
Deliveries Cardboard boxes About 200 boxes/week £2 800/year Compacting for (10 000/year) disposal
Wooden pallets 150/year broken of £350/year Nonevarious sizes
Process 1 Chipboard 5 tonnes off-cuts/week £8 000/year Incineration
Wash-down water 20 000 litres/week £2 000/year None1 000 m3/year
Process 2 Off-spec products 2.5% £3 000/year None(lost time and storage)
Scrap metal (mixed) 20 tonnes/year £18 000/year Segregation and (£20 000 minus re-sale£2 000 scrap value)
Process 3 Oil leaks 150 litres/year £500 None
Sludge 600 litres/year £300 None
NET ANNUAL COST £34 950/year
* Indicate timescale
Fig 1 Completed Worksheet 1
GG38C published by the Environmental Technology Best Practice Programme. Helpline: 0800 585794
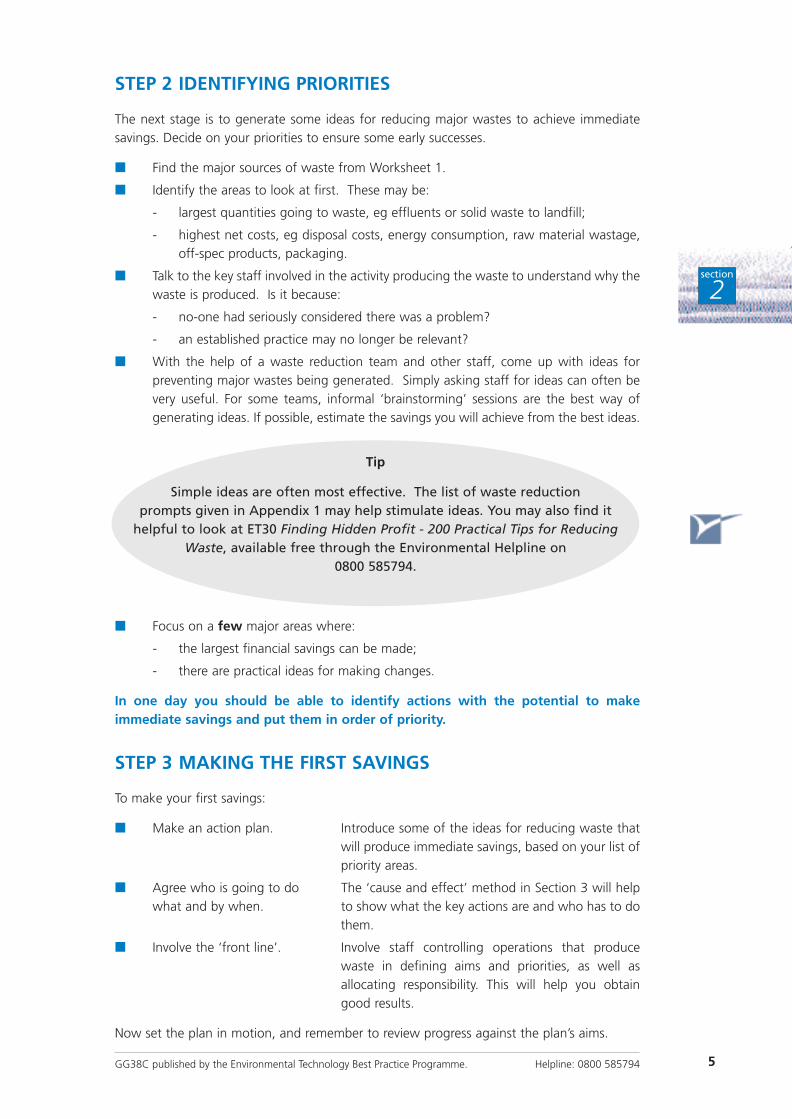
STEP 2 IDENTIFYING PRIORITIES
The next stage is to generate some ideas for reducing major wastes to achieve immediatesavings. Decide on your priorities to ensure some early successes.
■ Find the major sources of waste from Worksheet 1.
■ Identify the areas to look at first. These may be:
- largest quantities going to waste, eg effluents or solid waste to landfill;
- highest net costs, eg disposal costs, energy consumption, raw material wastage,off-spec products, packaging.
■ Talk to the key staff involved in the activity producing the waste to understand why thewaste is produced. Is it because:
- no-one had seriously considered there was a problem?
- an established practice may no longer be relevant?
■ With the help of a waste reduction team and other staff, come up with ideas forpreventing major wastes being generated. Simply asking staff for ideas can often bevery useful. For some teams, informal ‘brainstorming’ sessions are the best way ofgenerating ideas. If possible, estimate the savings you will achieve from the best ideas.
■ Focus on a few major areas where:
- the largest financial savings can be made;
- there are practical ideas for making changes.
In one day you should be able to identify actions with the potential to makeimmediate savings and put them in order of priority.
STEP 3 MAKING THE FIRST SAVINGS
To make your first savings:
■ Make an action plan. Introduce some of the ideas for reducing waste thatwill produce immediate savings, based on your list ofpriority areas.
■ Agree who is going to do The ‘cause and effect’ method in Section 3 will helpwhat and by when. to show what the key actions are and who has to do
them.
■ Involve the ‘front line’. Involve staff controlling operations that producewaste in defining aims and priorities, as well asallocating responsibility. This will help you obtaingood results.
Now set the plan in motion, and remember to review progress against the plan’s aims.
5
section
2
Tip
Simple ideas are often most effective. The list of waste reductionprompts given in Appendix 1 may help stimulate ideas. You may also find it
helpful to look at ET30 Finding Hidden Profit - 200 Practical Tips for ReducingWaste, available free through the Environmental Helpline on
0800 585794.

STEP 4 MEASURING SAVINGS
To demonstrate that savings are being made, it is necessary to measure:
Examples
■ Waste production. Skips per month.
Bins per week.
Effluent in m3 per month.
■ Raw material use. How much do you order per month?
How many consumables do you order per month, eg gloves, boxes of paper, oil, solvent?
■ Utility use. How much was your last bill?
As part of your action plan, you should make sure that simple measuring systems are in place.These must be both cost-effective and appropriate for your process. Decide on the level ofmeasurement necessary to check on progress, and include regular checks in your plan.
Existing simple methods of obtaining the necessary information include:
■ stock control information;
■ installed meters for energy and water - are there enough meters to make sense ofpatterns of use in the site or department?
Carry out some simple checks such as:
■ separating different types of important solid waste to allow you to measure wastesimply by weight or volume;
■ counting waste containers - which may be helpful for less important wastes, but is notas effective as weighing;
■ timing how long it takes to fill a bucket and multiplying up the time to estimatecontinuous liquid flows over a day or week.
Record measurements and retain them for reference.
STEP 5 ACHIEVING MORE SAVINGS
After a few months, progress reviews will provide concrete evidence that waste reduction isreally worth the commitment and effort. Take some more photographs to record any visiblechanges.
Use this evidence to convince management and employees that a full-blown waste reductionprogramme will be worthwhile for your company.
Utility Amount/month Cost (£/month)
Gas m3 £
Water m3 £
Electricity kWh £
Total £
GG38C published by the Environmental Technology Best Practice Programme. Helpline: 0800 5857946
section
2
GG38C published by the Environmental Technology Best Practice Programme. Helpline: 0800 585794
The two key techniques and key advice below will help you make quick savings and will alsohelp you develop a systematic approach for sustained long-term savings.
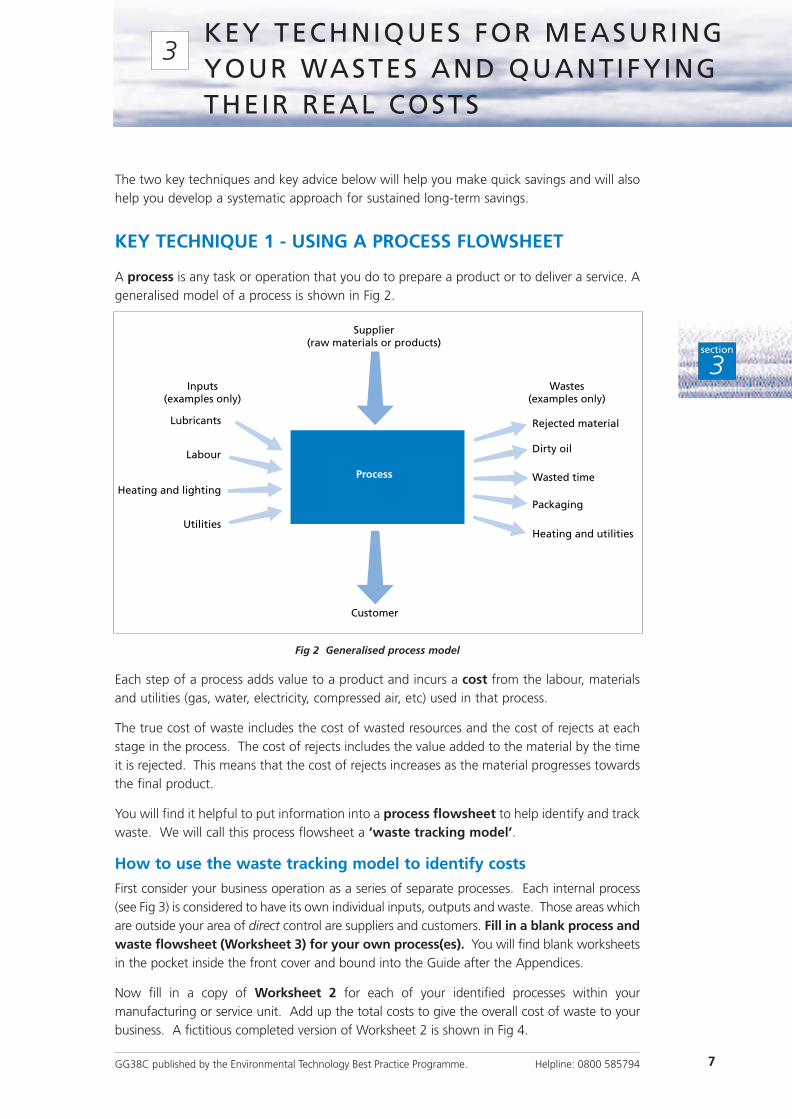
KEY TECHNIQUE 1 - USING A PROCESS FLOWSHEET
A process is any task or operation that you do to prepare a product or to deliver a service. Ageneralised model of a process is shown in Fig 2.
Fig 2 Generalised process model
Each step of a process adds value to a product and incurs a cost from the labour, materialsand utilities (gas, water, electricity, compressed air, etc) used in that process.
The true cost of waste includes the cost of wasted resources and the cost of rejects at eachstage in the process. The cost of rejects includes the value added to the material by the timeit is rejected. This means that the cost of rejects increases as the material progresses towardsthe final product.
You will find it helpful to put information into a process flowsheet to help identify and trackwaste. We will call this process flowsheet a ‘waste tracking model’.
How to use the waste tracking model to identify costs
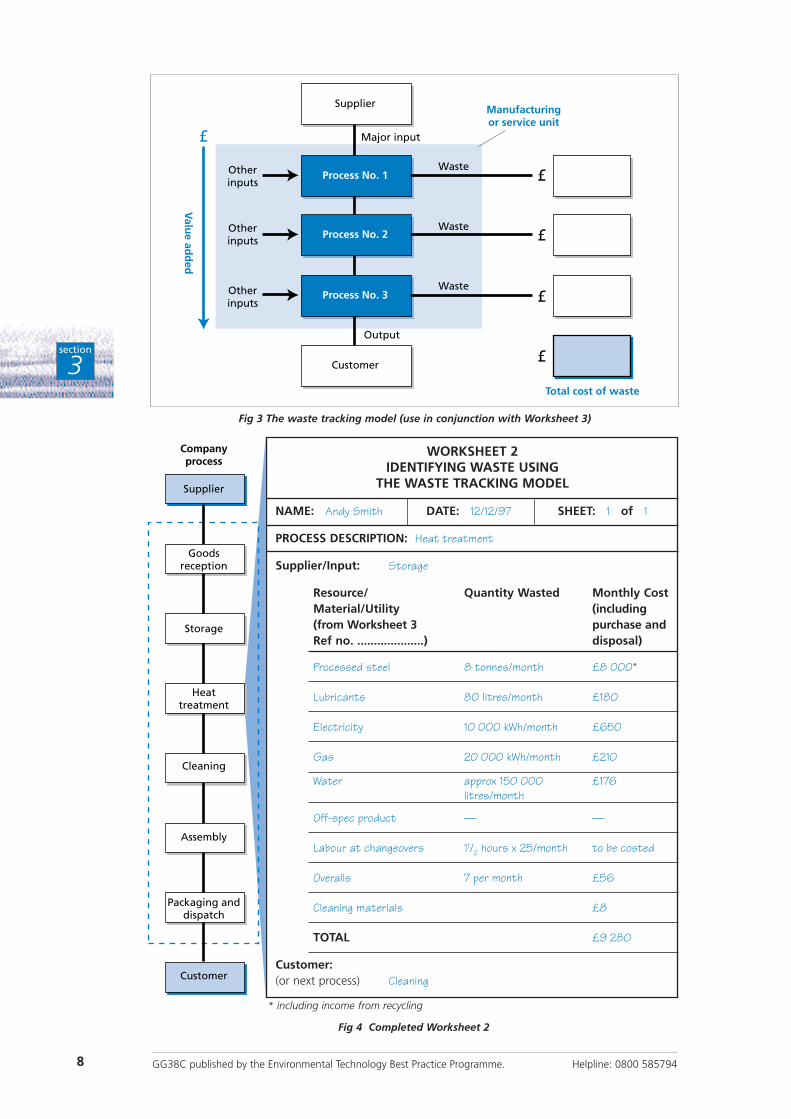
First consider your business operation as a series of separate processes. Each internal process(see Fig 3) is considered to have its own individual inputs, outputs and waste. Those areas whichare outside your area of direct control are suppliers and customers. Fill in a blank process andwaste flowsheet (Worksheet 3) for your own process(es). You will find blank worksheetsin the pocket inside the front cover and bound into the Guide after the Appendices.
Now fill in a copy of Worksheet 2 for each of your identified processes within yourmanufacturing or service unit. Add up the total costs to give the overall cost of waste to yourbusiness. A fictitious completed version of Worksheet 2 is shown in Fig 4.
7
section
3
KEY TECHNIQUES FOR MEASURINGYOUR WASTES AND QUANTIFYINGTHEIR REAL COSTS
3
Supplier(raw materials or products)
Labour
Lubricants
Heating and lighting
Utilities
Customer
Process
Wastes(examples only)
Inputs(examples only)
Rejected material
Dirty oil
Wasted time
Packaging
Heating and utilities
8
section
3
GG38C published by the Environmental Technology Best Practice Programme. Helpline: 0800 585794
Supplier
Total cost of waste
Process No. 1
Process No. 2
Process No. 3
Customer
Waste
Waste
Waste
Otherinputs
Otherinputs
Otherinputs
Output
Major input
£
£
£
£
£
Manufacturingor service unit
Valu
e add
ed
Fig 3 The waste tracking model (use in conjunction with Worksheet 3)
Supplier
Companyprocess
Goodsreception
Storage
Heattreatment
Cleaning
Assembly
Packaging anddispatch
Customer
WORKSHEET 2IDENTIFYING WASTE USING
THE WASTE TRACKING MODEL
NAME: Andy Smith DATE: 12/12/97 SHEET: 1 of 1
PROCESS DESCRIPTION: Heat treatment
Supplier/Input: Storage
Resource/ Quantity Wasted Monthly Cost Material/Utility (including (from Worksheet 3 purchase andRef no. ....................) disposal)
Processed steel 8 tonnes/month £8 000*
Lubricants 80 litres/month £180
Electricity 10 000 kWh/month £650
Gas 20 000 kWh/month £210
Water approx 150 000 £176litres/month
Off-spec product — —
Labour at changeovers 11/2 hours x 25/month to be costed
Overalls 7 per month £56
Cleaning materials £8
TOTAL £9 280
Customer:(or next process) Cleaning
* including income from recycling
Fig 4 Completed Worksheet 2
GG38C published by the Environmental Technology Best Practice Programme. Helpline: 0800 585794
If the information you need is not available, either make a ‘best’ guess or carry out somesimple measurements. At the same time, decide whether improved information collection isjustified.
You should now have a good picture of the ‘waste cost’ basis of your business. Bring togetherall the details obtained during the waste tracking exercise and see if there are anydiscrepancies in overall values, ie between identified and total actual water use, and rawmaterial and energy consumption. Dig deeper if there are major discrepancies. They mayrepresent a major cost - and a major savings opportunity!
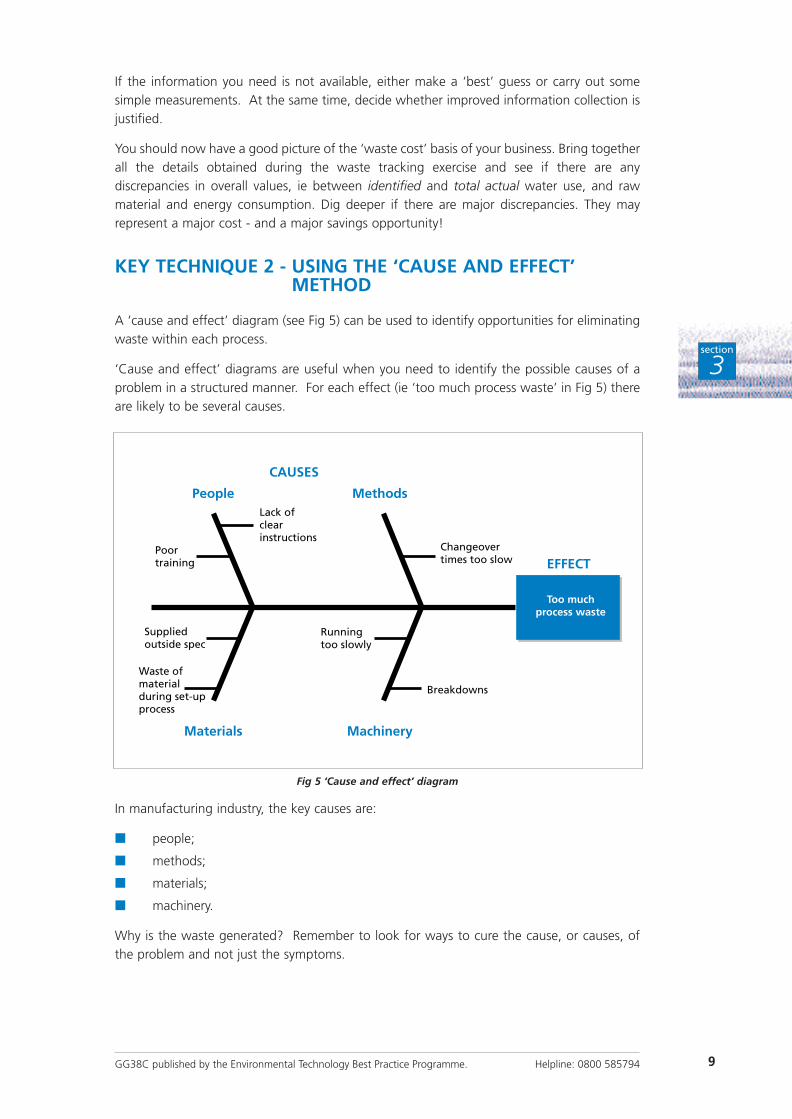
KEY TECHNIQUE 2 - USING THE ‘CAUSE AND EFFECT’METHOD
A ‘cause and effect’ diagram (see Fig 5) can be used to identify opportunities for eliminatingwaste within each process.
‘Cause and effect’ diagrams are useful when you need to identify the possible causes of aproblem in a structured manner. For each effect (ie ‘too much process waste’ in Fig 5) thereare likely to be several causes.
In manufacturing industry, the key causes are:
■ people;
■ methods;
■ materials;
■ machinery.
Why is the waste generated? Remember to look for ways to cure the cause, or causes, ofthe problem and not just the symptoms.
9
section
3
People Methods
MachineryMaterials
Changeover times too slow
Poortraining
Lack ofclearinstructions
Suppliedoutside spec
Waste ofmaterialduring set-upprocess
Runningtoo slowly
Breakdowns
Too muchprocess waste
EFFECT
CAUSES
Fig 5 ‘Cause and effect’ diagram
‘Cause and effect’ diagrams are a standard tool for quality improvement. The best recipe forsuccess is to:
■ ask the people who work on the process to suggest reasons (without recrimination) forthe problem;
■ list their suggestions against each cause;
■ involve everyone in the development of solutions;
■ implement no-cost measures as soon as possible.
Generating ideas
When considering ways to reduce waste generation and utility consumption, start with the‘bigger’ issues and then work down to smaller problems.
■ Challenge existing practices. Ask why things are done in a particular way.
■ Draw up a shortlist of options for improving performance, in conjunction with the keystaff in each department/unit. Select those options that emphasise cost saving andefficiency.
■ Assess possible savings.
■ Consider the practicality and timescale for making the necessary changes.
■ Where possible, allocate responsibility to staff in each department/unit for assessingand recommending opportunities. This encourages ‘ownership’ of the solution.
At this point, take another look through the list of waste reduction prompts in Appendix 1.Does anything on the list strike a chord? You may come across further ideas in ET30 FindingHidden Profit - 200 Practical Tips for Reducing Waste. This collection of wastebusting tipscovers:
■ invisible losses;
■ waste and materials management;
■ material handling;
■ process control and management;
■ examples from specific industrial sectors showing how to reduce process losses.
To obtain a free copy of ET30, contact the Environmental Helpline on 0800 585794.
For the best long-term benefits, look for solutions in the following order:
■ Waste prevention. This may involve a fundamental change in process, operation,product or raw material, so that the basic process produces less waste.
■ Waste reduction. This may mean streamlining processes, better housekeeping andlow-cost changes to avoid unnecessary waste from the existing process.
■ Waste re-use/recycle. This is about getting value from waste materials thatotherwise would have a disposal cost. It is more cost-effective to limit the productionof waste in the first place.
Implementing changes outside your direct control may require discussions with otherdepartments to ensure that the proposals conform with company strategy.
Improving the efficiency of your production methods may mean changing the way productsare made. Remember to ensure that product quality is maintained.
10
section
3
GG38C published by the Environmental Technology Best Practice Programme. Helpline: 0800 585794

GG38C published by the Environmental Technology Best Practice Programme. Helpline: 0800 585794 11
section
3
Key advice
To manage waste effectively and pinpoint where savings can be made, you mustidentify:
■ all the different types of waste produced by each of your company’sactivities;
■ the stage in the process at which they are produced.
Remember, the ‘product’ in a service company is the service your companyprovides. The ‘process’ is the series of steps you take in providing the service.
Important considerations
■ Consider your business operations as a number of separate processes, suchas:
- receipt/dispatch;
- fabrication;
- paint shop;
- stores;
- offices.
■ Consider all forms of wastage. This means:
- identifying where and why wastes arise;
- monitoring utility consumption in different areas and identifyingusers of gas, water and electricity.
■ Consider installing more meters, but only where the cost is justified by thepotential benefits. As a rule of thumb, savings will be 5%, 10% and 20%of the amount of electricity, gas and water respectively that wouldregister annually on the new meters.
■ Pin down waste generation and utility use to individual processes/departments. This is not to allocate ‘blame’, but to see where oppor-tunities exist for reducing waste.
■ Consider the time of day when wastes arise. Is waste production relatedto machine changeover, process cycles, startup/shutdown, etc?
Talk to operators of equipment and the people actually carrying out the process.Encourage ‘ownership’ of waste - this makes it easier to collect information. Atthis stage, information will probably be collected by several key employees andnot just the programme co-ordinator.
A successful waste reduction programme changes people’s attitudes to waste. They come torealise that the true cost of waste includes conversion and rework costs, in addition tomaterial and disposal costs. Everyone within the company must appreciate that waste is ameasure of operational efficiency that has a direct impact on the profitability, survival andgrowth of the business.
As you worked through Section 2, you will have made some early savings and begun todevelop the attitude your company needs to build upon these achievements.
A more detailed systematic approach to waste reduction is discussed in a series of threecomplementary Guides, available free through the Environmental Helpline on 0800 585794.
■ Saving Money Through Waste Minimisation: Raw Material Use (GG25)
■ Saving Money Through Waste Minimisation: Reducing Water Use (GG26)
■ Saving Money Through Waste Minimisation: Teams and Champions (GG27)
This systematic approach to waste reduction involves the same basic principles outlined inSection 2. To achieve even greater savings and lasting benefits for your company, theseprinciples have to be applied more thoroughly:
■ Step 1 Measuring your wastes and counting their real costs.
■ Step 2 Solving problems by a ‘cause and effect’ method.
■ Step 3 Identifying priorities for action.
■ Step 4 Implementing change.
■ Step 5 Measuring benefits.
■ Step 6 Reviewing progress.
For further free help or advice on implementing a waste reduction programme, call theEnvironmental Helpline on 0800 585794.
The Environmental Helpline can:
■ answer your queries about environmental issues, legislation or technology - up to twohours per query;
■ tell you about waste minimisation clubs and workshops;
■ send you copies of relevant Environmental Technology Best Practice Programmepublications, including free Guides and Case Studies on cost-effective ways to reducewaste at source;
■ suggest other sources of information;
■ arrange for a specialist to contact your company.
For smaller companies, the Helpline offers a free half-day counselling visit. For detailscontact the Environmental Helpline on freephone 0800 585794.
12
section
4
GG38C published by the Environmental Technology Best Practice Programme. Helpline: 0800 585794
T H E F U T U R E A N D A D D I T I O N A L H E L P
4
GG38C published by the Environmental Technology Best Practice Programme. Helpline: 0800 585794
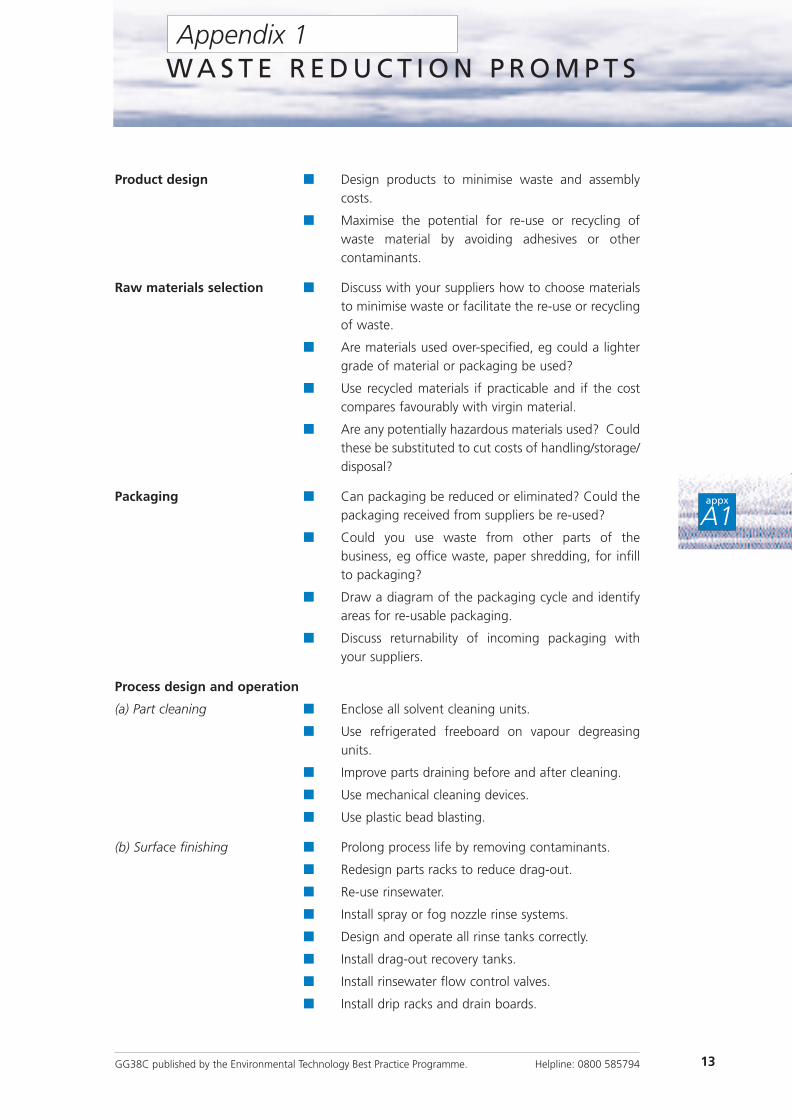
Product design ■ Design products to minimise waste and assemblycosts.
■ Maximise the potential for re-use or recycling ofwaste material by avoiding adhesives or othercontaminants.
Raw materials selection ■ Discuss with your suppliers how to choose materialsto minimise waste or facilitate the re-use or recyclingof waste.
■ Are materials used over-specified, eg could a lightergrade of material or packaging be used?
■ Use recycled materials if practicable and if the costcompares favourably with virgin material.
■ Are any potentially hazardous materials used? Couldthese be substituted to cut costs of handling/storage/disposal?
Packaging ■ Can packaging be reduced or eliminated? Could thepackaging received from suppliers be re-used?
■ Could you use waste from other parts of thebusiness, eg office waste, paper shredding, for infillto packaging?
■ Draw a diagram of the packaging cycle and identifyareas for re-usable packaging.
■ Discuss returnability of incoming packaging withyour suppliers.
Process design and operation
(a) Part cleaning ■ Enclose all solvent cleaning units.
■ Use refrigerated freeboard on vapour degreasingunits.
■ Improve parts draining before and after cleaning.
■ Use mechanical cleaning devices.
■ Use plastic bead blasting.
(b) Surface finishing ■ Prolong process life by removing contaminants.
■ Redesign parts racks to reduce drag-out.
■ Re-use rinsewater.
■ Install spray or fog nozzle rinse systems.
■ Design and operate all rinse tanks correctly.
■ Install drag-out recovery tanks.
■ Install rinsewater flow control valves.
■ Install drip racks and drain boards.
13
W A S T E R E D U C T I O N P R O M P T SAppendix 1
appx
A1

(c) Surface coating ■ Use high-volume low-pressure spray guns.
■ Use electrostatic spray coating systems.
■ Control coating viscosity with heat units.
■ Use powder coatings.
■ Use high solids coatings.
(d) Equipment cleaning ■ Use high pressure rinse systems.
■ Use mechanical wipers.
■ Use a countercurrent rinse sequence.
■ Re-use spent rinse water.
■ Use ‘pigs’ to clean lines.
■ Use compressed gas to blow out lines.
(e) Spills/leaks ■ Use bellows-sealed valves.
■ Install spill basins or bunds.
■ Use seal-less pumps.
■ Maximise use of welded pipe joints.
■ Install splash guards and drip boards.
■ Install overflow control devices.
(f) Maintenance ■ Purify and re-use coolant on machine tools.
■ Rationalise uses of lubricating oils to extend oilchange times and cut quantities stored.
Water use and discharge ■ Evaluate water charges, and sewerage and effluentdisposal costs to determine weekly/daily figures.
■ Locate and cure any leaks.
■ Use manual spray guns to control wash-down use.
■ Examine potential for re-use of water, eg wash-downs.
■ Can effluent be economically treated on-site toreduce disposal charges? Is there scope for sharingtreatment facilities with adjacent businesses?
■ Fit an occupancy control if you have urinals flushinground the clock.
Energy management ■ Measure energy used in the manufacturing process.
■ What does your energy cost? Check that tariffs areappropriate.
■ How much energy are you consuming? How does itvary?
■ Measure your performance on a routine basis.
■ Survey the heating system to check the efficiency of:
- boiler;
- pipe insulation;
- control system for time/temperatures.
14 GG38C published by the Environmental Technology Best Practice Programme. Helpline: 0800 585794
appx
A1
GG38C published by the Environmental Technology Best Practice Programme. Helpline: 0800 585794
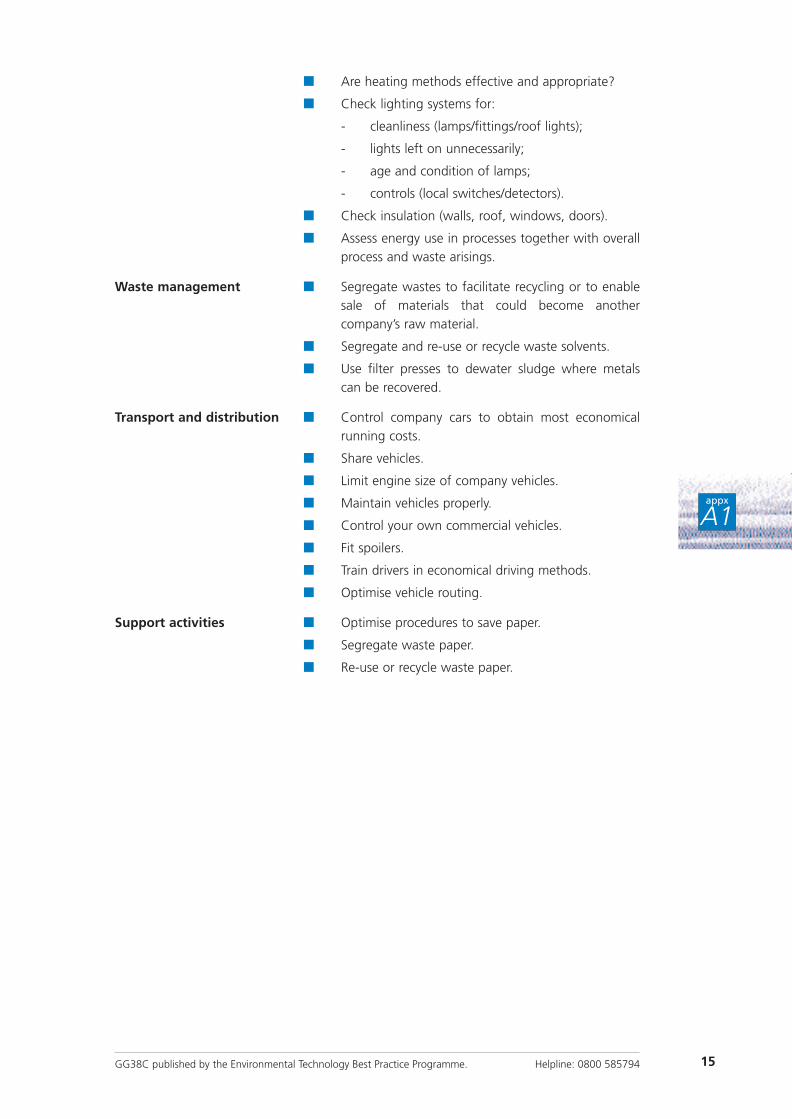
■ Are heating methods effective and appropriate?
■ Check lighting systems for:
- cleanliness (lamps/fittings/roof lights);
- lights left on unnecessarily;
- age and condition of lamps;
- controls (local switches/detectors).
■ Check insulation (walls, roof, windows, doors).
■ Assess energy use in processes together with overallprocess and waste arisings.
Waste management ■ Segregate wastes to facilitate recycling or to enablesale of materials that could become anothercompany’s raw material.
■ Segregate and re-use or recycle waste solvents.
■ Use filter presses to dewater sludge where metalscan be recovered.
Transport and distribution ■ Control company cars to obtain most economicalrunning costs.
■ Share vehicles.
■ Limit engine size of company vehicles.
■ Maintain vehicles properly.
■ Control your own commercial vehicles.
■ Fit spoilers.
■ Train drivers in economical driving methods.
■ Optimise vehicle routing.
Support activities ■ Optimise procedures to save paper.
■ Segregate waste paper.
■ Re-use or recycle waste paper.
15
appx
A1

Proper control of raw materials, intermediate products, final products and waste streams isan important waste reduction technique. Inadequate inventory control leads to two majorsources of waste, out-of-date and no-longer-used raw materials. Inventory controls rangefrom simple changes in ordering procedures to implementing just-in-time manufacturingtechniques.
■ Can your company reduce waste by tightening up and extending its existing inventorycontrol programmes?
Buying only the amount of raw material needed for a production run or a set period of timeis one of the keys to improved inventory control. Excess inventory often has to be disposedof because it goes out-of-date. You should therefore:
■ make sure inventory management procedures are applied;
■ educate staff in the purchasing department about the problems and costs of disposingof excess materials;
■ examine specified expiry dates (especially for stable compounds) to see if they are tooshort.
The development of review procedures for all purchased materials is another importantaspect of inventory control. Your company’s standard procedures should require all materialsto be approved prior to purchase.
■ Check whether a raw material contains any hazardous constituents, and if so, whethersuitable non-hazardous substitutes are available.
■ Make sure your chemical supplier sends you the relevant Material Safety Data Sheets.
‘Just-in-time manufacturing’ is the ultimate in inventory control since it eliminates the needfor an inventory. Raw materials are moved directly from the receiving dock to themanufacturing area for immediate use. The final product is then shipped out without anyintermediate storage. Just-in-time manufacturing is a complex operation and is notapplicable to all businesses. However, it can reduce waste significantly.
16
appx
A2
GG38C published by the Environmental Technology Best Practice Programme. Helpline: 0800 585794
I N V E N T O R Y M A N A G E M E N TAppendix 2

GG38C published by the Environmental Technology Best Practice Programme. Helpline: 0800 585794
*Indicate timescale
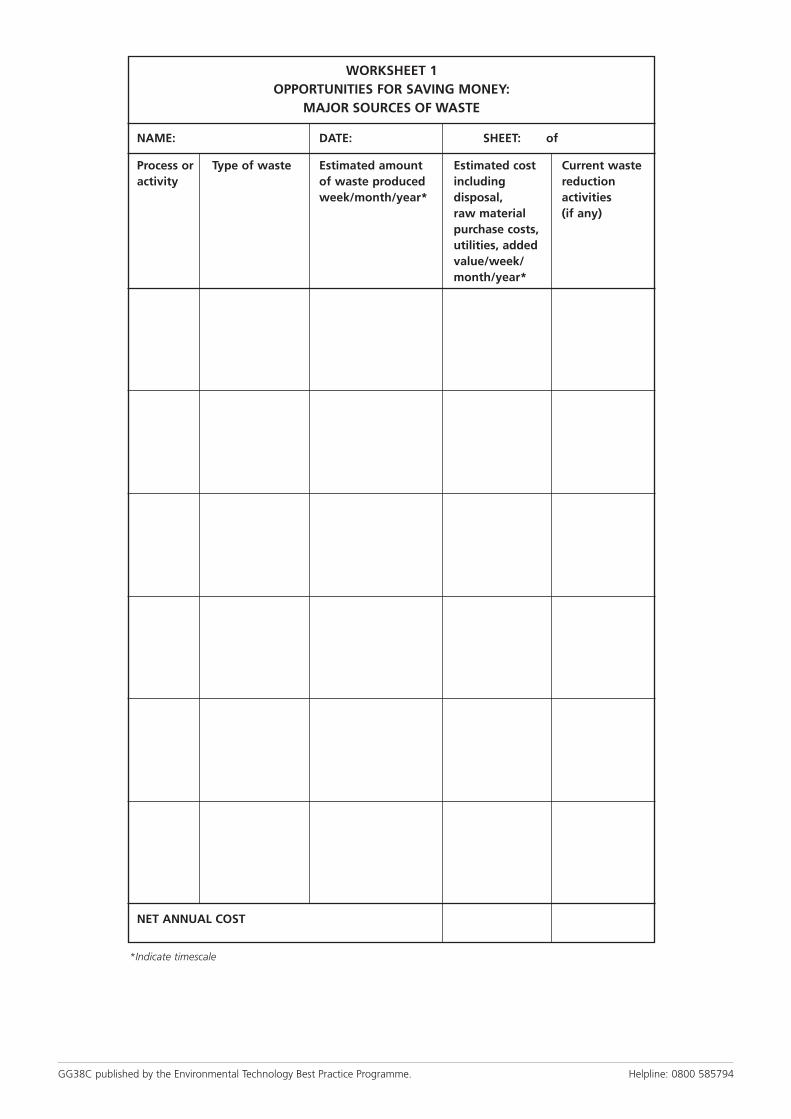
Please photocopy this worksheet.
WORKSHEET 1OPPORTUNITIES FOR SAVING MONEY:
MAJOR SOURCES OF WASTE
NAME: DATE: SHEET: of
Process or Type of waste Estimated amount Estimated cost Current wasteactivity of waste produced including reduction
week/month/year* disposal, activitiesraw material (if any)purchase costs,utilities, addedvalue/week/month/year*
NET ANNUAL COST

Please photocopy this worksheet.
GG38C published by the Environmental Technology Best Practice Programme. Helpline: 0800 585794
WORKSHEET 2IDENTIFYING WASTE USING
THE WASTE TRACKING MODEL
NAME: DATE: SHEET: of
PROCESS DESCRIPTION:
Supplier/Input:
Resource/ Quantity Wasted Monthly Cost
Material/Utility (including
(from Worksheet 3 purchase and
Ref no. ....................) disposal)
TOTAL
Customer:
(or next process)

GG38C published by the Environmental Technology Best Practice Programme. Helpline: 0800 585794
Please photocopy this worksheet.
Process name
InputsInput quantitiesWaste and
quantities/costs
Process name
Process name
WORKSHEET 3PROCESS AND WASTE FLOWSHEET (See Fig 3 in text) Ref no. .................
To customer or next flowsheet

GG38C published by the Environmental Technology Best Practice Programme. Helpline: 0800 585794
O P P O R T U N I T Y C H E C K L I S T
Department Area Possible waste
Incoming materials Loading docks, Packaging/containers ■■pipelines, Off-spec deliveries ■■receiving areas Damaged containers ■■
Spill residue ■■Cleaning rags, etc ■■Pallets (non-returnable) ■■Gloves, overalls, etc ■■
Storage Tanks, silos, warehouse, Tank bottoms ■■(raw materials, drum storage, yards, Off-spec materials ■■parts, final products) storerooms Excess materials ■■
Damaged containers ■■Empty containers ■■Leaks from pumps/valves/pipes ■■Out-of-date materials ■■No-longer-used materials ■■Damaged products ■■
Production Melting, curing, Washwater ■■baking, distilling, Solvents evaporating ■■washing, coating, Still bottoms in tanks ■■forming, machining Off-spec product rejects ■■
Catalysts ■■Empty containers ■■Sweepings ■■Ductwork clearout ■■Additives ■■Oil ■■Process solution dumps ■■Rinsewater ■■Excess materials ■■Filters ■■Leaks from tanks/pipes/valves ■■Spill residue ■■Swarf/off-cuts ■■Sludge ■■Drag-out from baths ■■Packaging of dispatched goods ■■
Please photocopy this checklist.
GG38C published by the Environmental Technology Best Practice Programme. Helpline: 0800 585794
Support services Laboratories, Chemicals ■■maintenance shops, Samples and containers ■■garages, offices Solvents ■■
Cleaning agents ■■Degreasing sludges ■■Sand blasting waste ■■Lubricating oils and greases ■■Scrap metal ■■Caustics ■■Filters ■■Acids ■■Batteries ■■Office paper, etc ■■
Energy Buildings, processes, High temperatures ■■boiler plant and plant Lights left on ■■distribution system Taps left running ■■
Doors left open ■■Air leaks from compressor lines ■■Heat loss through roof/doors/windows ■■Money wasted through buying ■■electricity, gas and water at high tariffs
Discharge lamps beyond economic life ■■Poorly controlled or inefficient ■■heating/hot water systems
Electric motors over five years old ■■Process heat not re-used ■■
Water Processes, toilets, Urinals flushing continually ■■kitchens Underground leaks ■■
Taps left running ■■Wasteful wash-downs ■■
Other Consumables Detergents ■■Overalls ■■Gloves ■■
Please photocopy this checklist.
O P P O R T U N I T Y C H E C K L I S T
Department Area Possible waste
Incoming materials Loading docks, Packaging/containers ■■pipelines, Off-spec deliveries ■■receiving areas Damaged containers ■■
Spill residue ■■Cleaning rags, etc ■■Pallets (non-returnable) ■■Gloves, overalls, etc ■■
Storage Tanks, silos, warehouse, Tank bottoms ■■(raw materials, drum storage, yards, Off-spec materials ■■parts, final products) storerooms Excess materials ■■
Damaged containers ■■Empty containers ■■Leaks from pumps/valves/pipes ■■Out-of-date materials ■■No-longer-used materials ■■Damaged products ■■
Production Melting, curing, Washwater ■■baking, distilling, Solvents evaporating ■■washing, coating, Still bottoms in tanks ■■forming, machining Off-spec product rejects ■■
Catalysts ■■Empty containers ■■Sweepings ■■Ductwork clearout ■■Additives ■■Oil ■■Process solution dumps ■■Rinsewater ■■Excess materials ■■Filters ■■Leaks from tanks/pipes/valves ■■Spill residue ■■Swarf/off-cuts ■■Sludge ■■Drag-out from baths ■■Packaging of dispatched goods ■■
GG38C published by the Environmental Technology Best Practice Programme. Helpline: 0800 585794
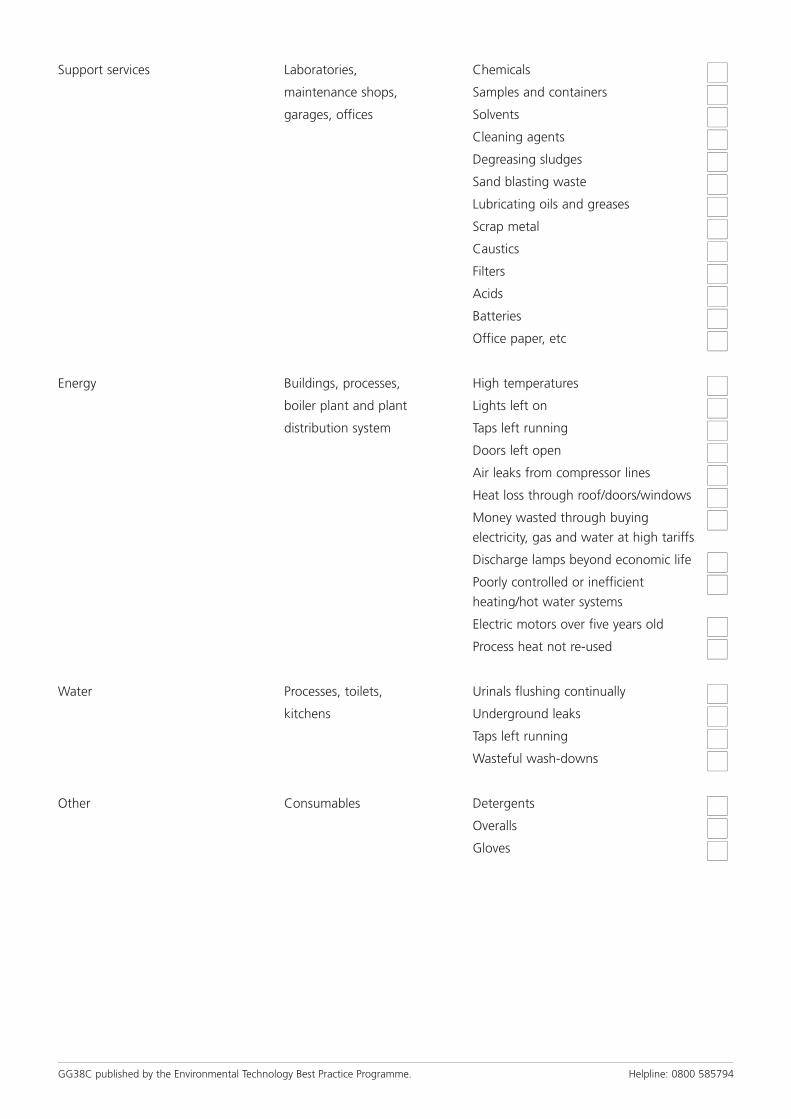
Support services Laboratories, Chemicals ■■maintenance shops, Samples and containers ■■garages, offices Solvents ■■
Cleaning agents ■■Degreasing sludges ■■Sand blasting waste ■■Lubricating oils and greases ■■Scrap metal ■■Caustics ■■Filters ■■Acids ■■Batteries ■■Office paper, etc ■■
Energy Buildings, processes, High temperatures ■■boiler plant and plant Lights left on ■■distribution system Taps left running ■■
Doors left open ■■Air leaks from compressor lines ■■Heat loss through roof/doors/windows ■■Money wasted through buying ■■electricity, gas and water at high tariffs
Discharge lamps beyond economic life ■■Poorly controlled or inefficient ■■heating/hot water systems
Electric motors over five years old ■■Process heat not re-used ■■
Water Processes, toilets, Urinals flushing continually ■■kitchens Underground leaks ■■
Taps left running ■■Wasteful wash-downs ■■
Other Consumables Detergents ■■Overalls ■■Gloves ■■
GG38C published by the Environmental Technology Best Practice Programme. Helpline: 0800 585794
GG38C published by the Environmental Technology Best Practice Programme. Helpline: 0800 585794
*Indicate timescale
WORKSHEET 1OPPORTUNITIES FOR SAVING MONEY:
MAJOR SOURCES OF WASTE
NAME: DATE: SHEET: of
Process or Type of waste Estimated amount Estimated cost Current wasteactivity of waste produced including reduction
week/month/year* disposal, activitiesraw material (if any)purchase costs,utilities, addedvalue/week/month/year*
NET ANNUAL COST

GG38C published by the Environmental Technology Best Practice Programme. Helpline: 0800 585794
WORKSHEET 2IDENTIFYING WASTE USING
THE WASTE TRACKING MODEL
NAME: DATE: SHEET: of
PROCESS DESCRIPTION:
Supplier/Input:
Resource/ Quantity Wasted Monthly Cost
Material/Utility (including
(from Worksheet 3 purchase and
Ref no. ....................) disposal)
TOTAL
Customer:
(or next process)

GG38C published by the Environmental Technology Best Practice Programme.
Process
InpInput quantities
Process
Process
WORKSPROCESS AND WA(See Fig 3 in text) R
To customer or

Helpline: 0800 585794
s name
puts
Waste andquantities/costs
s name
s name
HEET 3ASTE FLOWSHEET Ref no. .................
next flowsheet