Embed Size (px)
Citation preview
Customer service and operational performance reportQuarter 1 (1 April – 26 June 2021)

Document Title Here 2
•
3 Introduction
4 Our scorecard
5 Operations 6 Passenger journeys 7 Bus journey time8 Services operated 12 Roads and traffic
14 Customers15 TfL cares about its customers 17 Satisfaction18 Calls23 Complaints24 Commendations25 Tickets26 System availability27 Digital28 Transport innovation29 Travel demand management 30 Campaigns32 Consultations33 London Assembly scrutiny
34 Glossary
Contents

Customer service and operational performance report 3 Customer service and operational performance report 3
We continue to play our part in supporting London’s recovery from the coronavirus pandemic. Now, more than ever, our customers expect a safe and reliable transport network, offering value for money and innovation. We put customers at the heart of everything we do. We are committed to listening to them, focusing on tackling their most common day-to-day frustrations, while investing to improve journeys.
To reassure customers as they return to the network, we have launched one of our biggest ever campaigns to remind them that, wherever they want to go, we’ll get them there safely, quickly and sustainably. This is reflected in increasing passenger numbers and our highest-ever scores for most of our customer care metrics.
TfL Go, our real-time travel app, has been crucial in our recovery campaign. Customers can get real-time ‘busyness’ information for London Underground stations alongside the quieter times to travel, to reassure people as they return to the network. For the first time, we are showing detailed accessibility information, including live step-free access, to make our network inclusive and welcoming for everyone.
This report shows we have experienced the same challenges as other businesses and services, with our staff being unable to work at certain times, whether due to self-isolation, shielding or new working practices to comply with Government restrictions. Despite this, we have been able to deliver a near-full level of service.
IntroductionThis report reviews our operational performance and customer service in the first quarter of 2021/22
We are extremely proud of our colleagues and partner organisations who have shown their dedication in supporting Londoners and each other.
More people are returning to our network, with the latest figures showing that more than two million journeys are being made on the Tube most weekdays, and more than four million journeys every weekday on London’s buses. Research also shows that three quarters of Londoners have used public transport in the last month.
We want to reassure customers as they return to our transport network
Andy LordManaging Director London Underground and TfL Engineering
Gareth PowellManaging Director Surface Transport
Vernon EverittManaging Director Customers, Communication and Technology

Customer service and operational performance report 4 Customer service and operational performance report 4
Our scorecardMeasuring the reliability of our services and the progress of London’s recovery
Measure2021/22
Year-to-date actual2021/22
Year-to-date target2021/22
Full-year forecast2021/22
Full-year target
Operations
Passenger journeys – London Underground, Buses, London Overground, Trams, DLR, TfL Rail, Cycle Hire – compared to pre-coronavirus levels (%) 55 35 67 67
Bus journey time (minutes) 31.6 31.0 32.6 32.6
London Underground trips operated against schedule (%) 90.1 88.0 91.0 91.0
Customer
TfL cares about its customers (%) 57 56 58 56
Our scorecard for 2021/22 continues to focus on the recovery of the organisation and the Capital from the pandemic.
Scrutiny of our performance against the measures included here is the responsibility of the TfL Board’s Customer Service and Operational Performance Panel.
In the operations section of this report, passenger journeys set the context for the metrics that follow. We have structured this section by metric rather than by operational area to provide a more thematic approach, which reflects the scorecard. For operational areas not included on the scorecard, we have included the metric used at an operating business level to provide appropriate insight.
Scorecard measures in this reportIn this report, the scorecard measures are marked like this.

Customer service and operational performance report 5
OperationsProviding safe, clean and reliable services to support the recovery

Customer service and operational performance report 6
Coronavirus has had an unprecedented impact on passenger numbers, which have fluctuated considerably during the pandemic.
Passenger journeys have seen significant growth since the easing of Government restrictions, with total TfL journeys increasing to 55 per cent of pre-pandemic levels at the end of Q1.
Passenger journeys*Past five quarters (millions) Compared to pre-coronavirus baseline (%)
0
100
200
300
400
500
600
TfL RailRail
BusesLondon Underground
Q1 2021/22Q4 2020/21Q3 2020/21Q2 2020/21Q1 2020/21
26
11012
2150
87
236
29
105
280
35 7
427
6
358
78
239
30 5
352
128
306
41 7
482
0
20
40
60
80
100
Q4 2021/22Q3 2021/22Q2 2021/22Q1 2021/22Q4 2020/21
Budget Actual
We continue to run near-normal levels of service across the public transport network and offer a wide range of active travel options.
Despite the challenges presented by the pandemic, we worked hard to ensure that key workers were provided with a reliable service. We are closely monitoring our operations and working collaboratively to deliver the best service possible to our customers as they return in increasing numbers to the network.
Passenger journeys
* Q4 is longer than Q1 to Q3 (16 weeks and one day vs 12 weeks)

Customer service and operational performance report 7
Bus journey time is an accumulation of all the stages of a customer’s journey experience, measured in minutes.
It enables us to monitor the performance of our bus service from the perspective of our customers, helping us to better understand how to encourage the public back onto our network as we recover from the pandemic.
Bus journey time*Past five quarters (minutes) Annual trend (moving average)
29
30
31
32
33
Weighted customer journey time
Q1 2021/22Q4 2020/21Q3 2020/21Q2 2020/21Q1 2020/21
XXX
30.1
31.2
30.0
31.6
29
30
31
32
33
Weighted customer journey time
2021/222020/212019/202018/192017/18
Customer journey times have fluctuated during the coronavirus pandemic, in line with the recovery of bus demand and road traffic volumes. Periods with lockdowns (Q2 and Q4 2020/21) saw shorter journey times, whereas periods without lockdowns showed a recovery in bus journeys and road traffic, resulting in longer journey times. Q1 2021/22 values were also higher due to increased roadworks, negatively affecting road conditions, average bus speeds and reliability.
After improvements in average journey times in 2019/20 compared to previous years, journey times improved substantially again in 2020/21 due to the coronavirus pandemic. Fewer journeys were made (especially in the first lockdown) and there was less road traffic, which led to improvements in bus speeds and excess wait times. Journey times increased in Q1 2021/22, mainly due to increased demand, traffic volumes and roadworks, but remain much better than pre-pandemic values.
Bus journey time
* No data available for Q1 2020/21 due to middle door boarding

Customer service and operational performance report 8
London Underground trips operated, against schedule Past five quarters (%) Annual trend (moving average)*
Elizabeth line (TfL Rail) public performance measure Past five quarters (%)
50
60
70
80
90
100
Trips operated, against schedule
Q1 2021/22Q4 2020/21Q3 2020/21Q2 2020/21Q1 2020/2193
94
95
96
97
98
99
100
Public performance
Q1 2021/22Q4 2020/21Q3 2020/21Q2 2020/21Q1 2020/21
Since the start of the pandemic, our focus has been on running as many trains as possible so that customers who need to travel can do so. We have therefore changed our key performance metric to monitor how many of our timetabled trains we have run. This contrasts with the previous excess journey time metric, which focused on the additional time it took customers to complete their journeys. Our current approach is now even more important in this recovery phase.
We continue to deliver a good service, consistently beating our public perfomance measure target.
Since the end of 2020, we have been replacing legacy trains with new longer-length Elizabeth line trains, giving a better travelling environment with walkthrough carriages and air-conditioning. There have been some reliability issues as the new trains were introduced, but these are being resolved with the manufacturer Alstom.
80
84
88
92
96
100
Trips operated, against schedule
2021/222020/212019/202018/192017/18
The level of service operated on the network is dependent on the reliability of our assets and the availability of our colleagues. We have been impacted by the pandemic, as has society as a whole, with our colleagues being absent from work due to shielding or self-isolating. Despite this, we have consistently delivered a reliable core service, and have now been able to reopen all our stations except Heathrow Terminal 4.
Services operated
Lockdowns, the recovery of passenger numbers, and the availability of our colleagues due to the pandemic have all played a part in fluctuating service levels during this quarter.
It should be noted that the rail measures reported in this section reflect the terms of our contracts with our partner organisations. This is why, for example, some services report using the public performance measure, whereas London Overground reports on the basis of the time to three measure, which focuses on train punctuality.
A detailed explanation of all the metrics can be found in the Glossary at the end of this report.
* Data not available before March 2020

Customer service and operational performance report 9
Buses scheduled services operatedPast five quarters (%)
Dial-a-Ride trip requests scheduledPast five quarters (%)Annual trend (moving average)
97
97.5
98
98.5
99
99.5
100
Scheduled services operated
Q1 2021/22Q4 2020/21Q3 2020/21Q2 2020/21Q1 2020/21
99.2
98.898.7
98.4
98.0
80
85
90
95
100
Trip requests
Q1 2021/22Q4 2020/21Q3 2020/21Q2 2020/21Q1 2020/21
In Q1 2020/21, the percentage of bus scheduled services operated was much higher than normal as the initial coronavirus lockdown brought about reduced passenger numbers and minimal traffic disruption, which more than offset increased staff absence. Subsequent quarters have seen a steady return towards more normal levels as traffic disruption has increased. Performance in Q4 2020/21 and Q1 2021/22 was also affected by bus operator industrial action, pushing it below pre-pandemic levels in Q1 2021/22.
The coronavirus pandemic has had a significant impact on the number of journey requests made by Dial-a-Ride members and in how we serve them. Because our customers are particularly vulnerable, we have been carrying only one passenger or household per journey, which has made scheduling more difficult. However, reduced passenger demand and careful planning have mitigated any issues.
95
96
97
98
99
100
Scheduled services operated
2021/222020/212019/202018/192017/18
The percentage of bus scheduled services operated fell slightly in 2019/20 against the previous two years, due to increases in emergency utility works and central London demonstrations. In 2020/21, the percentage grew to record levels (although scheduled mileage was reduced) as coronavirus restrictions caused reduced passenger numbers and minimal traffic disruption. In Q1 2021/22, more normal levels were seen.

Customer service and operational performance report 10
London Overground time to three Past five quarters (%)
90
92
94
96
98
100
Scheduled services operated
Q1 2021/22Q4 2020/21Q3 2020/21Q2 2020/21Q1 2020/21
London Overground train punctuality (time to three) has stayed relatively stable since the start of the pandemic. Performance dipped in Q1 2021/22 as a result of services returning to pre-pandemic levels, particularly the reinstatement of 10 trains per hour on the north London section of the line. We are also seeing higher volumes of customers returning to the network, and greater impacts from other train and freight operating companies.
London Trams scheduled services operated Past five quarters (%)
95
96
97
98
99
100
Scheduled services operated
Q1 2021/22Q4 2020/21Q3 2020/21Q2 2020/21Q1 2020/21
Trams performance has been relatively stable against the 99 per cent target, although there was a dip in Q4 2020/21 due to a third-party building fire that closed the network for several days over the festive period. In the same quarter, there was also a major overhead line failure, and pandemic-related driver availability issues. Performance recovered strongly in Q1.
DLR departuresPast five quarters (%)
Emirates Air Line availability Past five quarters (%)
95
96
97
98
99
100
Departures
Q1 2021/22Q4 2020/21Q3 2020/21Q2 2020/21Q1 2020/21
DLR performance has been very good for the past five quarters, with the percentage of departures being consistently more than 99 per cent. Strong performance was maintained across five different timetable changes during the pandemic to reflect the changing demand during the national lockdowns and easing of restrictions.
95
96
97
98
99
100
Availability
Q1 2021/22Q4 2020/21Q3 2020/21Q2 2020/21Q1 2020/21
System availability was 96.6 per cent in Q1 2021/22 compared to 98.5 per cent for the same quarter in 2020/21. The Emirates Air Line opened from 14 to 17 April 2020 to allow healthcare workers to travel to and from the Nightingale Hospital at the Excel Centre. It then closed from 18 April due to the pandemic and re-opened to the general public from 18 May 2020. Downtime this year was mainly due to high gusting wind at tower height, which required stopping the service for the safety of our passengers.
Customer service and operational performance report 11
Woolwich Ferry availability Past five quarters (%)
50
60
70
80
90
100
Availability
Q1 2021/22Q4 2020/21Q3 2020/21Q2 2020/21Q1 2020/21
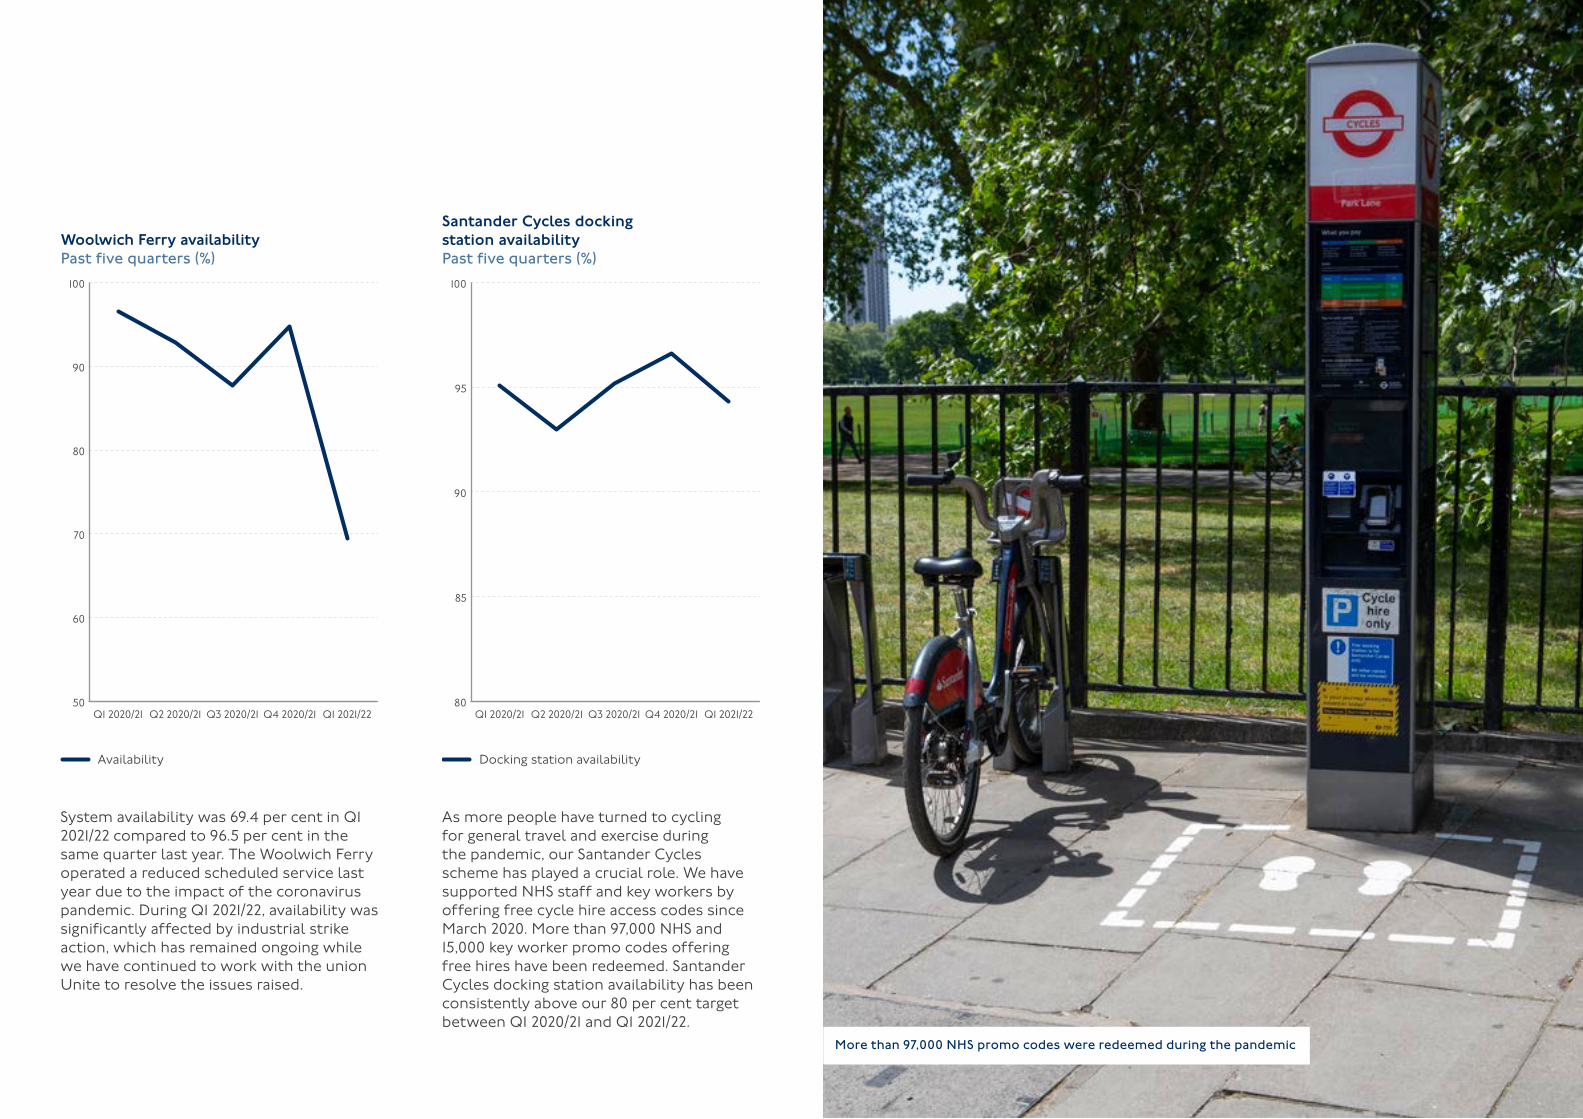
System availability was 69.4 per cent in Q1 2021/22 compared to 96.5 per cent in the same quarter last year. The Woolwich Ferry operated a reduced scheduled service last year due to the impact of the coronavirus pandemic. During Q1 2021/22, availability was significantly affected by industrial strike action, which has remained ongoing while we have continued to work with the union Unite to resolve the issues raised.
Santander Cycles docking station availabilityPast five quarters (%)
80
85
90
95
100
Docking station availability
Q1 2021/22Q4 2020/21Q3 2020/21Q2 2020/21Q1 2020/21
As more people have turned to cycling for general travel and exercise during the pandemic, our Santander Cycles scheme has played a crucial role. We have supported NHS staff and key workers by offering free cycle hire access codes since March 2020. More than 97,000 NHS and 15,000 key worker promo codes offering free hires have been redeemed. Santander Cycles docking station availability has been consistently above our 80 per cent target between Q1 2020/21 and Q1 2021/22.
More than 97,000 NHS promo codes were redeemed during the pandemic

Customer service and operational performance report 12
The lifting of restrictions has seen a return to near-normal traffic levels since the first coronavirus lockdown.
We continue to improve journeys for cyclists, pedestrians and bus customers by adjusting traffic signal timings on the TfL Road Network (red route).
Road disruptionPast five quarters (%)
Bus average speedPast five quarters (mph)
-50
-40
-30
-20
-10
0
10
20
TargetActual
Q1 2021/22Q4 2020/21Q3 2020/21Q2 2020/21Q1 2020/21
-5
0
-44
0
-11
-2
-16
-2
4
3
8
9
10
11
12
Weighted average speed
Q1 2021/22Q4 2020/21Q3 2020/21Q2 2020/21Q1 2020/21
11.3
9.99.8
10.2
9.6
Disruption was -44 per cent in Q1 2020/21 due to the first coronavirus lockdown, and remained below target for the remainder of 2020/21 due to the impact of further lockdowns (-11 per cent in Q3, and -16 per cent in Q4). In Q1 2021/22, disruption returned to relative normality following the removal of many coronavirus restrictions (disruption scored four per cent relative to a target of three per cent).
Q1 2020/21 saw much higher than normal bus speeds as the initial coronavirus lockdown resulted in little traffic and fewer disruptive works. Bus speeds declined in Q2 and Q3 as restrictions were lifted for part of this period, but increased once more in Q4 as a lockdown was imposed again. The gradual lifting of restrictions in Q1 2021/22 has seen bus speeds significantly improve again and they remain slightly higher than pre-coronavirus levels.
Roads and traffic
Customer service and operational performance report 13
Type of userPast five quarters (hours)*
0
1,000
2,000
3,000
4,000
5,000
6,000
CyclistsPedestriansBuses
Q1 2021/22Q4 2020/21Q3 2020/21Q2 2020/21Q1 2020/21
1,306
279
1,585
4,084
449
4,533
1,544
1431,700
n/a n/a
13
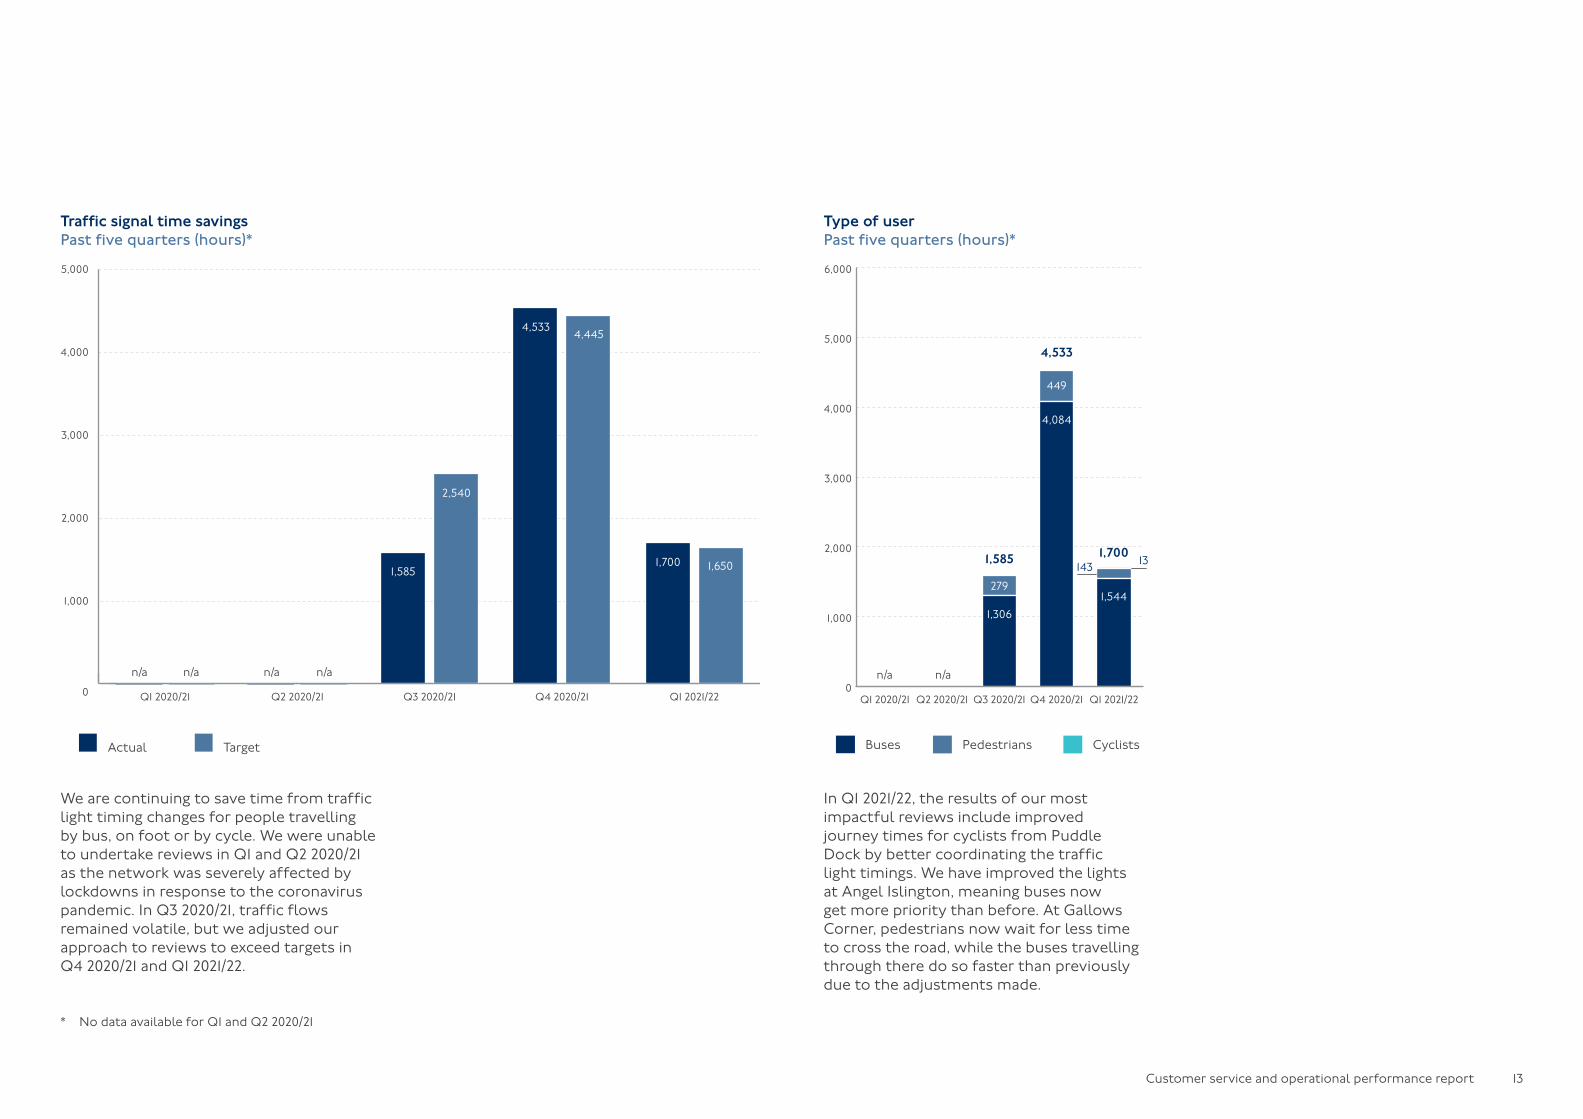
In Q1 2021/22, the results of our most impactful reviews include improved journey times for cyclists from Puddle Dock by better coordinating the traffic light timings. We have improved the lights at Angel Islington, meaning buses now get more priority than before. At Gallows Corner, pedestrians now wait for less time to cross the road, while the buses travelling through there do so faster than previously due to the adjustments made.
* No data available for Q1 and Q2 2020/21
Traffic signal time savings Past five quarters (hours)*
0
1,000
2,000
3,000
4,000
5,000
TargetActual
Q1 2021/22Q4 2020/21Q3 2020/21Q2 2020/21Q1 2020/21
n/a n/a
1,585
2,540
n/a n/a
4,5334,445
1,700 1,650
We are continuing to save time from traffic light timing changes for people travelling by bus, on foot or by cycle. We were unable to undertake reviews in Q1 and Q2 2020/21 as the network was severely affected by lockdowns in response to the coronavirus pandemic. In Q3 2020/21, traffic flows remained volatile, but we adjusted our approach to reviews to exceed targets in Q4 2020/21 and Q1 2021/22.

Customer service and operational performance report 14
CustomersRegardless of the challenges posed by the pandemic, we have continued to support and engage with our customers
Customer service and operational performance report 15
All LondonersAgreement, disagreement, neither (%)
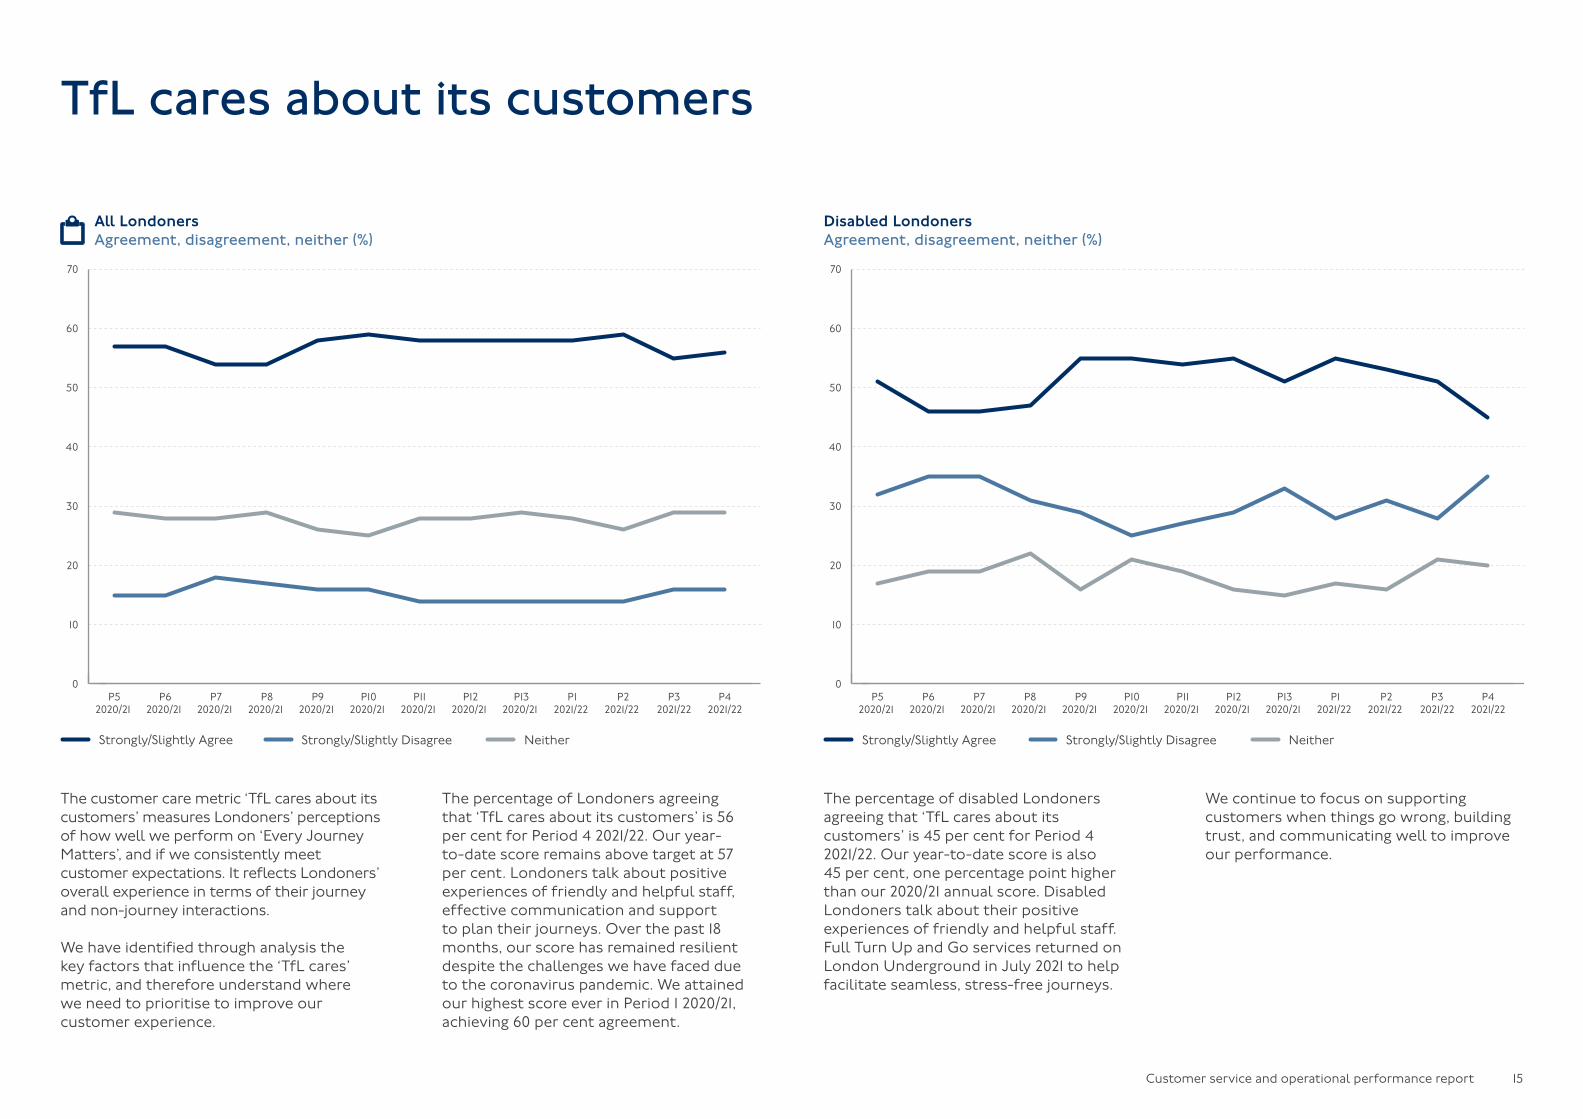
The percentage of Londoners agreeing that ‘TfL cares about its customers’ is 56 per cent for Period 4 2021/22. Our year-to-date score remains above target at 57 per cent. Londoners talk about positive experiences of friendly and helpful staff, effective communication and support to plan their journeys. Over the past 18 months, our score has remained resilient despite the challenges we have faced due to the coronavirus pandemic. We attained our highest score ever in Period 1 2020/21, achieving 60 per cent agreement.
The customer care metric ‘TfL cares about its customers’ measures Londoners’ perceptions of how well we perform on ‘Every Journey Matters’, and if we consistently meet customer expectations. It reflects Londoners’ overall experience in terms of their journey and non-journey interactions.
We have identified through analysis the key factors that influence the ‘TfL cares’ metric, and therefore understand where we need to prioritise to improve our customer experience.
0
10
20
30
40
50
60
70
NeitherStrongly/Slightly DisagreeStrongly/Slightly Agree
P42021/22
P32021/22
P22021/22
P12021/22
P132020/21
P122020/21
P112020/21
P102020/21
P92020/21
P82020/21
P72020/21
P62020/21
P52020/21
TfL cares about its customers
Disabled LondonersAgreement, disagreement, neither (%)
The percentage of disabled Londoners agreeing that ‘TfL cares about its customers’ is 45 per cent for Period 4 2021/22. Our year-to-date score is also 45 per cent, one percentage point higher than our 2020/21 annual score. Disabled Londoners talk about their positive experiences of friendly and helpful staff. Full Turn Up and Go services returned on London Underground in July 2021 to help facilitate seamless, stress-free journeys.
0
10
20
30
40
50
60
70
NeitherStrongly/Slightly DisagreeStrongly/Slightly Agree
P42021/22
P32021/22
P22021/22
P12021/22
P132020/21
P122020/21
P112020/21
P102020/21
P92020/21
P82020/21
P72020/21
P62020/21
P52020/21
We continue to focus on supporting customers when things go wrong, building trust, and communicating well to improve our performance.

Customer service and operational performance report 16
Key survey questionsAgreement (%)
Within the ‘TfL cares about its customers’ metric, there are five key drivers that exert the most influence on Londoners’ perceptions. Overall, scores have remained resilient throughout the coronavirus pandemic, and we have achieved our highest ever scores over this period for most categories. Supporting customers when things go wrong remains a key area of focus for improvement.
40
50
60
70
80
TfL has friendly and helpful staff
TfL is investing to improve my journeysTfL supports customers when things go wrong
TfL communicates openly and honestlyTfL is an organisation I can trust
P42021/22
P32021/22
P22021/22
P12021/22
P132020/21
P122020/21
P112020/21
P102020/21
P92020/21
P82020/21
P72020/21
P62020/21
P52020/21
The customer care metric score has remained resilient

Customer service and operational performance report 17
Customer satisfaction score Q1 2020/21 Q2 2020/21 Q3 2020/21 Q4 2020/21 Q1 2021/22
London Underground N/A 75 76 76 78
London Buses N/A 76 78 79 79
DLR N/A 77 78 78 78
London Overground N/A 75 76 76 76
London Trams N/A N/A 76 N/A N/A
TfL Rail N/A 74 76 75 78
SatisfactionPast five quarters (scores)
In Q2 2020/21, the customer satisfaction score was determined by online methods rather than face to face due to the coronavirus pandemic. This enabled surveying to resume and has ensured continuity during coronavirus restrictions. It means that scores are not directly comparable with those gathered before the pandemic.
In Q1 2021/22, overall satisfaction scores increased for London Underground and TfL Rail, and remained stable for all other modes.
Customers reported fewer delays on TfL Rail and DLR, while all other modes remained stable.
There were increases in satisfaction across most coronavirus metrics for all modes. The wearing and enforcement of face coverings remained at similar levels to Q4 2020/21.
All station metrics have remained broadly stable, with a significant increase in satisfaction with crowding for London Underground.
Satisfaction
By changing to online methods, we continued to survey customer satisfaction

Customer service and operational performance report 18
Calls/Correspondence Q1 2020/21 Q2 2020/21 Q3 2020/21 Q4 2020/21 Q1 2021/22
Telephone calls 227,815 361,144 419,129 296,212 363,418
Calls abandoned (%)* 7.2 10.3 6.4 6.4 9.0
Correspondence 102,716 48,412 96,209 70,847 94,424
Cases closed (%)** 74.6 85.8 86.4 88.7 83.9
Average speed of answer (seconds) 83 343 135 100 213
General calls (Contact Centre)Past five quarters
In Q1, telephone demand was up on both the previous quarter and the same quarter the previous financial year. Correspondence was up on last quarter, but was down on Q1 2020/21.
We have seen our demand remain relatively strong over the course of the pandemic, although it is still lower than pre-pandemic levels. We have consistently seen that Contact Centre Operations demand levels have been higher than the number of passenger journeys made. This is largely attributable to customers seeking guidance on the measures brought in to help combat
Calls
In addition to our general Contact Centre, we also have dedicated lines for road charging and ULEZ, taxi and private hire, and Dial-a-Ride.
Calls/Correspondence 2017/18 2018/19 2019/20 2020/212021/22
year to date
Telephone calls 2,835,189 2,699,025 2,687,696 1,304,300 363,418
Calls abandoned (%)* 10.5 10.9 16.2 7.6 9.0
Correspondence 542,760 609,201 757,298 364,778 94,424
Cases closed (%)** 85.9 82.0 78.9 83.4 83.9
Past five years
* Calls abandoned target 15 per cent or lower
** Cases responded to within the agreed timeframe. Our target is 80 per cent of correspondence responded to within three working days, or 10 working days for more complex issues that require investigation
the spread of coronavirus, such as social distancing and, in particular, the use of face coverings.
In accordance with Mayoral and Government advice, we have made numerous changes to our approach over the course of the pandemic. Responding to fluctuations in demand, we carefully managed our workforce, focusing on the safety of both our staff and customers. We continue to monitor developments closely, with plans in place to enable us to react should there be a change in Government advice.

Customer service and operational performance report 19
Our telephone service continues to take high volumes of calls for help and guidance
Calls by subject* **This quarter
Contactless paymentSantander Cycles
ConcessionsSurface and Rail
OtherOyster
27,671
110,441
113,963
69,822
5,690
35,831
Overall telephone demand was up by 23 per cent on the previous quarter – the biggest drivers for this were Santander Cycles and contactless (up by 48 and 43 per cent respectively). Compared to Q1 2020/21, overall telephone demand was up 60 per cent, due to the restrictions in place at this time last year.
Oyster-related calls increased by 17 per cent compared to Q1 last year. Contactless calls have increased by 165 per cent in the same timeframe, confirming that the new ways of working are causing some customers to switch to contactless, with its greater flexibility.
* Surface and Rail: London Underground, London Buses, London Overground, Emirates Air Line, DLR, TfL Rail, Cycling (general), River services, Safety, Coaches
** Other: Crossrail, Public help points, Taxi and Private Hire, Ticketing app, Sarah Hope Line, Street-related calls
Customer service and operational performance report 20
Calls Q1 2020/21 Q2 2020/21 Q3 2020/21 Q4 2020/21 Q1 2021/22
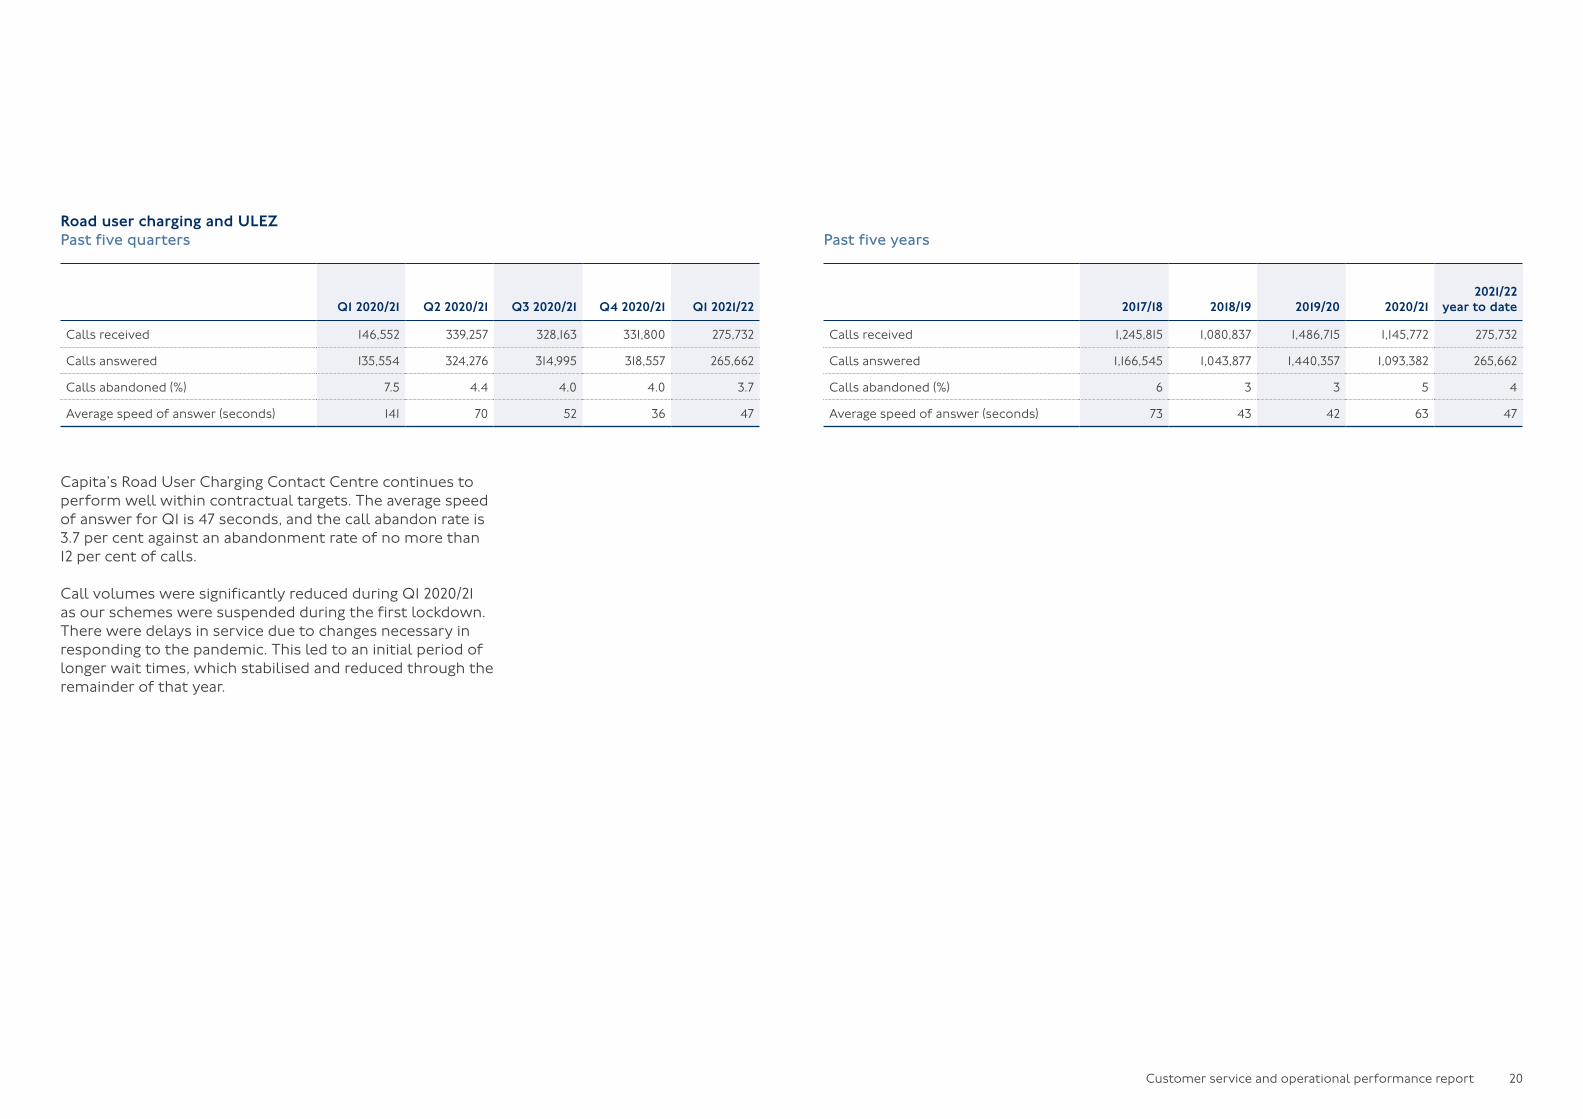
Calls received 146,552 339,257 328,163 331,800 275,732
Calls answered 135,554 324,276 314,995 318,557 265,662
Calls abandoned (%) 7.5 4.4 4.0 4.0 3.7
Average speed of answer (seconds) 141 70 52 36 47
Road user charging and ULEZPast five quarters
Capita’s Road User Charging Contact Centre continues to perform well within contractual targets. The average speed of answer for Q1 is 47 seconds, and the call abandon rate is 3.7 per cent against an abandonment rate of no more than 12 per cent of calls.
Call volumes were significantly reduced during Q1 2020/21 as our schemes were suspended during the first lockdown. There were delays in service due to changes necessary in responding to the pandemic. This led to an initial period of longer wait times, which stabilised and reduced through the remainder of that year.
Calls 2017/18 2018/19 2019/20 2020/212021/22
year to date
Calls received 1,245,815 1,080,837 1,486,715 1,145,772 275,732
Calls answered 1,166,545 1,043,877 1,440,357 1,093,382 265,662
Calls abandoned (%) 6 3 3 5 4
Average speed of answer (seconds) 73 43 42 63 47
Past five years

Customer service and operational performance report 21
Taxi and private hirePast five quarters
Call activity since Q1 2020/21 is based on our vehicle licensing call centre only. At the start of the pandemic, we closed inbound call options for driver and operator licensing queries as we did not have the technology to move this to a homeworking solution without significant cost. Instead, we moved to an email service, with staff making outbound calls to support licensees with complex enquiries. All emails are responded to within one working day of receipt.
The change, initially designed to be temporary, has worked extremely well and has introduced efficiencies as staff time is more effectively managed without having a reactive telephone service. The trade is supportive of the arrangements continuing and there are no plans to reopen inbound calls at this time.
Call volumes and response times at our vehicle licensing call centre have fluctuated in line with different phases of the coronavirus pandemic.
Calls Q1 2020/21 Q2 2020/21 Q3 2020/21 Q4 2020/21 Q1 2021/22
Calls received 18,786 67,644 93,609 42,252 46,513
Calls answered 11,466 50,303 55,180 41,898 45,959
Calls abandoned (%) 39.0 25.6 41.1 0.8 1.2
Average speed of answer (seconds) 1,176 737 1,652 16 33
Calls 2017/18 2018/19 2019/20 2020/212021/22
year to date
Calls received 684,904 840,178 749,561 222,291 46,513
Calls answered 623,837 582,022 532,096 158,847 45,959
Calls abandoned (%) 8 30 29 29 1
Average speed of answer (seconds) 118 733 699 896 33
Past five years

Customer service and operational performance report 22
Dial-a-RidePast five quarters
In Q1, there was a 40 per cent increase in call volumes compared to Q4 2020/21, and a 248 per cent increase compared to the same quarter last year. Since the ending of lockdown restrictions on 19 July, there has been an increase in average daily calls of 125 per cent compared to the same time last year. The call abandoned rate remains better than target at 3.1 per cent, and the average speed of answer is 13 seconds quicker than the last quarter.
Past five years
Calls/Correspondence Q1 2020/21 Q2 2020/21 Q3 2020/21 Q4 2020/21 Q1 2021/22
Calls received 13,406 33,143 37,313 33,413 46,691
Calls abandoned (%) 6.2 9.0 3.8 3.7 3.1
Average speed of answer (seconds) 57 196 84 72 59
Email bookings 152 1,538 3,494 1,184 3,783
Calls/Correspondence 2017/18 2018/19 2019/20 2020/212021/22 year
to date
Calls received 596,161 564,391 533,868 117,275 46,691
Calls abandoned (%) 12.1 10.5 10.7 5.5 3.1
Average speed of answer (seconds) 252 233 287 108 59
Email bookings 44,655 45,950 82,450 6,368 3,783

Customer service and operational performance report 23
Complaints Q1 2020/21 Q1 2021/22 Variance (%)
London Underground 3.47 1.41 -59
London Buses 4.92 3.88 -21
DLR 1.58 0.61 -61
London Overground 2.12 0.79 -63
TfL Rail 4.61 2.10 -54
London Trams 2.25 0.80 -64
Emirates Air Line 9.59 4.14 -57
Congestion charge 4.08 2.94 -28
Dial-a-Ride 59 51.31 -13
London River Services 4.47 0.65 -85
Santander Cycles 4.62 2.43 -47
Taxis* 1.15 2.73 137
Private hire* 0.68 2.48 265
Contactless 0.54 0.44 -19
Oyster 0.89 0.17 -81
ComplaintsYear on year (per 100,000 journeys)
The pandemic has had a severe impact on all areas, with passenger volumes only half of pre-pandemic levels. This has had a noticeable effect on the overall volume of complaints, which have been lower, although we have noticed increases in complaints on subjects such as the mandatory use of face coverings and social distancing.
Buses complaints fell by a smaller margin than other modes, due to the additional demands placed on frontline staff during
Complaints
Complaints 2017/18 2018/19 2019/20 2020/212021/22
year to date
London Underground 0.89 0.98 1.14 1.74 1.41
London Buses 2.89 3.17 3.17 4.37 3.88
DLR 0.82 0.78 0.89 1.09 0.61
London Overground 1.68 1.69 1.58 1.24 0.79
TfL Rail 2.47 2.39 2.30 2.26 2.10
London Trams 1.62 1.28 1.65 1.76 0.80
Emirates Air Line 2.40 4.11 2.83 2.57 4.14
Congestion charge 4.04 1.59 2.48 3.83 2.94
Dial-a-Ride 82.23 69.86 83.62 64.87 51.31
London River Services 0.79 1.49 1.26 2.44 0.65
Santander Cycles 4.56 4.00 3.54 2.68 2.43
Taxis* 7.28 7.22 8.06 1.69 2.73
Private hire* 3.92 2.95 2.57 1.36 2.48
Contactless 0.14 0.21 0.40 0.39 0.44
Oyster 0.18 0.15 0.17 0.26 0.17
Past five years
With both passenger numbers and complaint volumes down so substantially across the bulk of our services, it is difficult to draw meaningful comparisons with pre- pandemic levels.
Currently, we are beginning to see the early signs of recovery, and this appears to be more of a contactless-led recovery due to the more flexible nature of the product. This may change as the recovery continues but will be driven by the decisions taken by Government and businesses on how and where their staff will work in future.
the pandemic, such as drivers needing to ensure the use of face coverings. Enforcing social distancing and the segregation of school services were other potential areas for conflict or perceived failings.
The rise in taxi and private hire complaints may be a statistical anomaly as the journey data we hold for these areas is based on a 2009 sample, and does not reflect changes in the pandemic. We continue to monitor driver performance very closely.
* Journeys not recorded; figures based on survey data. Taxi and private hire complaint numbers are not directly comparable due to the way they are received/recorded

Customer service and operational performance report 24
Commendations
Commendations Q1 2020/21 Q2 2020/21 Q3 2020/21 Q4 2020/21 Q1 2021/22
London Underground 48 96 110 75 168
London Buses 191 473 507 406 549
DLR 1 3 6 2 6
London Overground 8 21 12 18 29
TfL Rail 2 18 31 14 38
London Trams 3 2 1 0 4
Emirates Air Line 0 3 0 1 10
Dial-a-Ride 4 2 7 6 17
London River Services 1 1 2 0 1
Santander Cycles 1 0 0 0 1
Taxis and private hire 5 5 6 12 9
TfL Road Network 5 7 7 4 3
TfL Policy 11 2 2 6 0
CommendationsPast five quarters
Total commendations increased by 198 per cent this quarter compared to the same quarter last year, and rose by 53 per cent compared to the previous quarter. The biggest increases were on TfL Rail, DLR and Dial-a-Ride, although all other areas performed well.
While overall commendation volumes declined compared to the pre-pandemic timeframe (volumes have declined by 56 per cent in Q1 2021/22 compared to Q1 2019/20), it reflects well on our frontline colleagues that they have managed to maintain around the same level of commendations despite all the challenges they have faced through the pandemic.
One commendation highlights the daily challenges our staff face. A member of the public called our Sarah Hope Line to report they had seen a tweet from a customer who was standing on a platform edge with the intention of committing suicide. Our customer service executive, Stephen Wallage, gathered information from the member of the public to try to locate the person. The Suicide Prevention team, British Transport Police and London Underground duty officer were alerted, and located the individual in under 20 minutes, leading them to safety. Stephen has received a life-saver award for his part in preventing a potential tragedy.
Customers have appreciated the efforts of our frontline colleagues

Customer service and operational performance report 25
Tickets
0.0
0.5
1.0
1.5
2.0
TravelcardsBus and Tram
Oyster PAYGContactless
Q1 2021/22Q4 2020/21Q3 2020/21Q2 2020/21Q1 2020/21
0.16
0.130.01
0.050.35
0.75
0.43
0.08
0.59
0.40
0.09
0.18
1.260.20
1.46
0.47
0.27
0.060.08
0.881.08
0.52
0.09
0.17
1.86
0
1
2
3
4
TravelcardsBus and Tram
Oyster PAYGContactless
2021/222020/212019/202018/192017/18
0.74
1.37
0.22
3.40
1.01
1.23
0.18
1.26
1.16
0.16
0.86
3.44
0.94
3.36
1.65
1.06
0.74
3.60
0.27
0.47
0.88
1.07
0.15
0.060.08
The national lockdowns during the pandemic saw demand drop dramatically, but the share of contactless payment media (cards and mobile devices) used remained around half of all fare payer tickets throughout this period.
Demand recovered slightly after Step 2 of the Government’s roadmap out of lockdown on 12 April 2021.
Before the pandemic, the total number of fare payer tickets used remained fairly stable every year, while the share of contactless payment media increased.
During the pandemic, the use of contactless payment and Oyster pay as you go recovered to a greater extent than Travelcards, suggesting some migration from the latter to the former. Bus and tram passes have also made a stronger recovery than Travelcards.
Fare payer split on typical weekdays*Past five quarters (millions)** Past five years (millions)***
349kautomated refunds were issued in Q1, with £1.9m refunded
2.2mcontactless journeys are made daily (this is the daily Q1 average, and figures have fluctuated in this time due to lockdown easing)
84.4mcontactless bank cards and mobile devices have been used on bus, Tube and rail services over the past five years****
* Graphs use typical weekdays to represent the trend per time period. The number of Travelcards and bus and tram passes valid on these typical weekdays is used as a proxy for the number of tickets used. The population studied covers all fare payer ticket types, excluding paper single tickets, which comprise less than one per cent of journeys on the network
** Days measured: Thursday 16 April 2020 Q1 2020/21 Thursday 20 August 2020 Q2 2020/21 Thursday 5 November 2020 Q3 2020/21 Thursday 4 February 2021 Q4 2020/21 Thursday 20 May 2021 Q1 2021/22
*** Days measured: Thursday 9 February 2017 Thursday 8 February 2018 Thursday 7 February 2019 Thursday 6 February 2020 Thursday 4 February 2021
**** Due to data issues, we have calculated lifetime usage of contactless payment card from mid-2016 onwards
Customer service and operational performance report 26
System availability
Q1 2020/21 Q1 2021/22
Availability ActualVariance to target
Variance to last year Actual
Variance to target
Variance to last year
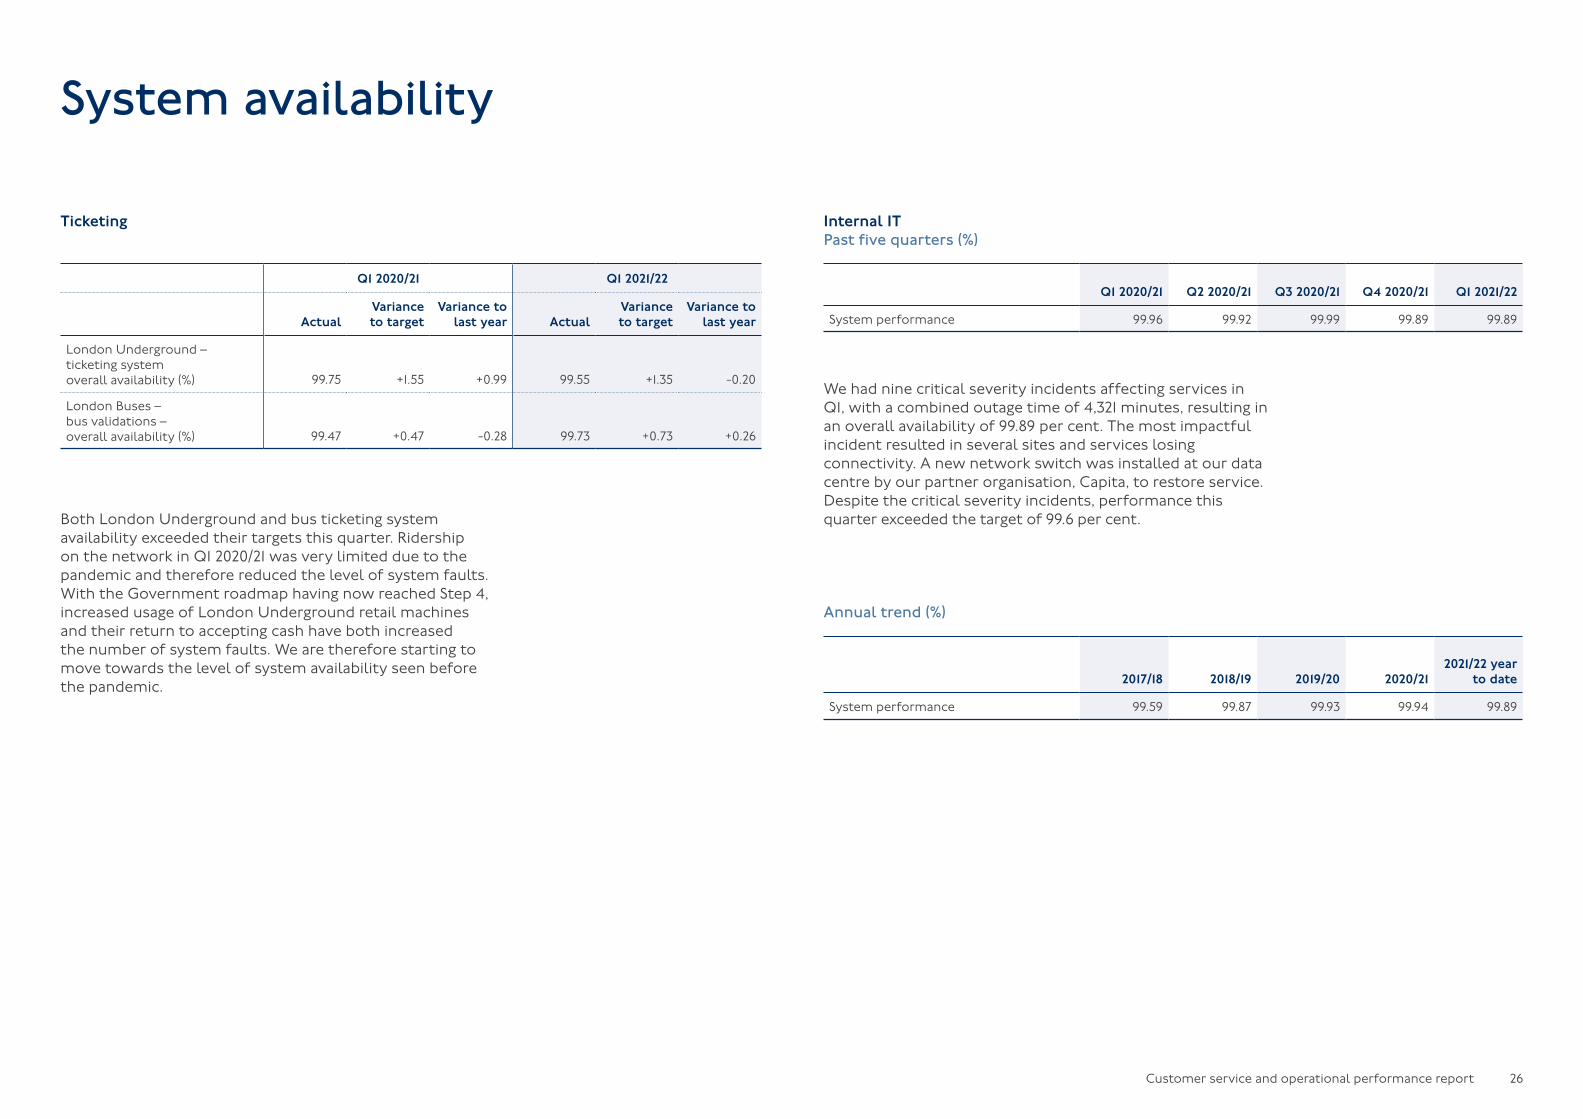
London Underground – ticketing system overall availability (%) 99.75 +1.55 +0.99 99.55 +1.35 -0.20
London Buses – bus validations – overall availability (%) 99.47 +0.47 -0.28 99.73 +0.73 +0.26
Performance Q1 2020/21 Q2 2020/21 Q3 2020/21 Q4 2020/21 Q1 2021/22
System performance 99.96 99.92 99.99 99.89 99.89
Ticketing Internal ITPast five quarters (%)
Annual trend (%)
Both London Underground and bus ticketing system availability exceeded their targets this quarter. Ridership on the network in Q1 2020/21 was very limited due to the pandemic and therefore reduced the level of system faults. With the Government roadmap having now reached Step 4, increased usage of London Underground retail machines and their return to accepting cash have both increased the number of system faults. We are therefore starting to move towards the level of system availability seen before the pandemic.
We had nine critical severity incidents affecting services in Q1, with a combined outage time of 4,321 minutes, resulting in an overall availability of 99.89 per cent. The most impactful incident resulted in several sites and services losing connectivity. A new network switch was installed at our data centre by our partner organisation, Capita, to restore service. Despite the critical severity incidents, performance this quarter exceeded the target of 99.6 per cent.
Performance 2017/18 2018/19 2019/20 2020/212021/22 year
to date
System performance 99.59 99.87 99.93 99.94 99.89

Customer service and operational performance report 27
Digital
Much of our delivery focus has been on TfL Go, our real-time travel app. The app launched on iOS devices in August 2020 and on Android in December 2020, and includes multi-modal journey planning, real-time Tube and rail status, nearby bus stops and live arrivals. TfL Go complements our website, which has seen growth outpace the general return to the network this quarter.
A key differentiator for TfL Go is our focus on inclusivity. For the first time, we are showing detailed accessibility information for stations and platforms, including live step-free access status based on lift availability.
In June, we launched real-time ‘busyness’ information for London Underground stations, further reassuring customers as they return to the network. Customers can see whether stations are ‘quiet now’, ‘busy now’ or ‘very busy now’, alongside the expected quieter times to travel on any given day. This innovative data is generated from depersonalised customer WiFi connections within stations.
5.9munique devices visiting the TfL website this quarter
479kdownloads to the TfL Go app since launch
123mwebsite page views this quarter
TfL Go helps customers plan their journeys and get real-time information

Customer service and operational performance report 28
Transport innovation
Our transport innovation team seeks out and assesses new ideas and developments in transport, helping TfL determine which new business models or services can help us address the challenges our city faces. We are fundamentally changing how TfL engages with market innovators to capture value, reduce costs and ensure new business models work for all.
Electric scooter rental trial On 7 June, the electric scooter rental trial launched, with a number of boroughs taking part from the start and more joining throughout. The scooters are used only on roads and cycleways – it is illegal to ride them on pavements – and trips must end in designated parking locations. Safety is at the core of the trial, with many standards going further than those set out nationally, such as a lower maximum speed of 12.5mph. Throughout the trial, data shared by the operators, Dott, Lime and TIER, and collected from wider stakeholders, will play a vital role in helping to shape London policy and the UK’s future legislation on electric scooters.
There is more information at tfl.gov.uk/modes/driving/electric-scooter-rental-trial.
Innovation challenges Through TfL’s innovation hub, we lead a cutting-edge programme of commercial innovation and market engagement. Through the programme, we trial solutions to prove their application with a view to a wider rollout of successful technology, creating significant new value and delivering better, cheaper and quicker outcomes for London.
Mayor’s Innovation Resilience Challenge The Resilience Fund was the Mayor of London’s £1m challenge fund to incentivise innovators to address social issues facing London, helping us emerge stronger from coronavirus and ensure the Capital is prepared for future challenges. It was run in partnership with the Mayor of London and funded by the London Economic Action Partnership.
TfL supported the challenge, with a focus on three challenge areas, including:
• Air quality
• Renewable energy
• Optimisation smart mobility challenge, focused on freight journeys
London RoadLabIn 2019, we launched an innovation challenge called RoadLab, which called on the UK’s leading innovators to develop technology to make roadworks in the Capital safer, smarter and more accessible. Nine innovators were chosen to go through to a 10-week programme, where their proposed technology was trialled and developed with the support of London’s major utility companies and London Councils.
Following a ground-breaking procurement process, TfL has now awarded contracts to Samdesk and Immense to use their technology on London’s road network in the coming months.
Immense uses innovative simulation technology that models roadworks to understand their impact on the Capital’s road network before they take place. The software can provide TfL and utilities staff with information on predicted congestion impacts, increases in emissions and the safety impacts of planned roadworks. This information can then be used to inform Londoners about predicted impacts to their intended journey.
Software from Samdesk leverages artificial intelligence and realtime publicly available social media data to detect emerging disruptions, giving TfL staff a faster and more comprehensive insight into incidents unfolding across the transport network. Having early access to this kind of information will help TfL to respond to them more quickly.
The programme was funded by TfL’s Lane Rental scheme, which charges roadworks companies for digging up London’s busiest roads at times that cause the most disruption to people’s journeys.
Driver fatigueThe Driver Fatigue and Health and Wellbeing Innovation challenge launched in March 2021 in response to research we commissioned into driver fatigue. More than 50 companies responded to the challenge with solutions, and the shortlisted companies are now working with bus operators.
FreightLab London FreightLab looked for solutions to make goods movement in the Capital safer, cleaner and more efficient.
Innovators who were successful in applying for the programme were offered funding, land sites and subject matter expertise to support the trials’ objectives. Industry partners included Royal Mail, UPS and DPD.
Trials for the products developed in FreightLab began this summer. Our research findings will be used to inform future policies.
Road risk We have established a research and development partnership with Daimler to explore how we can use anonymised connected vehicle data, such as sudden braking/swerving, from multiple in-car sensors and our own collision and casualty data (STATS 19) to identify high-risk collision hotspots before an incident takes place.
WazeTo achieve our Vision Zero objectives, we need to be able to target drivers and motorcyclists with road safety messages, but we do not have our own communications channels to reach out to these groups.
In May 2021, in partnership with Waze, a new feature was launched to deliver messages to drivers and motorcyclists to help encourage safe driving. For safety reasons, the messages appear only when the vehicle is stationary. Within 24 hours of launch, the message was shown 225,000 times to drivers/motorcyclists.
Customer service and operational performance report 29
Travel demand management
Throughout the coronavirus pandemic and into recovery, our Travel Demand Management team has been delivering vital insight-driven advice, tools and partnership, working to enable travel at quieter times.
The team has analysed network-wide demand trends, creating targeted advice to support customers returning to the network in line with the demand management challenges associated with the steps of the Government roadmap. We have also been working closely with employers from a variety of sectors to help build their plans for the return of staff to offices. In May, we conducted a survey of 110 office-based businesses, the findings being used to inform TfL-wide recovery planning.
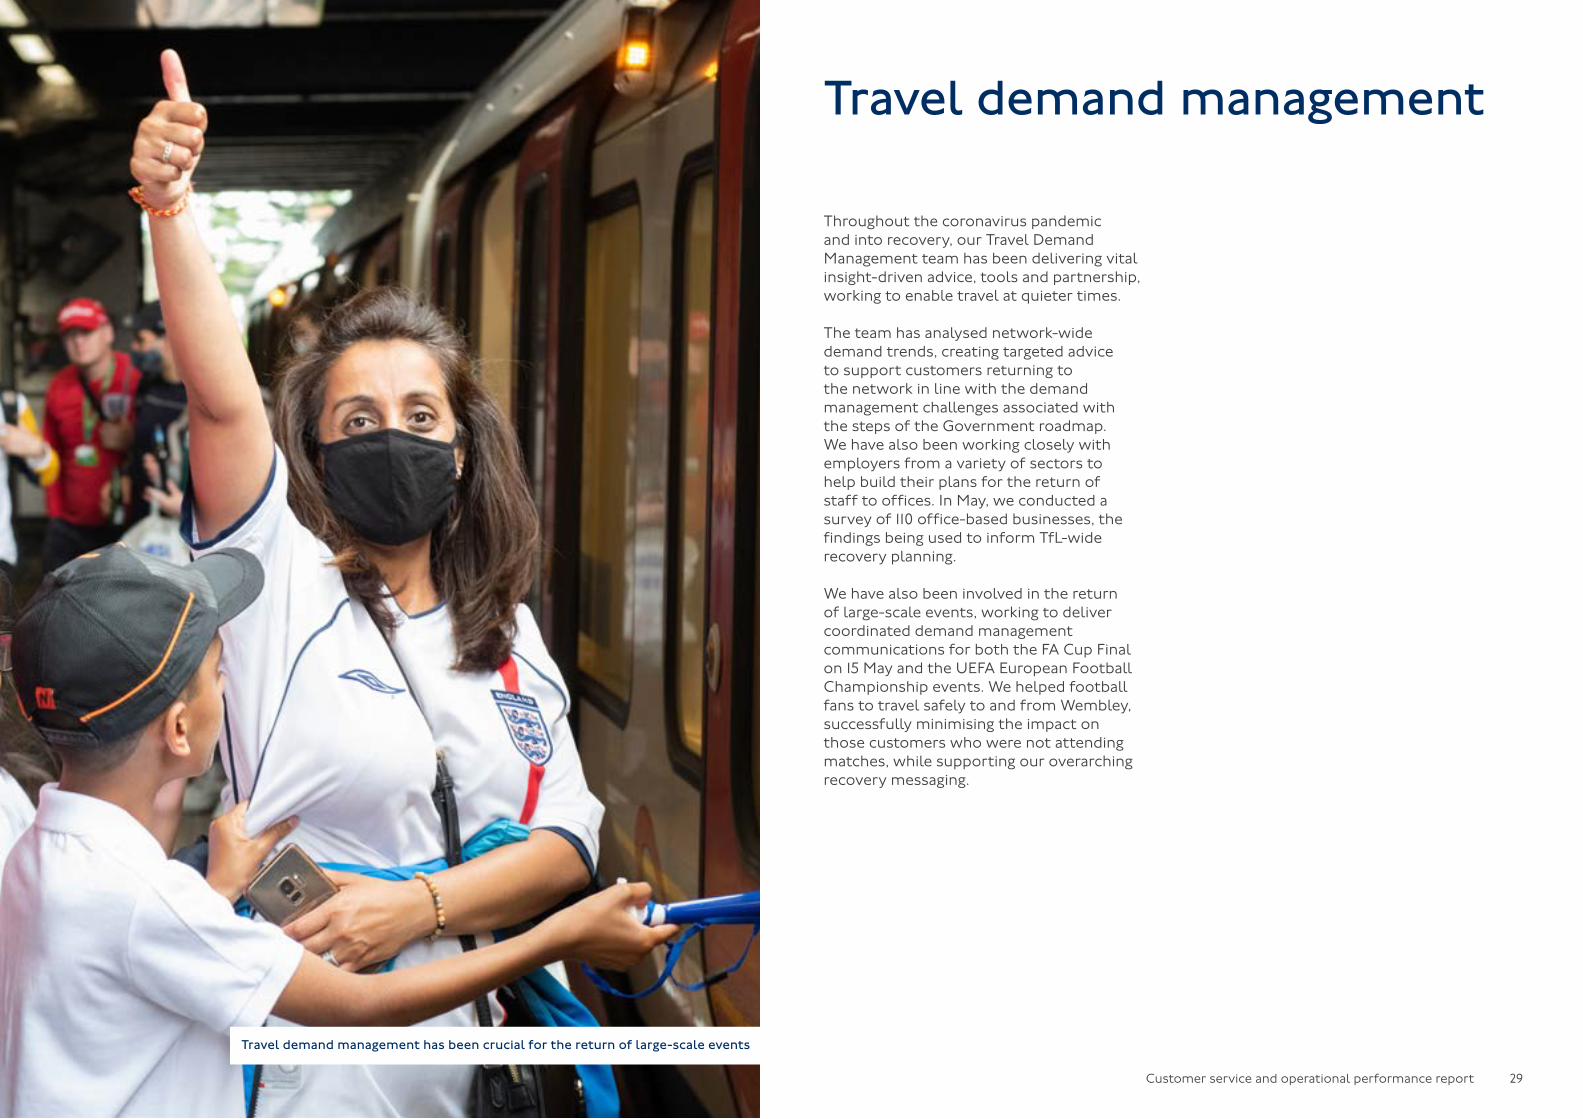
We have also been involved in the return of large-scale events, working to deliver coordinated demand management communications for both the FA Cup Final on 15 May and the UEFA European Football Championship events. We helped football fans to travel safely to and from Wembley, successfully minimising the impact on those customers who were not attending matches, while supporting our overarching recovery messaging.
Travel demand management has been crucial for the return of large-scale events

Customer service and operational performance report 30
Campaigns
Clear communication with our customers has never been more important
312customer campaigns so far in 2021/22
79mcustomer information emails sent in 2021/22 to date
Campaigns 2017/18 2018/19 2019/20 2020/212021/22
year to date
Customer emails (millions) 187 189 205 211 79
Campaigns 1,043 930 1,101 685 312
Campaigns – Customer information email volumesPast five years
Customer information emails were critical at the height of the pandemic when we needed to keep our customers informed about the ever-changing situation. We supported multiple mass email communication throughout this period, and are now working to support all recovery campaigns. We work closely with our colleagues to ensure customers know our services are safe, clean, reliable and accessible.

Customer service and operational performance report 31
Customer marketing and behaviour change campaignsWe have focused on campaigns reassuring customers of the safety of the network and supporting London’s recovery. Our recent campaigns have been on TfL infrastructure and service improvements; public transport recovery; face coverings; ventilation reassurance; recovery and cleaning of the network; public transport safety; abusive behaviour; value fares; better behaviours; active travel; Santander Cycles; online cycle skills training; road danger reduction; ULEZ expansion; and air quality.
Some major campaigns have focused on recovery. Following the easing of the Government’s coronavirus restrictions on 12 April, we informed Londoners who were returning to outdoor dining or non-essential retail that our public transport network could get them there safely, and we provided relevant travel information. This activity ran alongside our reassurance messages and a campaign to encourage Londoners to walk or cycle. The campaign was conducted via social media, digital posters and radio, and promoted travel advice tools, the £2.50 off-peak Zone 1 and Hopper fares, quiet times to travel and the TfL Go app. As restrictions eased and further sectors reopened, the campaign included posters showing Londoners getting back to the activities they love, for example, the cinema, large cultural venues such as museums, and indoor dining.
Another recovery campaign revolved around our ‘Welcome back’ advertisement, which was shown on TV, in cinemas and shared on social media. It has been seen by 4.1m people.
Abusive behaviour on the network was the subject of a further campaign. Unacceptable abusive behaviour towards other passengers and staff is the most serious form of antisocial behaviour to occur on the network. On 7 June, we launched our new ‘Serious Worrying Incidents’ campaign to create a sense of unity among Londoners, standing together against antisocial behaviour such as staff abuse, drunken behaviour and hate crime directed at customers or staff.
The visual for the campaign shows Londoners raising their hands in unity against abuse and makes it clear that this type of behaviour will not be tolerated and can result in a criminal record. The campaign targets all public transport users, including victims and perpetrators, and raises awareness of how to report incidents to the British Transport Police or the Metropolitan Police Service. The campaign launched using digital and print posters across the network, social media, sponsored podcasts and customer emails.

Customer service and operational performance report 32
Consultations
We launched five consultations in Q1, as follows:
Four consultations for Healthy Streets:
• Walking and cycling changes between Oval and Streatham
• Walking and cycling changes between Oval and Elephant & Castle
• Walking and cycling changes on Tooley Street and Duke Street Hill
• Walking and cycling changes between Chelsea Bridge and Wandsworth town centre
One safer junction consultation:
• A217 Lumley Road safer junction scheme
In Q2, we are launching 10 consultations:
One key consultation:
• New Congestion Charge proposals. The Congestion Charge consultation opened on 28 July and will close on 6 October. The proposals cover issues such as how much the charge should be, the days and hours when the charge would apply and discounts for residents living in the zone
Nine other consultations:
• Route 633 extension to Pollards Hill
• Lower speed limits (20mph) in Westminster
• Bus route R7 rerouting
• Penalty Charge Notice increases on the TfL Road Network
• Improvements for pedestrians and bus passengers on Earls Court Road
• Changes to bus routes N21, N550 & N551
• Route 410: removal of double runs on Davidson Road
• Route 497 extension
• Hatch Lane rerouting (routes 212, 357 & 657)
We are planning a further five consultations before the end of Q2:
• A23 Streatham: Tesco crossing scheme
• Townley Road Bexleyheath: bus stand and stop scheme
• Route 224: rerouting in Park Royal via Twyford Abbey Road
• A102 noise barrier: Silvertown Tunnel
• Nine Elms Lane Highways Scheme: western section
We want as many Londoners as possible to have their say in our consultations

Customer service and operational performance report 33
London Assembly scrutiny
Date Title Type of scrutiny
27 May 2021 Mayor’s Question Time Open meeting
1 June 2021 Confirmation Hearings Committee Open meeting
10 June 2021 Assembly plenary session with functional bodies Open meeting
24 June 2021 Mayor’s Question Time Open meeting
London Assembly scrutinyQ1
Q2*
Date Title Type of scrutiny
30 June 2021 Assembly Transport Committee Open meeting
15 July 2021 Mayor’s Question Time Open meeting
2 September 2021 Assembly plenary session on transport Open meeting
9 September 2021 Mayor’s Question Time Open meeting
We have met virtually with the London Assembly throughout the pandemic
* The dates may be subject to change

Customer service and operational performance report 34
Glossary
Measure Unit Description
Bus average speed mph The average speed of buses running in service, including the dwell time while stationary at bus stops.
Bus journey time mins This measure is the overall time a customer must allow to complete a bus journey on the London bus network (high-frequency routes only).
It includes the components of wait time, in-vehicle time, interchange, crowding and buffer time, and is weighted by customer demand and the financial value of the customer’s time to measure the overall customer experience.
DLR departures % The percentage of scheduled trains that have completed their end-to-end journey.
Elizabeth line: public performance measure
% The public performance measure (PPM) shows the percentage of trains that arrive at their final destination on time.
It combines figures for punctuality and reliability into a single performance measure, and is the rail industry standard measurement of performance.
It measures the performance of individual trains advertised as passenger services against their planned timetable, as agreed between the operator and Network Rail at 22:00 the night before the journey in question. It is therefore the percentage of trains arriving ‘on time’ compared with the total number of trains planned.
In London and the South East, a train is defined as being on time if it arrives at its destination within five minutes (four minutes, 59 seconds or less) of the planned arrival time.
Where a train fails to run its entire planned route (not calling at all timetabled stations), it will count as a PPM failure.
Emirates Air Line availability % The scheduled hours/minutes minus downtime (when the service is closed to passengers) as a percentage of the scheduled hours/minutes.
London Overground: time to three % Time to three measures train punctuality in terms of the percentage of recorded station stops arrived at early or less than three minutes after the scheduled time.
This is different to the PPM, which measures the punctuality of trains at the final destination only.
Time to three excludes station stops where the train fails to call. For PPM, all cancelled trains are included in the measure and counted as ‘non-punctual’ trains.
Measure Unit Description
Passenger journeys compared to pre-coronavirus levels
% This measure compares 2021/22 demand with the 2019/20 demand level.
Road disruption % This measures delays to vehicle journey times in order to ensure that unplanned disruption and planned works and events are managed effectively.
Tracking road disruption remains important for TfL to meet its duties under the Traffic Management Act, and its obligations as a strategic traffic authority.
Note: this covers only the TfL Road Network (red route).
Santander Cycles docking station availability
% The percentage of time that docking stations are not empty of cycles/full of cycles.
Scheduled services operated % London Underground: the percentage of our scheduled services that we operate.
London Buses: the proportion of planned in-service mileage that has been provided for passenger use. Note: operated mileage may be less than planned mileage due to staffing, mechanical or traffic congestion issues.
Dial-a-Ride: the proportion of member journey requests the On-Demand Team has been able to fulfil.
London Trams: the percentage of services that are operated compared with the scheduled timetable.
Traffic signal time savings (time saved by pedestrians, cyclists and bus users at traffic lights)
hours The metric is measured by conducting a ‘before’ and ‘after’ comparison of journey and wait times through each reviewed junction. The absolute time changes (both positive and negative) are multiplied by estimates of the number of people using each set of reviewed signals on each mode of sustainable transport.
Note: measurement does not take place during ‘abnormal’ periods of road network use, such as during school and bank holiday periods, or if planned and unplanned events and roadworks are happening in the locality.
Woolwich Ferry availability % The scheduled hours/minutes minus downtime (when the service is closed to passengers) as a percentage of the scheduled hours/minutes.
Part of the Greater London Authority family led by Mayor of London Sadiq Khan, we are the integrated transport authority responsible for delivering the Mayor’s aims for transport.
We have a key role in shaping what life is like in London, helping to realise the Mayor’s vision for a ‘City for All Londoners’ and helping to create a safer, fairer, greener, healthier and more prosperous city. The Mayor’s Transport Strategy sets a target for 80 per cent of all journeys to be made by walking, cycling or using public transport by 2041. To make this a reality, we prioritise sustainability, health and the quality of people’s experience in everything we do.
We run most of London’s public transport services, including the London Underground, London Buses, the DLR, London Overground, TfL Rail, London Trams, London River Services, London Dial-a-Ride, Victoria Coach Station, Santander Cycles and the Emirates Air Line. The quality and accessibility of these services is fundamental to Londoners’ quality of life. By improving and expanding public transport and making more stations step
free, we can make people’s lives easier and increase the appeal of sustainable travel over private car use.
We manage the city’s red route strategic roads and, through collaboration with the London boroughs, we are helping to shape the character of all London’s streets. These are the places where Londoners travel, work, shop and socialise. Making them places for people to walk, cycle and spend time will reduce car dependency, improve air quality, revitalise town centres, boost businesses and connect communities. As part of this, the Ultra Low Emission Zone scheme and more environmentally friendly bus fleets are helping to tackle London’s toxic air.
During the coronavirus pandemic we have taken a huge range of measures to ensure the safety of the public. This includes enhanced cleaning using hospital-grade cleaning substances that kill viruses and bacteria on contact, alongside regular cleaning of touch points, such as poles and doors, and introducing more than 1,000 hand sanitiser points across the public transport network.
Working with London’s boroughs we have also introduced Streetspace for London, a temporary infrastructure programme providing wider pavements and cycle lanes so people can walk and cycle safely and maintain social distancing.
At the same time, we are constructing many of London’s most significant infrastructure projects, using transport to unlock much needed economic growth. We are working with partners on major projects like the extension of the Northern line to Battersea, Barking Riverside and the Bank station upgrade.
Working with Government, we are in the final phases of completing the Elizabeth line which, when open, will add 10 per cent to central London’s rail capacity. Supporting the delivery of high-density, mixed-use developments that are planned around active and sustainable travel will ensure that London’s growth is good growth. We also use our own land to provide thousands of new affordable homes and our own supply chain creates tens of thousands of jobs and apprenticeships across the country.
We are committed to being an employer that is fully representative of the community we serve, where everyone can realise their potential. Our aim is to be a fully inclusive employer, valuing and celebrating the diversity of our workforce to improve services for all Londoners.
We are constantly working to improve the city for everyone. This means using data and technology to make services intuitive and easy to use and doing all we can to make streets and transport services accessible to all. We reinvest every penny of our income to continually improve transport networks for the people who use them every day. None of this would be possible without the support of boroughs, communities and other partners who we work with to improve our services.
By working together, we can create a better city as London recovers from the pandemic and moves forward.
About TfL

PUB21-040
© Transport for London
September 2021
tfl.gov.uk