Embed Size (px)
Citation preview

Customer Segmentation for NOVEC
DEVELOPING CUSTOMER CLUSTERS RESPECTIVE TO NOVEC’S TOTAL ENERGY USAGE
ANITA AHN MESELEWORK AYTENIFSU RANDALL BARFIELD DANIEL KIM
GEORGE MASON UNIVERSITY
FINAL PROJECT COURSE OR/SYST 699
FALL 2016
PEPARED FOR DR. HOFFMAN
2016

Contents
1. Introduction ........................................................................................................................................................ 5
1.1 Background ........................................................................................................... 5
1.2 Problem Statement ................................................................................................ 5
1.3 Project Description ................................................................................................. 6
1.4 Limitations & Assumptions ..................................................................................... 7
1.5 Criteria of Success ................................................................................................. 8
2. Literature Search ............................................................................................................................................ 8
2.1 Clustering Time-series Energy Data from Smart Meters ....................................... 8
3. Technical Approach .................................................................................................................................... 11
3.1 Proposed Methodology ........................................................................................ 11
4. Data Pre-Processing and Analysis ..................................................................................................... 13
4.1 Data Dictionary .................................................................................................... 13
4.2 Data Sampling ..................................................................................................... 14
4.3 Data Cleaning .................................................................................................... 155
4.4 Data Transformation ............................................................................................ 16
4.4.1 Demand Factor Variable Exploration .......................................................... 177
4.4.2 Load Factor Variable Exploration .................................................................. 18
4.4.3 Coincident Usage Ratio Variable Exploration................................................ 19
4.4.4 Coincident Peak Ratio Variable Exploration .................................................. 18
4.4.5 Worknight to Workday Usage Ratio Variable Exploration ............................. 18
4.4.6 Weekday to Weekend Usage Ratio Variable Exploration ............................. 20
4.5 Final Dataset........................................................................................................ 21
5. Customer Clustering Analysis .............................................................................................................. 21
5.1 Correlation Analysis ............................................................................................. 22
5.2 Optimal number of clusters (K) ............................................................................ 23
5.3 Cluster Distribution .............................................................................................. 26
5.4 Characterizing the Clusters ................................................................................. 27
5.5 Cluster Profile Plots ............................................................................................. 28
5.5.1 Clusters Load Factor profile .......................................................................... 28
5.5.2 Clusters Weekday vs Weekend Usage profile .............................................. 29
5.5.3 Clusters Worknight to Workday Usage profile ............................................... 31
5.6. Compute Confidence Interval for Unknown mean ( ) ....................................... 34
5.6.1 Mean and 95% Confidence Interval for Demand Factor variable .................. 34
5.6.2 Mean and 95% Confidence Interval for Load Factor variable........................ 35
5.6.3 Mean and 95% Confidence Interval for Coincident Usage Ratio variable ..... 35
5.6.4 Mean and 95% Confidence Interval for Weekday-to-Weekend Usage Ratio variable .................................................................................................................. 35
5.6.5 Mean and 95% Confidence Interval for Coincident Peak Ratio variable ....... 35
5.6.6 Mean and 95% Confidence Interval for Weeknight-to-Weekday Usage Ratio variable .................................................................................................................. 36
5.7 Application: Estimating NOVEC peak usage ....................................................... 36
5.8 Comparison of July and January usage ............................................................... 36
6. Risk Analysis ............................................................................................................. 38
7. Conclusions ............................................................................................................... 38
8. Recommendations and Future Use .................................................................................................... 38
Appendix A: Project Plan ............................................................................................... 39
9.1 Work Breakdown Structure .................................................................................. 39
9.2 Schedule .............................................................................................................. 39
9.3 Project Reporting ................................................................................................. 43
Appendix B: Initial Analysis – SAS .......................................................................................................... 44
Appendix C: Initial Analysis – Weka ........................................................................................................ 46
Appendix D: Other Tables & Graphs ....................................................................................................... 47
Appendix E: Terminology and Ratio Meanings .................................................................................. 49
Bibliography ......................................................................................................................................................... 50

Executive Summary Northern Virginia Electric Cooperative (NOVEC) is a power reseller on its own distribution infrastructure headquartered in Manassas, Virginia. As a not-for-profit organization, one of their primary goals is to reduce cost in order to pass the savings along to the customer. One path for reducing cost is to accurately predict the amount of power purchased from wholesale electric grid providers. Accurate forecasting allows NOVEC to negotiate a bulk price with wholesalers. If consumption is under-predicted, NOVEC must purchase additional power on short notice to meet demand, often at a higher rate. If consumption is over-predicted, some portion of electrical power purchased goes unused, the cost of which must be shared by the customers of the cooperative. NOVEC’s current model for predicting forecasted power consumption involves a combination of economic and weather forecasting combined with historical data from customers’ past usage and the breakdown of residential versus commercial customers. NOVEC submitted to the George Mason Systems Engineering and Operations Research department a task of further refining the segmentation of customers to help feed their prediction model. The hope was that a more granular clustering of customer power consumption behaviors (beyond customer type such as Residential and Commercial) would provide more accurate inputs and allow refinement of the forecasting model. To that end, NOVEC provided 5-years of sample data for our analysis to the project team. This project seeks to study NOVEC’s customers’ electricity usage by characterizing each customer based on their behavior represented by metrics such as load factor, demand factor, coincident usage, work-night to workday usage ratio, weekday to weekend usage ratio and to cluster the population into different groups that allows the company to accurately predict future energy demand. Throughout the project, the team has learned a great deal about different clustering algorithms, data analysis, data mining, as well previous clustering approaches that have been used specifically for forecasting energy usage. Although the team was not able to develop a robust segmentation model to cluster customers based on those criterion, the team has produced 6 customer groups of similar characteristics based on the current sample dataset and demonstrated how to apply those results to see how each segment of customers contribute towards the NOVEC system peak.

1. Introduction
1.1 Background
Electricity plays an important part in running the daily lives of Americans. It is used to power schools, office buildings, and small to large corporations. It takes advance planning in order to build circuits that are able to provide the capacity needed to provide power to an area. Companies like Northern Virginia Electric Cooperative (NOVEC) that provide electricity to both residential and industrial users, must build circuits in advance of the demand with limited prior knowledge on the region’s customer behavior of electricity usage. Therefore, it would be extremely beneficial for NOVEC to be able to classify different types of potential customers with respect to their energy consumption behavior. This will help NOVEC in predicting the amount of electricity it needs for new developments and facilitate the purchasing of energy supplies.
NOVEC is one of the largest electric distribution cooperatives in the country. It is a locally based and owned electric distribution system located in Manassas, Virginia. Currently, NOVEC services about 651 square miles of area with more than 6,880 miles of power lines and provides electricity to more than 155,000 home and businesses in multiple counties such as Fairfax, Loudoun, Prince William, Stafford, and Fauquier. Some of its bigger and well-known clients include Potomac Mills Outlet Mall, Verizon, and AT&T. Reliable electricity distribution is necessary for these businesses to run their daily operations. As the population of both residential and commercial users in these counties grow, NOVEC will greatly benefit with the ability to predict future consumer’s electricity consumption. Prior to building electricity circuits, NOVEC has general information about what type of customer will be using electricity in the area, i.e. whether it will be a residential area, or a commercial building. Currently, the company has only four qualitative characteristics of customer segments – Residential, Small Commercial, Large Commercial, and Churches. However, these groupings are classified based on billing categories, which may be unrelated to the actual customer type. For example, A residential customer that uses a lot of electricity may be billed and classified as a “small commercial” customer. Therefore, the groups are neither intuitive nor homogenous and do not provide much insight to the customer’s behavior of electricity usage. If NOVEC is able to identify customer segments that are homogenous within the clusters and significantly distinguished from one segment to the other, it will help NOVEC understand the population of their customers, therefore increasing their capability to plan and construct power lines for future developments. Six derived attributes from sample data were used to help characterize each customer based on their behavior of electricity consumption.

1.2 Problem Statement
NOVEC has sample customer data from a stratified random sample of all of its customers. NOVEC would like to determine if this stratified sample can be used to segment its customers by their electricity consumption behavior, especially in respect to when the system reaches peak usage. NOVEC would like to know the recommended number of segments and the characteristics of those segments.
1.3 Project Description
NOVEC has five years of data, from 2011 to 2015, of hourly electricity usage for its customers. The data has “Customer Group” data, which identifies what type of client it is – Residential, Small Commercial, Large Commercial, or Church. It also has a unique “Map Location Number” that tells the geospatial location of the client, and an “Account Number” that can tell whether or not the client has changed during the period. The customer’s usage is given in KwH (Kilowatts per Hour). By studying this data and finding a way to segment the customers into groups according to similar consumption patterns, the goal of this study is to provide the best number of clusters and customer segmentation that will help NOVEC understand customer’s energy consumption with respect to how these clusters contribute towards the entire system’s consumption of energy.
The data collected for this project is a stratified random sampling of the population, originally collected for rate-making purposes. Therefore, the sample collects more data for customers that use higher amounts of electricity compared to customers with relatively low usage. This leads the data to be over-representative of the population of heavy users, i.e. Large Commercial Customers. However, around 92% of NOVEC’s consumers comprise of Residential customers and the behavior of these consumers is important for the entire system.
With the amount of data available, it is important to scope the problem into a project that is doable and provides insights within the limited time available (i.e. one semester). The project team has come up with 3 level of goals to meet for this semester.
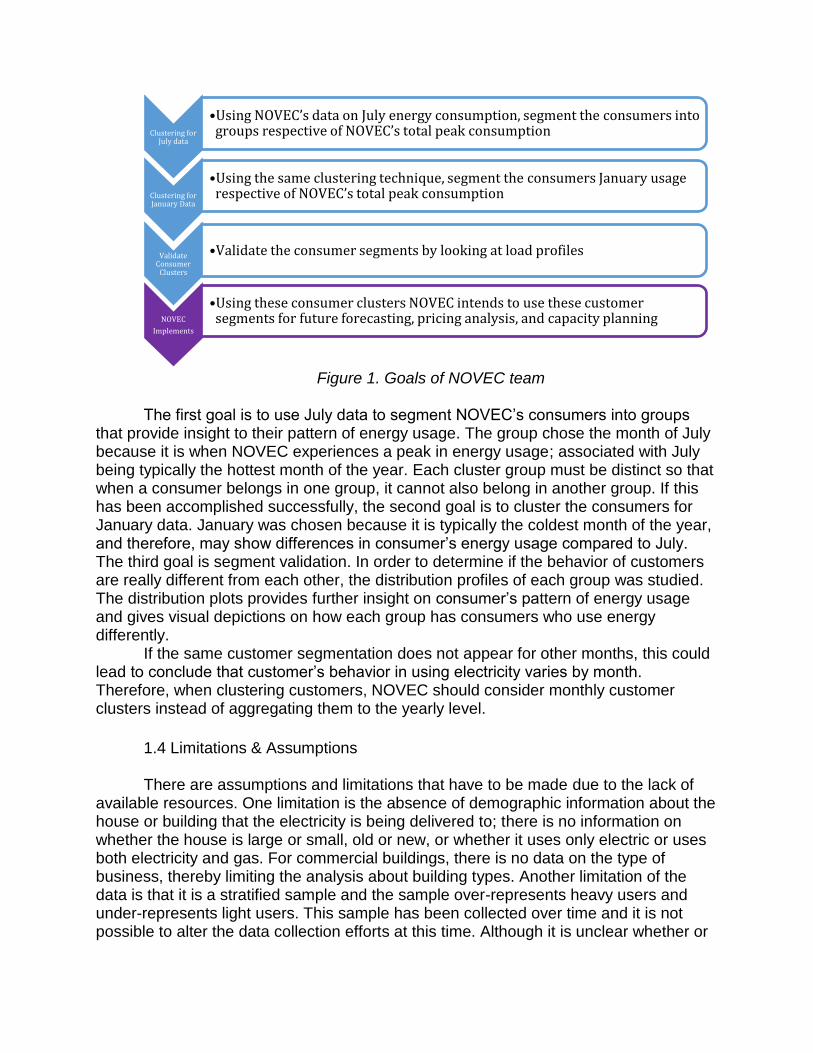
Figure 1. Goals of NOVEC team
The first goal is to use July data to segment NOVEC’s consumers into groups
that provide insight to their pattern of energy usage. The group chose the month of July because it is when NOVEC experiences a peak in energy usage; associated with July being typically the hottest month of the year. Each cluster group must be distinct so that when a consumer belongs in one group, it cannot also belong in another group. If this has been accomplished successfully, the second goal is to cluster the consumers for January data. January was chosen because it is typically the coldest month of the year, and therefore, may show differences in consumer’s energy usage compared to July. The third goal is segment validation. In order to determine if the behavior of customers are really different from each other, the distribution profiles of each group was studied. The distribution plots provides further insight on consumer’s pattern of energy usage and gives visual depictions on how each group has consumers who use energy differently.
If the same customer segmentation does not appear for other months, this could lead to conclude that customer’s behavior in using electricity varies by month. Therefore, when clustering customers, NOVEC should consider monthly customer clusters instead of aggregating them to the yearly level.
1.4 Limitations & Assumptions
There are assumptions and limitations that have to be made due to the lack of available resources. One limitation is the absence of demographic information about the house or building that the electricity is being delivered to; there is no information on whether the house is large or small, old or new, or whether it uses only electric or uses both electricity and gas. For commercial buildings, there is no data on the type of business, thereby limiting the analysis about building types. Another limitation of the data is that it is a stratified sample and the sample over-represents heavy users and under-represents light users. This sample has been collected over time and it is not possible to alter the data collection efforts at this time. Although it is unclear whether or
Clustering for July data
•Using NOVEC’s data on July energy consumption, segment the consumers into groups respective of NOVEC’s total peak consumption
Clustering for January Data
•Using the same clustering technique, segment the consumers January usage respective of NOVEC’s total peak consumption
NOVEC
Implements
•Using these consumer clusters NOVEC intends to use these customer segments for future forecasting, pricing analysis, and capacity planning
Validate Consumer
Clusters
•Validate the consumer segments by looking at load profiles

not this will have a huge impact in the reliability of the study, these limitations have to be taken into consideration when concluding results from the analysis.
Also, the categorization of customer groups was found to be unreliable because these groups are organized based on billing purposes, rather than customer classification purposes. Therefore, residential customers who use a lot of electricity can be billed as a “Small Commercial” customer, and vice versa. Also, many customers’ classification changed from year to year, further decreasing the reliability of this classification. Due to this inconsistency in customer groupings, it was decided to use mathematical metrics derived from data to group customers into clusters. These metrics describe customers based on “how” they use electricity, rather than “how much” electricity they use. Therefore, the metrics will help diverge from sample collection bias. We discuss the approach used in Section 3.1 of this report.
One assumption that was made throughout this analysis is that if the Account Number of the customer does not change, then it is safe to assume that the client is the same client owning the same type of business or home, which requires similar energy usage.
1.5 Criteria of Success Currently, NOVEC models its customer groups as “Residential” “Small Commercial”, “Large Commercial” and “Church”. However, these groups do not provide a homogenous grouping that can be used to model the energy use for the entire NOVEC’s system. Our goal is to provide NOVEC with homogenous customer segments that provide information on how customer segments use electricity, specifically in terms of their contribution to NOVEC’s peak energy consumption. The team wants to group customers based on their electricity consumption behavior so that NOVEC can use these segments to predict electricity usage with more granularity. Eventually, NOVEC will use the information on customer clusters to implement into a multitude of projects including Time-of-use pricing, Load Management, and Capacity Planning. Furthermore, the analysis can be used for predictive modeling to predict the amount of electricity that will be demanded, allowing the company to determine its purchasing requirements in order to meet consumer demand. Although the initial focus of the project is to accurately segment customers for the month of July, the ultimate goal is to find customer segmentation for July and January for years 2011 to 2015.
2. Literature Search
2.1 Clustering Time-series Energy Data from Smart Meters While researching about customer clustering, particularly related to consumer’s energy usage, team NOVEC found an article published online in 2014. The article was about clustering consumers based on energy usage for the goal of recommending ways to use energy efficiently for the commercial and industrial consumers. This research relates closely to what the NOVEC team sets out to do, which is taking time-series data on energy usage given in kWh units, to determine the best way to group customers with similar patterns of consumption together. This article written by Alexander Lavin and

Diego Klabjan, states that “The goal in clustering time-series data is to organize the data into homogeneous groups, maximizing the similarity and dissimilarity within and between groups, respectively (Lavin & Klabjan, 2014)”. Similar to team NOVEC, Lavin and Klabjan have faced difficulty of obtaining qualitative data for their research and state that:
Qualitative characteristics such as building type, location, size, and so on do not suffice in grouping participants for comparison because they do not capture their energy usage tendencies, and the data is difficult to obtain. Quantitatively, energy data alone does not provide enough depth to identify both strengths and shortcomings in participants’ energy efficiency. Yet, data mining can provide insight to a participant’s energy usage tendencies. (Lavin et al., 2014) There are major differences between Lavin’s research and the group’s project.
Lavin’s research only looks at the commercial and industrial customer accounts, while NOVEC data has residential and commercial customers. The mean energy usage for residential customers and commercial customers are very different, in usage time and kWh. Therefore, the project team’s customers may show greater variations in energy usage pattern when compared with a study that studies only commercial customers. This could lead the NOVEC team to segment customers with more number of clusters or greater variation within the clusters. Also, Lavin’s data was with 15 minutes of granularity while team NOVEC’s data’s granularity is by the hour. With smaller intervals of time, it is more likely that Lavin’s data set captures more detailed variation by time frame, while NOVEC’s data set is more aggregated. Finally, as stated before, the goal of Lavin’s research is to identify areas where customers could use energy more efficiently, but the research also has a secondary goal of identifying open and close hours of business. Team NOVEC’s goal is to cluster customers so that NOVEC can understand different customer types within the population and use the knowledge for future capacity building and geospatial modeling. Although the end goals are different, similarity in the available data, and ultimate goal of clustering customer segments is very similar, which led the group to consider the methods used in this research.
According to Lavin, there are two general approaches to clustering. One is hierarchical clustering and the other is partition based clustering. Hierarchical clustering “treats each data point as a singleton cluster and then successively merge clusters until all points have been merged into a single cluster” (Lavin et al., 2014 as cited in Eicholtz, 2014). It is a bottom-up approach of clustering. Partition based clustering, “work the other way around by starting with a single cluster which is then subsequently split in several smaller clusters” (Lavin et al., 2014 as cited in Eicholtz, 2014). For the purposes of our goal in segmenting customers, the team identified partition based clustering to be more fit. In particular, out of different partition based clustering techniques, team NOVEC identified K-means clustering to be a good methodology. The steps to K-means algorithm is stated in another article named “Integrating multi-criteria decision making and clustering for business customer segmentation” written by Güçdemir and Selim in 2015.
Step 1. Determine the number of clusters (k).

Step 2. Randomly assign k data points to be the initial cluster centroids. Step 3. Assign each data point to a cluster that has the nearest centroid. Step 4. Recalculate the cluster centroids. Step 5. Repeat steps 3 to 5 until termination. (Güçdemir, 2015) The team decided to go with this methodology with another information from the
article that states “Kohan et al. (2008), in investigating the optimum clustering algorithm for classifying utility customers, also find that a modified k-means algorithm outperforms hierarchical clustering of energy profiles” (Lavin et al., 2014). Also, a distance based clustering method like k-means fits the goal of our project. Lavin, et al. state: “This is an ideal feature for our application because we aim to compare and contrast individual energy profiles, which can be accomplished with distinct distance measures providing a tangible dissimilarity measure” (Lavin, 2014). The goal of team NOVEC’s clusters is also to provide a tangible measure of consumer’s electricity usage, which makes the partition based clustering method more appropriate.
In order to see the clustering of different customers, the article uses distance calculation and plots to visualize the result. The article uses these three steps to cluster its customers:
1. Over set of predetermined number of k clusters and days of calendar year, a mean profile is produced for each account
2. The distance (using one of the distance formulas) is computed between each pair of energy profiles and the calculated dissimilarities are stored in a data table
3. K-means algorithm is run and the plots of energy versus time are then made to analyze the results (Lavin et al., 2014)
There are multiple distance calculations that the article talks about, which are
difference of squares, Euclidean distance, root mean squared distance, and normalized distance function. With using R statistical software, the distance calculation and k-means clustering can be done automatically. The equations for each distance calculations are as follows: Difference of squares:
Euclidean distance:
Root mean squared distance:
Normalized distance function:

By plotting the energy usage over time for each customer cluster, you can visualize how customers in different groups behave differently. Ideally, the graphical depiction of customer’s profiles will show differences in customer’s pattern of energy usage. “That is, the goal is to find the maximum number of clusters for which the mean profiles are distinctly unique in shape” (Lavin et al., 2014). If the graphs show that majority of the customers follow a denoted pattern, it will help to conclude that the clusters are identified correctly, and justify the number of clusters as well, in addition to decreasing the sum of square errors with cluster size. In Lavin’s research, data cleansing was done for customers with missing data points. They used a combination of linear interpolation and average energy values to fill in gaps in the data, while throwing out data points that had considerable gaps. As NOVEC team’s data will have incomplete data points and missing data as well, the team will have to come up with some methodology to overcome this shortcoming. In conclusion of this article, Lavin states that “energy trends vary month-by-month, so we must be able to identify energy efficiency issues on a monthly basis” (Lavin, 2014). Since this research is very similar to NOVEC’s problem, it is highly likely that NOVEC’s data set will vary in trends by month, therefore, the team recommends NOVEC to look at energy trends by month, not by year.
3. Technical Approach
3.1 Proposed Methodology
To handle the big amount of data that is available from NOVEC, it was necessary to use a program that can handle large amounts of data. The group chose to store the data on SQL server to do the initial analysis and R, SAS and Weka to do clustering, generate plots and run analysis on finding patterns of customer data. Using different graphs like line, bar, and histograms, general information about the data was learned; such as total electricity usage, total number of data points, and total number of unique accounts among different customer groups. Deeper exploratory analysis was done by using correlation plots and a correlation matrix.
The group determined that the K-means method of grouping consumers will be the best to accomplish the goal. As noted in Section 2 of the report, K-means clustering determines center points called centroids, and assigns data points to the respective neighboring centroid.
Through our initial data analysis, the group was faced with the difficulty of dealing with “dirty” data. The stratified sample of data showed that its proportion of samples did not coincide with the total population’s proportion, and data on Customer Groups (which identifies them into qualitative groups of “Residential”, “Small Commercial”, and “Large Commercial”) was not reliable, and subject to change over time due to mislabeling errors. Since qualitative data was identified as not useful, the group had to come up with quantitative metrics in order to group the customers into respective segments that do not overlap one another.
There were specifically 6 metrics that the NOVEC team used in order to group the customers according to energy usage patterns – Demand Factor, Load Factor, Coincident Usage Ratio, Coincident Peak Ratio, Worknight to Workday Usage Ratio,

and Weekday to Weekend Usage Ratio. Demand Factor, Load Factor, Coincident Usage Ratio, and Coincident Peak Ratios are metrics already used by NOVEC, while the Worknight to Workday ratio and Weekday to Weekend Ratios were formulated by the team. The formulas for each ratio is given below:
Demand Factor=Customer′s Peak Consumption
Peak System Load
Load Factor=Customer′s Average Usage
Customer′s Peak Consumption
Coincident Usage Ratio=Coincident Usage
Peak System Load
Coincident Peak Ratio=Coincident Usage
Customer′s Peak Consumption
Worknight to Workday Usage Ratio=Worknight Total Usage
Worday Total Usage
Weekday to Weekend Usage Ratio=Weekday Total Usage
Weekend Total Usage
These ratios introduce some terminology that may be unfamiliar to those not involved in energy research.
Customer’s Peak Consumption refers to the largest amount of electricity (peak usage), that the customer used during the month, measured in kWh.
Peak System Load refers to the largest amount of electricity that the entire system used, measured in kWh.
Customer’s Average Usage takes each customer’s energy usage over the month and divides by the number of records, giving the average electricity usage in kWh.
Coincident Usage refers to the amount of electricity that the customer used, when NOVEC’s entire system was at its peak consumption, also expressed in kWh.
Workday Total Usage refers to the customer’s total electricity usage collected from 8am to 4pm from Monday to Friday for the month.
Worknight Total Usage sums the total electricity usage collected from 5pm to 11pm on Monday to Friday for the month.
Weekday Total Usage sums the total electricity usage from Monday to Friday for the month, regardless of the time period, and similarly,
Weekend Total Usage refers to the total electricity usage from Saturday to Sunday for the month.
All the above ratios are for a specified month. For example, Demand Factor for the month of July would be the Peak Usage of Electricity in July divided by the Peak System Load in the month of July.
Demand factor ratio ranges from 0 to 1 and measures how much a customer’s electricity usage contributes to entire system’s electricity usage. Smaller demand factor signifies a small user, and bigger demand factor signifies a bigger user of electricity. Load factor ranges from 0 to 1 and shows how variant customer’s energy usage is from
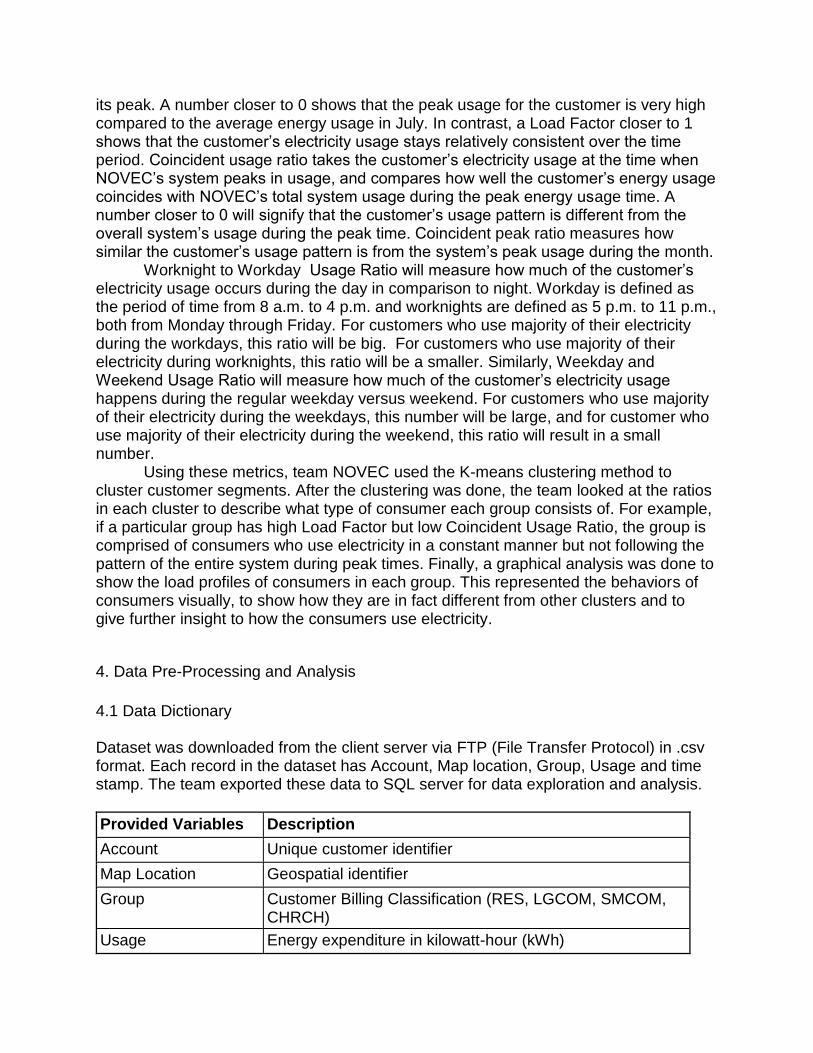
its peak. A number closer to 0 shows that the peak usage for the customer is very high compared to the average energy usage in July. In contrast, a Load Factor closer to 1 shows that the customer’s electricity usage stays relatively consistent over the time period. Coincident usage ratio takes the customer’s electricity usage at the time when NOVEC’s system peaks in usage, and compares how well the customer’s energy usage coincides with NOVEC’s total system usage during the peak energy usage time. A number closer to 0 will signify that the customer’s usage pattern is different from the overall system’s usage during the peak time. Coincident peak ratio measures how similar the customer’s usage pattern is from the system’s peak usage during the month.
Worknight to Workday Usage Ratio will measure how much of the customer’s electricity usage occurs during the day in comparison to night. Workday is defined as the period of time from 8 a.m. to 4 p.m. and worknights are defined as 5 p.m. to 11 p.m., both from Monday through Friday. For customers who use majority of their electricity during the workdays, this ratio will be big. For customers who use majority of their electricity during worknights, this ratio will be a smaller. Similarly, Weekday and Weekend Usage Ratio will measure how much of the customer’s electricity usage happens during the regular weekday versus weekend. For customers who use majority of their electricity during the weekdays, this number will be large, and for customer who use majority of their electricity during the weekend, this ratio will result in a small number. Using these metrics, team NOVEC used the K-means clustering method to cluster customer segments. After the clustering was done, the team looked at the ratios in each cluster to describe what type of consumer each group consists of. For example, if a particular group has high Load Factor but low Coincident Usage Ratio, the group is comprised of consumers who use electricity in a constant manner but not following the pattern of the entire system during peak times. Finally, a graphical analysis was done to show the load profiles of consumers in each group. This represented the behaviors of consumers visually, to show how they are in fact different from other clusters and to give further insight to how the consumers use electricity.
4. Data Pre-Processing and Analysis
4.1 Data Dictionary Dataset was downloaded from the client server via FTP (File Transfer Protocol) in .csv format. Each record in the dataset has Account, Map location, Group, Usage and time stamp. The team exported these data to SQL server for data exploration and analysis.
Provided Variables Description
Account Unique customer identifier
Map Location Geospatial identifier
Group Customer Billing Classification (RES, LGCOM, SMCOM, CHRCH)
Usage Energy expenditure in kilowatt-hour (kWh)

DateTime MM-DD-YYYY 00:00 (24-hour)
Table 1. Data dictionary
4.2 Data Sampling The following table shows the overall historical portfolio of NOVEC. Approximately, 150,000 customers are grouped into customer types such as Residential, Large Company and Small Company.
Customer Type July 2011 July 2012 July 2013 July 2014 July 2015
Residential 135,407 (92.33%)
137,819 (92.30%)
140,806 (92.34%)
144,488 (92.36%)
147,652 (92.36%)
Large Company 94 (0.06%) 96 (0.06%) 110 (0.07%) 116 (0.07%) 121 (0.08%)
Small Company 11,143 (7.60%) 11,379 (7.62%) 11,551 (7.58%) 11,820 (7.56%) 12,083 (7.56%)
Street Light 16 (0.01%) 17 (0.01%) 17 (0.01%) 17 (0.01%) 17 (0.01%)
Total 146,660 149,311 152,484 156,441 159,873
Table 2. NOVEC Customer Portfolio
The following table shows the distribution of consumers in our sample data.
Customer Type July 2011 July 2012 July 2013 July 2014 July 2015
Residential 389 (45.98%) 420 (43.43%) 465 (42.94%) 421 (42.18%) 365 (40.20%)
Church 25 (2.96%) 36 (3.72%) 36 (3.32%) 32 (3.21%) 30 (3.30%)
Large Company 258 (30.50%) 316 (32.68%) 362 (33.43%) 348 (34.87%) 346 (38.11%)
Small Company 174 (20.57%) 195 (20.17%) 220 (20.31%) 197 (19.74%) 167 (18.39%)
Total 846 967 1083 998 908
Table 3. Sample data The sample data table shows that the proportion of residential customers is under-represented while the large companies are over-represented when compared to the historical population proportion. The team confirmed that there exists a bias in the sampling method through this exploratory analysis.
NOVEC’s system electricity usage peaks occurs in July every year. NOVEC stressed the importance of clustering customers’ usage with respect to system’s peak usage during July, since purchasing additional power at short term rates during this peak period is very expensive. Hence we started by visualizing and exploring the total hourly energy usage of the sample data for the month of July,2011. Each line in the graph represents a day in July, 2011.The following graph has 31 lines for 31 days for the month.

Fig 2. Daily sample energy usage pattern for July 2011 The graph of sample data shows that the system shows increase in electricity usage beginning around 5-6 a.m., reaches its peak around 10 a.m. to 3 p.m. and decreases from 5 p.m. The peak times represented in this graph is not representative of the entire population of NOVEC because as we have stated earlier, the sample collected more data for consumers who use a lot of electricity, who tend to be large commercial companies. Therefore, the graph above most likely represents the electricity usage pattern of large commercial companies. This further confirms the need for the team to use metrics that represent “how” consumers uses electricity, not “how much” electricity they use. 4.3 Data Cleaning
The dataset we received from the client has some irregularities which result in
zero values of some attributes such as: July Peak, July Average and Coincident Usage. Data records with no values were removed to minimize the error of the results of the analysis. After the dataset was cleaned using scripts to remove records with zero values, we retained about 96% of the original data for analysis. The following table depicts the total number of accounts in the original data and accounts after data cleansing.
Year Number of Customer Accounts in Original Data
Number of Customer Accounts in Final Data
2011 846 811
2012 966 932
2013 1082 1044

Table 3. Number of Customers in Data
The team has discussed removing outliers in the data set before processing clustering algorithms. However, determined that studying the behaviors of consumers who show irregular behaviors of electricity consumption is important. Therefore, the data was just processed to remove empty values, but has kept the outliers.
4.4 Data Transformation
After the data was cleaned, we adjusted the values of the observations through mathematical operations within the R software package and created derived variables for the purpose of the analysis. The following are the definition of derived variables created by the team to be used for analysis. The variables highlighted in bold are calculated metrics that were used for the clustering algorithm.
Newly Created Variables Description
July Peak Maximum recorded electricity usage by customer
July Consumption Total July electricity consumption by customer
July Avg Hourly average electricity usage by customer
Peak System Load Maximum record NOVEC system usage
Demand Factor July Peak / Peak System Load
Load Factor July Avg / July Peak
Coincident Usage Customer electricity usage at time of NOVEC system peak
Coincident Usage Ratio Coincident Usage / Peak System Load
Coincident Peak Ratio Coincident Usage / July Peak
Workday Total Usage Total usage from 8am – 4pm on Monday through Friday for entire month of July
Work-night Total Usage Total usage from 5pm – 11pm on Monday through Friday for entire month of July
Worknight to Workday Usage Ratio
Worknight Total Usage / Workday Total Usage
Weekday Total Usage Total usage on Monday through Friday for entire month of July
2014 997 957
2015 908 869
Total 4,799 4,613

Weekend Total Usage Total usage on Saturday through Friday for entire month of July
Weekday to Weekend Usage Ratio
Weekday Total Usage / Weekend Total Usage
Table 4. Derived variables for analysis
For the purpose of customer segmentation, we selected Demand Factor, Load Factor, Coincident Usage Ratio, Coincident Peak Ratio, Worknight to Workday Usage Ratio and Weekday to Weekend Usage Ratio variables.
Once we calculated the values for the selected variables for analysis, each variable in the dataset was graphed to see its distribution using a histogram. Whenever the distribution of a variable had a positive skew, we computed the natural logarithm of the variable. Taking the natural Logarithm of skewed data transformed the data set to have more normal distributions.
4.4.1 Demand Factor Variable Exploration
Fig 3. Demand factor variable exploration
The histogram for demand factor shows a heavily right-skewed distribution. However, a Log and Ln transformation shows two distinct peaks suggestive of two unique customer populations.

4.4.2 Load Factor Variable Exploration
Fig 6. Load factor variable exploration
The histogram for load factor shows one peak suggestive of a single customer population. There is no need for Log or Ln transformations. 4.4.3 Coincident Usage Ratio Variable Exploration
Fig 4. Coincident Usage variable exploration

The histogram for coincident usage shows a heavily right-skewed distribution. However, a Log and Ln transformation shows two distinct peaks suggestive of two unique customer populations.
4.4.4 Coincident Peak Ratio Variable Exploration
Fig 5. Coincident Peak Ratio variable exploration
The histogram for coincident peak ratio shows 3 peaks suggestive of three unique customer populations. There is no need for Log or Ln transformations. 4.4.5 Worknight to Workday Usage Ratio Variable Exploration

Fig 7. Worknight to Workday Ratio variable exploration The histogram for worknight to workday ratio is heavily right tailed. A Log or Ln transformation shows one peak suggestive of a single customer population.
4.4.6 Weekday to Weekend Usage Ratio Variable Exploration
Fig 8. Weekday-Weekend Ratio variable exploration
The histogram for weekday to weekend ratio is heavily right tailed. A Log or Ln transformation shows one peak suggestive of a single customer population.

4.5 Final Dataset The following table shows an example of the final dataset after the data was transformed to be used for k-means clustering.
account year LN_DemandFactor Load_Factor
LN_CoincidentUsageRatio
Coincident_Peak_Ratio
LN_wknight_wkday_Ratio
LN_wkday_wkend_Ratio
10082850 2012 -11.7535 0.1993 -12.6783 0.3966 -0.8958 0.8596
10082850 2015 -12.2443 0.2573 -12.7265 0.6174 -0.7197 0.8570
10527647 2012 -12.3759 0.2079 -15.5041 0.0438 -2.3997 2.7332
10666330 2012 -11.2132 0.1948 -12.7386 0.2175 -0.7044 0.8720
10723900 2014 -11.6977 0.3611 -12.4543 0.4693 -0.2741 1.0456
10733030 2013 -11.788 0.3752 -11.9948 0.8131 -0.9051 1.0377
10754460 2012 -7.7496 0.8363 -7.8134 0.9382 -0.2977 0.9230
10754464 2015 -6.9834 0.7999 -7.0550 0.9308 -0.2557 1.0893
10830230 2012 -16.7197 0.9159 -16.7557 0.9647 -0.2875 0.8941
1083080 2013 -12.1423 0.2108 -13.0914 0.3871 -0.3389 1.0082
……… ……. …….. ……. ……… ……….. ……….. ………..
……… ……. …….. ……. ……… ……….. ……….. ………..
Table 5. Snippet of final dataset
5. Customer Clustering Analysis Customer Cluster analysis is the task of grouping a set of customers in such a way that customers in the same group (called a cluster) are more similar in use of electricity usage to each other than to those in other groups (clusters). In order to determine appropriate clusters, the team explored three alternative clustering techniques: k-means, hierarchical clustering and histogram clustering as the initial phase of our

clustering analysis. Based on literature review, the team identified a partition based clustering technique called K-means to be the best fit.
5.1 Correlation Analysis
In order to overcome possible auto-correlation issues, the team to see if there are strong correlation among the variables. A correlation matrix was computed using R. The sample correlation coefficient is defined by the following formula,
𝑟𝑥𝑦 =𝑆𝑥𝑦
𝑆𝑥𝑆𝑦
where 𝑆𝑥 and 𝑆𝑦 are the sample standard deviations, and 𝑆𝑥𝑦 is the sample covariance.
Fig 9. Correlation of variables
The correlation values in the above figure can be interpreted as: If the correlation between two coefficients is close to 1, it indicates that the variables are positively correlated and linearly related. A number closer to -1, indicates that the variables are negatively correlated. A number close to 0 indicates a weak linear relationship between the variables. For instance, in our analysis LN_DemandFactor and LN_CoincidentUsageRatio are highly correlated (.89) while others have weak correlation. Looking at the correlation of variables is important for the group’s analysis because it would be redundant to use variables that are highly correlated with each other in order to come up with different customer segments. By looking at this correlation matrix, our team decided that all the ratios could be used in order to proceed with our clustering analysis.
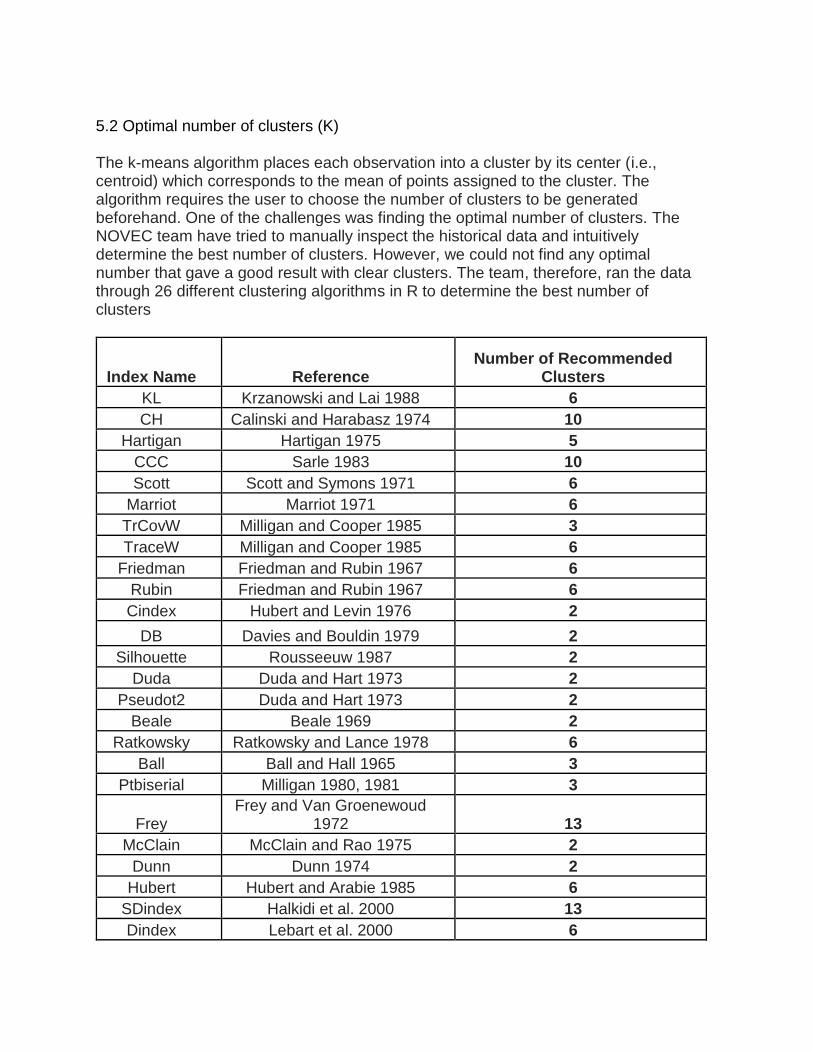
5.2 Optimal number of clusters (K) The k-means algorithm places each observation into a cluster by its center (i.e., centroid) which corresponds to the mean of points assigned to the cluster. The algorithm requires the user to choose the number of clusters to be generated beforehand. One of the challenges was finding the optimal number of clusters. The NOVEC team have tried to manually inspect the historical data and intuitively determine the best number of clusters. However, we could not find any optimal number that gave a good result with clear clusters. The team, therefore, ran the data through 26 different clustering algorithms in R to determine the best number of clusters
Index Name Reference Number of Recommended
Clusters
KL Krzanowski and Lai 1988 6
CH Calinski and Harabasz 1974 10
Hartigan Hartigan 1975 5
CCC Sarle 1983 10
Scott Scott and Symons 1971 6
Marriot Marriot 1971 6
TrCovW Milligan and Cooper 1985 3
TraceW Milligan and Cooper 1985 6
Friedman Friedman and Rubin 1967 6
Rubin Friedman and Rubin 1967 6
Cindex Hubert and Levin 1976 2
DB Davies and Bouldin 1979 2
Silhouette Rousseeuw 1987 2
Duda Duda and Hart 1973 2
Pseudot2 Duda and Hart 1973 2
Beale Beale 1969 2
Ratkowsky Ratkowsky and Lance 1978 6
Ball Ball and Hall 1965 3
Ptbiserial Milligan 1980, 1981 3
Frey Frey and Van Groenewoud
1972 13
McClain McClain and Rao 1975 2
Dunn Dunn 1974 2
Hubert Hubert and Arabie 1985 6
SDindex Halkidi et al. 2000 13
Dindex Lebart et al. 2000 6

SDbw Halkidi and Vazirgiannis 2001 15
Table 6. List of algorithms to determine k
Figure 10. Optimal number of clusters
Following the above analysis, the 26 different indices recommended 2 or 6 as the optimal number of clusters. The team agreed to go with six clusters because two clusters is smaller than the number of customer groups (4) that NOVEC currently has. Also, smaller number of clusters limits the ability to capture the varying behaviors of the consumers of NOVEC Statistical tests were used to confirm and validate the newly discovered six customer segments after applying the K-means algorithm on the data. Nonparametric tests were used because 4 variables in the data did not show a normal distribution (Figs. 2-3, 6-7). The first statistical test used was the Kruskal-Wallis test. It is a nonparametric test that compares two or more groups to determine whether or not they came from identical populations. A significant Kruskal-Wallis test indicates that there are at least two groups which come from different populations. All variables show a significant result (p-value < 0.05). This indicates that there are at least two customer groups which are different for each variable.
Variable DF Chi-Square
P-value
DemandFactor 5 2586.1 < 0.0001
Load_Factor 5 2928.4 < 0.0001
CoincidentUsageRatio 5 3179.2 < 0.0001
0
2
4
6
8
10
2 3 4 5 6 7 8 9 10 11 12 13 14 15
CO
UN
T
NUMBER OF CLUSTERS
Optimal Number of Clusters: 2 or 6

Coincident_Peak_Ratio 5 3022.9 < 0.0001
Wknight_wkday_Ratio 5 1504.9 < 0.0001
Wkday_wkend_Ratio 5 1335.8 < 0.0001
Table 7. Kruskal-Wallis Test Unfortunately, the Kruskal-Wallis test does not identify which specific groups are statistically significantly different. The Dunn test was used to follow up the Kruskal-Wallis test for post hoc analysis. The Dunn test is a nonparametric test that can be used to determine specifically where the differences occur between groups. For Demand Factor, the Dunn test indicated statistically significant differences between groups 1, 4, and 6. Groups 2, 3, and 4 did not show any statistically significant differences between them. Hence, there were 4 distinct groups found for this variable (Groups 1, 4, [2, 3, 4], 6). For Load Factor, the Dunn test indicated statistically significant differences between groups 2, 4 and 5. Groups 1, 3, and 6 did not show any statistically significant differences between them. Hence, there were 4 distinct groups found for this variable (Groups 2, 4, [1, 3, 6], 5). For Coincident Usage Ratio, the Dunn test indicated statistically significant differences between groups 1, 3, and 4. Groups 2 and 6 did not show any statistically significant differences between them. Hence, there were 5 distinct groups found for this variable (Groups 1, 3, 4, [2, 6], 5). For Coincident Peak Ratio, the Dunn test indicated statistically significant differences between groups 1, 3, 5, and 6. Groups 2 and 4 did not show any statistically significant differences between them. Hence, there were 5 distinct groups found for this variable (Groups 1, 3, 5, [2, 4], 6). For Worknight to Workday Usage Ratio, the Dunn test indicated a statistically significant difference for group 1. Groups 3 and 4 did not show any statistically significant differences between them. Similarly, groups 2, 5, and 6 did not show any statistically significant differences between them. Hence, there were 3 distinct groups found for this variable (Groups 1, [3, 4], [2, 5, 6]). For Weekday to Weekend Usage Ratio, the Dunn test indicated statistically significant differences between all groups. Hence, there were 6 distinct groups found for this variable (Groups 1, 2, 3, 4, 5, 6).

Figure 11.
5.3 Cluster Distribution The team analyzed July’s consumer data from 2011 to 2015 and grouped them into 6 clusters. The following table shows the percentage composition of each group across the years. The percentage of customers in each group does not vary a lot across the years. This is a good indicator that the clustering mechanism holds true for the years 2011 to 2015.
0
2000
4000
6000
1 2 3 4 5 6
Me
an
Ra
nk
Group
Demand Factor
0
1000
2000
3000
4000
5000
1 2 3 4 5 6
Me
an
Ra
nk
Group
Load Factor
0
1000
2000
3000
4000
5000
1 2 3 4 5 6
Me
an
Ra
nk
Group
Coincident Usage Ratio
0
1000
2000
3000
4000
1 2 3 4 5 6
Me
an
Ra
nk
Group
Coincident Peak Ratio
0
1000
2000
3000
4000
5000
1 2 3 4 5 6
Me
an
Ra
nk
Group
Weekday vs Weekend Usage Ratio
0
1000
2000
3000
4000
5000
1 2 3 4 5 6
Me
an
Ra
nk
Group
Worknight vs Workday Usage Ratio
Groups
/Year2011 2012 2013 2014 2015 Average
1 5% 11% 11% 11% 15% 10%
2 11% 11% 9% 8% 8% 9%
3 2% 3% 3% 3% 3% 3%
4 19% 17% 19% 19% 18% 19%
5 23% 22% 22% 29% 24% 24%
6 39% 36% 36% 30% 32% 35%

Table 8. Cluster distribution
Fig 12. Cluster Distribution pie-chart
5.4 Characterizing the Clusters
1-High weekday users/ companies
2-Irregular Heavy Users
3-Night time users
3%
4-Regular heavy Users
19%
5-Low Users24%
6-Medium Users
CLUSTER DISTRIBUTION

Fig 13. Customer Profiling
5.5 Cluster Profile Plots
5.5.1 Clusters Load Factor profile
Figure 14. Load Factor Clusters for 6 Customer Segments
0
1000
2000
3000
4000
5000
1 2 3 4 5 6
ME
AN
RA
NK
GROUP
Customer Profiling
Demand Factor - Customer's Peak Consumption/Peak System LoadLoad Factor - Customer's Avg Energy Use/Customer's Peak ConsumptionCoincident Usage Ratio - Customer's Coincident Peak Usage/Peak System LoadCoincident Peak Ratio - Customer's Coincident Peak Usage/Customer's Peak ConsumptionWeekend to Weekday Usage Ratio - Weekday Total Usage/Weekend Total UsageWorknight to Workday Usage Ratio - Worknight Total Usage/Workday Total Usage
“Weekday Users”
"Efficient Users”
“Night Owls”
“Heavy Users”
“Light Users”
“Medium Users”
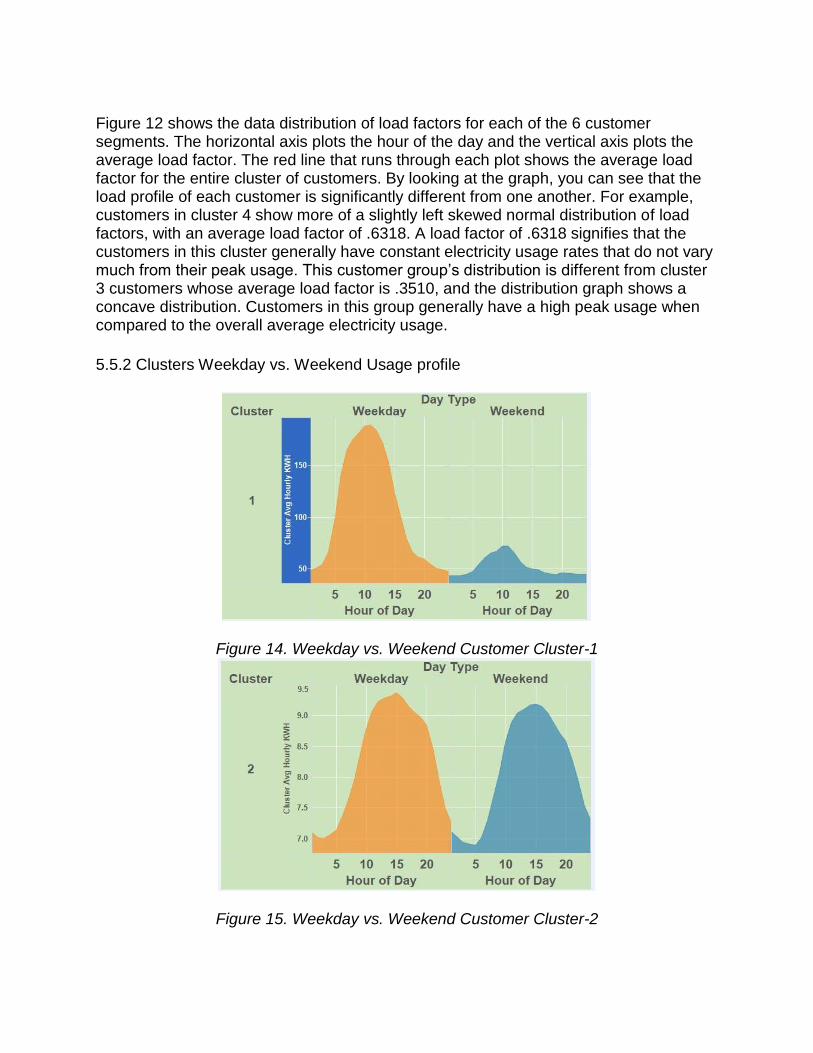
Figure 12 shows the data distribution of load factors for each of the 6 customer segments. The horizontal axis plots the hour of the day and the vertical axis plots the average load factor. The red line that runs through each plot shows the average load factor for the entire cluster of customers. By looking at the graph, you can see that the load profile of each customer is significantly different from one another. For example, customers in cluster 4 show more of a slightly left skewed normal distribution of load factors, with an average load factor of .6318. A load factor of .6318 signifies that the customers in this cluster generally have constant electricity usage rates that do not vary much from their peak usage. This customer group’s distribution is different from cluster 3 customers whose average load factor is .3510, and the distribution graph shows a concave distribution. Customers in this group generally have a high peak usage when compared to the overall average electricity usage.
5.5.2 Clusters Weekday vs. Weekend Usage profile
Figure 14. Weekday vs. Weekend Customer Cluster-1
Figure 15. Weekday vs. Weekend Customer Cluster-2
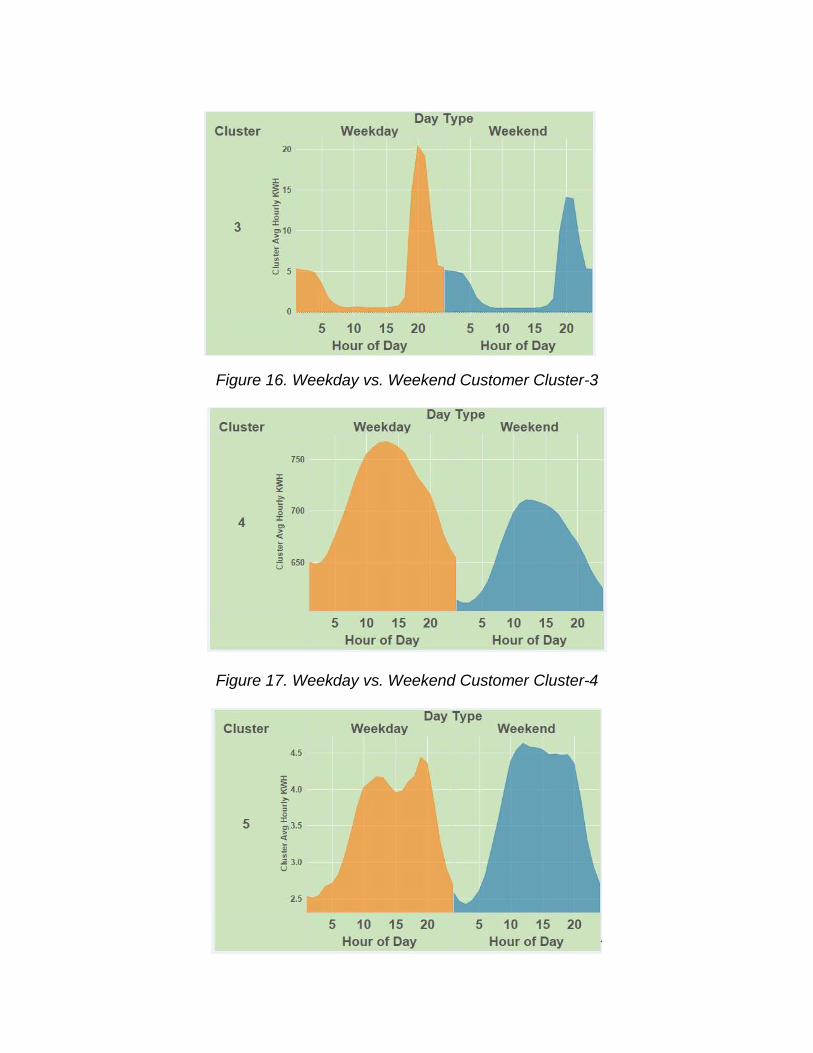
Figure 16. Weekday vs. Weekend Customer Cluster-3
Figure 17. Weekday vs. Weekend Customer Cluster-4

Figure 18. Weekday vs. Weekend Customer Cluster-5
Figure 19. Weekday vs. Weekend Customer Cluster-6
5.5.3 Clusters Worknight to Workday Usage profile
Figure 20. Workday vs. Worknight Customer Cluster-1
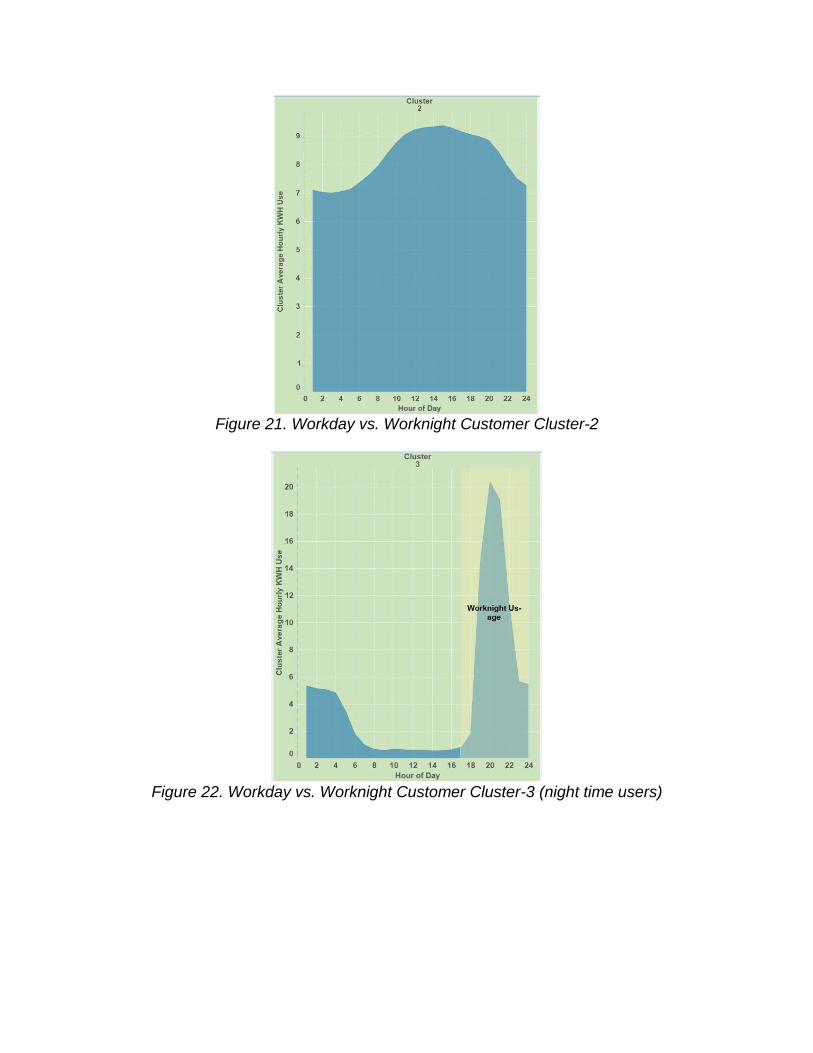
Figure 21. Workday vs. Worknight Customer Cluster-2
Figure 22. Workday vs. Worknight Customer Cluster-3 (night time users)

Figure 23. Workday vs. Worknight Customer Cluster-4 (Regular Heavy User)
Figure 24. Workday vs. Worknight Customer Cluster-5

Figure 25. Workday vs. Worknight Customer Cluster-6
5.6. Compute Confidence Interval for Unknown mean ( )
For a population with unknown mean and known standard deviation , a confidence interval for the population mean, based on a simple random sample (SRS) of size n, is
calculated as + z* , where z* is the upper (1-C)/2 critical value for the standard normal distribution.
Note: This interval is only exact when the population distribution is normal. For large samples (n>100) such as our sample dataset from NOVEC customers’ distributions, the distribution is assumed to be normal by the Central Limit Theorem. The project team picked 95% confidence level for the unknown mean and computed the range as Lower 95% CI and Upper 95% CI for each clustering characteristic variables.
5.6.1 Mean and 95% Confidence Interval for Demand Factor variable
Group Demand Factor Lower 95% CI
Upper 95% CI
1 3.07E-04 2.66E-04 3.48E-04
2 1.31E-05 1.21E-05 1.41E-05
3 4.10E-05 3.24E-05 4.96E-05
4 7.12E-04 5.38E-04 8.86E-04
5 1.85E-05 1.42E-05 2.29E-05
6 1.71E-05 1.45E-05 1.97E-05

Table 9. Mean and 95% Confidence Interval for Demand Factor variable From the above table, we can see the confidence intervals overlap. i.e. Group 6's CI and Group 5's, therefore the two groups are not statistically different for Demand Factor. Hence, the means are not statistically significant for the two groups.
5.6.2 Mean and 95% Confidence Interval for Load Factor variable
Group Load Factor Lower 95% CI
Upper 95% CI
1 0.34 0.34 0.35
2 0.71 0.70 0.72
3 0.35 0.33 0.37
4 0.63 0.61 0.64
5 0.24 0.24 0.25
6 0.34 0.33 0.35
Table 10. Mean and 95% Confidence Interval for Load Factor variable For Load Factor, Group 1, 3 and 6’s CI overlap, therefore the three groups are not statistically different. Hence, the means are not statistically significant for the three groups.
5.6.3 Mean and 95% Confidence Interval for Coincident Usage Ratio variable
Group Coincident Usage Ratio
Lower 95% CI
Upper 95% CI
1 8.54E-05 6.81E-05 1.03E-04
2 1.10E-05 9.31E-06 1.26E-05
3 1.75E-06 2.03E-08 3.48E-06
4 6.31E-04 3.11E-04 9.52E-04
5 3.90E-06 2.60E-06 5.20E-06
6 1.10E-05 8.52E-06 1.34E-05
Table 11. Mean and 95% Confidence Interval for Coincident Usage Ratio variable For Coincident Usage Ratio, Group 2 and 6’s CI overlap, therefore the two groups are not statistically different. Hence, the means are not statistically significant for these two groups.
5.6.4 Mean and 95% Confidence Interval for Weekday-to-Weekend Usage Ratio variable
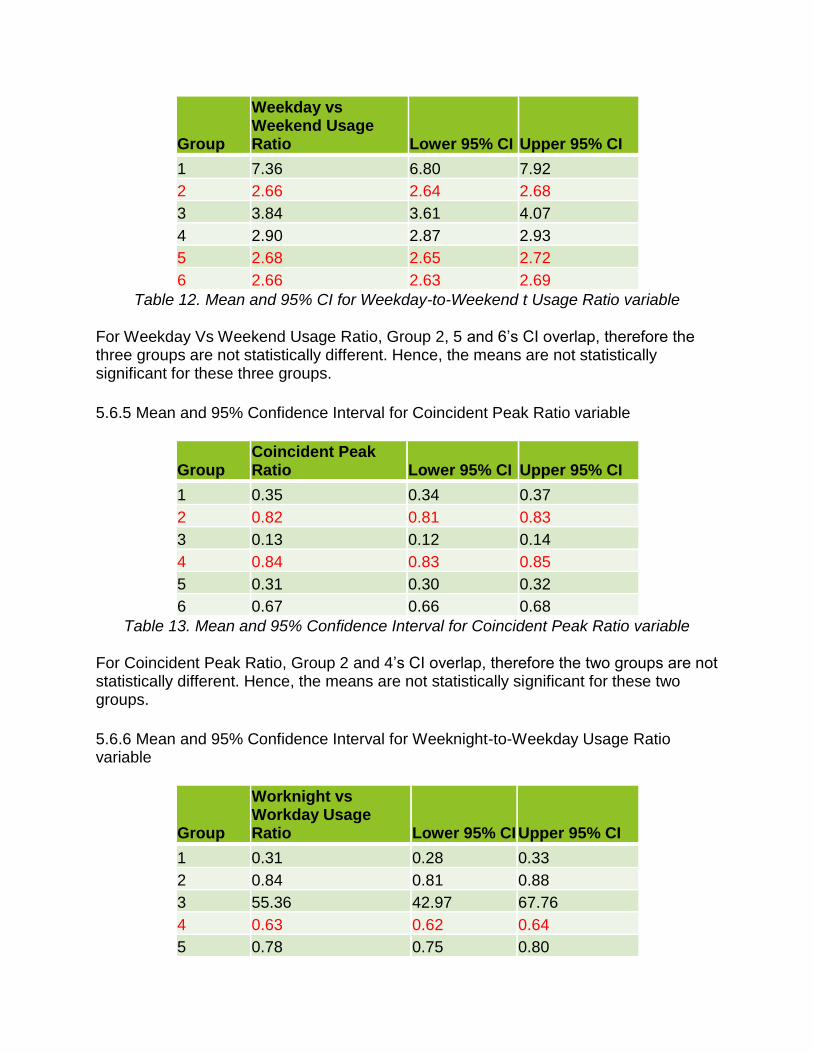
Group
Weekday vs Weekend Usage Ratio Lower 95% CI Upper 95% CI
1 7.36 6.80 7.92
2 2.66 2.64 2.68
3 3.84 3.61 4.07
4 2.90 2.87 2.93
5 2.68 2.65 2.72
6 2.66 2.63 2.69
Table 12. Mean and 95% CI for Weekday-to-Weekend t Usage Ratio variable For Weekday Vs Weekend Usage Ratio, Group 2, 5 and 6’s CI overlap, therefore the three groups are not statistically different. Hence, the means are not statistically significant for these three groups.
5.6.5 Mean and 95% Confidence Interval for Coincident Peak Ratio variable
Group Coincident Peak Ratio Lower 95% CI Upper 95% CI
1 0.35 0.34 0.37
2 0.82 0.81 0.83
3 0.13 0.12 0.14
4 0.84 0.83 0.85
5 0.31 0.30 0.32
6 0.67 0.66 0.68
Table 13. Mean and 95% Confidence Interval for Coincident Peak Ratio variable For Coincident Peak Ratio, Group 2 and 4’s CI overlap, therefore the two groups are not statistically different. Hence, the means are not statistically significant for these two groups.
5.6.6 Mean and 95% Confidence Interval for Weeknight-to-Weekday Usage Ratio variable
Group
Worknight vs Workday Usage Ratio Lower 95% CI Upper 95% CI
1 0.31 0.28 0.33
2 0.84 0.81 0.88
3 55.36 42.97 67.76
4 0.63 0.62 0.64
5 0.78 0.75 0.80

6 0.61 0.60 0.63
Table 14. Mean and 95% CI Weeknight-to-Weekday Usage Ratio variable For Worknight to Workday Usage Ratio, Group 4 and 6’s CI overlap, therefore the two groups are not statistically different. Hence, the means are not statistically significant for these two groups.
5.7 Application: Estimating NOVEC peak usage NOVEC can use our cluster analysis to identify future customers and their predicted impact on peak system load. For example, if NOVEC saw an increase of 100 customers in group 4, the peak system load would increase between 3.1% - 9.5% (95% CI) based on the sample data.
Group Coincident Usage Ratio Lower 95% CI Upper 95% CI
4 100*6.31E-04 = 0.0631 100*3.11E-04 = 0.031 100*9.52E-04 = 0.095
Table 15. Computing predicted impact based on CI
5.8 Comparison of July and January usage The project team did a similar analysis for the month of January of the 5- year sample data and compared the electricity usage behavior with the clusters for July. Overall the clusters display similar patterns and the number of clusters are still the same.
0
1000
2000
3000
4000
5000
1 2 3 4 5 6
ME
AN
RA
NK
GROUP
Demand Factor
Jan July
0
1000
2000
3000
4000
5000
1 2 3 4 5 6
ME
AN
RA
NK
GROUP
Load Factor
Jan July

Figure 26. Comparison of January and July Groups
The groups in January and July both show similar patterns of ratios, signifying that the clustering of customers are relatively consistent between the two months.
6. Risk Analysis We identify and manage existing and potential problems that could undermine the solution of our project. So far also accept the risk related to the nature of the sample data being collected for rate making vs for customer electric usage segmentation purpose. We also discovered some inconsistences with customer classification types which some customers appear to be classified as different types at different years. We removed some records with zero values in the data cleaning and preprocessing phase to minimize the percentage error. To mitigate the risks, The Sponsor is aware of the issues with the sample data and recommends a rigorous documentation as we go along using different tools and algorithms for analysis on these data.
7. Conclusions
We are able to segment the stratified survey data and show clear differences in uses among the survey customers. The team was able to cluster the customers into 6
0
1000
2000
3000
4000
5000
1 2 3 4 5 6
ME
AN
RA
NK
GROUP
Coincident Usage Ratio
Jan July
0
500
1000
1500
2000
2500
3000
3500
4000
1 2 3 4 5 6
ME
AN
RA
NK
GROUP
Coincident Peak Ratio
Jan July
0
1000
2000
3000
4000
5000
1 2 3 4 5 6
ME
AN
RA
NK
GROUP
Worknight to Workday Usage Ratio
Jan July
0
1000
2000
3000
4000
5000
1 2 3 4 5 6
ME
AN
RA
NK
GROUP
Weekday to Weekend Usage Ratio
Jan July

different segments based on their behavior of electricity usage with respect to NOVEC’s peak energy usage. We currently recommend 6 segments based upon the metrics we used.
We recognize that changes in technology, family dimension and new energy sources will lead to a change in customer’s energy usage behavior, so the same analysis should be redone when such technological shifts occur.
The customer clusters can be used by NOVEC to help in time-of-use pricing, load management programs and capacity planning.
8. Recommendations and Future Use The team recommends the following ideas for potential future work.
1. Consider incorporating additional metrics such as seasonality effects, holiday effects, and more time of day analysis to see if new clusters emerge.
2. Should NOVEC pursue to use existing data for segmentation, we recommend applying importance sampling technique for detailed analysis of the stratified survey data.
3. Perform a survey with fair representation of all types of customers
Appendix A: Project Plan
9.1 Work Breakdown Structure A Work Breakdown Structure (WBS) was developed to assist in scheduling,
evaluating and managing project tasks and deliverables. The WBS has five components: project management, research and analysis, clustering and segmentation, solutions and project deliverables. Project management consists of project planning, project team meetings, tracking to determine earned value reporting metrics. The purpose of these tasks is to ensure the project team remains focused on sponsor needs, within budget and in time.
Deliverables include final presentation, project proposal, final report and a project website. The research and analysis consists of problem definition and defining scope of the project. It also includes customer segmentation and clustering analysis, which will be given as a report to the NOVEC. Finally, the team will analyze each resulting category of customers by validating and testing the segment with data.

Figure 27. Work Breakdown Structure
9.2 Schedule The major milestones planned for the NOVEC Customer Segmentation for Forecasting project are provided in Table 16. These milestones provide a framework for the deliverables and major project briefings.
Milestone Date
Team Organization and Project Description
Sep 1,2016
Problem Definition Presentation Sep 9,2016
Project Proposal Presentation Sep 22,2016
Project Proposal Report Oct 6, 2016
In Progress Review 1 Oct 13,2016 (20 min)
Professor Working Group Meeting Nov 3, 2016
In Progress Review 2 with Professor Nov 8, 2016
Final Presentation Dry Run
Nov 17. 2016
NOVEC Customer Segmentation for Forecasting Project
Project Management
Project Planning
Project Reporting
Project Meetings
Research and Analysis
Problem Definition
Scope Definition
Clustering and Segmentation
Exploratory Analysis
Customer Segmentation
Modeling
Solution
Analysis of Results
Test and Evaluation
Deliverables
Final Presentation
Project Proposal
Final Report
Website

Draft Final Report Nov 17, 2016
Final Report submission after corrections
Dec 1, 2016
Final Presentation /Submission Deliverables and Website
Dec 9, 2016 Friday
Table 16. Project Milestone The following project time line with the plan depicts the baseline schedule for the NOVEC Customer Segmentation for Forecasting project.
Figure 28. Project time line

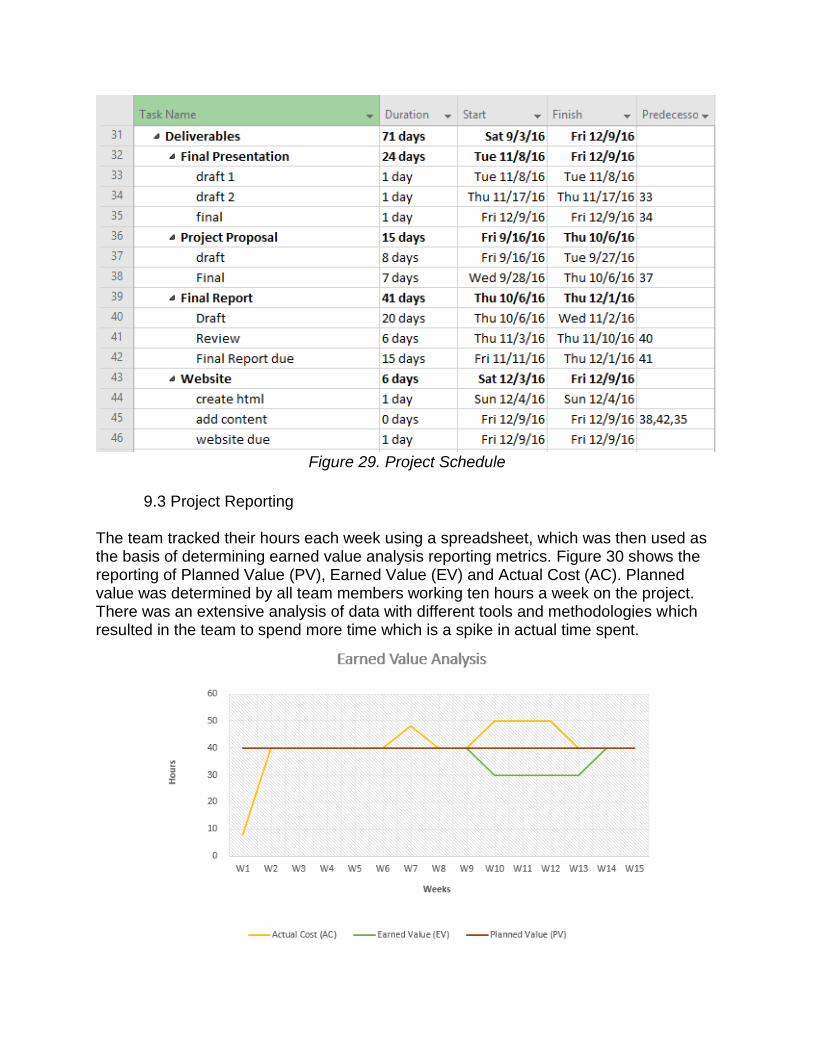
Figure 29. Project Schedule
9.3 Project Reporting The team tracked their hours each week using a spreadsheet, which was then used as the basis of determining earned value analysis reporting metrics. Figure 30 shows the reporting of Planned Value (PV), Earned Value (EV) and Actual Cost (AC). Planned value was determined by all team members working ten hours a week on the project. There was an extensive analysis of data with different tools and methodologies which resulted in the team to spend more time which is a spike in actual time spent.

Fig 30. Earned Value Analysis There was some delay in the project which resulted the team falling behind schedule. This is shown in figure below. As it can be seen the Schedule Variance (SV) line in yellow fell into negative values. The delay was caused because with initial K-means analysis alone, the team could not explain how clusters were different from each other. There needed to be identifiable characteristics with each group of customers and verification to show that customers in different groups use electricity differently. This was later solved through identifying customer groups by their variables, and also by looking at the graphed profiles of the customers in a group. After modifying the methodology and redefining the goals, the team was able to deliver the project on time.
Figure 29. Variance Analysis
Appendix B: Initial Analysis – SAS Analysis done with SAS was done with different customer groups. Residential, Small Commercial, and Large Commercial customers were analyzed separately, and clusters were formed within each customer group. The analysis resulted in 7 clusters for residential customers, 8 clusters for Small Commercial customers, and 6 clusters for large commercial customers. The respective tables and graphs are below:

Figure 30. SAS-Residential Customers
Figure 31. SAS-Small Commercial Customers

Figure 32. SAS-Large Commercial Customers
Appendix C: Initial Analysis – Weka Weka is an open source software for data mining and known for doing clustering analysis. But it has the limitation of not being able to determine the optimal number of clusters. Using K-means and PAM, the optimal number of clusters was determined to be 6 using R. The team inputted these cluster sizes into Weka for the following clusters.
Attribute Full Data Group 1 Group 2 Group 3
Group 4 Group 5 Group 6
Group Distribution 4600 1073 1378 363 424 760 602
Percent Distribution 100% 23% 30% 8% 9% 17% 13%
Load Factor .4065 .3611 .3088 .7363 .367 .6464 .376
Coincident_PK_Ratio .5813 .7627 .4803 .8667 .2915 .8838 .1391

LN_CoincidentUsageRatio -11.3788 -11.4313 -12.3224 -12.0336 -9.6021 -8.0961 -14.126
LN_DemandFactor -10.5845 -11.1504 -11.5707 -11.8815 -8.1591 -7.9643 -11.5524
LN_Wkday_Wkend_Ratio 1.0675 1.0109 .9896 .9662 1.5596 1.0662 1.0791
LN_Wknigth_Wkday_Ratio -.4702 -.5789 -.4857 -.3033 -1.1226 -.5134 .172
Table 17. Cluster Distribution
Group 1 – 23% Group 5 – 17% Group 4 – 9% Group 3 – 8% Group 6 – 13% Group 2 – 30%
Fig 33. Weka-Cluster segmentation Appendix D. Other Tables & Graphs The table below shows the characteristics of each cluster in terms of the centroid(mean) values of the attributes used as an input for K-means clustering.
Table 18. Characterizing clusters with variable means
Group
Demand
Factor
Load
Factor
Coincident
Usage Ratio
Coincident
Peak Ratio
Worknight vs
Workday Usage
Ratio
Weekday vs
Weekend Usage
Ratio
1 3.07E-04 0.34 8.54E-05 0.35 0.31 7.36
2 1.31E-05 0.71 1.10E-05 0.82 0.84 2.66
3 4.10E-05 0.35 1.75E-06 0.13 55.36 3.84
4 7.12E-04 0.63 6.31E-04 0.84 0.63 2.90
5 1.85E-05 0.24 3.90E-06 0.31 0.78 2.68
6 1.71E-05 0.34 1.10E-05 0.67 0.61 2.66
Load factor
Coincident peak ratio
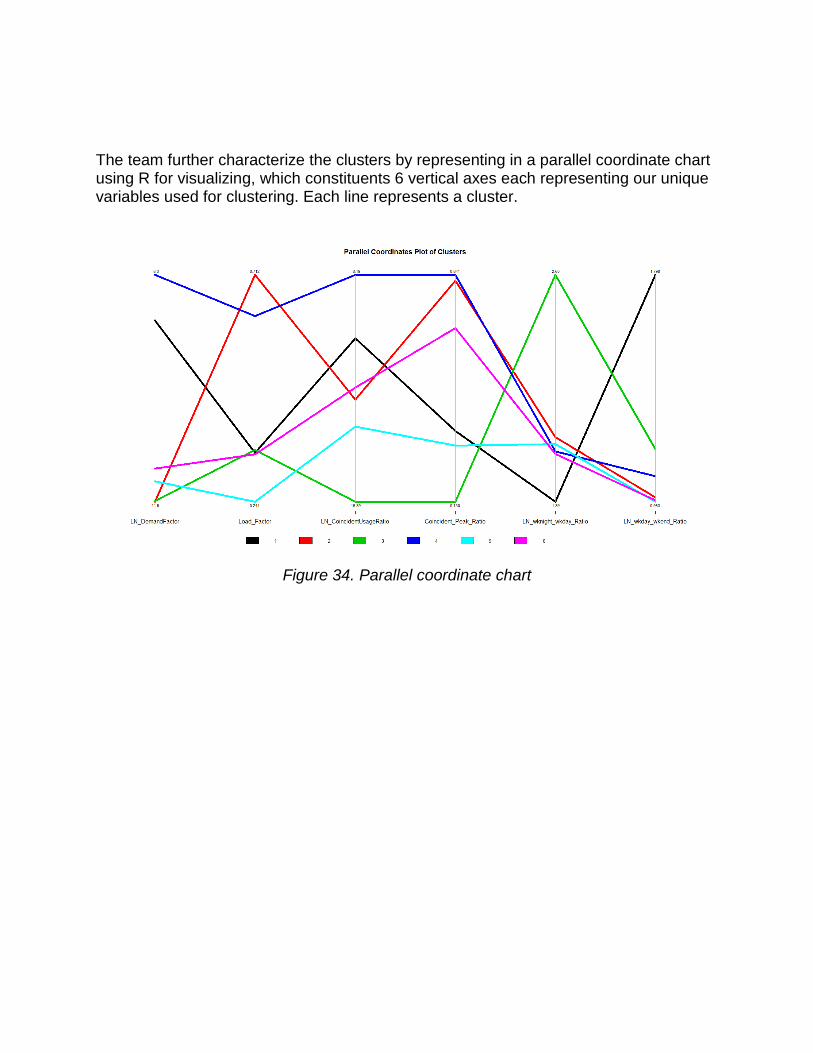
The team further characterize the clusters by representing in a parallel coordinate chart using R for visualizing, which constituents 6 vertical axes each representing our unique variables used for clustering. Each line represents a cluster.
Figure 34. Parallel coordinate chart

Appendix E. Terminology and Ratio Meanings
Terminology Customer’s Peak Consumption: Customer’s highest KwH energy usage amount in the time period Customer’s Average Energy Use: Customer’s average KwH energy usage amount in the time period Peak System Load: Maximum peak electricity usage in KwH for entire NOVEC’s system in time period Coincident Peak Usage: Customer’s KwH usage at the time NOVEC’s system peaked Workday/Worknight Total Usage: Customer’s total KwH usage during 8am-4pm/ 5pm-11pm on Monday-Friday for entire month Weekday/Weekend Total Usage: Customer’s total KwH usage during Monday-Friday/ Saturday-Sunday for entire month
Ratios
Demand Factor Consumer′s Peak Consumption
Peak System Load
Ranges from 0-1. Measure of how large of a user the consumer is. Number closer to 0 indicates that consumer is relatively a small user; Number closer to 1 indicates that consumer is relatively a big user
Load Factor Consumer′s Avg Energy Use
Consumer′s Peak Consumption
Ranges from 0-1. Measures the consistency of consumer’s energy usage. Number closer to 0 indicates that consumer has greater variability in energy usage; Number closer to 1 indicates that consumer uses energy in consistent manner.
Coincident Usage Ratio Consumer′s Coincident Peak Usage
Peak System Load
Ranges from 0-1. Measure of energy contribution of consumer during peak time. Number closer to 0 indicates that consumer contributes little to system’s peak usage; Number closer to 1 indicates that consumer contributes more to system’s peak usage.
Coincident Peak Ratio Consumer′s Coincident Peak Usage
Consumer′s Peak Consumption
Ranges from 0-1. Measure of the alignment of system’s peak usage with consumer’s peak usage. Number closer to 0 indicates that consumer’s peak consumption does not align well with system’s peak; Number closer to 1 indicates that consumer’s peak consumption aligns well with system’s peak.
Worknight to Workday Usage Ratio Worknight Total Usage
Workday Total Usage
Measures whether the consumer uses most of its electricity during the workday hours or the worknight hours. Bigger ratio indicates consumer is a heavy workday user, smaller ratio indicates consumer uses most of its electricity during the worknight hours.
Weekday to Weekend Usage Ratio Weekday Total Usage
Weekend Total Usage
Measures whether the consumer uses most of its electricity during the Weekday or Weekend. Bigger ratio indicates consumer is a heavy weekday user, smaller ratio indicates consumer uses most of its electricity during the weekend.
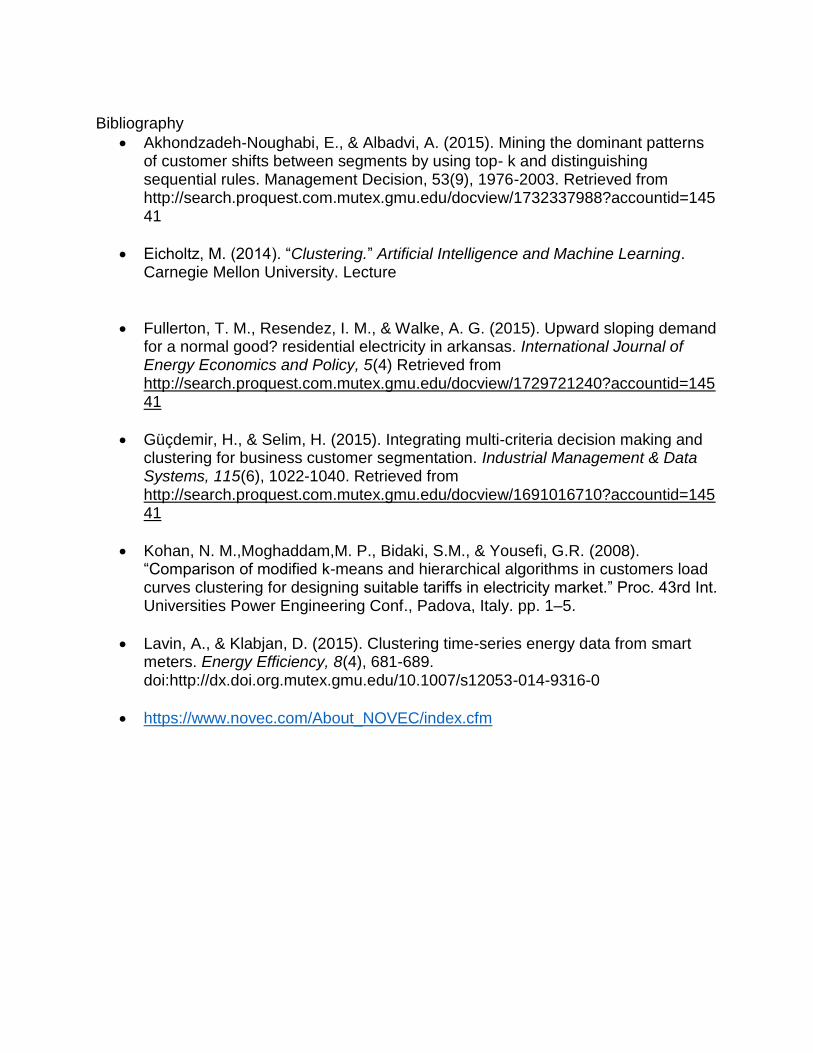
Bibliography
Akhondzadeh-Noughabi, E., & Albadvi, A. (2015). Mining the dominant patterns of customer shifts between segments by using top- k and distinguishing sequential rules. Management Decision, 53(9), 1976-2003. Retrieved from http://search.proquest.com.mutex.gmu.edu/docview/1732337988?accountid=14541
Eicholtz, M. (2014). “Clustering.” Artificial Intelligence and Machine Learning. Carnegie Mellon University. Lecture
Fullerton, T. M., Resendez, I. M., & Walke, A. G. (2015). Upward sloping demand for a normal good? residential electricity in arkansas. International Journal of Energy Economics and Policy, 5(4) Retrieved from http://search.proquest.com.mutex.gmu.edu/docview/1729721240?accountid=14541
Güçdemir, H., & Selim, H. (2015). Integrating multi-criteria decision making and clustering for business customer segmentation. Industrial Management & Data Systems, 115(6), 1022-1040. Retrieved from http://search.proquest.com.mutex.gmu.edu/docview/1691016710?accountid=14541
Kohan, N. M.,Moghaddam,M. P., Bidaki, S.M., & Yousefi, G.R. (2008). “Comparison of modified k-means and hierarchical algorithms in customers load curves clustering for designing suitable tariffs in electricity market.” Proc. 43rd Int. Universities Power Engineering Conf., Padova, Italy. pp. 1–5.
Lavin, A., & Klabjan, D. (2015). Clustering time-series energy data from smart meters. Energy Efficiency, 8(4), 681-689. doi:http://dx.doi.org.mutex.gmu.edu/10.1007/s12053-014-9316-0
https://www.novec.com/About_NOVEC/index.cfm


![3M™Novec™ 612 Novec™ 612 - United States ... · Commercial units available [Contact 3M for details] 3 Innovation. Typical Novec™ 612 Cover Gas: Concentration/Flow Rates Open](https://img.pdfslide.us/doc/110x75/5b71fa707f8b9a467a8c0ce0/3mnovec-612-novec-612-united-states-commercial-units-available.jpg)