Embed Size (px)
Citation preview

7/29/2019 Customer Satisfactionnh
http://slidepdf.com/reader/full/customer-satisfactionnh 1/70
INTRODUCTION
Customer satisfaction, a business term, is a measure of how products and services
supplied by a company meet or surpass customer expectation. It is seen as a key performance indicator within business and is part of the four of a Balanced Scorecard.
In a competitive marketplace where businesses compete for customers,
customer satisfaction is seen as a key differentiator and increasingly has become a key
element of business strategy.
It's a well known fact that no business can exist without customers. In the
business of Website design, it's important to work closely with your customers tomake sure the site or system you create for them is as close to their requirements as
you can manage. Because it's critical that you form a close working relationship with
your client, customer service is of vital importance.
Customer satisfaction is the most common form of market research in
business-to-business markets and is often connected to quality and production
measurement, rather than as straight marketing based research.
Before setting up a customer satisfaction programme, it is necessary to ensure
that the organisation has the will to actually make changes for improvement,
otherwise you will simply be annoying customers by taking their time to collect
information, then not doing anything with it.
MEASURING CUSTOMER SATISFACTION
When customers rate their satisfaction with an element of the company's performance, say delivery, we need to recognize that customers will vary in how they
define good delivery: it could mean early delivery, on-time delivery, order
completeness, and so on, yet if the company had to spell out every element in detail,
customers would face a huge questionnaire. We must also recognize that two
customers can report being "highly satisfied" for different reasons. One way be easily
satisfied most of the time and the other might be hard to please but was pleased on
this occasion.

7/29/2019 Customer Satisfactionnh
http://slidepdf.com/reader/full/customer-satisfactionnh 2/70
Companies should also note that manager and salespersons can manipulate
their ratings on customer satisfaction. They can be especially nice to customers just
before the survey. They can be especially nice to exclude unhappy customers from
being included in the survey.
One danger is that customer know that the company will go out of its way
to please customers, some customers may want to express high dissatisfaction (even if
satisfied) in order to receive more concessions.
Ways to satisfy customers
1. Encourage face-to-face dealings
2. Respond to messages promptly & keep your customers informed
3. Be friendly and approachable
4. Have a clearly-defined customer service policy
5. Attention to detail
6. Anticipate your customer‟s needs & go out of your way to help them out
7. Honors your promises
Consumer satisfaction can be measured using survey techniques and
questionnaires. Questions typically include an element of emotional satisfaction
coupled with an element of behavioral satisfaction, or loyalty to a particular product
or service.
Customer satisfaction, a term frequently used in marketing, is a measure of
how products and services supplied by a company meet or surpass customer
expectation. Customer satisfaction is defined as "the number of customers, or
percentage of total customers, whose reported experience with a firm, its products, or
its services (ratings) exceeds specified satisfaction goals."

7/29/2019 Customer Satisfactionnh
http://slidepdf.com/reader/full/customer-satisfactionnh 3/70
It is seen as a key performance indicator within business and is often part of a
Balanced Scorecard. In a competitive marketplace where businesses compete for
customers, customer satisfaction is seen as a key differentiator and increasingly has
become a key element of business strategy.
Within organizations, customer satisfaction ratings can have powerful effects.
They focus employees on the importance of fulfilling customers‟ expectations.
Furthermore, when these ratings dip, they warn of problems that can affect
sales and profitability. These metrics quantify an important dynamic. When a brand
has loyal customers, it gains positive word-of-mouth marketing, which is both free
and highly effective."
Therefore, it is essential for businesses to effectively manage customer
satisfaction. To be able do this, firms need reliable and representative measures of
satisfaction.
"In researching satisfaction, firms generally ask customers whether their
product or service has met or exceeded expectations. Thus, expectations are a key
factor behind satisfaction. When customers have high expectations and the reality
falls short, they will be disappointed and will likely rate their experience as less than
satisfying. For this reason, a luxury resort, for example, might receive a lower
satisfaction rating than a budget motel-even though its facilities and service would be
deemed superior in 'absolute' terms."
The importance of customer satisfaction diminishes when a firm has increased
bargaining power. For example, cell phone plan providers, such as AT&T and
Verizon, participate in an industry that is an oligopoly, where only a few suppliers of
a certain product or service exist. As such, many cell phone plan contracts have a lot
of fine print with provisions that they would never get away if there were, say, a
hundred cell phone plan providers, because customer satisfaction would be way too
low, and customers would easily have the option of leaving for a better contract offer.
There is a substantial body of empirical literature that establishes the benefits
of customer satisfaction for firms.

7/29/2019 Customer Satisfactionnh
http://slidepdf.com/reader/full/customer-satisfactionnh 4/70
NEED OF THE STUDY
It is buyer‟s market. Customer is an important person to the organization. We
have to fulfill the requirements of customer to survive in the global competitive
environment. The needs and demands of customers are constantly changing. So,
suppliers / organizations have to dance to the tune of customer. In this regard, the
organization must equip to demonstrate its power. The following information would
help the leaders or managers to understand the magnitude of customer satisfaction.
This present study of customer satisfaction is done in Berger paints at
Karimnagar. Customer satisfaction is a very good study. By this, we can know the
Quality and Product range in Berger paints. By the study of customer satisfaction, we
can know the opinions of customers regarding the products of Berger paints.
We can also know the products offered by the Berger paints.
OBJECTIVES OF STUDY
1. To know the satisfaction level of customers with the products of Berger paints.
2.
To know the customer perception towards the services of Berger paints.
3. To know the opinion on quality and product range in Berger paints.
4. To know the promotional activities implemented by Berger paints.
5. To bring awareness to the customers regarding the Berger paints.
6. To know the preference of customers regarding the products.
7. To know the opinion of customers on price rates in Berger paints.
SCOPE OF THE STUDY
The scope is very limited because attitude of the people change according to the time.
It is restricted to Karimnagar and that to among 100 respondents. It is conducted for
45 days and restricted to certain area.

7/29/2019 Customer Satisfactionnh
http://slidepdf.com/reader/full/customer-satisfactionnh 5/70
RESEARCH METHODOLOGY
Research is the plan structure & strategy for investigation conceived to answer to
research question & control variance. It is the overall operation pattern to framework
of project that stipulated the information to be collected from which sources by word
procedure. What are the two possible sources of data for securing in the above
mentioned information in the primary & secondary data.
SOURCES OF DATA:
Information required for the project is mainly primary data. The information
was collected by sample survey method with the help of questionnaire by meting
various customers of Berger paints.
Secondary data is collected form the company journals, magazines, broachers
& websites.
Sample design:
The sampling unit was confined to consumers of the product i.e. Berger paints
to know there satisfaction level regarding performance of the company.
Sample universe:
The survey was done in Karimnagar only according to my convenience. It is
not giving the complete picture of Andhra Pradesh (or) India.
Sample frame/unit:
Sample frame for professionals, business people, employees etc, who are
using Berger paints.
Sample size:
The total sample size is 100 only.

7/29/2019 Customer Satisfactionnh
http://slidepdf.com/reader/full/customer-satisfactionnh 6/70
Sample technique:
The information is planned to be collected by sample method, the sample method
followed is random sampling method. The sampling method is simple random
sampling.
Analytical Method: simple percentage method is used for the analysis purpose.
Data collection:
The information is collected through questionnaires and personal interviews. And the
information of customers is known by company‟s service sheet and the free service
sheet.
A Direct structure questionnaire has been asked to all the respondents in the
sample followed by direct personal interviews. Duration of study is 45 days.
Descriptive Studies:
In descriptive studies, when the researcher is interested in knowing the characteristics
of certain groups such as age. Sex, educational level occupation of income, a
descriptive study is necessary. Descriptive studies are well structured. It is therefore,
necessary that the researcher gives sufficient thought to framing research questions
and deciding the types of data to he collected and the procedure to be used for this
purpose. The objective of such a study is to answer the “who, what and how” of the
subject under investigation.
7/29/2019 Customer Satisfactionnh
http://slidepdf.com/reader/full/customer-satisfactionnh 7/70
LIMITATION OF THE STUDY
1. The present research is restricted to Karimnagar only.
2.
The sample size taken is only 100 and as such is very small as compared tothe universe, this is due to the constraints of time and effort, and as such
may not be enough to generalize to the entire population, however it is
presumed that the sample represents the universe.
3. Respondents might have responded with the actual feelings of facts while
giving responses to the questionnaire.
4.
Time being a limiting factor was not sufficient to gather opinions frommajority of the respondents, who form part of the universal sample.
5. While every care as been taken to eliminate perceptual bias from the side
of the researcher and the respondents however certain element of bias
might have set in to the research in adverantly.

7/29/2019 Customer Satisfactionnh
http://slidepdf.com/reader/full/customer-satisfactionnh 8/70
INDUSTRY PROFILE
Paint is defined as the group of emulsions , consisting of pigments suspended
in a liquid medium , for use as decorative or protective coatings . Today,
contemporary paints and coating consists of countless of hundred of thousands to
fulfill the varied requirements of hundreds of thousands of applications .”Paint”
ranges from the broad group of environmentally sound latex paints that many
consumers use to decorate and protect their homes and the translucent coating that
line the interior of food homes and the translucent coating that line the interior of food
containers, to the chemically complex , multi-component finishes that automobile
manufacturers apply on the assembly line.
Paint made its earliest appearance about 30,000 yeara ago . Cave dwellers
used crude paints to leave behind the graphic representations of their lives that even
today decorate the walls of their ancient rock dwellings.
The utility of paints has evolved from a decorative use to a surface protection
use. Also, know as surface coatings, paints can be classified on the basis of end use,
solvent system and solid content.
End use classification:
Under this heading, paints can be classified as decorative / architectural paints
and industrial paints .As the names suggest, decorative paints are mainly used for
household and construction purposes while industrial paints are used as coating for
industrial productions . Main types of decorative paints are enamels , acrylic
emulsions, distempers and exteriors and post a message primary types of industrial
paints are marine paints , anti corrosive metal coatings , ect .
Solvent based classification:
This includes paints, which use petro products or water as the main solvent.
Water based paints are gaining popularity due to their environment friendliness.
Solid content can be classified as liquid or solid (powder) paints .Powder
coating find application mainly in the white goods industry .

7/29/2019 Customer Satisfactionnh
http://slidepdf.com/reader/full/customer-satisfactionnh 9/70
The decorative segment dominates the market in India with a 70% share with
the rest accounted for by industrial paints . This is compared to the developed
countries where the share is the reverse with the industrial segments the major one .
With increased industrialization segments the major one . With increased
industrialization the ratio in India is also likely to change in the favour of industrials
and both segments are likely to be equal partners by the end of five years.
Decorative Paints Segment Market Size (Rs mn)
Enamels 8600
Wall Finishes 4730
Primers 2150
Wood Finishes 430
Total 15910
INDIAN PAIN INDUSTRIES SECTOR REPORT
Products
Industrial Paints Segment Market Size (Rs mn)
Auto 4386
CRP 1075
Powder 860
Coil 94.6
Others 731
Total 7147

7/29/2019 Customer Satisfactionnh
http://slidepdf.com/reader/full/customer-satisfactionnh 10/70
OVERVIEW OF PAINT INDUSTRY
The Indian paint industry is a Rs 49 Billion sector
The demand for paints is relatively price – elastic but is linked to the industrialand economical growth.
The per capita consumption of paints in India is very low at 0.5 kg per annum
if compared with 4kg in the South East Asian nations and 22 kgs in developed
countries . The global average per capita consumption is 15 kg.
In Indian the organized sector control 70 percent of the total market with the
remaining 30 percent being in the hands of nearly 2000 small – scale units.
In Indian the industrial paint segment account for 30percent of the paint
market while the decorative paint segment accounts for 70 per cent of paints
sold in Indian .
In most developed countries , the ration of decorative paints vis-à-vis
industrial paints is around 50:50.
All the industry major have a vast dealership network and are required to
maintain high inventory levels.
Most of the paint leaders have technical tie-ups with global paint leaders.
Sector comments
Paint is a mixture of four element – solvents, binders, pigments and additives .
Solvents give the paint a liquid flow while the binder binds it to the surface. Pigments
impart colour and opacity to the paint and the additives give it special resistance
properties.
Sector trends
The recession in the construction and automobile sector had throw in shades of
gray across the Industry spectrum , but the revival in these sectors is cause for cheer
for the paint industry as well. The balance sheets of the industry major are now painted with bright colors.

7/29/2019 Customer Satisfactionnh
http://slidepdf.com/reader/full/customer-satisfactionnh 11/70
Sector specifics
On product lines, paints can be differentiated into decorative or architectural
paints and industrial paints. While the former caters to the housing sector , the
automotive segment is a major consumer of the latter .Decorative paints can future be
classified into premium, medium and distemper segments .Premium decorative paints
are acrylic emulsions used mostly in the metros .The medium range consists of
enamels , popular in smaller cities and towns . Distempers are economy products
demanded in the suburban and rural markets .Nearly 20perr cent of all decorative
paints sold in India are distempers and it is here that the unorganized sector has
dominance. Industrial paints include powder coatings , high performance coating and
automotive and marine paints .But two – thirds of the industrial paints produced in thecountry are automotive paints.
Market profile
The leaders in the organised paint industry are Asian Paints (India) Ltd.(APIL)
Goodlass Nerolac Paints Ltd.(GNPL), Berger Paints , Jenson & Nicholson Ltd.(J&N)
and ICI (India )Ltd.
Asian paint is the industry leader with and overall market share of 33 per cent
in the organised paints market .It has the largest distribution network among the
players and its aggressive marketing has earned it strong brand equity .The Berger
Group and ICI share the second slot in the industry with market shares of 17 per cent
each .GNPL has a market share of 15 percent in the organised sector.
The market can be further spilt into decorative paints and industrial paints.
The demand for decorative paints is highly price – sensitive and also cyclical .Monsoon is a slack season while the peak business period is Diwali festival time,
when most people repaint their houses. The industrial paints segment, on the other
hand, is a high volume-low margin business .In the decorative segment, it is the
distribution network that counts while in the industrial segment the deciding factor are
technological superiority and tie-up with automobile manufactures for assured
business.

7/29/2019 Customer Satisfactionnh
http://slidepdf.com/reader/full/customer-satisfactionnh 12/70
APIL dominates the decorative segment with a 33 per cent market share. The
company has more than 15,000 retail outlets and its brands Tractor, Apcolite, Utsav,
Apex and Ace are entrenched in the marker. GNPL the number – two in the decorative
segment, with a 15 per cent market share too, has now increased its distribution
network to 10,700 outlets to compete with APIL effectively. Berger and ICI have 9
per cent and 8per cent shares respectively in this segment followed by J&N and
Shalimar with 1 and 6 per cent shares.
The share of industrial paints in the total paint consumption of the nation is
very low compared to global standards .It accounts for 30 per cent of the paint market
with 70 per cent of paints sold in India for decorative purposes. In most developed
countries, the ratio of decorative paints vis-à-vis industrial paints is around 50:50. But
with the decorative segment bottoming out, companies are increasingly focusing on
industrial paints .The future for industrial paints is bring .In the next few yeas, Its
share would go up to 50 per cent, in line with the global trend.
GNPAL dominates the industrial paints segment with 43 per cent market
share. It has a lion‟s share of 70 per cent in the OEM passenger car segment, 40 per
cent share of two wheeler OEM market and 20 per cent of commercial vehicle OEM
market .It supplies 70 per cent of the paint requirement of Maruti, India „s largest
passenger car manufacturer, besides supply to other customers like Telco, Toyota,
Hindustan Motors, Hero Honda, TVS- Suzuki, Mahindra & Mahindra, Ashok
Leyland, Ford India, Pal Peugeot and Bajaj Auto .GNPL also controls 20 per cent of
the consumer durables segment with client like whirlpool and Godrej Ge. The
company is also venturing into new area like painting of plastic, coli coating and cans.
APIL the leader in decorative paints ranks a poor second after Goodlass Nerolac in the industrial segment with a 15 per cent market share. But with its joint
venture Asian PPG Industries the company is aggressively targeting the automobile
sector .It has now emerged as a 100 per cent OEM supplier to Daewoo ,Hyundai ,
Ford and General Motors and is all set to ride on the automobile boom .Berger and
ICI are the other players in the sector with 10 per cent and 9 per cent shares
respectively .Shalimar too , has an 8 per cent share .

7/29/2019 Customer Satisfactionnh
http://slidepdf.com/reader/full/customer-satisfactionnh 13/70
Price sensitivity factors
Various factors that have influenced the pricing of paints are summarized below:
The industry is raw – material intensive. Of the 300 odd raw materials, nearly half
of them are imported petroleum products. Thus, any deficit in global oil reserves
affects the bottomline of the players.
The major raw material titanium dioxide, pathalic anhydride and peutarithrithol
constitute 50 per cent of the total cost. Besides, this there are other raw materials
such as castor, linseed and soybean oils, turpentine .The raw materials cost sums
up to a whopping 70 per cent .Any increase in the prices of these raw materials
could adversely affect paint prices.
Most of the paint major have to import neatly 30 per cent of their raw material
requirement thus change in import policies can affect the industry.

7/29/2019 Customer Satisfactionnh
http://slidepdf.com/reader/full/customer-satisfactionnh 14/70
COMPANY PROFILE
Berger Paints India Limited (BPIL) is one of India's foremost paint companies,
currently ranked as second largest on the basis of consolidated sales turnover in
Indian paint industry.
Established in 17th December, 1923, the company then known as Hadfiled's
(India) Limited; was a small paint company based in Kolkata having its only
manufacturing facility at Howrah, West Bengal to produce ready mixed stiff paints,
varnishes and distempers. Post independence, towards the end of 1947, British Paints
(Holdings) Limited, U.K acquired Hadfield's (India) Limited and thus British Paints
(India) Limited was incorporated. From a production capacity of 150 tonnes and salesturnover of around Rs. 25 lakhs in 1947, the company has come a long way to become
at one point of time; a part of the worldwide BERGER group in 1983 and thereby
acquiring its present name Berger Paints India Limited to having subsequently gone
through further ups & downs as well as ownership changes to gain its present status
wherein the majority stake is with Delhi based Dhingra brothers and business revenue
close to Rs.2000 crs.
Today Berger Paints India Limited, having solely used and developed the
name and trademark BERGER and all its variants in India, is a household name in
paint. With Head Office in Kolkata the company manufactures and markets a range of
decorative & industrial paint products under various product brands and has it
operations spread throughout the length & breath of the country; with seven
manufacturing facilities in India and more than 82 depots, several regional & area
offices, besides four facilities overseas. It has a workforce of over 2300 employees
and a countrywide distribution network of 12000 plus dealers.
Berger Paints has clearly demonstrated its commitment to Indian consumers
for over 85 years, by offering its varied range of high performing quality products
backed by highest level of customer service. Company's high ethical standards in
business dealings and its on-going efforts in community welfare make Berger Paints
India Limited a responsible corporate citizen.
7/29/2019 Customer Satisfactionnh
http://slidepdf.com/reader/full/customer-satisfactionnh 15/70
While the company's decorative and Industrial paints continue to gain an
increasing market share, Berger as an organization has managed to achieve
sustainable competitive advantage through innovations in all spear of business, desire
to excel and by creating a winning culture & abiding faith in its values & philosophy
among all its stakeholders.
With Berger Paints you can now see your imagination of colour unfurl in front
of your eyes and watch your home come alive telling a thousand tales.
Transform you home with the POWER OF IMAGINATION.
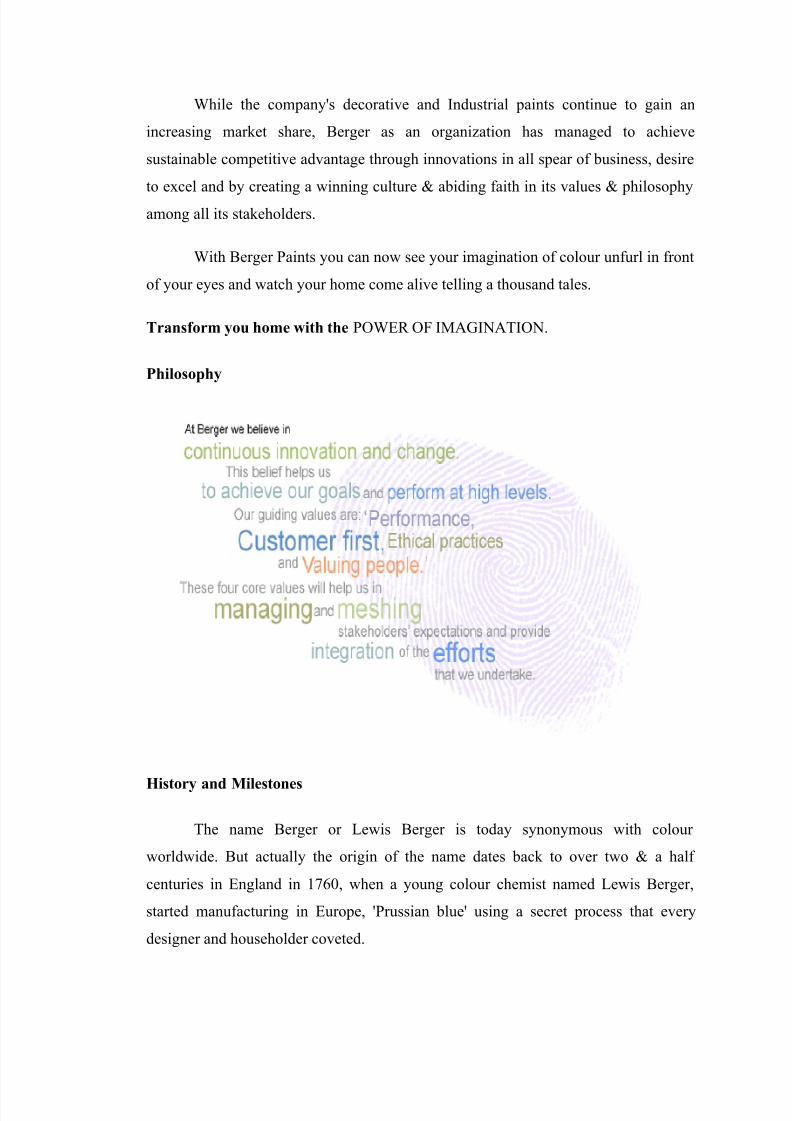
Philosophy
History and Milestones
The name Berger or Lewis Berger is today synonymous with colour
worldwide. But actually the origin of the name dates back to over two & a half
centuries in England in 1760, when a young colour chemist named Lewis Berger,
started manufacturing in Europe, 'Prussian blue' using a secret process that every
designer and householder coveted.

7/29/2019 Customer Satisfactionnh
http://slidepdf.com/reader/full/customer-satisfactionnh 16/70
Mr. Berger perfected this process & art of the blue colour, which was the
colour of most military uniform of that time. Enriched by the imagination of Lewis
Berger, the unending quest for creation and innovation in the world of colour & paints
still continues.
The history of Berger Paints India Limited as a company started in 1923 as
Hadfield's (India) Limited which was a small colonial venture producing ready-
mixed stiff paints, varnishes and distempers setup on a 2 acres of land in one of
India's first industrial towns close to Kolkata in Howrah, Bengal. Subsequently in
1947, British Paints (Holdings) Limited, an international consortium of paint
manufacturing companies bought over Hadfield's (India) Limited and thus the name
changed to British Paints (India) Ltd. The gentleman who took over, as its first
managing director was Mr. Alexender Vernon Niblet, an Englishman who was later
on followed by Mr. Alfred Godwin in 1962.
Further in the year 1965, the share capital of British Paints (Holdings) Limited
was acquired by Celanese Corporation, USA and the controlling interest of British
Paints (India) Ltd was acquired by CELEURO NV, Holland, a Celanese subsidiary.
Subsequently in 1969, the Celanese Corporation sold its Indian interests to
Berger, Jenson & Nicholson, U.K. Then onwards the company British Paints (India)
Ltd became a member of the worldwide BERGER group having its operations across
oceans in numerous geographies and this marked the beginning of Lewis Berger's
legacy in India – which the company would later take forward to enviable heights.
From 1973 the company entered into one of its dynamic phases of business with
introduction of new generation products in the industrial, marine and decorative
segments under the able leadership of it first Indian Managing Director Mr.Dongargaokar Madhukar.
Year 1976 was another turning point in the history of the company when the
foreign holding in the company was diluted to below 40% by sale of a portion of the
shares to the UB Group controlled by Mr. Vittal Mallya. The reins of the company
were taken over by Mr. Biji K Kurien as its Chief Executive & Managing Director in
the year 1980. Finally in the year 1983, the British Paints (India) Limited, changed its
name to Berger Paints India Limited.

7/29/2019 Customer Satisfactionnh
http://slidepdf.com/reader/full/customer-satisfactionnh 17/70
The entire 80s & 90s saw the lunch of many new products from company's
stable such as premium emulsions and high quality acrylic distempers. The COLOUR
BANK tinting system was launched through which the consumer could select from a
range of over 5000 shades.
Again the fortunes of the company changed hands in 1991 with UB Group's
stake in the company bought over by the Delhi based Dhingra brothers, Mr.
K.S.Dhingra & Mr. G.S.Dhingra and their associates of the UK Paints Group.
Presently Dhingras' control a majority stake of almost 73% in Berger Paints India
Limited, which is a professionally managed organization, headquartered in Kolkata,
with the stewardship resting since 1994 with the current Managing Director Mr. Subir
Bose.
James Wilfred Adamson, founder of the British Paints Organization,
embarked on his career as a traveling salesman. Adamson bought his first Oil and
Colour business in 1909. By 1917 Adamson was owning paint manufacturing
companies in Rhodesia, Canada and the Caribbean. Elsewhere an Englishman, Mr.
Hadfield, set up Hadfield's (India) Limited on 17 December, 1923, ...a small paint
company in Calcutta. Towards the end of 1947 British Paints acquired Hadfield's
(India) Limited and thus British Paints (India) Limited was incorporated in the State
of West Bengal. What British Paints, (Holding), UK acquired was a company which
at that time produced 150 tonnes of ready mixed stiff paints, varnishes and
distempers. Our 1947 sales was a princely RS.25 lakhs, with a total employee strength
of 100. The first Managing Director of British Paints was Mr. A. V. Niblett.

7/29/2019 Customer Satisfactionnh
http://slidepdf.com/reader/full/customer-satisfactionnh 18/70
BOARD OF DIRECTORS
Mr. Kuldip Singh Dhingra was born on 2nd September,
1947 and has been a director of the Company since 17th July,
1991. He was appointed as the Chairman of the Company on
17th June, 1994. Mr. Dhingra is a graduate, an industrilist, a
promoter of the Company and has a long standing experience
in the paints and related industries. Mr. Dhingra also received
an Alumni Award from the Delhi University for distinction in
the field of Industry.
Mr. Gurbachan Singh Dhingra was born on 9th April, 1950.
He has been the director of the Company since 14th May, 1993.
Mr. Dhingra is a graduate, an Industrialist, a promoter of the
Company and has considerable experience in the paint industry,
especially in its technical aspects. He holds the position of the
Vice-Chairman of the Company.
Mr. Subir Bose, the Managing Director of the Company, was
born on 10th December, 1949. He graduated in Chemical
Engineering from the Indian Institute of Technology, Kanpur
and the completed his post graduation in Business
Administration from the Indian Institute of management,
Ahmedabad. Mr. Bose joined the Company in 1984 and was
named the Managing Director of the Company in 1994.
Mr. Anil Bhalla was born on 14th September, 1946. He
graduated in Economics (Hons) from the University of Delhi
and is a Fellow Chartered Accountant. He is also the Managing
Partner of JC Bhalla and Co. His Career graph boasts of vast
experience in auditing, joint venture consultancy, strategic
business consultancy, business valuations, merger and

7/29/2019 Customer Satisfactionnh
http://slidepdf.com/reader/full/customer-satisfactionnh 19/70
acquisitions.
Mr. Gerald Kenneth Adams was born on 17th June, 1953. He
has done his MBA from the Harvard Business School andthereafter was awarded a Bachelors Degree in Arts, Magna
Cum Laude, Phi Beta Kappa by the University of Washington.
Mr. Adams was the Managing Director of Orica Consumer
Products and held senior positions in Box USA, Amcor Limited
and the Boston Consulting Group.
Mr. Gureharan Das was born on 3rd October, 1943. He has been a director of Berger Paints India Limited since July, 2001.
Mr. Das is a Harvard graduate and was CEO of Proctor &
Gamble, India and Managing Director of Proctor & Gamble,
Worldwide. He is also a reputed author, a management
consultant and advises companies on sales & marketing and
global strategies.
Mr. Kamal Ranjan Das was born on 23rd February, 1932. A
science graduate with honours, he began his career in the year
1951. Mr. Das joined Berger Paints Indian Limited in 1975
after successful stints elsewhere and then after 20 years of
service, retired in 1994 as Executive Director. Mr. Das is now a
management consultant.
Mr. Naresh Gujral was born on 19th May, 1948. He has been
a Director of the Company since February, 2003. He is a fellow
member of the Institute of Chartered Accountants of India and
is the founder of Span India Group, which is one of the leading
exporters of high-end fashion garments to Europe from India.
He is an eminent industrialist.

7/29/2019 Customer Satisfactionnh
http://slidepdf.com/reader/full/customer-satisfactionnh 20/70
Mr. Pulak Chandan Prasad was born on 27th May, 1968 and
has been Director of the Company since November, 2009. Mr.
Prasad is a B.Tech from IIT and an IIM Ahmedabad alumni. He
was the Managing Director and co-head of the India office of
Warburg Pincus and a Management Consultant with McKinsey
& Company, USA and South Africa prior to that. Currently he
holds the position of member in the Audit Committee in Bharti
Airtel Ltd. and is also a Director on the Company's Board.
Management Team
Mr. Subir Bose, Managing Director
Mr. Bose is a B.Tech (Chemical) from IIT, Kanpur & PGDM
from IIM, Ahmedabad having over 36 years of work
experience. He started his career with Asian Paints Limited &
prior to joining Berger was associated with Abukon Nigeria
Limited.
Mr. Abhijit Roy, Sr. Vice President - Sales & Marketing
Decorative / Retail Paints Division
Mr. Roy is a B.E (Mech) from Jadavpur University, Kolkata &
PGDM from IIM, Bangalore having over 19 years of work
experience. He started his career with Asian Paints Limited &
prior to joining Berger was associated with ICI (India) Limited.
7/29/2019 Customer Satisfactionnh
http://slidepdf.com/reader/full/customer-satisfactionnh 21/70
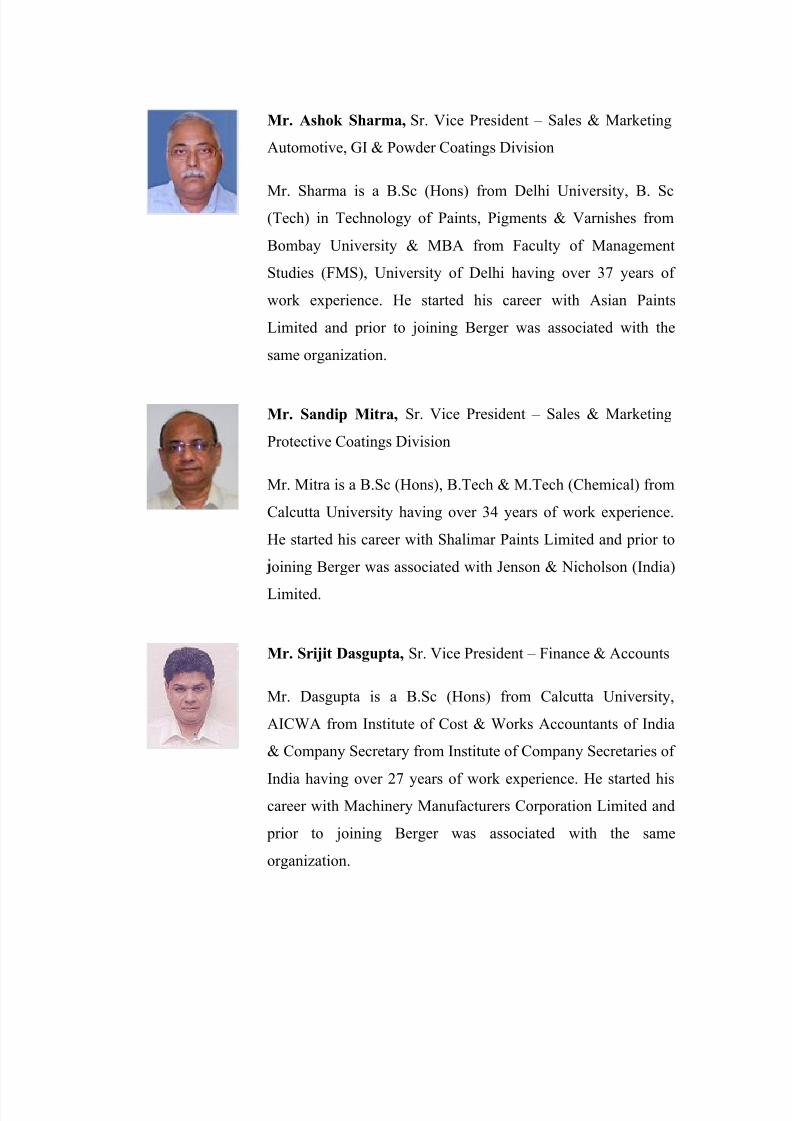
Mr. Ashok Sharma, Sr. Vice President – Sales & Marketing
Automotive, GI & Powder Coatings Division
Mr. Sharma is a B.Sc (Hons) from Delhi University, B. Sc(Tech) in Technology of Paints, Pigments & Varnishes from
Bombay University & MBA from Faculty of Management
Studies (FMS), University of Delhi having over 37 years of
work experience. He started his career with Asian Paints
Limited and prior to joining Berger was associated with the
same organization.
Mr. Sandip Mitra, Sr. Vice President – Sales & Marketing
Protective Coatings Division
Mr. Mitra is a B.Sc (Hons), B.Tech & M.Tech (Chemical) from
Calcutta University having over 34 years of work experience.
He started his career with Shalimar Paints Limited and prior to
oining Berger was associated with Jenson & Nicholson (India)
Limited.
Mr. Srijit Dasgupta, Sr. Vice President – Finance & Accounts
Mr. Dasgupta is a B.Sc (Hons) from Calcutta University,
AICWA from Institute of Cost & Works Accountants of India
& Company Secretary from Institute of Company Secretaries of
India having over 27 years of work experience. He started hiscareer with Machinery Manufacturers Corporation Limited and
prior to joining Berger was associated with the same
organization.

7/29/2019 Customer Satisfactionnh
http://slidepdf.com/reader/full/customer-satisfactionnh 22/70
Mr. Aniruddha Sen, Sr. Vice President & Company Secretary
Mr. Sen is a B.Sc (Hons) from Calcutta University, Diploma in
Management from IGNOU, Delhi, AICWA from Institute of Cost & Works Accountants of India & Company Secretary from
Institute of Company Secretaries of India having over 28 years
of work experience. He started his career with Indian
Aluminium Company Limited and prior to joining Berger he
was associated with the same organization.
Mr. Bhabesh Bera, Sr. Vice President – R & D
Mr. Bera is a B.Sc (Hons) & M.Sc (Chemistry) from Ranchi
University having over 34 years of work experience. He started
his career with C.S.I.R and prior to joining Berger he was
associated with the same organization in Regional Engineering
College, Durgapur.
Dr. Prosanta Kumar Ghosh, Vice President – Manufacturing
Dr. Ghosh is a B.Sc (Hons) from Burdwan University, M.Sc
(Physical Chemistry) & M.Tech (Material Science & Engg. –
Polymer) from IIT, Kharagpur & Ph.D (Polymer Science) from
IIT, Kharagpur having over 24 years of work experience. He
started his career with IVP Limited, and subsequently worked
for Rotomac Electricals Limited. Prior to joining Berger he wasassociated with ICI (India) Limited.
Mr. Subir Saha, Vice President - IT
Mr. Saha is a B.Stat (Hons.), M. Stat & Diploma in Computer
Science from Indian Statistical Institute (ISI), Kolkata having
over 32 years of work experience. He started his career with
National Informatics Centre and prior to joining Berger was

7/29/2019 Customer Satisfactionnh
http://slidepdf.com/reader/full/customer-satisfactionnh 23/70
associated CESC Limited.
Mr. Subhashish Das, Vice President – Corp. HR & Personnel
Mr. Das is an M.Com & LL.B from Pt. Ravi Shankar Shukla
University, Raipur; PGDPM from National Institute of
Personnel Management (NIPM), Kolkata, SIMAP from IIT,
Kharagpur and PGDHRD from AIMA & NHRD, New Delhi
having over 15 years of work experience. He started his career
with Ambuja Cements Limited and prior to joining Berger was
associated with the same organization.
Vision
To endure an environmentally safe and secure future with a commitment from
the company and all its employee to practice and implement methods that help reduce
the harmful effects on our environment.
Mission
To conserve natural resources and ensure that protection of the environment
remains our top priority.
To take up the challenge and develop more advanced products which
consistently help reduce the harmful effects on our environment and conserve natural
resources.
We not only take the responsibility for environmental protection but also make
our employees aware and committed to the cause
We respect the needs and social implications of all communities and cultures
where our business operates.

7/29/2019 Customer Satisfactionnh
http://slidepdf.com/reader/full/customer-satisfactionnh 24/70
A TOUCH OF GREEN IN OUR LIVES
We are committed to taking stringent measures to consistently reduce the
harmful effects on our environment. A few of them are as follows:
Our products are manufactuared keeping in mind stringent VOC limits along
with other environmental guidelines as per ithe industry.
Our products are compliant to all global and industrial green certifications
using renewable and sustainable raw materials in our formulations.
Installing energy efficient systems at all new plant facilities.
Launching green and envergy efficient products
Reducing waste and conserving natural resources in manufacturing facilities
SHADES OF GREEN IN ALL OUR COLORS
ECO PRO BREATHE EASY - Our first low VOC Paint
By reducing the VOC content in our paint considerably, we're offering a productsthat's not just low on emission but odourless as well. It's our flagship product that
leads the way to our Green Horizon. Mentioned below are a few of its propertise:
Low VOC
Negliglible aromatic content
Highest standard of indoor air quality
Global accreditation
Chemical components restriction
Zero health hazard
Maximum performance

7/29/2019 Customer Satisfactionnh
http://slidepdf.com/reader/full/customer-satisfactionnh 25/70
ECO SAFE
We ensure that all our other household decorative products are environment
friendly and compliant to global environmental standards as well.
No added Lead, Mercury of Chromium
Minimal aromatic content
Acceptable levels of VOC
Landmark Projects
Structures new and old sometimes become distinct landmarks. While a
modern structure gives you a glimpse of the changing cityscape, an ancient building
makes you relive a slice of history. But both could be reflecting the same colours. The
colours from Berger Paints that are used to brighten up the landmarks across India.
Here‟s a quick look at some of the projects that have been touched by Berger.
Quality Policy
We at Berger Paints are committed to provide full satisfaction to our customers with
respect to Quality, Reliability and Delivery and attain Quality Leadership for all
products that are offered by us. We shall achieve this goal by:
Establishing a Quality Management System conforming to International
Standards.
Institutionalizing a culture of "Getting it Right, First Time."
Upgrading our Technology continuously to meet expectations of customers.
Planned and structured Training and Development Programmes for all
employees.
Creating an environment which encourages team effort and where each
individual's contribution is recognised and valued.

7/29/2019 Customer Satisfactionnh
http://slidepdf.com/reader/full/customer-satisfactionnh 26/70
Products:
Interior Wall Coatings Silk
Breathe Easy
Rangoli Easy Clean
Rangoli Super Acrylic Emulsion

7/29/2019 Customer Satisfactionnh
http://slidepdf.com/reader/full/customer-satisfactionnh 27/70
Bison Acrylic Emulsion
Designer Finishes
Illusions
Illusions Imagine
Metallica
Marble
Distempers
Bison Distemper
Jadoo Acrylic Distemper

7/29/2019 Customer Satisfactionnh
http://slidepdf.com/reader/full/customer-satisfactionnh 28/70
Performance Berger Paints Corporate Social Responsibility
Conserve. Develop. Respect
Will the environment and those around us suffer as we profit? Are our
employees at Berger aware of their responsibility towards the environment? Are they
committed towards conserving natural resources?
These are just some of the questions raised at Berger before any decision is
taken. As a socially responsible corporate citizen, we at Berger ensure that the
stringent measures we take to reduce the adverse effects on the environment are taken
very seriously. At Berger growing is about creating a greener future alongside. These
measures include:
Reducing waste and conserving natural resources in manufacturing facilities
Developing green and energy efficient products
Installing energy efficient systems at all new plant facilities
Using renewable and sustainable raw materials in our formulations
Manufacturing products with the stringent VOC limits in mind along with
other environmental guidelines as per the industry
Ensuring every product is compliant to all global and industrial green
certifications

7/29/2019 Customer Satisfactionnh
http://slidepdf.com/reader/full/customer-satisfactionnh 29/70
All because we at Berger respect the needs and aspirations of all communities
when our business operates.
The Berger Commitment
As a part of the commitment towards the stakeholders and the society at large,
Berger Paints is committed to discharge its responsibility for the cause of the society
through a variety of philanthropic and benevolent activities benefiting the society. The
company has donated medical equipments and has installed shallow pumps in villages
and water coolers at various locations in the vicinity of its factories. Initiatives have
been undertaken for a cleaner environment through involvement of agencies towards
conservation of greenery, spreading the awareness of a greener planet amongst the
people, recycling of waste paper and others. Donations have been given to the
charitable institutions and social welfare organizations working for the cause of the
upliftment of the poor and downtrodden.
Recruitment Philosophy & Process
What we look for
Berger has many things in common. Quest for excellence and unadulterated
passion for work are some of them. What we look for in an ideal candidate are:
Leadership
Leadership is an attribute that doesn't come with a designation or experience.
At Berger, all of us, irrespective of age or profile are leaders in own right. We are
faced with challenges every single day where we stumble but learn from each other.
We own up, take responsibility and get it done. And therefore, everyday is an
opportunity to make it what we want it to be.
Commitment
At Berger, apart from the body, mind and heart, people even get their soul to
work. And by choice. Work here is not a nine to five chore. It is what defines us and
we love what we do. This is important to belong and have fun and if this is your
philosophy of work culture, we would be glad to have you.
7/29/2019 Customer Satisfactionnh
http://slidepdf.com/reader/full/customer-satisfactionnh 30/70
Solution provider
We understand that there is an efficient way out of every problem and that it
can be solved with strategy, action or advice. We, as an organization and as
employees, focus on the solution rather than the problem. And if this is your mindset,
then you belong here.
Energy
If there is one defining characteristic of all people working at Berger Paints
around the world, it is the energy. The vigor is infectious and is visible in our work, in
our interactions and in us. We live passionately. We work passionately. We solve
problems passionately. We are passionate. And if this defines you, Berger is meant for
you.
Integrity
Berger fosters a sense of responsibility in all its people who do what they do
with utmost honesty. You are not bundled under layers of management which ensures
that there is absolute transparency in the system. Integrity being high on your list of
priorities shows your application in a positive light.
Recruitment Philosophy
It is the policy of Berger to recruit appropriate candidate matching the
company‟s HR requirements in terms of necessary qualifications, experience,
attitudes and values. Our Company shall remain competitive and maintain a lean and
flat organization by recruiting in a planned way.
The Recruitment & Selection procedure takes place in two ways:
1. Recruitment and Selection excluding Campus Selection.
2. Campus Selection for MT‟s
All the employees joining the organization will undergo a thorough induction
process to familiarize themselves with the activities of the company. The detailed
planning will be done by HR Department for the new recruits.

7/29/2019 Customer Satisfactionnh
http://slidepdf.com/reader/full/customer-satisfactionnh 31/70
Recruitment & Selection excluding Campus Selection is based on
advertisements, placement consultant, employee referral and job sites. Interested
candidates meeting Berger‟s requirements can apply online. Applications are then
scrutinized and checked for eligibility. The candidates meeting the criteria set by
Berger are then called for a written test. Based on their performance in the written
test, they are further called for Psychometric and Personal interview.
For Campus Selection for MT’’s, Berger recruits the management students
of Sales & Marketing stream for the job of Management Trainee- Retail Sales. We
look forward to students with consistent academic background, good communication
& analytical skills, having desire to kick start their career in Channel Sales of
Consumer Durable sector. Contrary to the conventional Campus Recruitment process
of Pre- Placement Talk, Written Assessment Tests and Personal Interviews in campus,
our selection process comprises a Virtual Campus Recruitment Program using our
company‟s website and satellite link communication system of Video Conferencing.
Interested students shall have to appear for Online Test. Candidates scoring a fixed
cutoff mark then need to appear for the Personal Interview through Video
Conferencing.
Training and Development
At Berger we value our people and understand their needs for personal growth
and career. Providing people with appropriate environment and resources for growth,
learning and confidence is our priority. A career at Berger offers a chance to touch
someone's life. There are extensive training and development programmes to enhance
and update the skills and knowledge of its human resources. Our commitment to
training and development is a core value. We believe in polishing the skills and
knowledge of an individual. Thus we have designed various development
programmes to train our people.
Employee Training & Development Programme
Job Related Programs
Career Related Programs

7/29/2019 Customer Satisfactionnh
http://slidepdf.com/reader/full/customer-satisfactionnh 32/70
Employee Training & Development Programme
It is the Company‟s policy to provide appropriate learning opportunities to
assist employees in gaining job- related skills and knowledge that will contribute to
improved performance and career development. Thus there are two programme
designed for the employees of Berger Paints:
Job Related Programs
This Program is directly related to work assignments of the employee‟s
current position/ Job. An employee‟s immediate superior takes the lead by identifying
developmental objectives along with corresponding action plans. This is, generally,
done in conjunction with the performance / progress review process.
Career Related Programs
This Programme is related to development of skills, knowledge, and other
qualifications that prepare an employee for higher positions within the Company. In
this case the employee takes the lead by self-assessing skills, values, career, interests
and choices in consultation with his/her immediate superior.
SWOT ANALYSIS:-
Strengths
Imp of brand image as barriers to new entrants
Good technology backup.
Weaknesses
Raw materials ± scarcity
Requirement of high working capital
Real estate in a depression phase

7/29/2019 Customer Satisfactionnh
http://slidepdf.com/reader/full/customer-satisfactionnh 33/70
Opportunities
Fiscal incentives provided by Government.
Commodity to fmcg
Rise in disposable income
Threats
Foreign companies entering as sole players

7/29/2019 Customer Satisfactionnh
http://slidepdf.com/reader/full/customer-satisfactionnh 34/70
CUSTOMER SATISFACTION
Definition of Customer Satisfaction
Kotler (1997) defines customer satisfaction as “a person's feelings of pleasure
or disappointment resulting from comparing a Product‟s perceived performance (or
outcome) in relation to his or her expectations.”
Brown (1992) defines “the state in which customer needs, wants and
expectations throughout the product or service's life are met or exceeded resulting in
repeat purchase, loyalty and favorable worth-of mouth.”
According to Jones and Sasser (1995), four basic elements affect customer
satisfaction. They are the basic elements of the product or service, basic support
services, a recovery process for counteracting bad experiences, and extraordinary
service. There are many definitions of the key elements of the services, but this one is
considered appropriate in the context of care or after sales services.
Satisfaction is a function of perceived performance and expectation. If the
performance matches the expectations the customer is satisfied. If the performance
exceeds the expectation the customer is highly satisfied and delighted. If the
performance does not match the expectations the customer is dissatisfied. Satisfaction
is a person‟s feelings of pleasure of disappointment resulting for compar ing a
products perceived performance (out-come) in relation t his/her expectation. The link
between customer satisfaction and customer loyalty is proportional. Suppose customer
satisfaction is rated on a scale from 1 – 5. At a very low levels of customer
satisfaction.
Level-1, customers are likely to abandon.
Level-2 to 4, customers are fairly satisfied but still find tit easy to switch when a
better offer comes along.
Level-5, the customer is very likely to repurchase an even spread good word of mouth
about the company.

7/29/2019 Customer Satisfactionnh
http://slidepdf.com/reader/full/customer-satisfactionnh 35/70
The key to generating high customer loyalty is to deliver high customer value.
A company‟s value proposition is much more than it‟s positioning on a single
attribute. Most of the successful companies are raising expectations and delivering
performances to match. These companies are aiming for TCS – Total Customer
Satisfaction. Customer satisfaction is both a goal and a marketing tool. Companies
that achieve high customer satisfaction ratings make sure that their target market is
known.
After sales support management system is apart of ERP Enterprise Resource
Planning solution dealing with the support module after the sales of product. It creates
an advanced environment to the organization, which are in to technical support after
sales e.g. Companies offering electronic goods and motor vehicles etc.
Measuring customer satisfaction
Organizations need to retain existing customers while targeting non-
customers;. Measuring customer satisfaction provides an indication of how successful
the organization is at providing products and/or services to the marketplace.
Customer satisfaction is an abstract concept and the actual manifestation of the
state of satisfaction will vary from person to person and product/service to
product/service.

7/29/2019 Customer Satisfactionnh
http://slidepdf.com/reader/full/customer-satisfactionnh 36/70
The state of satisfaction depends on a number of both psychological and
physical variables which correlate with satisfaction behaviors such as return and
recommend rate. The level of satisfaction can also vary depending on other factors the
customer, such as other products against which the customer can compare the
organization's products.
Work done by Parasuraman, Zeithaml and Berry (Leonard L) between 1985
and 1988 delivered SERVQUAL which provides the basis for the measurement of
customer satisfaction with a service by using the gap between the customer's
expectation of performance and their perceived experience of performance. This
provides the researcher with a satisfaction "gap" which is semi-quantitative in nature.
Cronin and Taylor extended the disconfirmation theory by combining the
"gap" described by Parasuraman, Zeithaml and Berry as two different measures
(perception and expectation) into a single measurement of performance relative to
expectation.The usual measures of customer satisfaction involve a survey with a set of
statements using a Likert Technique or scale. The customer is asked to evaluate each
statement in terms of their perception and expectation of performance of the service
being measured.
Methodologies
American Customer Satisfaction Index (ACSI) is a scientific standard of
customer satisfaction. Academic research has shown that the national ACSI score is a
strong predictor of Gross Domestic Product (GDP) growth, and an even stronger
predictor of Personal Consumption Expenditure (PCE) growth. On the
microeconomic level, research has shown that ACSI data predicts stock market
performance, both for market indices and for individually traded companies.
Increasing ACSI scores has been shown to predict loyalty, word-of-mouth
recommendations, and purchase behavior. The ACSI measures customer satisfaction
annually for more than 200 companies in 43 industries and 10 economic sectors. In
addition to quarterly reports, the ACSI methodology can be applied to private sector
companies and government agencies in order to improve loyalty and purchase intent.

7/29/2019 Customer Satisfactionnh
http://slidepdf.com/reader/full/customer-satisfactionnh 37/70
Two companies have been licensed to apply the methodology of the ACSI for
both the private and public sector: CFI Group, Inc.applies the methodology of the
ACSI offline, and Foresee Results applies the ACSI to websites and other online
initiatives. ASCI scores have also been calculated by independent researchers, for
example, for the mobile phones sector.
The Kano model is a theory of product development and customer satisfaction
developed in the 1980s by Professor Noriaki Kano that classifies customer
preferences into five categories: Attractive, One-Dimensional, Must-Be, Indifferent,
Reverse. The Kano model offers some insight into the product attributes which are
perceived to be important to customers. Kano also produced a methodology for
mapping consumer responses to questionnaires onto his model.
SERVQUAL or RATER is a service-quality framework that has been
incorporated into customer-satisfaction surveys (e.g., the revised Norwegian
Customer Satisfaction Barometer) to indicate the gap between customer expectations
and experience.
J.D. Power and Associates provides another measure of customer satisfaction,
known for its top-box approach and automotive industry rankings. J.D. Power and
Associates' marketing research consists primarily of consumer surveys and is publicly
known for the value of its product awards.
Other research and consulting firms have customer satisfaction solutions as
well. These include A.T. Kearney's Customer Satisfaction Audit process, which
incorporates the Stages of Excellence framework and which helps define a company‟s
status against eight critically identified dimensions.
For Business to Business (B2B) surveys there is the InfoQuest box. This has
been used internationally since 1989 on more than 110,000 surveys (Nov '09) with an
average response rate of 72.74%. The box is targeted at "the most important"
customers and avoids the need for a blanket survey.

7/29/2019 Customer Satisfactionnh
http://slidepdf.com/reader/full/customer-satisfactionnh 38/70
Improving Customer Satisfaction
Published standards exist to help organizations develop their current levels of
customer satisfaction. The International Customer Service Institute (TICSI) has
released The International Customer Service Standard (TICSS). TICSS enables
organizations to focus their attention on delivering excellence in the management of
customer service, whilst at the same time providing recognition of success through a3rd Party registration scheme. TICSS focuses an organization‟s attention on
delivering increased customer satisfaction by helping the organization through a
Service Quality Model.
TICSS Service Quality Model uses the 5 P's - Policy, Processes, People,
Premises, Product/Services, as well as performance measurement. The
implementation of a customer service standard should lead to higher levels of
customer satisfaction, which in turn influences customer retention and customer
loyalty.
The functional features include:
1. Customer complaints tracking
2. Service engineers information tracking
3. Job scheduling for the complaints

7/29/2019 Customer Satisfactionnh
http://slidepdf.com/reader/full/customer-satisfactionnh 39/70
4. Spares management
5. Online support
6.
Reports
Customer complaints tracking
Complaint is the start point of any technical support system. With out a client request
the technical support is not initiated. Complaint tracking is done as follows:
1. Client may come down or make a phone call or complaint online
2. The client is validated. The client may have an annual maintenance
contract or may have a product in warranty or of warranty.
3. The intensity of the complaint is to be estimated to allocate resources.
4. Expected service type has to be finalized. It may be online assistance
indoor or onsite assistance.
Service Engineers information tracking:
Information about the engineers is inevitable in job scheduling. Information
about the engineers has to be added, deleted or modified in the database. It may
contain the following: the name, id of the engineer; the skill set of the manager; the
status of the engineer.
Job scheduling for the complaints:
Job scheduling means sequencing the request to its intensity, assignment of a
service engineer and creating a job card. It is done to optimize the technical resources
and to render the best service to the customer. Minor problem are processed by
technicians requests are handled by the expert team.

7/29/2019 Customer Satisfactionnh
http://slidepdf.com/reader/full/customer-satisfactionnh 40/70
The job card includes the following:
The compliant id, the assigned engineer id, the data and time of service, the
spare details, no. of man hours required etc.
1. The spare part name and serial number
2. The available quantity of each spare part
3. The prize, warranty and other specifications
4. The supplier information.
Online support:
The service is done online also. The client may visit the website to obtain
basic support information about the product and FAQ. He can chat with the service
engineer on phone or online.
Report:
The report reflects the current status of the system. The reports that can be
generated are as follows:
1. Customer request report status of the system. The reports that can be requests.
2. Service engineer report provides the information about the skills and strengths
of the support team.
3. Job scheduling report states the allotment of engineers to jobs.
4. Spares report discloses the availability of all the shapes in the system.
5. Receipts and payments report gives information about the cash flow in the
system.
6. Bills generation.

7/29/2019 Customer Satisfactionnh
http://slidepdf.com/reader/full/customer-satisfactionnh 41/70
Customer satisfaction tracking:
Customer satisfaction is the key concept to dictate the future of the
organization. In order to maximize the customer satisfaction along with quick
response and efficient service some other activities are to be performed.
They may be as follows:
1. Reception of the customer with hospitality.
2. Entertaining environment to the customer.
3. Providing guidance about the usage and maintenance of the product.
4. Offering gift and discounts.

7/29/2019 Customer Satisfactionnh
http://slidepdf.com/reader/full/customer-satisfactionnh 42/70
Operationalization of Customer Satisfaction
As customer needs and expectations are changing all the time, this will lead to
a situation whereby customers keep setting ever higher standards, and therefore to
achieve perfection is impossible. Markets should be seen as a group of individual
companies, and each of them must be treated individually with different requirements,
experiences, commitments, and relationships. Implementing customer satisfaction
philosophy means identifying customers, then identifying their needs and expectations
and finally, measuring their perceptions. Knowing the needs of the customer makes it
easier to anticipate the ideal set of products and services. A major flaw for all the
companies has proved to be their inability to understand other ways that customers
can be satisfied. By implementing direct and continuous employee contacts with the
customers, the customers' requirements and expectations can be determined. This
employee-customer connection additionally conveys the message that the company
cares about their customers.
Customer needs can be determined through marketing research, customer
interviews, reading customer concerns, or involving customers in the design of
services and service deliveries. In order to decide if the service can be provided at a
profit, it is necessary to link value equation to the strategic service vision. Working
together with both supplier and customer can increase profitability by expanding
margin potential.
A customer satisfaction study should begin by asking about the factors
affecting customer satisfaction, how important those factors are for the whole, and the
level of customer satisfaction. A problem with customer satisfaction surveys
(Naumann, 1994) is that a poor customer satisfaction programme yields vague dataand raises customer expectations. If customer expectations are raised and a company's
performance remains the same, the customer's overall satisfaction will decrease.

7/29/2019 Customer Satisfactionnh
http://slidepdf.com/reader/full/customer-satisfactionnh 43/70
Business Definition for: After-sales Service
In some cases, after-sales service can be almost as important as the initial
purchase. The manufacturer, retailer, or service provider determines what is included
in any warranty (or guarantee) package. This will include the duration of the warranty
traditionally one year from the date of purchase, but increasingly two or more year‟s
maintenance and/or replacement policy, items included/excluded, labor costs, and
speed of response. In the case of a service provider, after-sales service might include
additional training or helpdesk availability. Of equal importance is the customer's
perception of the degree of willingness with which a supplier deals with a question or
complaint, speed of response, and action taken.
After Sales Excellence
After Sales Excellence is a key driver for customer satisfaction and loyalty but
also a very important source of revenues and profits throughout a vehicle lifecycle.
Our after sales experts support our clients in all relevant areas of after sales service to
improve the internal cost base, the retail attractiveness as well as customer
satisfaction. Our results are measurable - significant improvements on key indicators
such as warranty costs, service quality, and fixed first visit rate.
Supply Chain Excellence
Our Supply Chain Excellence service enables you to realize substantial
improvements in your supply chain performance in terms of cost, efficiency, lead
times, demand management, customer service and working capital requirements. We
measure, improve and qualify supply chain organizations and processes and support
our clients by identifying and rapidly implementing cost and efficiency savings in the
entire supply chain. This can be achieved with the comprehensive, cross-functional
redesign of all logistics processes leveraging the entire supply chain including
customers and suppliers. With our proven Integrated Supply Chain Excellence Audit
we quickly identify gaps to proven best practices and benchmarks within, and beyond,
the Automotive Industry.

7/29/2019 Customer Satisfactionnh
http://slidepdf.com/reader/full/customer-satisfactionnh 44/70
Value Chain Design
Constantly reviewing the companies‟ value chain in a rapidly evolving
environment; deriving required core competencies and partnerships is a key
management responsibility. We help our clients design their value chain in terms of a
global engineering footprint, production and service network, thereby improving
efficiency and customer satisfaction in alignment with corporate strategy.
Customer Contacts and Relationships
In all cases, the supplier had been involved with the customer since the
beginning of the network building. It is difficult to distinguish whether some of the
changes in customer-supplier relationship were due to the duration of the relationship
between the two parties and whether some of the changes were caused by changes in
the customer's needs resulting from the customer's new position in the network life
cycle curve. For the results of this research, that question in terms of the underlying
factors has not addressed, but for future studies, it would be relevant to clarify which
of these two factors is the more significant or in fact, whether they can be
distinguished.
Relation of the Care to Customer Satisfaction
Innis and La Londe (1994) discovered that several customer satisfaction
variables significantly affect a customer's total customer satisfaction. Customer
service attributes received high ratings for the importance of customer satisfaction.
Attributes for physical distribution of customer service were rated higher than many
marketing attributes.
Most Important Services
Barsky (1995) proposed that what is important for one customer may not be
important for another. Barsky proposes this in the area of priority marketing, and the
idea was applied to different services in general. When a buyer considers closer
integration with a supplier, they may consider that it will most likely limit the number
of potential suppliers and fear that the partner may take advantage of this by
increasing prices or delivering poorer quality or poorer service.

7/29/2019 Customer Satisfactionnh
http://slidepdf.com/reader/full/customer-satisfactionnh 45/70
Interlocking with the supplier can limit the opportunity to acquire innovations
if the supplier lacks the capability of being a leading-edge supplier. Research has
shown that there are frequently differences between the views of the supplier's
management on customer value and the customers' views on what they say they value.
This was studied in the present study as well.

7/29/2019 Customer Satisfactionnh
http://slidepdf.com/reader/full/customer-satisfactionnh 46/70
Q. No.3. Is the price of the Vehicle is?
Table No-3
Figure no.3
Interpretation:
From the above graph it is observed that 85% of the people feel that the price
of vehicle is affordable, and 15% of people feel that the price of vehicle is not
affordable.
85%
15%
0%
10%
20%
30%
40%
50%
60%
70%
80%
90%
Affordable Not Affordable
P e r c e n
t a g e o
f r e s p o n d e n t s
Price
Percentage of respondents
S.No PriceNo. of
Respondents
Percentage of
respondents
1 Affordable 85 85%
2 Not Affordable 15 15%
Total 100 100%

7/29/2019 Customer Satisfactionnh
http://slidepdf.com/reader/full/customer-satisfactionnh 47/70
Q. No.4.What is the purpose of buying this BIKE?
Table No-4
Figure no.4
Interpretation:
From the above graph it is observed that 87% of the customers use their
vehicle for personal use, 13 % of the buyers use for other use.
87%
13%
0%
10%
20%30%
40%
50%
60%
70%
80%
90%
100%
Personal use Other use
P e r c e n
t a g e o
f r e s p o n d e n t s
Pupose of buying
Percentage of respondents
S.No Purpose of buyingNo. of
Respondents
Percentage of
respondents
1 Personal use 87 87%
2 Other use 13 13%
Total 100 100%

7/29/2019 Customer Satisfactionnh
http://slidepdf.com/reader/full/customer-satisfactionnh 48/70
Q. No.5. Who influenced in buying this BIKE?
Table No-5
Figure no.5
Interpretation:
From the above graph it is observed that 48% is influenced by themselves,
32% feel that the family place a vital role to purchase their vehicle, and then comes to
friends 12% and then advertisement 8%.
48%
32%
12%8%
0%
20%
40%
60%
Your self Family Friends Advertisement P e r c e n t a g e o
f r e
s p o n d e n t s
Influenced by
Percentage of respondents
S.No Influenced byNo. of
Respondents
Percentage of
respondents
1 Your self 48 48%
2 Family 32 32%
3 Friends 12 12%
4Advertisement 8 8%
Total 100 100%

7/29/2019 Customer Satisfactionnh
http://slidepdf.com/reader/full/customer-satisfactionnh 49/70
Q. No.6. What does this BIKE convey?
Table no.6
Figure no.6
Interpretation:
From the above graph it is concluded that 24% of the consumers purchase the
vehicle to maintain the status, where as 54% of the consumers purchase the vehicle
because of their necessity. 18% of the consumer‟s purchases as it give comfort, 4% of
the consumer purchase the vehicle for other reason.
24%
54%
18%
4%
0%
10%
20%
30%
40%
50%
60%
Status Necessity Comfort Other P e r c e n t a g e o
f r e s p o n
d e n t s
Bike conveys
Percentage of respondents
S. No bike ConveysNo. of
Respondents
Percentage of
respondents
1 Status 24 24%
2 Necessity 54 54%
3 Comfort 18 18%
4 Other 04 04%
Total 100 100%

7/29/2019 Customer Satisfactionnh
http://slidepdf.com/reader/full/customer-satisfactionnh 50/70
Q. No.7. What are the reasons for buying this BIKE?
Table no.7
Figure no.7
Interpretation:
From the above graph it is concluded from the study that 34% of them say that
price is crucial, 53% of them say mileage and 7% & 6% of them say service and
brand image.
34%
53%
7% 6%
0%
20%
40%
60%
Price Mileage Service Brand Image p e r c e n t a g e o
f r
e s p o n d e n t s
Crucial
Percentage of respondents
S.No CrucialNo. of
Respondents
Percentage of
respondents
1 Price 34 34%
2 Mileage 53 53%
3 Service 7 7%
4 Brand Image 6 6%
Total 100 100%

7/29/2019 Customer Satisfactionnh
http://slidepdf.com/reader/full/customer-satisfactionnh 51/70
Q. No.8. You use your BIKE mostly for?
Table no.8
Figure no.8
Interpretation:
From the above graph it was observed that 44% of the respondents use their
vehicle for going to office, 45% of the respondents use their vehicle to take their
family out and 2% and 9% of the respondents use their vehicle of shopping and long
drives.
44% 45%
9%
2%
0%
5%
10%
15%
20%
25%
30%
35%40%
45%
50%
Office Family Long Drives Shopping
P e r c e n t a g e o
f r e s p o n d
e n t s
Bike used for
Percentage of respondents
S.No Bike used forNo. of
Respondents
Percentage of
respondents
1 Office 44 44%
2 Family 45 45%
3 Long Drives 9 9%
4 Shopping 2 2%
Total 100 100%
7/29/2019 Customer Satisfactionnh
http://slidepdf.com/reader/full/customer-satisfactionnh 52/70
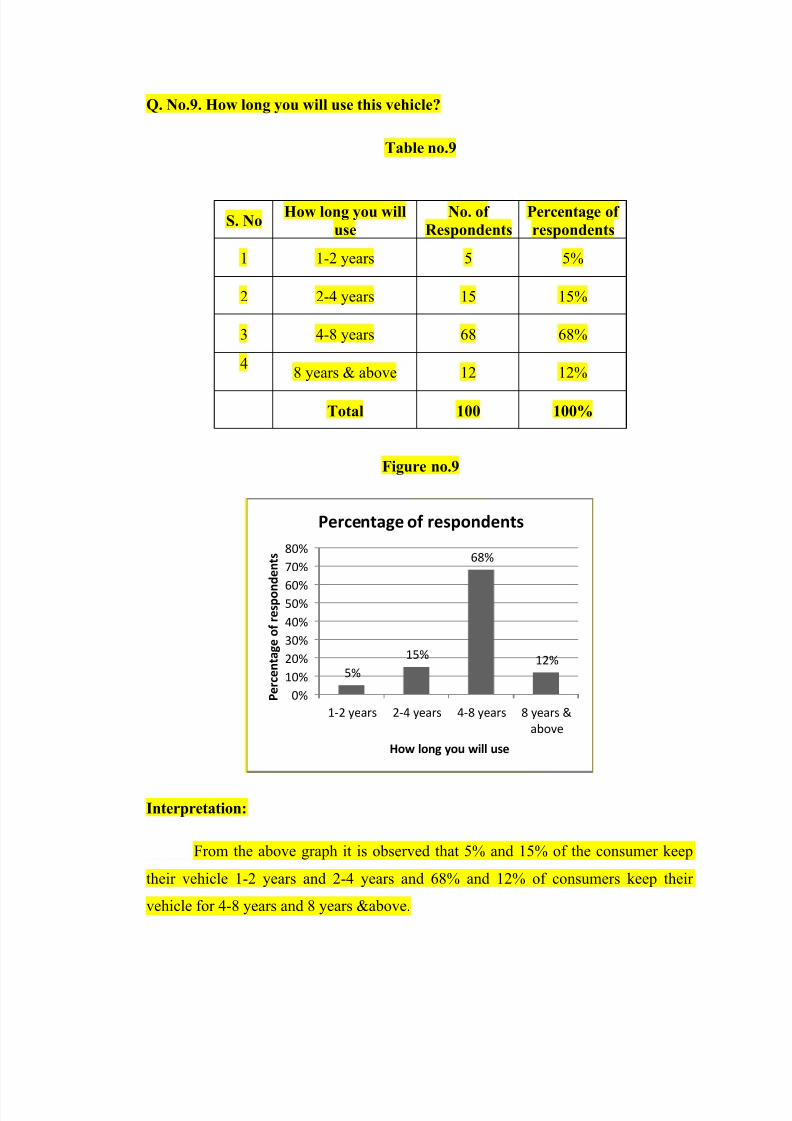
Q. No.9. How long you will use this vehicle?
Table no.9
Figure no.9
Interpretation:
From the above graph it is observed that 5% and 15% of the consumer keep
their vehicle 1-2 years and 2-4 years and 68% and 12% of consumers keep their
vehicle for 4-8 years and 8 years &above.
5%
15%
68%
12%
0%
10%
20%
30%
40%
50%60%
70%
80%
1-2 years 2-4 years 4-8 years 8 years &
above
P e r c e n t a g e o
f r e s p o n
d e n t s
How long you will use
Percentage of respondents
S. NoHow long you will
use
No. of
Respondents
Percentage of
respondents
1 1-2 years 5 5%
2 2-4 years 15 15%
3 4-8 years 68 68%
48 years & above 12 12%
Total 100 100%

7/29/2019 Customer Satisfactionnh
http://slidepdf.com/reader/full/customer-satisfactionnh 53/70
Q. No.10. Rate your satisfaction for the service provided by the Organization?
Table no. 10
Figure no.10
Interpretation:
From the above graph it is concluded that satisfied level at service center show
at X-axis and No. of Respondents at Y-axis. 7 % of the consumers said excellent, 61%
said good and 24% and 8% of the consumers said ok and poor.
7%
61%
24%
8%
0%
10%
20%
30%
40%
50%
60%
70%
Excellent Good OK Poor P e r c e n t a g e o
f r e s p o n
d e n t s
Satisfaction level at service station
Percentage of respondents
S.NoSatisfaction
level at serviceNo. of
Respondents
Percentage of
respondents
1 Excellent 7 7%
2 Good 61 61%
3 OK 24 24%
4Poor 8 8%
Total 100 100%
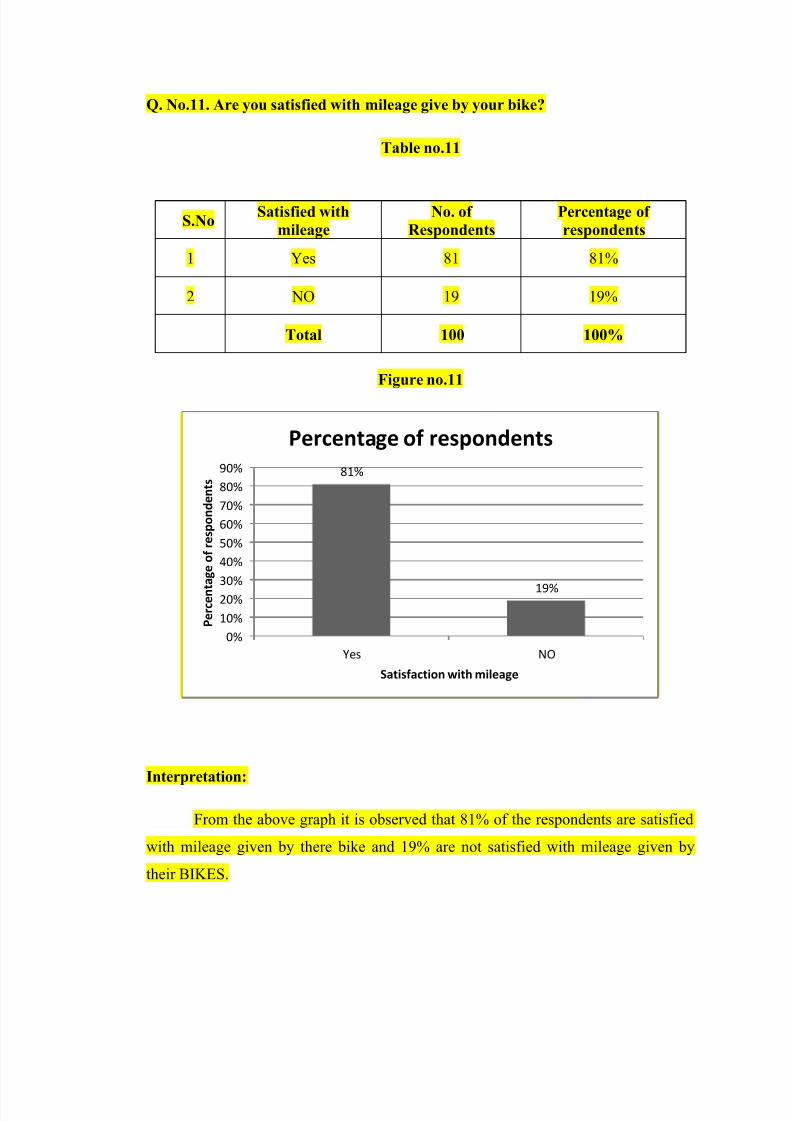
7/29/2019 Customer Satisfactionnh
http://slidepdf.com/reader/full/customer-satisfactionnh 54/70
Q. No.11. Are you satisfied with mileage give by your bike?
Table no.11
Figure no.11
Interpretation:
From the above graph it is observed that 81% of the respondents are satisfied
with mileage given by there bike and 19% are not satisfied with mileage given by
their BIKES.
81%
19%
0%
10%
20%
30%
40%
50%
60%
70%
80%
90%
Yes NO
P e r c e n t a g e o
f r e s p o n d e n t s
Satisfaction with mileage
Percentage of respondents
S.NoSatisfied with
mileage
No. of
Respondents
Percentage of
respondents
1 Yes 81 81%
2 NO 19 19%
Total 100 100%
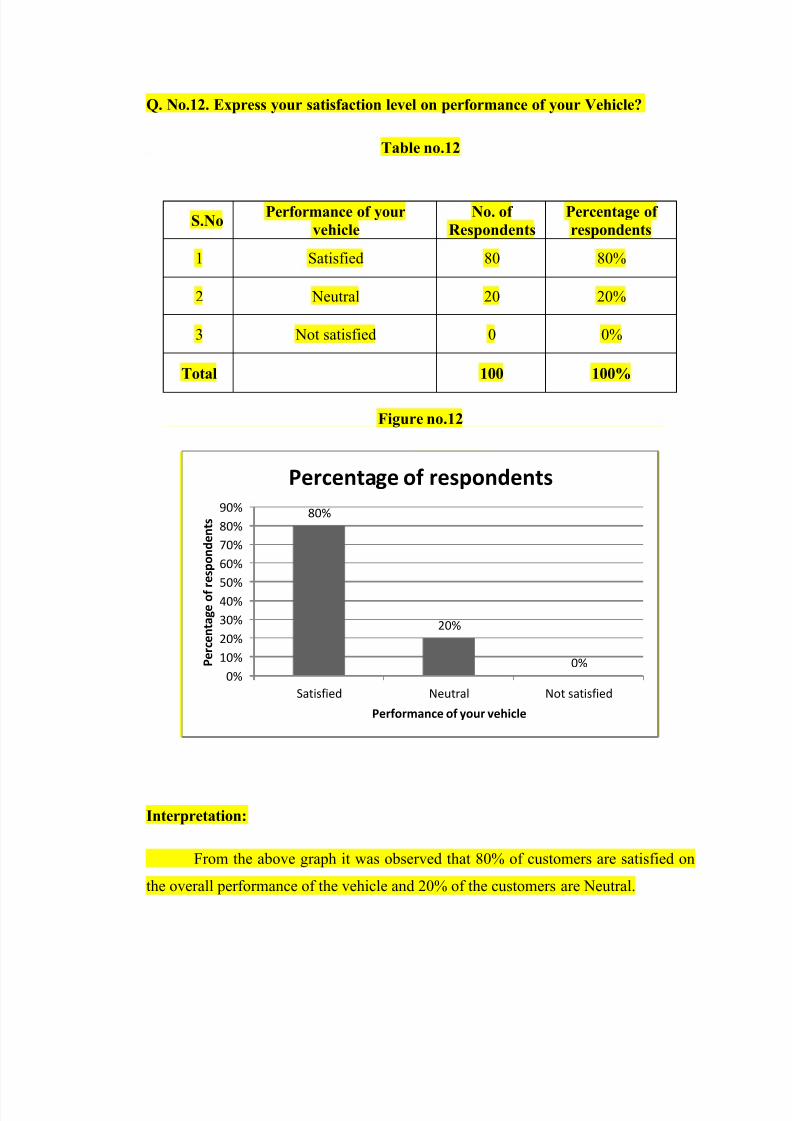
7/29/2019 Customer Satisfactionnh
http://slidepdf.com/reader/full/customer-satisfactionnh 55/70
Q. No.12. Express your satisfaction level on performance of your Vehicle?
Table no.12
Figure no.12
Interpretation:
From the above graph it was observed that 80% of customers are satisfied on
the overall performance of the vehicle and 20% of the customers are Neutral.
80%
20%
0%0%
10%
20%
30%
40%
50%
60%
70%
80%
90%
Satisfied Neutral Not satisfied
P e r c e n t a g e o
f
r e s p o n d e n t s
Performance of your vehicle
Percentage of respondents
S.NoPerformance of your
vehicle
No. of
Respondents
Percentage of
respondents
1 Satisfied 80 80%
2 Neutral 20 20%
3 Not satisfied 0 0%
Total 100 100%

7/29/2019 Customer Satisfactionnh
http://slidepdf.com/reader/full/customer-satisfactionnh 56/70
Q. No.13. Comment on the prices charged at service station?
Table no.13
Figure no.13
Interpretation:
From the above graph it was observed that 8% of the respondents feel that the
prices charged at service station was high and 36% feel it is medium and 54% of the
respondents feel that the prices are reasonable cost and 2% feel that the prices are low.
8%
36%
54%
2%
0%
10%
20%
30%
40%
50%
60%
High Medium Reasonable Low
P e r c e n t a g e o
f r e s p o n d e
n t s
Comment on prices
Percentage of respondents
Percentage of
respondents
S.No Comment on pricesNo. of
Respondents
Percentage of
respondents
1 High 8 8%
2 Medium 36 36%
3 Reasonable 54 54%
4 Low 2 2%
Total 100 100%
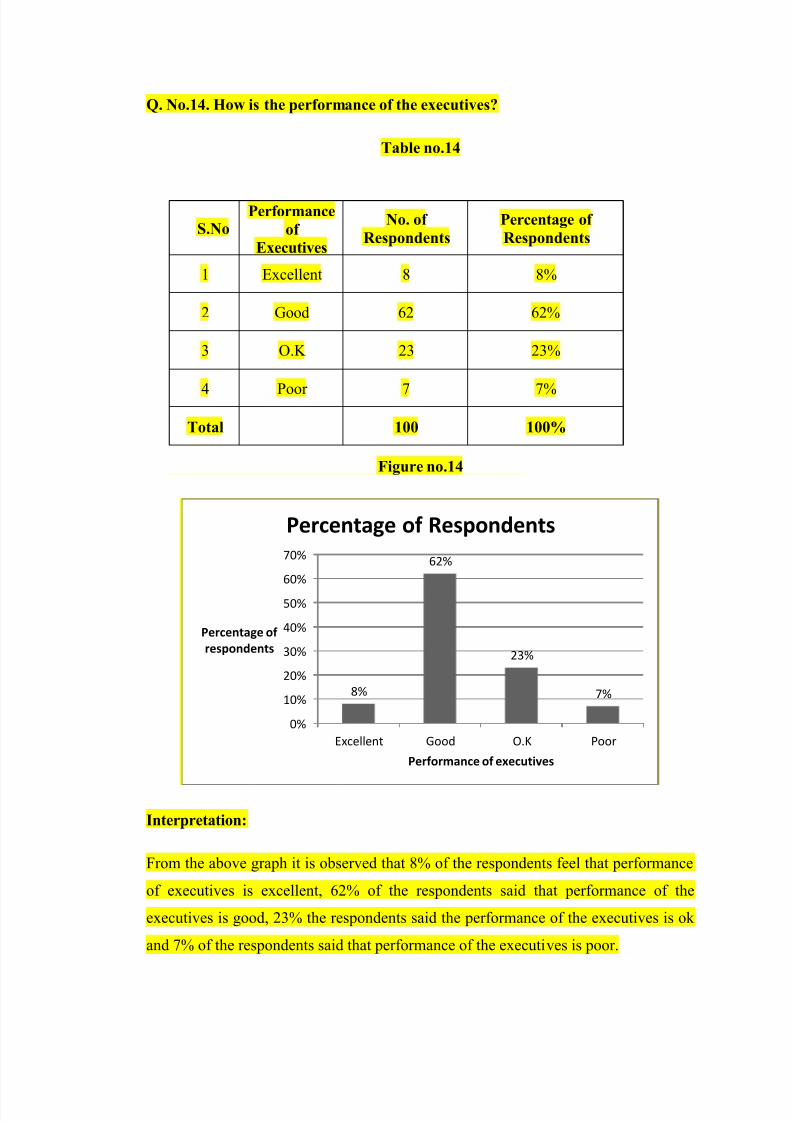
7/29/2019 Customer Satisfactionnh
http://slidepdf.com/reader/full/customer-satisfactionnh 57/70
Q. No.14. How is the performance of the executives?
Table no.14
Figure no.14
Interpretation:
From the above graph it is observed that 8% of the respondents feel that performance
of executives is excellent, 62% of the respondents said that performance of the
executives is good, 23% the respondents said the performance of the executives is ok
and 7% of the respondents said that performance of the executives is poor.
8%
62%
23%
7%
0%
10%
20%
30%
40%
50%
60%
70%
Excellent Good O.K Poor
Percentage of
respondents
Performance of executives
Percentage of Respondents
S.NoPerformance
of
Executives
No. of
Respondents
Percentage of
Respondents
1 Excellent 8 8%
2 Good 62 62%
3 O.K 23 23%
4 Poor 7 7%
Total 100 100%

7/29/2019 Customer Satisfactionnh
http://slidepdf.com/reader/full/customer-satisfactionnh 58/70
Q. No.15. Would you like to change your bike?
Table no.15
S.NO
CHANGING BIKE NO. OFRESPONDENTS
PERCENTAGE OFRESPONDENTS
1 Yes 98 98%
2 No 2 2%
100 100%
Figure no.15
Interpretation:
From the above graph it is conclude that 2% of the customers wanted to
change their bike and 98% of the customers said not regarding the idea to change their
choice from Hero to other‟s competitors .
98%
2%
0%
20%
40%
60%
80%
100%
120%
Yes No
P e r c e n t a g e o
f r e s p o n d e n t s
changing bike
PERCENTAGE OF RESPONDENTS

7/29/2019 Customer Satisfactionnh
http://slidepdf.com/reader/full/customer-satisfactionnh 59/70
Q. No.16. If YES, What is your rating factor for Bike which you will give
Table no.16
RATING GOOD FAIR BAD
Quality 62 4 1
Price 46 20 1
Longevity 55 12 0
figure no.16
Interpretation:
From the above graph it know that out of 100 respondents 67% have used the
Hero. Out of 67% respondents 62% people rated good quality, 4% respondent‟s rated
fair quality and remaining 1% respondents rated bad quality.
Out of 67% respondents 46% respondents rated good price, 20% respondents
rated fair quality and remaining 1% respondents rated bad price.
Out of 67% respondents‟ 55% of respondents rated good longevity and 12%
respondent‟s rated fair longevity.
0
10
20
30
40
50
60
70
GOOD FAIR BAD
Rating factor for reliance products
QUALITY
PRICE
LONGEVITY

7/29/2019 Customer Satisfactionnh
http://slidepdf.com/reader/full/customer-satisfactionnh 60/70
Q. No.17. If YES, how do you heard about HERO Products
Table no.17
Response Electronic
media
Print media Sales person others TOTAL
No. of
respondents
17 56 16 11 100
Percentage
of
respondents
17% 56% 16% 11% 100%
Figure no.17
Interpretation:
From the above graph we can analyze that most of response came from news paper
promotion is 56%,
Through electronic media is 17%, sales persons is 16% and 11% by others, by this we
known that paper ads are best than others.
17%
56%
16%11%
0%
10%
20%
30%
40%
50%
60%
Electronic
media
Print media Sales person others
P e r c e n t a g e o
f r e s p o n d e n t s
Response
Percentage of respondents
Percentage of
respondents

7/29/2019 Customer Satisfactionnh
http://slidepdf.com/reader/full/customer-satisfactionnh 61/70
Q. No.18.What way you think promotion of HERO MOTO CORP Products
Should be done
Table no.18
Promotions
to be done
No. of
respondents
Percentage of
respondents
Offers 8 8%
Advertisement
and offers10 10%
Advertisement 19 19%
Free Service 52 52%
Free service
and offers5 5%
All the above 6 6%
Total 100 100%
Graph no.18
Interpretation:
From the above graph we know that the promotions should be done by free service
and advertisement.
8% 10%19%
52%
5% 6%
0%
10%
20%
30%
40%
50%
60%
P e r c e n t a
g e s o f r e s p o n d e n t s
Promotions to be done
Percentage of respondents

7/29/2019 Customer Satisfactionnh
http://slidepdf.com/reader/full/customer-satisfactionnh 62/70
Q. No.19.Is the appointment system useful to you?
Table no.19
S. No Options No. Of respondentsPercentage of
respondents
1 Completely 25 25%
2 Useful 73 73%
3 Not useful 2 2%
TOTAL 100 100%
Figure no.19
Interpretation
From the above graph it is know that among the 100 customers when a
question was raised regarding the usefulness of service appointment system 25% of
the respondent said completely useful, 73% said useful and 2% said not useful.
25%
73%
2%
0%
10%
20%
30%
40%
50%
60%
70%
80%
Completely Useful Not useful
P e r c e n t a g e o
f r e s p
o n d e n t s
Options
Percentage of respondents
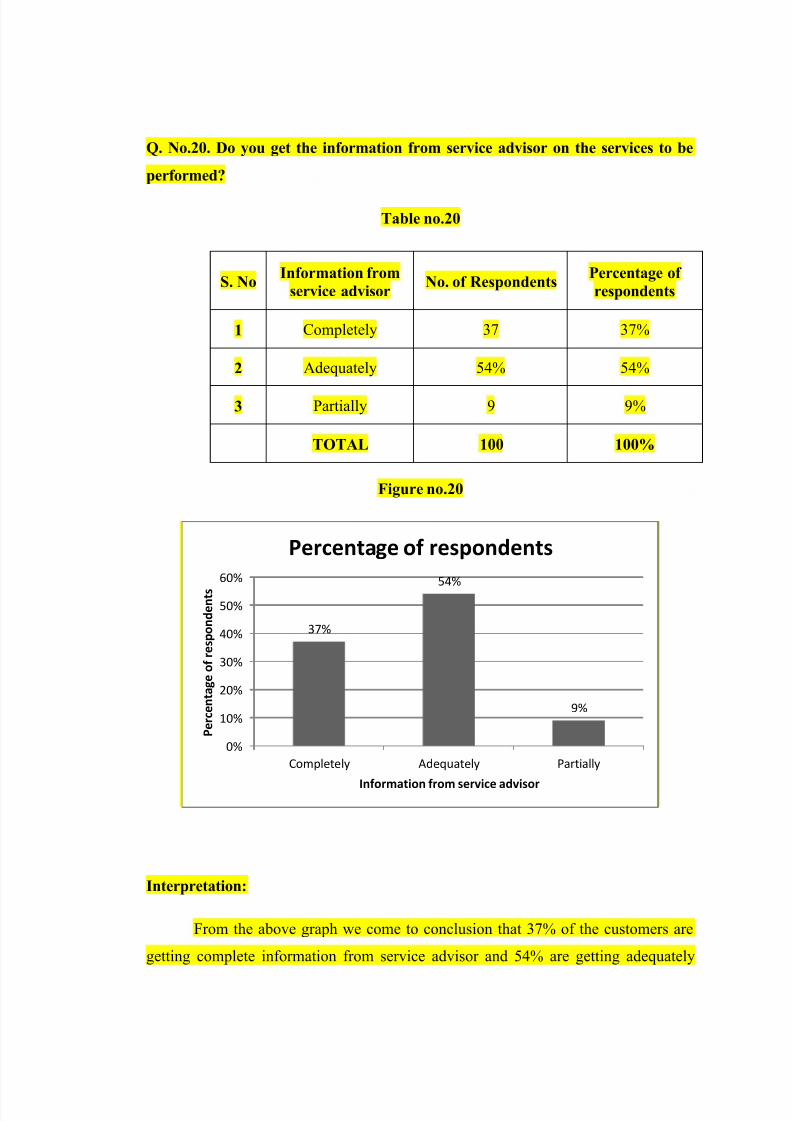
7/29/2019 Customer Satisfactionnh
http://slidepdf.com/reader/full/customer-satisfactionnh 63/70
Q. No.20. Do you get the information from service advisor on the services to be
performed?
Table no.20
S. NoInformation from
service advisorNo. of Respondents
Percentage of
respondents
1 Completely 37 37%
2 Adequately 54% 54%
3 Partially 9 9%
TOTAL 100 100%
Figure no.20
Interpretation:
From the above graph we come to conclusion that 37% of the customers are
getting complete information from service advisor and 54% are getting adequately
37%
54%
9%
0%
10%
20%
30%
40%
50%
60%
Completely Adequately Partially
P e r c e n t a g e o
f r e s p o n d e n t s
Information from service advisor
Percentage of respondents

7/29/2019 Customer Satisfactionnh
http://slidepdf.com/reader/full/customer-satisfactionnh 64/70
and 9% of the customers are getting partial information regarding the services to be
performed.
FINDINGS
1. Most of the buyers are professionals and business people using the Hero
MotoCorp Ltd bikes.
2. 94% of the respondents purchase new bikes only.
3. Nearly about 85% of the customers feel that the price of vehicle is affordable.
4. About 87% of the respondents use Hero MotoCorp Ltd bikes for their
personal use.
5. The reason for purchase only Hero MotoCorp Ltd is necessity for 54% of the
customers, 24% of the consumers feels status and 18% feel comfortable.
6. Many of the respondents are satisfied with regard to mileage, price.
7. 45% of the respondents use their vehicle to take their family out and 44% use
for going to office.
8. 61% of the respondents were satisfied with service provided by the dealer at
the service center, 24% and 7% of the respondents said ok and excellent, and
8% of the respondents were not satisfied with service at service station.
9. Above 56% of the respondents feel the prices are reasonable at the service
center. Where 8% and 38% of the respondents feel that the prize are high and
medium respectively.
10. 62% of the respondents feel that the overall performance of the vehicle is
good, 8% and 23% of the respondents feel that the performance of the vehicle
is excellent and o.k.

7/29/2019 Customer Satisfactionnh
http://slidepdf.com/reader/full/customer-satisfactionnh 65/70
SUGGESTIONS
1. It is suggested that some more place should be provided for luggage.
2. To provide better service to customers at work shop
3. To make the vehicle more spacious inside
4. To improve the comfortness in the vehicle
5. Skilled and experienced persons should be provided at service center, so that
problems of the vehicle should be resolved completely.
6. Engine capacity should be increase, this leads to increase mileage and pickup
7. To increase the place of parking at work shop.

7/29/2019 Customer Satisfactionnh
http://slidepdf.com/reader/full/customer-satisfactionnh 66/70
CONCLUSION
“The global business environment is buzzing with the single most important
issue of Building a competitive edge by creating and retaining a large number of
customers than their goods and services every organization is therefore seized of the
task of establishing sustaining its worth to the customer, who has been rendered
unpredictable by com petition”
Therefore every business is making a continuous effort for achieving customer
effort for achieving customer loyalty
In short it is total organizational culture and brand equity, which face
challenge. So that there is a perennial struggle amongst organizations to sustain their
existence in the market place, and hence in order to sustain the stiff competition the
company has to take up market Research frequently to know the changing needs &
preference of the customers.
This helps the company to reframe the policies in providing cutting edge
technology to satisfy the customer & retain him for a life time.
7/29/2019 Customer Satisfactionnh
http://slidepdf.com/reader/full/customer-satisfactionnh 67/70
BIBLIOGRAPHY
REFERENCES
BOOKS
Principles of Marketing : Philip Kotler & Gary Armstrong
Marketing Research : G.C.Beri
Consumer Behavior : Leon G. Shiftman
Services Marketing : Adlarian Palmer
MAGAZINES
Auto India
Business Today
JOURNALS
ICFAI General of Marketing
Retail Marketing
WEB SITES
www.hero.com
www.autofinlimited.com
www.google.com

7/29/2019 Customer Satisfactionnh
http://slidepdf.com/reader/full/customer-satisfactionnh 68/70
QUESTIONNAIRE
Name of Respondent: ___________________________________________________
Designation:________________________ Income: ___________________________
Address: _____________________________________________________________
Phone No._________________ Email id: ___________________________________
1) What is the model of bikes used by customers?
a. SPLENDER + b. PASSION +
c. GLAMOUR d. CBZ X-TREME
e. KARIZMA
2) Which type of bike have you bough
a. New b. Pre Owned
3) Whether the price of the Vehicle is?
a. Affordable b. Reasonable
4) What is the purpose of buying this bike?
a. Personal use b. Rental use
c. Other use d. None
5) Who influenced in buying this bike?a. Yourself b. Family
c. Friends d. Advertisement
6) What does this bike convey?
a. Necessity b. Comfort
c. Status d. Other
7) What are the reasons for buying this biker?
a. Price b. Mileage
c. Service d. Brand Image
8) You use your bike mostly for?
a. Office b. Family
c. Long drives d. Shopping
9) How long you will use this vehicle?
a. 1-2 years b. 2-4 years
c. 4-8 years d. 8 years & above
10) Rate your satisfaction for the service provided by the Organization?

7/29/2019 Customer Satisfactionnh
http://slidepdf.com/reader/full/customer-satisfactionnh 69/70
a. Excellent b. Good
c. Average d. Poor
11) Are you satisfied with mileage give by your bike?
a. Yes b. No
12) Express your satisfaction level on performance of your Vehicle?
a. satisfied b. Average
c. Not satisfied
13) Comment on the prices charged at service station?
a. High b. Medium
c. Reasonable d. Low
14) How is the performance of the executives?
a. Excellent b. Good
c. Average d. Poor
15) Would you like to change your bike?
a. Yes b. No
16) YES, What is your rating factor for Bike which you will give
17) If YES, how do you heard about Hero MotoCorp Ltd Products
a. Electronic media b. Print media
c. Sales person d. others
18) What way you think promotion of Hero MotoCorp Ltd Products Should be done
a. Offers b. Advertisement
c. Free Service d. others
19) Is the appointment system useful to you?
a. Completely b. Useful
RATING
FACTOR GOOD FAIR BAD
Quality
Price
Longevity
Others (_)
7/29/2019 Customer Satisfactionnh
http://slidepdf.com/reader/full/customer-satisfactionnh 70/70
c. Not useful
20) Do you get the information from service advisor on the services to be performed?
a. Completely b. Adequately
c. Partially
21) Suggestions for the company?
—————————————————————————————————————————
—————————————————————————————————————————
—————————————————————————————————————————


![Customer Retention [Infographic] Customer Experience](https://img.pdfslide.us/doc/110x75/55b6dceebb61eb0c598b46c8/customer-retention-infographic-customer-experience.jpg)