Embed Size (px)
Citation preview
CUSTOMER SATISFACTION INDEX OF SINGAPORE 2017
Q3 SCORES FOOD & BEVERAGE AND TOURISM
RESULTS OVERVIEW
2017 Q3 SCORES FOOD & BEVERAGE AND TOURISM
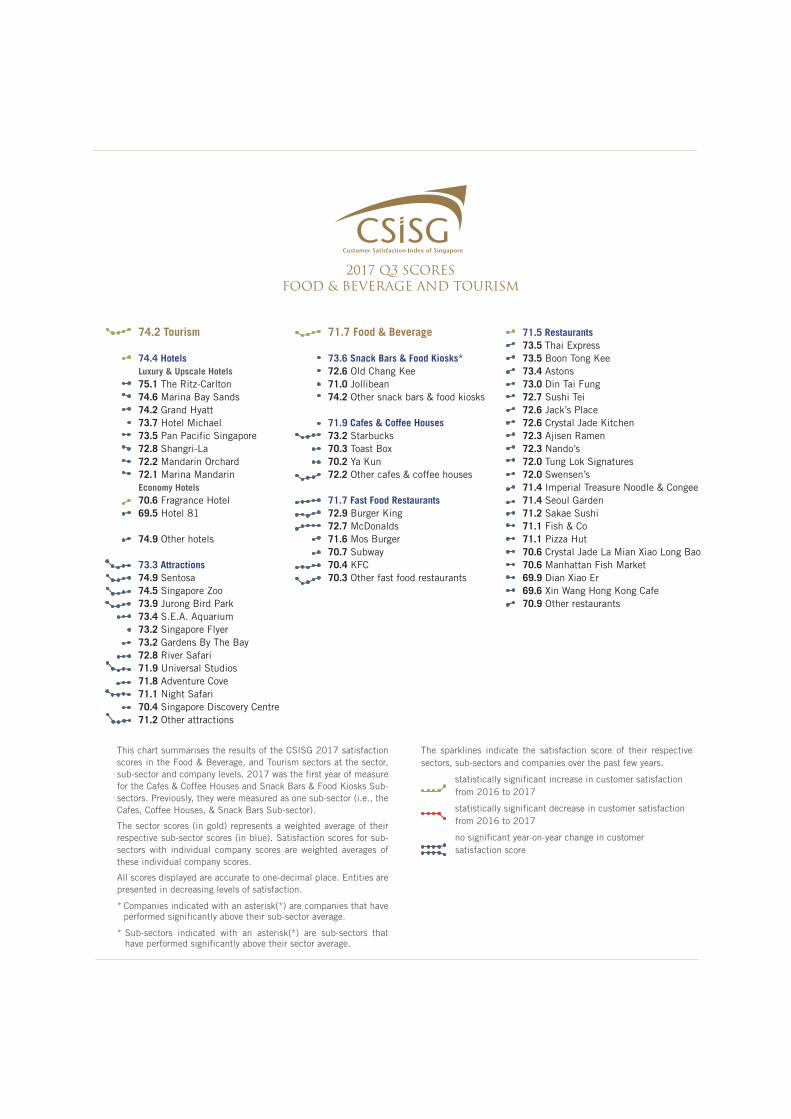
The sparklines indicate the satisfaction score of their respective sectors, sub-sectors and companies over the past few years.
statistically significant increase in customer satisfaction from 2016 to 2017
statistically significant decrease in customer satisfaction from 2016 to 2017
no significant year-on-year change in customer satisfaction score
This chart summarises the results of the CSISG 2017 satisfaction scores in the Food & Beverage, and Tourism sectors at the sector, sub-sector and company levels. 2017 was the first year of measure for the Cafes & Coffee Houses and Snack Bars & Food Kiosks Sub-sectors. Previously, they were measured as one sub-sector (i.e., the Cafes, Coffee Houses, & Snack Bars Sub-sector).
The sector scores (in gold) represents a weighted average of their respective sub-sector scores (in blue). Satisfaction scores for sub-sectors with individual company scores are weighted averages of these individual company scores.
All scores displayed are accurate to one-decimal place. Entities are presented in decreasing levels of satisfaction.
* Companies indicated with an asterisk(*) are companies that have performed significantly above their sub-sector average.
* Sub-sectors indicated with an asterisk(*) are sub-sectors that have performed significantly above their sector average.
74.2 Tourism
74.4 Hotels
Luxury & Upscale Hotels
75.1 The Ritz-Carlton74.6 Marina Bay Sands74.2 Grand Hyatt73.7 Hotel Michael73.5 Pan Pacific Singapore72.8 Shangri-La72.2 Mandarin Orchard72.1 Marina MandarinEconomy Hotels
70.6 Fragrance Hotel69.5 Hotel 81
74.9 Other hotels
73.3 Attractions
74.9 Sentosa74.5 Singapore Zoo73.9 Jurong Bird Park73.4 S.E.A. Aquarium73.2 Singapore Flyer73.2 Gardens By The Bay72.8 River Safari71.9 Universal Studios71.8 Adventure Cove71.1 Night Safari70.4 Singapore Discovery Centre71.2 Other attractions
71.7 Food & Beverage
73.6 Snack Bars & Food Kiosks*
72.6 Old Chang Kee71.0 Jollibean74.2 Other snack bars & food kiosks
71.9 Cafes & Coffee Houses
73.2 Starbucks70.3 Toast Box70.2 Ya Kun72.2 Other cafes & coffee houses
71.7 Fast Food Restaurants
72.9 Burger King72.7 McDonalds71.6 Mos Burger70.7 Subway70.4 KFC70.3 Other fast food restaurants
71.5 Restaurants
73.5 Thai Express73.5 Boon Tong Kee 73.4 Astons 73.0 Din Tai Fung72.7 Sushi Tei72.6 Jack’s Place72.6 Crystal Jade Kitchen72.3 Ajisen Ramen 72.3 Nando’s 72.0 Tung Lok Signatures 72.0 Swensen’s71.4 Imperial Treasure Noodle & Congee 71.4 Seoul Garden71.2 Sakae Sushi71.1 Fish & Co 71.1 Pizza Hut 70.6 Crystal Jade La Mian Xiao Long Bao 70.6 Manhattan Fish Market 69.9 Dian Xiao Er 69.6 Xin Wang Hong Kong Cafe 70.9 Other restaurants
CSISG 2017 THIRD QUARTER RESULTS OVERVIEW
The Customer Satisfaction Index of Singapore (CSISG) computes customer satisfaction scores at the national, sector, sub-sector, and company levels. The CSISG serves as a quantitative benchmark of the quality of goods and services produced by the Singapore economy over time and across countries. This is the CSISG’s eleventh year of measurement.
THIRD QUARTER RESULTS HIGHLIGHTS
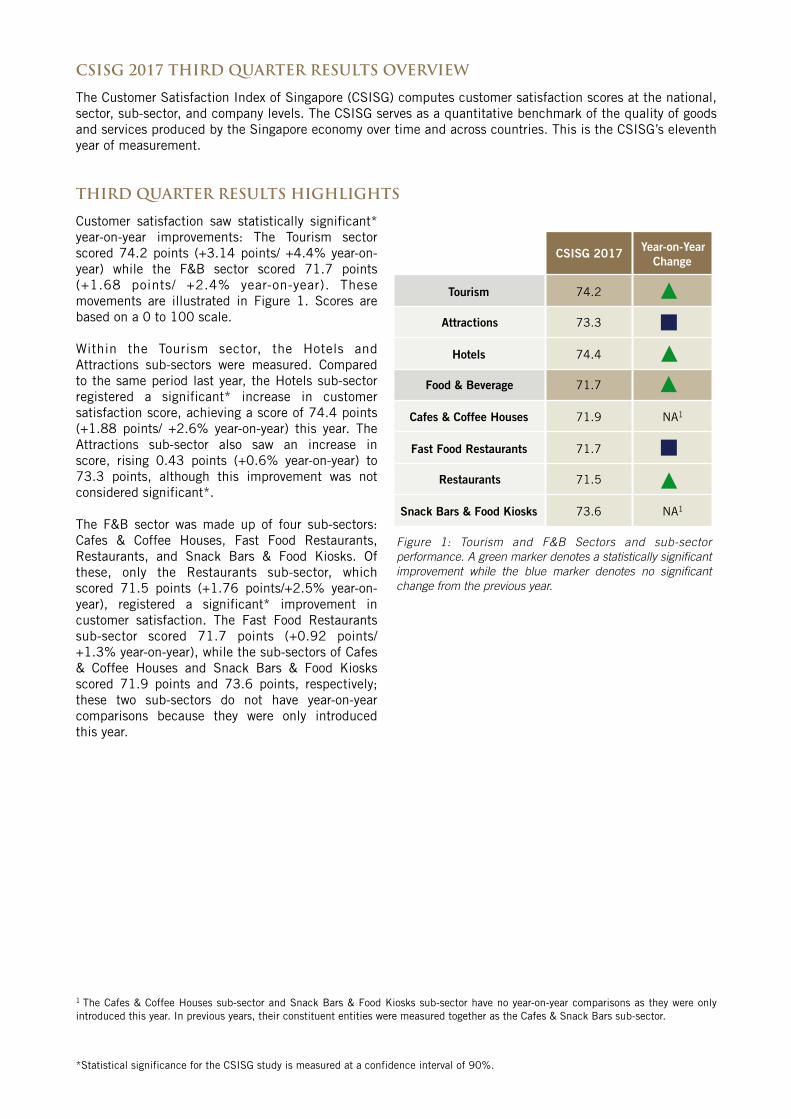
Customer satisfaction saw statistically significant* year-on-year improvements: The Tourism sector scored 74.2 points (+3.14 points/ +4.4% year-on-year) while the F&B sector scored 71.7 points (+1.68 points/ +2.4% year-on-year). These movements are illustrated in Figure 1. Scores are based on a 0 to 100 scale.
Within the Tourism sector, the Hotels and Attractions sub-sectors were measured. Compared to the same period last year, the Hotels sub-sector registered a significant* increase in customer satisfaction score, achieving a score of 74.4 points (+1.88 points/ +2.6% year-on-year) this year. The Attractions sub-sector also saw an increase in score, rising 0.43 points (+0.6% year-on-year) to 73.3 points, although this improvement was not considered significant*.
The F&B sector was made up of four sub-sectors: Cafes & Coffee Houses, Fast Food Restaurants, Restaurants, and Snack Bars & Food Kiosks. Of these, only the Restaurants sub-sector, which scored 71.5 points (+1.76 points/+2.5% year-on-year), registered a significant* improvement in customer satisfaction. The Fast Food Restaurants sub-sector scored 71.7 points (+0.92 points/+1.3% year-on-year), while the sub-sectors of Cafes & Coffee Houses and Snack Bars & Food Kiosks scored 71.9 points and 73.6 points, respectively; these two sub-sectors do not have year-on-year comparisons because they were only introduced this year.
1 The Cafes & Coffee Houses sub-sector and Snack Bars & Food Kiosks sub-sector have no year-on-year comparisons as they were only introduced this year. In previous years, their constituent entities were measured together as the Cafes & Snack Bars sub-sector.
*Statistical significance for the CSISG study is measured at a confidence interval of 90%.
CSISG 2017Year-on-Year
Change
Tourism 74.2
Attractions 73.3
Hotels 74.4
Food & Beverage 71.7
Cafes & Coffee Houses 71.9 NA1
Fast Food Restaurants 71.7
Restaurants 71.5
Snack Bars & Food Kiosks 73.6 NA1
Figure 1: Tourism and F&B Sectors and sub-sector performance. A green marker denotes a statistically significant improvement while the blue marker denotes no significant change from the previous year.
THIRD QUARTER KEY FINDINGS
Service A Key Driver of Perceived Quality For Luxury and Upscale Hotels
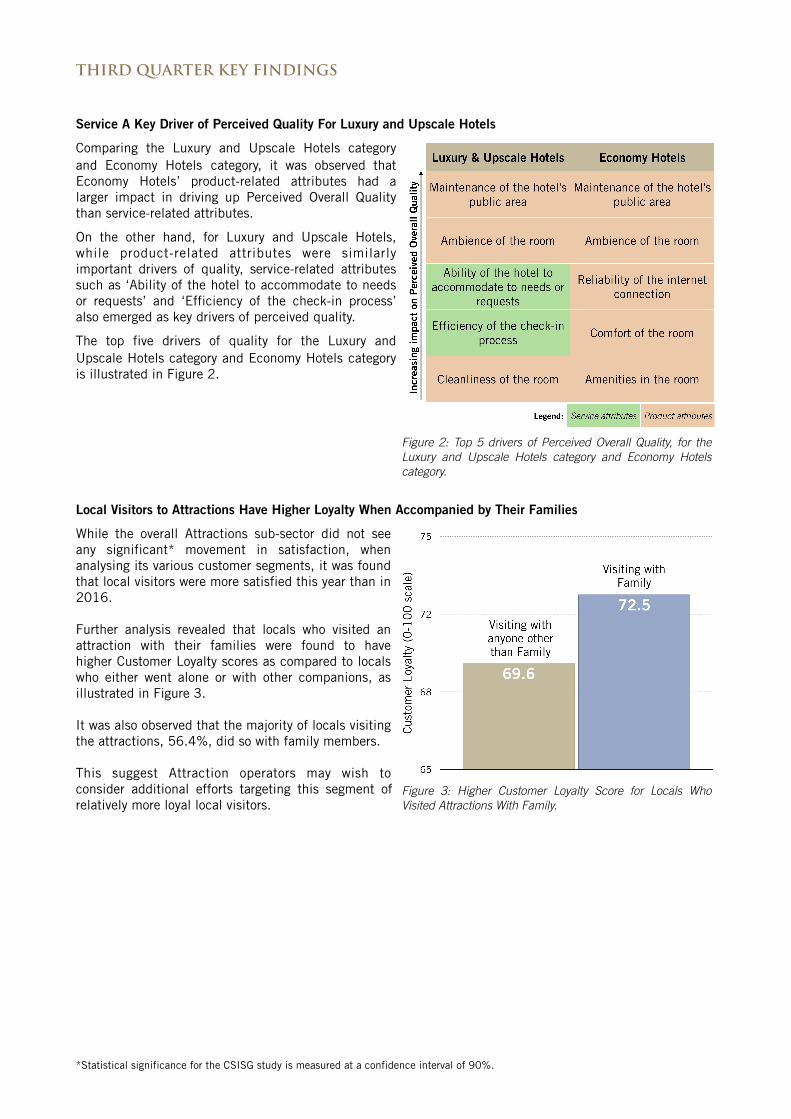
Comparing the Luxury and Upscale Hotels category and Economy Hotels category, it was observed that Economy Hotels’ product-related attributes had a larger impact in driving up Perceived Overall Quality than service-related attributes.
On the other hand, for Luxury and Upscale Hotels, while product-related attributes were similarly important drivers of quality, service-related attributes such as ‘Ability of the hotel to accommodate to needs or requests’ and ‘Efficiency of the check-in process’ also emerged as key drivers of perceived quality.
The top five drivers of quality for the Luxury and Upscale Hotels category and Economy Hotels category is illustrated in Figure 2.
Local Visitors to Attractions Have Higher Loyalty When Accompanied by Their Families
While the overall Attractions sub-sector did not see any significant* movement in satisfaction, when analysing its various customer segments, it was found that local visitors were more satisfied this year than in 2016.
Further analysis revealed that locals who visited an attraction with their families were found to have higher Customer Loyalty scores as compared to locals who either went alone or with other companions, as illustrated in Figure 3.
It was also observed that the majority of locals visiting the attractions, 56.4%, did so with family members.
This suggest Attraction operators may wish to consider additional efforts targeting this segment of relatively more loyal local visitors.
*Statistical significance for the CSISG study is measured at a confidence interval of 90%.
Figure 2: Top 5 drivers of Perceived Overall Quality, for the Luxury and Upscale Hotels category and Economy Hotels category.
Figure 3: Higher Customer Loyalty Score for Locals Who Visited Attractions With Family.
Longer Waiting Times Associated With Lower Satisfaction And Loyalty
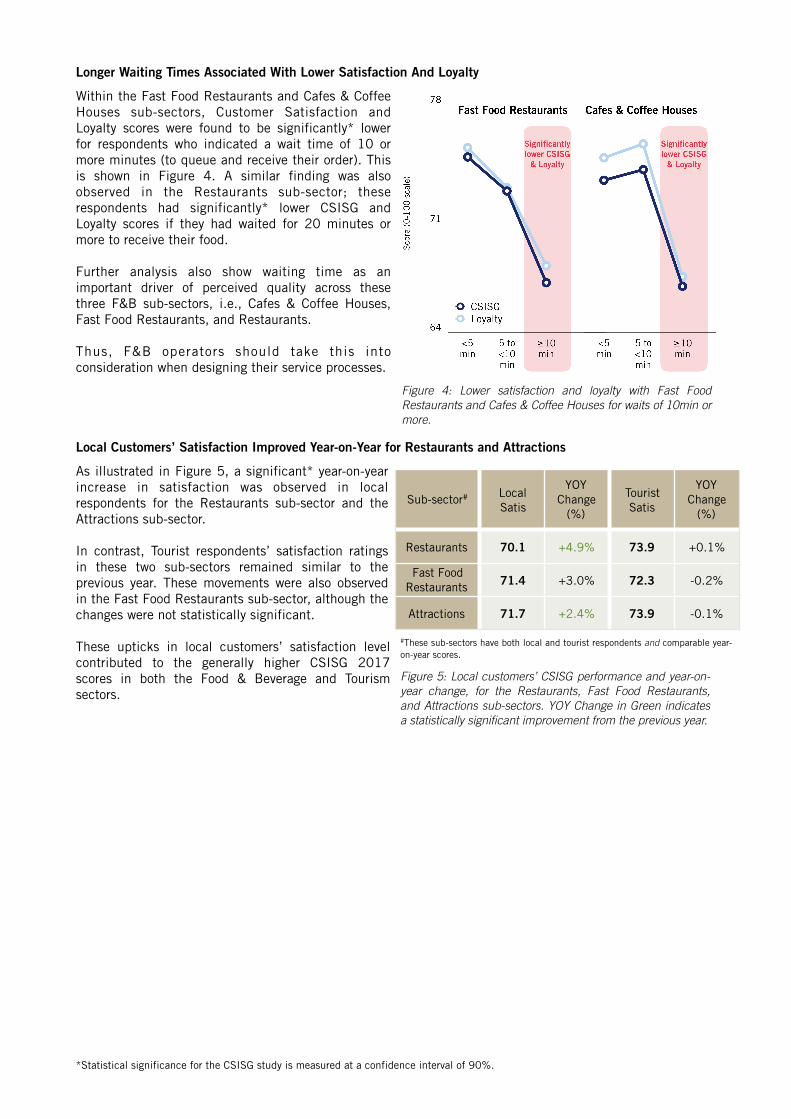
Within the Fast Food Restaurants and Cafes & Coffee Houses sub-sectors, Customer Satisfaction and Loyalty scores were found to be significantly* lower for respondents who indicated a wait time of 10 or more minutes (to queue and receive their order). This is shown in Figure 4. A similar finding was also observed in the Restaurants sub-sector; these respondents had significantly* lower CSISG and Loyalty scores if they had waited for 20 minutes or more to receive their food.
Further analysis also show waiting time as an important driver of perceived quality across these three F&B sub-sectors, i.e., Cafes & Coffee Houses, Fast Food Restaurants, and Restaurants.
Thus, F&B operators should take this into consideration when designing their service processes.
Local Customers’ Satisfaction Improved Year-on-Year for Restaurants and Attractions
As illustrated in Figure 5, a significant* year-on-year increase in satisfaction was observed in local respondents for the Restaurants sub-sector and the Attractions sub-sector.
In contrast, Tourist respondents’ satisfaction ratings in these two sub-sectors remained similar to the previous year. These movements were also observed in the Fast Food Restaurants sub-sector, although the changes were not statistically significant.
These upticks in local customers’ satisfaction level contributed to the generally higher CSISG 2017 scores in both the Food & Beverage and Tourism sectors.
*Statistical significance for the CSISG study is measured at a confidence interval of 90%.
Sub-sector# Local Satis
YOY Change
(%)
Tourist Satis
YOY Change
(%)
Restaurants 70.1 +4.9% 73.9 +0.1%
Fast Food Restaurants 71.4 +3.0% 72.3 -0.2%
Attractions 71.7 +2.4% 73.9 -0.1%
#These sub-sectors have both local and tourist respondents and comparable year-on-year scores.
Figure 4: Lower satisfaction and loyalty with Fast Food Restaurants and Cafes & Coffee Houses for waits of 10min or more.
Figure 5: Local customers’ CSISG performance and year-on-year change, for the Restaurants, Fast Food Restaurants, and Attractions sub-sectors. YOY Change in Green indicates a statistically significant improvement from the previous year.
CSISG BACKGROUND
CSISG scores are generated based on the econometric modelling of survey data collected from end-users after the consumption of products and services.
Company scores are weighted based on a separate incidence study. This incidence study helps determine each company’s sample profile and the local-tourist weights. Sub-sector scores are derived as a weighted average of company scores, in proportion to the local and tourist incidence interactions with the constituent companies. Sector scores are derived by aggregating the sub-sector scores proportionately to each sub-sector’s revenue contributions. Finally, the national score is weighted according to each sector’s contribution to GDP. CSISG scores customer satisfaction on a scale of 0 to 100 with higher scores representing better performance.
Under a quarterly measure-and-release system, distinct industry sectors measured within each calendar quarter have their results released the following quarter. Companies in the Retail and Info-Communications sectors were measured in the first quarter, Air Transport and Land Transport in the second quarter, Food & Beverage and Tourism sectors in the third quarter, and finally the companies of Finance & Insurance and Healthcare sectors, in the fourth quarter. The national score for 2017 will then be computed using the data collected over these four quarters.
For this third quarter of 2017, results for the F&B and Tourism sectors were collected and analysed. The F&B sector is made up of the Cafes & Coffee Houses, Fast Food Restaurants, Restaurants, and Snack Bars & Food Kiosks sub-sectors. The Tourism sector comprises of the Attractions and Hotels sub-sectors.
There were changes to this year’s F&B and Tourism sectors. For F&B, the Cafes & Coffee Houses sub-sector and the Snack Bars & Food Kiosks sub-sector were previously measured together as the Cafes & Snack Bars sub-sector. Also, measurement of the Bars & Pubs and Food Courts sub-sectors was discontinued. For Tourism, the measurement of the Travel & Tour Services and Online Travel Agencies sub-sectors was discontinued.
CSISG 2017 FIELDWORK PROCESS
Survey data for the F&B and Tourism sectors was collected between July and October 2017. Responses were through face-to-face interviews with Singapore residents at their homes and departing tourists at Changi Airport.
The Q3 fieldwork garnered 3,035 interviews with locals and 3,865 interviews with departing tourists at the airport. Altogether, there were 6,900 unique responses covering 370 distinct entities in the Food & Beverage and Tourism sectors; 57 entities have published scores.
*Statistical significance for the CSISG study is measured at a confidence interval of 90%.
contact us
For more details on the CSISG, the ISE Corporate Membership programme, and customised research, please reach us at
Institute of Service Excellence Singapore Management University
81 Victoria Street Administration Building Singapore 188065
Tel: +65 6828 0111 Fax: +65 6828 0690 Email: [email protected]
ise.smu.edu.sg