Embed Size (px)
Citation preview
Transit IDEA Program
CUSTOMER SATISFACTION INDEX FOR THE MASS TRANSIT INDUSTRY
Final Report for Transit IDEA Project 1 Prepared by: Tri-County Metropolitan Transportation District of Oregon Portland Oregon May 1995
Innovations Deserving Exploratory Analysis (IDEA) Programs Managed by the Transportation Research Board This Transit IDEA project was funded by the Transit IDEA Program, which fosters development and testing of innovative concepts and methods for advancing transit practice. The Transit IDEA Program is funded by the Federal Transit Administration (FTA) as part of the Transit Cooperative Research Program (TCRP), a cooperative effort of the FTA, the Transportation Research Board (TRB) and the Transit Development Corporation, a nonprofit educational and research organization of the American Public Transportation Association (APTA). The Transit IDEA Program is one of four IDEA programs managed by TRB. The other IDEA programs are listed below. • NCHRP Highway IDEA Program, which focuses on advances in the design, construction, safety, and
maintenance of highway systems, is part of the National Cooperative Highway Research Program. • High-Speed Rail IDEA Program, which focuses on innovative methods and technology in support of the
Federal Railroad Administration’s (FRA) next-generation high-speed rail technology development program. • Safety IDEA Program, which focuses on innovative approaches for improving railroad safety and intercity bus
and truck safety. The Safety IDEA program is funded by the Federal Motor Carrier Safety Administration and the FRA.
Management of the four IDEA programs is coordinated to promote the development and testing of innovative concepts, methods, and technologies. For information on the IDEA programs, look on the Internet at www.trb.org/idea or contact the IDEA programs office by telephone at (202) 334-3310 or by fax at (202) 334-3471. IDEA Programs Transportation Research Board 500 Fifth Street, NW Washington, DC 20001
The project that is the subject of this contractor-authored report was a part of the Innovations Deserving Exploratory Analysis (IDEA) Programs, which are managed by the Transportation Research Board (TRB) with the approval of the Governing Board of the National Research Council. The members of the oversight committee that monitored the project and reviewed the report were chosen for their special competencies and with regard for appropriate balance. The views expressed in this report are those of the contractor who conducted the investigation documented in this report and do not necessarily reflect those of the Transportation Research Board, the National Research Council, or the sponsors of the IDEA Programs. This document has not been edited by TRB. The Transportation Research Board of the National Academies, the National Research Council, and the organizations that sponsor the IDEA Programs do not endorse products or manufacturers. Trade or manufacturers' names appear herein solely because they are considered essential to the object of the investigation.
CUSTOMER SATISFACTION INDEX FOR THE MASS TRANSIT INDUSTRY
Project Final Report Transit IDEA Project 1 Prepared for Transit IDEA Program Transportation Research Board National Research Council Prepared by Tri-County Metropolitan Transportation District of Oregon
Portland Oregon
May 1, 1995

Data Page (TRB)
Acknowledgements Kathryn Coffel, Director Marketing Information Department Tri-County Metropolitan Transportation District of Oregon 4012 S.E. 17th Avenue Portland, Oregon 97055 (503) 238-5860 FAX (503) 239-6469 Yvonne Lyon, Manager Manager, Marketing Analysis Tri-County Metropolitan Transportation District of Oregon 4012 S.E. 17th Avenue Portland, Oregon 97055 (503) 239-6430 FAX (503) 239-6469 Paula Sonkin Account Executive J. D. Power and Associates 970 West 190th Street Suite 480 Torrance, California 90502 (310) 323-1433 FAX (310) 323-1213 Ms. Louwana Oliva Director of Communications Metro Regional Transit Authority 416 Kenmore Blvd. Akron, Ohio 44301-1099 (216) 762-7267 FAX (216) 762-0854 Ms. Lynn Otte Manager, Market Development Regional Transportation Authority 181 West Madison, Suite 1900 Chicago, Illinois 60602 (312) 917-0706 FAX (312) 917-0846 Ms. Debbie Alexander Director of Marketing Metropolitan Council Transit Operations 560 Sixth Avenue North Minneapolis, Minnesota 55411-4398 (612) 349-7670 FAX (612) 349-7675 Mr. Steven Silkunas Director, Technical Services and Research Southeastern Pennsylvania Transportation Authority 841 Chestnut Street Philadelphia, Pennsylvania 19107-4484 (215) 580-7977 FAX (215) 580-7997

TABLE OF CONTENTS
Page Number
Executive Summary IDEA Product Concept and Innovation Investigation
Assumptions Methodology Used to Collect Data
Questionnaire Sample and Methodology
Approaches Taken to Analyze the Data Overall Customer Satisfaction Analysis Factor and Regression Analysis Overall Satisfaction and Factor Index Scores Loyalty and Satisfaction Discriminate Analysis Prioritization of Improvement Opportunities
Detailed Results Bus Study Light Rail Study Heavy Rail Study
Plans for Implementation
Conclusions
APPENDIX SECTION A: Guidelines for Adoption of CSI Methodology for Individual Transit Districts B: Discussion of Statistical Analysis C: Questionnaire
1
EXECUTIVE SUMMARY
Customer satisfaction research has long been used in private industry as a strategic tool to identify the opportunities
management should pursue to improve customer satisfaction and increase sales. A number of transit agencies now
conduct research to determine how they are meeting the needs of customers in their districts -- but the data is not
collected on a uniform basis from district to district. Thus, the transit industry has been unable to determine how
satisfied transit customers are with the products and services the industry has to offer. In addition, the individual
agencies that monitor customer satisfaction have been unable to assess their own performance against peer or national
scores.
This pilot Customer Satisfaction Index (CSI) research project is the first systematic, nonbiased, statistically
sophisticated measure of customer satisfaction to be conducted across transit districts. For the first time, transit
agencies have the ability to analyze their own performance, compare themselves directly to a total sample average, and
compare and learn from other districts.
This demonstration project used CSI research methodology and directly applied the technique to five diverse transit
districts. In general, a CSI project is conducted by having respondents rate a given product on a number of satisfaction
attributes associated with that product (here, mass transit). To construct the CSI, attributes are rated and put through a
factor analysis (to group attributes). Then, a regression analysis is performed to determine which factors are most
closely associated with overall customer satisfaction. Beyond measuring satisfaction, CSI research provides actionable
data with which companies can design products and programs that most effectively match customers desires and
monitor the impact their strategies ultimately have on sales.
Tri-County Metropolitan Transportation District of Oregon (TRI-MET) of Portland, Oregon carried out the IDEA
project in cooperation with four other transit agencies. To be useful to the transit industry, the CSI application was
tested in a cross-section of transit properties throughout the United States. The transit districts that participated in the
study include: Metro Regional Transit Authority (MRTA), Akron, Ohio; Regional Transportation Authority through
the Chicago Transit Authority (CTA), Chicago, Illinois; Metropolitan Council Transit Operations (MCTO),
Minneapolis, Minnesota; Southeastern Pennsylvania Transportation Authority (SEPTA), Philadelphia, Pennsylvania;
and Tri-County Metropolitan Transportation District of Oregon (TRI-MET), Portland Oregon.
2
A telephone survey was conducted among 900 transit users in the 5 test cities: 500 bus, 200 light rail, and 200
heavy rail interviews were conducted. One common questionnaire that covered customer satisfaction for bus, light rail,
and heavy rail was developed by all five transit districts. The questionnaire covered the following areas; overall
customer satisfaction with bus/rail experience, measurement of the transit districts' performance on 35-40 transit
attributes, likelihood of using bus/rail again, reasons for using transit; and demographics (gender, age, income, length of
time living in the area). No open-ended questions were asked. Data from the 900 interviews were analyzed to
determine the factors that most influenced overall customer satisfaction and the relative weight each factor possessed.
The study results indicate that customer satisfaction with mass transit is generally good. However, as satisfaction
levels decline among transit users, there is a significant reduction in customer loyalty in terms of using transit again or
recommending transit to a friend or relative. Therefore, to improve transit's image and increase ridership among current
and potential customers, emphasis should be placed on improving those attributes that distinguish "Somewhat
Satisfied" respondents from "Very Satisfied" respondents. The improvement opportunity areas offering the greatest
return on investment (the "high leverage" opportunities) are those associated with driver courtesy, frequency of service,
safety (security) and cleanliness of vehicles, train stations and bus stops.
It is important to note that safety (or security) issues are intricately tied to cleanliness. Vehicles, bus stops and train
stations that obtained higher "cleanliness" ratings also carried an increased perception of personal safety from crime
and the behavior of other people on the vehicles and at bus stops and train stations.
The CSI methodology was used to generate index scores (rankings) for bus and light rail transportation. Index
scores were not generated for heavy rail because the two districts participating in this portion of the study (CTA and
SEPTA) performed at parity in each of the factors contributing to overall satisfaction.
The index scores indicate how far above or below average an agency is rated (by definition, one half of the study
population would be above average, the other below). It should be noted that, in absolute measures, all transit providers
scored relatively well in the evaluations. The distinction for "how well" the districts scored relative to the others, is the
value of the index comparison. For example, an index score of 125 indicates a rating 25% above the total sample
average. The total sample average is set to 100 in the base measurement. Index scores for the test districts in this
study are listed below:
3
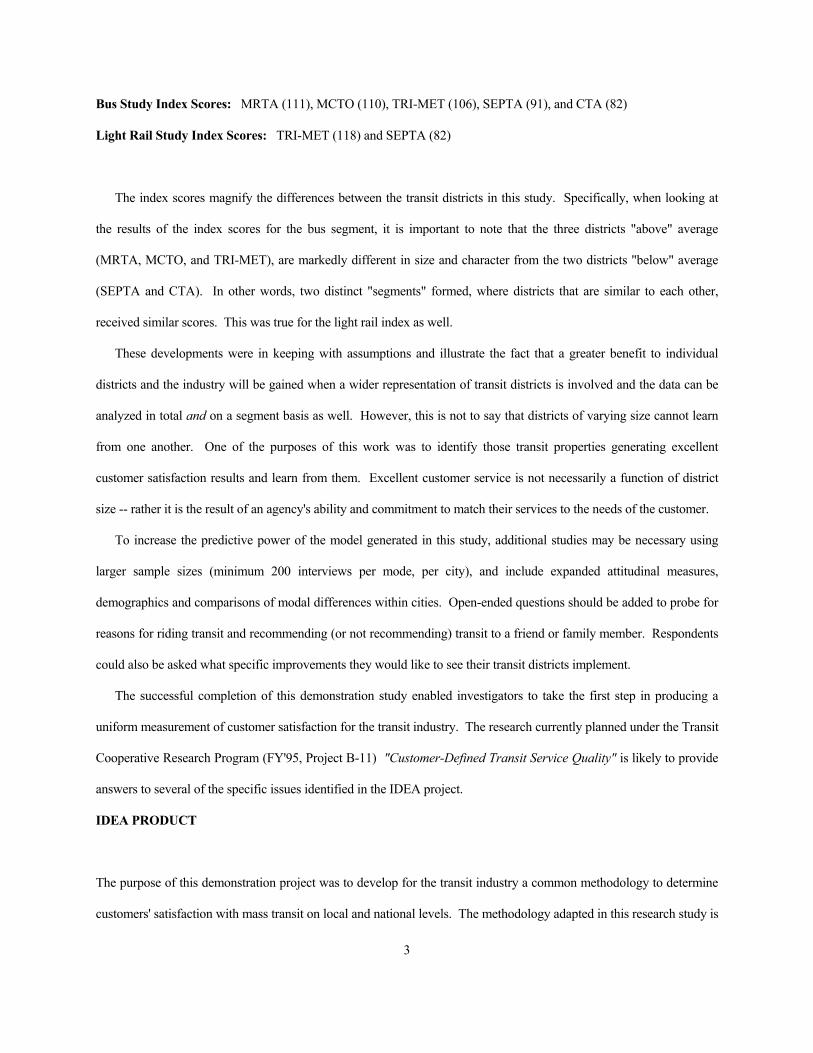
Bus Study Index Scores: MRTA (111), MCTO (110), TRI-MET (106), SEPTA (91), and CTA (82)
Light Rail Study Index Scores: TRI-MET (118) and SEPTA (82)
The index scores magnify the differences between the transit districts in this study. Specifically, when looking at
the results of the index scores for the bus segment, it is important to note that the three districts "above" average
(MRTA, MCTO, and TRI-MET), are markedly different in size and character from the two districts "below" average
(SEPTA and CTA). In other words, two distinct "segments" formed, where districts that are similar to each other,
received similar scores. This was true for the light rail index as well.
These developments were in keeping with assumptions and illustrate the fact that a greater benefit to individual
districts and the industry will be gained when a wider representation of transit districts is involved and the data can be
analyzed in total and on a segment basis as well. However, this is not to say that districts of varying size cannot learn
from one another. One of the purposes of this work was to identify those transit properties generating excellent
customer satisfaction results and learn from them. Excellent customer service is not necessarily a function of district
size -- rather it is the result of an agency's ability and commitment to match their services to the needs of the customer.
To increase the predictive power of the model generated in this study, additional studies may be necessary using
larger sample sizes (minimum 200 interviews per mode, per city), and include expanded attitudinal measures,
demographics and comparisons of modal differences within cities. Open-ended questions should be added to probe for
reasons for riding transit and recommending (or not recommending) transit to a friend or family member. Respondents
could also be asked what specific improvements they would like to see their transit districts implement.
The successful completion of this demonstration study enabled investigators to take the first step in producing a
uniform measurement of customer satisfaction for the transit industry. The research currently planned under the Transit
Cooperative Research Program (FY'95, Project B-11) "Customer-Defined Transit Service Quality" is likely to provide
answers to several of the specific issues identified in the IDEA project.
IDEA PRODUCT
The purpose of this demonstration project was to develop for the transit industry a common methodology to determine
customers' satisfaction with mass transit on local and national levels. The methodology adapted in this research study is
4
known as the Customer Satisfaction Index (CSI). The methodology, developed by J.D. Power and Associates, was
applied for the IDEA study. CSI research methodology is a tool used by industry leaders in the private sector to gain a
clear picture of customers' satisfaction with the products and services offered by an industry. In addition, individual
companies are able to judge their own performance relative to their competitors within an industry, formulate strategies
to improve their market positions and monitor the impact their strategies ultimately have on sales.
This IDEA project tested the application of the CSI methodology across five transit districts for identifying
priorities to improve customer satisfaction and ridership. To gain a "national" scope, this pilot study was conducted in
five transit districts in the United States of varying sizes including: Metro Regional Transit Authority (MRTA), Akron,
Ohio; Regional Transportation Authority through the Chicago Transit Authority (CTA), Chicago, Illinois; Metropolitan
Council Transit Operations (MCTO), Minneapolis, Minnesota; Southeastern Pennsylvania Transportation Authority
(SEPTA), Philadelphia, Pennsylvania; and Tri-County Metropolitan Transportation District of Oregon (Tri-Met),
Portland Oregon.
Using the data derived from the study, investigators were able to:
1. Identify the key factors driving customer satisfaction with transit in the five test cities, and the relative
importance of each of those factors.
2. Construct overall customer satisfaction index scores and independent factors index scores for the total sample
and for each transit district in the study.
3. Form a clear understanding of the performance of each transit district relative to the total sample and to other
districts.
4. Identify and prioritize improvement opportunities for the transit districts in this project.
The investigators also developed guidelines for adoption of the CSI methodology by individual transit agencies. These
guidelines are detailed in Appendix A.
CONCEPT AND INNOVATION
5
Customer satisfaction research has long been used in private industry as a strategic tool to identify the opportunities
management should pursue to improve customer satisfaction and increase sales. A number of transit agencies now
conduct research to determine how they are meeting the needs of customers in their districts -- but the data is not
collected on a uniform basis from district to district. Thus, the transit industry has been unable to determine how
satisfied transit customers are with the products and services the industry has to offer. In addition, the individual
agencies that monitor customer satisfaction have been unable to assess their own performance against peer or national
scores.
This pilot CSI research program is the first systematic, nonbiased, statistically sophisticated measure of customer
satisfaction to be conducted across transit districts. For the first time, transit agencies have the ability to analyze their
own performance, compare themselves directly to a total sample average, and compare and learn from other districts.
In general, a CSI project is conducted by having respondents rate a given product on a number of satisfaction
attributes associated with that product (here, mass transit). To construct the CSI, attributes are rated and put through a
factor analysis (to group attributes). Then, a regression analysis is performed to determine which factors are most
closely associated with overall customer satisfaction. Beyond measuring satisfaction, CSI research provides actionable
data with which companies can design products and programs that most effectively match customers desires, and
monitor the impact their strategies ultimately have on sales.
INVESTIGATION
To enhance both the utility and the appropriateness of the information to be gathered from this project, all phases of the
study design were the result of collaborations between the five transit districts (MRTA, CTA, MCTO, SEPTA, and
TRI-MET) and the study consultant.
Assumptions
6
During the design phase of this demonstration program the following assumptions were made regarding the
construction of the study and the use of the data derived from the investigation:
1. A minimum sample size of 100 respondents per mode, per city would be sufficient to demonstrate the
usefulness of the methodology for transit research purposes.
2. The five transit districts involved were representative of the diversity of transit districts in the United States.
3. The collaboration of the five transit districts would produce a questionnaire that would be applicable to all five
districts, but unique to none.
4. Data from the pilot project would add to existing data bases and not be used to substantiate or negate results
from prior research in the individual districts.
5. The index derived from the pilot project would be applicable to the five districts in the study (the "total
sample"), and would not be represented as an "industry index".
6. Districts of differing size and complexity would generate satisfaction scores reflecting the unique qualities of
the districts under investigation.
Methodology Used for Collecting Data
Questionnaire
One common questionnaire was developed to collect the data, with slight programming adjustments made to
accommodate the differences between bus and rail. The questionnaire used in this study is located in Appendix C. The
questionnaire covered the following areas:
• Overall Satisfaction with bus/rail experience using a 5-point scale (5 = "Very Satisfied" to 1 = "Very
Dissatisfied")
• Measurement of districts' performance on 35-40 attributes using a 5-point scale (5 = "Excellent" to 1 = "Poor")
7
• Likelihood of using bus/rail again
• Reasons for using transit (closed)
• Demographics (gender, age, income, length of time living in the area)
Sample and Methodology
Respondents were contacted by telephone using random-digit dialing in zip code areas provided by each of the five
cities in the study. The lists of telephone numbers were scanned to include only residential numbers. The telephone
methodology was chosen over other methods because it offered maximum control over respondent selection, provided
consistency in data collection, and enabled quota sampling by city and transportation mode. Respondents were at least
16 years of age and had ridden the city's bus and/or rail system at least one time (one way) in the month prior to the
study.
A total of 900 interviews were conducted in the test cities. Interview quotas were allocated as follows: 500
interviews (100 per city) among respondents who had ridden the bus at least once (one way) in the month prior to the
study, 200 interviews among respondents who had used light rail at least once (one way) in the month prior to the
study, and 200 interviews among respondents who had ridden heavy rail at least once (one way) in the month prior to
the study. The interview allocations were as follows:
• MRTA (100 total): 100 bus interviews
• MCTO (100 Total): 100 bus interviews
• CTA (200 Total): 100 bus interviews, 100 heavy rail interviews
• SEPTA (300 Total): 100 bus interviews, 100 heavy rail interviews, 100 light rail interviews
• TRI-MET (200 Total): 100 bus interviews, 100 light rail interviews
In all districts, except MRTA, incidence levels were below projections. However, because the questionnaire length
was shorter than expected (14 minutes actual versus 20 minutes estimated), the investigators were able to make the
additional number of telephone calls necessary to complete the 900 interviews, and stay within time and budget
guidelines. The low incidence rates may have occurred for the following of reasons:
8
1. Estimated incidence rates were for total ridership. In the cities of Chicago, Philadelphia and Portland,
respondents were recruited by mode. Incidence rates by mode can and do differ, sometimes dramatically.
2. Estimated incidence rates quoted for Minneapolis was for ridership in the last year, not the last month as
intended.
3. The interviews did not begin with a "warm-up" question favored by many researchers.
What impact, if any, the above issues may have had on the incidence rates is unknown at this time. However, these
are points to keep in mind when considering studies of similar design and intent.
Approaches Taken to Analyze the Data
Data from the five test cities were first cleaned and checked for validity, logic and missing data (unanswered questions).
A small amount of missing data occurred, but no patterns across districts were found. The intention of this research is
to be a flexible management tool that can form the basis of an action plan to create measurable improvements in
customer satisfaction. Consequently, the research can be analyzed on many levels. The following approaches were
used to analyze the data in the study:
Overall Satisfaction Analysis
In the questionnaire respondents are asked to indicate their level of overall satisfaction with their last transit experience.
This overall satisfaction question is the heart of this research method. In the questionnaire the following five levels of
overall satisfaction were defined: “Very Satisfied”, “Somewhat Satisfied”, “Neither Satisfied Nor Dissatisfied”,
“Somewhat Dissatisfied”, and “Very Dissatisfied”. Answers to this overall satisfaction question were analyzed to
determine the distribution of customer satisfaction with transit service along the "Very Satisfied" to "Very Dissatisfied"
scale. This analysis was performed for the bus, light rail, and heavy rail segments of the study. . The "Detailed
Results" section of this report discusses the results of these analyses.
9
Overall satisfaction was also the "dependent variable" against which independent factors were regressed to
determine the factors most closely associated with customer satisfaction (see factor and regression analysis below).
Factor and Regression Analyses
The 35-40 transit attributes, identified in the questionnaire, underwent factor analysis. Factor analysis is a statistical
methodology that involves clustering or grouping attributes that correlate around common themes or “factors”.
Generally, 7-10 independent factors emerge from the analysis.
The independent factors derived from the factor analysis were then regressed against the dependent variable. For
this study, the dependent variable was overall customer satisfaction. This step determines each factor’s contribution to
overall customer satisfaction and is expressed by the weight that is assigned to the factor. Added together the factors’
weights total 100%.
Those factors with a weight of 17% or higher were identified as "Highly Important" to customers' satisfaction in the
test districts. Factor weights of 11%-16% were considered "Moderately Important", and factors that contribute 10% or
less to overall satisfaction are considered to be of "Low Importance" to the customer. Factor and regression analyses
were conducted for the bus, light rail, and heavy rail segments of the study
Overall Satisfaction Index Scores and Factor Index Scores
Index scores indicate the degree to which each city is different from the total sample average of all participating
districts. The total sample average was set to 100 in this study. The index scores indicate how far above or below
average an agency is rated. For example, an index score of 125 indicates a rating 25% above the total sample average.
Index scores are built through the following process:
1. Independent factors and the weight of each factor are derived using the factor and regression analyses
described above.
2. Using the CSI formula, indices are generated for both overall customer satisfaction and for each of the factors.
10
The maximum possible index score represents what the score would be for a factor if each of the attributes
comprising that factor was given an "Excellent" rating by all participating respondents. Crucial factors (those most
heavily weighted), where the gap is the greatest between the index score and the maximum possible index score,
represents an opportunity for improvement.
In this study, index scores were generated for both the bus and light rail segments. Index scores were not generated
for the heavy rail study because the two districts participating in the heavy rail portion of the project (CTA and SEPTA)
performed at parity in each of the factors contributing to overall satisfaction.
Loyalty Analysis and Satisfaction Discriminate Analysis
Loyalty (will use again or recommend to a friend) was measured along the overall customer satisfaction scale (“Very
Satisfied” to “Very Dissatisfied”) to determine the relationship between loyalty and overall customer satisfaction.
Survey data indicates that as overall customer satisfaction levels increase so does customer loyalty. As a result,
satisfaction discriminate analyses were performed to determine what attribute improvements would most likely increase
overall customer satisfaction levels.
A satisfaction discriminate analysis compares attributes performance scores between levels of overall satisfaction.
To discriminate between two levels of overall satisfaction, the average attribute means scores for one level of
satisfaction are compared, on a side-by-side basis, to the average attribute mean scores for another level of satisfaction.
Then, for each attribute, significance testing (T-test) is conducted to determine if there are any statistically significant
differences between the two levels. The resulting T-scores are then ranked from highest to lowest. Highest scores
indicate the areas where the greatest degree of difference exists between levels and indicates the greatest opportunity for
improvement in overall customer satisfaction.
The following overall satisfaction levels were compared in the study and the top satisfaction discriminators (T-
scores) were generated for each comparison:
1. “Somewhat Satisfied” level compared with “Very Satisfied” level;
2. “Neither Satisfied Nor Dissatisfied” level compared with “Somewhat Satisfied” level; and
3. “Very Dissatisfied/Somewhat Dissatisfied” level compared with “Neither Satisfied Nor Dissatisfied” level.
11
Prioritization of Improvement Opportunities
To prioritize improvement opportunities, it is necessary to examine what a transit system "does well" versus "not so
well" within the context of what is truly important to the customer. This was done by analyzing the importance (the
weight) of a factor to overall customer satisfaction and by comparing the attribute scores within that factor against the
total sample average attribute scores. For example, if a factor is weighted high (17% or above) then it is highly
importance to overall customer satisfaction. Yet, if the attributes scores that comprise that factor are significantly below
the total sample average attribute scores, then a transit system is not performing well within the context of what is truly
important to the customer. Therefore, high priority should be placed on improving the attributes that comprise that
factor. This would constitute a Priority 1 improvement opportunity.
Table 1 defines the four priority levels that were developed for the study. Priority 2 opportunities would focus on
improving attributes where the scores are equal to or above the total sample average scores and where factor
importance is high or moderate. Less benefit to individual agencies would be derived by focusing on Priorities 3 and 4
where factor importance is moderate or low and attribute scores are equal to or above the total sample average.
Prioritization improvement opportunities were identified for all of the transit district participating in the study.
Detailed Results
Bus Study
A total of 500 bus interviews were conducted in the IDEA project. One hundred interviews were conducted for each
transit district.
Overall Satisfaction Analysis Overall customer satisfaction among bus passengers in each of the participating districts is at a respectable level. Table
2 lists the overall satisfaction survey results for bus service. With the exception of CTA, average mean scores (on a
12
five point scale) are all above 4.0. Although CTA is lower than the other districts, overall satisfaction among CTA
passengers is positive (3.61).
The majority of respondents in each of the cities indicated that they are "Very Satisfied" or "Somewhat Satisfied"
with their last bus trip. Over one-half of the respondents for MRTA, MCTO, and TRI-MET ranked themselves in the
highest category, "Very Satisfied," and approximately one-third were "Somewhat Satisfied."
The percent of respondents for SEPTA and CTA who were "Very Satisfied" was appreciably lower than the other
three districts. However, with nearly half of their respondents in the "Somewhat Satisfied" category, both SEPTA and
CTA have opportunities to show strong gains in customer satisfaction by improving performance in those areas that
will move customers from "Somewhat Satisfied" to "Very Satisfied."
The low percentage of respondents who were "Neither Satisfied Nor Dissatisfied" or "Dissatisfied" indicate that the
transit districts involved in this study will benefit from focusing improvement efforts on maintaining "Very Satisfied"
passengers at their current level and moving those passengers who are "Somewhat Satisfied" to "Very Satisfied."
Factor and Regression Analysis
Data from the 500 interviews underwent factor and regression analysis to determine the factors that most influenced
overall customer satisfaction for bus travel and the relative weight each factor possessed. Eight factors emerged as
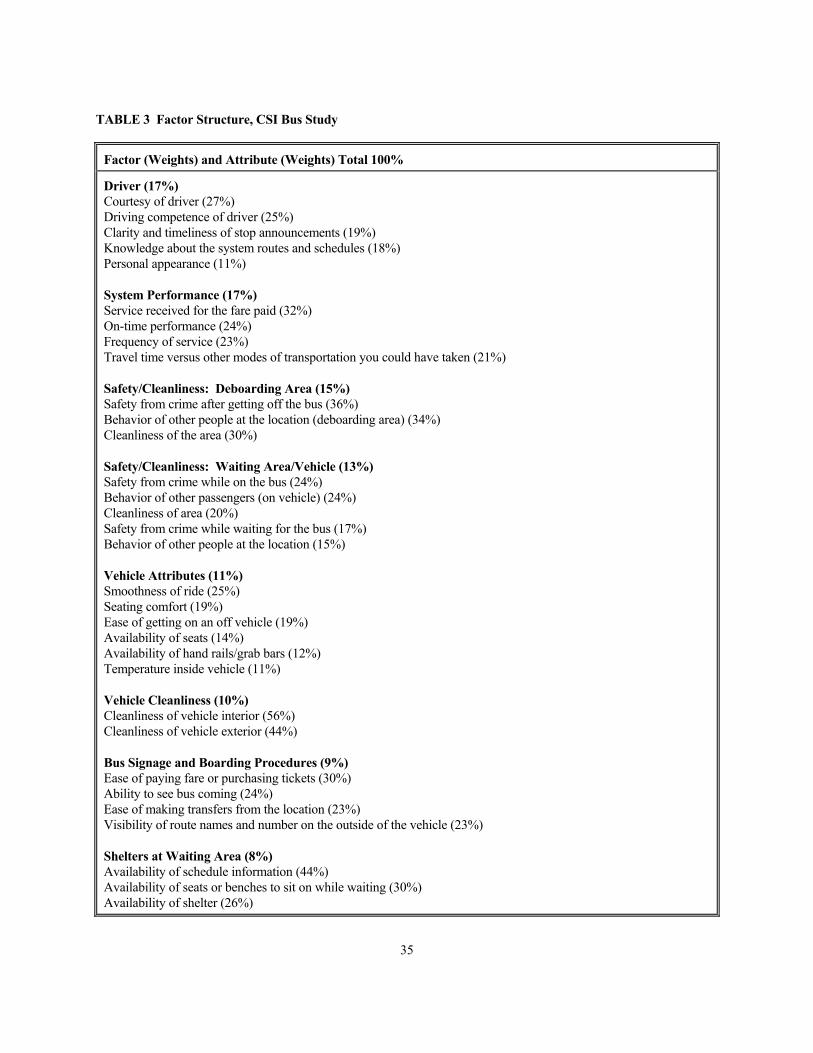
contributing to overall satisfaction. Table 3 lists the factors and their weights, and the corresponding attributes and their
weights.
The two most important factors, "Driver" and "System Performance", combined account for over one-third of
overall satisfaction. Three of the factors, "Safety/Cleanliness-Deboarding Area", "Safety/Cleanliness of Waiting
Area/Vehicle", and "Vehicle Cleanliness", directly relate to safety and also contribute to over one-third of overall
satisfaction. Statistical analyses of this study indicates that there is a direct correlation between perceived safety and
cleanliness. Passengers equate cleanliness with their personal safety from crime and the behavior of other people on the
buses and at bus stops.
The remaining three factors, "Vehicle Attributes", "Bus Signage and Boarding Procedures", and "Shelters at
Waiting Area", are also associated with customer satisfaction but are of less importance to transit customers. Even
13
though these factors are of "less importance," it does not mean that transit districts should neglect these areas. Rather, it
is more likely that the transit districts in this study are already meeting customers' needs in these areas, though not to
equal degrees. Should the districts' performance begin to weaken, it is likely that these factors would then increase in
their importance for determining overall customer satisfaction.
The initial factor analysis identified two additional factors that were not found to significantly influence customer
satisfaction. They are "Phone Access" (where you wait for or deboard the bus) and "Parking" (spaces where you catch
the bus).
Table 4 list the eight factors and their weights for the total sample and for the five transit districts in the study.
Because of the relatively small base size of respondents in each city (100), some of the factors do not significantly
correlate with overall satisfaction in each of the test cities. The factor weights that are noted with an asterisk are
statistically calculated estimates of what the contribution would be if the sample size was larger (minimum of 200
respondents per city).
It should be noted that, although each factor is statistically independent, improving performance on one factor (or an
important attribute) can favorably impact scores in other areas. For example, a transit district may choose to improve
the "Driver" factor and realize an improvement in the "System Performance" factor.
Overall Satisfaction and Factor Index Scores
Table 5 lists overall satisfaction index scores and index scores for each of the eight factors, for the total sample and for
each transit property. When looking at the overall satisfaction index scores and the individual factor index scores,
MRTA (Akron) captured the number one position. MRTA's first place ranking is the result of high scores in six of the
eight factors contributing to customer satisfaction, a tie with MCTO (Minneapolis) in four, and a second place rank in
the remaining two factors. Although MRTA's performance is impressive, it should be noted that there is a significant
gap between MRTA's index scores and the maximum possible index scores, indicating that there is still opportunity to
improve in each area.
MCTO (Minneapolis) and TRI-MET (Portland) received strong second and third place rankings (110 and 106
respectively). MCTO's second place performance is attributed to above average rankings in all eight factors (highest
14
scores on two factors). TRI-MET is in a very close third place, with above average scores on all factors and is on par
with the two leaders on five out of eight factors.
SEPTA (Philadelphia) and CTA (Chicago) finished fourth and fifth, respectively. SEPTA's position is primarily
due to below average index scores in each of the eight factors that are associated with overall satisfaction. Chicago's
low index score is the result of last place rankings in each of the eight factors.
It is important to note that the three transit district that are "above" average (over 100) of a group of five, are
markedly different in size and character than the two districts "below" average. In other words, it appears that two
distinct "segments" have formed. This development is not a great surprise and indicates that the greatest benefits
individual districts and the industry can gain from this type of research will be derived when a wider representation of
transit districts is involved and data can be analyzed in total and on a segment basis as well.
Loyalty and Satisfaction Discriminate Analysis
Table 6 illustrates the relationship between customer loyalty and overall customer satisfaction. The data indicates that
loyalty ratings for bus users increase precipitously as overall customer satisfaction levels rise. Therefore, the primary
goal in each of the transit districts should be to elevate customer satisfaction levels among bus users to the highest
levels.
Table 7 lists the top ten discriminators between “Somewhat Satisfied” respondents and “Very Satisfied”
respondents. The results indicate that to successfully move "Somewhat Satisfied" passengers to "Very Satisfied"
passengers, a transit property must focus on improving the following attributes:
1. Courtesy of bus drivers
2. Availability of seats
3. Safety from crime after getting off the bus
4. Ease of getting on/off the vehicle
5. Service received for the fare paid
15
Table 8 lists the top discriminators between “Neither Satisfied Nor Dissatisfied” respondents and “Somewhat
Satisfied” respondents. To move those who were "Neither Satisfied Nor Dissatisfied" to "Somewhat Satisfied" the
results indicate that attention should be paid to the following attributes:
1. Behavior of other people at the deboarding location
2. Service received for the fare paid
3. Driving competence of the driver
4. Smoothness of ride
5. Seating comfort
Table 9 lists the top discriminators between "Very Dissatisfied/Somewhat Dissatisfied" respondents and “Neither
Satisfied Nor Dissatisfied” respondents. To move those who are "Very Dissatisfied/Somewhat Dissatisfied" to "Neither
Satisfied Nor Dissatisfied", transit districts must focus on improving the following attributes:
1. Frequency of service
2. Cleanliness of vehicle interior
3. Safety from crime while on the bus
4. Behavior of other people at the boarding location
5. Knowledge of the driver about the system, routes and schedules
Prioritization of Improvement Opportunities
The following summarizes the high priority improvement opportunities yielded from this analysis for the transit
districts participating in the bus segment of the study. See Table 1 for definition of prioritization categories.
MRTA - Akron:
Because MRTA’s scores are the highest and second highest among the participating districts in all areas, there are no
Priority 1 opportunities to pursue. However, Akron should leverage off its strengths by improving the following factors
that fall within the Priority 2 category:
16
• “Vehicle Attributes”
• “Safety/Cleanliness: Deboarding Area”
MCTO - Minneapolis:
MCTO demonstrates strong performance in all areas, and has no Priority 1 opportunities to pursue. MCTO should
focus on improving the following factors that fall within the Priority 2 category:
• “System Performance”
• “Safety/Cleanliness: Waiting Area/Vehicle”
TRI-MET - Portland:
Tri-Met ranks above average and performs well in all areas and has no Priority 1 opportunities to pursue. Instead, focus
should be placed on improving the following Priority 2 factors that are of importance to customers in Portland:
• “System Performance”
• “Driver”
• “Safety/Cleanliness: Waiting Area/Vehicles”
SEPTA - Philadelphia:
SEPTA scored below average in all areas and therefore, focus should be placed on improving both the following
Priority 1 and 2 factors that are of importance to customers in Philadelphia:
• “Driver”
• “Vehicle Attributes”
• “System Performance”
CTA - Chicago:
CTA scored below average in all areas, and as a result Chicago has an opportunity to improve customer satisfaction by
focusing attention on improving the following Priority 1 and 2 factors:
• “Shelters at Waiting Area”
• “Safety/Cleanliness: Deboarding Area”
17
• “Driver”
• “System Performance”
Light Rail Study
A total of 200 light rail interviews were conducted for this demonstration project; one hundred interviews for SEPTA
(Philadelphia) and 100 for TRI-MET (Portland).
Overall Satisfaction Analysis
Overall customer satisfaction among light rail passengers for both TRI-MET and SEPTA was at respectable levels,
4.64 and 3.88 respectively (See Table 10 for details). Almost all (94%) of TRI-MET's light rail users indicated that
they were "Somewhat Satisfied” or “Very Satisfied" with their last ride. The majority (74%) ranked themselves in the
highest category, "Very Satisfied." At SEPTA, 71% of light rail riders indicated that they were "Somewhat Satisfied”
or “Very Satisfied" with their last ride. Nearly one-third (31%) rated themselves "Very Satisfied" with their last light
rail ride.
The low percentage of respondents who are "Neither Satisfied Nor Dissatisfied" or "Dissatisfied", indicates that the
transit districts involved in this study will benefit from focusing improvement efforts to maintain "Very Satisfied"
passengers at their current level, and moving those who are "Somewhat Satisfied" to "Very Satisfied."
Factor and Regression Analyses
18
Data from the 200 interviews underwent factor and regression analysis to determine the factors that most influenced
overall customer satisfaction for light rail and the relative weight each factor possessed. Six factors emerged as
contributing to overall satisfaction.. Table 10 lists the six factors and their weights, and the corresponding attributes
and their weights. The three most important factors, "Vehicle Attributes", “Safety”, and "System Performance" account
for over almost two-thirds of overall customer satisfaction. The remaining three factors that contribute to overall
customer satisfaction are "Stations", "Operator/Conductor", and "Phone Access”.
Table 12 lists the six factors and their weights for the total sample and for the two transit districts participating in the
light rail study. Results indicate that "Vehicle Attributes" and "Operator/Conductor" factors are more highly associated
with customer satisfaction among SEPTA's light rail passengers. "System Performance", "Stations", and "Phone
Access" are more important to TRI-MET customers. "Safety" issues are very important to light rail passengers in both
districts, although to a higher degree for TRI-MET passengers.
Overall Satisfaction and Factor Index Scores
Overall satisfaction index scores and index scores for each of the six independent factors, were produced for both
transit districts in the light rail study. Table 13 lists index scores for the total sample and for the two transit districts.
When looking at the overall satisfaction index scores and the individual factor index scores, TRI-MET is ahead of
SEPTA on "Overall Satisfaction" as a result of higher scores in each of the six factors. Although TRI-MET's
performance is impressive, it should be noted that there is a significant gap between TRI-MET's index scores and the
maximum possible scores, indicating that there is still opportunity to improve in each area, most notably in the "Safety"
area
As was the case in the bus study, the performance gap between TRI-MET and SEPTA is most likely reflective of
the size and character differences between the two transit districts. Again, this development was predictable and
indicates that a wider representation of districts providing light rail services will enable researchers to analyze the data
in total and on a "segment" basis.
Loyalty Analysis and Satisfaction Discriminate Analysis
19
Table 14 shows the relationship between customer loyalty and overall customer satisfaction. The data indicates that
loyalty ratings for bus users increases precipitously as satisfaction levels increase. Hence, the primary goal in both
districts should be to elevate customer satisfaction levels among light rail passengers.
Table 15 lists the top ten discriminators between “Somewhat Satisfied” respondents and “Very Satisfied”
respondents for the light rail study. To successfully move "Somewhat Satisfied" passengers to "Very Satisfied"
passengers, a transit property must excel in all areas. However the greatest benefits can be gained by improving the
following attributes:
1. Smoothness of ride
2. Cleanliness of vehicle interior
3. Cleanliness of vehicle exterior
4. Ease of making transfers from the station
5. Clarity and timeliness of stop announcements
Table 16 lists the top discriminators between “Neither Satisfied Nor Dissatisfied” respondents and “Somewhat
Satisfied” respondents. To move those who were "Neither Satisfied Nor Dissatisfied" to "Somewhat Satisfied", the
following attributes should be improved:
1. Line for purchasing tickets of paying fares
2. Availability of car parking spaces
3. Temperature inside the vehicle
4. On-time performance
5. Cleanliness of vehicle exterior
Table 17 lists the top discriminators between "Very Dissatisfied/Somewhat Dissatisfied" respondents and “Neither
Satisfied Nor Dissatisfied” respondents. To move those who are "Very Dissatisfied/Somewhat Dissatisfied" to "Neither
Satisfied Nor Dissatisfied", transit districts must focus on improving the following attributes:
1. Ease of making transfers from the station
2. Behavior of other people at the train station (deboarding area)
20
3. Behavior of other passengers (on train)
4. Courtesy of the operator/conductor
5. Behavior of other people at the train station (waiting area)
Prioritization of Improvement Opportunities
The following summarizes the high priority improvement opportunities yielded from this analysis for TRI-MET and
SEPTA (See Table 1 for prioritization chart).
TRI-MET - Portland:
Because of TRI-MET’s high scores, no Priority 1 improvements should be pursued. Instead, TRI-MET should
leverage off its’ strengths by improving the following factors that are of Priority 2 importance to customers in Portland:
• “System Performance”
• “Safety”
• “Phone Access”
• “Stations”
SEPTA - Philadelphia:
Because SEPTA scores below average they should focus on improving the following factors that are of Priority 1
importance to the customers in Philadelphia:
• “Vehicle Attributes”
• “Operator/Conductor”
• “Safety”
Heavy Rail Study
A total of 200 heavy rail interviews were conducted; 100 for SEPTA (Philadelphia) and 100 for CTA (Chicago).
21
Overall Satisfaction Analysis
Overall customer satisfaction among heavy rail passengers for SEPTA and CTA are at respectable levels and on the
positive side, 3.74 and 3.98 respectively (See Table 18 for details). Two-thirds (66%) of CTA's heavy rail users
indicted that they were either "Very Satisfied" (36%) or "Somewhat Satisfied" (30%) with their last ride. Eighty
percent of SEPTA's heavy rail users indicated that they were either "Very Satisfied" (33%) or "Somewhat Satisfied"
(47%) with SEPTA's heavy rail service. As was found in the bus and light rail segments of this report, few respondents
were dissatisfied with the service received in the heavy rail test cities. This finding indicates that both districts will
make the greatest gains by maintaining "Very Satisfied" passengers and moving "Somewhat Satisfied" passengers into
the "Very Satisfied" category.
Factor and Regression Analysis
Data from the 200 heavy rail interviews underwent factor and regression analysis to determine the factors that most
influenced overall customer satisfaction and the relative weight each factor possessed. Seven factors emerged as
contributing to overall satisfaction with heavy rail transit. Table 19 lists the seven factors and their weights, and the
corresponding attributes and their weights. The three most important factors, "System Performance",
"Operator/Conductor", and “Safety”, combined account for over sixty percent of overall customer satisfaction. The
remaining four factors that contribute to overall customer satisfaction are "Waiting Area at Station", "Vehicle
Attributes", “Passenger Behavior”, and "Phone Access”, respectively. The initial factor analysis also identified one
additional factor that was not found to significantly influence customer satisfaction, which was "Parking Availability"
at the station where respondents catch their trains.
Table 20 lists the seven factors and their weights for the total sample and the two transit districts. Results show that
“Operator/Conductor", "System Performance" are the factors most closely associated with customer satisfaction among
SEPTA's heavy rail passengers. Of moderate importance to SEPTA riders was "Waiting Area At Station" and "Safety".
22
"System Performance", and "Safety" are the two factors most important to CTA passengers, followed by
"Operator/Conductor" and "Phone Access".
Overall Satisfaction and Factor Index Scores Because SEPTA and CTA performed at parity in each of the factors contributing to overall satisfaction, index scores
could not be produced for the heavy rail study.
Loyalty Analysis and Satisfaction Discriminate Analysis
Table 21 illustrates the relationship between customer loyalty and overall customer satisfaction. The data indicates that
loyalty ratings for bus users increases precipitously as satisfaction levels increase. Therefore, the primary goal in both
districts should be to elevate overall customer satisfaction levels among heavy rail passengers to the highest levels.
Table 22 lists the top ten discriminators between “Somewhat Satisfied” respondents and “Very Satisfied”
respondents for the heavy rail study. To successfully move "Somewhat Satisfied" passengers to "Very Satisfied"
passengers, a transit property will obtain the greatest benefits by focusing on the following attributes:
1. Seating comfort
2. Service received for the fare paid
3. Cleanliness of vehicle interior
4. Behavior of other people at the train station (deboarding area)
5. Cleanliness of stations (waiting area)
Table 23 lists the top discriminators between “Neither Satisfied Nor Dissatisfied” respondents and “Somewhat
Satisfied” respondents. To move respondents who were "Neither Satisfied Nor Dissatisfied" to "Somewhat Satisfied"
the following attributes should be improved:
1. Travel time versus other modes of transportation you could have taken
2. Cleanliness of station (deboarding area)
3. Ease of getting on and off the vehicle
4. Access to pay phone (deboarding area)
23
5. Availability of car parking space
Table 24 lists the top discriminators between "Very Dissatisfied/Somewhat Dissatisfied" respondents and “Neither
Satisfied Nor Dissatisfied” respondents. To move those who are "Very Dissatisfied/Somewhat Dissatisfied" to "Neither
Satisfied Nor Dissatisfied", transit districts must focus on the following attributes:
1. Courtesy of the operator/conductor
2. Behavior of other people at the train station (deboarding area)
3. Courtesy and helpfulness of station staff (waiting area)
4. Service received for the fare paid
5. Safety from crime while waiting at the station
Prioritization of Improvement Opportunities Analysis
Because the two transit districts participating in the heavy rail study were rated so closely, neither district’s attributes
scores are rated significantly below the sample average, which is a criteria for Priority 1. Therefore, by definition no
improvements opportunites can be classified as Priority 1. However, Priority 2 improvement opportunities, where
factor importance is high and attribute scores are equal to the sample average, could be yielded for the heavy rail study.
The following summarizes the Priority 2 improvement opportunities for CTA and SEPTA:
CTA - Chicago:
Highest priority should be placed on the following Priority 2 factors that are of most importance to customers in
Chicago:
• “System Performance”
• “Safety”
• “Operator/Conductor”
• “Phone Access”
SEPTA - Philadelphia:
Focus should be placed on the following Priority 2 factors that are of most importance to SEPTA riders:
24
• “Operator/Conductor”
• “System Performance”
• “Waiting Area at Station”
• “Safety”
PLANS FOR IMPLEMENTATION
This pilot program has demonstrated that a common measurement can be used across transit districts to assist transit
districts in (1) understanding the needs of their customers, (2) determining their performance individually and relative
to other districts, (3) targeting improvement opportunities, (4) formulating solutions to service problems, and (5)
monitoring the progress of improvement programs over time.
The greatest benefits from this research will increase as time goes by. The series of attributes and their factors can
improve as more data is gathered across a wide variety of districts. Also, future versions of the questionnaire can
evolve and become more and more applicable to a cross-section of transit properties. As the data bank increases, better
demographics, ridership, usage, and attitude measures can be studied. However, for this to occur, development work
must continue. The investigators envision a near-term and long-term approach to implementation of this research
technique in the transit industry:
In the near-term and on a continuing basis, the investigators will work with individual agencies (and their
consultants) wishing to implement this type of research program. The investigators have developed guidelines for
adoption of the CSI methodology for individual transit agencies. The guidelines are detailed in Appendix A.
Representatives from a number of districts have indicated a great deal of interest in this technique and it's usefulness for
customer satisfaction. The investigators will encourage districts to use the same methodology, the same questionnaire,
and the same data analysis so that results can be compared uniformly from district to district.
The long-term intention is to attempt to recreate the index, with more transit districts, larger sample sizes, more
attributes, and open-ended questions to find out "why" respondents may or may not recommend transit to others, or
"what improvements" respondents would most like their transit districts to implement. The next study would provide a
25
deeper level of data, would represent a true "industry" index, and would provide true "peer" comparisons for
participating transit districts. Investigators anticipate the long-term objective could be accomplished in two years.
The investigators presented the IDEA project at the TRB Annual Meeting in January 1995. As a result of that
presentation, the investigators have received requests for presentations of the IDEA project results from numerous
transit districts, oversight bodies and transit associations.
CONCLUSIONS
Results from this demonstration research program successfully illustrated the feasibility of using a common
measurement of customer satisfaction to assist decision makers in transit achieve a better fit between the features of
transit services and the needs of customers. The measurement used in this project (the CSI) provided total sample and
"peer" scores against which participating transit districts could compare their results.
In looking at the results from an overall perspective (across cities and modes studied), it can be said that customer
satisfaction with mass transit is generally good. However, as satisfaction levels decline among transit users, there is a
significant reduction in customer loyalty in terms of using transit again or recommending transit to a friend or relative.
Therefore, to improve transit's image and increase ridership among current and potential customers, transit districts
must focus on moving people from "Somewhat Satisfied" to "Very Satisfied" levels.
To accomplish this task, emphasis should be placed on improving those attributes that separate "Somewhat
Satisfied" respondents from "Very Satisfied" respondents. The attributes that separate "Somewhat Satisfied"
respondents from "Very Satisfied" respondents are those associated with the courtesy of the drivers/operators,
availability and comfort of seats, frequency of service, safety from crime while waiting for buses and trains, safety from
crime while riding on public transit, and the cleanliness of transit vehicles, train stations and bus stops.
It is important to note that "Safety" (or security) issues are intricately tied to "Cleanliness." Vehicles, bus stops and
train stations that obtained higher "cleanliness" ratings also carry an increased perception of safety -- safety in terms of
personal safety at bus stops and train stations, safety while riding transit vehicles, and the behavior of other people on
transit and at train stations and bus stops.
26
Results from this pilot study highlight the size and character differences between the transit districts in this study.
Specifically, when looking at the index results, it is of great interest to see that districts of similar size and character are
rated similarly. In other words, "segments" form. This was true across all modes studied.
This development was in keeping with the investigators assumptions and illustrates the fact that, a greater benefit to
individual districts and the industry will be gained when a wider representation of transit districts is involved and the
data can be analyzed in total and on a segment basis as well. However, this is not to say that districts of varying size
cannot learn from one another. One of the purposes of this work is to identify those transit properties generating
excellent customer satisfaction results and learn from them. Excellent customer service is not necessarily a function of
district size -- rather it is the result of an agency's ability and commitment to matching their services to the needs of the
customer.
Follow-up interviews with the research teams in the five transit districts, have indicated that the primary use of
results from this project have been: (1) to create and/or promote customer satisfaction programs, (2) compare data
collection techniques with existing customer satisfaction measurement programs, and (3) help direct budget
expenditures for vehicle maintenance and service expansion.
The successful conclusion of this study marks the first step the transit industry has taken to establish customer
satisfaction benchmarks against which transit services can be realistically delivered. Much more work needs to be done
in this area to increase the predictive power of the model designed in this project and to develop a research program that
can easily make the transition from local to national levels and maintain value at each level. The investigators will
work with researchers from other transit districts to design future studies that will include larger sample sizes (200-500
interviews per mode, per city), compare modal differences within cities, and expand demographic and attitudinal
information. The follow-on research planned under a Transit Cooperative Research Project (FY '95, Project B-11)
"Customer-Defined Transit Service Quality" is designed to provide answers to several of the specific issues identified
in the Transit IDEA project and broaden the application of the CSI concept developed in the Transit IDEA project..
APPENDIX A APPENDIX A
GUIDELINES FOR ADOPTION OF CSI METHODOLOGY FOR INDIVIDUAL DISTRICTS
27
This demonstration project included multiple transit districts for the purposes of deriving an overall index. In the
absence of data from other transit districts, individual agencies can use the methodology described in this study to
design a useful customer satisfaction research program for their own individual districts. The following guidelines are
offered to adapt this CSI methodology for use in individual districts:
Initial Steps
1. Define the objectives for conducting the study.
2. Identify management decisions to be made as a result of the information derived from the study.
3. Determine the scope (modes and geographic area) of the investigation.
4. Identify available funds. Costs to conduct a study such as this can vary from district to district and can be
influenced by the number of interviews desired, incidence rate by mode, telephone interview method used (computer
assisted or pencil/paper), questionnaire length, the number of open end questions included, the amount of analysis
requested, and vendor competition.
Methodology To Use For Collecting Data
Conduct a telephone survey, using random-digit-dialing in the test area. Only residential number should be used in the
survey. Interviews should be conducted using a computer assisted telephone interviewing (CATI).package
Sample
Survey should include at least 200 respondents per mode studied. Respondents should be at least 16 years of age and
should have ridden the city's transit system at least once (one way) in the month prior to the study.
Questionnaire
28
Use one common questionnaire to collect the data, with programming adjustments to accommodate differences
between modes studied. The following areas of inquiry are suggested:
• Overall Satisfaction with bus/rail experience using a 5-point scale (5 = "Very Satisfied" to 1 = "Very
Dissatisfied")
• Measurement of districts' performance on 35-40 attributes using a 5-point scale (5 = "Excellent" to 1 = "Poor")
• Likelihood of using bus/rail again
• Reasons for using transit (closed)
• Demographics (gender, age, income, length of time living in the area)
If a respondent's last bus or rail trip required more than one vehicle, they were asked to rate only "the very last" bus
or rail vehicle they rode.
A copy of the questionnaire used in this study can be found in Appendix C. The length of the questionnaire
averaged 14 minutes. Depending on the scope of the survey and the budget available, open-end questions could be
added that would enrich the data concerning "loyalty" questions. Questions such as:
• "What one thing would you like (your district) to change?"
• "Why would you recommend/not recommend this service to a friend or family member?"
Approaches to Analyze Data
Individual agencies can analyze their data in a number of ways and the following outlines some of the most common
approaches. This research methodology is not a "one-size-fits-all" approach to research, but is designed to be a flexible
tool, applicable to a variety of situations. Thus, the following list should not be interpreted as a comprehensive list of
analytical options available to researchers.
Overall Satisfaction Analysis
29
The overall satisfaction question is the heart of this research method. Respondents are asked to indicate their level of
satisfaction with their last transit experience. Responses range from "Very Satisfied" to "Very Dissatisfied". The data
is used:
• To determine the distribution of overall customer satisfaction with transit service along the "Very Satisfied" to
"Very Dissatisfied" scale, and
• As the dependent variable against which independent factors are regressed to determine which factors are
most closely associated with customer satisfaction (See Factor and Regression Analysis below).
Factor and Regression Analysis
In the questionnaire respondents are asked to rate their transit district’s performance on 35-40 attributes. Mean scores
for each transit attribute can be subjected to a factor analysis, which statistically groups the attributes into independent
factors. The independent factors can then be regressed against the dependent variable, which is overall customer
satisfaction. This step assigns weights to each factor, which reflects each factor's contribution to overall customer
satisfaction.
Overall Satisfaction Index Scores and Factor Index Scores
To build an index would require the participation of more than one transit district. Index scores indicate the degree
to which each transit district is different from the total sample average of all participating districts. The index scores
indicate how far above or below average an agency is rated. For example, an index score of 125 indicates a rating 25%
above the total sample average. The customer satisfaction indices that were built for this IDEA project were created
using J.D. Power and Associates’ Index Formula. The creation of the index formula is not included in this report,
because it is proprietary information of J.D. Power and Associates. Should a group of transit districts wish to replicate
the index, then J.D. Power could be contacted, or another vendor could be contacted to develop an alternative form of
indexing. Index scores are built through the following process:
30
1. Independent factors and the weight of each factor are derived using the factor and regression analyses
described above.
2. Using the CSI formula, indices are generated for both overall customer satisfaction and for each of the factors.
The maximum possible index score represents what the score would be for a factor if each of the attributes
comprising that factor was given an "Excellent" rating by all participating respondents. Crucial factors (those most
heavily weighted), where the gap is the greatest between the highest index score and the maximum possible index
score, represents an opportunity for improvement.
Loyalty Analysis
Customer loyalty (will use again or recommend to a friend) as it relates to overall satisfaction is a useful analysis. Data
can be used by transit agency researchers to determine if and to what degree loyalty increases as overall satisfaction
levels increase.
Satisfaction Discriminate Analysis
A satisfaction discriminate analysis can be performed to compare attributes performance scores between different levels
of overall customer satisfaction. To discriminate between two levels of overall satisfaction, the average attribute means
scores for one level of satisfaction can be compared, on a side-by-side basis, to the average attribute mean scores for
another level. Then, for each attribute, significance testing (T-test) can be conducted to determine if there are
statistically significant differences between the two levels. The resulting T-scores can be ranked from highest to lowest.
Highest scores indicate the areas where the greatest degree of difference exists between levels and indicates the
greatest opportunity for improvement in customer satisfaction.
The following overall customer satisfaction level comparisons are suggested for satisfaction discriminate analyses:
1. "Somewhat Satisfied" versus those who are "Very Satisfied"
2. "Neither Satisfied Nor Dissatisfied" versus those who are "Somewhat Satisfied"
31
3. "Very Dissatisfied/Somewhat Dissatisfied" versus those who are "Neither Satisfied Nor Dissatisfied"
Prioritization of Improvement Opportunities
To prioritize improvement opportunities, it is necessary to examine what a transit system "does well" versus "not so
well" within the context of what is truly important to the customer. This can be done by analyzing the importance (the
weight) of a factor to overall customer satisfaction and by comparing the attribute scores within that factor against the
total sample average scores. For example, if a factor is weighted high (17% or above) then it is highly importance to
overall customer satisfaction. Yet, if the attributes scores that comprise that factor are significantly below the total
sample average scores, then a transit system is not performing well within the context of what is truly important to the
customer. Therefore, high priority should be placed on improving the attributes that comprise that factor. This would
constitute a Priority 1 improvement opportunity.
Table 1 defines the four priority levels that were developed for the IDEA project. Priority 2 opportunities would
focus on improving attributes where the scores are equal to or above the total sample average scores and where factor
importance is high or moderate. Less benefit to individual agencies would be derived by focusing on Priorities 3 and 4
where factor importance is moderate or low and attribute scores are equal to or above the total sample average.
Segmentation Analysis
Segments of a population can be compared and contrasted. For example, analyses can be performed to determine
overall satisfaction levels between "Occasional" and "Frequent" riders, "Commuters" and "Non-commuters", or,
satisfaction by Number of Transfers, by Gender, or by Geographic Region.
Tracking Analysis
Tracking studies can be conducted to determine the effectiveness that improvement strategies have on customer
satisfaction for a transit district and, ultimately, on ridership.

32
APPENDIX B
THE J.D. POWER AND ASSOCIATES INDEX METHODOLOGY AND THE ANALYSIS CONDUCTED
FOR THE IDEA STUDY
Discussion of Statistical Analysis:
The Index methodology is a model of the industry under examination. The modeling process provides importance
weights. Models based on derived importance highlight variables that co-vary with some overall measure of
satisfaction. The greater the degree of co-variation (that is "correlation") the greater the importance.
The most salient advantage of modeling importance is the provision of goodness of fit statistics. Goodness of fit
statistics provide a means of evaluating how well the model predicts, or alternatively how well the battery of questions
in the questionnaire capture the nature of the market under examination. Two goodness of fit statistics are the Percent
of Variance accounted for when predicting overall satisfaction, and the Spearman Rank Order correlation of the
Predicted values of overall satisfaction and the actual values of overall satisfaction. For all models in the CSI
demonstration project, the Percent of variance accounted for is in the mid 30's. The Spearman Rank Order correlation's
are all 1.0. This means the current models are sufficient to accurately predict the rank order of overall satisfaction by
city within mode of transit system. Scores such as these are considered a good beginning and not an unusual "first run"
for a study of this size and design. However, more work needs to be done with larger sample sizes and more transit
districts to fully define the structures of the various transit modes. As the experience increases within the industry,
stronger scores can be expected.
The modeling process involves a regression analysis where overall satisfaction is predicted by respondent answers
to a battery of questions concerning their transit experience. Regression procedures require that the predicting variables
have little to no intercorrelations (that is, the "multicolineartity" problem). Violation of multicolinearity constraints can
lead to highly misleading results. In order to remove the intercorrelations, a statistical procedure called the Principal
Components analysis is performed (Factor Analysis is often used as a generic name for this procedure).
33
Principal Components provides a transformation that removes the intercorrelations among the predictor variables.
This process finds variables that have strong intercorrelations and creates a composite variable containing the
information in the intercorrelated set. The end result is a series of groups, for factors, that have been adjusted to have
zero correlation with each other. These factors, representing independent chunks of information, are then regressed to
the overall satisfaction variable. The resultant regression weights are proportioned to one hundred percent.
Knowing that a factor such as "Safety/Cleanliness: Boarding Area" for the bus modality accounts for 15% of
overall satisfaction is an interesting finding. However, each factor consists of several elements, and it would be nice to
know how the importance of each individual variable within each factor. In order to provide those weights, a second
principal components analysis is performed among each factors elements. Thus, the analysis is being used to
statistically remove the intercorrelations among the individual variables within each factor. Once the variables are
transformed to independence, they are regressed to the overall satisfaction variable. This provides weights for each
individual variable. With the bus modality as an example, the "Safety/Cleanliness: Boarding Area" factor accounts for
15% of the total variation, and of that 15%, the three variables in that factor account for 5.4, 4.5 and 5.1 percent of the
factor total.
This analysis completes most of the modeling procedure. Each variable has a weight, and each factor (grouping of
variables) has a weight. Using these weights and each respondent's scores on the individual variable, an additive
models is constructed. The additive model is centered so the overall mean score is 100 with a spread of some number
of points. The resultant model provides a scaled overall predicted value of overall satisfaction (the "Index"), and values
for each of the factors isolated (the "measures").
The calculation of the factor weights are often performed on different segments of the market. For example,
commuters and non-commuters. This provides important information on how importance may vary as a function
different target groups.
34
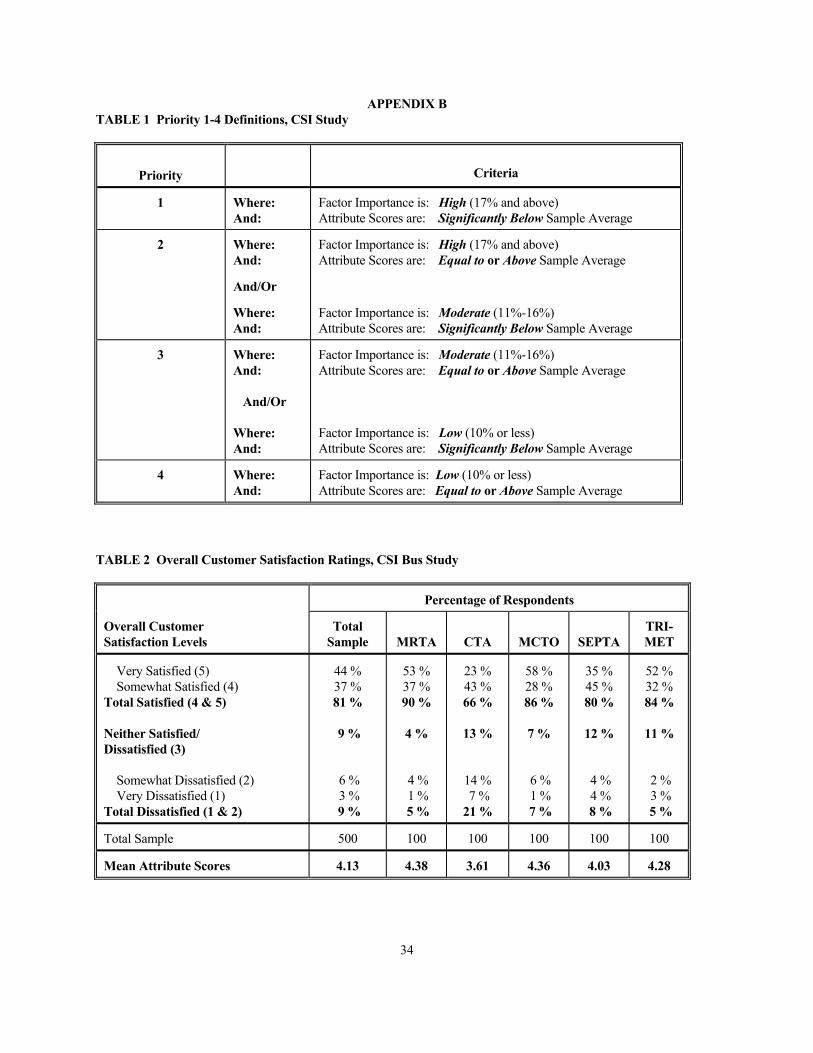
APPENDIX B TABLE 1 Priority 1-4 Definitions, CSI Study
Priority
Criteria
1 Where: And:
Factor Importance is: High (17% and above) Attribute Scores are: Significantly Below Sample Average
2 Where: And:
And/Or
Where: And:
Factor Importance is: High (17% and above) Attribute Scores are: Equal to or Above Sample Average
Factor Importance is: Moderate (11%-16%) Attribute Scores are: Significantly Below Sample Average
3 Where: And: And/Or Where: And:
Factor Importance is: Moderate (11%-16%) Attribute Scores are: Equal to or Above Sample Average Factor Importance is: Low (10% or less) Attribute Scores are: Significantly Below Sample Average
4 Where: And:
Factor Importance is: Low (10% or less) Attribute Scores are: Equal to or Above Sample Average
TABLE 2 Overall Customer Satisfaction Ratings, CSI Bus Study
Percentage of Respondents
Overall Customer Satisfaction Levels
Total Sample
MRTA
CTA
MCTO
SEPTA
TRI-MET
Very Satisfied (5) Somewhat Satisfied (4) Total Satisfied (4 & 5) Neither Satisfied/ Dissatisfied (3) Somewhat Dissatisfied (2) Very Dissatisfied (1) Total Dissatisfied (1 & 2)
44 % 37 % 81 %
9 %
6 % 3 % 9 %
53 % 37 % 90 %
4 %
4 % 1 % 5 %
23 % 43 % 66 %
13 %
14 % 7 % 21 %
58 % 28 % 86 %
7 %
6 % 1 % 7 %
35 % 45 % 80 %
12 %
4 % 4 % 8 %
52 % 32 % 84 %
11 %
2 % 3 % 5 %
Total Sample 500 100 100 100 100 100
Mean Attribute Scores 4.13 4.38 3.61 4.36 4.03 4.28
35
TABLE 3 Factor Structure, CSI Bus Study
Factor (Weights) and Attribute (Weights) Total 100%
Driver (17%) Courtesy of driver (27%) Driving competence of driver (25%) Clarity and timeliness of stop announcements (19%) Knowledge about the system routes and schedules (18%) Personal appearance (11%) System Performance (17%) Service received for the fare paid (32%) On-time performance (24%) Frequency of service (23%) Travel time versus other modes of transportation you could have taken (21%) Safety/Cleanliness: Deboarding Area (15%) Safety from crime after getting off the bus (36%) Behavior of other people at the location (deboarding area) (34%) Cleanliness of the area (30%) Safety/Cleanliness: Waiting Area/Vehicle (13%) Safety from crime while on the bus (24%) Behavior of other passengers (on vehicle) (24%) Cleanliness of area (20%) Safety from crime while waiting for the bus (17%) Behavior of other people at the location (15%) Vehicle Attributes (11%) Smoothness of ride (25%) Seating comfort (19%) Ease of getting on an off vehicle (19%) Availability of seats (14%) Availability of hand rails/grab bars (12%) Temperature inside vehicle (11%) Vehicle Cleanliness (10%) Cleanliness of vehicle interior (56%) Cleanliness of vehicle exterior (44%) Bus Signage and Boarding Procedures (9%) Ease of paying fare or purchasing tickets (30%) Ability to see bus coming (24%) Ease of making transfers from the location (23%) Visibility of route names and number on the outside of the vehicle (23%) Shelters at Waiting Area (8%) Availability of schedule information (44%) Availability of seats or benches to sit on while waiting (30%) Availability of shelter (26%)
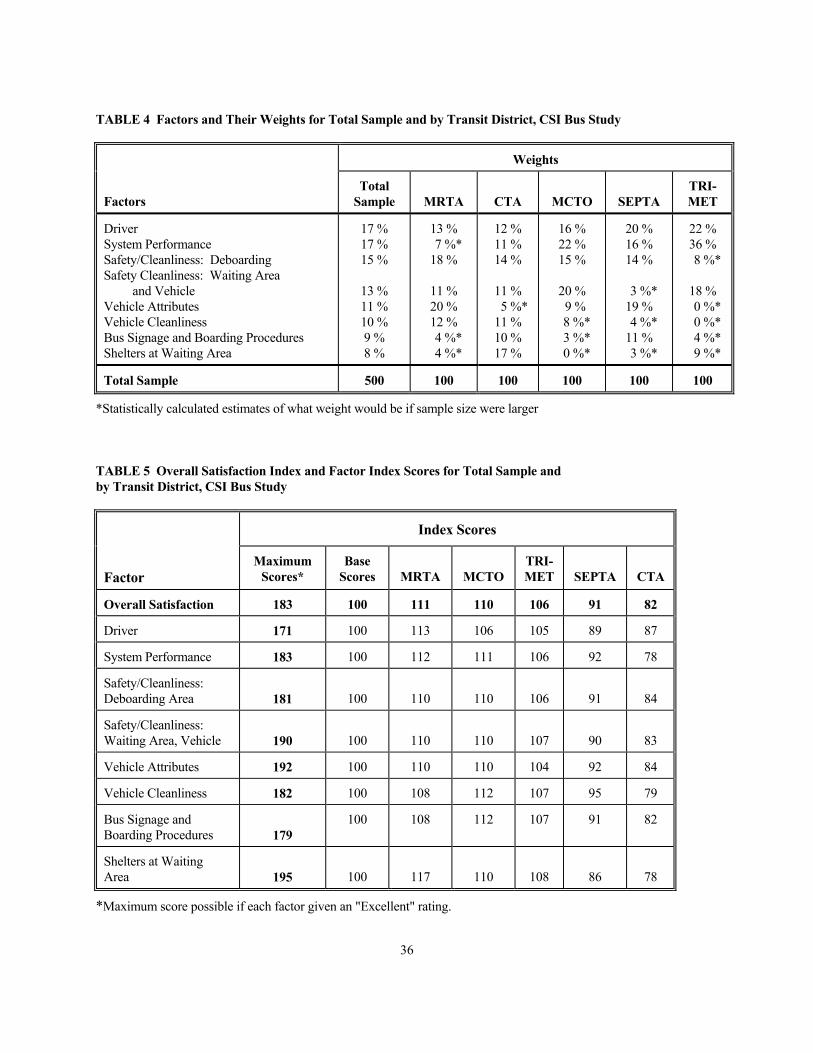
36
TABLE 4 Factors and Their Weights for Total Sample and by Transit District, CSI Bus Study
Weights
Factors
Total Sample
MRTA
CTA
MCTO
SEPTA
TRI-MET
Driver System Performance Safety/Cleanliness: Deboarding Safety Cleanliness: Waiting Area and Vehicle Vehicle Attributes Vehicle Cleanliness Bus Signage and Boarding Procedures Shelters at Waiting Area
17 % 17 % 15 %
13 % 11 % 10 % 9 % 8 %
13 % 7 %* 18 %
11 % 20 % 12 %
4 %* 4 %*
12 % 11 % 14 %
11 %
5 %* 11 % 10 % 17 %
16 % 22 % 15 %
20 % 9 %
8 %* 3 %* 0 %*
20 % 16 % 14 %
3 %* 19 %
4 %* 11 %
3 %*
22 % 36 %
8 %*
18 % 0 %* 0 %* 4 %* 9 %*
Total Sample 500 100 100 100 100 100
*Statistically calculated estimates of what weight would be if sample size were larger TABLE 5 Overall Satisfaction Index and Factor Index Scores for Total Sample and by Transit District, CSI Bus Study
Index Scores
Factor
Maximum Scores*
Base Scores
MRTA
MCTO
TRI-MET
SEPTA
CTA
Overall Satisfaction 183 100 111 110 106 91 82
Driver 171 100 113 106 105 89 87
System Performance 183 100 112 111 106 92 78
Safety/Cleanliness: Deboarding Area
181
100
110
110
106
91
84
Safety/Cleanliness: Waiting Area, Vehicle
190
100
110
110
107
90
83
Vehicle Attributes 192 100 110 110 104 92 84
Vehicle Cleanliness 182 100 108 112 107 95 79
Bus Signage and Boarding Procedures
179
100 108 112 107 91 82
Shelters at Waiting Area
195
100
117
110
108
86
78
*Maximum score possible if each factor given an "Excellent" rating.
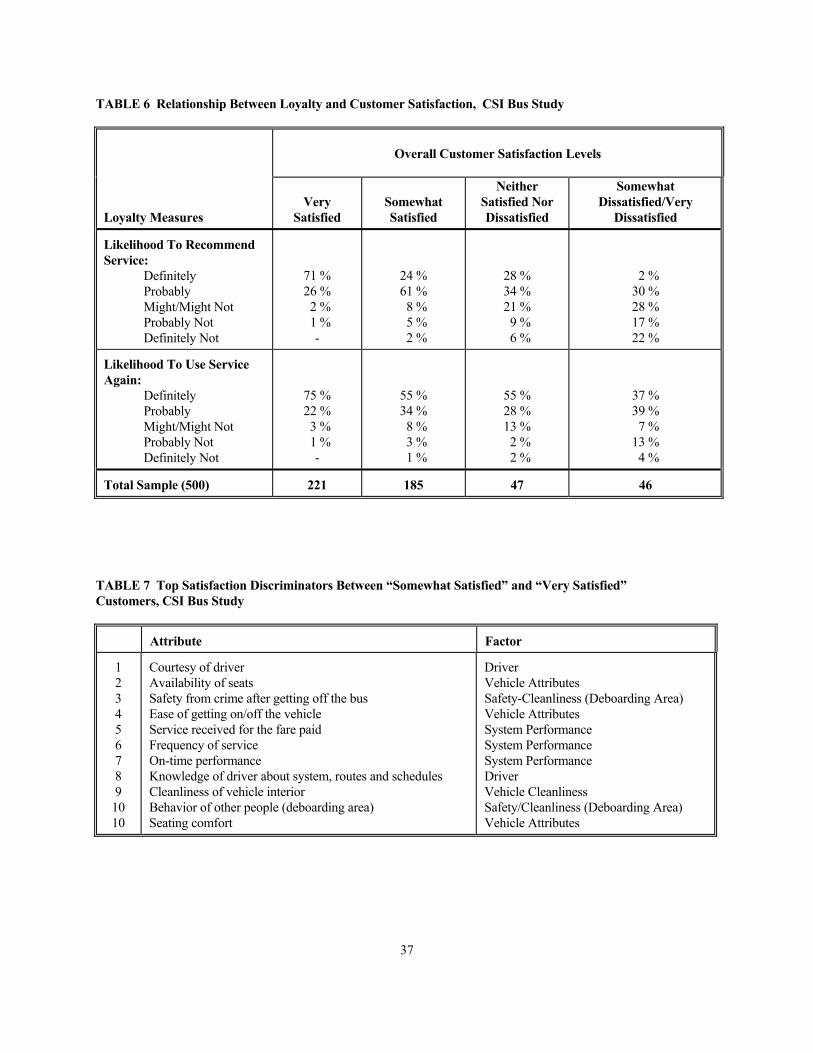
37
TABLE 6 Relationship Between Loyalty and Customer Satisfaction, CSI Bus Study
Overall Customer Satisfaction Levels
Loyalty Measures
Very
Satisfied
Somewhat Satisfied
Neither Satisfied Nor Dissatisfied
Somewhat Dissatisfied/Very
Dissatisfied
Likelihood To Recommend Service:
Definitely Probably Might/Might Not Probably Not Definitely Not
71 % 26 % 2 % 1 %
-
24 % 61 % 8 % 5 % 2 %
28 % 34 % 21 % 9 % 6 %
2 % 30 % 28 % 17 % 22 %
Likelihood To Use Service Again:
Definitely Probably Might/Might Not Probably Not Definitely Not
75 % 22 % 3 % 1 %
-
55 % 34 % 8 % 3 % 1 %
55 % 28 % 13 % 2 % 2 %
37 % 39 % 7 % 13 % 4 %
Total Sample (500) 221 185 47 46
TABLE 7 Top Satisfaction Discriminators Between “Somewhat Satisfied” and “Very Satisfied” Customers, CSI Bus Study
Attribute Factor
1 2 3 4 5 6 7 8 9 10 10
Courtesy of driver Availability of seats Safety from crime after getting off the bus Ease of getting on/off the vehicle Service received for the fare paid Frequency of service On-time performance Knowledge of driver about system, routes and schedules Cleanliness of vehicle interior Behavior of other people (deboarding area) Seating comfort
Driver Vehicle Attributes Safety-Cleanliness (Deboarding Area) Vehicle Attributes System Performance System Performance System Performance Driver Vehicle Cleanliness Safety/Cleanliness (Deboarding Area) Vehicle Attributes
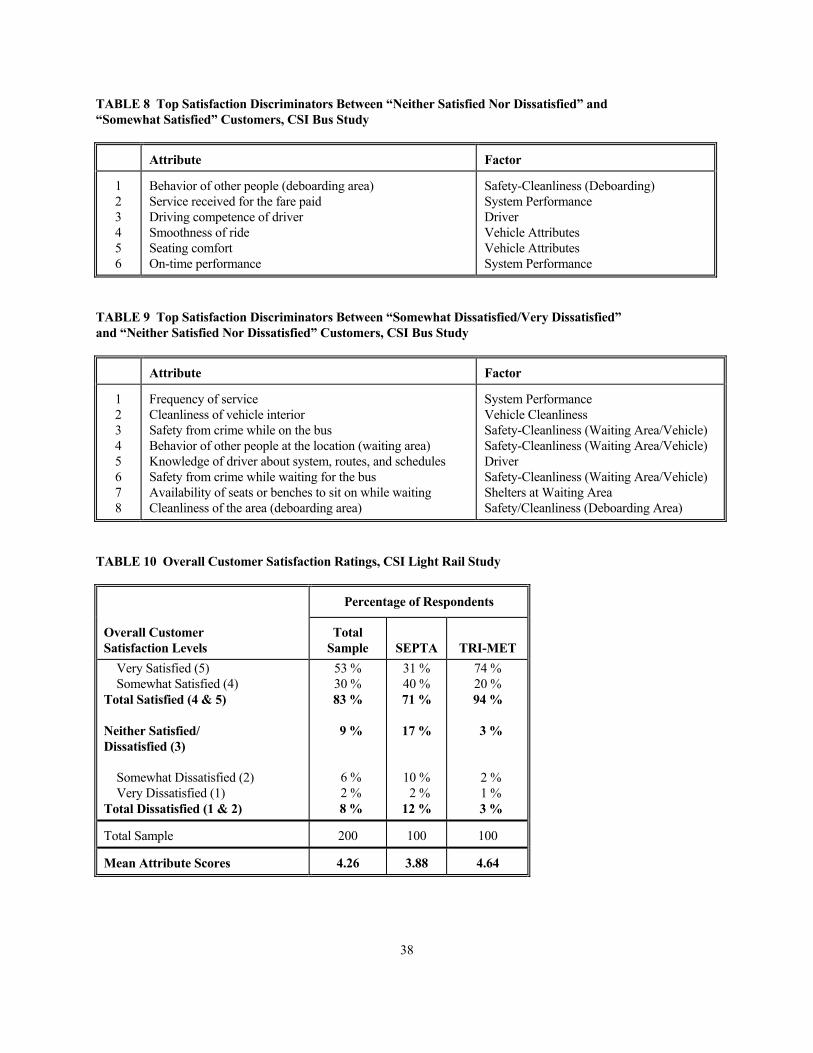
38
TABLE 8 Top Satisfaction Discriminators Between “Neither Satisfied Nor Dissatisfied” and “Somewhat Satisfied” Customers, CSI Bus Study
Attribute Factor
1 2 3 4 5 6
Behavior of other people (deboarding area) Service received for the fare paid Driving competence of driver Smoothness of ride Seating comfort On-time performance
Safety-Cleanliness (Deboarding) System Performance Driver Vehicle Attributes Vehicle Attributes System Performance
TABLE 9 Top Satisfaction Discriminators Between “Somewhat Dissatisfied/Very Dissatisfied” and “Neither Satisfied Nor Dissatisfied” Customers, CSI Bus Study
Attribute Factor
1 2 3 4 5 6 7 8
Frequency of service Cleanliness of vehicle interior Safety from crime while on the bus Behavior of other people at the location (waiting area) Knowledge of driver about system, routes, and schedules Safety from crime while waiting for the bus Availability of seats or benches to sit on while waiting Cleanliness of the area (deboarding area)
System Performance Vehicle Cleanliness Safety-Cleanliness (Waiting Area/Vehicle) Safety-Cleanliness (Waiting Area/Vehicle) Driver Safety-Cleanliness (Waiting Area/Vehicle) Shelters at Waiting Area Safety/Cleanliness (Deboarding Area)
TABLE 10 Overall Customer Satisfaction Ratings, CSI Light Rail Study
Percentage of Respondents
Overall Customer Satisfaction Levels
Total Sample
SEPTA
TRI-MET
Very Satisfied (5) Somewhat Satisfied (4) Total Satisfied (4 & 5) Neither Satisfied/ Dissatisfied (3) Somewhat Dissatisfied (2) Very Dissatisfied (1) Total Dissatisfied (1 & 2)
53 % 30 % 83 %
9 %
6 % 2 % 8 %
31 % 40 % 71 %
17 %
10 % 2 % 12 %
74 % 20 % 94 %
3 %
2 % 1 % 3 %
Total Sample 200 100 100
Mean Attribute Scores 4.26 3.88 4.64
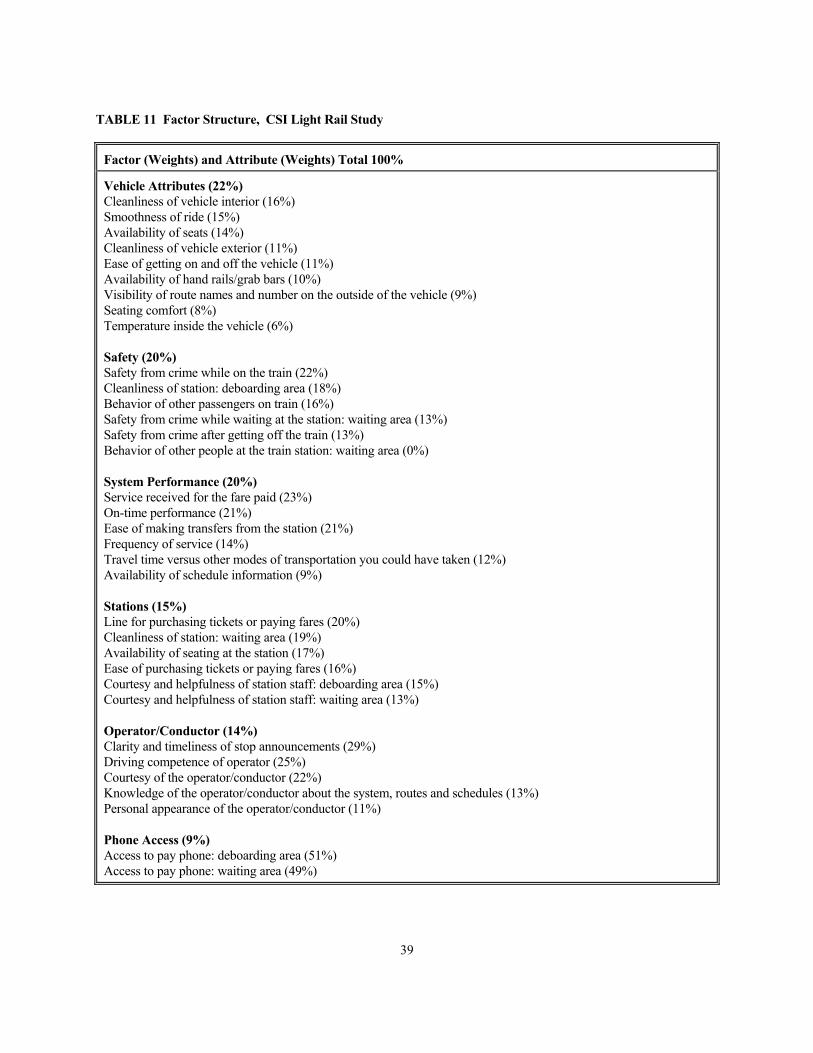
39
TABLE 11 Factor Structure, CSI Light Rail Study
Factor (Weights) and Attribute (Weights) Total 100%
Vehicle Attributes (22%) Cleanliness of vehicle interior (16%) Smoothness of ride (15%) Availability of seats (14%) Cleanliness of vehicle exterior (11%) Ease of getting on and off the vehicle (11%) Availability of hand rails/grab bars (10%) Visibility of route names and number on the outside of the vehicle (9%) Seating comfort (8%) Temperature inside the vehicle (6%) Safety (20%) Safety from crime while on the train (22%) Cleanliness of station: deboarding area (18%) Behavior of other passengers on train (16%) Safety from crime while waiting at the station: waiting area (13%) Safety from crime after getting off the train (13%) Behavior of other people at the train station: waiting area (0%) System Performance (20%) Service received for the fare paid (23%) On-time performance (21%) Ease of making transfers from the station (21%) Frequency of service (14%) Travel time versus other modes of transportation you could have taken (12%) Availability of schedule information (9%) Stations (15%) Line for purchasing tickets or paying fares (20%) Cleanliness of station: waiting area (19%) Availability of seating at the station (17%) Ease of purchasing tickets or paying fares (16%) Courtesy and helpfulness of station staff: deboarding area (15%) Courtesy and helpfulness of station staff: waiting area (13%) Operator/Conductor (14%) Clarity and timeliness of stop announcements (29%) Driving competence of operator (25%) Courtesy of the operator/conductor (22%) Knowledge of the operator/conductor about the system, routes and schedules (13%) Personal appearance of the operator/conductor (11%) Phone Access (9%) Access to pay phone: deboarding area (51%) Access to pay phone: waiting area (49%)
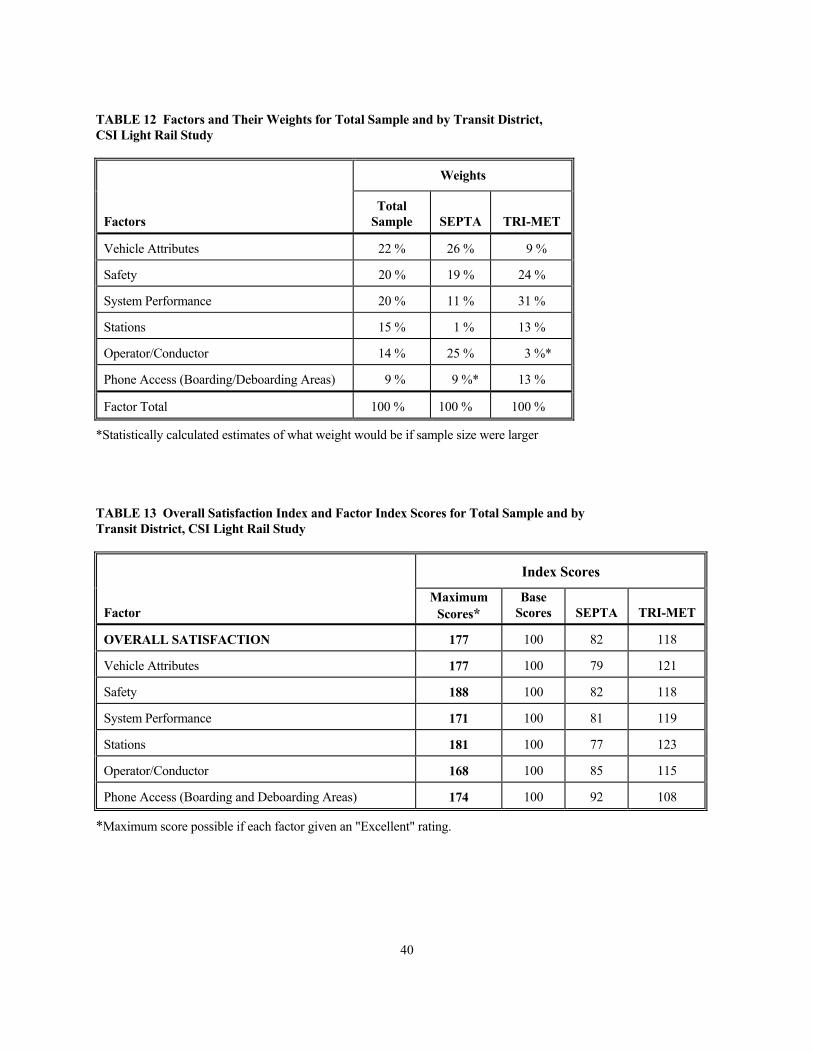
40
TABLE 12 Factors and Their Weights for Total Sample and by Transit District, CSI Light Rail Study
Weights
Factors
Total Sample
SEPTA
TRI-MET
Vehicle Attributes 22 % 26 % 9 %
Safety 20 % 19 % 24 %
System Performance 20 % 11 % 31 %
Stations 15 % 1 % 13 %
Operator/Conductor 14 % 25 % 3 %*
Phone Access (Boarding/Deboarding Areas) 9 % 9 %* 13 %
Factor Total 100 % 100 % 100 %
*Statistically calculated estimates of what weight would be if sample size were larger TABLE 13 Overall Satisfaction Index and Factor Index Scores for Total Sample and by Transit District, CSI Light Rail Study
Index Scores
Factor
Maximum Scores*
Base Scores
SEPTA
TRI-MET
OVERALL SATISFACTION 177 100 82 118
Vehicle Attributes 177 100 79 121
Safety 188 100 82 118
System Performance 171 100 81 119
Stations 181 100 77 123
Operator/Conductor 168 100 85 115
Phone Access (Boarding and Deboarding Areas) 174 100 92 108
*Maximum score possible if each factor given an "Excellent" rating.
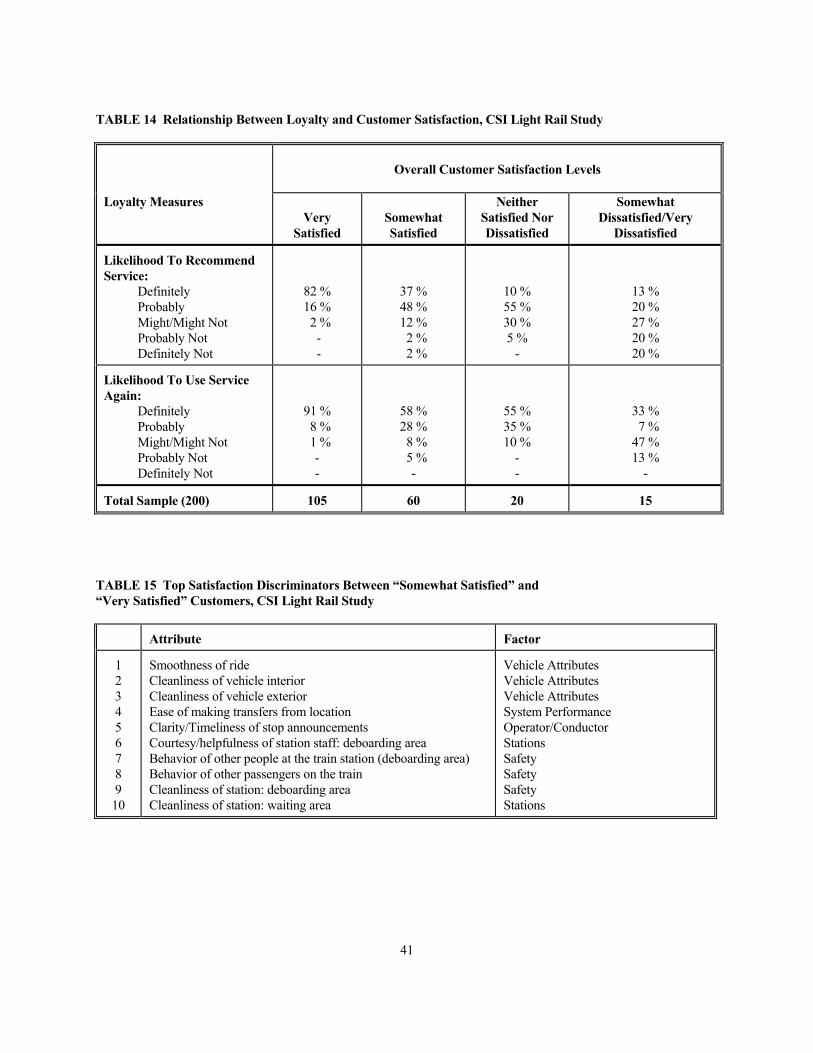
41
TABLE 14 Relationship Between Loyalty and Customer Satisfaction, CSI Light Rail Study
Overall Customer Satisfaction Levels
Loyalty Measures
Very
Satisfied
Somewhat Satisfied
Neither Satisfied Nor Dissatisfied
Somewhat Dissatisfied/Very
Dissatisfied
Likelihood To Recommend Service:
Definitely Probably Might/Might Not Probably Not Definitely Not
82 % 16 % 2 %
- -
37 % 48 % 12 % 2 % 2 %
10 % 55 % 30 % 5 %
-
13 % 20 % 27 % 20 % 20 %
Likelihood To Use Service Again:
Definitely Probably Might/Might Not Probably Not Definitely Not
91 % 8 % 1 %
- -
58 % 28 % 8 % 5 %
-
55 % 35 % 10 %
- -
33 % 7 % 47 % 13 %
-
Total Sample (200) 105 60 20 15
TABLE 15 Top Satisfaction Discriminators Between “Somewhat Satisfied” and “Very Satisfied” Customers, CSI Light Rail Study
Attribute Factor
1 2 3 4 5 6 7 8 9 10
Smoothness of ride Cleanliness of vehicle interior Cleanliness of vehicle exterior Ease of making transfers from location Clarity/Timeliness of stop announcements Courtesy/helpfulness of station staff: deboarding area Behavior of other people at the train station (deboarding area) Behavior of other passengers on the train Cleanliness of station: deboarding area Cleanliness of station: waiting area
Vehicle Attributes Vehicle Attributes Vehicle Attributes System Performance Operator/Conductor Stations Safety Safety Safety Stations
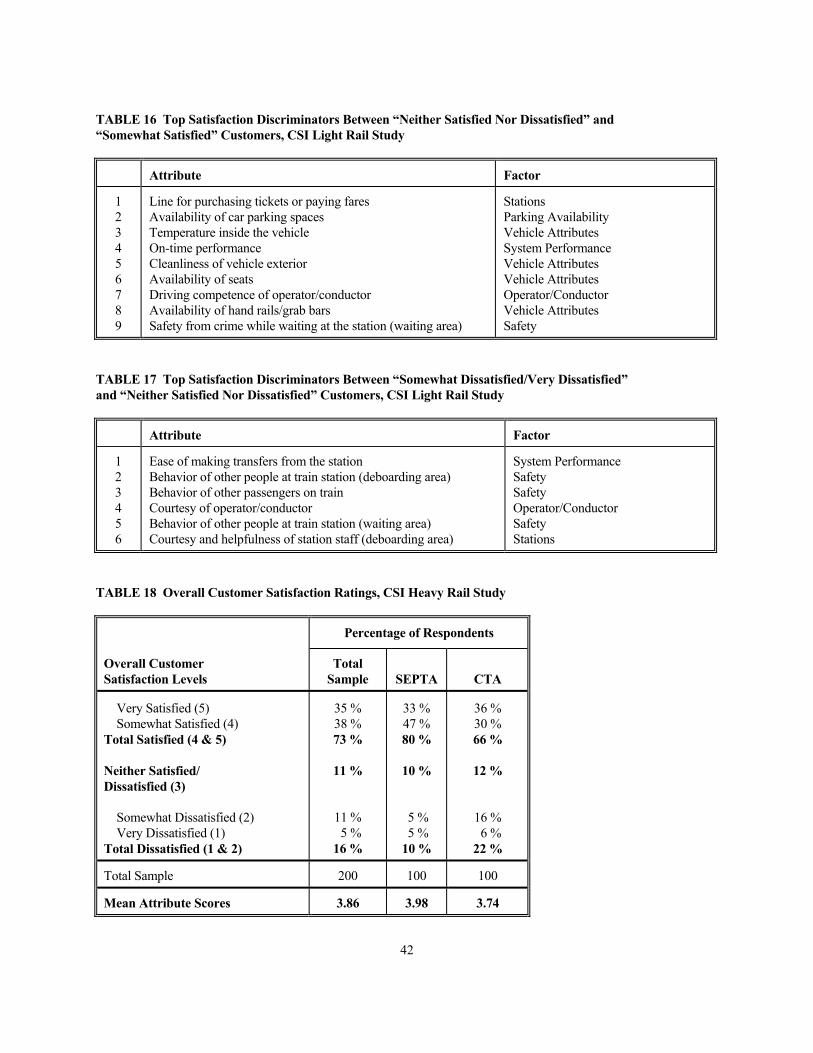
42
TABLE 16 Top Satisfaction Discriminators Between “Neither Satisfied Nor Dissatisfied” and “Somewhat Satisfied” Customers, CSI Light Rail Study
Attribute Factor
1 2 3 4 5 6 7 8 9
Line for purchasing tickets or paying fares Availability of car parking spaces Temperature inside the vehicle On-time performance Cleanliness of vehicle exterior Availability of seats Driving competence of operator/conductor Availability of hand rails/grab bars Safety from crime while waiting at the station (waiting area)
Stations Parking Availability Vehicle Attributes System Performance Vehicle Attributes Vehicle Attributes Operator/Conductor Vehicle Attributes Safety
TABLE 17 Top Satisfaction Discriminators Between “Somewhat Dissatisfied/Very Dissatisfied” and “Neither Satisfied Nor Dissatisfied” Customers, CSI Light Rail Study
Attribute Factor
1 2 3 4 5 6
Ease of making transfers from the station Behavior of other people at train station (deboarding area) Behavior of other passengers on train Courtesy of operator/conductor Behavior of other people at train station (waiting area) Courtesy and helpfulness of station staff (deboarding area)
System Performance Safety Safety Operator/Conductor Safety Stations
TABLE 18 Overall Customer Satisfaction Ratings, CSI Heavy Rail Study
Percentage of Respondents
Overall Customer Satisfaction Levels
Total Sample
SEPTA
CTA
Very Satisfied (5) Somewhat Satisfied (4) Total Satisfied (4 & 5) Neither Satisfied/ Dissatisfied (3) Somewhat Dissatisfied (2) Very Dissatisfied (1) Total Dissatisfied (1 & 2)
35 % 38 % 73 %
11 %
11 % 5 % 16 %
33 % 47 % 80 %
10 %
5 % 5 % 10 %
36 % 30 % 66 %
12 %
16 % 6 % 22 %
Total Sample 200 100 100
Mean Attribute Scores 3.86 3.98 3.74
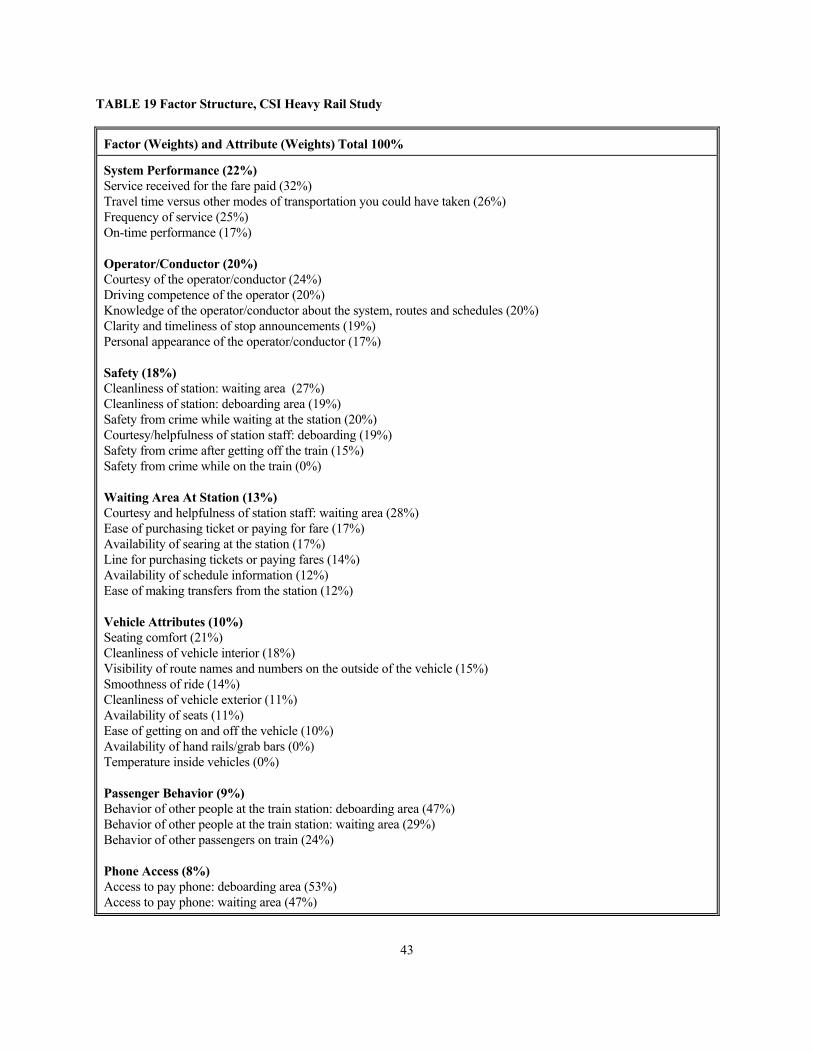
43
TABLE 19 Factor Structure, CSI Heavy Rail Study
Factor (Weights) and Attribute (Weights) Total 100%
System Performance (22%) Service received for the fare paid (32%) Travel time versus other modes of transportation you could have taken (26%) Frequency of service (25%) On-time performance (17%) Operator/Conductor (20%) Courtesy of the operator/conductor (24%) Driving competence of the operator (20%) Knowledge of the operator/conductor about the system, routes and schedules (20%) Clarity and timeliness of stop announcements (19%) Personal appearance of the operator/conductor (17%) Safety (18%) Cleanliness of station: waiting area (27%) Cleanliness of station: deboarding area (19%) Safety from crime while waiting at the station (20%) Courtesy/helpfulness of station staff: deboarding (19%) Safety from crime after getting off the train (15%) Safety from crime while on the train (0%) Waiting Area At Station (13%) Courtesy and helpfulness of station staff: waiting area (28%) Ease of purchasing ticket or paying for fare (17%) Availability of searing at the station (17%) Line for purchasing tickets or paying fares (14%) Availability of schedule information (12%) Ease of making transfers from the station (12%) Vehicle Attributes (10%) Seating comfort (21%) Cleanliness of vehicle interior (18%) Visibility of route names and numbers on the outside of the vehicle (15%) Smoothness of ride (14%) Cleanliness of vehicle exterior (11%) Availability of seats (11%) Ease of getting on and off the vehicle (10%) Availability of hand rails/grab bars (0%) Temperature inside vehicles (0%) Passenger Behavior (9%) Behavior of other people at the train station: deboarding area (47%) Behavior of other people at the train station: waiting area (29%) Behavior of other passengers on train (24%) Phone Access (8%) Access to pay phone: deboarding area (53%) Access to pay phone: waiting area (47%)
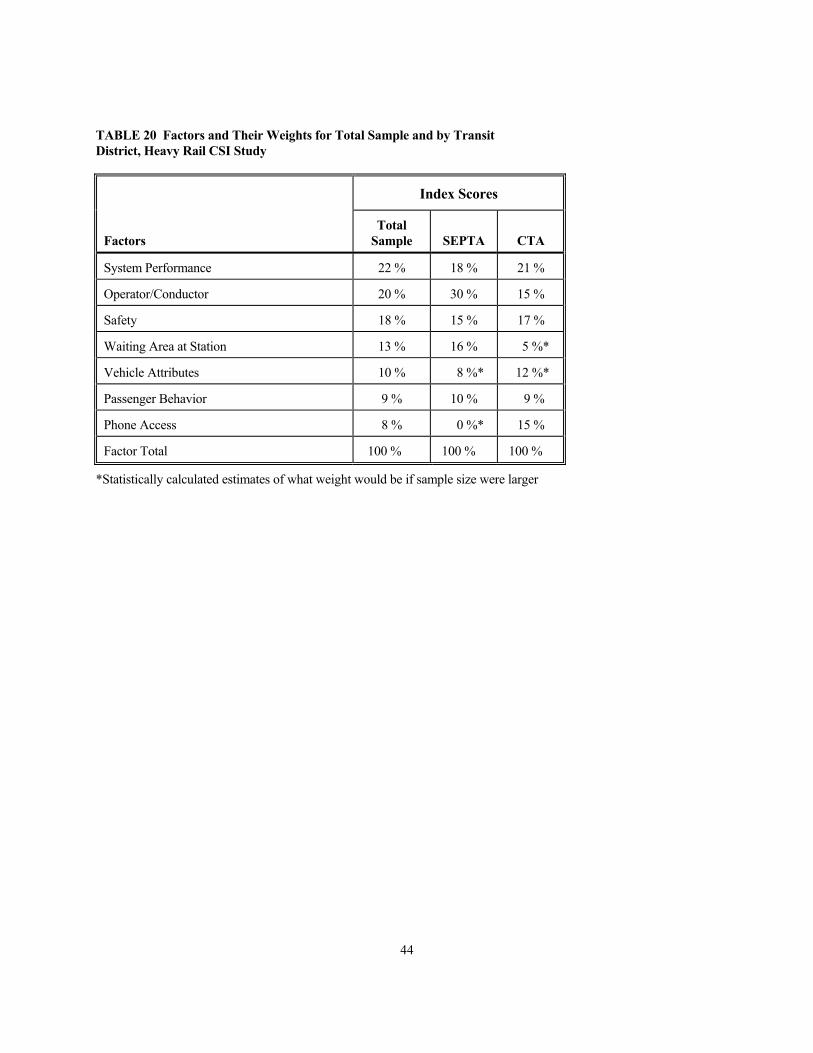
44
TABLE 20 Factors and Their Weights for Total Sample and by Transit District, Heavy Rail CSI Study
Index Scores
Factors
Total Sample
SEPTA
CTA
System Performance 22 % 18 % 21 %
Operator/Conductor 20 % 30 % 15 %
Safety 18 % 15 % 17 %
Waiting Area at Station 13 % 16 % 5 %*
Vehicle Attributes 10 % 8 %* 12 %*
Passenger Behavior 9 % 10 % 9 %
Phone Access 8 % 0 %* 15 %
Factor Total 100 % 100 % 100 %
*Statistically calculated estimates of what weight would be if sample size were larger
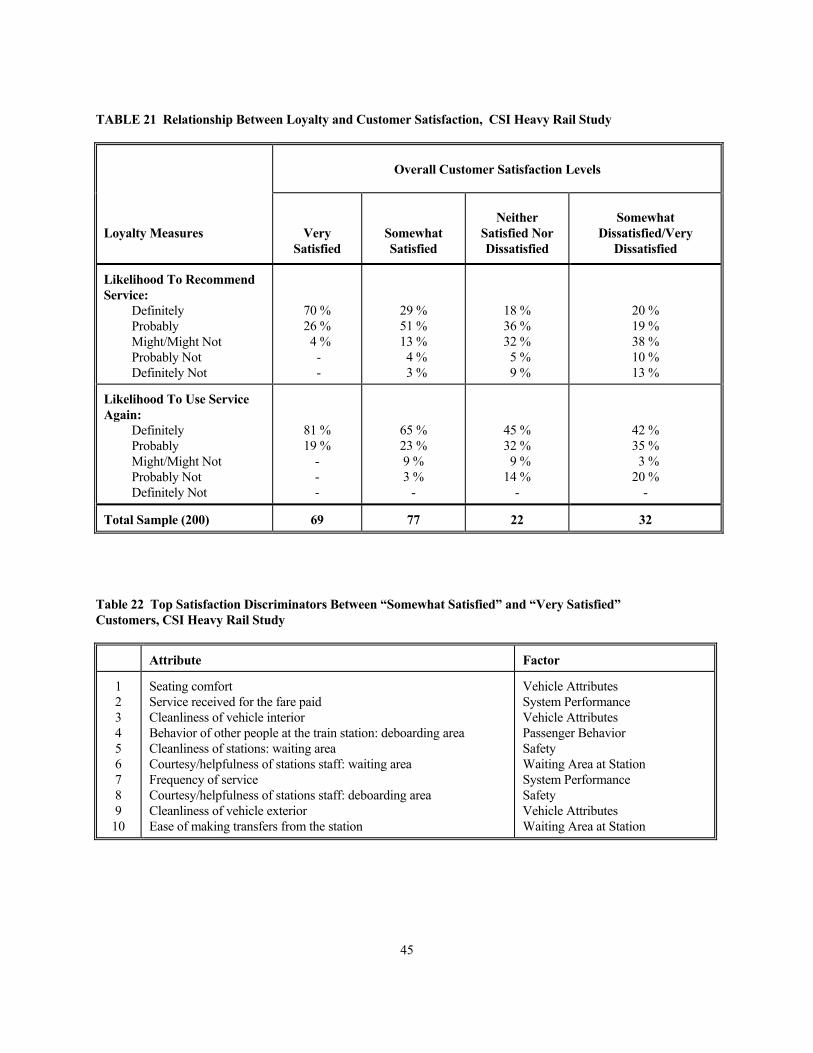
45
TABLE 21 Relationship Between Loyalty and Customer Satisfaction, CSI Heavy Rail Study
Overall Customer Satisfaction Levels
Loyalty Measures
Very Satisfied
Somewhat Satisfied
Neither
Satisfied Nor Dissatisfied
Somewhat
Dissatisfied/Very Dissatisfied
Likelihood To Recommend Service:
Definitely Probably Might/Might Not Probably Not Definitely Not
70 % 26 % 4 %
- -
29 % 51 % 13 % 4 % 3 %
18 % 36 % 32 % 5 % 9 %
20 % 19 % 38 % 10 % 13 %
Likelihood To Use Service Again:
Definitely Probably Might/Might Not Probably Not Definitely Not
81 % 19 %
- - -
65 % 23 % 9 % 3 %
-
45 % 32 % 9 % 14 %
-
42 % 35 % 3 % 20 %
-
Total Sample (200) 69 77 22 32
Table 22 Top Satisfaction Discriminators Between “Somewhat Satisfied” and “Very Satisfied” Customers, CSI Heavy Rail Study
Attribute Factor
1 2 3 4 5 6 7 8 9 10
Seating comfort Service received for the fare paid Cleanliness of vehicle interior Behavior of other people at the train station: deboarding area Cleanliness of stations: waiting area Courtesy/helpfulness of stations staff: waiting area Frequency of service Courtesy/helpfulness of stations staff: deboarding area Cleanliness of vehicle exterior Ease of making transfers from the station
Vehicle Attributes System Performance Vehicle Attributes Passenger Behavior Safety Waiting Area at Station System Performance Safety Vehicle Attributes Waiting Area at Station
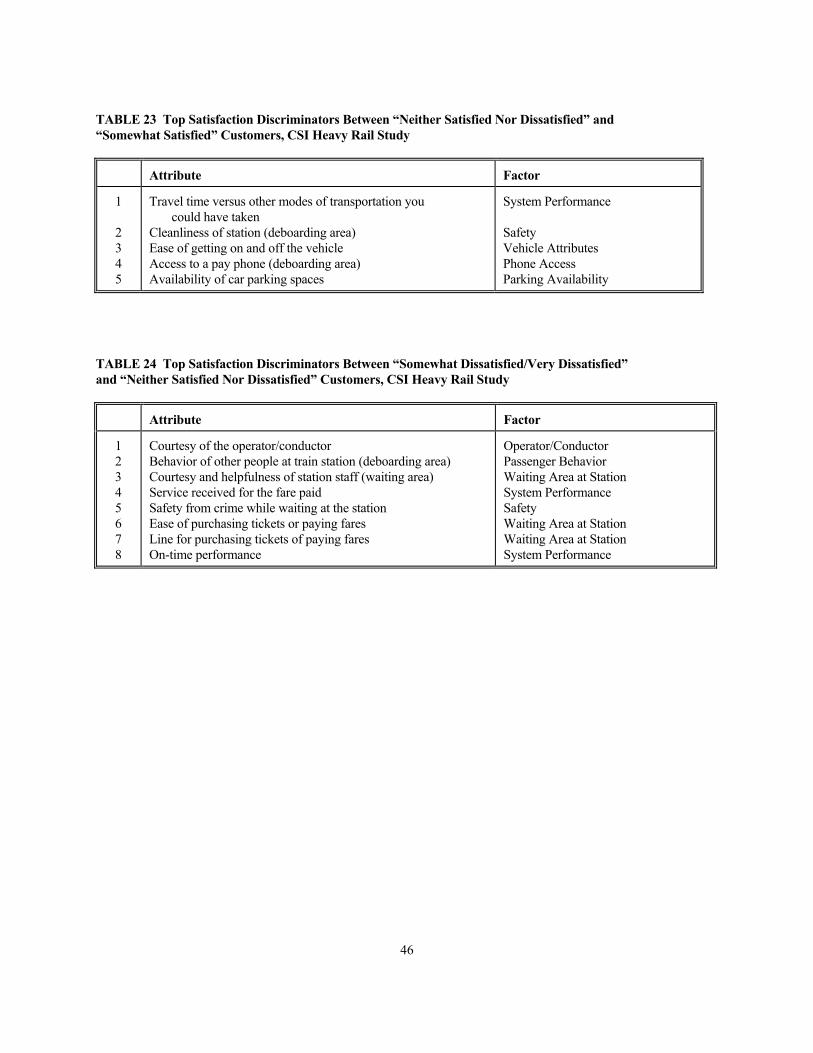
46
TABLE 23 Top Satisfaction Discriminators Between “Neither Satisfied Nor Dissatisfied” and “Somewhat Satisfied” Customers, CSI Heavy Rail Study
Attribute Factor
1 2 3 4 5
Travel time versus other modes of transportation you could have taken Cleanliness of station (deboarding area) Ease of getting on and off the vehicle Access to a pay phone (deboarding area) Availability of car parking spaces
System Performance Safety Vehicle Attributes Phone Access Parking Availability
TABLE 24 Top Satisfaction Discriminators Between “Somewhat Dissatisfied/Very Dissatisfied” and “Neither Satisfied Nor Dissatisfied” Customers, CSI Heavy Rail Study
Attribute Factor
1 2 3 4 5 6 7 8
Courtesy of the operator/conductor Behavior of other people at train station (deboarding area) Courtesy and helpfulness of station staff (waiting area) Service received for the fare paid Safety from crime while waiting at the station Ease of purchasing tickets or paying fares Line for purchasing tickets of paying fares On-time performance
Operator/Conductor Passenger Behavior Waiting Area at Station System Performance Safety Waiting Area at Station Waiting Area at Station System Performance
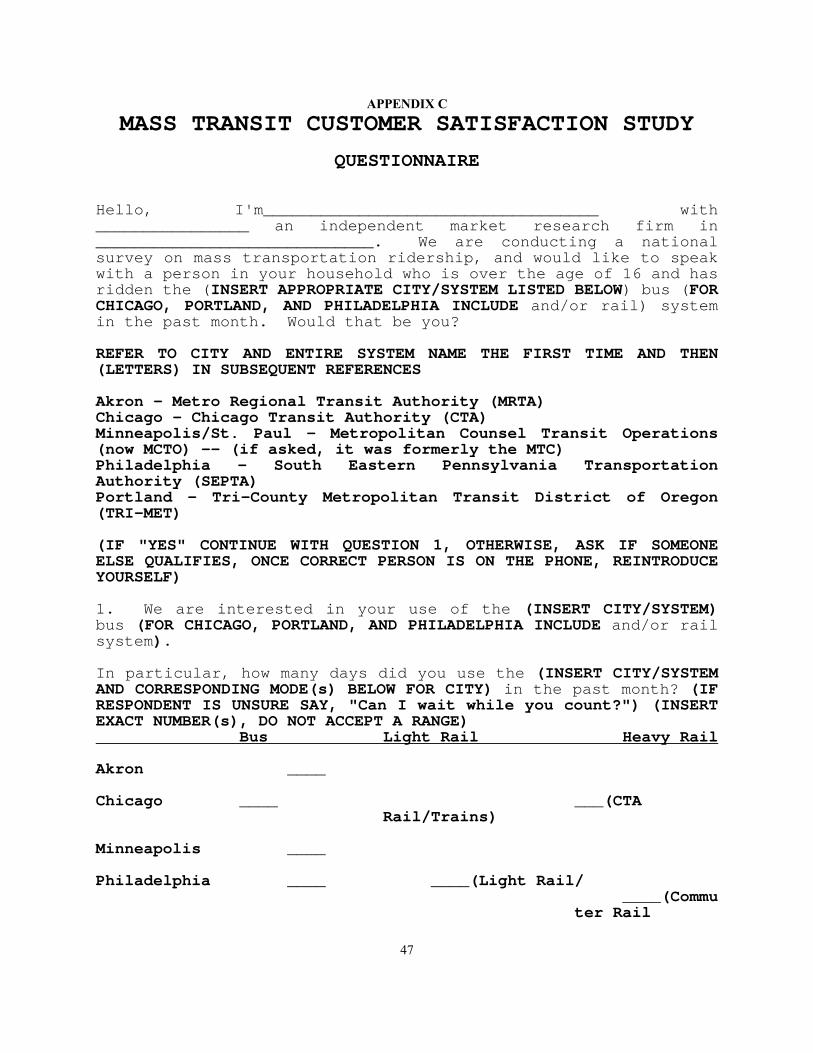
47
APPENDIX C
MASS TRANSIT CUSTOMER SATISFACTION STUDY
QUESTIONNAIRE
Hello, I'm___________________________________ with ________________ an independent market research firm in _____________________________. We are conducting a national survey on mass transportation ridership, and would like to speak with a person in your household who is over the age of 16 and has ridden the (INSERT APPROPRIATE CITY/SYSTEM LISTED BELOW) bus (FOR CHICAGO, PORTLAND, AND PHILADELPHIA INCLUDE and/or rail) system in the past month. Would that be you? REFER TO CITY AND ENTIRE SYSTEM NAME THE FIRST TIME AND THEN (LETTERS) IN SUBSEQUENT REFERENCES Akron - Metro Regional Transit Authority (MRTA) Chicago - Chicago Transit Authority (CTA) Minneapolis/St. Paul - Metropolitan Counsel Transit Operations (now MCTO) -- (if asked, it was formerly the MTC) Philadelphia - South Eastern Pennsylvania Transportation Authority (SEPTA) Portland - Tri-County Metropolitan Transit District of Oregon (TRI-MET) (IF "YES" CONTINUE WITH QUESTION 1, OTHERWISE, ASK IF SOMEONE ELSE QUALIFIES, ONCE CORRECT PERSON IS ON THE PHONE, REINTRODUCE YOURSELF) 1. We are interested in your use of the (INSERT CITY/SYSTEM) bus (FOR CHICAGO, PORTLAND, AND PHILADELPHIA INCLUDE and/or rail system). In particular, how many days did you use the (INSERT CITY/SYSTEM AND CORRESPONDING MODE(s) BELOW FOR CITY) in the past month? (IF RESPONDENT IS UNSURE SAY, "Can I wait while you count?") (INSERT EXACT NUMBER(s), DO NOT ACCEPT A RANGE) Bus Light Rail Heavy Rail Akron ____ Chicago ____ ___(CTA
Rail/Trains) Minneapolis ____ Philadelphia ____ ____(Light Rail/
____(Commuter Rail
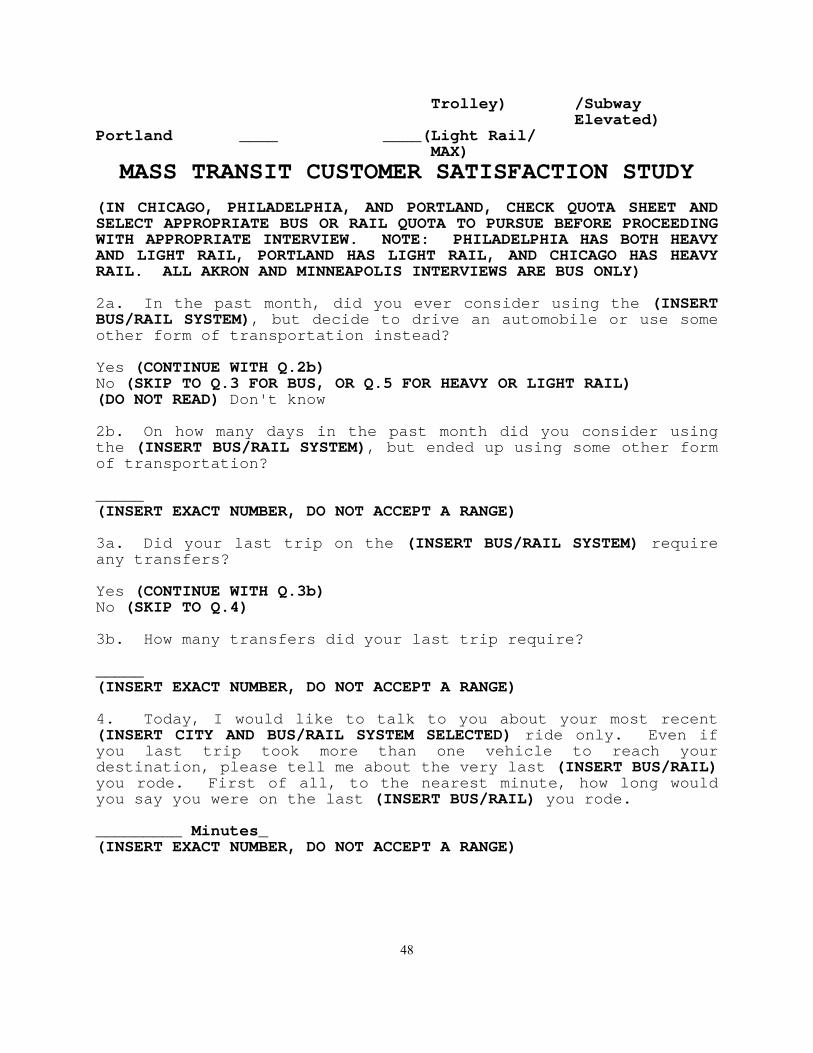
48
Trolley) /Subway Elevated)
Portland ____ ____(Light Rail/ MAX)
MASS TRANSIT CUSTOMER SATISFACTION STUDY
(IN CHICAGO, PHILADELPHIA, AND PORTLAND, CHECK QUOTA SHEET AND SELECT APPROPRIATE BUS OR RAIL QUOTA TO PURSUE BEFORE PROCEEDING WITH APPROPRIATE INTERVIEW. NOTE: PHILADELPHIA HAS BOTH HEAVY AND LIGHT RAIL, PORTLAND HAS LIGHT RAIL, AND CHICAGO HAS HEAVY RAIL. ALL AKRON AND MINNEAPOLIS INTERVIEWS ARE BUS ONLY) 2a. In the past month, did you ever consider using the (INSERT BUS/RAIL SYSTEM), but decide to drive an automobile or use some other form of transportation instead? Yes (CONTINUE WITH Q.2b) No (SKIP TO Q.3 FOR BUS, OR Q.5 FOR HEAVY OR LIGHT RAIL) (DO NOT READ) Don't know 2b. On how many days in the past month did you consider using the (INSERT BUS/RAIL SYSTEM), but ended up using some other form of transportation? _____ (INSERT EXACT NUMBER, DO NOT ACCEPT A RANGE) 3a. Did your last trip on the (INSERT BUS/RAIL SYSTEM) require any transfers? Yes (CONTINUE WITH Q.3b) No (SKIP TO Q.4) 3b. How many transfers did your last trip require? _____ (INSERT EXACT NUMBER, DO NOT ACCEPT A RANGE) 4. Today, I would like to talk to you about your most recent (INSERT CITY AND BUS/RAIL SYSTEM SELECTED) ride only. Even if you last trip took more than one vehicle to reach your destination, please tell me about the very last (INSERT BUS/RAIL) you rode. First of all, to the nearest minute, how long would you say you were on the last (INSERT BUS/RAIL) you rode. _________ Minutes_ (INSERT EXACT NUMBER, DO NOT ACCEPT A RANGE)
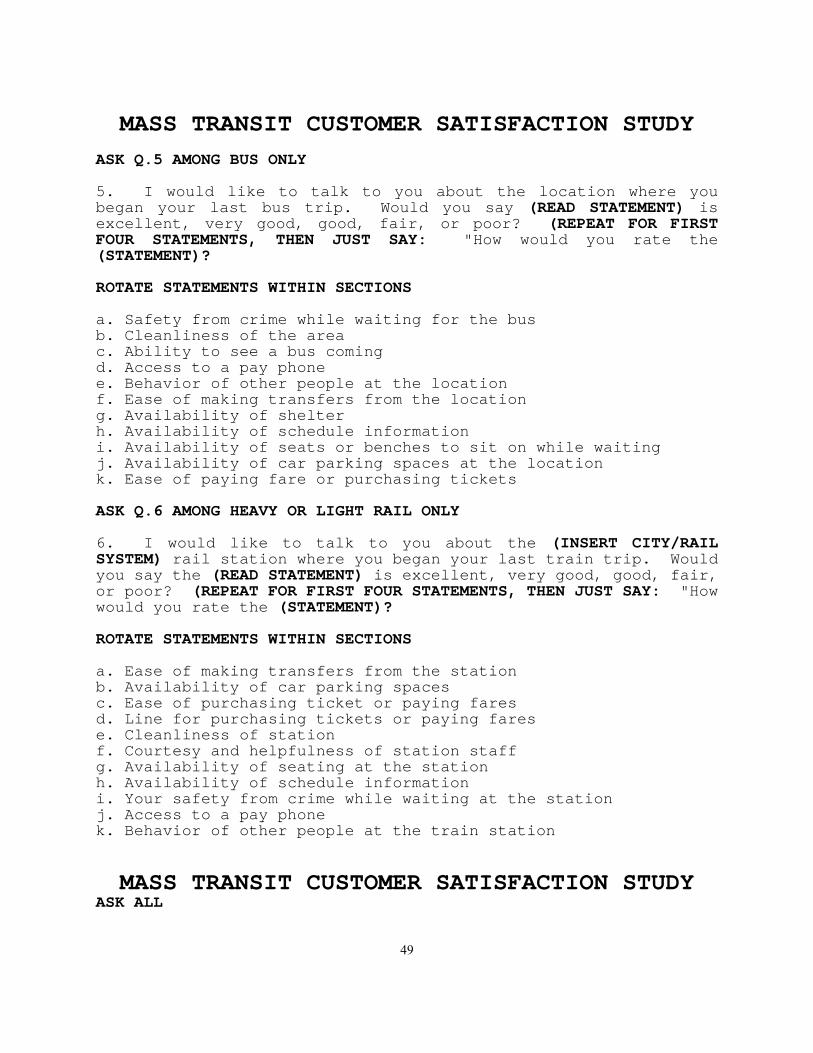
49
MASS TRANSIT CUSTOMER SATISFACTION STUDY
ASK Q.5 AMONG BUS ONLY 5. I would like to talk to you about the location where you began your last bus trip. Would you say (READ STATEMENT) is excellent, very good, good, fair, or poor? (REPEAT FOR FIRST FOUR STATEMENTS, THEN JUST SAY: "How would you rate the (STATEMENT)? ROTATE STATEMENTS WITHIN SECTIONS a. Safety from crime while waiting for the bus b. Cleanliness of the area c. Ability to see a bus coming d. Access to a pay phone e. Behavior of other people at the location f. Ease of making transfers from the location g. Availability of shelter h. Availability of schedule information i. Availability of seats or benches to sit on while waiting j. Availability of car parking spaces at the location k. Ease of paying fare or purchasing tickets ASK Q.6 AMONG HEAVY OR LIGHT RAIL ONLY 6. I would like to talk to you about the (INSERT CITY/RAIL SYSTEM) rail station where you began your last train trip. Would you say the (READ STATEMENT) is excellent, very good, good, fair, or poor? (REPEAT FOR FIRST FOUR STATEMENTS, THEN JUST SAY: "How would you rate the (STATEMENT)? ROTATE STATEMENTS WITHIN SECTIONS a. Ease of making transfers from the station b. Availability of car parking spaces c. Ease of purchasing ticket or paying fares d. Line for purchasing tickets or paying fares e. Cleanliness of station f. Courtesy and helpfulness of station staff g. Availability of seating at the station h. Availability of schedule information i. Your safety from crime while waiting at the station j. Access to a pay phone k. Behavior of other people at the train station
MASS TRANSIT CUSTOMER SATISFACTION STUDY ASK ALL
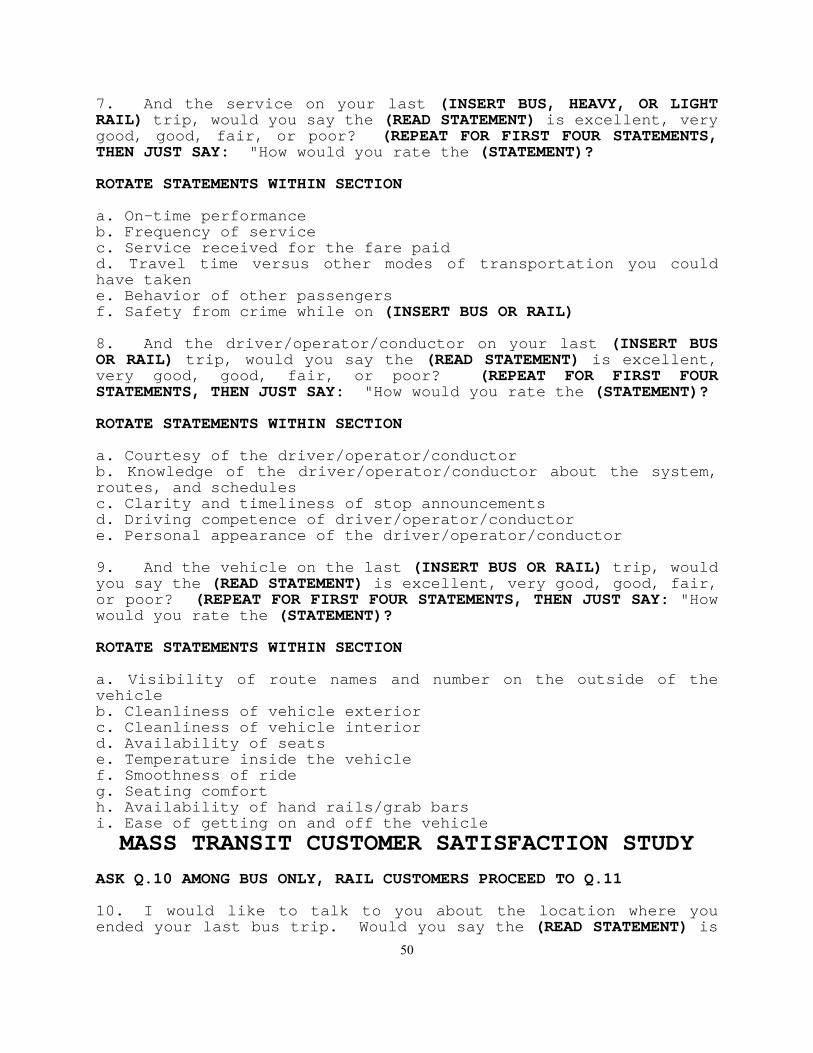
50
7. And the service on your last (INSERT BUS, HEAVY, OR LIGHT RAIL) trip, would you say the (READ STATEMENT) is excellent, very good, good, fair, or poor? (REPEAT FOR FIRST FOUR STATEMENTS, THEN JUST SAY: "How would you rate the (STATEMENT)? ROTATE STATEMENTS WITHIN SECTION a. On-time performance b. Frequency of service c. Service received for the fare paid d. Travel time versus other modes of transportation you could have taken e. Behavior of other passengers f. Safety from crime while on (INSERT BUS OR RAIL) 8. And the driver/operator/conductor on your last (INSERT BUS OR RAIL) trip, would you say the (READ STATEMENT) is excellent, very good, good, fair, or poor? (REPEAT FOR FIRST FOUR STATEMENTS, THEN JUST SAY: "How would you rate the (STATEMENT)? ROTATE STATEMENTS WITHIN SECTION a. Courtesy of the driver/operator/conductor b. Knowledge of the driver/operator/conductor about the system, routes, and schedules c. Clarity and timeliness of stop announcements d. Driving competence of driver/operator/conductor e. Personal appearance of the driver/operator/conductor 9. And the vehicle on the last (INSERT BUS OR RAIL) trip, would you say the (READ STATEMENT) is excellent, very good, good, fair, or poor? (REPEAT FOR FIRST FOUR STATEMENTS, THEN JUST SAY: "How would you rate the (STATEMENT)? ROTATE STATEMENTS WITHIN SECTION a. Visibility of route names and number on the outside of the vehicle b. Cleanliness of vehicle exterior c. Cleanliness of vehicle interior d. Availability of seats e. Temperature inside the vehicle f. Smoothness of ride g. Seating comfort h. Availability of hand rails/grab bars i. Ease of getting on and off the vehicle
MASS TRANSIT CUSTOMER SATISFACTION STUDY
ASK Q.10 AMONG BUS ONLY, RAIL CUSTOMERS PROCEED TO Q.11 10. I would like to talk to you about the location where you ended your last bus trip. Would you say the (READ STATEMENT) is
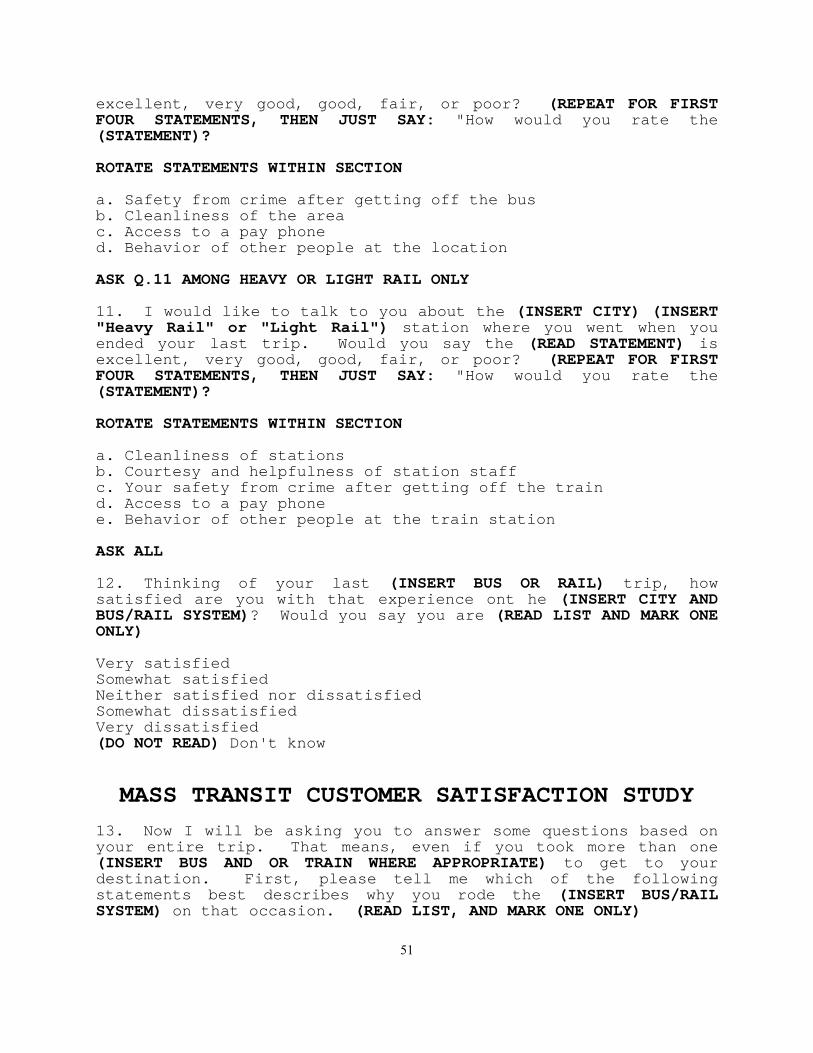
51
excellent, very good, good, fair, or poor? (REPEAT FOR FIRST FOUR STATEMENTS, THEN JUST SAY: "How would you rate the (STATEMENT)? ROTATE STATEMENTS WITHIN SECTION a. Safety from crime after getting off the bus b. Cleanliness of the area c. Access to a pay phone d. Behavior of other people at the location ASK Q.11 AMONG HEAVY OR LIGHT RAIL ONLY 11. I would like to talk to you about the (INSERT CITY) (INSERT "Heavy Rail" or "Light Rail") station where you went when you ended your last trip. Would you say the (READ STATEMENT) is excellent, very good, good, fair, or poor? (REPEAT FOR FIRST FOUR STATEMENTS, THEN JUST SAY: "How would you rate the (STATEMENT)? ROTATE STATEMENTS WITHIN SECTION a. Cleanliness of stations b. Courtesy and helpfulness of station staff c. Your safety from crime after getting off the train d. Access to a pay phone e. Behavior of other people at the train station ASK ALL 12. Thinking of your last (INSERT BUS OR RAIL) trip, how satisfied are you with that experience ont he (INSERT CITY AND BUS/RAIL SYSTEM)? Would you say you are (READ LIST AND MARK ONE ONLY) Very satisfied Somewhat satisfied Neither satisfied nor dissatisfied Somewhat dissatisfied Very dissatisfied (DO NOT READ) Don't know
MASS TRANSIT CUSTOMER SATISFACTION STUDY
13. Now I will be asking you to answer some questions based on your entire trip. That means, even if you took more than one (INSERT BUS AND OR TRAIN WHERE APPROPRIATE) to get to your destination. First, please tell me which of the following statements best describes why you rode the (INSERT BUS/RAIL SYSTEM) on that occasion. (READ LIST, AND MARK ONE ONLY)
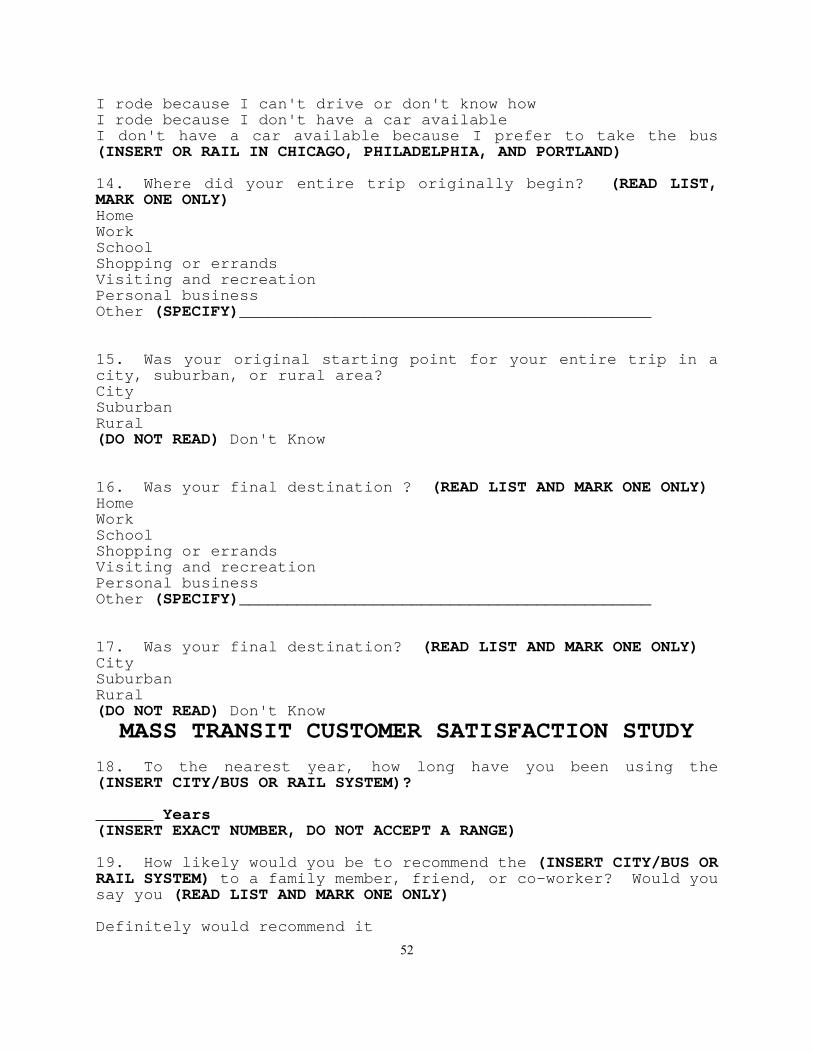
52
I rode because I can't drive or don't know how I rode because I don't have a car available I don't have a car available because I prefer to take the bus (INSERT OR RAIL IN CHICAGO, PHILADELPHIA, AND PORTLAND) 14. Where did your entire trip originally begin? (READ LIST, MARK ONE ONLY) Home Work School Shopping or errands Visiting and recreation Personal business Other (SPECIFY)___________________________________________ 15. Was your original starting point for your entire trip in a city, suburban, or rural area? City Suburban Rural (DO NOT READ) Don't Know 16. Was your final destination ? (READ LIST AND MARK ONE ONLY) Home Work School Shopping or errands Visiting and recreation Personal business Other (SPECIFY)___________________________________________ 17. Was your final destination? (READ LIST AND MARK ONE ONLY) City Suburban Rural (DO NOT READ) Don't Know
MASS TRANSIT CUSTOMER SATISFACTION STUDY
18. To the nearest year, how long have you been using the (INSERT CITY/BUS OR RAIL SYSTEM)? ______ Years (INSERT EXACT NUMBER, DO NOT ACCEPT A RANGE) 19. How likely would you be to recommend the (INSERT CITY/BUS OR RAIL SYSTEM) to a family member, friend, or co-worker? Would you say you (READ LIST AND MARK ONE ONLY) Definitely would recommend it
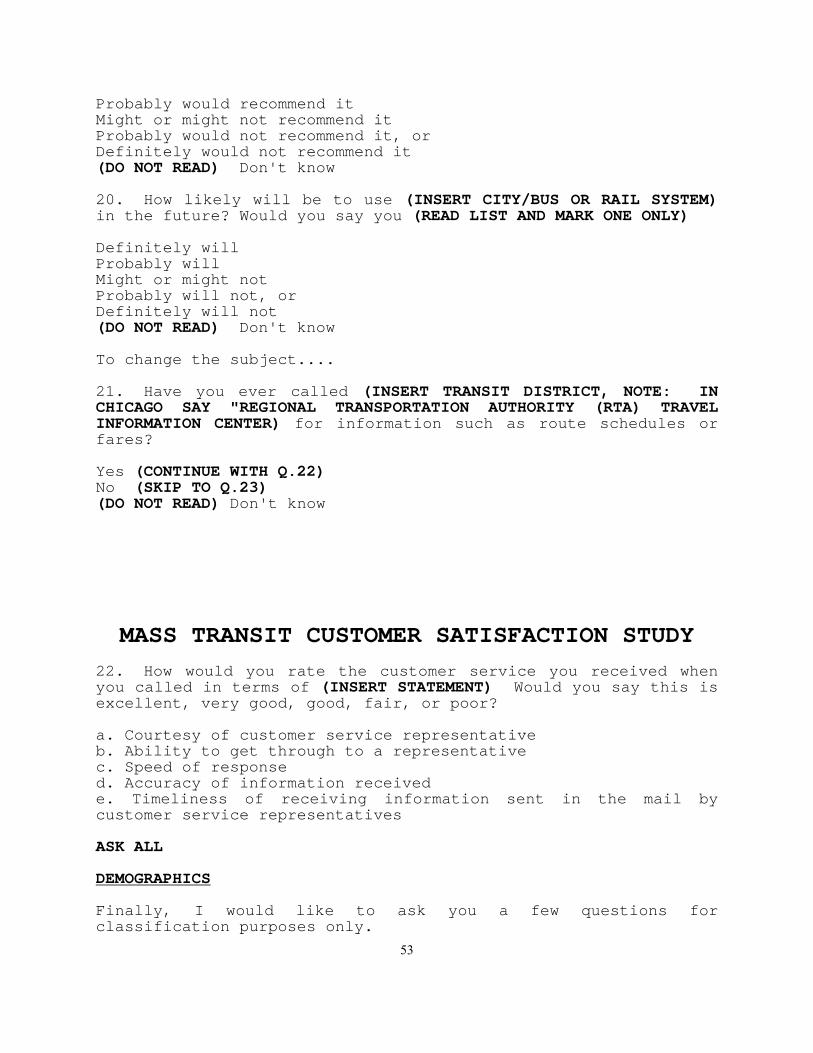
53
Probably would recommend it Might or might not recommend it Probably would not recommend it, or Definitely would not recommend it (DO NOT READ) Don't know 20. How likely will be to use (INSERT CITY/BUS OR RAIL SYSTEM) in the future? Would you say you (READ LIST AND MARK ONE ONLY) Definitely will Probably will Might or might not Probably will not, or Definitely will not (DO NOT READ) Don't know To change the subject.... 21. Have you ever called (INSERT TRANSIT DISTRICT, NOTE: IN CHICAGO SAY "REGIONAL TRANSPORTATION AUTHORITY (RTA) TRAVEL INFORMATION CENTER) for information such as route schedules or fares? Yes (CONTINUE WITH Q.22) No (SKIP TO Q.23) (DO NOT READ) Don't know
MASS TRANSIT CUSTOMER SATISFACTION STUDY
22. How would you rate the customer service you received when you called in terms of (INSERT STATEMENT) Would you say this is excellent, very good, good, fair, or poor? a. Courtesy of customer service representative b. Ability to get through to a representative c. Speed of response d. Accuracy of information received e. Timeliness of receiving information sent in the mail by customer service representatives ASK ALL DEMOGRAPHICS Finally, I would like to ask you a few questions for classification purposes only.
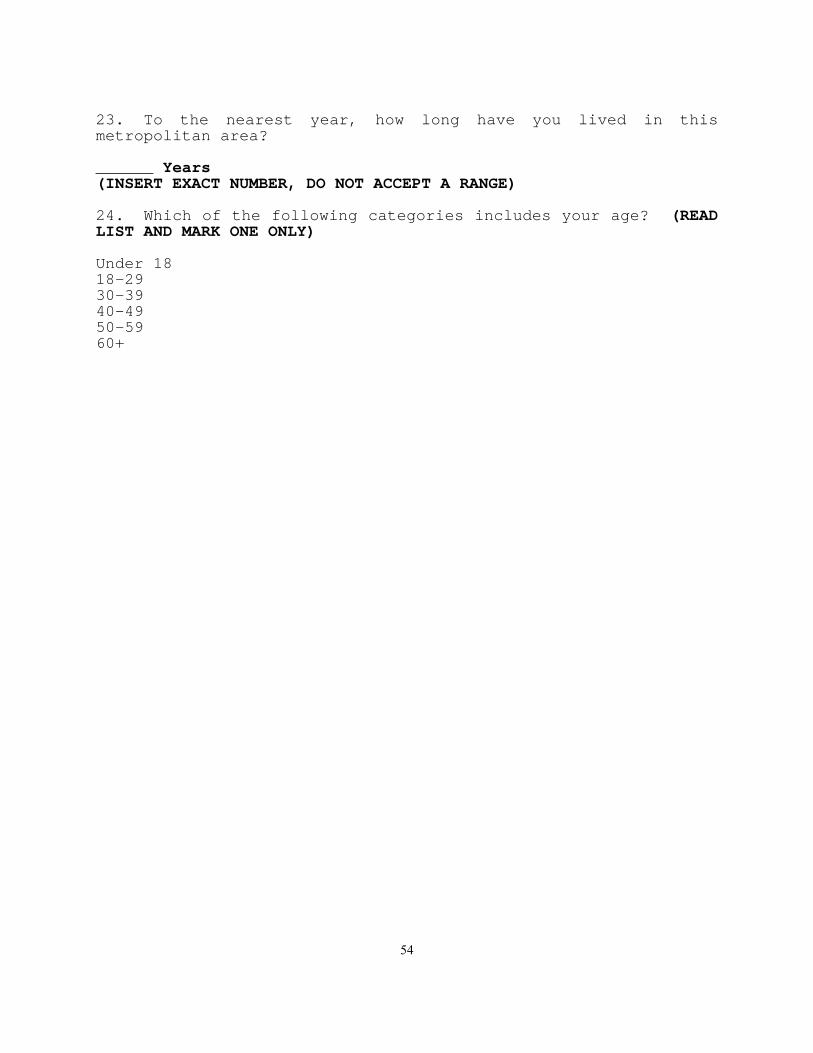
54
23. To the nearest year, how long have you lived in this metropolitan area? ______ Years (INSERT EXACT NUMBER, DO NOT ACCEPT A RANGE) 24. Which of the following categories includes your age? (READ LIST AND MARK ONE ONLY) Under 18 18-29 30-39 40-49 50-59 60+
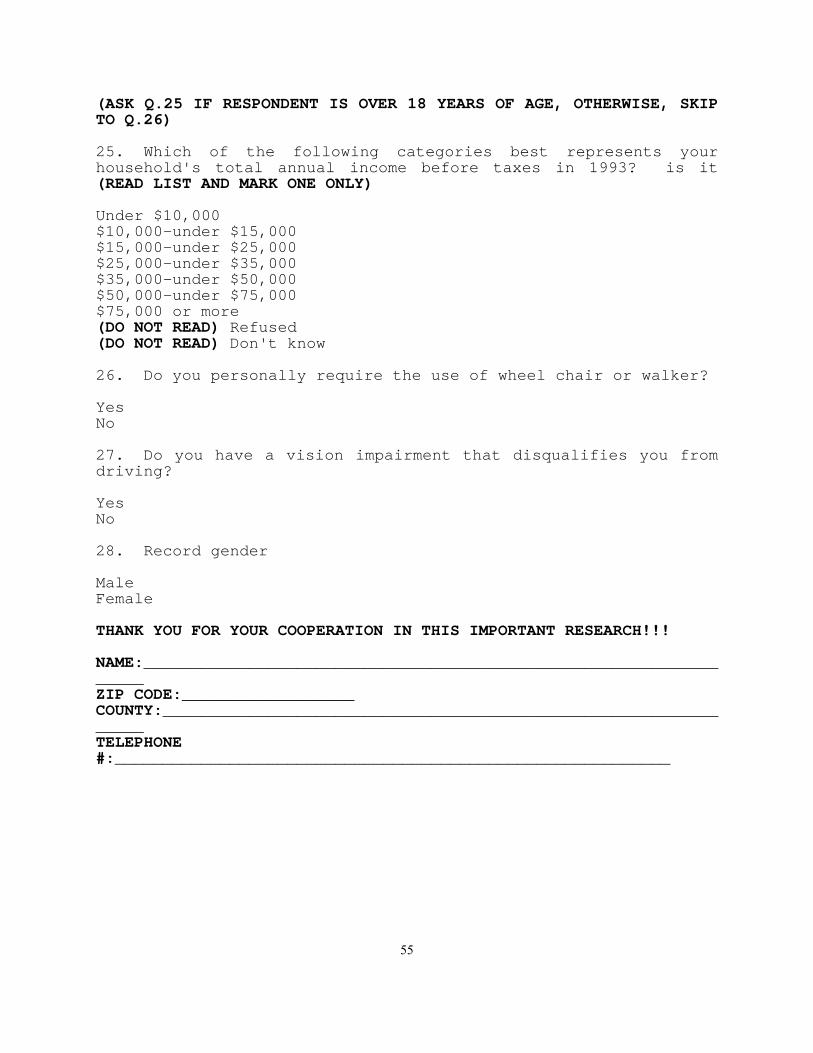
55
(ASK Q.25 IF RESPONDENT IS OVER 18 YEARS OF AGE, OTHERWISE, SKIP TO Q.26) 25. Which of the following categories best represents your household's total annual income before taxes in 1993? is it (READ LIST AND MARK ONE ONLY) Under $10,000 $10,000-under $15,000 $15,000-under $25,000 $25,000-under $35,000 $35,000-under $50,000 $50,000-under $75,000 $75,000 or more (DO NOT READ) Refused (DO NOT READ) Don't know 26. Do you personally require the use of wheel chair or walker? Yes No 27. Do you have a vision impairment that disqualifies you from driving? Yes No 28. Record gender Male Female THANK YOU FOR YOUR COOPERATION IN THIS IMPORTANT RESEARCH!!! NAME:_________________________________________________________________ ZIP CODE:__________________ COUNTY:_______________________________________________________________ TELEPHONE #:__________________________________________________________