Embed Size (px)
Citation preview
Customer Satisfaction
in the Metropolitan
Ambulance Service
by
Scott Ian Stewart,
BSc, GradDipEd, AssocDipHealthSci
Victoria Graduate School of Business, Faculty of Business and Law
August 2001
This thesis is submitted in fulfilment of the requirements for the
Degree of Master of Business,
Victoria University of Technology.

“Customer Satisfaction in the MAS” Declaration
i
Declaration
I certify that this thesis contains no material that has been submitted for the award of
any other degree or diploma in any institute, college or university, and that, to the best
of my knowledge and belief, it contains no material previously published or written by
another person, except where due reference is made in the text.
Scott Stewart
“Customer Satisfaction in the MAS” Permission to Copy
ii
Permission to Copy
I hereby give permission to the staff of the University Library and to the staff and
students of Victoria University of Technology to copy this thesis in whole or part,
subject to normal conditions of acknowledgment.
Scott Stewart
“Customer Satisfaction in the MAS” Acknowledgments
iii
Acknowledgments
I wish to acknowledge the support of the following people who without their assistance
this research would not be possible. Dr. George Wittingslow and Dr. Nick Billington
for their guidance and support, Sanjib Roy for making the customer database available
and giving the support of Metropolitan Ambulance Service and Kerrie Stewart for her
unfailing patience, encouragement and bullying!
“Customer Satisfaction in the MAS” List of Tables
iv
List of Tables
Table 1 Comparison of issues measured by Australian ambulance satisfaction studies 37
Table 2 Research study groupings.................................................................................66
Table 3 Response rates in the various groupings ........................................................... 74
Table 4 Descriptive statistics on total sample ................................................................ 79
Table 5 Subscribers compared to health care card holders (HCCH).............................. 86
Table 6 Subscribers that have used the MAS compared with those that have not used the
MAS......................................................................................................................... 88
Table 7 Health care card holders (HCCH) that have used the MAS compared to those
that have not used the MAS..................................................................................... 89
Table 8 Respondents that have never used MAS compared to those that have used once
or twice and those that have more than twice.......................................................... 90
Table 9 t-tests on outcome variables .............................................................................. 92
Table 10 ANOVA’s on satisfaction and outcome variables .......................................... 94
“Customer Satisfaction in the MAS” List of Figures
v
List of Figures
Figure 1 Complaints to MAS for the 12-month period April 1999- March 2000 .....40
Figure 2 General Structure of PLSM Model..............................................................62
Figure 3 Management’s theoretical model of customer satisfaction in the MAS......69
Figure 4 Preliminary model of customer satisfaction as seen by the customers
of the MAS ..................................................................................................72
Figure 5 Final satisfaction model...............................................................................76
Figure 6 Customer satisfaction with latent variables and overall satisfaction...........84
Figure 7 Latent variable impact scores ......................................................................85
Figure 8 Satisfaction impact matrix ...........................................................................87
Figure 9 Priority matrix..............................................................................................88
“Customer Satisfaction in the MAS” Abstract
vi
Abstract
The field of customer satisfaction is complex and lacks clarity. Any technique that can
bring order and predicability to the field is keenly sought. The partial least square
methodology (PLSM) is a new means of modelling and predicting future outcomes.
This research uses the partial least square modelling methodology to investigate and
model the satisfaction of users of the Metropolitan Ambulance Service, Melbourne
(MAS). The theories of Customer Satisfaction were reviewed then a definition of the
concept established. The current state of the MAS was briefly discussed and the PLSM
methodology was defined. Data collected from the MAS customer population was
analysed by the PLSM method and by traditional statistical methods for comparative
purposes.
The results of the research demonstrated that the PLS methodology can be successfully
applied to the field of satisfaction measurement of the ambulance service customer.
Whilst uniquely modelling the determinants of customer satisfaction, it agreed with
work by earlier researchers that particular aspects of staff behaviour were very
important for high levels of customer satisfaction in the service industries.
The model predicted that changes in the satisfaction rating of the staff variable would
have a significant effect on overall satisfaction and critical consequential outcomes such
as reuse and re-subscription. It also predicted that the overall model of customer
satisfaction of MAS users was insensitive to changes with image, cost or equipment.
“Customer Satisfaction in the MAS” Abstract
vii
An unexpected finding was that perceived medical ability was strongly linked to the
paramedic’s professional appearance.
Implications of the finding are that MAS should pay close attention in the design and
maintenance of the paramedic uniform. The relationship between a paramedic’s
professional appearance and their medical ability as perceived by a patient should be
emphasised during training and professional development days. The very high
importance of staff issues such as competence, friendliness, calmness and
trustworthiness in regard to customer satisfaction reaffirms MAS attention and
awareness of the matter.
The research needs to been repeated within MAS to give a trend over time and a
measure of the effectiveness of changes. To show that the methodology is widely
applicable the research should be repeated using another ambulance service.
“Customer Satisfaction in the MAS” Table of Contents
viii
Table of Contents DECLARATION I
PERMISSION TO COPY II
ACKNOWLEDGMENTS III
LIST OF TABLES IV
LIST OF FIGURES V
ABSTRACT VI
TABLE OF CONTENTS VIII
1. INTRODUCTION 1
1.1 Aims 1
1.2 Satisfaction of ambulance service customers 2
1.3 The MAS 5
2. LITERATURE REVIEW: CUSTOMER SATISFACTION 14
2.1 Definition of Customer Satisfaction 14
2.2 The Nature of Customer Satisfaction 19
2.3 Concepts of Satisfaction Performance 22
2.4 Measuring Customer Satisfaction 25
2.5 Medical Care Satisfaction Literature 30
2.6 Ambulance Customer Satisfaction Literature 36
2.7 Conclusion 44
3. MEASURING CUSTOMER SATISFACTION 45
3.1 Introduction 45
3.2 Background of Measuring Customer Satisfaction 45
“Customer Satisfaction in the MAS” Table of Contents
ix
3.3 Second Generation Modelling 46
3.4 Conceptual Framework - Defining a Model's Components 58
4. METHODS 62
4.1 Introduction 62
4.2 Parameters used in the study 63
4.3 Data Collection Methods 66
5. RESULTS 74
5.1 Response Rates 74
5.2 Final Model with Values 74
5.3 Descriptive Statistics on Total Sample 79
5.4 Quality Component Scores -Satisfaction and Impact 81
5.5 Satisfaction for Various Subgroups 86
5.6 t - test Results on Satisfaction and Outcomes 92
5.7 ANOVA’s on Satisfaction and Outcome Variables 94
6. DISCUSSION 96
6.1 Conventional Statistics Results 96
6.2 Partial Least Square Results 99
6.3 Comparison with other Medical Satisfaction Studies 99
6.4 Latent Variables and Impacts 100
6.5 Differences between Groups 105
6.6 Comparison of the PLSM and other Methods 107
6.7 Acknowledged Weaknesses of the Study. 109
6.8 Proposed MAS use of findings 110
6.9 Conclusion 111
7. BIBLIOGRAPHY 113
8. APPENDIX 144

“Customer Satisfaction in the MAS” Table of Contents
x
8.1 Appendix I – Questionnaire 145
8.2 Appendix II– Correlation Matrix 150
“Customer Satisfaction in the MAS” Chapter 1: Introduction
1
1. Introduction
This thesis will test the appropriateness of a methodology to investigate and model the
satisfaction of users of an ambulance service. Firstly, there will be a review of the
theories of customer satisfaction then a definition of the concept will be established to
be used in the thesis. The methodology to be applied will be defined. The organisation,
which is the subject of this study, is the Metropolitan Ambulance Service, Melbourne
(MAS). The current state of the MAS will be briefly discussed. Data collected from
the MAS customer population will then be analysed by the selected method and by
traditional statistical methods for comparative purposes.
In this chapter, the issues to be studied will be outlined to give a basis for the research
and discussions in later chapters.
1.1 Aims
This thesis aims to:
• Identify the drivers of satisfaction with an ambulance service,
• Measure the relative satisfaction with and importance of those drivers,
• Determine whether the Subscribers and the Health Care Card Holders have differing
satisfaction models and values,
• Determine which areas for improvement within MAS offer the greatest potential
return on investment,
• Predict the effect changes on the service will have on the decision to reuse and
resubscribe, and
“Customer Satisfaction in the MAS” Chapter 1: Introduction
2
• Benchmark the MAS’s level of customer satisfaction against other organisations.
1.2 Satisfaction of ambulance service customers
There is a sizeable body of research on the medical aspects of pre-hospital care and on
the area of customer satisfaction but few studies have been reported on customer
satisfaction of users of an ambulance service. A review of the available literature found
only one published study (Fultz, Coyle and Reynolds, 1998) examining satisfaction of
customers of an ambulance service. Fultz, Coyle and Reynolds (1998) investigated the
satisfaction of patients transported by an Air Ambulance Service. A further three
unpublished studies, were uncovered including one which measured the customer
satisfaction with the call taking process that initiates the MAS emergency response
(Patterson, 1996; NWR–ASV, 1999; Dale, 2000). None of these studies, however,
considered the service delivery and subscription aspects of an ambulance service.
The above studies did not model the satisfaction of ambulance users or attempt to make
predictions regarding effects of changes.
It is proposed in this thesis that a suitable methodology for measuring the satisfaction of
customers of an ambulance service would:
• Identify the drivers of satisfaction and rate them in terms of performance and
importance,
• Determine which drivers have the potential to be efficiently improved with a
resulting increase in satisfaction,
“Customer Satisfaction in the MAS” Chapter 1: Introduction
3
The methodology should also be able to establish if the various segments of the
customer base have varied expectations of the ambulance service,
• Finally the methodology should be able to link the nebulous concept of satisfaction
with tangible, measurable acts such as use, recommendation and repurchase,
• The ability to validly benchmark the results against other organisations would be an
additional benefit.
1.2.1 Satisfying patients enhances service quality
Providing the service that the customer wants is the best course of action for
organisations, according to the World Quality Movement (1997), the world peak quality
body. MAS’s Ambulance Paramedics receive three years medical training at university
and in the field, before they are qualified. The elite mobile intensive care ambulance
paramedics undergo a further twelve months training. Their medical care and skills
levels are thought to be of world standard by MAS and the Victorian State Government.
But as Fitch (1989, p. 9) states, “Patients can receive excellent clinical care and at the
same time be mistreated”. Paramedics should care for people, not just medical
problems. If an Ambulance Service is committed to excellence then they would need to
ask, “what can we do for our patients above and beyond excellent medical treatment?”
The non-medical aspects of the interaction can be very important to a patient and their
family. It can be argued that what really matters to the patient are the things that MAS
should be doing. In this sense, a quality service as defined by the customer, is one that
produces customer satisfaction.
“Customer Satisfaction in the MAS” Chapter 1: Introduction
4
Lately quality has been defined as customer satisfaction. Companies such as General
Electric and Motorola have been moving away from the ISO 9000 series measures to
one using customer satisfaction. The Australian Wider Quality Movement in their
report, Quality, Productivity and Competitiveness (1997) stated, “Quality is what the
customer believes it is”. On 5th May 1997, the World Quality Movement defined
customer satisfaction as quality (1997). Fornell (1995) has shown that customer
satisfaction guided changes to an organisation have shown a competitive advantage
demonstrated by increased market share and profit margin.
Internationally quality management schemes seem not to have brought the results first
promised by their supporters. In a survey of more than 200 British firms, only 20%
reported they had found any significant impact as a result of Total Quality Management,
(TQM), (Ittner and Larcker, 1996). Of 500 US companies, almost two-thirds found no
competitive gain in their quality programs (Ittner and Larcker, 1996). TQM had the
effect of focusing employee’s attention on internal processes rather than on external
results (Harari, 1993), effort had been directed toward jumping through internal
bureaucratic hoops and not necessarily adding value to the end user.
1.2.2 Benchmarking
An important part of many quality programs is benchmarking an organisation with other
comparable businesses. MAS is seeking to benchmark its performance against eight
other ambulance services throughout the world (Baragwanath, 1997a). Because of the
differences such as area, population, skill levels, geography, climate and funding levels
“Customer Satisfaction in the MAS” Chapter 1: Introduction
5
between the services, meaningful comparisons may be hard to make for often quoted
benchmarks, such as response times or successful resuscitation from cardiac arrest.
If there were a robust model of customer satisfaction, meaningful comparison could be
made with other ambulance services that do not exactly match MAS in demographics.
Customer satisfaction can be used as an externally rated, inter-industry benchmark; it
can also be used cross sectionally and over time (Fornell et al., 1996). A deficiency of
satisfaction scores from other ambulance services would not inhibit a comparison being
made. By using a customer satisfaction methodology, MAS could validly benchmark
its self against other non-ambulance organisations that achieve high levels of
satisfaction.
1.3 The MAS
The Ambulance Service Victoria - Metropolitan Region, trading, as Metropolitan
Ambulance Service, Melbourne, is the subject of this study. MAS is the sole provider
of professional pre-hospital emergency health care for the 3.4 million people living in
Greater Melbourne and the surrounding area. The service is a state government backed
enterprise and its role is enshrined in the Ambulance Services Act, 1986.
Some may argue that the role of an organisation such as MAS is to deliver paramedic
services, not necessarily to make stakeholders happy. However, it is important that
MAS is perceived to be effective and efficient by the stakeholders and customers. For
“Customer Satisfaction in the MAS” Chapter 1: Introduction
6
any organisation to survive, even a government-backed monopoly, it must satisfy its
market. To achieve this goal the market must perceive that its needs have been met.
Few would argue that the quality of medical care provided by an ambulance service is
not of paramount importance. The patients, the customers of that service, usually have
little ability or experience to judge the quality of the paramedical medical service
provided. MAS’s data suggests that that the average person only uses the service
between one and two times in their lifetime. The patients therefore tend to judge the
quality of the service as a whole on other non-medical factors (Swan, 1989). Swan
(1989) stated these included, the paramedics conducting themselves in a calm and
reassuring manner, clean ambulances and how well the service performs compared with
preconceptions formed from television and movies. He claimed that it is these
judgments that influence how the customers perceive the organisation.
MAS has a number of stakeholders, including the state government, subscribers and
public. The satisfaction or dissatisfaction of MAS customers can have direct and
indirect effects. For example, a dissatisfied subscriber may chose to not resubscribe.
Levels of satisfaction or dissatisfaction can also place pressure on the state government
who have ultimate control over the MAS.
1.3.1 Paramedical service quality
MAS have in place a Total Quality Assurance Program (Csupor, 1997) consistent with
ISO 9002. MAS’s performance, measured by these criteria, is now tied to funding
(Olszac, 1997). Previously all of MAS’s non-emergency stretcher contractors had been
“Customer Satisfaction in the MAS” Chapter 1: Introduction
7
accredited to ISO 9002 (Olszac, 1997). MAS has now achieved certification under
AS/NZS ISO 9001:2000 (MAS, 2001). As one of its quality activities under AS/NZS
ISO 9001:2000, MAS is obliged to monitor information on the level of customer
satisfaction and/or dissatisfaction.
In MAS’s Quality Assurance Plan, Csupor (1997, p. 8) alludes to customer satisfaction
by the statement “It is the community, in the broader definition, who will determine
whether they have received “Quality Service”. She argued that quality is usually
perceived as having three interrelated domains: “Service”, “Care” and
“Organisational”.
Csupor (1997, p. 7) stated that Quality Service is “achieving community satisfaction by
the service provided”. Unfortunately, how this is measured was not outlined. Quality
Care is defined as providing care to acceptable and established standards. Quality
Organisation is achieved by fostering a working culture of getting it right first time and
a commitment to doing better by participation in a coordinated continuous clinical
quality improvement process (Csupor, 1997).
Whilst adhering to ISO 9002 and AS/NZS ISO 9001:2000 may or may not improve
medical care for the patients, it could be argued that it would not necessarily
demonstrate an improvement in their satisfaction without an appropriate methodology.
“Customer Satisfaction in the MAS” Chapter 1: Introduction
8
1.3.2 Stake holders and public perception
Many groups, the government, subscribers, the media, patients, the public and staff,
evaluate MAS’s performance. The State Government of Victoria, through the
Department of Human Services, provides the bulk of the funds to MAS. They appoint
the Board Of Management and Chief Executive Officer. The MAS is directly
accountable the Department of Human Services and is required to meet performance
targets. The media provides information and helps form opinions for all the above
groups. The members of the fourth estate wield considerable power over public
opinion, particularly those members of the public whose only source of information of
MAS is through the media. Patients are the most obvious of the groups served by
MAS. In some ways, this group is easy to satisfy, if they receive an ambulance in time
and are given the care they expect. The strong emotions however, generally involved in
ambulance work, can colour the perception of the service provided. The patients and
their relatives are usually in a highly emotional state and any deficiency in the care
provided, real or perceived may result in a formal complaint to management, the media,
or the government. This may in turn affect the perception of others. Improved
customer satisfaction would impact in all of these areas and result in improved
community perception of ambulance care (Daly, 1992).
There has been a move toward smaller government expenditure and greater public
accountability by the bodies receiving the funding. The publishing of customer
satisfaction measurement scores would assist in justifying the monies used by MAS.
1.3.3 Subscription scheme
“Customer Satisfaction in the MAS” Chapter 1: Introduction
9
MAS has a Subscription Scheme. This is analogous to insurance where for an annual
fee the subscriber is entitled to free emergency ambulance treatment and transport. The
MAS Chief Executive Officer stated in the 1996 annual report that the financial
viability of MAS is linked to the well-being of its Subscription Scheme (Olszac, 1996).
The scheme is a major source of income to MAS. Any profit the scheme makes helps to
defray the loss incurred by MAS due to lack of full cost recovery from patient transport
fees (Baragwanath, 1997a).
The revenue from subscribers for 1995/96 was almost $28 million representing 34.7%
of its total revenue of $80.6 million (MAS, 1996). This result was profitable as the
members only accounted for 14.8% of the patients transported. The profitability wasn’t
lost on health insurers such as Medibank Private who have provided competition to the
subscription scheme. Over the period, 1994/5 to 1995/6, MAS subscriptions dropped
from 530,385 to 512,028 (MAS, 1996). Almost certainly some of this was due to
defection of members to the health insurers, although recession and negative publicity
during this period may also have had an effect.
MAS needs to focus on keeping existing customers rather than just recruiting new ones.
It costs five times more to acquire a new customer than to keep an existing one
(Djupvik and Eilertsen, 1995). It makes sound commercial sense for MAS to keep
subscribers satisfied. There is a close relationship between customer satisfaction and
customer loyalty (Djupvik and Eilertsen 1995). Satisfied customers buy more, more
often, and are more price tolerant (Marr and Crosby, 1993). A more satisfied customer
base increases their likelihood of resubscribing and hence improves the long-term
viability of the organisation (Brooks, 1995).
“Customer Satisfaction in the MAS” Chapter 1: Introduction
10
A dissatisfied customer may cost MAS more than just one subscription. Research on
bank customers suggests that the average unhappy user will tell sixteen other people of
his experience. By comparison, a happy bank customer will tell an average of eight of
his delight (Goodman et al., 1995).
The average subscriber does not use the MAS in any given year, yet most continue to
pay the annual fee. The reasons behind this need to be explored. The appropriate
customer satisfaction methodology would enable predictions to be made where
improvements in the quality would increase the satisfaction and hence the value of the
MAS subscriber base.
New subscribers must be recruited even if the subscriber base were to be totally
satisfied with MAS. For example, once a person is entitled to income support, the
Federal government issues a Health Care Card, which among other things entitles the
holder to free ambulance transport. Only the most supportive subscribers continue to be
members in these circumstances. To grow the size of the subscriber base still more new
members are needed. The decision to join the subscription scheme also needs to be
understood by MAS. This would enable more focused and effective advertising.
“Customer Satisfaction in the MAS” Chapter 1: Introduction
11
1.3.4 Competition from other insurance schemes
During the 1996-97 financial year, 76,800 new members were recruited to the scheme
while 49,500 members left. Some of the loss was due to former subscribers becoming
eligible for free transport, but MAS estimated that around 30 per cent of members who
failed to renew their subscription become members to cheaper insurance schemes.
(Baragwanath, 1997a)
To compete with the other Schemes MAS has to either drop its prices, or increase the
satisfaction of its subscribers and exploit their increased price tolerance.
The accurate measurement of customer satisfaction would enable MAS to better
manage its subscription scheme by better understanding its customers and being able to
predict their propensity to resubscribe.
1.3.5 Preparation for a deregulated emergency ambulance market place
Currently under the Ambulance Services Act 1986, MAS has a legislated monopoly on
pre-hospital emergency assessment treatment and transport in the Greater Melbourne
area. Since 1994, sub-contractors to the MAS have handled the bulk of non-emergency
transport between hospitals.
This situation may change. The last conservative state government of Victoria had
privatisation very much on its agenda. In the last few years, the electricity, gas and
“Customer Satisfaction in the MAS” Chapter 1: Introduction
12
water industries have been privatised. Even the Metropolitan Fire Brigade has been
suggested as a potential candidate.
It is possible in the future that the emergency ambulance industry could be subject to
privatisation. A high level of public satisfaction may enable MAS to avoid this
outcome. This could be compared with the Victorian Public Transport Corporation
where poor public perception made it easer for the then government, and more palatable
to the public, to privatise.
If a government did privatise the MAS, and / or other companies competed in the pre-
hospital emergency care market, the MAS would need to all the tools available to it to
compete more effectively. One of most powerful tools is an accurate measurement of
customer satisfaction.
MAS in a possible, future, deregulated market may be compared to Norwegian Telecom
(NT). NT is a former monopoly being steadily opened up to an increasing number of
competitors. This situation called for a market and customer-oriented organisation with
a clear strategy not to lose too many customers. NT in the early 1990’s had little
experience with competition and its success depended on how fast the organisation
became more market orientated (Djupvik and Eilertsen, 1995). NT used customer
satisfaction research to meet the challenge of competition.
If the aims outlined in section 1.1 are to be achieved, a definition of the term and a
suitable methodology of measuring customer satisfaction must be found. In the next

“Customer Satisfaction in the MAS” Chapter 1: Introduction
13
chapter the field of customer satisfaction will be discussed, defined, and the appropriate
research methodology selected for this project.
“Customer Satisfaction in the MAS” Chapter 2: Literature Review
14
2. Literature Review: Customer Satisfaction
The field of Customer Satisfaction is large and traverses many academic disciplines. In
this chapter, a review of the published literature upon which this study rests will be
presented. The search for a workable definition of customer satisfaction will be
explored. The concepts regarding the theoretical nature of customer satisfaction will be
investigated and some of the major techniques used to measure it will be discussed.
Lastly, the literature concerning the driving factors for satisfaction regarding medical
care and in particular, ambulance services will be considered.
2.1 Definition of Customer Satisfaction
An analysis of the literature concerned with customer satisfaction in 1992 revealed a
large and ever growing body of research with some 15,000 trade and academic articles,
which had been written on the topic over the previous two decades (Peterson and
Wilson, 1992).
Despite the many studies on customer satisfaction, there appeared to be no overall
agreement over important issues such as concepts, constructs, definitions,
measurements, methodologies and various interrelationships (Yi, 1990; Brooks, 1995).
Currently the constructs of customer satisfaction are built upon concepts such as
individual wants, needs and expectations. These concepts emerged from theories about
consumer choice for goods and services, which are sought to meet needs and wants.
“Customer Satisfaction in the MAS” Chapter 2: Literature Review
15
Issues such as prices, convenience, appeal and quality were seen as moderating the
choices.
The concept of satisfaction itself needs to be defined. The Shorter Oxford English
Dictionary (1944, p. 1792) defined satisfaction as ‘[1] being satisfied, [2] thing that
satisfies desire or gratifies feeling’. It describes satisfy as ‘ [1] meeting wishes of
content, [2] be accepted as adequate [3] to fulfil, [4] comply with, [5] come up to
expectations.’ Customer is defied as ‘a person who buys a product or uses a service.’
Hence using these definitions, customer satisfaction can be thought of as a user or
purchaser having their needs and expectations fulfilled.
The concept of customer satisfaction has been defined in various ways. Zeithaml,
Berry and Parasuraman (1993) suggested that customer satisfaction is a function of the
customer’s assessment of service quality, product quality and price. Oliva, Oliver and
Bearden (1995) suggested that satisfaction is a function of product performance relative
to consumer expectations. Bachelet (1995) considered satisfaction to be an emotional
reaction by the consumer in response to an experience with a product or service. He
believed that this definition included the last contact with a product or service, the
satisfaction experience since the time of purchase as well as the general satisfaction
experienced by regular users. Hill (1996) defined customer satisfaction as the
customers’ perceptions that a supplier has met or exceeded their expectations. Jones
and Sasser (1995) defined customer satisfaction by identifying four factors they
postulated affected it. The factors were: (1) essential elements of the product or service
that customers expected all rivals to deliver, (2) basic support services such as customer
assistance, (3) a recovery process to make up for bad experiences and
“Customer Satisfaction in the MAS” Chapter 2: Literature Review
16
(4) “customisation” which were factors that met customers’ personal preferences,
values, or needs. Ostrom and Iacobucci (1995) examined a number of definitions from
other researchers and distinguished between the concept of consumer value and
customer satisfaction. They stated that customer satisfaction was best judged after
purchase, was experiential and took into account the qualities and benefits as well as the
costs and efforts associated with a purchase. Gerson (1996) suggested that a customer
was satisfied whenever his or her needs, real or perceived were met or exceeded. He
put it succinctly as “Customer Satisfaction is simply whatever the customer says it is”(p.
24).
A new paradigm of customer satisfaction has evolved from this multifarious body of
knowledge. Johnson and Fornell, (1991) proposed an econometric model where
satisfaction was viewed as “a cumulative abstract construct that describes customers’
total consumption experience with a product or service”(p. 271). They stated this was
not a transient perception of how happy a customer was with the product at any given
point in time. It was the overall experience with the purchase and use of a product or
service to that point in time. This concept is consistent with the economic notion where
satisfaction embraces post-purchase consumption utility as well as expected utility
(Meeks, 1984). Johnson and Fornell’s (1991) view also conformed to the economic
psychological theory where satisfaction was compared with the notion of subjective
wellbeing (Wärneryd, 1988). The Johnson and Fornell (1991) model evolved into the
American Customer Satisfaction Index (ACSI). The ACSI model rests on the
relationships between the customers evaluated characteristics such as perceived quality,
perceived value, price tolerance, willingness to repurchase and recommendation of the
product or service to others (Fornell et al., 1996). Put simply by Fornell et al (1996, p.
“Customer Satisfaction in the MAS” Chapter 2: Literature Review
17
10), “Customer satisfaction is when your customers come back and your products
don’t”.
2.1.1 Importance of customer satisfaction
The significance of customer satisfaction to the business world is the concept that a
satisfied customer will be a positive asset for the company through reuse of the service,
repurchase of the product or positive word of mouth, which should lead to increased
profit. The converse of this is that a dissatisfied customer will tell more people of their
dissatisfaction, possibly complain to the company and if sufficiently disenfranchised,
change to another company for their product or service, or totally withdraw from the
market (Anderson and Sullivan, 1993; Fornell, Ittner and Larcker, 1995; Oliva, Oliver
and Bearden, 1995).
2.1.2 Perception of customer satisfaction
Customer satisfaction studies tend follow two different models. These models have
been dubbed the “customer concerns” and the “organisational concerns” approach.
There are also an infinite number of shades of grey in-between the two extremes
(Wittingslow and Markham, 1999).
The model of customer satisfaction chosen in a study reflects the culture of the
organisation conducting the study. The type of model chosen has consequences for
defining customer satisfaction. A company that is driven by the importance of what it
believes it is doing and the importance of its market approach, tends to interpret
“Customer Satisfaction in the MAS” Chapter 2: Literature Review
18
customer satisfaction as what the customer should want, against these organisational
and marketing needs (Yi, 1990; Dutka, 1994). If however the organisation has a culture
where the customer is seen as being an independent entity who has his/her own motives
beliefs and needs, then customer satisfaction will be defined as being based upon
customer thinking (Wittingslow and Markham, 1999).
Wittingslow and Markham, (1999) suggest that we perceive the world around us in an
egocentric and selective way. Because we can’t take in all the images, sensation and
feelings that are experiencing continually, we select those that are the most important.
A result of this filtering process is we can not evaluate, with any accuracy, a thing we
have either consciously or unconsciously selected out. The sequela of this, for customer
satisfaction research, is that asking questions on an issue that the respondent has
selected out or not experienced produces problems for the data set produced. Either the
respondent chooses an answer at random (inducing noise into the data set) (Andrews,
1984) or replies with a “Don’t Know / Not applicable” (resulting in missing data). To
minimise this problem, the respondent must be asked question that draw from their
experience and are in language that they understand (Wittingslow and Markham, 1999).
In this study, customer satisfaction will be defined as “those perceptions that act on the
decision process to use, subscribe, reuse and resubscribe to the MAS.” The various
schools of thought on customer satisfaction will now be examined.
“Customer Satisfaction in the MAS” Chapter 2: Literature Review
19
2.2 The Nature of Customer Satisfaction
Before customer satisfaction can be measured, the nature of satisfaction itself must be
determined. As Johnson, Anderson and Fornell, (1995) stated, “The modelling of
customer satisfaction depends critically on how satisfaction is conceptualised.” This
aspect however is controversial. Some of the disputed characteristics of customer
satisfaction are, the nature of satisfaction, whether satisfaction is cumulative, or
transaction specific, and the merits of measurement at the individual compared to the
market level.
2.2.1 Social Sciences theories of the nature of satisfaction
There have been many approaches in defining the consumer satisfaction/ dissatisfaction
construct and how the various customer factors such as cost or product performance
impact on satisfaction.
1. Equity Theory. - According to equity theory, satisfaction occurs when a given
party feels that the ratio of their outcomes of a process is in some way in balance
with their inputs such as cost, time and effort (Brooks, 1995).
2. Attribution Theory - in this theory the outcome of a purchase is thought of in terms
of success or failure. The cause of the satisfaction is either attributed to factors that
are internal such as the buyers’ perceived buying abilities or external such as
difficulty of the buying task, other peoples efforts or luck (Brooks, 1995).
“Customer Satisfaction in the MAS” Chapter 2: Literature Review
20
3. Performance Theory - customer satisfaction is directly related to the product or
services’ perceived performance characteristics (Brooks, 1995). Performance is
defined as the customers’ perceived level of product quality relative to the price
they pay. That is satisfaction is equated with value, where value equals perceived
quality divided by the price paid (Johnson, Anderson and Fornell, 1995).
4. Expectancy Disconfirmation Theory - Brooks (1995) stated that Expectancy
Disconfirmation Theory, at the time of the publication of his research, was the most
popular of all the social science theories. In this theory, customers form expectations
of product performance characteristics prior to purchase. When the product is
bought and used, the expectations are compared with actual performance using a
better-than, worse-than heuristic. Positive disconfirmation results if the product is
better than expected while worse than expected performance results in negative
disconfirmation. Simple confirmation results when a product or service performs as
expected. Satisfaction is expected to increase as positive disconfirmation increases
(Liljander and Strandvik, 1995).
2.2.2 Statistical History of customer satisfaction
The first work in the area that would become mathematically based customer
satisfaction was carried out in the 1920’s by sociologists studying mass behaviour using
primarily percentage analysis. By the 1940’s, scaling and ratings were at the cutting
edge of consumer science. The jump from correlation to equations was the major
development in the 1950’s. The first generation of multivariate analysis occurred in the
“Customer Satisfaction in the MAS” Chapter 2: Literature Review
21
1960’s. These methods however were limited in their ability to bring together theory
and data. They also were restricted in processing behavioural data by their failure to
incorporate auxiliary measurement theories, i.e. the theoretical assumptions made
during measurement, that, if excluded from the empirical model, would bias estimates
and confound results (Blalock 1982, Fornell, 1988).
The increasing availability of computer technology in the late 1960’s and early 1970’s
enabled the widespread use of multivariate analysis in marketing (Sheth, 1971). The
new methods of simultaneous analysis of multiple variables displaced the older
techniques of univariate and bivariate analysis. The new processes included multiple
regression, multiple discriminant analysis, factor analysis, principal components, multi-
dimensional scaling and cluster analysis. The multivariate revolution of the early
1970’s became established within academia by 1980 and became commonly used in
commercial marketing research by 1982 (Bateson and Greyser, 1982).
Around 1982 a new multivariate technique appeared which was claimed brought
together the areas of psychometrics, econometrics, quantitative sociology, statistics,
biometrics, education, philosophy of science, numerical analysis and computer science
(Fornell, 1988). This technique was dubbed the Swedish Satisfaction Barometer
(Fornell, 1988). Claimed advantages of this methodology were that it corrected for
measurement imprecision, isolated effects, modelled a system of relationships and
provided a basis for cause-and-effects interpretation. By the 1990’s the method had
developed by researchers such as Fornell, Anderson, Johnson, Cha and Bryant at the
National Center for Quality Research (NCQR) into the American Customer Satisfaction
“Customer Satisfaction in the MAS” Chapter 2: Literature Review
22
Index (ACSI), an aggregate, prospective, predictive customer satisfaction measure. The
ACSI will be discussed further in section 2.4.4 (p. 28).
2.3 Concepts of Satisfaction Performance
2.3.1 Gap theory
Parasuraman, Zeithaml and Berry (1988) suggested that expectations in the satisfaction
literature have been used as predictions of service performance, while expectations in
the service quality literature were viewed in terms of what the service provider should
offer. Later Zeithaml, Berry and Parasuraman (1993) modified this distinction,
introducing two different levels of expectations and proposing the existence of a zone of
tolerance between these levels. They argued that satisfaction is the function of the
difference or gap between predicted service and perceived service, while perceived
service quality is the function of the comparison of adequate or desired service with
perceived service performance.
2.3.2 Catastrophe theory / fuzzy logic
Most models of customer satisfaction assume a linear relationship between the effect of
various causes such as expectancy disconfirmation on the consumer’s reaction to a
product or service. Oliva, Oliver and Bearden (1995) put forward the concept of
involvement with a product or service. They suggested that at a low level of
involvement the traditional linear assumptions hold true. However, at high levels of
“Customer Satisfaction in the MAS” Chapter 2: Literature Review
23
involvement the relationship becomes “sticky”. That is, the consumers do not shift
preferences over a range of reported performance. Instead, the perceived performance
level declined until it reaches a cusp where the consumer suddenly abandoned the
product in favour of a competitor. Later when the perceived performance of a product
improves, the consumer will not re-purchase until there is large advantage in doing so.
2.3.3 Transaction-specific satisfaction and cumulative satisfaction
Johnson, Anderson and Fornell (1995) suggested there were two concepts of customer
satisfaction in the literature: transaction-specific satisfaction and cumulative
satisfaction. Transaction specific customer satisfaction focuses on individual consumer
responses to individual products and services while the cumulative one describes the
total consumption experience of a customer with a product or service (Anderson and
Fornell, 1993; Boulding et al., 1993).
Some disagreement exists in transaction-specific satisfaction. Parasuraman, Zeithaml
and Berry (1988) suggested that perceived service quality was an antecedent to
transaction-specific satisfaction while Bitner (1990) and Bolton and Drew (1991)
believed that transaction-specific satisfaction is an antecedent to perceived service
quality.
Johnson, Anderson and Fornell (1995) argued that while enterprises had a practical
need to conduct transaction specific research on customer satisfaction, this action did
not contribute to the generation of empirically generalised theories and models on
satisfaction. They suggested that a market level or aggregate approach to customer
“Customer Satisfaction in the MAS” Chapter 2: Literature Review
24
satisfaction was more likely to overcome problems in reconciling the variation of
findings at the individual level.
2.3.4 Individual (disaggregate) satisfaction
A large amount of customer satisfaction literature is based on the model of disaggregate
(individual level) satisfaction with services or goods (Yi 1991). These disaggregate
studies show the scope of human behaviour. However, Yi (1991) and Anderson and
Sullivan (1993) have reported problems with the empirical “generalizability” of these
studies. Johnson, Anderson and Fornell (1995) argued that the attitudes and behaviour
of individuals might be so unique that reliable generalisations cannot be determined
from individual level studies. As a solution to this problem, they suggested the
aggregation of individuals to produce a market level satisfaction.
2.3.5 Market level (aggregate) satisfaction
Little work has been done on aggregate or market level customer satisfaction. Market
level satisfaction is the aggregate satisfaction of all those who purchase and consume a
particular product. Johnson, Anderson and Fornell (1995) reported that the aggregation
of individual responses served to improve the power of the measurement by reducing
the error in measurement of satisfaction variables and increasing the verification of
coherent relationships with other variables. They suggested that the aggregation might
also increase the sensitivity to relationships between consumer attitudes and subsequent
purchase behaviour.
“Customer Satisfaction in the MAS” Chapter 2: Literature Review
25
Market level satisfaction has been found to be reasonably stable over time (Johnson,
Anderson and Fornell 1995). Market performance expectations have a large rational
component yet remain adaptive to changing market conditions.
Johnson, Anderson and Fornell (1995) identified three antecedents of their market
model: performance (perceived product quality relative to price), expectation (attitudes
or beliefs about the degree of performance) and disconfirmation (the degree to which
perceived performance confirms performance expectations). They suggested that
disconfirmation has an important role in developing transactional models of satisfaction
although it is a problematic concept.
2.4 Measuring Customer Satisfaction
Various methods have been used to measure customer satisfaction. Many customer
satisfaction measures however are created without consideration of to their final use. In
particular, they are not designed for easy interpretation by managers looking to best
implement change in their organisation (Fornell, Ittner and Larcker, 1995). Those that
have been used include:
2.4.1 The Top box method
The very common “Top-box” surveys where the respondent ticks one of a small number
of boxes suffer from a number of limitations. The small number of scale points results
in a significant measurement error in the indices. This makes small changes in
customer satisfaction difficult to track (Fornell, Ittner and Larcker, 1995). When filling
“Customer Satisfaction in the MAS” Chapter 2: Literature Review
26
out a survey form, respondents will rarely use extremes. So if boxes numbered 1 to 5
are presented to an individual, the responses 1 and 5 are rarely used. This effectively
reduces the scale to one of three points with the mean average normally in the range 3
to 4. There is a tendency for researchers, when analysing data from Top-box surveys, to
add together the top two boxes, generally an “excellent” and “good” rating and then to
use the resulting percentage value as the number that are satisfied (Patterson, 1996;
Quint and Fergusson, 1997). As well as oversimplifying the concept of customer
satisfaction, this reduces the sensitivity of the measure to changes such as customers
going from a good to an excellent rating.
2.4.2 The SERVQUAL method
SERVQUAL was developed by Parasuraman, Zeithaml and Berry (1988) and is based
on the service quality “gap model”. The gap model defines service as a function of the
gap between customers’ expectations of a service and their perceptions of the actual
service delivery by an organisation. Although widely used (Hemmansi, Strong and
Taylor, 1994), SERVQUAL has had a number of criticisms including multicollinearity
(Chen, Gupta and Rom, 1994) and psychometric problems (Brown, Churchill and Peter,
1993). Smith (1995) considered it of questionable value for either practitioners or
academics.
The above two techniques are the main systems utilised by researchers. However, they
are affected by several problems. The most important of these is that they fail to
provide insight into the determinants of customer satisfaction that have the greatest
influence on purchase, repurchase and price tolerance that lead to the highest economic
returns for the supplier.
“Customer Satisfaction in the MAS” Chapter 2: Literature Review
27
2.4.3 National Centre For Quality Research (NCQR) method
The basic model for estimating the NCQR consists of a system of equations describing
relations among six constructs, perceived quality, customer expectations, perceived
value, customer satisfaction, customer retention and customer complaints. Each
construct is measured using multiple questionnaire items to increase the precision of
measurement. Each of the questions is measured on a ten-point scale to enhance
reliability and reduce error in the indices. This also increases the ability to track small
changes that may be lost using a more coarse scale.
The data is analysed using a proprietary version of partial least squares modelling
(PLSM) to produce a customer satisfaction index (Fornell, Ittner and Larcker, 1995). It
is claimed that the index has a high correlation with customer repurchase intention and
price tolerance and hence economic performance because of the weighting of individual
items such as overall satisfaction, confirmation to expectation and comparison to ideal
(Fornell, Ittner and Larcker, 1995). The index was developed to overcome
shortcomings in ability to directly link quality improvements with changes in financial
performance.
The NCQR methodology can be used at both the macro and micro level. Examples of
the macro level applications are the Swedish Customer Satisfaction Barometer and the
American Customer Satisfaction Index. Used this way it is a national measure of how
well companies and industries satisfy their customers (Fornell, 1992). It measures
economic performance in regard to quality from a customer perspective. This may be
“Customer Satisfaction in the MAS” Chapter 2: Literature Review
28
compared with a productivity index, which also measures economic performance but
refers to quantity.
The micro level application of the NCQR methodology focuses on a single business. It
assists in the managing of the overall business strategy by concentrating on the retention
of customers rather than the more common emphasis on recruiting new clientele. The
methodology considers the customer base to be an asset. It aims to measure what
variables affect customer satisfaction and retention and it is claimed that the
methodology can predict what will be the impact of changes to the variables upon reuse,
recommendation, repurchase and price tolerance (Fornell et al., 1996).
2.4.4 Macro applications of the NCQR method
The National Centre for Quality Research methodology was used first by the Swedish
Customer Satisfaction Barometer (SCSB) in 1989 (Fornell, 1992). Although many
individual companies and some industries had measured customer satisfaction, this was
the first time a nation had done so (Fornell, 1992).
A further evolution of the cumulative and aggregate market approach is the American
Customer Satisfaction Index (ACSI) that was first developed in 1982, tested, further
modified and implemented by Fornell, Johnson, Anderson, Cha and Everitt-Bryant in
1995 (Fornell et al., 1996). The ACSI is the macro face of the NCQR methodology;
instead of dealing with an individual company, it is a national economic indicator of
customer evaluations of the quality of goods and services of the major corporations in
the particular economy. The development of the ASCI model is based on aggregated
market relationships between underlying customer characteristics such as perceived
“Customer Satisfaction in the MAS” Chapter 2: Literature Review
29
quality, perceived value, customization, reliability, customer expectations and price
tolerance (Fornell et al., 1996).
The World Quality Council (WQC), the international peak quality body, has been
deliberating on methods by which quality could be measured across, dissimilar
products, services and nations. In 1997, the Secretary General of the WQC
recommended that the member countries develop their own Customer Satisfaction
measures based on the NCQR from the Business School of the University of Michigan
(WQC, 1997).
2.4.5 Micro applications of the NCQR method
The NCQR methodology that is used for the SCSB and the ACSI can be customised for
application at the micro or individual company level. This is done by conducting initial
qualitative research by non directive interviews with customers and staff to determine
the drivers of customer satisfaction and the economic consequences of the satisfaction
that are unique to that company. From this a preliminary model of the customer
satisfaction, customer generated drivers of satisfaction are constructed and grouped into
latent variables. These latent variables impact to various degrees onto the overall
satisfaction. Changes in the overall satisfaction affect the economic consequences or
outcomes of price tolerance and loyalty in terms of re-purchase and recommendation to
others.
“Customer Satisfaction in the MAS” Chapter 2: Literature Review
30
From the survey results, it is possible to estimate the financial consequences of changes
in the satisfaction drivers through factors such as quality initiatives. See section 3.3.4.2
(p. 56) for a detailed discussion on the methodology.
2.5 Medical Care Satisfaction Literature
2.5.1 The importance of satisfied patients
The generalised ramifications of satisfaction that apply to other customers were also
found in medical patients. Patients that were satisfied were more likely to return to a
particular doctor or hospital, less likely to leave private health insurance, and less likely
to sue of negligence (Ware and Hays, 1988; Stelber and Krowinski, 1990; Weiss and
Senf, 1990; Aharony and Strasser, 1993; Levinson et al., 1997). Satisfied patients were
also more compliant with their medical therapy and as a result had better clinical
outcomes (Greenfield, 1985; Rubin, 1989; Kaplan, Greenfield and Ware, 1989; Hauck,
1990; DiMatteo et al., 1993).
Welch et al. (1999) argued that patient perception of health care quality reflected
underlying satisfaction with care. They suggested that patient satisfaction was as
important as any other outcome of medical care, particularly in the elderly population.
Thomas (1998) asserted that patient satisfaction was a critical variable in any
calculation of quality or value of medical services. He observed that the science of
“Customer Satisfaction in the MAS” Chapter 2: Literature Review
31
medicine was the technical side while the art of medicine was the patient satisfaction
side.
2.5.2 Determinants of patient satisfaction
Many factors have been reported as influencing patient satisfaction with medical care.
They include:
Age - Older patients tended to be more satisfied with their medical care (DiMatteo and
Hays, 1980). The researchers suggested that this may have been due to the patients’
longer than average relationship time with their care providers.
Gender - Lieberman (1989) found that women had higher satisfaction levels than men.
This contrasted with the earlier work of Gray (1980) and Greenley and Schoenherr
(1981) that found no gender bias in satisfaction.
Income - Many studies found that wealthy patients are more satisfied than poor patients
(Chaska, 1980; Patrick, Scrivens and Charlton, 1983; Calnan, 1988). They suggested
reasons such as poorer patients received less continuity of doctors, less salubrious
hospitals and paid a proportionately more for medical prescriptions.
Cost - Sing (1990) found using factor analysis that satisfaction with a medical insurance
provider tended to be very independent dimension from satisfaction with medical care
providers. That is, the patients could rate the medical care highly while having low
satisfaction with their medical insurance providers and vice versa.
“Customer Satisfaction in the MAS” Chapter 2: Literature Review
32
Race – Murray-Garcia et al. (2000) found significant differences in the level of
satisfaction different racial and ethnic groups reported with medical care providers.
They found that Blacks reported the highest satisfaction, followed by Whites while
Asians tend to report lower levels. However, the group was unsure if this reflected
higher expectations or differences in quality of care.
Staff - Many studies on medical services reported factors relating to staff as having the
most impact both on overall satisfaction and on tendency to recommend the service to
others (Quint and Fergusson, 1997; Garney, 1998; Press and Garney, 1998; Weinsing et
al.; 1998, Brown et al., 1999). The exact description of what aspects of the
interpersonal interface were the most important varied greatly depending on the study.
Quint and Fergusson (1997) in their study of patients of Victorian public hospitals
found that the key drivers of very high patient satisfaction were communication aspects,
compassion, reassuring attitude, courtesy and availability of staff. Press and Garney
(1998) reported that staff sensitivity to the problems of the patient was the most
important influence in recommendation of that hospital to others. The lesser important
interpersonal factors found were, staff concern about patient privacy, nurse's attitude
toward being summoned and friendliness of nurses. Weinsing et al. (1998) found that
“informativeness” and “humaneness” were among the factors most often cited as
important to patients. Garney (1999) found that the issues most influencing the
likelihood of a patient recommending a hospital were, staff sensitivity to the
inconvenience that health problems can cause, staff concern for patient privacy, amount
of attention paid to patients special needs, degree to which nurses took patients health
problem seriously, nurses attitude towards being called and the friendliness of the
“Customer Satisfaction in the MAS” Chapter 2: Literature Review
33
nurses. Dale and Howanitz (1996) found meeting an outstanding employee was
correlated with higher satisfaction rates.
Some authors believed that the patient’s evaluation of the communication skills of their
treating clinician was a critical determinant of patient satisfaction (Rowland-Morin and
Carroll, 1990; Hall et al., 1994; Frederickson, 1995; Roter et al., 1997). Brown et al.
(1999) found that patient satisfaction did not increase after a short training session on
communication skills for general practitioners. They suggested that such skills training
programs might need to be longer and teach a broader range of skills to have an effect
on patient satisfaction.
Response - Promptness of response to call button was found by Press and Garney
(1998) to be of importance to hospital patients. Garney (1999) found this also
influenced the likelihood of a patient recommending a hospital. Time waiting for
admission was found to be a factor by Quint and Fergusson (1997). Dale and Howanitz
(1996) also found that shorter waiting times were correlated with higher satisfaction
rates in patients.
Clinical Skill - Patients find it difficult to evaluate the clinical skill of medical
providers (Berry, 1995). Quint and Fergusson (1997) stated that the technical skills of
medical staff are assumed to be high and it was the “personality” aspects of a hospital,
which appeared to play a greater roll in patient satisfaction. Other studies found clinical
skill to be important. Baker (1991) established that quality of medical care was one
determinate of patient satisfaction with their general practitioner. Dale and Howanitz
(1996) found that professional treatment and discomfort less than expected, correlated
“Customer Satisfaction in the MAS” Chapter 2: Literature Review
34
with higher satisfaction rates. Weinsing et al. (1998) reported that patients often cited
competence and accuracy as important in their satisfaction with a general practitioner.
Garney (1999) found that the technical skill of nurses influenced the likelihood of a
patient recommending a hospital.
Other Determinates – Other factors that patients found influenced their satisfaction
with their general practitioner were accessibility, continuity, availability, premises
where patients were involved in decisions, time for care, accessibility and availability
(Baker, 1991; Baker and Streatfield, 1995; Weinsing et al., 1998).
In regard to hospitals involvement of the patient in decisions, adequate information
about treatment, less injections, quality of meals, overall cheerfulness of the Hospital
were found to influence satisfaction and the likelihood of a patient recommending a
hospital (Dale and Howanitz, 1996; Quint and Fergusson, 1997; Garney, 1999).
Overall Satisfaction
The patient's overall satisfaction with care is influenced by their medical outcome
(O’Connor et al., 1999). As discussed above interpersonal factors play a important role.
Lumley, Brown and Small (1993) suggested that there was a tendency for patients to be
uncritical of health care workers, particularly immediately after the event. This perhaps
would lead to high satisfaction scores if customers were surveyed immediately after
their experience.
The high satisfaction usually found when measuring patient’s evaluation of medical
care caused problems in interpreting surveys (Stelber, 1988). As an example, Quint and
“Customer Satisfaction in the MAS” Chapter 2: Literature Review
35
Fergusson’s (1997) survey of Victorian Hospital recorded high levels of satisfaction.
Quint and Fergusson found that in regard to overall satisfaction, 76% of patients were
“very satisfied” and 20% “fairly satisfied”. A high 96% of patients said they would
recommend the hospital to friends and family. In terms of perception of the quality of
care, 55% rated it as excellent, 32% as very good and 10% as good.
“Customer Satisfaction in the MAS” Chapter 2: Literature Review
36
2.6 Ambulance Customer Satisfaction Literature
2.6.1 Australian ambulance satisfaction studies
The literature shows high satisfaction with Australian ambulance services. However,
none of the publicly reported Australia ambulance satisfaction surveys are directly
comparable to the proposed ACSI methods.
Patterson's (1996) survey of the patients transported by the Queensland Ambulance
Service (QAS) used the top-box method. She reported that of the 903 responses, 80%
rated QAS as excellent and 17% as good.
North West Region – Ambulance Service Victoria’s (NWR–ASV) (1998) survey
reported a 99% affirmative response to the yes / no question “was the patient satisfied
with the overall service provided?” The author then felt the need to point out that the
single “no” vote was received from a patient being transferred between psychiatric
institutions. Both surveys reported good response to questionaries via mail, Patterson
(1996), reported a 45.2% return rate among a cohort of transported patients that
included 95% subscribers. NWR–ASV (1998) had a 37% return rate after sampling
every tenth case it responded to in October 1998. This high response rate is echoed in
the USA where Fultz, Coyle and Reynolds (1998) reported a 61% response rate to a
mail survey of 400 medical patients transported by air ambulance.
“Customer Satisfaction in the MAS” Chapter 2: Literature Review
37
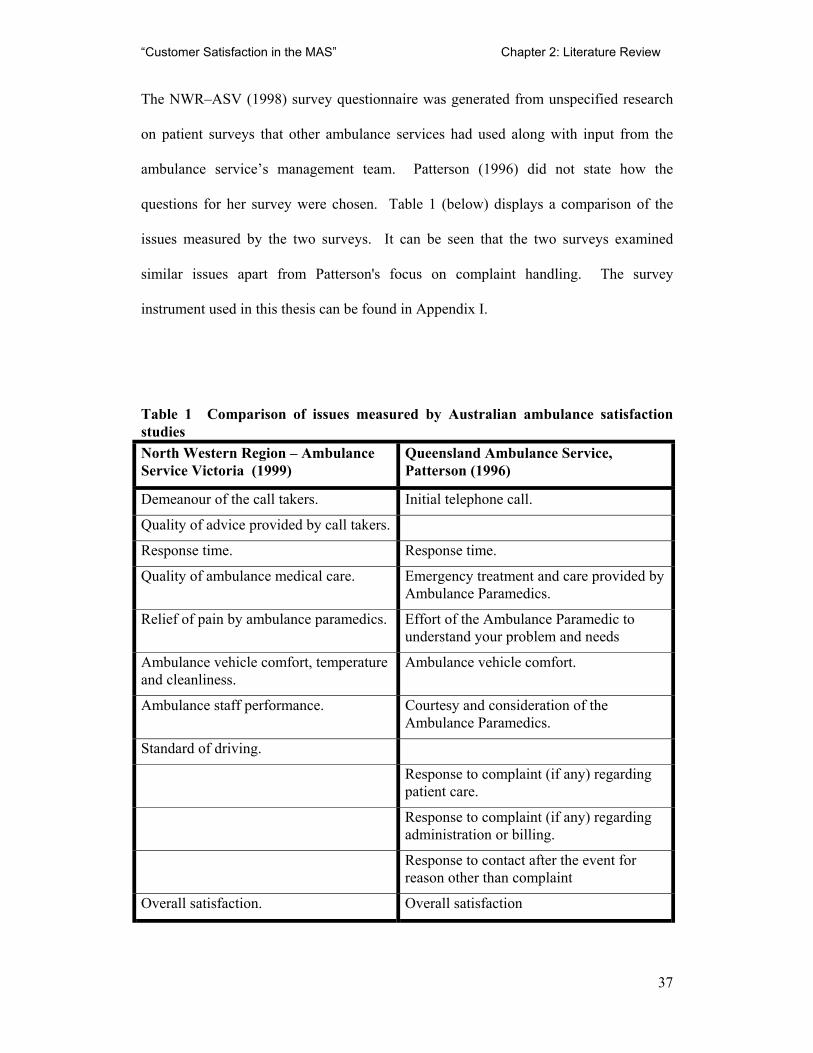
The NWR–ASV (1998) survey questionnaire was generated from unspecified research
on patient surveys that other ambulance services had used along with input from the
ambulance service’s management team. Patterson (1996) did not state how the
questions for her survey were chosen. Table 1 (below) displays a comparison of the
issues measured by the two surveys. It can be seen that the two surveys examined
similar issues apart from Patterson's focus on complaint handling. The survey
instrument used in this thesis can be found in Appendix I.
Table 1 Comparison of issues measured by Australian ambulance satisfaction studies North Western Region – Ambulance Service Victoria (1999)
Queensland Ambulance Service, Patterson (1996)
Demeanour of the call takers. Initial telephone call.
Quality of advice provided by call takers.
Response time. Response time.
Quality of ambulance medical care. Emergency treatment and care provided by Ambulance Paramedics.
Relief of pain by ambulance paramedics. Effort of the Ambulance Paramedic to understand your problem and needs
Ambulance vehicle comfort, temperature and cleanliness.
Ambulance vehicle comfort.
Ambulance staff performance. Courtesy and consideration of the Ambulance Paramedics.
Standard of driving.
Response to complaint (if any) regarding patient care.
Response to complaint (if any) regarding administration or billing.
Response to contact after the event for reason other than complaint
Overall satisfaction. Overall satisfaction
“Customer Satisfaction in the MAS” Chapter 2: Literature Review
38
2.6.2 Australian ambulance emergency call takers
Dale (2000) studied the level of satisfaction of 423 telephone callers requesting
emergency ambulances from Intergraph Public Safety™ (IPS). Whilst IPS takes the
initial calls for service and dispatches the Metropolitan Ambulance Service crews, it is a
separate organisation. Dale’s (2000) study used non-directive telephone interviewing to
develop a customer-based questionnaire; then used simple descriptive statistics to
analyse the resulting data. The mail questionnaire achieved a 53% response rate. He
found that the main drivers of satisfaction with the call taking process were:
attentiveness, efficiency, professionalism, ability and perceived level of training of the
call takers. Dale (2000) reported a mean satisfaction with the call taking process of
8.62 on a scale of 1 to 10. Health professionals were less satisfied with the call taking
process with an average overall satisfaction on 7.9 on the same scale. Dale (2000) did
not explore the reasons for the differences or determine whether they were statistically
significant.
2.6.3 USA studies of ambulance services
Fultz, Coyle and Reynolds (1998) studied air ambulance patients in the USA, using a 4-
point Likert scale; the respondents discussed similar issues to the Australian studies.
They found that the issues, which were important to the patients and needed
improvements, were rapport with the crew, communications and operations.
“Customer Satisfaction in the MAS” Chapter 2: Literature Review
39
2.6.4 Customer perceptions and expectations of MAS
Baragwanath (1997a) in his Auditor General’s report into the MAS stated “The public’s
expectation of its ambulance service is that it will respond quickly to emergency calls
and provide quality clinical care to patients”(p.5). No one would argue that the quality
of medical care provided by an organisation, such as MAS is, not paramount in
importance, but the general public has little medical knowledge from which to judge
their pre-hospital care. Because of their technical nature, or other reasons, it is not
always possible for customers to know if a service was performed properly. Services
that are difficult for customers to judge even after they have been performed are known
as “black box services” (Berry, 1995). In effect, the service remains hidden or semi-
hidden as if in a black box. This is true of the MAS service, as the customer/patient has
little idea of the correct medical procedure. As a result, they are likely to form their
opinion of the service from other factors (Swan, 1989). Bachelet (1995) found that a
product’s perceived performance will tend to reflect its image when the customer is
unable to compare the service provided with other products. Swan (1989) suggested
that personal grooming, neat uniform, clean, well maintained vehicles, safe driving and
calm professional conduct of the ambulance officers were important factors for the
public in judging the performance of an ambulance service. He also suggested that
community first aid and CPR programs help positively affected the public’s perception
of an ambulance service. Ryan (1994) stated that customers, who are patients, needed a
high level of reliability for the provision of equal access to definitive care. Yet, it seems
that the staff interpersonal issues, not medical technical quality, were the main causes of
satisfaction and complaint (Lescun, 2000). In the wider literature, a study of customer
satisfaction with hospitals by Gilbert, Lumpkin and Dant (1992) found that, staff
“Customer Satisfaction in the MAS” Chapter 2: Literature Review
40
friendliness, was the most important followed by staff competence and cost. MAS’s
data on complaints (Lescun, 2000) demonstrated the importance of good interpersonal
skill and attitude for staff.
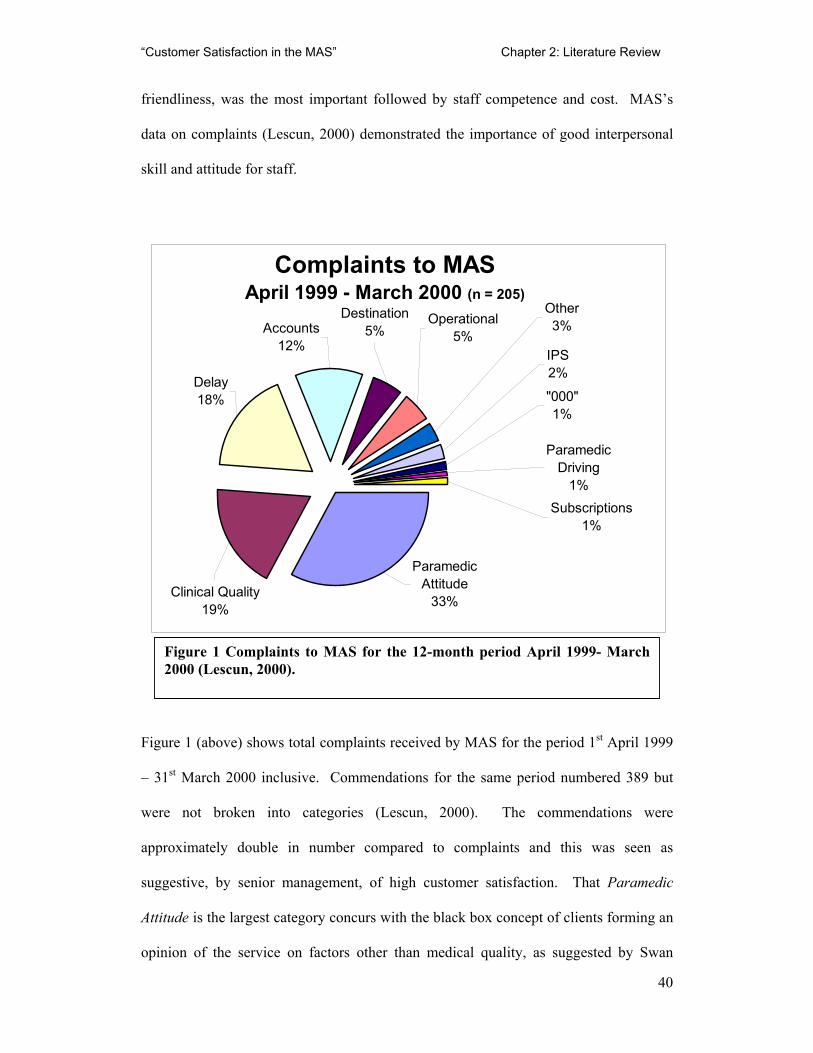
Figure 1 (above) shows total complaints received by MAS for the period 1st April 1999
– 31st March 2000 inclusive. Commendations for the same period numbered 389 but
were not broken into categories (Lescun, 2000). The commendations were
approximately double in number compared to complaints and this was seen as
suggestive, by senior management, of high customer satisfaction. That Paramedic
Attitude is the largest category concurs with the black box concept of clients forming an
opinion of the service on factors other than medical quality, as suggested by Swan
Complaints to MAS April 1999 - March 2000 (n = 205)
Delay18%
Paramedic Attitude
33%
Destination5%
Subscriptions1%
Operational5%
Paramedic Driving
1%
Other3%
"000"1%
Clinical Quality19%
IPS 2%
Accounts12%
Figure 1 Complaints to MAS for the 12-month period April 1999- March2000 (Lescun, 2000).
“Customer Satisfaction in the MAS” Chapter 2: Literature Review
41
(1989). Some 19% of the complaints were categorised as relating to Clinical Quality,
so medical quality was perceived to be a factor by customers. Delay related to time until
the ambulance arrived. Accounts related to the billing of customers that were not
otherwise coved by subscription or a Health Care Card; Destination related to the
choice of Hospital by the ambulance crew. Operational was concerned with system
problems. IPS was Intergraph Public Safety™, the private company that dispatched the
Ambulances (as was discussed section 2.6.2, page 38). 000 is the Australia wide
emergency phone number, comparable to “911” in the USA or “999” in the UK. This
service was staffed by Telstra™ employees, not MAS. Paramedic Driving and
Subscriptions are self-evident.
2.6.5 MAS and quality
In 1997, all MAS’s non-emergency stretcher contractors were accredited to ISO 9002
(MAS, 1997). MAS as a whole achieved ISO 9001-2000 in 2001 (MAS, 2001). MAS
have not published a document that deals directly with customer satisfaction. It does
however have a Total Quality Assurance Program with a stated goal of continuing
improvement in the quality of care delivered by the MAS. It acknowledges that the
MAS’s core business is that of patient care (Csupor, 1997)
MAS currently measures the quality of its service by clinical indicators. Csupor (1997)
stated that the crew members first complete an informal clinical audit at the time of
service delivery, in the form of self or peer appraisal. A more formal clinical In-field
audit is performed by a Clinical Support Officer (CSO). The CSO observes the
individual ambulance paramedic’s clinical performance, patient care at the scene and
later at the hospital handover. This enables the CSO to make measurements and
“Customer Satisfaction in the MAS” Chapter 2: Literature Review
42
judgments about the quality of that performance against the existing clinical standards.
Data recorded is passed to the clinical department for further analysis.
Polsky and Johnson (1994), reviewing continuous quality improvement in ambulance
services in the USA, found some processes were statistically in good control and met
the ISO 9002 definition of quality, but did not adequately meet customer needs or
expectations. They felt these processes needed to be examined, to identify
opportunities, to improve all future results.
Ryan (1994), however, stated that quality assurance in health care has been ineffective
in enabling good care. He found that quality assurance merely functioned to
retrospectively police the quality of care by identifying offenders who failed to adhere
to normative values. Ryan (1994) also stated that ambulance service managers must
seek out and incorporate the customers' perspective's as to their varying needs. Mattera
(1995) suggested that customer satisfaction was one of the dimensions that needed to be
measured on the change from quality assurance to continuous quality improvement in
prehospital care.
While the current MAS process for measuring quality maybe suitable for the ISO 9002
process, Csupor (1997) stated that the community would determine whether they
received quality service. She defined Quality Service as achieving community
satisfaction by the service provided. Currently MAS have no way of measuring
community satisfaction apart from indirectly in a qualitative manner via the print and
electronic media. The NCQR methodology would be suitable to meet the terms of the
MAS obligation, under ISO 9001:2000, of ensuring customer needs and expectations
“Customer Satisfaction in the MAS” Chapter 2: Literature Review
43
are determined and fulfilled (MAS, 2001). The NCQR methodology measures
satisfaction at the market level rather than the individual (Johnson, Anderson and
Fornell, 1995). For the MAS, its potential market and the community are arguably the
same population.
MAS are seeking to benchmark its performance against other ambulance services
throughout the world (Baragwanath, 1997a). Response times are one of these
benchmarks and are closely monitored by the MAS. Different emergency organisations
have various definitions of response time but it is generally regarded as referring to the
time from a person requesting an ambulance at the dispatch centre until the ambulance
arrives at the given address. The variation in definitions and differences in geography
and populations make this a difficult benchmark to apply fairly. Patients tended to
overestimate the response times, but under estimate the on-scene and transport times.
Harvey et al. (1999) suggested that actual response times often met patients’ stated
expectations; although the patients may not perceive that they have been met.
Another popular performance benchmark used amongst ambulance services is that of
successful resuscitation from cardiac arrest. This is a tantalising measure of quality of
medical service, from a product performance view. The resuscitation benchmark,
however, is confounded by different definitions of a successful resuscitation, what
constitutes a cardiac arrest, different response times and exclusion criterion.
Naumann and Giel (1995) suggested benchmarking using customer satisfaction.
Fornell et al. (1996) stated that the NCQR methodology for measuring customer
satisfaction could be used to benchmark across different industries. If the MAS could
“Customer Satisfaction in the MAS” Chapter 2: Literature Review
44
utilise the NCQR methodology it would not be restricted to comparing itself only with
other ambulance services and it could apply a more rigorous means of evaluation.
2.7 Conclusion
In summary, the definition of customer satisfaction that will be used in this research is
“those customer/patient perceptions that act on the decision process to reuse and
resubscribe to the MAS.” The rest of the thesis will apply the NCQR methodology as
described above in section 2.4.5 (p 29).
The next chapter will discuss how various methods of collecting customer satisfaction
data and an appropriate modelling tool examined and selected so the above definition
can be applied in a field study.
“Customer Satisfaction in the MAS” Chapter 3: Measuring Customer Satisfaction
45
3. Measuring Customer Satisfaction
3.1 Introduction
Having decided in chapter 2, on a working definition of customer satisfaction as “those
perceptions that act on the decision process to reuse and resubscribe to the MAS” the
next step is to measure the concept. Early methods of measuring customer satisfaction
such as percentage analysis, scaling, ratings and “the top box” method are still used in
the corporate world. Nevertheless, more advanced multivariate methods have been
developed. Analysis of variance is an example of the first developments of improving
analysis of data, while still a useful tool, it like other first generation multivariate
methods has problems bringing theory and data together. Second generational
multivariate methods such as Structural Equation Modelling (SEM) and Partial Least
Squares Modelling (PLSM) are able to combine theoretical and empirical knowledge.
SEM and PLSM are finding favour in a variety of applications but of interest here is
that of modelling customer satisfaction. In this chapter, it will be argued that PLSM in
particular is suited to measuring satisfaction because of its tolerance to the type of the
data generated by a customer survey.
3.2 Background of Measuring Customer Satisfaction
The first work in the area that would become mathematically based customer
satisfaction was done in the 1920’s by sociologists studying mass behaviour using
primarily percentage analysis. By the 1940’s, scaling and ratings were at the cutting
“Customer Satisfaction in the MAS” Chapter 3: Measuring Customer Satisfaction
46
edge of consumer science. The jump from correlation to equations was the major
development in the 1950’s. The first generation of multivariate analysis occurred in the
1960’s. First generation multivariate methods, like multiple regression, factor analysis,
analysis of variance and others have become extremely useful tools for researchers.
First generation methods help evaluate constructs and relationships between constructs.
However, such an evaluation has to be performed in subsequent steps. These methods
all are limited in their ability to bring together theory and data. They are also all
restricted in processing behavioural data by their failure to incorporate auxiliary
measurement theories, i.e. the theoretical assumptions made during measurement, that,
if excluded from the empirical model, would bias estimates and confound results
(Blalock 1982; Fornell, 1988).
3.3 Second Generation Modelling
The increasing availability of computer technology in the late 1960’s and early 1970’s
enabled the widespread use of multivariate analysis in marketing (Sheth, 1971). The
newer methods of simultaneous analysis of multiple variables displaced the older
techniques of univariate and bivariate analysis. The new processes included multiple
regression, multiple discriminant analysis, factor analysis, principal components, multi-
dimensional scaling and cluster analysis. The multivariate revolution of the early
1970’s became established within academia by 1980 and became commonly used in
commercial marketing research by 1982 (Bateson and Greyser, 1982). Claus Fornell
(1984) labelled these multivariate techniques, second generation.
Around 1982 a novel multivariate technique appeared that brought together the areas of
psychometrics, econometrics, quantitative sociology, statistics, biometrics, education,
“Customer Satisfaction in the MAS” Chapter 3: Measuring Customer Satisfaction
47
philosophy of science, numerical analysis and computer science (Fornell, 1988).
Instead of simply aggregating measurement error in a residual error term, this methods
simultaneously evaluate both the measurement model and the theoretical model. It
adjusts the relationships among the variables accordingly (Aubert, Rivard and Patry,
1995). Advantages of these methods are that they correct for measurement imprecision,
isolate effects, model a system of relationships and provide a basis for cause-and-effects
interpretation (Fornell, 1988).
3.3.1 Impetus to model customer satisfaction behaviour
Through the use of a coherent psychological model of customer behaviour, there is a
higher likelihood of being able to make sense of the empirical data collected. The raw
data from a customer satisfaction study can be dealt with in many ways. At the basic
level, it can be looked at in terms of cross tabulation and analysis of variance.
Alternatively, customer satisfaction data can be seen as a prime target for using
modelling methods because, the nature of customer satisfaction is that there are
contributory variables to satisfaction and also satisfaction leads to customer outcome
behaviour such as reuse and recommendation. Modelling provides the researcher with
the ability to explore possible causal connections between the various levels of
variables. If accurately modelled, it can also provide statistical information, which can
be a guide to predicting likely future behaviours of the customer population.
At a more general level, any approach to customer satisfaction, which uses the
customer's behaviour as its starting point also uses some underlying theory of human
behaviour. In this study, the underlying theory is the expectancy-value approach that
“Customer Satisfaction in the MAS” Chapter 3: Measuring Customer Satisfaction
48
has had extensive use in organisational behaviour (Gordon, 1996). This position states
that behaviour is determined by the interaction between the expectations the individual
has of an outcome and the valuation he/she places on that outcome. Applying this to
customer behaviour it can be seen that the customer has expectations of product/service
and places valuations (financial and affective) on that product/service. His/her
satisfaction will be strongly determined by the extent to which the performance of the
product/service is congruent with the prior expectancy/value system (Gordon, 1996).
Customer satisfaction researchers have used various second generation analytical
methods such as SEM, Factor Analysis, and Multidimensional Scaling. These
techniques are broadly concerned with defining the structural relationships between
variables. Loehlin (1992) suggested that SEM is the most flexible of these. The
statistical package LISREL® that is used in many areas of social and econometric
research is based on SEM (Long 1983). SEM is also used in market research (Maclean
and Grey, 1998).
“Customer Satisfaction in the MAS” Chapter 3: Measuring Customer Satisfaction
49
3.3.2 Partial least squares modelling (PLSM)
Partial Least Squares Modelling (PLSM) is related to SEM. PLSM is similar to
regression, but simultaneously models the structural paths (i.e., theoretical relationships
among latent variables) and measurement paths (i.e. relationships between a latent
variable and its indicators). PLSM has evolved from a class of least-squares models of
correlation matrices introduced in the 1920's by the biometrician, Sewall Wright.
Wright used the technique to link path analysis with factor analysis. The technique was
rediscovered in the 1960s and 70s and given its current name by Herman Wold, a
Swedish econometrician (Wold, 1980). PLSM originally went under the name Non-
linear Iterative Partial Least Squares (NIPALS), dating back to Wold's (1981) “fix-
point” algorithms of the 1960's. Wold's work evolved over three decades and many
articles. The focus of Wold's (1980) work was the process of producing models that
been developed from a set of empirical assumptions about behaviour as opposed to
generating theories about behaviour and then testing them with a modelling procedure.
SEM by comparison centres on testing theory while PLSM is about modelling empirical
systems. PLSM has been described as being close to the data while SEM is close to the
theory (Aubert, Rivard and Patry, 1995).
Wold dubbed PLSM, soft modelling. The PLSM approach, applied in this study,
defines the key elements of the model from the qualitative data collected. The research
begins with an empirical model and the field data collection is based upon it. PLSM
does not look for models within a data set, which has been collected with some general
latent variables in mind. The important difference between PLSM and SEM is that
“Customer Satisfaction in the MAS” Chapter 3: Measuring Customer Satisfaction
50
SEM emphases exploring various possible models which could explain the data
structures (Joreskog and Wold, 1982).
Wold (1982) stated that some aspects of his soft modelling technique was not fully
developed within theoretical statistics and admitted that approach was outside
conventional population-based statistical analyses. This has not stopped PLSM being
refined and used for a variety of applications over the years. The basic algorithms were
fine-tuned by Young (1994). Herman Wold’s son Sven (Wold and Sjostrom, 1977;
Wold, 1978) created specialised algorithms for PLSM in the field of Chemometrics
which deals with the evaluation of chemical and pharmaceutical problems. PLSM was
applied to a range of problems in psychology (Bookstein, 1991). In the field of
econometrics, the American Customer Satisfaction Index (Fornell et al., 1996) is based
on PLSM applied to Customer Satisfaction. Other Customer Satisfaction indices across
Europe and Asia also use PLSM (CFI, 2000; EOQ, 2000, Fornell, 2000).
3.3.3 Choosing an appropriate modelling tool
The choice of method of statistical analysis and modelling depends on many variables.
In situations where preceding theory is strong and additional evaluation and
development is the aim, covariance based full-information estimation methods, (i.e.
Maximum Likelihood or Generalized Least Squares) are used. Some widely known
software such as AMOS and LISREL® use a covariance fitting approach. However,
there exists a loss of predictive accuracy with these methods due to the indeterminacy of
factor score estimations. The component-based PLSM avoids two serious problems:
inadmissible solutions and factor indeterminacy (Fornell and Bookstein, 1982). The
potential loss of accuracy is tolerated when measuring customer satisfaction as the
“Customer Satisfaction in the MAS” Chapter 3: Measuring Customer Satisfaction
51
prime concern is testing the structural relationships (i.e. parameter estimation) among
concepts (Chin, Salisbury and Gopal, 1996).
PLSM is primarily intended for causal-predictive analysis in situations of high
complexity but low theoretical information. When comparing PLSM with SEM, one
major difference is the way in which models are estimated. PLSM uses Least Squares
estimation while SEM tends to use a Maximum Likelihood estimation procedure (Hahn,
Johnson and Herrmann, 2000). The Maximum Likelihood procedure depends on
having data that fulfils parametric criteria. PLSM, using Least Squares, has a much
lower requirement for parameterisation than SEM. Therefore PLSM can deal with data
that violates the parametric requirements of SEM. As a result of the lesser
parameterisation requirements, PLSM can handle smaller samples than other methods to
generate stable models (Wittingslow and Markham, 1999). For example, PLSM can
generate significant results with a sample size of 200 for complex models than involves
10 exogenous latent variables and 3 endogenous latent variables. By comparison,
covariance approaches would require samples of 500 to obtain stable results (Hahn,
Johnson and Herrmann, 2000). PLSM's ability to model latent constructs under
conditions of non-normality and small to medium sample sizes has made it popular use
among researchers (Aubert, Rivard and Patry 1994; Compeau and Higgins 1995; Chin
and Gopal 1995). PLSM also has a cumulative effect – with subsequent research on the
same population, using the same model, even smaller samples than the initial can
produce significant results (Fornell et al., 1996).
The PLSM algorithm adjusts weighting for each indicator in calculating the score of the
latent variable rather than assuming equal weights. This results in lower weightings for
“Customer Satisfaction in the MAS” Chapter 3: Measuring Customer Satisfaction
52
the indicators with weaker relationships to related indicators. This attribute makes
PLSM preferable to techniques such as regression, which assume error free
measurement when using data sets that contain noise (Wold, 1982, 1985 & 1989;
Lohmöller, 1984). As the reliability of the data declines, regression produces biased
and inconsistent coefficient estimates, along with a loss of statistical power (Busemeyer
and Jones 1983; Aiken and West 1991). When using regression, with perfect data, a
small effect (f = 0.02) would be detected at a power of 0.80 in a sample of n = 400, this
sample would need to increase in size to n = 1056 if the data was only 80% reliable
(Aiken and West, 1991).
Andrews (1984) showed that even scrupulously performed surveys had 20-30% “noise”
(and therefore produced data of 80-70% reliability). The noise is erroneous data due to
human variance. As a result when dealing statistically with a data set from a
questionnaire one must apply a methodology that can handle the inherent erroneous
data. While regression type methods can handle imperfect data sets, PLSM is must be
used if very large sample sizes are to be avoided.
Consequently the PLSM method is often more suitable for application and prediction.
PLSM assumes that all the measured variance is useful variance to be explained. Latent
variables are estimates as exact linear combinations of the observed measures, so
avoiding the indeterminacy problem and providing an exact definition of component
scores. The PLSM method uses an iterative estimation technique that provides a
general model, which encompasses, among other techniques, canonical correlation,
redundancy analysis, multiple regression, multivariate analysis of variance, and
principle components (Wold, 1982).
“Customer Satisfaction in the MAS” Chapter 3: Measuring Customer Satisfaction
53
A weakness of PLSM is that being a limited information method the bias and
consistency of parameter estimates are less than optimal. The estimates will be
asymptotically correct under the joint conditions of large sample size and large number
of indicators per latent variable. Otherwise, construct to loadings tends to be
overestimated and structural paths among constructs underestimated (Fornell and
Bookstein, 1982).
PLSM is considered capable of explaining complex relationships (Fornell and
Bookstein 1982; Fornell, Lorange and Roos, 1990). Wold (1985) suggested that PLS
was virtually without competition when analysing large, complex models with latent
variables. By the 1990’s, the method had developed by researchers such as Fornell,
Anderson, Johnson, Cha and Bryant at the National Center for Quality Research
(NCQR) into the American Customer Satisfaction Index (ACSI).
3.3.4 National centre for quality research method using PLSM
The NCQR research techniques are based on PLSM and it is this, which makes it
arguably the leading customer satisfaction method. The NCQR method’s predictive
power comes from the use of an econometric model which ties customers perceptions of
quality and value to satisfaction, and then explains the effects of that satisfaction on
consumer behaviour such as complaints, price tolerance and repurchase intentions.
While many other opinion surveys measure the same features they have so far failed to
match the reported accuracy of the NCQR in predicting customer behaviour in response
“Customer Satisfaction in the MAS” Chapter 3: Measuring Customer Satisfaction
54
to changes in the product or service experience and then to economic returns (Anderson
and Mittal, 2000).
The basic model for estimating the NCQR consists of a system of equations describing
relations among six constructs, perceived quality and value, and customer expectations,
satisfaction, retention and complaints. Each construct is measured using multiple
questionnaire items to increase the precision of measurement. The response to each of
the questions is given on a ten-point scale to enhance reliability and reduce error in the
indices.
The data is analysed using a patented version of the partial least squares (PLS)
mathematical technique to produce a customer satisfaction index. The index has a high
correlation with customer repurchase intention and price tolerance and hence economic
performance because of the weighting of individual items such as overall satisfaction,
confirmation to expectation and comparison to ideal (Fornell, Ittner and Larcker, 1995).
It was developed to overcome shortcomings in ability to directly link quality
improvements with changes in financial performance (Fornell, Ittner and Larcker,
1995).
The NCQR methodology can be used at both the macro and micro level. Examples of
the macro level applications are the Swedish Customer Satisfaction Barometer and the
American Customer Satisfaction Index. Used this way it is a national measure of
companies and industries as a whole satisfy their customers (Fornell, 1992). It
measures economic performance in regard to quality from a customer perspective. This
“Customer Satisfaction in the MAS” Chapter 3: Measuring Customer Satisfaction
55
may be compared with a productivity index, which also measures economic
performance but refers to quantity.
The micro level application of the NCQR methodology focuses on a single business. It
assists in the managing of the overall business strategy by concentrating on the retention
of customers rather than the more common emphasis on recruiting new clientele. The
NCQR methodology considers the customer base as an asset and measures what factors
affect satisfaction and retention. It can predict what result changes to the factors would
make in reuse, recommendation, repurchase and price tolerance.
3.3.4.1 Swedish customer satisfaction barometer (SCSB)
The National Centre for Quality Research methodology was used first by the Swedish
Customer Satisfaction Barometer (SCSB) in 1989 (Fornell, 1992). Although many
individual companies and some industries had measured customer satisfaction, this was
the first time a nation has done so. It was found that high scores were in industries
where customers tasted varied and the products were also heterogeneous. The
automobile industry is an example of this. There were also high scores when the
product was undifferentiated and the customers’ taste was also homogeneous:
consumers of milk or sugar for example. Low scores were the result when varied
consumer taste was not fulfilled with sufficient choice. Government monopolies such
as police and telecommunications were the best examples of this (Fornell, 1992).
3.3.4.2 American customer satisfaction index (ACSI)
An evolution of the cumulative and aggregate market approach is the American
Customer Satisfaction Index (ACSI) that was first developed in 1982, tested, further
“Customer Satisfaction in the MAS” Chapter 3: Measuring Customer Satisfaction
56
modified and implemented by Fornell and his colleagues in 1995 (Fornell et al., 1996).
The ACSI is the macro face of the NCQR methodology in that instead of dealing with
just with an individual company, it is a national economic indicator of customer
evaluations of the quality of goods of the major corporations in the particular economy.
The development of the ASCI model is based on aggregated market relationships
between underlying customer characteristics such as perceived quality, perceived value,
customization, reliability, customer expectations and price tolerance.
There is evidence in the literature for the accuracy of the NCQR methodology used in
the ACSI. A positive and significant relationship between customer satisfaction results
using the NCQR methodology and the performance of the companies using it was found
by Fornell and Bryant (1997). These include a significant and positive relationship
between the ACSI result and market-to-book values and price/earnings ratios. There is
also a negative relationship between ACSI and risk measures implying that firms with
high loyalty and customer satisfaction have stronger financial positions and less
variability (Fornell and Bryant, 1997).
Since the ACSI has been released, high rating ACSI and SCSB firms have out-
performed the stock market average. Further economic validity of the ACSI is shown by
the statistically significant stock market following public releases of ACSI results in the
USA. Since its release in 1994 the ACSI has predicted the stock market with precision
(Fornell, Ittner and Larcker, 1995).
The World Quality Council, the peak quality body, after deliberating on methods by
which quality could be measured across, dissimilar products, services and even nations,
“Customer Satisfaction in the MAS” Chapter 3: Measuring Customer Satisfaction
57
in 1997, recommended that the member countries develop their own Customer
Satisfaction measures based on the NCQR at the Business School of the University of
Michigan. The NCQR methodology has been adopted by the USA, Sweden, Israel,
Taiwan, South Korea and the European Union as the technique they have use to
measure Customer Satisfaction (CFI, 2000; EOQ, 2000; Fornell, 2000).
3.3.4.3 The NCRQ methodology at the micro level
As mentioned in 2.4.5 the NCQR methodology can be customised for application at the
micro or individual company level. This is done by conducting initial qualitative
research by non directive interviews with customers and staff to determine the drivers
of customer satisfaction and the economic consequences of that satisfaction that are
unique to that company. From this a preliminary model of the customer satisfaction is
constructed with the customer-generated drivers of satisfaction being grouped in to
latent variables. These impact to various degrees onto the overall satisfaction. From
the overall satisfaction are the economic consequences or outcomes of price tolerance
and loyalty in terms of re-purchase and recommendation to others.
A survey produced from the model presents a statement generated from the customer
interview and then asks for a response on a one to ten scale with a “don’t know” option.
In a similar way the respondent is questioned on their overall satisfaction with the
product, how it compares with an ideal and how it has met their expectations. The
respondents are then asked about their willingness to repurchase the product,
recommend it to other and their price tolerance.
“Customer Satisfaction in the MAS” Chapter 3: Measuring Customer Satisfaction
58
The data from the survey is analysed with a proprietary technique based on partial least
squares (PLS). The resulting data gives estimates on a scale from 0 to 100 on the
relationship between changes in driver scores and customer satisfaction and the
relationship between changes in customer satisfaction and customer loyalty. The data
also produces a performance rating for each of the drivers and their impact on customer
satisfaction.
From the above information, it is possible to estimate the financial consequences of
changes in the satisfaction drivers through factors such as quality initiatives. The drivers
of satisfaction that have a low satisfaction rating and a high impact are those that have
the greatest effect on customer satisfaction and hence repurchase, recommendation and
price tolerance. The methodology then allows for the calculation of the effect a quality
initiative would have on the value of the customer asset.
3.4 Conceptual Framework - Defining a Model's
Components
PLSM modelling, (refer to Fig. 2, p. 62) uses manifest and latent variables. A manifest
variable is one that can be measured directly. A latent variable is inferred from a set of
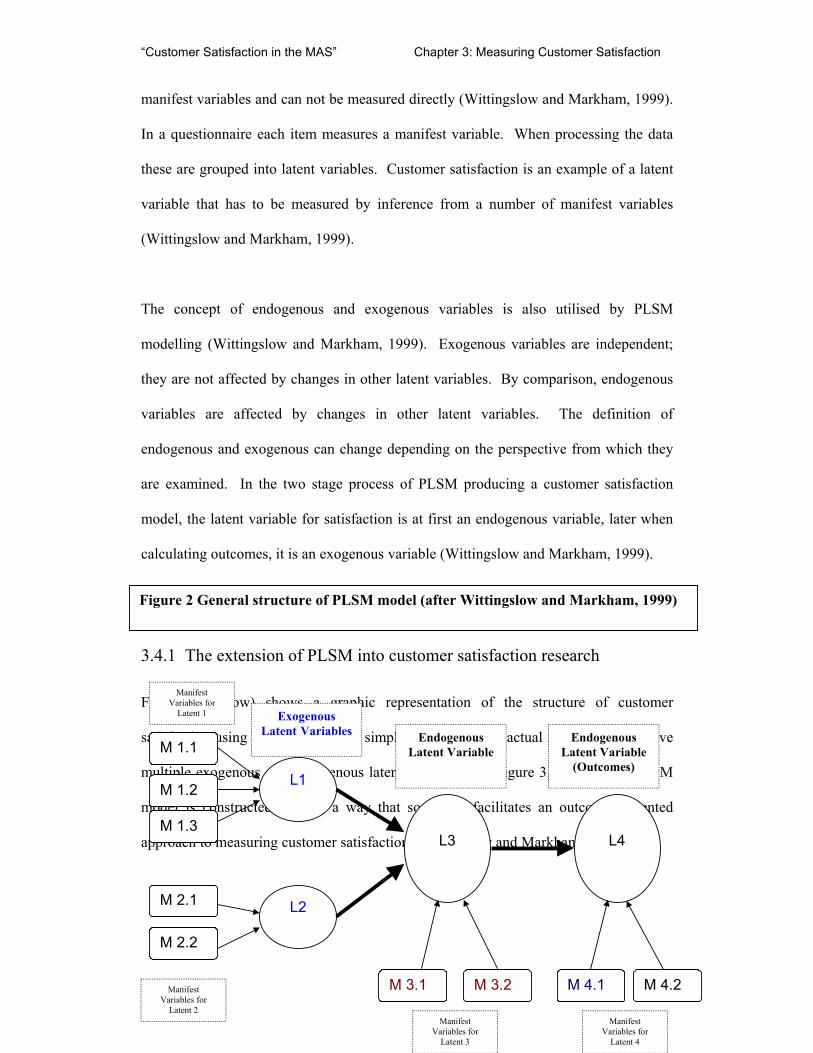
“Customer Satisfaction in the MAS” Chapter 3: Measuring Customer Satisfaction
59
manifest variables and can not be measured directly (Wittingslow and Markham, 1999).
In a questionnaire each item measures a manifest variable. When processing the data
these are grouped into latent variables. Customer satisfaction is an example of a latent
variable that has to be measured by inference from a number of manifest variables
(Wittingslow and Markham, 1999).
The concept of endogenous and exogenous variables is also utilised by PLSM
modelling (Wittingslow and Markham, 1999). Exogenous variables are independent;
they are not affected by changes in other latent variables. By comparison, endogenous
variables are affected by changes in other latent variables. The definition of
endogenous and exogenous can change depending on the perspective from which they
are examined. In the two stage process of PLSM producing a customer satisfaction
model, the latent variable for satisfaction is at first an endogenous variable, later when
calculating outcomes, it is an exogenous variable (Wittingslow and Markham, 1999).
3.4.1 The extension of PLSM into customer satisfaction research
Figure 2 (below) shows a graphic representation of the structure of customer
satisfaction using PLSM. This is a simplified version and actual models usually have
multiple exogenous and endogenous latent variables (e.g. figure 3, p. 68). The PLSM
model is constructed in such a way that so that it facilitates an outcomes oriented
approach to measuring customer satisfaction (Wittingslow and Markham, 1999).
M 1.1
M 1.2
M 1.3
M 2.2
M 2.1
L1
L2
L3
L4
M 3.1 M 3.2 M 4.1 M 4.2
Endogenous Latent Variable
Endogenous Latent Variable
(Outcomes)
Exogenous Latent Variables
Manifest Variables for
Latent 1
Manifest Variables for
Latent 2 Manifest
Variables for Latent 3
Manifest Variables for
Latent 4
Figure 2 General structure of PLSM model (after Wittingslow and Markham, 1999)
“Customer Satisfaction in the MAS” Chapter 3: Measuring Customer Satisfaction
60
The model displayed in figure 2 (p. 60) has three separate components:
1. L1 and L2 are the latent exogenous variables that influence overall satisfaction
These each have satisfaction measures are generated from the PLSM calculations
processing the associated manifest variables. For example, M1.1, M1.2 and M1.3
are the manifest variables that are used by the PLSM to produce the satisfaction
value for L1. This calculated value is based upon the weighted average of manifest
variables but are not a straightforward sum of the manifest scores. Each manifest
variable represents the mean value for the customer response to a particular question
2. L3 is the latent endogenous variable for overall satisfaction. It is this satisfaction
score that can be used as an overall measure to benchmark with other organisations.
3. L4 The latent endogenous variable(s) (only one shown for clarity) that measure(s)
the outcomes from satisfaction. These outcomes are typically factors such as
repurchase, reuse and recommendation.
Apart from producing a satisfaction score for each of the latent variables, a second
value is estimated that describes the impact of the exogenous latent variables on the
endogenous latent variables. For example this enables predictions to be made in regard
to changes in overall satisfaction and hence outcomes with known changes to
satisfaction with a given exogenous latent variable.
This study will test to see if the NCQR methodology for measuring customer
satisfaction at the micro (or corporation) level is applicable to a section of the customers
“Customer Satisfaction in the MAS” Chapter 3: Measuring Customer Satisfaction
61
of the MAS. The methodology used will be in line with that of the NCQR. It will
measure the customer’s level of customer satisfaction using the customer’s model of
customer satisfaction.
3.4.2 Conclusion
In summary, the definition of customer satisfaction that will be used in this research is
as those perceptions that act on the decision process to reuse and resubscribe to the
MAS. In the rest of the thesis, the NCQR methodology as described above in the last
Section 3.3.4.3 (p. 58) will be applied. The following chapter will attempt to model
satisfaction and successfully apply it to the MAS customer population.
“Customer Satisfaction in the MAS” Chapter 4: Methods
62
4. Methods
4.1 Introduction
In the previous chapters, the definition of Customer Satisfaction has been discussed and
a working definition suggested. The mathematical method for analysing the data has
also been discussed. In this chapter the necessary methodology will be developed.
In this study, the National Centre for Quality Research (NCQR) methodology
employing PLSM will be used. As discussed in chapter 3, the NCQR methodology
utilising PLSM is arguably the leading method for measuring customer satisfaction and
linking it to repurchase and reuse.
As mentioned in chapter 3, many methods have been used to measure customer
satisfaction. Many customer satisfaction measures however are created without
consideration of to their final use. In particular, they are not designed so that higher
satisfaction levels produce higher scores and in turn higher scores predict greater
financial performance (Fornell, Ittner and Larcker, 1995).
The two most popular methods are, Top Box and SERVQUAL. As discussed in chapter
2, they are affected by a number of major problems. The most important one of these
for organisations is that they fail to provide insight into the determinants of customer
“Customer Satisfaction in the MAS” Chapter 4: Methods
63
satisfaction which have the greatest influence on repurchase and price tolerance that
lead to the highest economic returns.
The remainder of this chapter will discuss the design of the instrument in the thesis
project and how it attempts to overcome the problems of the two most frequently
utilised methodologies.
4.2 Parameters used in the study
4.2.1 Sample frame
The MAS management interviews were in December 1997 and January 1998. The data
collection from the public was in October 1998. The geographic area of the study was
that of Greater Melbourne and districts. This mirrors the coverage area for the MAS.
The sample frame was those individuals who reside in the coverage area for the MAS.
4.2.2 Study groupings
Firstly, some terms must be defined.
Subscribers - Individuals who are covered by the subscription scheme. The
subscription scheme is akin to insurance.
“Customer Satisfaction in the MAS” Chapter 4: Methods
64
Health Care Card Holders (HCCH) - Individuals who hold a federal government
issued Health Care Card and therefore are eligible for free ambulance transport. There
are many specific groups entitled to free transport, unemployed and old age pensioners
for example, but no attempt was made to study division within this particular grouping.
These two groupings were chosen to assess the difference in customer satisfaction
between people who are paying an annual fee for a service and those who are not
(neither group pays for each individual service.) Some old age pensioners also have a
subscription to the MAS. The pensioners are aware that they get the service for free
without subscribing, but tend to view it as a donation.
Both Subscribers and HCCH’s receive the same service. Usually the MAS employee
providing the service does not know if the customer is a subscriber or not until
transport is initiated and the subscriber card or HCC is requested. All groups were
drawn from the same geographic areas. All groups were sampled in the same time
frame. Subscribers have to pay an annual fee to MAS (analogous to an insurance fee)
for service unlike the HCCH customers. This requires the subscribers have to have an
annual interaction with MAS subscription department, by telephone or mail, unlike the
HCCH. This fact may increase the subscriber’s involvement (Oliva, Oliver and
Bearden, 1995) with the process. This is likely to increase importance the customer
puts on the service. The involvement is likely to be high in any case, when calling for
an ambulance, given the importance of the service provided to the customer. Possibly
the subscribers have a greater expectation of the service. If as is claimed, the service is
the same, they should therefore report a lower level of satisfaction (Bryant and Cha,
1996). The comparison for this may be confounded by the different socio-economic
“Customer Satisfaction in the MAS” Chapter 4: Methods
65
values of the two groups as the HCCH respondents are by having the card, signify that
they are, on average, from the lower socio-economic groups. This may effect their
perception and hence satisfaction levels of the Service.
User - This category consists of individuals who have been attended to by MAS
between one and six months ago. The one-month restriction was to ensure that the
majority of customers would have recovered from the event that caused them to use
MAS’s services. The six-month time limit was to ensure the issues surrounding the
service by MAS are still clear in their mind.
Non User - Individuals how have never called for, treated or transported by an
ambulance.
The two definitions of User and Non user were chosen to make any effects on the
satisfaction of customers after interaction with MAS clear.
The NCQR methodology demands a minimum of 200 individuals that share the same
model of customer satisfaction to achieve acceptable confidence levels. Subgroups with
a population as small as 50 can be analysed with validity (Fornell et al., 1996).
The above categories combine to form the following research study groupings. See
Table 2 (p. 67).
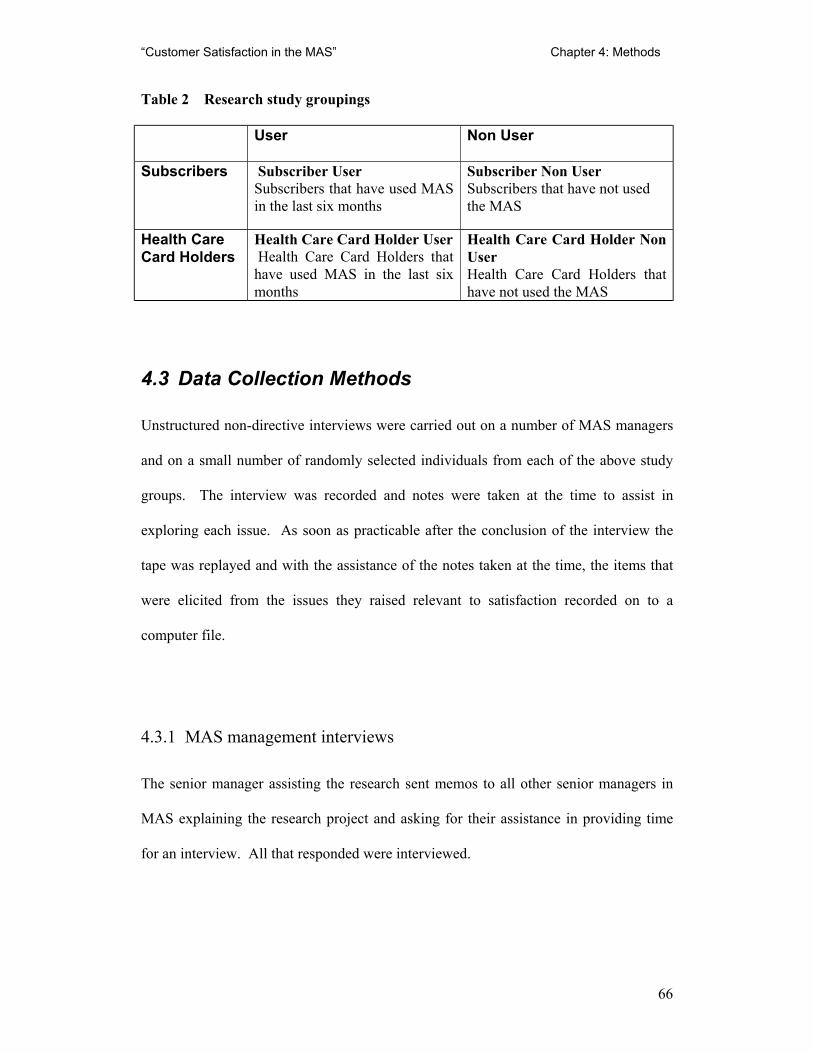
“Customer Satisfaction in the MAS” Chapter 4: Methods
66
Table 2 Research study groupings
User Non User
Subscribers Subscriber User Subscribers that have used MAS in the last six months
Subscriber Non User Subscribers that have not used the MAS
Health Care Card Holders
Health Care Card Holder User Health Care Card Holders that have used MAS in the last six months
Health Care Card Holder Non User Health Care Card Holders that have not used the MAS
4.3 Data Collection Methods
Unstructured non-directive interviews were carried out on a number of MAS managers
and on a small number of randomly selected individuals from each of the above study
groups. The interview was recorded and notes were taken at the time to assist in
exploring each issue. As soon as practicable after the conclusion of the interview the
tape was replayed and with the assistance of the notes taken at the time, the items that
were elicited from the issues they raised relevant to satisfaction recorded on to a
computer file.
4.3.1 MAS management interviews
The senior manager assisting the research sent memos to all other senior managers in
MAS explaining the research project and asking for their assistance in providing time
for an interview. All that responded were interviewed.
“Customer Satisfaction in the MAS” Chapter 4: Methods
67
The management personnel who volunteered were interviewed to understand the current
issues, as viewed by relevant management personnel, and develop a knowledge of the
environment in which MAS operates.
From the interviews a theoretical management model of customer satisfaction in the
MAS was developed. See Figure 3 (p 69).
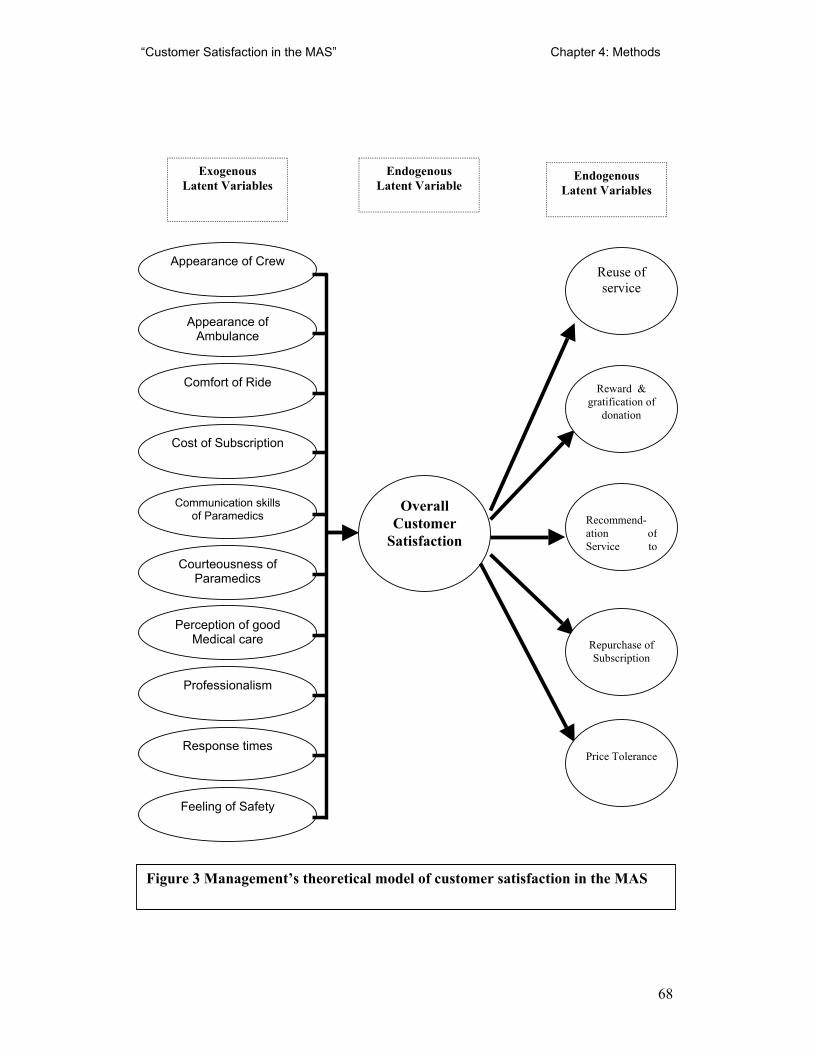
“Customer Satisfaction in the MAS” Chapter 4: Methods
68
Overall Customer
Satisfaction
Reward & gratification of
donation
Recommend-ation of Service to
Price Tolerance
Repurchase of Subscription
Endogenous Latent Variable
Endogenous Latent Variables
Exogenous Latent Variables
Reuse of service
Appearance of Crew
Professionalism
Perception of good Medical care
Feeling of Safety
Appearance of Ambulance
Response times
Comfort of Ride
Cost of Subscription
Communication skills of Paramedics
Courteousness of Paramedics
Figure 3 Management’s theoretical model of customer satisfaction in the MAS
“Customer Satisfaction in the MAS” Chapter 4: Methods
69
4.3.2 Customer interviews
For each of the four study groups, individuals were selected at random and interviewed
using the non-directive interviewing method as described above, with the initial
question being:
“How do you see the MAS?”
New subjects from each group are interviewed until no new factors influencing
customer satisfaction are found for three subjects in a row. The total number of
customer interviews was 19. Individual interviews have been used instead of focus
groups. Focus groups tend to be dominated by one or two vocal individuals and hence
produce skewed and biased results. Satisfaction and purchase decision are individual
responses not the result of a group (Fornell, Ittner and Larcker, 1995).
4.3.3 Model building
The preliminary customer satisfaction model Figure 4 (p. 72), was built from the
responses from the one on one qualitative non-directive interview. Each unique point
that was raised by a customer was included in the model that was based on the generic
model of customer satisfaction, as shown in Fig 2. (p. 62). These points were
considered customer-generated drivers of satisfaction and are grouped on the basis of
similarity into latent variables that impact to various degrees onto the overall
satisfaction. Leading from the overall satisfaction is the economic consequences or
outcomes of price tolerance and loyalty in terms of re-purchase and recommendation to
“Customer Satisfaction in the MAS” Chapter 4: Methods
70
others. The manifest variables are in the boxes on the left while the rest of the diagram
is in the same style as figure 3, The Managerial model (p.69).
The model prepared from the management interview (Figure 3) while similar, differs
from that developed from the customers (Figure 4) in a number of areas. The model
that was prepared from the customer interviews was the one used in the research.
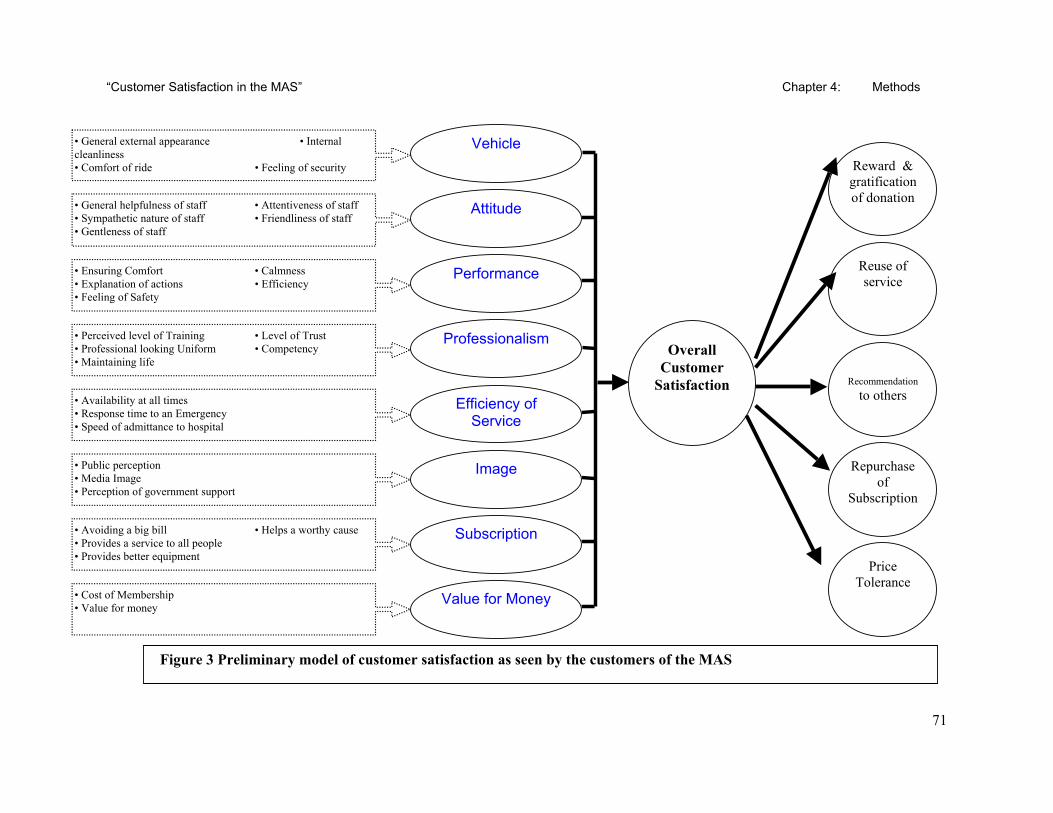
“Customer Satisfaction in the MAS” Chapter 4: Methods
71
Reward & gratification of donation
Recommendation
to others
Price Tolerance
Repurchase of
Subscription
Reuse of service
Overall Customer
Satisfaction
Subscription
Image
Vehicle
Value for Money
Attitude
Performance
Professionalism
Efficiency of Service
• General external appearance • Internal cleanliness • Comfort of ride • Feeling of security
• General helpfulness of staff • Attentiveness of staff • Sympathetic nature of staff • Friendliness of staff • Gentleness of staff
• Ensuring Comfort • Calmness • Explanation of actions • Efficiency • Feeling of Safety
• Perceived level of Training • Level of Trust • Professional looking Uniform • Competency • Maintaining life
• Availability at all times • Response time to an Emergency • Speed of admittance to hospital
• Public perception • Media Image • Perception of government support
• Avoiding a big bill • Helps a worthy cause • Provides a service to all people • Provides better equipment
• Cost of Membership • Value for money
Figure 3 Preliminary model of customer satisfaction as seen by the customers of the MAS
“Customer Satisfaction in the MAS” Chapter 4: Methods
72
4.3.4 Instrument design
The survey instrument was constructed from the content of the interviews with the MAS
customers. Where possible the actual statements used by the customers were
incorporated into the questions. The endogenous latent variables of Overall
Satisfaction, Reuse of service, Re-subscription, Recommendation of the service to others
and Recommendation of subscription to others were measured with extra questions.
The actual question was given as a statement, generated from the customer interview.
The respondent was asked for a reply on a one to ten scale with an explicit “Don’t
Know” option. Demographic data about age, gender, home postcode and whether the
respondent was a subscriber or held a health care card was then requested.
4.3.5 Field Survey
Recipients of Survey - MAS reports a return rate of approximately 50% to previous
surveys (Roy, 1997). On that basis if was decided that the actual number of survey
mailed out would need to be double the respondents needed.
One hundred individuals that fitted the criteria of each study groups, subscriber-user,
subscriber-non-user and HCCH-user were randomly selected from the MAS database.
The group that are Health Care Card holders and had not used the MAS did not appear
on the MAS database. They were sampled by contacting the Victorian Aged Group and
sampling via their database to get the required numbers of respondents. As this group
“Customer Satisfaction in the MAS” Chapter 4: Methods
73
had no connection to MAS, a lower response rate was expected so one hundred and fifty
surveys were mailed to this classification.
Those selected were sent by mail the same package consisting of, the questionnaire, two
cover letters and a pre addressed mail back envelope. The first letter was from VUT
explaining the survey and stressing the importance, independence and confidentiality of
the research. A second letter was from MAS stating its support and interest in
providing a better service to the public.
The next chapter will report on the findings and results of the methodology applied to
the data collected from the questionaries.
“Customer Satisfaction in the MAS” Chapter 5: Results
74
5. Results
5.1 Response Rates
Response rates varied with the different groupings, subscribers were more likely to
respond than Health Care Card Holders (HCCH). Individuals that had used MAS were
more likely to reply than those that had not. See Table 3 (below).
Table 3 Response rates in the various groupings Grouping Questionaries
sent out Valid
Responses
% Return
Subscriber that have used 100 80 80% Subscriber that have not used 100 66 66% All Subscribers 200 146 73% HCCH that have used 100 59 59% HCCH that have not used 150 50 30% All HCCH 250 109 44% ALL 450 255 57%
5.2 Final Model with Values
The final model is presented in Figure 5 (p. 76). It is similar in structure to the
preliminary model of customer satisfaction generated from the interviews of customers
shown in Fig 3 (p.72). This supported the decision to use the customer generated
model. The differences between the preliminary and final model are discussed later in
this section. The R2 for Satisfaction is 0.66 indicating that the model fits the data well
(Martensen et al., 1999).
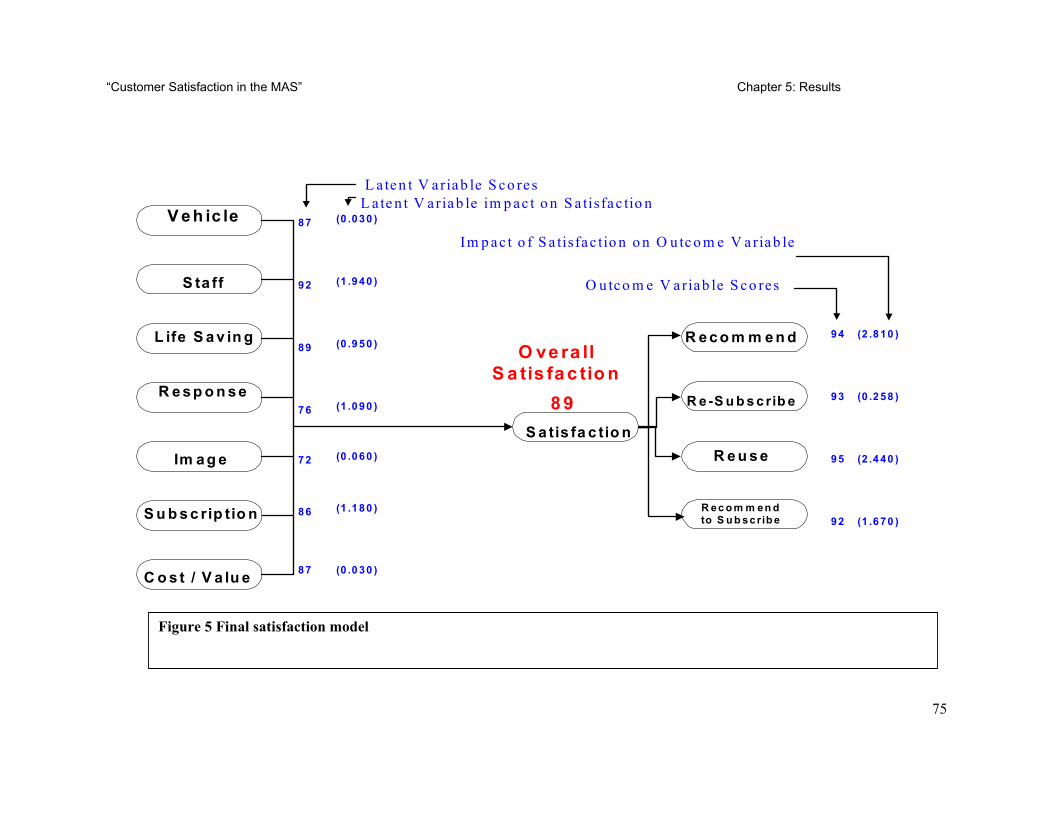
“Customer Satisfaction in the MAS” Chapter 5: Results
75
V e h ic le
S ta ff
L ife S a v in g
Im a g e
R e s p o n s e
S u b s c rip tio n
C o s t / V a lu e
87 (0 .0 30 )
92 (1 .9 40 )
89 (0 .9 50 )
76 (1 .0 90 )
72 (0 .0 60 )
86 (1 .1 80 )
87 (0 .0 30 )
L a ten t V ariab le S co res L a te n t V ariab le im p ac t o n S a tisfac tio n
S a tis fa c tio n
O ve ra ll S a tis fa c tio n
8 9
R e c o m m e n d
R e -S u b s c rib e
R e u s e
R ec o m m en d to S u b sc rib e
94 (2 .8 10 )
93 (0 .2 58 )
95 (2 .4 40 )
92 (1 .6 70 )
O utco m e V ariab le S co res
Im p ac t o f S a tisfac tio n o n O u tc o m e V ariab le
Figure 5 Final satisfaction model
“Customer Satisfaction in the MAS” Chapter 5: Results
76
There are three parts to the final satisfaction model (Figure 5, p. 76). Although they are
interlinked, each part is measured separately in the questionnaire and statistically
analysed independently.
On the left of the model are the latent variables, these are variables that cannot be
measured directly and are inferred from variables that can be measured, the manifest
variables. The labels for the latent variables (eg Staff) are arbitrary but are chosen to
reflect the nature of the questions that make up the variable.
In the middle is the overall satisfaction latent variable. Satisfaction is an endogenous
variable in that it is dependent on exogenous variables such as Staff and Life Saving.
The satisfaction variable is the one used to compare various organisation and industry
categories in the American Customer Satisfaction Index (ACSI). Current results of the
ACSI for government bodies, with which this can be directly compared to, can be found
at http://www.bus.umich.edu/research/nqrc/acsi.html. By comparison, Hospitals in the
USA, as an industry sector rated 70 for the first quarter 1999. The lowest score was the
Internal Revenue, which rated 51, and the highest was the US Mint, which rated 86
among coin collectors.
On the right hand side of the model are the outcomes, these are also known as
endogenous variables. In this model, they relate to the likely hood of the customer to,
Recommend the MAS to others, Re-subscribe to the MAS, Reuse the MAS, and
Recommend to Subscribe to others.
“Customer Satisfaction in the MAS” Chapter 5: Results
77
The values to the immediate right of the outcomes are first the outcome variable scores
and then the impact of satisfaction on outcome variables. The outcome variable scores
are the probability of a customer performing a given act. Hence, Recommend (the MAS
to others) scored 94. This means that the model predicts that there is a 94% chance that
the customer will recommend MAS to others. Re-subscribe scored 93, Reuse rated 95
and Recommend to Subscribe, earned 92.
Next to the latent variables on the left side of the model are the latent variable
satisfaction scores. These can be thought of as how the customer rated a particular
variable. It can be seen that Vehicle rated 87 while Staff high scored with 92. Life
Saving received 89, Response 76 while Image was rated lower with a score of 72.
Subscription netted 86 and Cost/Value scored 87.
The latent variables also have impact scores associated with them; these are the figures
in brackets. The “Impact on the Satisfaction” scores provide a prediction of the
movement by five points in the score of the latent variable will have on overall
satisfaction. For example, Staff has an impact rating of 1.940. Were Staff to change its
satisfaction rating by 5 points and go from 92 to 97, the overall satisfaction would
increase by 1.940 and hence go from 89 to 90.940 (which would be rounded to 91).
Other variables that had high impacts were Subscription with 1.180, Response with
1.090 and Life Saving with 0.960. Variables that had small impacts were Image with
0.060, Vehicle with 0.030 and Cost/Value with 0.030. Hence, a change in the Staff
variable is predicted to have a significant effect on overall satisfaction while the same
order of change to the Image variable is expected to have inconsequential effects.
“Customer Satisfaction in the MAS” Chapter 5: Results
78
The result of a change in the overall satisfaction value can be predicted by the Impact of
Satisfaction on the Outcome variables. These scores are to the far right of the model
and work in a similar way as the impacts on the latent variables. With these, it is a
change of 5 points in the Overall Customer Satisfaction variable, the model predicts that
the outcome variables will change by the impact value. So, if Overall Customer
Satisfaction changed from 89 to 94, the Recommend variable will increase from 94 to
96.810. In practice, this would be then rounded to 97.
There are two main changes compared to the preliminary model presented in Chapter 4.
Firstly, the variables now have values. This is as a result of the PLS modelling.
Secondly, there are changes in the latent variables. The variables of Attitude,
Performance and Professionalism suggested in the preliminary model have, in the final
model, been replaced by the latent variables Staff and Life Saving. This is due to
questions 6 - 16 and 18 -19 being closely related in the correlation matrix and grouped
together under the latent variable of Staff. Question 17 and 20 were correlated and
impacted on the latent variable of Life Saving. Response was produced from questions
21, 22, 23 and 26. Image was the product of question 24 and 25. Questions 30 to 32
impacted on Subscription. Cost / Value was the result of questions 27 and 28.
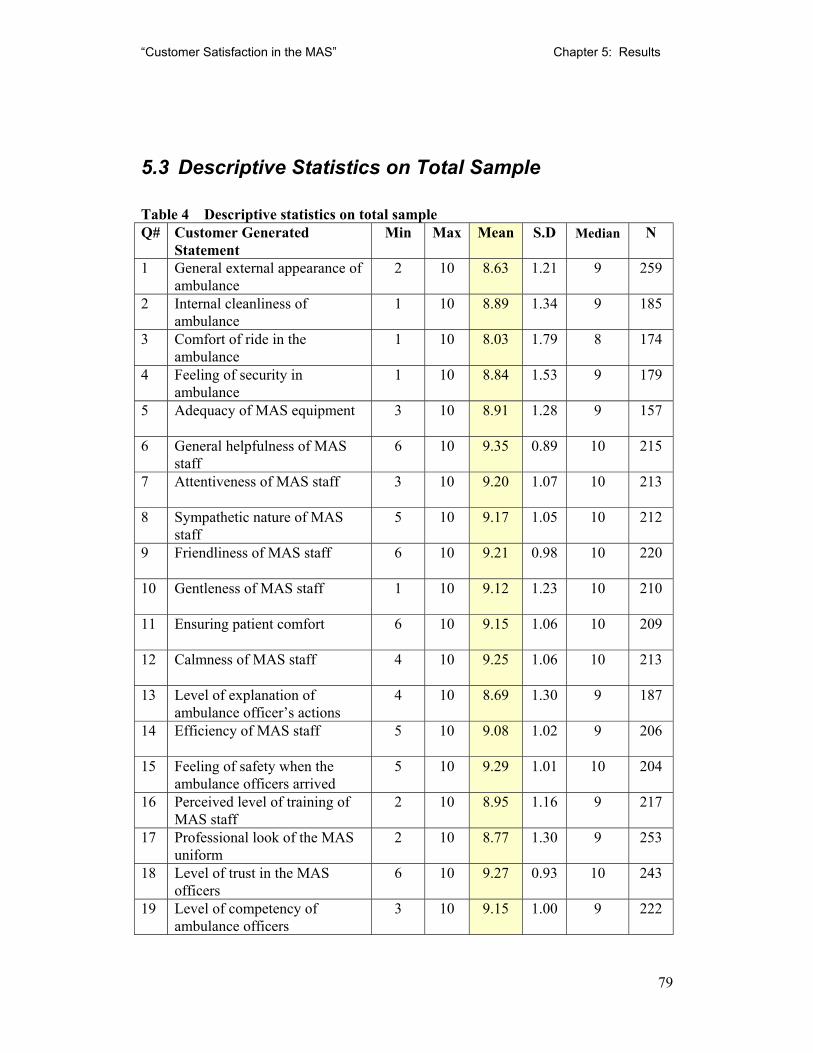
“Customer Satisfaction in the MAS” Chapter 5: Results
79
5.3 Descriptive Statistics on Total Sample
Table 4 Descriptive statistics on total sample Q# Customer Generated
Statement Min Max Mean S.D Median N
1 General external appearance of ambulance
2 10 8.63 1.21 9 259
2 Internal cleanliness of ambulance
1 10 8.89 1.34 9 185
3 Comfort of ride in the ambulance
1 10 8.03 1.79 8 174
4 Feeling of security in ambulance
1 10 8.84 1.53 9 179
5 Adequacy of MAS equipment 3 10 8.91 1.28 9 157
6 General helpfulness of MAS staff
6 10 9.35 0.89 10 215
7 Attentiveness of MAS staff 3 10 9.20 1.07 10 213
8 Sympathetic nature of MAS staff
5 10 9.17 1.05 10 212
9 Friendliness of MAS staff 6 10 9.21 0.98 10 220
10 Gentleness of MAS staff 1 10 9.12 1.23 10 210
11 Ensuring patient comfort 6 10 9.15 1.06 10 209
12 Calmness of MAS staff 4 10 9.25 1.06 10 213
13 Level of explanation of ambulance officer’s actions
4 10 8.69 1.30 9 187
14 Efficiency of MAS staff 5 10 9.08 1.02 9 206
15 Feeling of safety when the ambulance officers arrived
5 10 9.29 1.01 10 204
16 Perceived level of training of MAS staff
2 10 8.95 1.16 9 217
17 Professional look of the MAS uniform
2 10 8.77 1.30 9 253
18 Level of trust in the MAS officers
6 10 9.27 0.93 10 243
19 Level of competency of ambulance officers
3 10 9.15 1.00 9 222
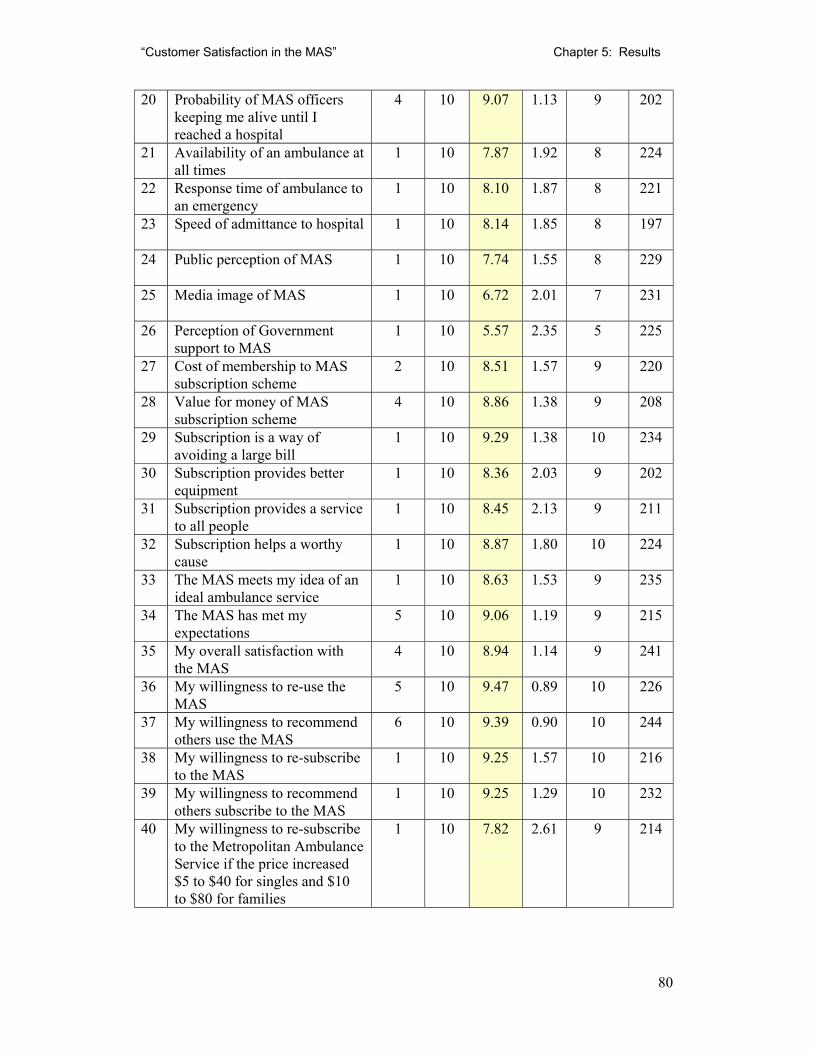
“Customer Satisfaction in the MAS” Chapter 5: Results
80
20 Probability of MAS officers keeping me alive until I reached a hospital
4 10 9.07 1.13 9 202
21 Availability of an ambulance at all times
1 10 7.87 1.92 8 224
22 Response time of ambulance to an emergency
1 10 8.10 1.87 8 221
23 Speed of admittance to hospital 1 10 8.14 1.85 8 197
24 Public perception of MAS 1 10 7.74 1.55 8 229
25 Media image of MAS 1 10 6.72 2.01 7 231
26 Perception of Government support to MAS
1 10 5.57 2.35 5 225
27 Cost of membership to MAS subscription scheme
2 10 8.51 1.57 9 220
28 Value for money of MAS subscription scheme
4 10 8.86 1.38 9 208
29 Subscription is a way of avoiding a large bill
1 10 9.29 1.38 10 234
30 Subscription provides better equipment
1 10 8.36 2.03 9 202
31 Subscription provides a service to all people
1 10 8.45 2.13 9 211
32 Subscription helps a worthy cause
1 10 8.87 1.80 10 224
33 The MAS meets my idea of an ideal ambulance service
1 10 8.63 1.53 9 235
34 The MAS has met my expectations
5 10 9.06 1.19 9 215
35 My overall satisfaction with the MAS
4 10 8.94 1.14 9 241
36 My willingness to re-use the MAS
5 10 9.47 0.89 10 226
37 My willingness to recommend others use the MAS
6 10 9.39 0.90 10 244
38 My willingness to re-subscribe to the MAS
1 10 9.25 1.57 10 216
39 My willingness to recommend others subscribe to the MAS
1 10 9.25 1.29 10 232
40 My willingness to re-subscribe to the Metropolitan Ambulance Service if the price increased $5 to $40 for singles and $10 to $80 for families
1 10 7.82 2.61 9 214
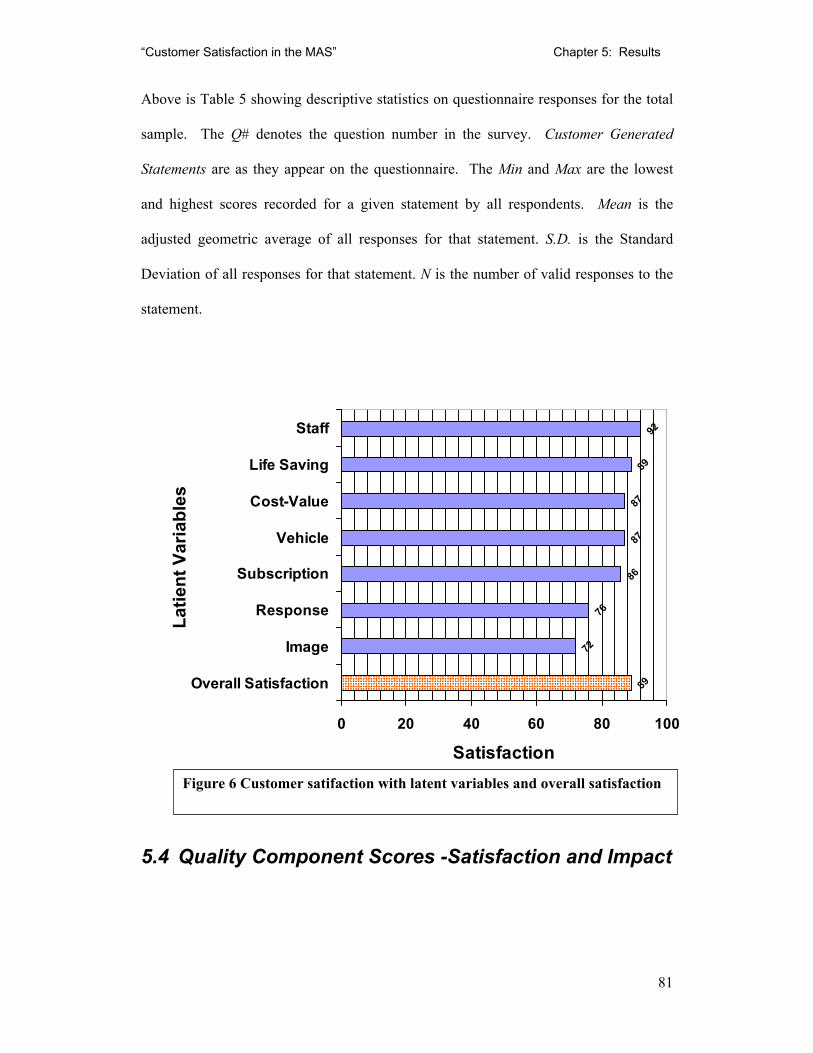
“Customer Satisfaction in the MAS” Chapter 5: Results
81
Above is Table 5 showing descriptive statistics on questionnaire responses for the total
sample. The Q# denotes the question number in the survey. Customer Generated
Statements are as they appear on the questionnaire. The Min and Max are the lowest
and highest scores recorded for a given statement by all respondents. Mean is the
adjusted geometric average of all responses for that statement. S.D. is the Standard
Deviation of all responses for that statement. N is the number of valid responses to the
statement.
5.4 Quality Component Scores -Satisfaction and Impact
�������������������������������������������������������������������������������������������������������������������������������������������������������������������������������������������������������������������������������������� 89
72
76
86
87
87
89
92
0 20 40 60 80 100
Overall Satisfaction
Image
Response
Subscription
Vehicle
Cost-Value
Life Saving
Staff
Latie
nt V
aria
bles
SatisfactionFigure 6 Customer satifaction with latent variables and overall satisfaction
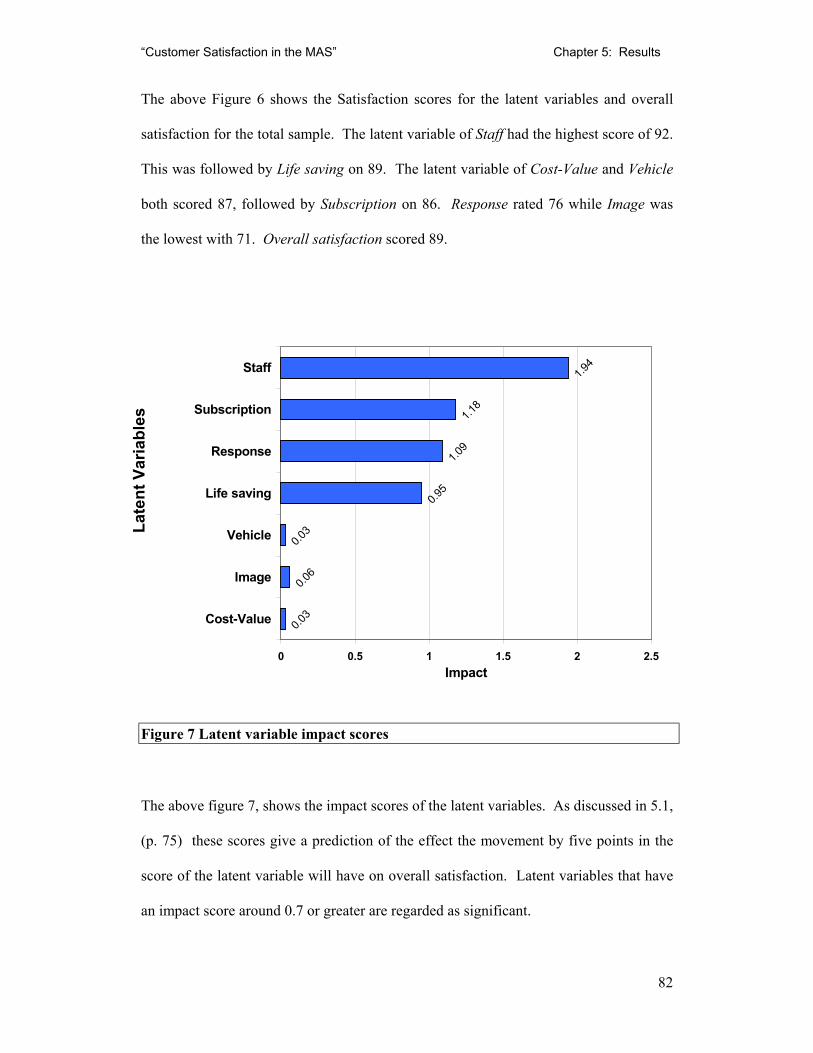
“Customer Satisfaction in the MAS” Chapter 5: Results
82
The above Figure 6 shows the Satisfaction scores for the latent variables and overall
satisfaction for the total sample. The latent variable of Staff had the highest score of 92.
This was followed by Life saving on 89. The latent variable of Cost-Value and Vehicle
both scored 87, followed by Subscription on 86. Response rated 76 while Image was
the lowest with 71. Overall satisfaction scored 89.
Figure 7 Latent variable impact scores
The above figure 7, shows the impact scores of the latent variables. As discussed in 5.1,
(p. 75) these scores give a prediction of the effect the movement by five points in the
score of the latent variable will have on overall satisfaction. Latent variables that have
an impact score around 0.7 or greater are regarded as significant.
0.03
0.06
0.03
0.95
1.09
1.18
1.94
0 0.5 1 1.5 2 2.5
Cost-Value
Image
Vehicle
Life saving
Response
Subscription
Staff
Late
nt V
aria
bles
Impact
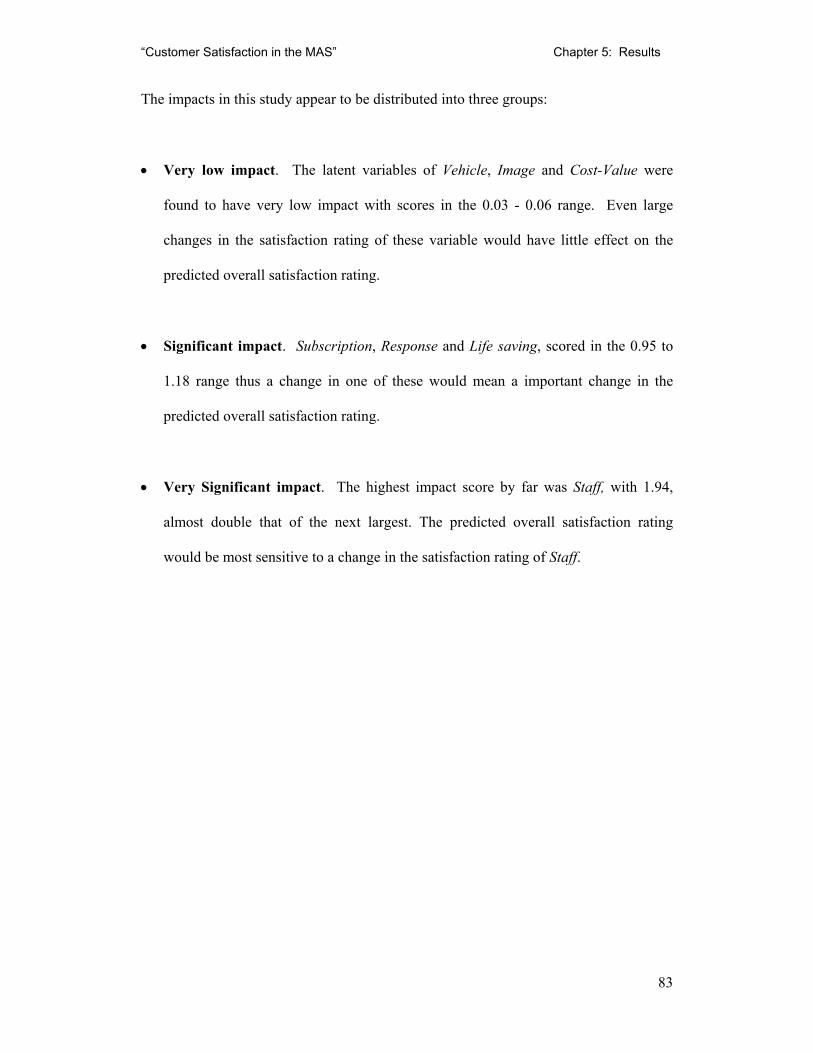
“Customer Satisfaction in the MAS” Chapter 5: Results
83
The impacts in this study appear to be distributed into three groups:
• Very low impact. The latent variables of Vehicle, Image and Cost-Value were
found to have very low impact with scores in the 0.03 - 0.06 range. Even large
changes in the satisfaction rating of these variable would have little effect on the
predicted overall satisfaction rating.
• Significant impact. Subscription, Response and Life saving, scored in the 0.95 to
1.18 range thus a change in one of these would mean a important change in the
predicted overall satisfaction rating.
• Very Significant impact. The highest impact score by far was Staff, with 1.94,
almost double that of the next largest. The predicted overall satisfaction rating
would be most sensitive to a change in the satisfaction rating of Staff.
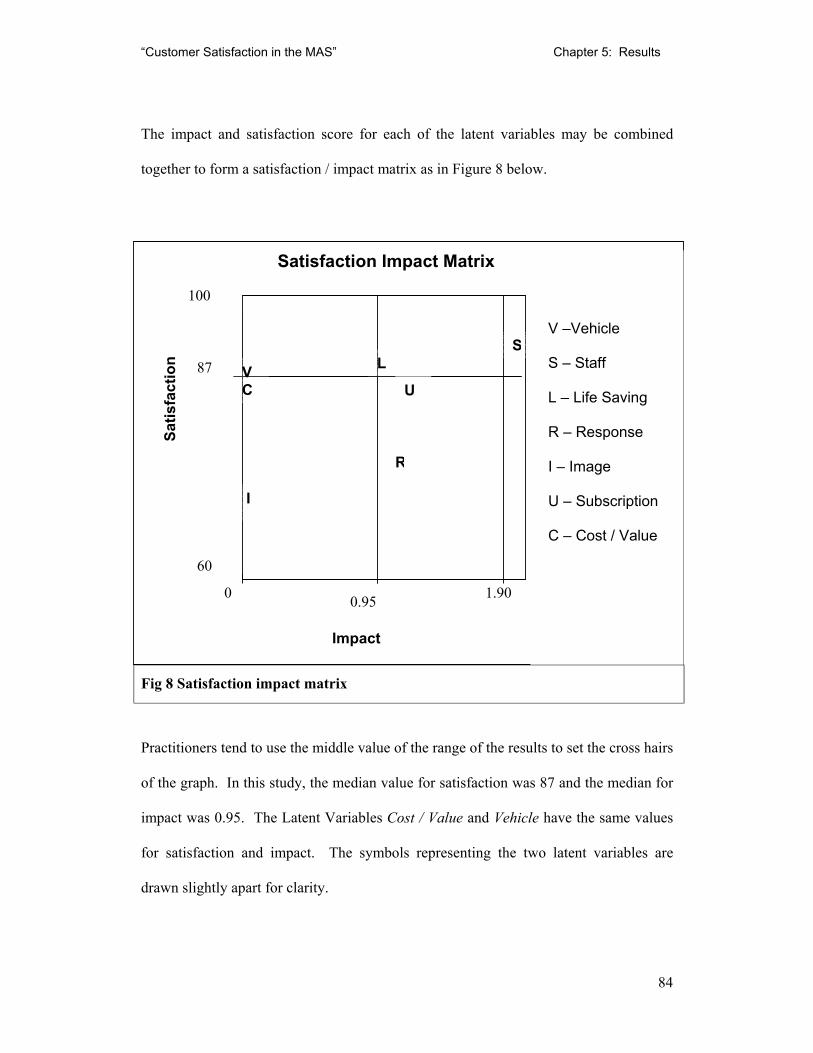
“Customer Satisfaction in the MAS” Chapter 5: Results
84
The impact and satisfaction score for each of the latent variables may be combined
together to form a satisfaction / impact matrix as in Figure 8 below.
Fig 8 Satisfaction impact matrix
Practitioners tend to use the middle value of the range of the results to set the cross hairs
of the graph. In this study, the median value for satisfaction was 87 and the median for
impact was 0.95. The Latent Variables Cost / Value and Vehicle have the same values
for satisfaction and impact. The symbols representing the two latent variables are
drawn slightly apart for clarity.
Satisfaction Impact Matrix
V –Vehicle
S – Staff
L – Life Saving
R – Response
I – Image
U – Subscription
C – Cost / Value
Satis
fact
ion
Impact
0.95 0
60
100
87
1.90
SLV
C U
I
R
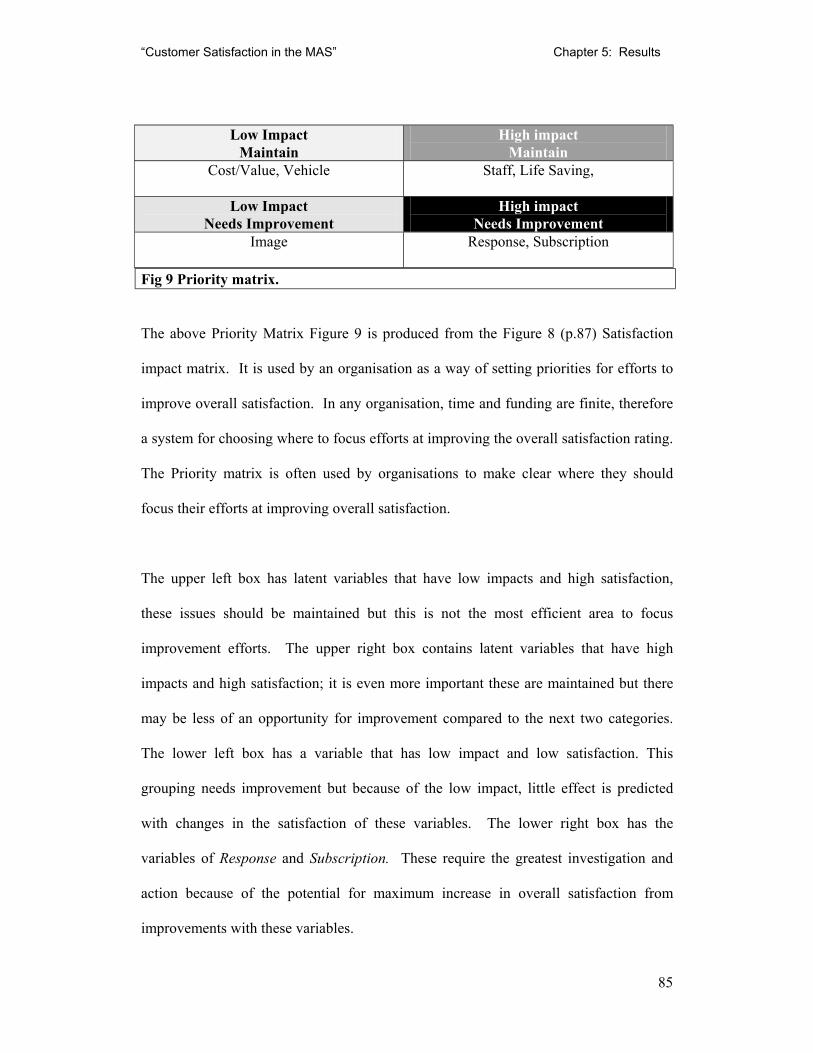
“Customer Satisfaction in the MAS” Chapter 5: Results
85
Low Impact Maintain
High impact Maintain
Cost/Value, Vehicle
Staff, Life Saving,
Low Impact Needs Improvement
High impact Needs Improvement
Image
Response, Subscription
Fig 9 Priority matrix.
The above Priority Matrix Figure 9 is produced from the Figure 8 (p.87) Satisfaction
impact matrix. It is used by an organisation as a way of setting priorities for efforts to
improve overall satisfaction. In any organisation, time and funding are finite, therefore
a system for choosing where to focus efforts at improving the overall satisfaction rating.
The Priority matrix is often used by organisations to make clear where they should
focus their efforts at improving overall satisfaction.
The upper left box has latent variables that have low impacts and high satisfaction,
these issues should be maintained but this is not the most efficient area to focus
improvement efforts. The upper right box contains latent variables that have high
impacts and high satisfaction; it is even more important these are maintained but there
may be less of an opportunity for improvement compared to the next two categories.
The lower left box has a variable that has low impact and low satisfaction. This
grouping needs improvement but because of the low impact, little effect is predicted
with changes in the satisfaction of these variables. The lower right box has the
variables of Response and Subscription. These require the greatest investigation and
action because of the potential for maximum increase in overall satisfaction from
improvements with these variables.
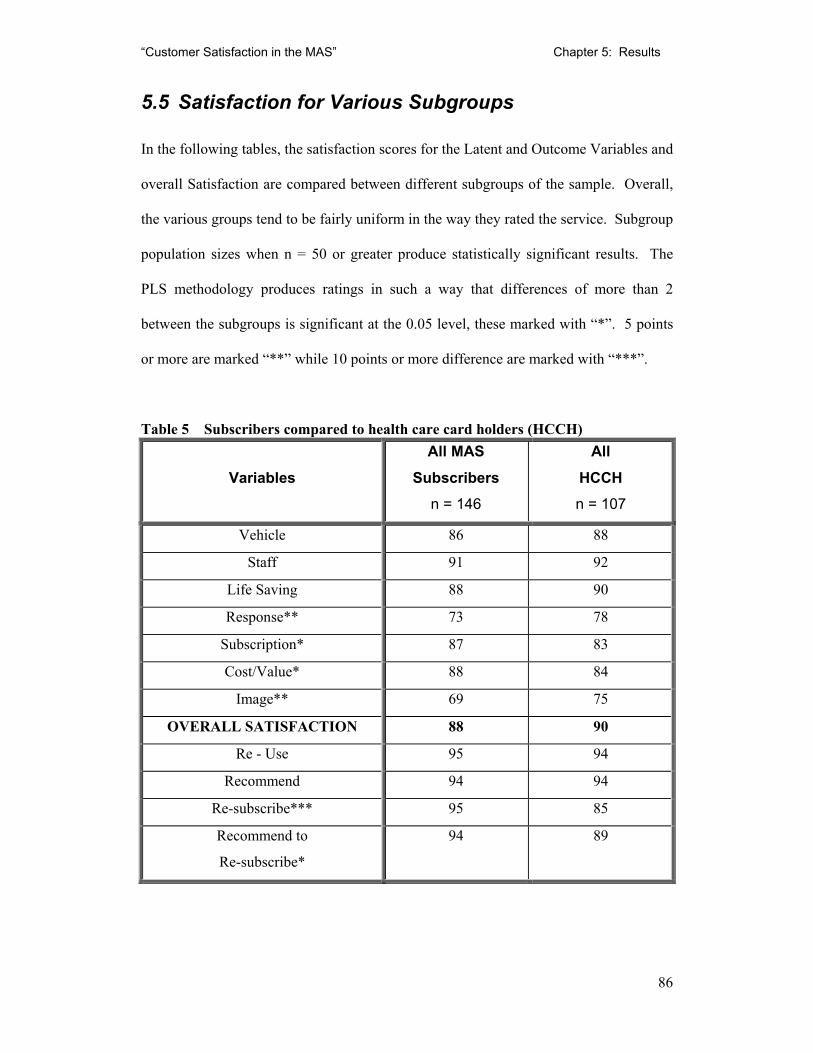
“Customer Satisfaction in the MAS” Chapter 5: Results
86
5.5 Satisfaction for Various Subgroups
In the following tables, the satisfaction scores for the Latent and Outcome Variables and
overall Satisfaction are compared between different subgroups of the sample. Overall,
the various groups tend to be fairly uniform in the way they rated the service. Subgroup
population sizes when n = 50 or greater produce statistically significant results. The
PLS methodology produces ratings in such a way that differences of more than 2
between the subgroups is significant at the 0.05 level, these marked with “*”. 5 points
or more are marked “**” while 10 points or more difference are marked with “***”.
Table 5 Subscribers compared to health care card holders (HCCH)
Variables
All MAS Subscribers
n = 146
All HCCH n = 107
Vehicle 86 88
Staff 91 92
Life Saving 88 90
Response** 73 78
Subscription* 87 83
Cost/Value* 88 84
Image** 69 75
OVERALL SATISFACTION 88 90
Re - Use 95 94
Recommend 94 94
Re-subscribe*** 95 85
Recommend to
Re-subscribe*
94 89
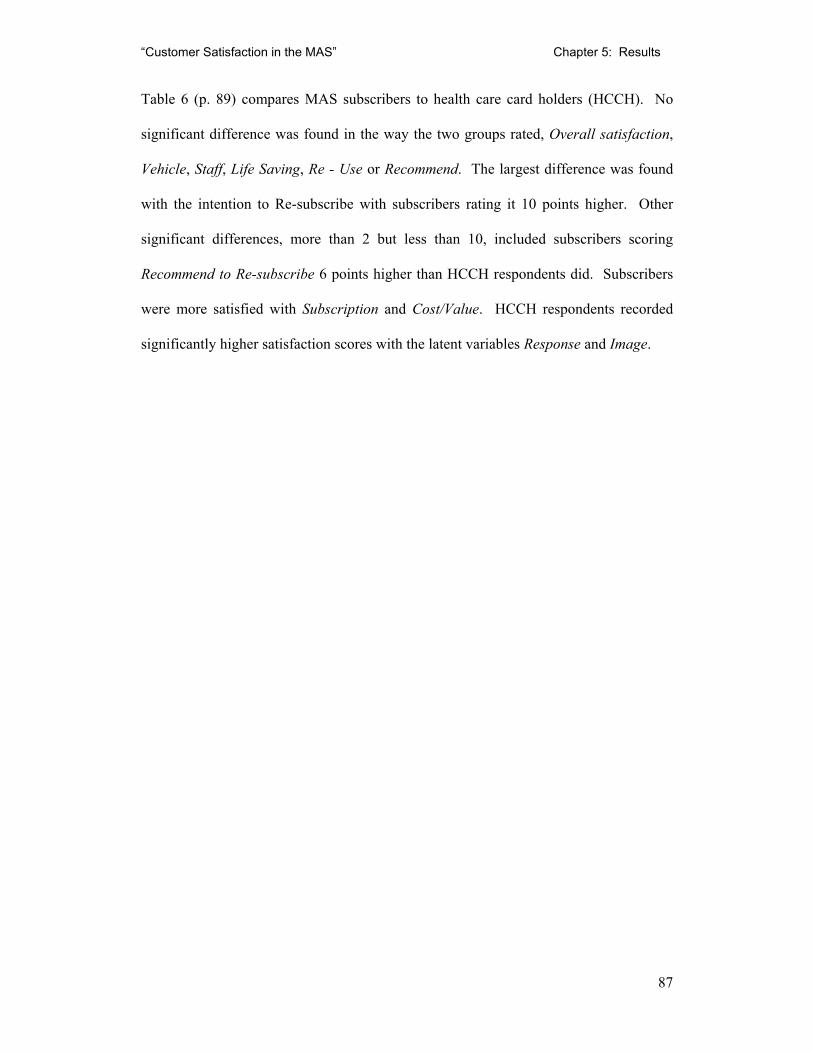
“Customer Satisfaction in the MAS” Chapter 5: Results
87
Table 6 (p. 89) compares MAS subscribers to health care card holders (HCCH). No
significant difference was found in the way the two groups rated, Overall satisfaction,
Vehicle, Staff, Life Saving, Re - Use or Recommend. The largest difference was found
with the intention to Re-subscribe with subscribers rating it 10 points higher. Other
significant differences, more than 2 but less than 10, included subscribers scoring
Recommend to Re-subscribe 6 points higher than HCCH respondents did. Subscribers
were more satisfied with Subscription and Cost/Value. HCCH respondents recorded
significantly higher satisfaction scores with the latent variables Response and Image.
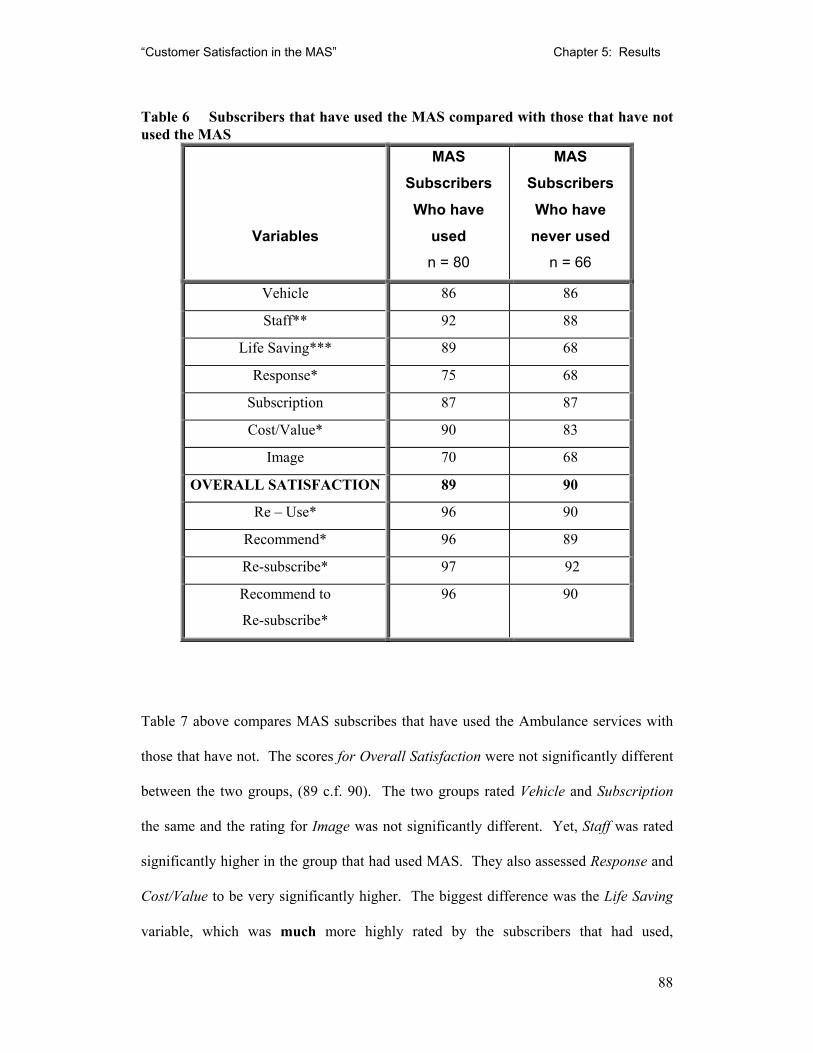
“Customer Satisfaction in the MAS” Chapter 5: Results
88
Table 6 Subscribers that have used the MAS compared with those that have not used the MAS
Variables
MAS Subscribers Who have
used n = 80
MAS Subscribers Who have
never used n = 66
Vehicle 86 86
Staff** 92 88
Life Saving*** 89 68
Response* 75 68
Subscription 87 87
Cost/Value* 90 83
Image 70 68
OVERALL SATISFACTION 89 90
Re – Use* 96 90
Recommend* 96 89
Re-subscribe* 97 92
Recommend to
Re-subscribe*
96 90
Table 7 above compares MAS subscribes that have used the Ambulance services with
those that have not. The scores for Overall Satisfaction were not significantly different
between the two groups, (89 c.f. 90). The two groups rated Vehicle and Subscription
the same and the rating for Image was not significantly different. Yet, Staff was rated
significantly higher in the group that had used MAS. They also assessed Response and
Cost/Value to be very significantly higher. The biggest difference was the Life Saving
variable, which was much more highly rated by the subscribers that had used,
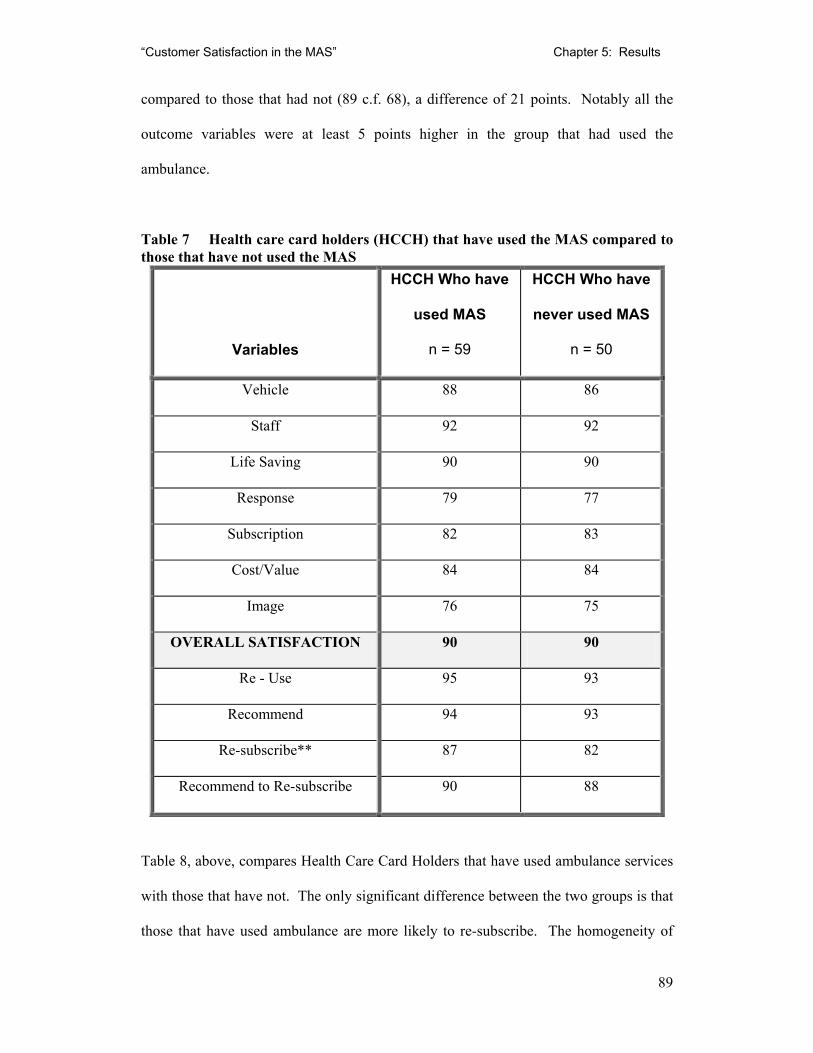
“Customer Satisfaction in the MAS” Chapter 5: Results
89
compared to those that had not (89 c.f. 68), a difference of 21 points. Notably all the
outcome variables were at least 5 points higher in the group that had used the
ambulance.
Table 7 Health care card holders (HCCH) that have used the MAS compared to those that have not used the MAS
Variables
HCCH Who have
used MAS
n = 59
HCCH Who have
never used MAS
n = 50
Vehicle 88 86
Staff 92 92
Life Saving 90 90
Response 79 77
Subscription 82 83
Cost/Value 84 84
Image 76 75
OVERALL SATISFACTION 90 90
Re - Use 95 93
Recommend 94 93
Re-subscribe** 87 82
Recommend to Re-subscribe 90 88
Table 8, above, compares Health Care Card Holders that have used ambulance services
with those that have not. The only significant difference between the two groups is that
those that have used ambulance are more likely to re-subscribe. The homogeneity of
“Customer Satisfaction in the MAS” Chapter 5: Results
90
the two groups of HCC holders contrasts sharply with the large differences found in the
subscribers groups in Table 4.
Table 8 Respondents that have never used MAS compared to those that have used once or twice and those that have more than twice
Variables
Never Used
MAS
n = 95
Called or used
MAS once or
twice
n = 99
Used MAS
more than
twice
n = 69
Vehicle 87 87 87
Staff 91 91 92
Life Saving** 88 90 91
Response** 73 77 77
Subscription 85 86 85
Cost/Value** 84 88 90
Image** 72 73 71
OVERALL
SATISFACTION*
86 89 91
Re-Use* 91 95 97
Recommend* 91 95 96
Re-subscribe* 88 95 94
Recommend to
Re-subscribe*
89 94 94
Table 9 above, compares groups that have either, not used, used one or twice, or used
MAS more than twice. The groupings were constructed in this way to investigate the
MAS belief that (a) most people only call MAS one or twice in their lifetime and (b)
“Customer Satisfaction in the MAS” Chapter 5: Results
91
that patients who make multiple trips via ambulance, often referred to colloquially by
paramedics as “frequent fliers”, are different to other customers.
Overall there seems to be a correlation between increasing use of Ambulance services
and increasing satisfaction score both overall and individual variables. However, the
differences are generally largest between the non-user group and the two groups that
have used.
5.5.1 Summary of overall trends between the subgroups
Overall Satisfaction is similar in all groups. HCCH satisfaction ratings do not change
depending on usage. Subscribers who have used MAS show a strong positive trend in
their satisfaction with latent and outcome variables. Subscribers have a higher
satisfaction with Subscription and Cost/Value compared to HCCH. HCCH are less
likely than subscribers to state that will subscribe or recommend subscription.
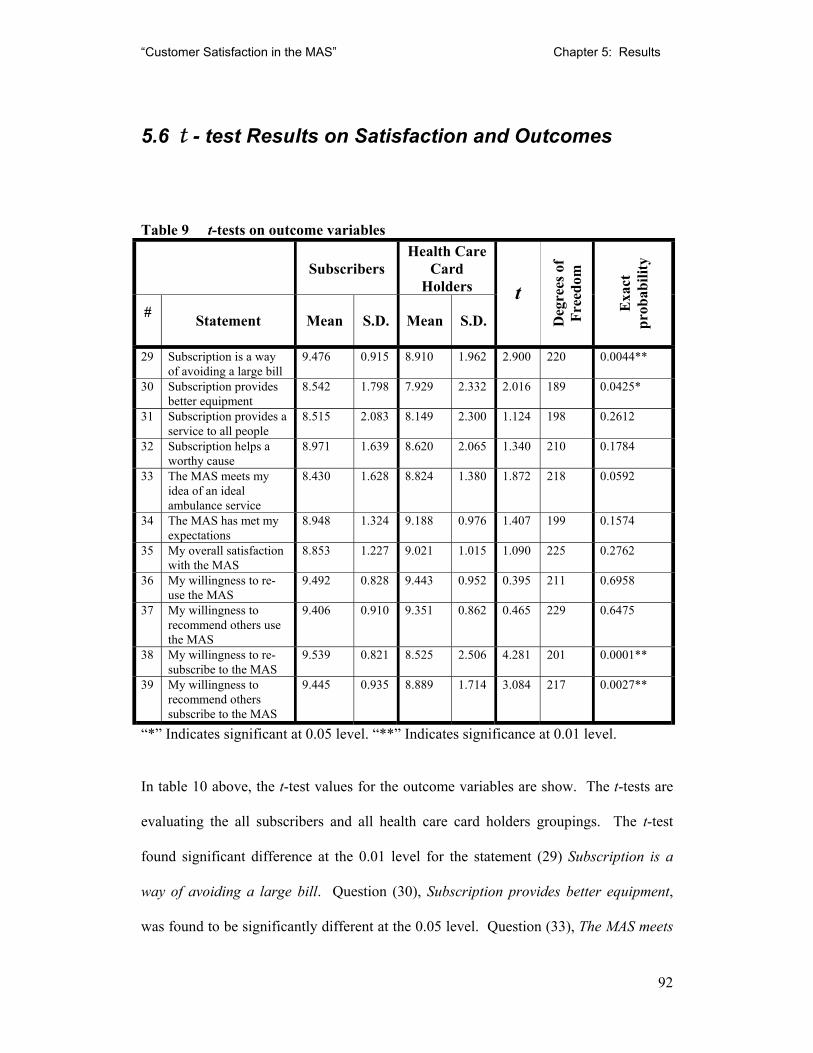
“Customer Satisfaction in the MAS” Chapter 5: Results
92
5.6 t - test Results on Satisfaction and Outcomes
Table 9 t-tests on outcome variables
Subscribers Health Care
Card Holders
# Statement Mean S.D. Mean S.D.
t
Deg
rees
of
Free
dom
Exa
ct
prob
abili
ty
29 Subscription is a way of avoiding a large bill
9.476 0.915 8.910 1.962 2.900 220 0.0044**
30 Subscription provides better equipment
8.542 1.798 7.929 2.332 2.016 189 0.0425*
31 Subscription provides a service to all people
8.515 2.083 8.149 2.300 1.124 198 0.2612
32 Subscription helps a worthy cause
8.971 1.639 8.620 2.065 1.340 210 0.1784
33 The MAS meets my idea of an ideal ambulance service
8.430 1.628 8.824 1.380 1.872 218 0.0592
34 The MAS has met my expectations
8.948 1.324 9.188 0.976 1.407 199 0.1574
35 My overall satisfaction with the MAS
8.853 1.227 9.021 1.015 1.090 225 0.2762
36 My willingness to re-use the MAS
9.492 0.828 9.443 0.952 0.395 211 0.6958
37 My willingness to recommend others use the MAS
9.406 0.910 9.351 0.862 0.465 229 0.6475
38 My willingness to re-subscribe to the MAS
9.539 0.821 8.525 2.506 4.281 201 0.0001**
39 My willingness to recommend others subscribe to the MAS
9.445 0.935 8.889 1.714 3.084 217 0.0027**
“*” Indicates significant at 0.05 level. “**” Indicates significance at 0.01 level.
In table 10 above, the t-test values for the outcome variables are show. The t-tests are
evaluating the all subscribers and all health care card holders groupings. The t-test
found significant difference at the 0.01 level for the statement (29) Subscription is a
way of avoiding a large bill. Question (30), Subscription provides better equipment,
was found to be significantly different at the 0.05 level. Question (33), The MAS meets

“Customer Satisfaction in the MAS” Chapter 5: Results
93
my idea of an ideal ambulance service, was close to significance with a probability of
0.0592. Question (38), My willingness to resubscribe to the MAS was very significantly
different with a 0.0001 probability. My willingness to recommend others subscribe to
the MAS, question (39), was different at the 0.01 significance level.
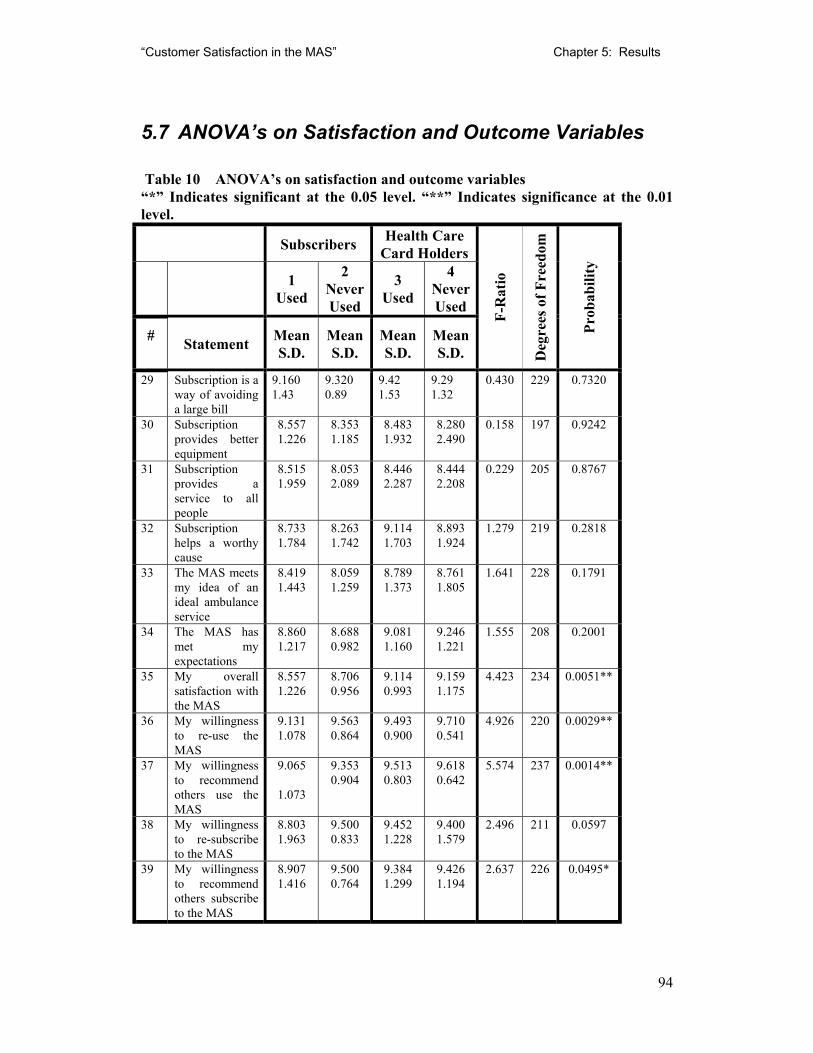
“Customer Satisfaction in the MAS” Chapter 5: Results
94
5.7 ANOVA’s on Satisfaction and Outcome Variables
Table 10 ANOVA’s on satisfaction and outcome variables “*” Indicates significant at the 0.05 level. “**” Indicates significance at the 0.01 level. Subscribers Health Care
Card Holders
1 Used
2 Never Used
3 Used
4 Never Used
# Statement Mean S.D.
Mean S.D.
Mean S.D.
Mean S.D.
F-R
atio
Deg
rees
of F
reed
om
Prob
abili
ty
29 Subscription is a way of avoiding a large bill
9.160 1.43
9.320 0.89
9.42 1.53
9.29 1.32
0.430 229 0.7320
30 Subscription provides better equipment
8.557 1.226
8.353 1.185
8.483 1.932
8.280 2.490
0.158 197
0.9242
31 Subscription provides a service to all people
8.515 1.959
8.053 2.089
8.446 2.287
8.444 2.208
0.229 205 0.8767
32 Subscription helps a worthy cause
8.733 1.784
8.263 1.742
9.114 1.703
8.893 1.924
1.279 219
0.2818
33 The MAS meets my idea of an ideal ambulance service
8.419 1.443
8.059 1.259
8.789 1.373
8.761 1.805
1.641 228
0.1791
34 The MAS has met my expectations
8.860 1.217
8.688 0.982
9.081 1.160
9.246 1.221
1.555 208
0.2001
35 My overall satisfaction with the MAS
8.557 1.226
8.706 0.956
9.114 0.993
9.159 1.175
4.423 234
0.0051**
36 My willingness to re-use the MAS
9.131 1.078
9.563 0.864
9.493 0.900
9.710 0.541
4.926 220 0.0029**
37 My willingness to recommend others use the MAS
9.065
1.073
9.353 0.904
9.513 0.803
9.618 0.642
5.574 237 0.0014**
38 My willingness to re-subscribe to the MAS
8.803 1.963
9.500 0.833
9.452 1.228
9.400 1.579
2.496 211
0.0597
39 My willingness to recommend others subscribe to the MAS
8.907 1.416
9.500 0.764
9.384 1.299
9.426 1.194
2.637 226
0.0495*
“Customer Satisfaction in the MAS” Chapter 5: Results
95
Table 8. (p.97), shows the ANOVAs for the satisfaction and outcome variables.
Significant difference at the 0.01 level was found in outcome (35), My overall
satisfaction with the MAS. Outcomes (36), My willingness to re-use the MAS, and (37),
My willingness to recommend others use the MAS, were also found to be significant at
the 0.01 level. Outcome (39), My willingness to recommend others subscribe to the
MAS, was significant at the 0.05 level.
“Customer Satisfaction in the MAS” Chapter 6: Discussion
96
6. Discussion
In this the final chapter the results which would be found in conventional satisfaction
surveys are discussed and compared to the PLS results found in the survey of MAS
clients. Finally the chapter will briefly outline issues which would need to be included
in a further development of the use of the PLS methodology.
In this section the application of the traditional statistics and partial least square
modelling outlined in chapter 5, will be discussed.
6.1 Conventional Statistics Results
As discussed in section 3.3.3 (p. 52), the data produced by the satisfaction studies is
frequently skewed and therefore inappropriate for parametric statistical methods. In this
study, the data for most of the variables was found to have large negative skewed values
and high kurtosis. Partial Least Squares Modelling (PLSM) is claimed to be superior to
other methods in satisfaction research as it can also effectively deal with relatively
small sample sizes, high level of “noise” in the data and a large model with many
variables. Reported customer satisfaction surveys, however, have traditionally
employed statistical methods of descriptive statistics such as mean and standard
deviation and also the more complex computations such as t-tests and Analysis of
Variance (ANOVA). To examine the differences between the results obtained by
PLSM and the conventional statistical methods, both were included in chapter 5, they
will be discussed below.
“Customer Satisfaction in the MAS” Chapter 6: Discussion
97
The conventional statistical results appeared in Chapter 5, table 5 (p. 80) for the
descriptive statistics, table 10 for the t-test (p. 94) and table 11 (p. 96) for the ANOVA
to give a basis from which to compare the PLSM results in figures 5 to 9 and tables 4 to
9.
6.1.1 t-tests
As might be expected given the difference in payment for the MAS services the
subscribers and HCCH were found to give significantly different answers to some of the
satisfaction and outcome statements. In the satisfaction statements, (29) “Subscription
is a way of avoiding a large bill” and (30) “Subscription provides better equipment”,
the non membership paying HCCH participants agreed significantly less with the
statement than membership paying subscribers. The health care card holders received
the same free service as the subscribers without having to pay an annual fee. As would
be expected a percentage of the HCCHs disagreed that subscription was a way of them
avoiding a large bill. A similar explanation would hold for statement 30. Significant
differences were not found between the groups for the altruistic statements 31 and 32
that relate to providing a service to all and helping a worthy cause.
The satisfaction statement 33, “The MAS meets my idea of an ideal ambulance service”,
was close to being significant at the 0.05 level (p = 0.0592). Interestingly it was the
HCCHs that had the higher mean score. This suggests that subscribers were less
satisfied than HCCHs with the MAS. Given that the same level of service was provided
to both groups this suggests that either the subscribers were expecting more or the
“Customer Satisfaction in the MAS” Chapter 6: Discussion
98
HCCH participants, because of their personal histories, had a greater appreciation of the
life saving capacity of the MAS.
The statement (38), “my willingness to re-subscribe to the MAS”, produced a very
significant difference between the groups, (p = 0.0001). This is understandable, as the
HCCHs have no need to resubscribe as they receive the service free of charge. The
statement (39) “My willingness to recommend others subscribe to the MAS” also
produced a significant difference (p=0.0027). The HCCHs were less willing to
recommend. As they were more likely to have friends and relatives who were health
care card holders, they would have had less opportunity to recommend the service to
people who could subscribe to the MAS.
6.1.2 Analysis of variance
The analysis of variance found a highly significant difference (p=0.0051) with overall
satisfaction between the groups. This was not found using the t-test.
Re-use and recommendation to re-use were also found to be significantly different with
health care card holders more likely to reuse and recommend the service. Subscribers
that had used MAS were significantly more likely to recommend others to re-subscribe.
This was similar to the findings with the t-test.
Contact with the service significantly increased the positive perception of the service
and its likelihood of being recommended.
“Customer Satisfaction in the MAS” Chapter 6: Discussion
99
6.2 Partial Least Square Results
The overall satisfaction with MAS, among subscribers and health care cardholders as a
whole, rated 89 satisfaction points. This is a very high score. Unfortunately, no other
ambulance services have been publicly reported using the method. However the MAS
results could be compared with USA values, that reports an industry average for
hospitals (Fornell, 2000) of 70 and a 70.4 average for all services industries. Amongst
service companies, Federal Express was the top scorer with 83. The top federal
government agency was NASA, which was rated 86 by educators participating in their
programs (Fornell, 2000).
6.3 Comparison with other Medical Satisfaction Studies
Comparing the MAS results with those from other ambulance services is difficult due to
the differences in methodology. Patterson's (1996) survey of the Queensland
Ambulance Service is not directly comparable to the MAS PLS results, due to her using
the top-box method. She reported that 80% of respondents rated QAS as excellent and
17% as good. The NWR–ASV ’s (1999) survey results of 99% satisfaction are even
harder to compare due to the use of just a “yes-no” option. Perhaps they can be
compared on a qualitative basis, rather than being able to directly compare them with
this study’s results. The data suggest that ambulance services in Australia are rated
very highly by their users.
Cohen, Forbes and Garraway (1996) reported that customers tend to score their
satisfaction with health services in a hysteretic method where by such an organisation
“Customer Satisfaction in the MAS” Chapter 6: Discussion
100
achieved high satisfaction scores over a range of high to moderate performance. When
the heath service functioned poorly, they were rated as performing very badly. They
then continued to score very low until the health service was back to a high quality
state. Berry (1995) suggested that customers were less tolerant for services that were
vital to their financial security or health, such as insurance and health-care. MAS and
its subscription scheme have aspects of both. Quint and Fergusson, in their 1997 report
into Victorian Hospitals stated that patients tended to give very high ratings to a
hospital in overall terms, although some specific issues did not rate highly. While the
scores were obtained by Quint and Fergusson (1997) used the “top box method”
parallels can be drawn in Image and Response. They were two of the lower scoring
latent variables in the PLS results.
6.4 Latent Variables and Impacts
The Latent Variable Staff had the highest impact and the highest value. This is the
major factor in the high overall score. Staff's high impact is not unsurprising. MAS is a
service organisation. The MAS staff member with whom the customer deals with is the
face of the organisation for that patient. Studies such as that by Williams and Calnan
(1991) have shown that the most important aspect of a service organisation is staff
interaction with the customer. However, the fact that Staff has around twice the impact
of other latent variables such as Response, Life Saving or Subscription needs more
exploration.
The Quint and Fergusson (1997) hospital study suggested that the key drivers of very
high satisfaction are communication aspects (particularly at admission), compassionate,
“Customer Satisfaction in the MAS” Chapter 6: Discussion
101
reassuring attitude of all staff, courtesy of nurses and doctors and availability of medical
staff. The key drivers concept can thought of as analogous to the impact value in the
PLS methodology. Weinsing et al. (1998) found that patients, in general practice care,
put high priorities on aspects such as “informativeness”, “humaneness” and
“competence /accuracy”. Quint and Fergusson (1997) also found that “technical” skills
of medical staff are assumed to be high, and it is the “personality” aspects of a hospital,
which appear to play the greater role in patient satisfaction.
As previously discussed in chapter 2, the “black box” nature of paramedical services
makes it difficult for customers to judge quality of the services, even after they have
been performed. It is implied from the impact scores that the customers were basing
their overall satisfaction more on issues that they could judge such as attitude or
professional look of the uniform than on arguably more important but harder to evaluate
issues such as quality of medical care.
While the clinical performance of ambulance paramedics has been the focus of attention
(Baragwanath, 1997a), inadequate attention has been paid to the selection, training and
monitoring of customer service aspects.
Staff, with a satisfaction rating of 92 and an impact of 1.940 was composed of a large
number of high scoring questions. The lowest scoring was question (13), “Level of
explanation of ambulance officers’ actions” with 8.69. This result is still very high. The
score is suggestive of a training need to ensure the paramedic explain the medical
procedures being performed to the patient in language that they can understand.
Question (16), “Perceived level of training of MAS staff”, was also relatively low,
“Customer Satisfaction in the MAS” Chapter 6: Discussion
102
compared to the other questions, with 8.95. Given that the general public has little idea
of the actual schooling, the score of this manifest variable may be marginally increased
by a marketing campaign highlighting the university education of the Ambulance
Paramedics.
The latent variable Subscription had the next highest impact (1.180) and a mid-range
satisfaction score (86). The manifest variables that comprised Subscription were
questions 29-32. The highest score, 9.29, was for Q29 “Subscription is a way of
avoiding a large bill”. This was followed by Q32 “Subscription helps a worthy cause”
with a score of 8.87. Q31, “Subscription provides a service to all people” scored 8.45
while “Subscription provides better equipment” rated 8.37. The prime motivation
appeared to be fiscal, while the more altruistic motives still scored well. While
avoiding a large bill was the most important factor, providing better equipment, a
service to all people, and helping a worthy cause were also strong motivational factors
for subscription.
The high impact score of Subscription is, at first glance, inconsistent with Sing’s (1990)
finding that medical insurance was a very independent dimension from satisfaction with
medical care. It seems that the subscription scheme is perceived as being part of MAS
rather that just another form of insurance; hence the high level of support for the
concept of paying subscription being analogous with a donation to a worthy cause.
Given the high satisfaction score of Subscription, it would appear that subscribers are
generally happy with the current cost of membership. Comments written on the survey
forms supported the contention that it was seen as a good value form of insurance.
“Customer Satisfaction in the MAS” Chapter 6: Discussion
103
However many saw it as a donation or a way to support a worthy cause. Some
pensioners maintained their subscription even though they would have received a free
service. From the data, Subscription is not price critical and could withstand a
significant price increase without a large drop in subscription rates.
The latent variable Response had a high impact and a relatively low satisfaction score.
It was composed of manifest variables 21, 22, 23 and 26. Q21, “Availability of an
ambulance at all times”, rated 7.87. Q22 “Response time of ambulance to an
emergency” scored 8.10. Q23, “Speed of admittance to hospital” scored 8.14. Q26,
“Perception of Government support of MAS”, rated the lowest of all the manifest
variables with 5.57. Q26 was not expected to be in the Response latent variable but
modelling suggested that the customers perceived that government support, ambulance
availability and response to be closely related. At the time of the data collection, a
number of high profile cases involving long ambulance response times were featured in
the mass media, although Baragwanath’s (1997a) audit found that response times had
progressively improved since the early 1990’s. Waiting times at hospital was also an
issue in the media at the time and this may of impacted on manifest variable Q23.
The Life Saving latent variable was composed of just two questions, Q17 “Professional
look of MAS uniform” and Q20 “Probability of MAS officers keeping me alive until I
reached hospital”. Q17 scored 8.77 while Q20 scored 9.07. It was not obvious at the
preliminary stage that these two questions were related, however, in the modelling they
were correlated. These results support the discussion above that patients have little
medical knowledge and are therefore unable to assess quality of care. A major way in
“Customer Satisfaction in the MAS” Chapter 6: Discussion
104
which customers judged the ability of paramedics to maintain life was by how
professional they appeared.
The MAS currently has two basic version of the uniform. The older style is a typical
dark blue shirt and trousers with shoulder badges while the newer uniform is the same
colour overalls with large ambulance labels and reflective tape. The newer uniform was
introduced mainly on occupational health and safety grounds. Given that medical skill
is appeared to be judged by appearance of the uniform, further research needs to be
done on the different uniforms impact on various sections of the MAS client base.
The latent variable Image had the lowest satisfaction score (72) and almost zero impact
(0.060). An interpretation of this is that the respondents were media worldly, whilst
they may receive media reports they do not necessarily believe them. Image consisted
of just two questions. Q24, “Public perception of MAS” rated 7.74 while Q25, “Media
image of MAS” scored 6.72. These are the second and third lowest rated items in the
survey and combine to give the Image latent variable a comparatively low satisfaction
rating. It should be noted that the data collection was carried out in a period of time just
after a string of negative media reports concerning ambulance delays in responding to
patients. However to put that in some perspective the rating of 72 for Image was higher
than the American Customer Satisfaction Index, 2001 average for hospitals (68), hotels
(71) and federal government agencies (69) (Fornell, 2001).
The low impact rating of Image also suggests that a media campaign just targeting the
image of an ambulance service would have little effect on overall satisfaction. Such a
“Customer Satisfaction in the MAS” Chapter 6: Discussion
105
promotion, to be effective, would need to focus on the paramedics medical and
interpersonal skills, ambulance availability and short response times.
The latent variable Vehicle with a satisfaction of 87 and an impact of 0.030 was
calculated from manifest variables Q1 to Q5. These referred to aspects of the
ambulance and to the adequacy of equipment in general. The lowest of these was, Q3
“comfort of ride in the ambulance”. Ride comfort was one of a number of issues MAS
managers commented on in the initial interviews referred to in chapter 4. If this
variable score were to be significantly increased, the comfort of ride would be the first
area to be investigated. However, because of the almost zero impact of Vehicle, this
initiative would have an insignificant effect on predicted overall satisfaction.
The latent variable Cost/Value relates to the cost and value for money of the
subscription scheme. Both manifest variables rated on the high eights, resulting in a
high satisfaction rating of 87. As with Vehicle, the impact is virtually nil, 0.03. Given
the high satisfaction rating of Subscription, the current cost of subscription does not
seem to be price critical and could therefore withstand an increase in price without a
predicted corresponding large drop in re-subscription.
6.5 Differences between Groups
Overall, satisfaction was similar in all groupings. The biggest variations were based on
usage (see Table 9, p. 93). Those who had never used the MAS rated it at 86 overall
while those that had used in more than twice scored it significantly higher at 91. In
almost all the variables, there is a positive correlation between increasing use and a
“Customer Satisfaction in the MAS” Chapter 6: Discussion
106
higher satisfaction rating. This suggests that actual MAS performance was better than
the a pori perception and expectation. To add weight to this argument, the rating of
Image is lowest with those that used MAS the most. It is possible they were comparing
the media image with their own experience and perceived a large gap, therefore rating
Image lower as their esteem of MAS rose.
In Chapter 5, Table 6 (p. 89) compared HCCH and subscribers. Both groupings scored
the overall satisfaction at similar levels however, the scores for the latent variables
differed significantly. As would be expected the subscribers rated Subscription,
Cost/Value, Re-subscribe and Recommend to Re-subscribe more highly than the HCCH
who did not need to subscribe. HCCH would have had by definition a lower average
income and hence the cost of subscription would have relatively greater. In addition, as
stated previously HCCH participants received the service for free and did not need to
subscribe, hence they were less likely to score a question regarding subscription highly.
In an analogous setting Quint and Fergusson’s (1997), hospital study found there was
no significant difference in the satisfaction levels of public and private patients.
Unfortunately, they did not report the individual factors so a more thorough comparison
cannot be made.
While Subscribers who have used MAS showed a strong positive trend in their
satisfaction with latent and outcome variables, HCCH satisfaction ratings did not
change significantly with usage. This is shown in table 7 (p. 91) and table 8, (p. 92).
Fornell (2001) suggested that satisfaction varied depending on whether a customer was
receiving a service or collecting earned benefits. Possibly it is that subscribers
“Customer Satisfaction in the MAS” Chapter 6: Discussion
107
perceived that the MAS was a service that they had chosen to use while HCCH
participants believed that it was a service they are forced to use and as a result had a
slightly different model of satisfaction.
Recent work using a finite mixture PLS approach (Hahn, Johnson and Herrmann, 2000)
showed promise for capturing the heterogeneity that has been evident in this paper
amongst the different groups of MAS customers. Indeed there may be segments in the
MAS client population that have differing needs and priorities but are not easily
described using traditional demographic values. More work needs to be done on the
different requirements for satisfaction of the various segments of the MAS customer
base.
6.6 Comparison of the PLSM and other Methods
All the different statistical methods employed in this paper agreed that the customers
were highly satisfied the MAS. However, the information provided from the methods
and what can be done with that information did differ. PLS provides additional insights
over and above those provided by the traditional statistics of mean, median, t-tests and
ANOVA. The major benefit is the predictive nature of PLS that enables the accurate
targeting of quality to maximise customers satisfaction and repurchase.
The objective of most customer satisfaction surveys is to find which areas to target for
improvement. The descriptive statistics found the lowest results to be in the areas
regarding government support and media image of MAS. The PLS modelling
suggested that these areas had little impact on the overall satisfaction and hence reuse
“Customer Satisfaction in the MAS” Chapter 6: Discussion
108
and recommendation. Even a significant increase in the satisfaction associated with
these areas was predicted to have very little effect on overall satisfaction. Time and
effort would have been better spent with factors that had high impact such as Staff or
Response.
The t-tests found that subscribers and HCCH had differing satisfaction with issues
regarding subscription. This is an unremarkable finding given the fundamental
difference between the two groups is that one paid for a subscription and the other did
not. The PLS modelling also found this differentiation but also provided a number of
other insights that were not apparent from the traditional statistical methods. These
included the importance of the interpersonal aspects of the staff above their medical
skills and availability. The perceived correlation between life saving ability and
professional appearance was unexpected.
Like the other statistics, ANOVA found differences between the groups regarding
subscription issues. However, ANOVA found a significant difference between
subscribers and HCCH with overall satisfaction and willingness to recommend to others
that was not found in the t-test or PLS results.
Given the unsuitability of the parametric test to analyse satisfaction survey data, greater
confidence should be placed in the PLS results.
Unlike traditional statistics, PLS provides explains variance in the endogenous variables
and is able to cope with “noisy” data and complex models. PLS methodology predicts
and provides managers with explicit benchmarks for evaluating performance. The
“Customer Satisfaction in the MAS” Chapter 6: Discussion
109
impact score in the PLS model provides information that managers need to make
resource allocation decisions.
6.7 Acknowledged Weaknesses of the Study.
From a total mail out of 450, there were 265 returns as shown in Table 3 (p. 75).
However, 10 respondents did not reveal their subscriber or use status leaving 255 valid
responses for an overall valid return rate of 57%. Subscribers that have used had a good
return rate of 80% while health care card holders that have not used only replied 30% of
the time. As a result the finding for the subscribers are more likely to be accurate than
the for health care card holders. Likewise, the results for users are likely to be more
exact than for non users.
In common with most other mail out surveys, this process would select against those
that were illiterate, non-English speaking or visually impaired. It is possible that some
of the replies were from these groups but it is likely that they were under represented in
the sample. People who were homeless or had changed address in the time from
ambulance attendance and the survey being sent would also be under represented.
Customers that had died would obviously not be able to reply to the survey but their
relatives could and in at least two cases did respond. This was judged valid as these
individuals were also considered customers.
A common problem with satisfaction studies is that the data is not normally distributed
and hence commonly used statistics such as t-tests are inappropriate. The data in this
study showed large negative values for skewing and high positive kurtosis values.
“Customer Satisfaction in the MAS” Chapter 6: Discussion
110
Question (35) dealing with “My overall satisfaction with the MAS” for example, had a
skew of –1.24 and a kurtosis of 2.14, indicating a peaked asymmetric distribution highly
skewed to the right. The inappropriateness of using parametric statistics is
acknowledged but these methods were presented because they are in common use for
such studies and enabled comparison to be made with the PLS technique.
6.8 Proposed MAS use of findings
The MAS would be able to utilise the findings of this thesis in a number of ways. As
discussed previously they include benchmarking, key performance indicator, selection
and training of staff and targeting of advertising.
The benchmarking of the result with other organisations would enable MAS to compare
its satisfaction levels with that of many other organisations. An exchange of ideas may
flow in both directions.
MAS could use customer satisfaction as a key performance indicator (KPI). Along with
other KPI’s such as response time and patient outcome, customer satisfaction would
give a measure of the quality, efficiency and effectiveness of the ambulance service.
In the selection of staff to be employed by MAS, personality traits that correlate with
the customer reporting high satisfaction may be selected for. It is suggested that a
profile of an individual who is sympathetic, friendly, calm, trustworthy and has a
professional “look” should be added to the existing criteria.
“Customer Satisfaction in the MAS” Chapter 6: Discussion
111
The results from this thesis should be made known to the staff of MAS through existing
clinical update days. The findings should also be incorporated into the curriculum of
the main training providers: Monash and Victoria Universities. A heightened awareness
by the paramedic of what is important to an ambulance customer would better enable
them to provide a more satisfying service.
Advertising for the ambulance subscription scheme should be targeted with the
motivations discussed in this thesis in mind. They include the self-interested “avoiding
a large bill” and the more altruistic “helping a worthy cause” or “ providing a service
for all”. The customer generated statements behind the high impact variables such as
Staff, Life Saving and Response should be emphasised in the advertising. These include
processional look, good response times and availability of ambulances, level of training
and compassionate nature of staff.
6.9 Conclusion
The paper showed that the PLS methodology can be successfully applied to the field of
satisfaction measurement of the ambulance service customer. It also found the
determinants of customer satisfaction in this field. It agreed with work by other
researchers that aspects of staff are very important in service industries and that medical
services are rated highly unless they are very poor. An unexpected insight was that
perceived medical ability was strongly linked to the paramedic’s professional
appearance.
The model predicted that changes in the satisfaction rating of the Staff variable would
have a significant effect on Overall Satisfaction and hence outcomes such as Reuse and

“Customer Satisfaction in the MAS” Chapter 6: Discussion
112
Re-subscription. It also predicted that the model was insensitive to changes in
satisfaction with Image, Cost or Equipment.
“Customer Satisfaction in the MAS” Chapter 7: Bibliography
113
7. Bibliography
Aharony, L. and Strasser, S. (1993) “Patient satisfaction: what we know about and what
we still need to explore”, Medical Care Review, Vol. 50, pp. 49 – 79.
Aiken, L.S. and West S.G. (1991) Multiple Regression: Testing and Interpreting
Interactions, Newbury Park California, Sage Publications.
Anderson, E.W. and Fornell, C. (1993) “A Customer Satisfaction Research Prospectus”
in Service Quality in New Directions in Theory and Practice, ed. Oliver R.L.
and Rust R.T., Newbury Park, California, Sage, pp. 239–66.
Anderson, E.W. and Sullivan, M. (1993) “The Antecedents and Consequences of
Customer Satisfaction for Firms.” Marketing Science, Vol. 12 (Spring), pp. 125–
43.
Anderson, E.W. and Mittal, V. (2000) “Strengthening the Satisfaction–Profit Chain”
Journal of Service Research, Vol. 3, No. 2., pp. 107–20.
Andrews, F.M. (1984) “Construct Validity and Error Components of Survey
Measurement: A Statistical Modelling Approach”, Public Opinion Quarterly,
pp. 404–442.
Aubert, B.A., Rivard, S. and Patry, M. (1995) Development of Measures to Assess
Dimensions of IS Operation Transactions, Centre for International Research on
Analysis of Organisations Scientific Series, No. 95s-15, [Internet] Available
from:<http://www.cirano.qc.ca/publication/cahier/resume/95s-15.html>
[Accessed April 20th, 2000]
“Customer Satisfaction in the MAS” Chapter 7: Bibliography
114
[AWQM] Australian Wider Quality Movement, (1997) Quality, Productivity and
Competitiveness. The role of quality in Australia’s social and economic
development, Sydney, Standards Australia Publishing.
Bachelet, D. (1995) “Measuring Satisfaction, or the Chain, the Tree and the Nest” in
Brooks, Richard Ed. (1995) Customer Satisfaction Research, Amsterdam,
European Society for Opinion and Marketing Research.
Bagozzi, R.P. and Yi, Y. (1994) “Advanced Topics in Structural Equation Models” in
Advanced Methods of Marketing Research, ed. Bagozzi R.P., Cambridge,
Blackwell, pp. 317–85.
Baker, R. (1991) "The reliability and criterion validity of a measure of patients'
satisfaction with their general practice" Family Practice, Vol. 8, No. 2, pp. 171–
7.
Baker, R. and Streatfield, J. (1995) “What type of practice do patients prefer?:
Exploration of practice characteristics influencing patient satisfaction”, British
Journal of General Practice, Vol. 45 No. 40, pp. 654-9.
Baker, R. and Whitfield, M. (1992) “Measuring patient satisfaction: a test of construct
validity”, Quality Health Care, Vol. 1, No. 2, pp. 104 – 9.
Baragwanath, C.A. (1997a) Special Report No. 50. Metropolitan Ambulance Service:
Fulfilling a vital community need, Auditor General’s report into the MAS,
Melbourne, Victorian Government Printer.
“Customer Satisfaction in the MAS” Chapter 7: Bibliography
115
Baragwanath, C.A. (1997b) Special Report No. 51. Rural Ambulance Service: Fulfilling
a vital community need, Auditor General’s report, Melbourne, Victorian
Government Printer.
Baragwanath, C.A. (1997c) Special Report No. 53. Victoria's Multi-agency Approach to
Emergency Services: A focus on public safety, Auditor General’s report,
Melbourne, Victorian Government Printer.
Baragwanath, C.A. (1998) Special Report No. 56 Acute Health Services under Casemix:
A case of mixed priorities, Auditor General’s report, Melbourne, Victorian
Government Printer.
Bateson, J. and Greyser, S. (1982) The Effectiveness of the Knowledge Generation and
Diffusion Process in Marketing – Some Considerations and Empirical Findings,
The London Business School, Paper No. 82/4.
Benjamin, M. and Hollings, A.E. (1995) “Toward a Theory of Student Satisfaction: An
Exploratory Study of the Quality of Student Life”, Journal of College Student
Development, November/December 1995, Vol. 36, No. 6, pp. 574– 86.
Bennington, L. and James, C. (1996) Customer-Driven research - The enhanced focus
group to establish value and service quality, Working Paper 2/96, Department of
Management, Monash University.
Bentler, P.M. and Weeks, D.G. (1980) “Linear structural equations with latent
variables,” Psychometrika, No. 45, pp. 289–307.
“Customer Satisfaction in the MAS” Chapter 7: Bibliography
116
Berry, L.L. (1995) “Lessons from a Ten-Year Study of Service Quality in America”, in
Customer Satisfaction Research, Brooks R. ed., European Society for Opinion
and Marketing Research, Amsterdam.
Berwick, D.M. and Knapp, M.G. (1987) “Theory and Practice for Measuring Health
Care Quality.” Health Care Financing Review, Annual Supplement, pp. 49–55.
Berwick, D.M. (1989) “Continuing Improvement as an Ideal in Health Care.” New
England Journal of Medicine , Vol. 320, No. 1, pp. 53–6.
Bitner, M.J. (1990) “Evaluating Service Encounters: The Effects of Physical
Surroundings and Employee Responses” , Journal of Marketing, Vol. 54, No. 4,
pp. 69–82.
Blalock, H.M. (1982) Conceptualisation and Measurement in the Social Sciences,
Beverly Hills, California: Sage Publications, Inc.
Blendon, R. (1989). “Three Systems: A Comparative Survey.” Health Management
Quarterly , Vol. 11, No. 1, pp. 2–10.
Blendon, R. and Donelan, K. (1990). “The Public and the Emerging Debate Over
National Health Insurance.” New England Journal of Medicine, Vol. 323, No. 3,
pp. 208–12.
Blum, L.A. (1995) “Prickly Patients” Emergency Medical Services, May, 1995, p. 32 -
73.
Bolton, R.N. and Drew, J.H. (1991), “A Multistage Model of Customers’ Assessments
of Service Quality and Value,” Journal of Consumer Research, No. 17 (March),
pp. 375–84.
“Customer Satisfaction in the MAS” Chapter 7: Bibliography
117
Bookstein, F.L. (1991) “Partial Least Squares: A Dose-response Model for
Measurement in the Behavioural and Brain Sciences.” Psycoloquy, [Internet] 2,
(3), March 2nd, Available from:
<http://www.wachau.ai.univie.ac/Psycoloquy/91.v2> [Accessed May 23rd 2000].
Boulding, W., Staelin ,R., Kalra, A. and Zeitham, V. (1993) “A Dynamic Process
Model of Service Quality: From Expectations to Behavioural Intentions,”
Journal of Marketing Research, Vol. 30, No.2, pp. 7–27.
Brecka, J. (1995) “ACSI scores might relate to stock prices”, Quality-Progress, Vol. 28,
No. 4, pp. 11–4.
Brennan, P.F. (1995) “Patient satisfaction and normative decision theory” Journal of
the American Medical Informatics Association, Vol 2, No. 2, pp. 250–9.
Brooks, R. (1995) Customer Satisfaction Research, European Society for Opinion and
Marketing Research, Amsterdam.
Brown, J.B. Boles M., Mullooly J.P. and Levinson W., (1999) “Effect of Clinical
Communication Skills Training on Patient Satisfaction: A Randomized
Controlled Trial”, Annuals of Internal Medicine, Vol. 131, pp. 822–9.
Brown, T.J. Churchill G.A. and Peter J.P., (1993) “Research note: Improving the
measurement of service quality”, Journal of Retailing, Vol. 69, No. 1, pp. 127–
39.
Bryant, B.E. and Cha, J. (1996) “Crossing the Threshold” Marketing Research: A
Magazine of Management and Applications. Vol. 8, No. 4, pp. 20–8.
“Customer Satisfaction in the MAS” Chapter 7: Bibliography
118
Burgess, S. (1998) “An analysis of ambulance service response times and service
delivery in Melbourne, Australia” Australasian Journal of Emergency Care,
Vol. 5 No. 3, pp. 8–12.
Busemeyer, J.R. and Jones, L.E. (1983) “Analysis of Multiplicative Combination Rules
when the Causal Variables are Measured with Error”, Psychological Bulletin,
Vol. 93, pp. 549–62.
Calnan, M. (1988) “Lay evaluation of medicine and medical practice: report of a pilot
study.” International Journal of Health Services Vol. 18, No. 2, pp. 311–22.
Campbell, M., Sullivan, F. and Murray, S. (1995) “Videotaping of general practice
consultations: effect on patient satisfaction”, British Medical Journal, 22 July
1995, Vol. 311, pp. 236–8.
Caple, L. (1994) “Marketing Ambulance Services”, Frontline, December, 1994, pp. 37–
9.
[CFI] Claes Fornell International Group (2000) Home Page [Internet]. Available from:
<http://cfigroup.com> [Accessed March 7th 2001]
Chaska, N.L. (1980) “Use of medical services and satisfaction with ambulatory care.”
Public Health Report Vol. 95 No.44. pp. 1–24.
Chen, I.J., Gupta, A. and Rom, W. (1994) “A study and price in service operations”,
International Journal of Service Industry Management, Vol. 5, No. 2, pp. 23–33.
Chin, W. W. and Gopal, A. (1995) “Adoption Intention in GSS: Importance of Beliefs.”
Data Base Advances, Vol. 26, pp. 42–64.
“Customer Satisfaction in the MAS” Chapter 7: Bibliography
119
Chin, W.W., Marcolin, B.L. and Newsted, A. (1999) “A Partial Least Squares Latent
Variable Modelling Approach for Measuring Interaction Effects: Results from a
Monte Carlo Simulation Study and Voice Mail Emotion / Adoption Study”.
[Internet]. Available from :< http://disc-nt.cba.uh.edu/chin/icis96.pdf.>
[Accessed May 5th, 1999]
Chin, W. W., Salisbury, W.D. and Gopal, A. (1996) Perceived Cohesion in Groups: A
confirmatory factor analysis of the dimensions of belonging and morale. Home
Page. [Internet]. (September 15th) Available from:
<http://dave.cbi.msstate.edu/research/cohesion.html.> [Accessed June 25th,
1999]
Christensen, M., and Olsen, F. (1998) “Out of hours service in Denmark: evaluation
five years after reform”, British Medical Journal, Vol. 316, pp. 1502–5.
Cohen G., Forbes, F. and Garraway, M. (1996) “Can different patient satisfaction
survey methods yield consistent results? Comparison of three surveys”, British
Medical Journal, Vol. 313, pp. 841–4.
Compeau, D.R. and Higgins, C.A. (1995) “Application of Social Cognitive Theory to
Training for Computer Skills.” Information Systems Research, Vol. 6, pp. 118–
43.
Cottrel, R.J. (1995) “Proactive Relationship Management: The Next Step to Long-Term
Customer Loyalty.” in Brooks, Richard Ed. (1995) Customer Satisfaction
Research, European Society for Opinion and Marketing Research, Amsterdam.
“Customer Satisfaction in the MAS” Chapter 7: Bibliography
120
Csupor, B. (1997) Clinical Quality Assurance Plan, Metropolitan Ambulance Service
internal document, issued August 26th, 1997.
Dale, I. (2000) personal communication, 10/1/2000. Manager Quality Review Team,
Metropolitan Ambulance Service, Doncaster.
Dale, J.C. and Howanitz, P.J. (1996) “Patient Satisfaction in Phlebotomy – a College of
American Pathologists Q-Probes Study”, Laboratory Medicine, Vol. 27, pp.
188–92.
Daly, D. (1992) “Customer Service Above and Beyond”, Journal of Emergency
Medical Services, August, pp. 7– 8.
Davidson, S.J. (1993) “Closing the Loop: Discard Bad Applies or Continuously
Improve EMS?” In Quality Management in Prehospital Care. Sword RA (Ed.),
National Association of EMS Physicians. Mosby-Year Book, Inc., 1993, pp.
55–69.
DiMatteo, M.R. and Hays, R.D. (1980) “The significance of patients' perceptions of
physician conduct: A study of patient satisfaction in a Family Practice Center.”
Journal of Community Health, Vol. 6, pp. 18–28.
DiMatteo, M.R., Sherbourne, C.D., Hays, R.D., Ordway, L., Kravitz, R.L. and
McGlynn, E.A. (1993) “Physicians’ characteristics influence patients’ adherence
to medical treatment: results from the Medical Outcomes Study”, Health
Psychology, Vol. 12, pp. 93–102.
“Customer Satisfaction in the MAS” Chapter 7: Bibliography
121
Djupvik, H. and Eilertsen, D. (1995) “Customer Satisfaction Monitoring to Understand
the Market: Norwegian Telecom - A Case Study” in Customer Satisfaction
Research, Brooks R., ed., European Society for Opinion and Marketing
Research, Amsterdam .
Dougherty, J.E. (1988) “First Impressions”, Emergency, December, 1988, pp. 50–1.
Draper, M. and Hill, S. (1996) The role of patient satisfaction surveys in a National
approach to hospital quality management, Commonwealth Department of
Health and Family Services, Australian Government Printers.
Dubé, L. and Maute, M.F. (1998) “Defensive strategies for managing satisfaction and
loyalty in the service industry”, Psychology and Marketing, Vol. 16, No. 8, pp.
775–91.
Dutka, A. (1994) AMA Handbook for Customer Satisfaction: A Complete Guide to
Research, Planning and Implementation, NTC Business Books, Illinois.
Eastham, J.N. (1997) Quality Management in Emergency Medical Services, Symposium
held at the Carlton Crest Hotel, Melbourne, 20th October, 1997. Sponsored by
the Institute of Ambulance Officers (Aust), Victoria Division.
[EOQ] European Organisation for Quality (2000) The European Customer Satisfaction
Index, [Internet]. Available from: <http://www.eoq.org> [Accessed May 20th
2000].
Ewan, J. (1992) “How to sell an Ambulance” Frontline, October, 1992, pp. 21–4.
Falkenstein, L. (1996) Nichecraft: using your specialness to focus your business, corner
your market, and make customers seek you out, New York, Harper Collins.
“Customer Satisfaction in the MAS” Chapter 7: Bibliography
122
Feigenbaum, B. (1999) “Keeping Patients Satisfied”, Physicians Financial News, Vol.
17, No. 11, pp. 22–4.
Fierman, J. (1995) “Americans can't get no satisfaction”, Fortune, Vol. 132, No. 12, pp.
186–94.
Fitch, J. (1989) “How to Avoid Killing The Customer Relationship”, Journal of
Emergency Medical Services, September, pp. 8–11.
Fitzpatrick, R. and Hopkins, A. (1983). “Problems in the conceptual framework of
patient satisfaction research: an empirical exploration.” Society of Health and
Illness Vol. 5, No. 3, pp. 297–312.
Fornell, C. (1988) “A Second Generation of Multivariate Analysis: Classification of
Methods and Implications for Marketing Research”, Journal of Marketing, Vol.
52, No. 3, pp. 407–50.
Fornell, C. (1991) National and Corporate Customer Satisfaction Indices, A
presentation at the World Quality Day, November 145, 1991, World Trade
Center Amsterdam, The Netherlands.
Fornell, C. (1992) “A National Customer Satisfaction Barometer: The Swedish
Experience”, Journal of Marketing, Vol. 56, No. 1, pp. 6–21.
Fornell, C. (1994) “American Customer Satisfaction Index”, The Total Quality Review,
November / December, 1994, pp. 4–6.
Fornell, C. (1995) “The Quality of Economic Output: Empirical Generalizations about
its Distribution and Relationship to Market Share”, Marketing Science, Vol. 14,
No. 3, pp. G203 – G210.
“Customer Satisfaction in the MAS” Chapter 7: Bibliography
123
Fornell, C. (2000) ACSI Commentary, Special Report on Government Services
December 22, 2000 [Internet] Available from:
<http://www.bus.umich.edu/research/nqrc/govt-comm-00.html> [Accessed
January 28th, 2001]
Fornell, C. (2001) Transportation/Communications/Utilities & Services Sector,
Industry, and Company Scores 1995-Q1/20,, May 21st, 2001 [Internet] Available
from : <http://www.bus.umich.edu/research/nqrc/Q1-01.html#hos> [Accessed
June 7th, 2001]
Fornell, C. and Bookstein, F. L. (1982) “Two Structural Equation Models: LISREL and
PLS Applied to Consumer Exit-Voice Theory.” Journal of Marketing Research,
Vol. 19, pp. 440–52.
Fornell, C. and Everitt-Bryant, B. (1997) The American Customer Satisfaction Index
(ACSI): The Economic Indicator that Relates Satisfaction to Customer Loyalty,
University of Michigan Business School & American Society for Quality,
Document.
Fornell, C., Ittner, C.D. and Larcker, D.F. (1995) Understanding the American
Customer Satisfaction Index (ACSI): Assessing the Financial Impact of Quality
Initiatives, Juran Institute’s Conference on Managing for Total Quality.
Fornell, C. and Johnson, M.D. (1993) “Differentiation as a basis for explaining
customer satisfaction across industries”, Journal of Economic Psychology, Vol.
14, pp. 681–96.
“Customer Satisfaction in the MAS” Chapter 7: Bibliography
124
Fornell, C., Johnson, M.D., Anderson, E.W., Cha, J. and Everitt-Bryant, B. (1996).
“The American Customer Satisfaction Index: Nature, Purpose, and Findings”.
Journal of Marketing, Vol. 60, No. 10, pp. 7-18.
Fornell, C., Lorange, P. and Roos, J. (1990). “The Cooperative Venture Formation
Process: A Latent Variable Structural Modelling Approach,” Management
Science, Vol. 36, No.10, pp. 1246–55.
Frederickson, L.G. (1995) “Exploring information-exchange in consultation: the
patients’ view of performance and outcomes”, Patient Education Counsel Vol.
25, pp. 237- 46.
Fultz, J.H., Coyle, C.B. and Reynolds, P.W. (1998), “Air medical referring customer
satisfaction: a valuable insight” Air Med Journal, Vol. 17, No. 2, pp. 51–6.
Garney, P. (1998) “Measuring Patient Satisfaction”, Medical Practice Communicator,
Vol. 5, No. 2, p. 8.
Garney, P. (1999) “Are they Patients or Are they Customers”, Medical Practice
Communicator, Vol. 6, No. 5, pp. 4–6.
Garvin, D.A. (1993) “Competing on the Eight Dimensions of Quality” in Harvard
Business Review Book: Keeping Customers. ed. Sviokla J and Shapiro B. pp.
119–37.
Geershuis, S.A., Prendergast, L., Crosby, C. and Lowe, C.F. (1994) Welsh Health
Survey Measurement Scale: Quality of Life, Patient Satisfaction, Stigma.
Gerson, R.F. (1996) Great Customer Service for Your Small Business California, Crisp
Publications.
“Customer Satisfaction in the MAS” Chapter 7: Bibliography
125
Gilbert, F.W. Lumpkin J.R. and Dant R.P., (1992) “Adaptation and Customer
Expectations of Health Care Options”, Journal of Health Care Marketing, Vol.
12, No. 3, p. 46–55.
Goldstein, S.N. (1995) “Crazed Cops”, Emergency Medical Services, Vol. 95, pp. 33–
74.
Goodman, P.S. Fichman M., Lerch F.J. and Synder P.R., (1995) “Customer-Firm
Relationships, Involvement, and Customer Satisfaction” Academy of
Management Journal, Vol. 38, No. 5, pp. 1310-24.
Gordon, J. (1996) Organisational Behaviour: A Diagnostic Approach. Sydney: Prentice
Hall.
Gray, L.C. (1980) “Consumer satisfaction with physician provided services: a panel
study.” Social Science Medicine No. 14, p. 65.
Greenfield, S., Kaplan, S. and Ware, J. E. (1985) “Expanding patient involvement in
care: effects on patient outcomes.” Annals of Internal Medicine Vol. 102, pp.
520–8.
Greenley, J. and Schoenherr, R. (1981). “Organizational Effects on Client Satisfaction
with Humaneness of Service.” Journal of Health and Social Behaviour Vol. 22,
pp. 2–17.
Hall, J.A., Irish, J.T., Roter, D.L., Erhlich, C.M. and Miller, L.H. (1994) “Satisfaction,
gender, and communication in medical visits” Medical Care. Vol. 32, pp. 1216–
31.
“Customer Satisfaction in the MAS” Chapter 7: Bibliography
126
Hall, S. and Mesure, D. (1995) “Implementing Internal Customer Satisfaction
Measurement within a Market Research Agency”, in Brooks, Richard Ed.
(1995) Customer Satisfaction Research, European Society for Opinion and
Marketing Research, Amsterdam.
Hahn, C.H., Johnson, M.D. and Herrmann, A. (2000) Capturing Heterogeneity in
Customer Satisfaction Models: A Finite Mixture PLS Approach. Working paper
series, University of Michigan Business School, [Internet] Available from:
<http://eres.bus.umich.edu/web/facnum.html.> [Accessed 10/7/2001]
Harari, O. (1993) “Ten Reasons Why TQM Doesn’t Work” Management Review, Vol.
83, No. 1, pp. 33–8.
Harvey, A.L., Gerard, W.C., Rice, G.F. and Finch, H. (1999), “Actual vs. perceived
EMS response time” Prehospital Emergency Care, Vol. 3, No. 1, pp. 11–4.
Hauck, F.R., Zyzanski, S.J., Alemagno, S.A. and Medalie, J.H. (1990) “Patient
perceptions of humanism in physicians: effects on positive health behaviours.”
Family Medicine, Vol. 22, No. 6, pp. 447–52.
Hemmansi, M., Strong, K.C. and Taylor, S.A. (1994) “Measuring service quality for
strategic planning and analysis in service firms”, Journal of Applied Business
Research, Vol. 10, No. 4, p. 24-34.
Hennig-Thurau, T. and Klee, A. (1997) “The impact of customer satisfaction and
relationship quality on customer retention: A critical reassessment and model
development”, Psychology and Marketing, Vol. 14, No. 8, pp. 737–64.
“Customer Satisfaction in the MAS” Chapter 7: Bibliography
127
Hill, N. (1996) Handbook of Customer Satisfaction, Aldershot, Gower Publishing
Limited.
Holleran, R.S. (1997) “The Care of the Family during Transport”, Air Medical Journal,
Vol. 16, No.2, pp. 36–7.
Horovitz, J. and Jurgens-Panak, M. (1992) Total Customer Satisfaction, London,
Pitman Publishing.
Huber, S.A. (1993) “Surveying patient satisfaction”, American Academy of Orthopaedic
Surgeons Bulletin, October 1993, pp. 23–5.
Hunt, D.W. and Hanks, J. (1995) “ED Extremists”, Emergency Medical Services, May
1995, pp. 33–83.
Iacobucci, D. (1996) “The Quality Improvement Customers Didn’t Want”, Harvard
Business Review, January / February 1996, pp. 20–36.
Ittner, C.D. and Larcker, D.F. (1996). “Measuring the impact of Quality Initiatives on
Firm Financial Performance”. Advances in the Management of Organizational
Quality, Vol. 1, No. 1, pp. 1–37.
Jackovitz, D.S. (1999) “Ambulatory Patient Satisfaction: A Systematic Approach to
Collecting and Reporting Information” Journal of Healthcare Quality, Vol. 21,
No. 6, pp. 12–7.
Jefferson, T. (1997) “Measuring Patient Satisfaction”, Medical Practice Communicator,
Vol. 4, No. 6, p. 3.
“Customer Satisfaction in the MAS” Chapter 7: Bibliography
128
Johnson, M.D. (1995) “The Four Faces of Aggregation in Customer Satisfaction
Research” Advances in Consumer Research, Vol. 22, pp. 89–93.
Johnson, M.D. Anderson, E.W. and Fornell, C. (1995) “Rational and Adaptive
Performance Expectations in a Customer Satisfaction Framework” Journal of
Consumer Research, Vol. 21, pp. 695–707.
Johnson, M.D. and Fornell, C. (1991) “A Framework for Comparing Customer
Satisfaction across Individuals and Product Categories” Journal of Economic
Psychology, Vol. 12, No. 6, pp. 267–86.
Johnson, M.D., Nader, G. and Fornell, C. (1996) “Expectations, perceived performance
and customer satisfaction for a complex service: The case of bank loans”,
Journal of Economic Psychology, Vol. 17, pp. 163–82.
Jones, T.O. and Sasser, E. (1995) “Why Satisfied Customers Defect”, Harvard Business
Review, November/December 1995, pp. 88–99.
Jöreskog, K.G. (1973) “A general method for estimating a linear structural equation
system” in Goldberger A.S. and Duncan O.D., Eds. Structural equation models
in the social sciences. New York: Seminar Press/Harcourt Brace.
Jöreskog, K.G. and Sorbom, D. (1988). LISREL 7: A guide to the program and
applications. Chicago, SPSS Inc.
Jöreskog, K.G. and Wold, H. (1982) “The ML and PLS Techniques for Modeling with
Latent Variables: Historical and Comparative Aspects” in Wold H. and Jöreskog
K.G. eds. Systems Under Indirect Observation: Causality, Structure, Prediction,
Vol. 1, Amsterdam, Holland, pp. 263–70.
“Customer Satisfaction in the MAS” Chapter 7: Bibliography
129
Juran, J.M., Gryna, F.M. and Bingham, R.S. (1974) Quality Control Handbook, 3rd ed.,
New York, McGraw-Hill Book Company.
Kaplan, S., Greenfield, S. and Ware, J. E. (1989) “Assessing the effects of physician-
patient interactions on the outcomes of chronic disease”, Medical Care, Vol. 27,
March, 3, pp. S110–27.
Keith, R.A. (1998) “Patient satisfaction and rehabilitation services” Archives of
Physical Medical Rehabilitation, Vol. 79, No. 9, pp. 1122–8.
Kessler, S. (1995) Total Quality Service: A Simplified Approach to Using the Baldridge
Award Criteria, American Society for Quality Research, Quality Press.
Kinnersley, P., Anderson, E., Parry, K., Clement, J., Archard, L., Turton, P.,
Stainthorpe, A., Fraser, A., Butler, C.C. and Rogers C. (2000) “Randomised
controlled trail of nurse practitioner versus general practitioner care for patients
requesting same day consultations in primary care”, British Medical Journal,
Vol. 320, pp. 1043–8.
Kuehl, A. (1993) “Developing Standards for EMS Quality Improvement.” In Quality
Management in Prehospital Care, Swor R.A. (ed.), National Association of
EMS Physicians. Mosby-Year Book, Inc., pp. 29–35.
Laffel, G. and Blumenthal, D. (1989) “The Case for Using Industrial Quality
Management Science in Health Care Organizations”, Journal of the American
Medical Association, Vol. 262, pp. 2869–73.
“Customer Satisfaction in the MAS” Chapter 7: Bibliography
130
Lescun, D. (2000) e-mail 20th May 2000, Customer Liaison and Freedom of Information
Officer David Lescun, Metropolitan Ambulance Service- Ambulance Service
Victoria.
Levinson, W., Roter, D.L., Mullooly, J.P., Dull, V.T. and Frankel, R.M. (1997)
“Physician-patient communication. The relationship with malpractice claims
among primary care physicians and surgeons”. Journal of the American Medical
Association, Vol. 277, pp. 553–9.
Lewis, B.R. (1995) “Measuring Consumer Expectation and Satisfaction”, in Brooks R.,
ed. (1995) Customer Satisfaction Research, European Society for Opinion and
Marketing Research, Amsterdam.
Lewis, M.M., Holditch-Davis, D. and Brunssen, S. (1997) “Parents As Passengers
During Paediatric Transport”, Air Medical Journal, Vol. 16, No. 2, pp. 38–42.
Lieberman, P.B. (1989) “Effect of patient gender on evaluation of intern performance”
Archives of Internal Medicine, Vol. 149, No. 8, pp. 1825–9.
Liljander, V. and Strandvik, T. (1995) “The Relation between Service Quality,
Satisfaction and Intentions” in Kunst P. and Lemmink J. Ed. (1995) Managing
Service Quality, Paul Chapman Publishing Ltd, The Netherlands.
Loblaw, A., Bezjak, A. and Bunson, T. (1999) “Developing and Testing a Visit-Specific
Patient Satisfaction Questionnaire: The Princes Margaret Hospital Satisfaction
with Doctor Questionnaire”, Journal of Clinical Oncology, Vol. 17, No. 6, pp.
1931–9.
“Customer Satisfaction in the MAS” Chapter 7: Bibliography
131
Loehlin, J.C. (1992). Latent variable models: An introduction to factor, path, and
structural analysis (2nd ed.). Hillsdale, New Jersey: Lawrence Erlbaum.
Loeken, K., Steine, S., Sandvik, L., Laerum, E. and Finset, A. (1995) “A new measure
of patient satisfaction with mammography. Validation by factor analytic
technique” Family Practice Journal, Vol. 13, No. 1, pp. 67–74.
Lohmöller, J.B. (1984) LVPLS Program Manual: Latent Variables Path Analysis with
Partial Least-Squares Estimation , Köln: Zentralarchiv für empirische
Soziaforschung.
Lohmöller, J.B. (1989) Latent variable path modelling with partial least squares.,
Heidelberg, Physica.
Long, J.S. (1983) Covariance Structure Models: An Introduction to LISREL, New York,
Sage Publishing.
Löthgren, M. and Tambour, M. (1996) Productivity and Customer Satisfaction - DEA
Network Model, Working Paper Series in Economics and Finance No. 140,
December 1996. [Internet]. Available from:
<http://swopec.hhs.se/SWoPEc/hastef/abs/hastef0140.htm> [Accessed 24/5/98]
Lumley, J., Brown, J. and Small, R. (1993) Annual Report February 1992-January
1993., Centre for the Study of Mother's and Children's Health.
MacLean, S. and Gray, K. (1998) “Structural Equation Modelling in Market Research”
reproduced from Journal of the Australian Market Research Society [Internet].
Available from:< http://www.smallwaters.com > [Accessed 20/12/98]
“Customer Satisfaction in the MAS” Chapter 7: Bibliography
132
Macneil, J., Testi, J., Cupples, J. and Rimmer, M. (1993) Benchmarking Australia,
Melbourne, Longman Australia Pty Ltd.
Mair, F. and Whitten, P. (2000) “Systematic review of studies of patient satisfaction
with telemedicine” British Medical Journal, Vol. 320, pp. 1517–20.
Marr, S.L. and Crosby, L.A. (1993) Customer Satisfaction Measurement: A
Management Information System for Total Quality, Washington, American
Marketing Association.
Martensen, A., Grønholdt, L., Eskildsen, J.K. and Kristensen, K. (1999),“Measuring
student oriented quality in higher education: Application of the ECSI
methodology”. Proceedings of the Conference on TQM for Higher Education
Institutions, August 1999, Verona, University of Verona.
[MAS] Metropolitan Ambulance Service (1996) Annual Report, Melbourne, State
Government Publisher.
[MAS] Metropolitan Ambulance Service (1997) FACTS and FIGURES, Public
Relations Department MAS, Doncaster.
[MAS] Metropolitan Ambulance Service (2001) ISO-9001:2000 and AS 4801-2000
Accreditation, Information Notice No. 2001/21, Issued February 15th, 2001,
MAS Internal Document, Doncaster.
Mattera, C.J. (1995) “The Evolving Change in Paradigm from Quality Assurance to
Continuous Quality Improvement in Prehospital Care.” Journal of Emergency
Nursing, Vol. 21, No. 1, pp. 46–52.
“Customer Satisfaction in the MAS” Chapter 7: Bibliography
133
McDowel, R.M. (1993) “Concepts in EMS Quality Management. l.” In Quality
Management in Prehospital Care . Swor R.A. ed., National Association of EMS
Physicians. Mosby-Year Book, Inc., pp. 14–28.
McKinley, R.K., Manku-Scott, T., Hastings, A.M., French, D.P. and Barker, R. (1997)
“Reliability and validity of a new measure of patient satisfaction with out of
hours medical care in the United Kingdom: development of a patient
questionnaire”, British Medical Journal, Vol. 314 pp. 193–9.
McNealey, R.M. (1994) Making Customer Satisfaction Happen: A Strategy for
Delighting Customers, London, Chapman & Hall Publishers.
McNeil, R. and Carpenter, M. (1995) “Customer Satisfaction really reflected in
Traditional Customer Satisfaction Measures”, in Brooks R. ed. Customer
Satisfaction Research, European Society for Opinion and Marketing Research,
Amsterdam.
[NQRC] National Quality Research Center (1997) Research Publications and Working
Papers National Quality Research Center: University of Michigan. (no date)
[Internet] Available from:
<http://www.bus.unimich.edu/research/nqrc/research.html> [Accessed 12/11/97]
Medibank Private (1996) Ambulance Cover, brochure, May 1996.
Meeks, J.G.T. (1984) “Utility in Economics: Theory and Applications, A Survey of the
Literature,” in Surveying Subjective Phenomena, Vol. 2, Turner C.F. and Martin
E. ed., Sage publishers, New York, pp. 41–91.
“Customer Satisfaction in the MAS” Chapter 7: Bibliography
134
Mitchell, V. (1996) “Assessing the Reliability and Validity of Questionnaires: an
empirical example.” Journal of Applied Management Studies, Vol. 5, No. 2, pp
199–207.
Mohr, L.A. and Henson, S.W. (1996) “Impact of Employee Gender and Job
Congruency on Customer Satisfaction”, Journal of Consumer Psychology, Vol.
5, No. 2, pp. 161–88.
Morris, R. (1997) The 1995 Ambulance Crisis, Resolution through Revolution,
Ambulance Employees Australia - Victorian Division : Union Bulletin,
5/5/1997.
Murray-Garcia, J.L., Selby, J.V., Schmittdiel, J., Grumbach, K. and Quensberry, C.P.
(2000) “Racial and ethnic differences in a patient survey: patients' values,
ratings, and reports regarding physician primary care performance in a large
health maintenance organization”, Medical Care, Vol. 38, No. 3, pp. 300–10.
Mutz, G., Greig, I. and Howel, S. (1995) “Customer, Dealer and Employee Satisfaction:
Prerequisites for Market Driven Quality in IBM”, in Brooks R., ed. Customer
Satisfaction Research, European Society for Opinion and Marketing Research,
Amsterdam.
Naumann, E. and Giel, K. (1995) Customer satisfaction measurement and management:
using the voice of the customer, Cincinnati, Thompson Executive Press.
Nordberg, M. (1995) “Frantic Families”, Emergency Medical Services, May 1995, pp.
32–82.
“Customer Satisfaction in the MAS” Chapter 7: Bibliography
135
[NWR–ASV] North Western Region – Ambulance Service Victoria (1999) Patient
Satisfaction Survey 1, Internal report, 27th January 1999.
O’Brien, L. and Jones, C. (1995) “Do Rewards Really Create Loyalty?" Harvard
Business Review, May-June 1995, pp. 75–83.
O'Connor, A.M., Drake, E.R., Fiset, V., Graham, I.D., Laupacis, A. and Tugwell, P.
(1999) “The Ottawa patient decision aids”, Effective Clinical Practice, Vol. 2,
pp. 163–70.
Oliva, T.A., Oliver, R.L. and Bearden, W.O. (1995) “The Relationships among
consumer satisfaction involvement, and product performance: A catastrophe
theory application”, Behavioural Science, Vol. 40, No. 2, pp. 104–32.
Olszac, P. (1996): Annual Report 1996 The Metropolitan Ambulance Service,
Melbourne, State Government Printers.
Olszac, P. (1997) The Metropolitan Ambulance Service’s response to Auditor Generals
report. Internal document, 11 November 1997.
Osse, B., Vernooij-Dassen, M., deVree, B.P.W., Schadé, E. and Grol, R. (2000)
“Assessment of the need for palliative care as perceived by individual cancer
patients and their families: A review of instruments for improving patient
participation in palliative care”, Cancer, Vol. 88, Issue 4, pp. 900–11.
Ostrom, A. and Iacobucci, D. (1995), “Consumer Trade-Offs and the Evaluation of
Services,” Journal of Marketing, Vol. 59, pp. 17–28.
“Customer Satisfaction in the MAS” Chapter 7: Bibliography
136
Parasuraman, A., Zeithaml, V.A. and Berry, L.L. (1988) “SERVQUAL: A Multiple-
Item Scale for Measuring Consumer Perceptions of Service Quality”, Journal of
Retailing, Vol. 64, No. 1, pp.12–40.
Patrick, D.L., Scrivens, E. and Charlton, J.R.H. (1983) “Disability and patient
satisfaction with medical care.” Medical Care Vol. 21, p. 1062.
Patterson, F., (1996) Patient Satisfaction Surveys and Prehospital Care, Queensland
Ambulance Service Prehospital Care Research Unit, unpublished report.
Pedersen, D. (1997) “Dissing Customers”, Newsweek, June 23, 1997, pp. 56–7.
Perry, N. (1996) “Mind Your Manners: Are you committing EMT etiquette sins?”,
Emergency Medical Services, June 1996, pp. 46–57.
Pesznecker, D.F. (1992) “Connections”, Emergency, January 1992, p. 62.
Peterson, R.A. and Wilson, W.R. (1992), “Measuring Customer Satisfaction: Fact and
Artefact” Journal of the Academy of Marketing Science, Vol. 20, pp. 61–71.
Petty, D. and Hewitt, I. (1995) “In TQ, the Process can be as Important as the Results”,
in Brooks R., Ed. (1995) Customer Satisfaction Research, European Society for
Opinion and Marketing Research, Amsterdam.
Pinto, T. (1983) “A Laying of Hands”, Emergency, March 1983, pp. 16–20.
Polsky, S.S. and Johnson, J.C. (1994) “Continuous Quality Improvement in EMS”. In
Principles of EMS Systems, Rousch W.R. ed. American College of Emergency
Physicians, 1994, pp. 291–311.
“Customer Satisfaction in the MAS” Chapter 7: Bibliography
137
Press, I. and Garney, R.F. (1998) St. Vincent Hospital: Quality - Patient Satisfaction,
[Internet]. Available from:
<http://www.stvin.org/quality/quality_patient_satisfaction_results.html>
[Accessed 31/03/99]
Quint, T. and Fergusson, J. (1997) Patient Satisfaction Survey, Victorian Public
Hospitals, Department of Human Services, Victorian State Government Printers,
Melbourne.
Roberts, P. (1997) “AGSM guarantees to index satisfaction”, The Australian Financial
Review, Friday July 11, p. 51.
Robinson, R. (1994) Follow-up Study of Health and Stress in Ambulance Services
Victoria, Australia 1993, Victorian Ambulance Crisis Counselling Unit,
Melbourne, Victorian State Government Printers.
Ross, C., Steward, C.A. and Sincore, J.H. (1993) “The importance of patient satisfaction
preferences in the measurement of health care satisfaction”, Medical Care, Vol.
33, pp. 1138–49.
Roter, D.L., Stewart, M., Putnam, S.M., Lipkin, M., Stiles, W. and Inui, T.S. (1997)
“Communication patterns of primary care physicians” Journal of the American
Medical Association, Vol. 6, pp. 277–350.
Roy, S. (1997) Interview with Sanjib Roy, Metropolitan Ambulance Service, Senior
manager, Doncaster, May 17 1997.
“Customer Satisfaction in the MAS” Chapter 7: Bibliography
138
Rowland-Morin, P.A., and Carroll, G.J. (1990) “Verbal communication skills and
patient satisfaction: a study of doctor-patient interviews”, Evaluation and the
Health Professions, Vol. 13, pp. 168–85.
Rubin, H.R. (1989) “Patient evaluations of hospital care. A review of the literature”
Medical Care, Vol. 28, pp. 3–9.
Ryan, J.L. (1994) “Quality Management.” In Prehospital Systems and Medical
Oversight 2nd Ed, . Kuehl A. ed., New York: Mosby Yearbook, Inc., , pp. 217–
46.
Sailsbury, C. (1997) “Postal survey of patients satisfaction with a general practice out of
hours cooperative”, British Medical Journal, Vol. 314 pp. 1594–1600.
Sheth, J.N. (1971) “The Multivariate Revolution in Marketing Research”, Journal of
Marketing, Vol. 35, pp 13–9.
Silvamendes, A. (2000) The European Quality Landscape, [Internet]. Available from:
<http://www.europa.eu.int/comm/dg03/index_en.htm> [Accessed 20/5/00].
Singh, J. (1990) "A Multifacet Typology of Patient Satisfaction with a Hospital Stay."
Journal of Health Care Management, Vol. 10, No. 4, pp. 8–21.
Smith, A.M. (1995) “Measuring service quality: Is SERVQUAL now redundant?”,
Journal of Marketing Management, Vol. 59, No. 4, pp. 58–70.
Smith, J.E. (1988) “Competent But Cold”, Emergency, October 1988, p. 80.
Spiro, D.C. (1995) “Boisterous Bystanders”, Emergency Medical Services, May 1995,
pp. 34–75.
“Customer Satisfaction in the MAS” Chapter 7: Bibliography
139
Spreng, R.A. and Olshavsky, R.W. (1993) “Desires Congruency Model of Consumer
Satisfaction” Journal of the Academy of Marketing Science, Vol. 21, No. 3, pp.
167–77.
Stelber, S.R. (1988). “How consumers perceive health care quality” Hospitals Vol. 62,
No. 7, p. 79.
Stelber, S.R. and Krowinski, W. (1990). Measuring and Managing Patient Satisfaction.
American Health Association.
Stewart, T.A. and Woods, W. (1996) “After all you’ve done for your customers, why
are they still not happy?” Fortune, Vol. 133, No. 2, pp. 56–9.
Struebing, L. (1996) “ACSI score continues to decline”, Quality Progress, Vol. 29, No.
8, pp. 17–8.
Swan, T.H. (1989) “Polishing Your Public Image: The Reflection can be Rewarding”,
Journal of Emergency Medical Services, June 1989, pp. 60–2.
Swor, R.A. (1992) “Quality Assurance in EMS Systems”, Emergency Medicine Clinics
of North America., Vol. 10, No. 3, pp. 597–610.
Swor, R.A. (1993), Quality Management in Prehospital Care, St Louis, Mosby Lifeline.
Taigman, M. (1996) “Can Empathy and Compassion be Taught?", Journal of
Emergency Medical Services, June, pp. 43–48.
“Customer Satisfaction in the MAS” Chapter 7: Bibliography
140
Tambour, M. and Löthgren, M. (1998) Productivity and Customer Satisfaction – A DEA
Network Model, [Internet]. Available from:
<http://idears.uqam.ca/ideas/data/Papers/hhshastef0140.html> [Accessed
12/5/1999]
Thomas, A.M. (1998) "Patient Satisfaction: Measuring the Art of Medicine", Journal of
the American Medical Association, Vol. 280, No. 24, p. 2127.
Toombs, K. and Bailey, G. (1995) “How to redesign your organization to match
customer needs”, Planning Review, Vol. 23, No. 2, pp. 20–4.
Turnbull, D.A., Wilkinson, C., Yaser, A., Carty, V., Svigos, J.M. and Robinson, J.S.
(1999) “Womens role and satisfaction in the decision to have a caesarean
section”, Medical Journal of Australia, No. 170, pp. 580–3.
Vasilash, G.S. (1995) “Quality: Better than ever”, Production, Vol. 107, No. 1, p. 8.
Venkatram, R. (1995) “Making CSM a Power Tool: Composite indices boost the value
of satisfaction measures for decision making”, Marketing Research, Vol. 7,
No.3, pp. 10–16.
Wakefield, D.S. and Wakefield, B.J. (1993) “Overcoming the Barriers to
Implementation of TQM/CQI in Hospitals: Myths and Realities.” Quality
Review Bulletin - Journal of Quality Improvement, Vol. 19, No. 3, pp. 77–88.
Ware, J.E. and Hays, R.D. (1988.) “Methods of measuring patient satisfaction with
specific medical encounters” Medical Care, Vol. 26, No. 4, pp. 393–402.
“Customer Satisfaction in the MAS” Chapter 7: Bibliography
141
Wärneryd, K.E. (1988), “Economic Psychology as a Field Study”, in Handbook of
Economic Psychology, Van Raaij W.F., Van Veldhoven G.M. and Wärneryd
K.E., Dordrecht: Kluwer ed., pp. 2–41.
Weinsing, M., Jung, H.P., Mainz, J., Olesen, F. and Grol, R. (1998) “A systemic review
of the literature on patient priorities for general practice care. Part 1: Description
of the research domain” Social Science Medicine, Vol. 47, No. 10, pp. 1573–88.
Weiss, B.D. and Senf, J.H. (1990) “Patient satisfaction survey instrument for use in
health maintenance organizations.” Medical Care Vol. 28, pp. 434–45.
Welch, G., Birkmeyer, J.D., Schwartz, L.M., Black, W.C. and Woloshin, S. (1999)
“Simple Strategies, Complex Issues”, Effective Clinical Practice, Vol. 2, pp. 5–
7.
Wiley, D.E. (1973) “The identification problem for structural equation models in
unmeasured variables,” in Goldberger A.S. and Duncan O.D. eds., Structural
equation models in the social sciences. New York: Seminar Press/Harcourt
Brace.
Williams, S.J. and Calnan, M. (1991), “Convergence and divergence: assessing criteria
of consumer satisfaction across general practice, dental and hospital care
settings”, Social Science Medicine Vol. 33, pp. 707–16.
Wittingslow, G.E. and Markham, S. (1999) “Customer-Driven Modelling of
Satisfaction Behaviour”, Australasian Journal of Market Research, Vol. 7, No.
2, pp. 29–38.
“Customer Satisfaction in the MAS” Chapter 7: Bibliography
142
Wold, H. (1966) “Estimation of principal components and related models by iterative
least squares” in Multivariate Analysis, Kirshnaiah P.R, ed., Academic Press,
New York, pp. 391–420.
Wold, H. (1980) “Model Construction and Evaluation when Theoretical Knowledge is
Scarce—Theory and Application of Partial Least Squares" Kmenta J. and
Ramsey J.B., eds., Evaluation of econometric models. New York: Academic
Press.
Wold, H. (1981) “The Fix-Point Approach to Interdependent Systems: Review and
Current Outlook” in Wold H. ed., The Fix-Point Approach to Interdependent
Systems Amsterdam, Holland, pp. 1–35.
Wold, H. (1982) “Soft Modelling: The Basic Design and Some Extensions”, in
Joreskog, K.G. and Wold, H. eds. Systems under Indirect Observation:
Causality, Structure, Prediction Vol. 2, Amsterdam, Holland, pp. 1–54.
Wold, H. (1985) “Partial Least Squares” in Kotz, S. and Johnson, N.L. eds.,
Encyclopedia of Statistical Sciences Vol 6, New York, Wiley, pp. 581–91.
Wold, H. (1989) “Introduction to the Second Generation of Multivariate Analysis” in
Wold, H. ed., Theoretical Empiricism, New York, Paragon House, pp. vii–xi.
Wold S. and Sjostrom M., (1977) Chemometrics: Theory and Application, ACS,
Washington.
Wold S., (1978) “Cross-validation Estimation of the Number of Components in Factor
and Principle Component Models”, Technometrics, Vol. 20, pp. 397–405.
[WQM] World Quality Movement (1997) Press Release May 5th 1997, New York.
“Customer Satisfaction in the MAS” Chapter 7: Bibliography
143
Xi, L. and Crane, N. (1993) Electronic Style: a guide to citing electronic information,
[Internet]. Available from: <http://www.uvm.edu/~ncrane/estyles/apa.html>
[Accessed 29/5/97].
Yi, Y. (1990) “A Critical Review of Customer Satisfaction”, Review of Marketing 1990,
Zeithaml V.A., ed., AMA: Duke University.
Zeithaml, V.A., Berry, L.L. and Parasuraman, A. (1993) “The Nature and Determinants
of Customer Expectations of Service”, Journal of the Academy of Marketing
Science, Vol. 21, No. 1, pp. 1–12.
Zemencuk, J.K., Hayward, R.A., Skarupski, K.A. and Katz, S.J. (1999) “Patients
Desires and Expectations for Medical Care: A Challenge to Improving Patient
Satisfaction”, American Journal of Medical Quality, Vol. 14, No. 1, pp. 21–7.

“Customer Satisfaction in the MAS” Appendix
144
8. Appendix
Appendix I Research Questionnaire
Appendix II Correlation Matrix
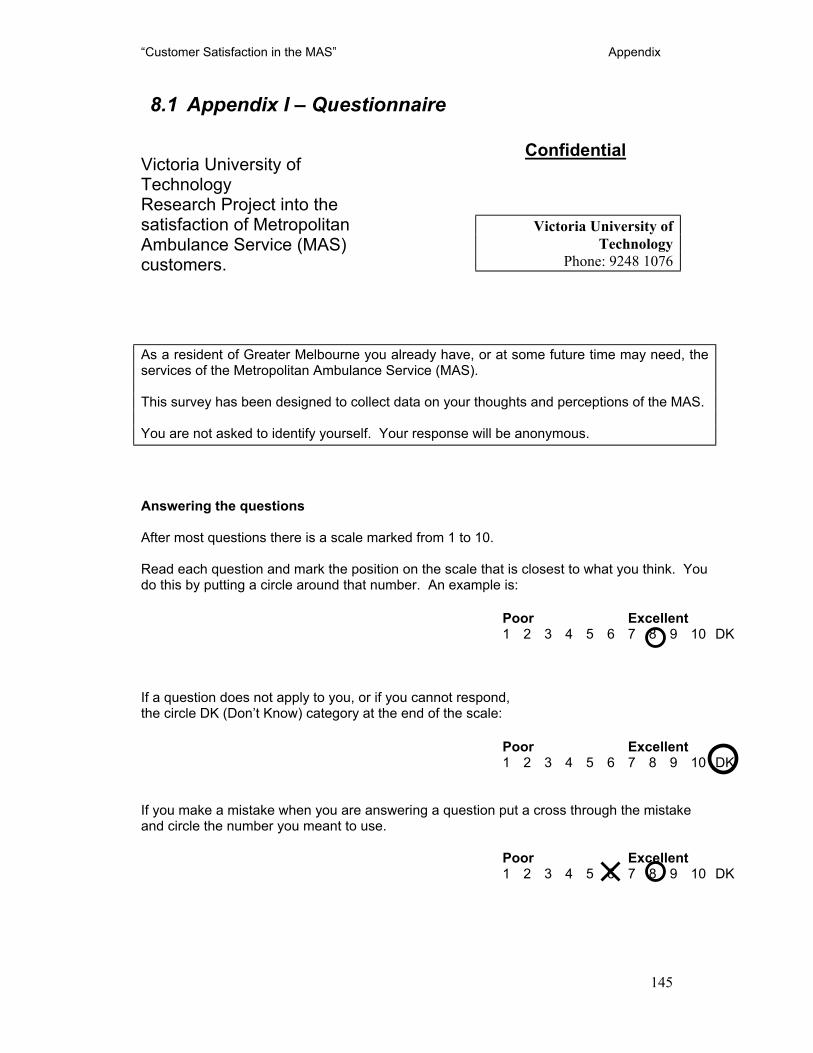
“Customer Satisfaction in the MAS” Appendix
145
8.1 Appendix I – Questionnaire
Victoria University of Technology Research Project into the satisfaction of Metropolitan Ambulance Service (MAS) customers.
Confidential
Victoria University of Technology
Phone: 9248 1076
As a resident of Greater Melbourne you already have, or at some future time may need, the services of the Metropolitan Ambulance Service (MAS). This survey has been designed to collect data on your thoughts and perceptions of the MAS. You are not asked to identify yourself. Your response will be anonymous. Answering the questions After most questions there is a scale marked from 1 to 10. Read each question and mark the position on the scale that is closest to what you think. You do this by putting a circle around that number. An example is: Poor Excellent
1 2 3 4 5 6 7 8 9 10 DK If a question does not apply to you, or if you cannot respond, the circle DK (Don’t Know) category at the end of the scale:
Poor Excellent
1 2 3 4 5 6 7 8 9 10 DK If you make a mistake when you are answering a question put a cross through the mistake and circle the number you meant to use. Poor Excellent
1 2 3 4 5 6 7 8 9 10 DK
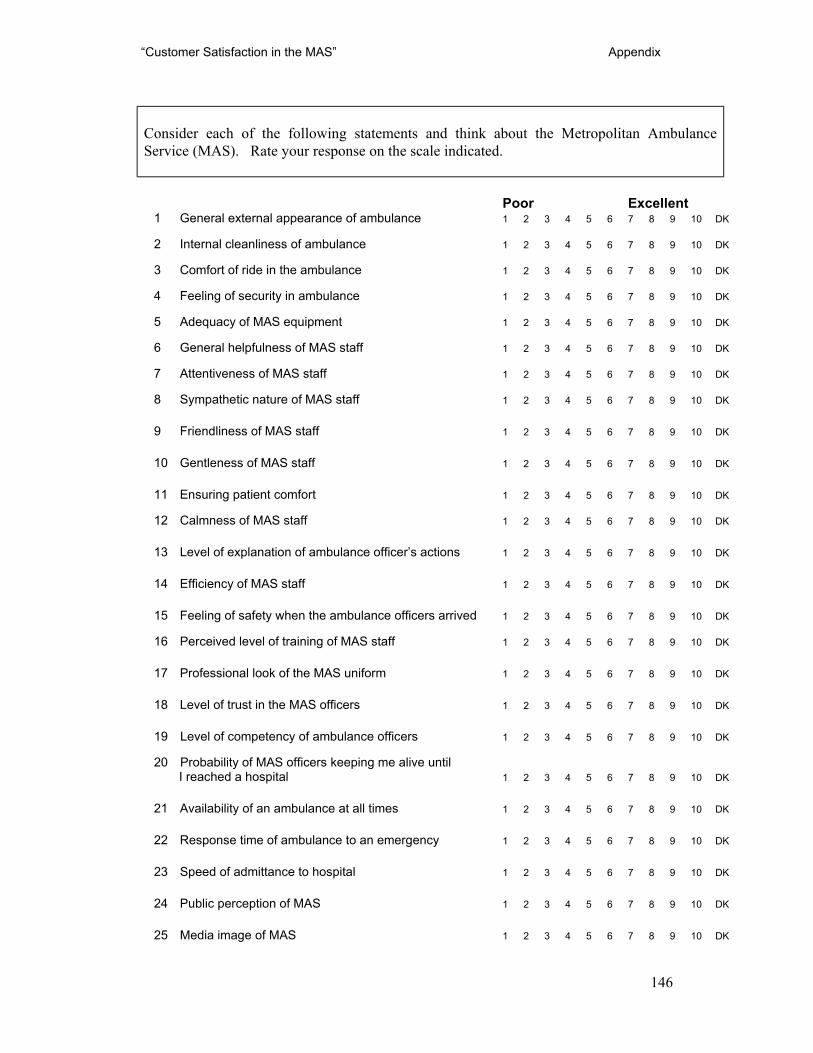
“Customer Satisfaction in the MAS” Appendix
146
Consider each of the following statements and think about the Metropolitan Ambulance Service (MAS). Rate your response on the scale indicated. Poor Excellent
1 General external appearance of ambulance 1 2 3 4 5 6 7 8 9 10 DK 2 Internal cleanliness of ambulance 1 2 3 4 5 6 7 8 9 10 DK 3 Comfort of ride in the ambulance 1 2 3 4 5 6 7 8 9 10 DK 4 Feeling of security in ambulance 1 2 3 4 5 6 7 8 9 10 DK 5 Adequacy of MAS equipment 1 2 3 4 5 6 7 8 9 10 DK 6 General helpfulness of MAS staff 1 2 3 4 5 6 7 8 9 10 DK 7 Attentiveness of MAS staff 1 2 3 4 5 6 7 8 9 10 DK 8 Sympathetic nature of MAS staff 1 2 3 4 5 6 7 8 9 10 DK 9 Friendliness of MAS staff 1 2 3 4 5 6 7 8 9 10 DK 10 Gentleness of MAS staff 1 2 3 4 5 6 7 8 9 10 DK 11 Ensuring patient comfort 1 2 3 4 5 6 7 8 9 10 DK 12 Calmness of MAS staff 1 2 3 4 5 6 7 8 9 10 DK 13 Level of explanation of ambulance officer’s actions 1 2 3 4 5 6 7 8 9 10 DK 14 Efficiency of MAS staff 1 2 3 4 5 6 7 8 9 10 DK 15 Feeling of safety when the ambulance officers arrived 1 2 3 4 5 6 7 8 9 10 DK 16 Perceived level of training of MAS staff 1 2 3 4 5 6 7 8 9 10 DK 17 Professional look of the MAS uniform 1 2 3 4 5 6 7 8 9 10 DK 18 Level of trust in the MAS officers 1 2 3 4 5 6 7 8 9 10 DK 19 Level of competency of ambulance officers 1 2 3 4 5 6 7 8 9 10 DK 20 Probability of MAS officers keeping me alive until
I reached a hospital 1 2 3 4 5 6 7 8 9 10 DK 21 Availability of an ambulance at all times 1 2 3 4 5 6 7 8 9 10 DK 22 Response time of ambulance to an emergency 1 2 3 4 5 6 7 8 9 10 DK 23 Speed of admittance to hospital 1 2 3 4 5 6 7 8 9 10 DK 24 Public perception of MAS 1 2 3 4 5 6 7 8 9 10 DK 25 Media image of MAS 1 2 3 4 5 6 7 8 9 10 DK
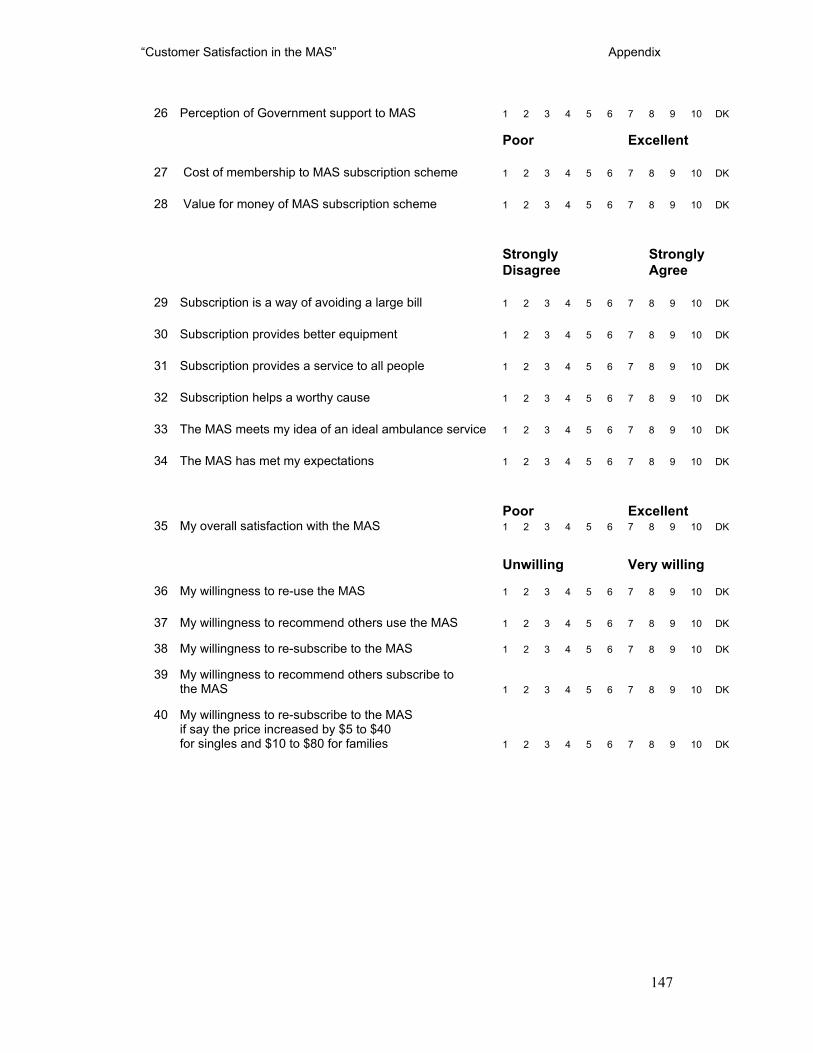
“Customer Satisfaction in the MAS” Appendix
147
26 Perception of Government support to MAS 1 2 3 4 5 6 7 8 9 10 DK
Poor Excellent 27 Cost of membership to MAS subscription scheme 1 2 3 4 5 6 7 8 9 10 DK 28 Value for money of MAS subscription scheme 1 2 3 4 5 6 7 8 9 10 DK
Strongly Strongly Disagree Agree
29 Subscription is a way of avoiding a large bill 1 2 3 4 5 6 7 8 9 10 DK 30 Subscription provides better equipment 1 2 3 4 5 6 7 8 9 10 DK 31 Subscription provides a service to all people 1 2 3 4 5 6 7 8 9 10 DK 32 Subscription helps a worthy cause 1 2 3 4 5 6 7 8 9 10 DK
33 The MAS meets my idea of an ideal ambulance service 1 2 3 4 5 6 7 8 9 10 DK
34 The MAS has met my expectations 1 2 3 4 5 6 7 8 9 10 DK
Poor Excellent
35 My overall satisfaction with the MAS 1 2 3 4 5 6 7 8 9 10 DK
Unwilling Very willing 36 My willingness to re-use the MAS 1 2 3 4 5 6 7 8 9 10 DK 37 My willingness to recommend others use the MAS 1 2 3 4 5 6 7 8 9 10 DK 38 My willingness to re-subscribe to the MAS 1 2 3 4 5 6 7 8 9 10 DK
39 My willingness to recommend others subscribe to the MAS 1 2 3 4 5 6 7 8 9 10 DK 40 My willingness to re-subscribe to the MAS if say the price increased by $5 to $40 for singles and $10 to $80 for families 1 2 3 4 5 6 7 8 9 10 DK
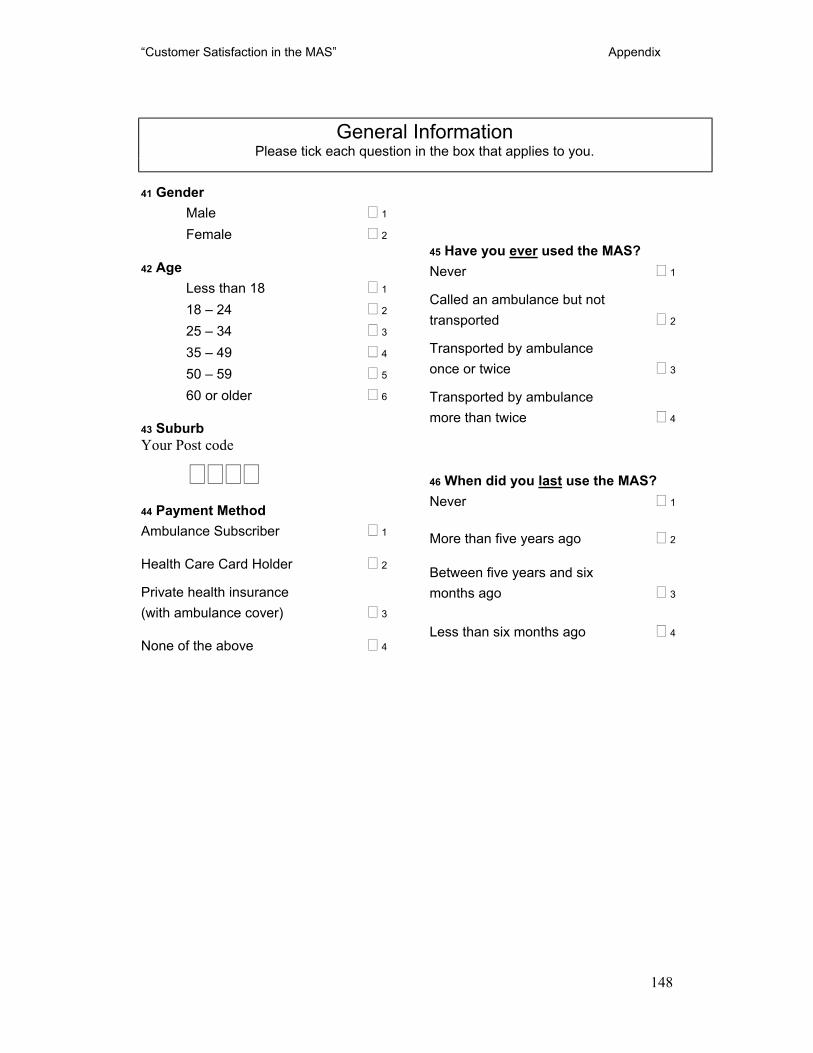
“Customer Satisfaction in the MAS” Appendix
148
General Information Please tick each question in the box that applies to you.
41 Gender Male 1 Female 2 42 Age
Less than 18 1 18 – 24 2 25 – 34 3 35 – 49 4 50 – 59 5 60 or older 6
43 Suburb Your Post code
44 Payment Method Ambulance Subscriber 1
Health Care Card Holder 2 Private health insurance (with ambulance cover) 3
None of the above 4
45 Have you ever used the MAS? Never 1 Called an ambulance but not transported 2 Transported by ambulance once or twice 3 Transported by ambulance more than twice 4
46 When did you last use the MAS? Never 1 More than five years ago 2
Between five years and six months ago 3
Less than six months ago 4
“Customer Satisfaction in the MAS” Appendix
149
Are there any other comments you would like to make?
______________________________________________________________________ ______________________________________________________________________ ______________________________________________________________________ ______________________________________________________________________ ______________________________________________________________________ ______________________________________________________________________ ______________________________________________________________________ ______________________________________________________________________ ______________________________________________________________________ ______________________________________________________________________ ______________________________________________________________________ ______________________________________________________________________ ______________________________________________________________________ ______________________________________________________________________ ______________________________________________________________________ ______________________________________________________________________ ______________________________________________________________________ ______________________________________________________________________ ______________________________________________________________________ ______________________________________________________________________ ______________________________________________________________________ ______________________________________________________________________ Thank you for completing this survey.
Please return the form as soon as possible.
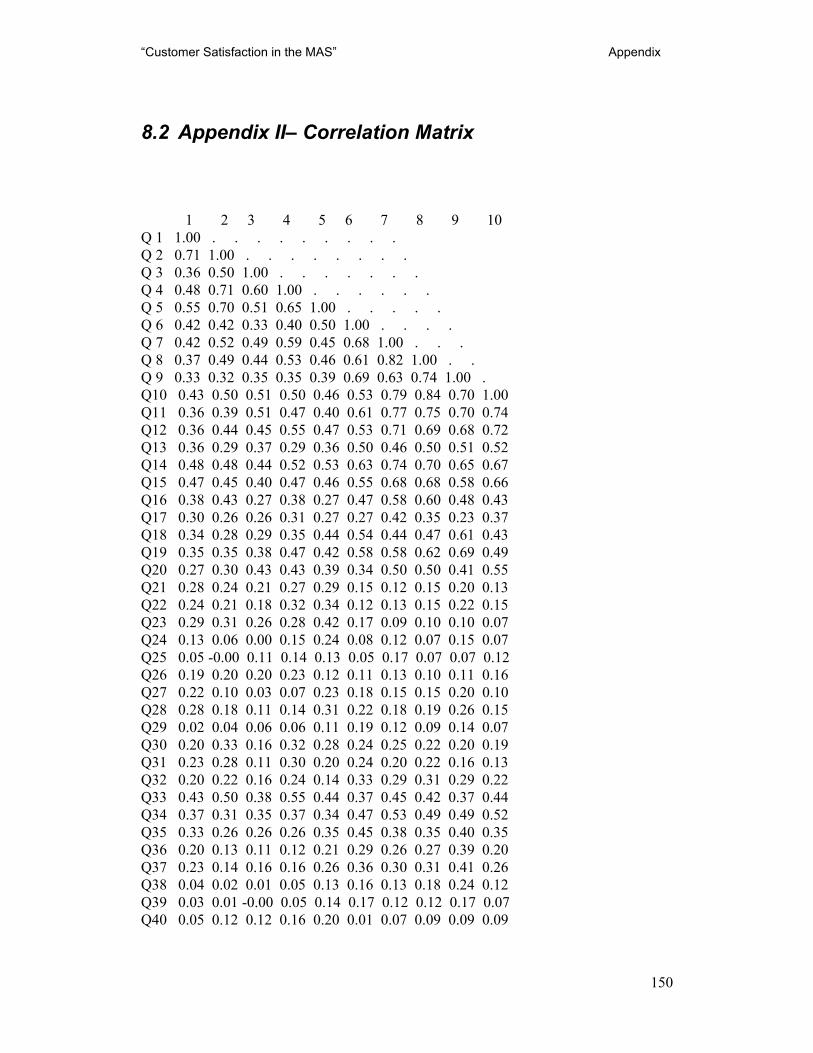
“Customer Satisfaction in the MAS” Appendix
150
8.2 Appendix II– Correlation Matrix
1 2 3 4 5 6 7 8 9 10 Q 1 1.00 . . . . . . . . . Q 2 0.71 1.00 . . . . . . . . Q 3 0.36 0.50 1.00 . . . . . . . Q 4 0.48 0.71 0.60 1.00 . . . . . . Q 5 0.55 0.70 0.51 0.65 1.00 . . . . . Q 6 0.42 0.42 0.33 0.40 0.50 1.00 . . . . Q 7 0.42 0.52 0.49 0.59 0.45 0.68 1.00 . . . Q 8 0.37 0.49 0.44 0.53 0.46 0.61 0.82 1.00 . . Q 9 0.33 0.32 0.35 0.35 0.39 0.69 0.63 0.74 1.00 . Q10 0.43 0.50 0.51 0.50 0.46 0.53 0.79 0.84 0.70 1.00 Q11 0.36 0.39 0.51 0.47 0.40 0.61 0.77 0.75 0.70 0.74 Q12 0.36 0.44 0.45 0.55 0.47 0.53 0.71 0.69 0.68 0.72 Q13 0.36 0.29 0.37 0.29 0.36 0.50 0.46 0.50 0.51 0.52 Q14 0.48 0.48 0.44 0.52 0.53 0.63 0.74 0.70 0.65 0.67 Q15 0.47 0.45 0.40 0.47 0.46 0.55 0.68 0.68 0.58 0.66 Q16 0.38 0.43 0.27 0.38 0.27 0.47 0.58 0.60 0.48 0.43 Q17 0.30 0.26 0.26 0.31 0.27 0.27 0.42 0.35 0.23 0.37 Q18 0.34 0.28 0.29 0.35 0.44 0.54 0.44 0.47 0.61 0.43 Q19 0.35 0.35 0.38 0.47 0.42 0.58 0.58 0.62 0.69 0.49 Q20 0.27 0.30 0.43 0.43 0.39 0.34 0.50 0.50 0.41 0.55 Q21 0.28 0.24 0.21 0.27 0.29 0.15 0.12 0.15 0.20 0.13 Q22 0.24 0.21 0.18 0.32 0.34 0.12 0.13 0.15 0.22 0.15 Q23 0.29 0.31 0.26 0.28 0.42 0.17 0.09 0.10 0.10 0.07 Q24 0.13 0.06 0.00 0.15 0.24 0.08 0.12 0.07 0.15 0.07 Q25 0.05 -0.00 0.11 0.14 0.13 0.05 0.17 0.07 0.07 0.12 Q26 0.19 0.20 0.20 0.23 0.12 0.11 0.13 0.10 0.11 0.16 Q27 0.22 0.10 0.03 0.07 0.23 0.18 0.15 0.15 0.20 0.10 Q28 0.28 0.18 0.11 0.14 0.31 0.22 0.18 0.19 0.26 0.15 Q29 0.02 0.04 0.06 0.06 0.11 0.19 0.12 0.09 0.14 0.07 Q30 0.20 0.33 0.16 0.32 0.28 0.24 0.25 0.22 0.20 0.19 Q31 0.23 0.28 0.11 0.30 0.20 0.24 0.20 0.22 0.16 0.13 Q32 0.20 0.22 0.16 0.24 0.14 0.33 0.29 0.31 0.29 0.22 Q33 0.43 0.50 0.38 0.55 0.44 0.37 0.45 0.42 0.37 0.44 Q34 0.37 0.31 0.35 0.37 0.34 0.47 0.53 0.49 0.49 0.52 Q35 0.33 0.26 0.26 0.26 0.35 0.45 0.38 0.35 0.40 0.35 Q36 0.20 0.13 0.11 0.12 0.21 0.29 0.26 0.27 0.39 0.20 Q37 0.23 0.14 0.16 0.16 0.26 0.36 0.30 0.31 0.41 0.26 Q38 0.04 0.02 0.01 0.05 0.13 0.16 0.13 0.18 0.24 0.12 Q39 0.03 0.01 -0.00 0.05 0.14 0.17 0.12 0.12 0.17 0.07 Q40 0.05 0.12 0.12 0.16 0.20 0.01 0.07 0.09 0.09 0.09
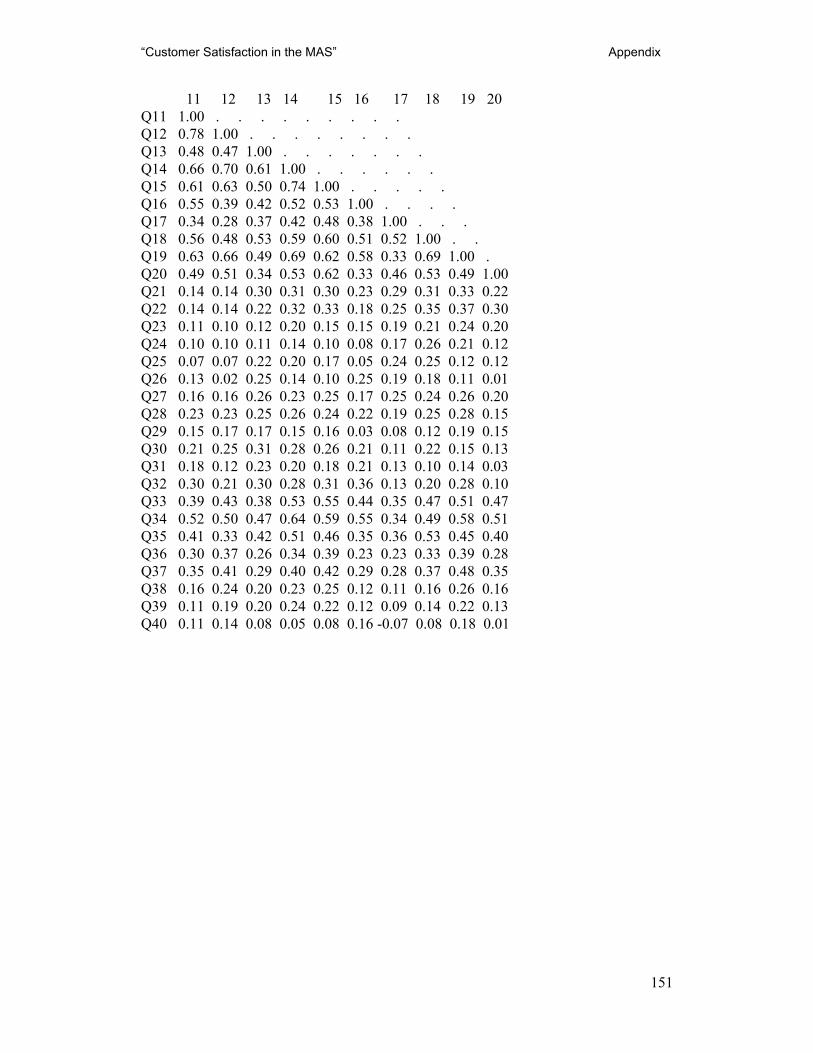
“Customer Satisfaction in the MAS” Appendix
151
11 12 13 14 15 16 17 18 19 20 Q11 1.00 . . . . . . . . . Q12 0.78 1.00 . . . . . . . . Q13 0.48 0.47 1.00 . . . . . . . Q14 0.66 0.70 0.61 1.00 . . . . . . Q15 0.61 0.63 0.50 0.74 1.00 . . . . . Q16 0.55 0.39 0.42 0.52 0.53 1.00 . . . . Q17 0.34 0.28 0.37 0.42 0.48 0.38 1.00 . . . Q18 0.56 0.48 0.53 0.59 0.60 0.51 0.52 1.00 . . Q19 0.63 0.66 0.49 0.69 0.62 0.58 0.33 0.69 1.00 . Q20 0.49 0.51 0.34 0.53 0.62 0.33 0.46 0.53 0.49 1.00 Q21 0.14 0.14 0.30 0.31 0.30 0.23 0.29 0.31 0.33 0.22 Q22 0.14 0.14 0.22 0.32 0.33 0.18 0.25 0.35 0.37 0.30 Q23 0.11 0.10 0.12 0.20 0.15 0.15 0.19 0.21 0.24 0.20 Q24 0.10 0.10 0.11 0.14 0.10 0.08 0.17 0.26 0.21 0.12 Q25 0.07 0.07 0.22 0.20 0.17 0.05 0.24 0.25 0.12 0.12 Q26 0.13 0.02 0.25 0.14 0.10 0.25 0.19 0.18 0.11 0.01 Q27 0.16 0.16 0.26 0.23 0.25 0.17 0.25 0.24 0.26 0.20 Q28 0.23 0.23 0.25 0.26 0.24 0.22 0.19 0.25 0.28 0.15 Q29 0.15 0.17 0.17 0.15 0.16 0.03 0.08 0.12 0.19 0.15 Q30 0.21 0.25 0.31 0.28 0.26 0.21 0.11 0.22 0.15 0.13 Q31 0.18 0.12 0.23 0.20 0.18 0.21 0.13 0.10 0.14 0.03 Q32 0.30 0.21 0.30 0.28 0.31 0.36 0.13 0.20 0.28 0.10 Q33 0.39 0.43 0.38 0.53 0.55 0.44 0.35 0.47 0.51 0.47 Q34 0.52 0.50 0.47 0.64 0.59 0.55 0.34 0.49 0.58 0.51 Q35 0.41 0.33 0.42 0.51 0.46 0.35 0.36 0.53 0.45 0.40 Q36 0.30 0.37 0.26 0.34 0.39 0.23 0.23 0.33 0.39 0.28 Q37 0.35 0.41 0.29 0.40 0.42 0.29 0.28 0.37 0.48 0.35 Q38 0.16 0.24 0.20 0.23 0.25 0.12 0.11 0.16 0.26 0.16 Q39 0.11 0.19 0.20 0.24 0.22 0.12 0.09 0.14 0.22 0.13 Q40 0.11 0.14 0.08 0.05 0.08 0.16 -0.07 0.08 0.18 0.01
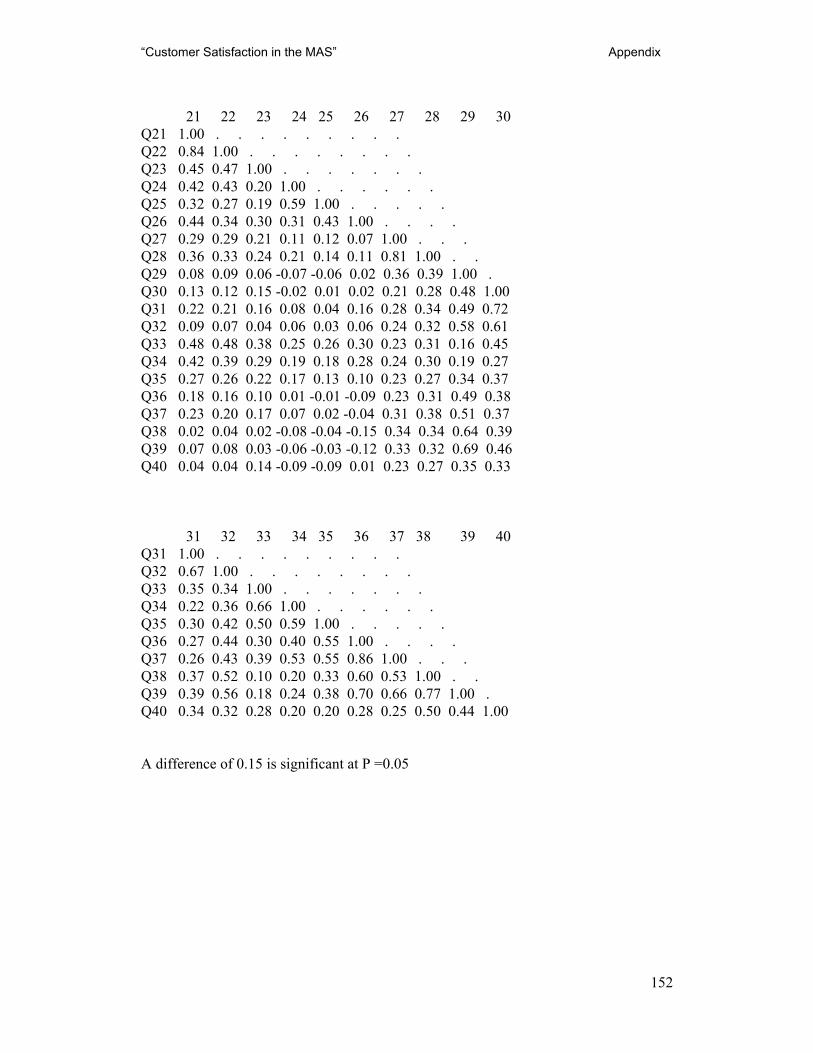
“Customer Satisfaction in the MAS” Appendix
152
21 22 23 24 25 26 27 28 29 30
Q21 1.00 . . . . . . . . . Q22 0.84 1.00 . . . . . . . . Q23 0.45 0.47 1.00 . . . . . . . Q24 0.42 0.43 0.20 1.00 . . . . . . Q25 0.32 0.27 0.19 0.59 1.00 . . . . . Q26 0.44 0.34 0.30 0.31 0.43 1.00 . . . . Q27 0.29 0.29 0.21 0.11 0.12 0.07 1.00 . . . Q28 0.36 0.33 0.24 0.21 0.14 0.11 0.81 1.00 . . Q29 0.08 0.09 0.06 -0.07 -0.06 0.02 0.36 0.39 1.00 . Q30 0.13 0.12 0.15 -0.02 0.01 0.02 0.21 0.28 0.48 1.00 Q31 0.22 0.21 0.16 0.08 0.04 0.16 0.28 0.34 0.49 0.72 Q32 0.09 0.07 0.04 0.06 0.03 0.06 0.24 0.32 0.58 0.61 Q33 0.48 0.48 0.38 0.25 0.26 0.30 0.23 0.31 0.16 0.45 Q34 0.42 0.39 0.29 0.19 0.18 0.28 0.24 0.30 0.19 0.27 Q35 0.27 0.26 0.22 0.17 0.13 0.10 0.23 0.27 0.34 0.37 Q36 0.18 0.16 0.10 0.01 -0.01 -0.09 0.23 0.31 0.49 0.38 Q37 0.23 0.20 0.17 0.07 0.02 -0.04 0.31 0.38 0.51 0.37 Q38 0.02 0.04 0.02 -0.08 -0.04 -0.15 0.34 0.34 0.64 0.39 Q39 0.07 0.08 0.03 -0.06 -0.03 -0.12 0.33 0.32 0.69 0.46 Q40 0.04 0.04 0.14 -0.09 -0.09 0.01 0.23 0.27 0.35 0.33
31 32 33 34 35 36 37 38 39 40 Q31 1.00 . . . . . . . . . Q32 0.67 1.00 . . . . . . . . Q33 0.35 0.34 1.00 . . . . . . . Q34 0.22 0.36 0.66 1.00 . . . . . . Q35 0.30 0.42 0.50 0.59 1.00 . . . . . Q36 0.27 0.44 0.30 0.40 0.55 1.00 . . . . Q37 0.26 0.43 0.39 0.53 0.55 0.86 1.00 . . . Q38 0.37 0.52 0.10 0.20 0.33 0.60 0.53 1.00 . . Q39 0.39 0.56 0.18 0.24 0.38 0.70 0.66 0.77 1.00 . Q40 0.34 0.32 0.28 0.20 0.20 0.28 0.25 0.50 0.44 1.00 A difference of 0.15 is significant at P =0.05