Embed Size (px)
Citation preview

Customer satisfaction and managerial sales recommendations for B2B high-
involvement products: the case of business aircraft
par
Jophrey Grégoire
sous la supervision de
M. Sylvain Audette
Sciences de la gestion
(Option Marketing)
Mémoire présenté en vue de l’obtention
du grade de maîtrise ès sciences
(M. Sc.)
Juillet 2019
© Jophrey Grégoire, 2019

ii

iii

iv

v
Executive Summary
Due to a need to deepen academic knowledge pertaining to customer satisfaction
and personal selling in business-to-business (B2B) environments, and the existence of
important gaps between B2B theory and practice, this research attempted to provide a
comprehensive outlook of customers’ overall satisfaction for B2B high-involvement
products by focusing on the global business aircraft industry. To this end, a conceptual
model inspired from Spreng, MacKenzie & Olshavsky (1996) was conceived and
incorporated one dependent, and six independent variables. More precisely, pre-purchase
desires and expectations, desires and expectations congruency, and post-purchase product
attributes and information satisfaction acted as independent variables. On the other hand,
overall customer satisfaction for B2B high-involvement products, in this case business
aircraft, figured as the dependent variable. Six main research hypotheses were then
formulated and tested using elaborate statistical analyses, in order to generate ten
managerial sales recommendations aimed at improving not only business aircraft
manufacturers and operators’ sales performance, but also their customers’ overall level of
satisfaction.
A questionnaire was sent electronically to worldwide business aircraft owners, and
stakeholders identified as currently playing or having played an active role in the
purchasing process of a business aircraft on the customer’s end. For clarification purposes,
all stakeholders and business aircraft owners aimed by this research were either evolving
within the global business aircraft/aerospace industry or not. In fact, some were identified
as working in different fields, such as legal, finance, consultancy, flight operations, aircraft
maintenance, engineering, external sales representatives, and various other ones.
As a result, 387 participants responded to this survey and allowed our research team
to determine that business aircraft do confer an enhanced level of convenience and flight
experience to their owners, but not any social status or prestige. Product attributes’
satisfaction involving attributes related to luxury & comfort, performance and service was
also found to have the most influence onto customers’ overall satisfaction, comparatively
to information satisfaction. Furthermore, personal selling quality was identified as having
a beneficial impact onto customers pre-purchase desires’ degree of fulfilment.

vi
The conceptual model conceived for this research turned out to be appropriate for
the testing of several hypotheses, but not all of them. Indeed, the one regarding the direct
relationship between pre-purchase expectations and post-purchase expectations
congruency remains invalidated. The fact that such model was inspired from one originally
used in a business-to-consumer (B2C) environment may partly explain this occurrence. As
such, this also indicates that it would require specific adjustments prior to being used again
in future B2B researches.
With an average overall satisfaction level of 56,3%, participants were particularly
dissatisfied regarding service-related attributes and the personal selling quality
encountered during the purchasing process of their aircraft. More precisely, 105 business
aircraft owners demonstrated an average satisfaction level of 54,9%, compared to 56,9%
for all 139 stakeholders who participated to this study. Convenience, performance
attributes, and perceived value were also identified as the most influential satisfaction
determinants in customers’ purchase decision with respective influence degrees of 85,8%,
83%, and 82%. Therefore, an aircraft’s performance, ability to buy time and save money
constitute the most important aspects that customers consider, when acquiring a business
aircraft. Lastly, ten managerial sales recommendations encompassing aspects such as
product information, customer approach, salespeople attitude, external stakeholders’
involvement, salesforce education, ongoing support, and durable business relationships
were generated.
Several of this research’s limitations were then examined, including the fact that
overall satisfaction was not measured using Likert scale, and future research perspectives
were also explored. These ones brought forth either new or complementary methodologies
to this research, and emphasized the importance of conducting researches that may be
beneficial to the global business aircraft industry, such as examining and comparing
customer satisfaction pertaining to different types of B2B high-involvement products like
luxury yachts, automobiles, and helicopters.
Keywords: Business aircraft; B2B sales; customer satisfaction; high-involvement
products; sales performance; personal selling; managerial sales recommendations

vii

viii
Table of Contents
Executive summary…………………………………………………………………………………….………...v
Table of contents…………………………………………………………………………………………….....viii
List of tables………………………………………………………………………………………....…………...xi
List of figures…………………………………………………………………………………………………….xi
Acknowledgements…………………………………………………………...…………………………………xii
Introduction……………………………………………………………………………………………..………..1
Chapter 1: Literature review……………………………………………………………………………………3
1.1 Consumer satisfaction…………………………....……………………………………………………...3
1.2 High-involvement products…………………………………………………………………………..…5
1.3 Determinants of consumer satisfaction………………………………………………………………….7
1.4 Conceptual models examined………………………………………………………………………...…8
1.4.1 Disconfirmation of expectations paradigm………………………………………………………8
1.4.2 Perceived performance and product attributes………………………………………………….10
1.4.3 The effect of disconfirmation…………………………………………………………………...12
1.4.4 Price and quality………………………………………………………………………...………13
1.4.5 Sales force satisfaction and price equity………………………………………………………..14
1.4.6 Expectations vs. desires…………………………………………………………………………15
1.4.7 Product attributes satisfaction and information satisfaction…………………………………….17
1.4.8 Expectations and desires congruency…………………………………………………………...18
1.5 Assessed dependent and independent variables………………………………………………………..19
1.5.1 Dependent variable: overall satisfaction for B2B high-involvement products………………….19
1.5.2 Independent variables…………………………………………………………………………...20
1.5.3 Desires……………………………………………………………………………...…………...20
1.5.3.1 Social status and prestige……………………………………………………………….21
1.5.3.2 Convenience…………………………………………………………………...……….25
1.5.3.3 Experience……………………………………………………………………………...27
1.5.4 Expectations…………………………………………………………………………………….29
1.5.4.1 Experience and service quality…………………………………………………………30
1.5.4.2 Product performance……………………………………………………………………35
1.5.4.3 Perceived value and premium…………………………………………………………..37
1.5.5 Product attributes satisfaction…………………………………………………………………...40
1.5.6 Information satisfaction…………………………………………………………………………42
1.5.6.1 Personal selling…………………………………………………………………………42
1.5.6.2 Word-of-mouth satisfaction…………………………………………………………….47
1.5.6.3 External experts’ involvement………………………………………………………….50
1.6 Conclusion……………………………………………………………………………………………..52
Chapter 2: The conceptual model and research hypotheses…………………………………………………56
2.1 The research’s problematic, objectives, and questions………………………………………………...57
2.1.1 The research’s problematic……………………………………………………………………...57
2.1.2 The research’s objectives……………………………………………………………………….58
2.1.3 The research’s questions………………………………………………………………………..60
2.2 The research’s conceptual model and hypotheses……………………………………………………..61
2.2.1 The research’s conceptual model……………………………………………………………….62
ix
2.2.2 The research’s hypotheses………………………………………………………………………64
2.3 Conclusion……………………………………………………………………………………………….68
Chapter 3: The Research’s Methodology……………………………………………………………………...71
3.1 The data collection method……………………………………………………………………………...71
3.1.1 The cross-sectional data collection method defined…………………………………………….72
3.1.1.1 The population and sample…………………………………………………………...72
3.1.1.2 Qualitative pre-survey sample…………………………………………………..........73
3.1.1.3 Quantitative data collection sample…………………………………………………..73
3.1.2 The questionnaire……………………………………………………………………………….74
3.1.3 The questionnaire’s pretest……………………………………………………………………...78
3.1.4 The questionnaire’s distribution………………………………………………………………...79
3.1.5 Cleaning and validating the dataset……………………………………………………………..81
3.1.5.1 Cleaning the dataset…………………………………………………………………..81
3.1.5.2 Validating the dataset…………………………………………………………………82
3.1.6 Selecting the appropriate modelling methods…………………………………………………..88
3.1.6.1 Measuring the dependent variable……………………………………………............88
3.1.6.2 Testing the research hypotheses………………………………………………………89
3.1.6.3 Analyzing section seven measurement instruments…………………………..............89
3.2 The selected measurement instruments………………………………………………………………….90
3.2.1 Pre-purchase desires’ measurement instruments………………………………………………..91
3.2.2 Pre-purchase expectations’ measurement instruments…………………………………………..91
3.2.3 Post-purchase product attributes’ satisfaction measurement instruments……………………….92
3.2.4 Post-purchase information satisfaction measurement instruments………………………………93
3.2.5 Desires’ and expectations’ congruency measurement instruments……………………………...96
3.2.6 Section seven measurement instruments………………………………………………………...97
3.3 Conclusion……………………………………………………………………………………………...100
Chapter 4: The results………………………………………………………………………………………...103
4.1 The adapted research conceptual model……………………………………………………………......103
4.2 Hypotheses’ tests and dependent variable analysis…………………………………………………….104
4.2.1 Testing the research hypotheses……………………………………………………………….104
4.2.2 Dependent variable analysis…………………………………………………………………...114
4.2.3 Individual satisfaction components analysis…………………………………………………..115
4.3 Section seven measurement instruments’ results………………………………………………………117
4.3.1 Frequency analysis of the dichotomous question……………………………………………...118
4.3.2 Satisfaction subconstructs’ weighted influence………………………………………………..118
4.3.3 Open-ended questions’ analysis and results…………………………………………………...122
4.4 Conclusion……………………………………………………………………………………………...126
Chapter 5: Managerial Recommendations, Discussion, Limitations & Future Research Perspectives…128
5.1 Managerial Sales Recommendations…………………………………………………………………...128
5.2 The Discussion…………………………………………………………………………………………130
5.2.1 Answers to the research’s objectives and questions…………………………………………...130
5.2.2 Discussion of the problematic, theoretical framework and conceptual model………………...135
5.3 The Limitations………………………………………………………………………………………...137
5.4 Future Research Perspectives………………………………………………………………………......139
5.5 Conclusion……………………………………………………………………………………………...140

x
General Conclusion……………………………………………………………………………………………141
References……………………………………………………………………………………………………...143
Annexes………………………………………………………………………………………………………...161
Annex 1: The final questionnaire………………………………………………………………………….161
Annex 2: Screenshots of the SPSS dimension reduction analysis’ results………………………………...180
Annex 3: Internal reliability of the personal selling subconstruct…………………………………………187
Annex 4: Screenshots of the SPSS reliability analysis’ results……………………………………………188
Annex 5: Screenshot of responses’ codification from open-ended question #1…………………………...191
Annex 6: Screenshots of the SPSS logistic regression analysis’ results…………………………………..192
Annex 7: Screenshot of the SPSS linear regression analysis’ results……………………………………...194
Annex 8: Screenshots of the SPSS research hypotheses test results………………………………………195
Annex 9: Screenshot of the SPSS overall satisfaction results analysis……………………………………200
Annex 10: SPSS screenshot of satisfaction results per category of respondent…………………………...200
Annex 11: SPSS screenshots of the individual components’ satisfaction results analysis………………..200
Annex 12: SPSS screenshot of the satisfaction & importance descriptive analysis……………………….201
Annex 13: SPSS screenshot of the dichotomous question frequency analysis……………………………202
Annex 14: SPSS screenshot of the rank-order questions’ frequency analysis…………………………….202
Annex 15: SPSS screenshots of the codification frequency analysis (1st Question)………………………203
Annex 16: SPSS screenshots of the codification frequency analysis (2nd Question)……………………...205
Annex 17: SPSS screenshot of the subconstructs’ importance level descriptive analysis………………...206
Annex 18: Alternate methods considered to measure the dependent variable…………………………….207
Annex 19: Correlation matrix and descriptive statistics…………………………………………………...209

xi
List of Tables
Table 1: Concept Definitions Recap Table…………………………………………………….52
Table 2: Recap Table of the Research’s Hypotheses………………………………………….68
Table 3: Questionnaire Distribution Recap Table…………………………………………….82
Table 4: Dimension Reduction Analysis Results………………………………………………83
Table 5: Internal Reliability Analysis Results…………………………………………………86
Table 6: Pre-Purchase Desires’ Likert Scales…………………………………………………91
Table 7: Pre-Purchase Expectations’ Likert Scales…………………………………………...92
Table 8: Post-Purchase Product Attributes’ Satisfaction Likert Scales……………………..93
Table 9: Personal Selling Satisfaction Likert Scales…………………………………………..94
Table 10: Word-of-Mouth Satisfaction Likert Scales..………………………………………..95
Table 11: External Experts’ Satisfaction Likert Scales……………………………………….96
Table 12: Desires’ and Expectations’ Congruency Likert Scales…………………………….97
Table 13: Research Hypotheses Test Results………………………………………………...106
Table 14: Overall Satisfaction Results………………………………………………………..114
Table 15: Overall Satisfaction per Category of Respondent………………………………..115
Table 16: Individual Components Satisfaction/Importance Results……………………….116
Table 17: Subconstructs’ Satisfaction and Importance Results…………………………….117
Table 18: Dichotomous Question Frequency Analysis’ Results…………………………….118
Table 19: Rank-order Questions’ Frequency Analyses’ Results……………………………119
Table 20: Subconstructs’ Weighted Influence onto Overall Satisfaction…………………..120
Table 21: Open-ended #1 – Codification Frequency Analysis’ Results…………………….122
Table 22: Open-ended #2 – Codification Frequency Analysis’ Results…………………….124
Table 23: Satisfaction Determinants’ Level of Influence……………………………………133
List of Figures
Figure 1: Patterson, Johnson & Spreng (1997) Conceptual Model…………………………..11
Figure 2: Patterson (1993) Conceptual Model………………………………………………...11
Figure 3: Voss, Parasuraman & Grewal (1998) Conceptual Model…………………………12
Figure 4: Madaleno, Wilson & Palmer (2007) Conceptual Model…………………………...13
Figure 5: Spreng, Mackenzie & Olshavsky (1996) Conceptual Model………………………16
Figure 6: Brady and Cronin (2001) Service Quality Literature Conceptualizations……….33
Figure 7: The Research’s Conceptual Model………………………………………………….63
Figure 8: The Seven-Point Likert Scale………………………………………………………..76
Figure 9: The Adapted Research Conceptual Model………………………………………..104

xii
Acknowledgements
This research is not only the fruit of many long hours of research and hard work,
but also the evidence that many people provided me with an incredible amount of support
and encouragement throughout the duration of my master’s degree. More specifically, I
would first like to thank my big brother Yany, who always made himself available
whenever I needed his help and advice. Walking in your footsteps was definitely more than
an enriching experience, it was also an honour. You are the one who first inspired me to
complete a master’s degree, and I sincerely hope this research will bring you some pride
and joy.
Such an achievement would also not have been possible without the constant
support and dedication of both my parents. Thanks mom and dad for always being there to
help me push my limits. My research director, M. Sylvain Audette, also played a key role
in the accomplishment of this study. I could not have asked for a better coach, whose
patience and knowledge helped me bring the “Cup” back home; And finally, here it is.
Thanks coach. Furthermore, thank you to M. Jean-Luc Geha, Director of HEC Montréal
Sales Institute, who expressed much interest and support in regards to this research and its
results.
I would also like to thank everyone who contributed in a way or another to the
accomplishment of this research project. To all my friends and professors, hats off to you,
and thank you for providing me with not only the right tools, but also the inspiration to
attempt and conclude this project.
My sincere gratitude also goes to the global business aircraft manufacturer, its
employees, and all respondents who kindly accepted to participate and make this research
possible. Lastly, but not least, thank you ladies and gentlemen of the jury for taking the
time to read and comment on this research; thus, allowing it to become even more
impactful for its readers.

xiii

1
Introduction
Multiple researchers have argued in the last few years that there exists an important
gap between business-to-business (B2B) theory and practice (Gummeson, 2013; Ruiz,
Kowalkowski, 2014; LaPlaca, da Silva, 2016). While much research and many case studies
have already been conducted in a business-to-consumer (B2C) environment, much less
attention has been devoted to a B2B context. There is still an important need to deepen
academic knowledge and create novel perspectives on various non-economic factors, such
as feelings, emotions, trust, consumer satisfaction, and purchase motivations related to or
involved in organizational purchasing (LaPlaca and da Silva, 2016).
One of these factors mentioned by LaPlaca and da Silva (2016), more precisely
consumer satisfaction, can be regarded as the ultimate objective a company aims for when
designing and selling a product. It has come to be regarded as the foundation for many
companies operating in various markets (Szymanski and Henard, 2001). In a B2B context,
such factor has the ability to influence customers repurchase decision, word-of-mouth
behavioural intentions, quality of future business relationships, and the level of loyalty
towards manufacturers (Molinari, Abratt and Dion, 2008; Gil-Saura, Frasquet-Deltoro and
Cervera-Taulet, 2009). Furthermore, and according to Molinari, Abratt and Dion (2008):
“research in satisfaction in B2B markets is lagging behind consumer marketing” (p. 364).
In this line of thought, and for the purpose of this research, the following literature
review will attempt to analyze, interpret, and compare various academic articles and studies
that were conducted to deepen knowledge pertaining to the influential determinants of B2B
consumers’ satisfaction, after organizational purchasing. Such literature review will focus
on defining the concepts that will be studied in this research. Specifically, the current
research examines multiple existing conceptual models from the fields of B2B and B2C
consumer satisfaction, along with the variables that compose them, explores academic
articles and studies that can enhance academic knowledge pertaining to each of these
variables, and lastly assesses existing methods to measure overall consumer satisfaction in
a B2B context. This extensive literature review shall pave the way towards a
methodological data-gathering process that will be conducted within the global business
aircraft industry.

2
Based on such review, this study will be based on a conceptual model adapted from
a pre-existing one conceived by Spreng, MacKenzie & Olshavsky (1996) that is depicted
and tested in their Journal of Marketing article entitled: “A re-examination of the
determinants of consumer satisfaction.” An explanation pertaining as to why this specific
model was selected, and the role of each of its variables will be provided, by examining
supporting academic articles originating from various fields of study related to each one of
these variables. Research hypotheses will then be formulated and tested, in order to identify
the role and influence of specific B2B consumer satisfaction determinants used in this
model. Data acquired mainly through quantitative, but also qualitative methods shall also
be statistically and methodologically analyzed. Finally, all obtained results will be
interpreted, discussed and used, in order to formulate diverse marketing and sales
managerial recommendations for business aircraft manufacturers and operators. Such
recommendations shall aim to improve manufacturers and operators’ sales performance,
along with improving their customers’ overall level of satisfaction.
Lastly, the principal limitations of this research will be discussed, along with some
future research opportunities directly related to the results obtained and the examined fields
of study.

3
Chapter 1: Literature Review
This first chapter aims to introduce every concept that will be addressed throughout
this research. Furthermore, this literature review has for objective to bring forth previous
academic research that introduced similar ideas and theories, in order to identify existing
gaps in a B2B context. Finally, the following pages shall also help the reader to better
understand the theoretical concepts that support and motivate the completion of this
research. Due to the scarcity of B2B researches, it must be noted that this review mostly
covers academic researches executed in a B2C context.
The first section shall define the concept of consumer satisfaction, and introduce
the determinants that compose and influence it. The concept of high-involvement product
shall then be defined, along with any additional concepts that may support it. The third
section shall introduce and define various concepts that compose, influence and act as
determinants of consumer satisfaction. Finally, various conceptual models issued from
prior academic research and that played a key role in the conception of this research’s
model will then be examined and interpreted.
1.1 Consumer Satisfaction
In order to identify which determinants compose and influence consumer
satisfaction for high-involvement products in a B2B context, it is imperative to
preemptively define such concept, as it represents the principal outcome of this research’s
conceptual model. As noted by Giese and Cote (2000): “[…] researchers have yet to
develop a consensual definition of consumer satisfaction” (p. 1). Yi (1990) also
demonstrates that it is equally unclear whether or not satisfaction is defined as an evaluative
process, or the outcome of an evaluative process (Giese and Cote, 2000). Most researchers
also argue about the nature of the consumer satisfaction concept. Some of them, such as
Bolton and Drew (1991) or Tse and Wilton (1988), portray it as a cognitive response, while
others like Halstead, Hartman, and Schmidt (1994) or Westbrook and Reilly (1983) argue
it is actually an affective response. Many differences also exist regarding the terms used
to designate this concept (Giese and Cote, 2000).
However, the literature reviewed, especially in a B2C context, shares some common
elements. More precisely, three components of consumer satisfaction seem to be recurrent
and apply to this concept, regardless of the authors, researchers or articles that attempt to
4
deepen academic knowledge related to this field of study. The first component regards the
fact that consumer satisfaction is an affective response that occurs following a particular
business-related occurrence such as a transaction, consumption experience, or a specific
product usage. This response can vary in intensity, depending on the type of situation in
which it occurs, and this intensity refers to the satisfaction’s response strength. The
response strength will always vary, according to a scale composed by a multitude of terms
ranging from “weak” to “strong” (Giese and Cote, 2000).
The second component of this concept was mentioned above, as it regards the type
of business-related occurrence after which it takes place. Giese and Cote (2000) describes
this business-related occurrence as a “focus,” and it serves to identify “the object of a
consumer’s satisfaction” (p. 2). During this second component, the consumer will compare
either the performance of the product or the experience of the service he purchased to some
previously established standards. These standards may be used to compare one or multiple
aspects of the focus, such as for example the product in its entirety, the consumption
experience, the salesperson involved in the transaction or even the store at which the
product or service was purchased (Giese and Cote, 2000). The clarity of this component is
crucial to the concept of consumer satisfaction as it allows the avoidance of any
“chameleon effects.”
Marsh and Yeung (1999) describe “chameleon effects” as a change of the
satisfaction constructs by the context in which they appear and maintain that they represent
an important problem in the field of satisfaction research. It is therefore imperative that
researchers take the time to precisely define the meaning of consumer satisfaction to the
participants of their studies, prior to beginning any experiments or data-gathering
processes.
Finally, the third component of consumer satisfaction relates to the timing at which
it takes place. The literature tends to agree that this concept takes place after the purchase
of a product or service, but also points out that it can take place at many other time frames,
due to the fact that satisfaction varies greatly over time and that it will eventually take place
when the evaluation of such product or service happens (Giese and Cote, 2000).
Furthermore, no agreement seems to have been reached in regards to the duration of this
concept, which consists in how long a specific satisfaction response lasts (Bolton and
5
Drew, 1991; Halstead, Hartman and Schmidt, 1994; Giese and Cote, 2000; Marsh and
Yeung, 1999; Tse and Wilton, 1988; Westbrook and Reilly, 1983 and Yi, 1990).
It is also important to consider the opposite of consumer satisfaction, more precisely
the concept of consumer dissatisfaction, as it represents an integral part of the former one.
Not only should consumer dissatisfaction be perceived as the total opposite of consumer
satisfaction within the realm of satisfaction, it shall also be viewed as a different dimension.
Indeed, even though consumer dissatisfaction is still based on the same three components
as consumer satisfaction, consumers can be satisfied with some specific aspects of the
product or service purchase while also being dissatisfied with others (Giese and Cote,
2000).
Therefore, in order to avoid any confusion and, as suggested by Peterson and
Wilson (1992), avert a lack of “definitional and methodological standardization,” this
research will assume that consumer satisfaction is defined as a summary affective response
of varying intensity directed at specific moments of product acquisition and consumption
(Giese and Cote, 2000). Consequently, such definition allows a clear methodological
examination and analysis of non-economic factors viewed as determinants of B2B
consumer satisfaction, as prescribed by recent studies emphasizing the need to deepen
related academic knowledge (LaPlaca and da Silva, 2016).
1.2 High-Involvement Products
A few studies focusing on high-involvement product purchases, mainly in a B2C
context, were conducted during the late 1980’s and early 1990’s. However, information
about such type of product from a B2B perspective remains scarce. As with the concept of
consumer satisfaction, it is important to prior define which elements or components are
required to classify a product as being of high-involvement. According to one of the few
B2C studies related to such concept, Pattersen (1993) defines high-involvement products
as “the initiation of some type of problem-solving behaviour when the purchase is
perceived as high in personal importance and involves comparatively higher amount of
risks” (p. 450).
More precisely, high-involvement products cause consumers to care more and to be
more cautious, during their purchasing process, due to a greater level of associated risk.
Dholakia (2001) mentions that product involvement and risk are both motivational

6
constructs that influence the information search decision-making process. Therefore, the
fact that such type of product can influence a consumer’s attitude in such a profound
manner, and that it may initiate a problem-solving behaviour can lead to an inference that
such products do not only have a greater affective and cognitive meaning, but are also
perceived as being generally much more complex than low-involvement products. This
statement is supported by Boutang and De Lara (2016) who bring forth the fact that
complex products usually comprise multiple attributes and will normally be associated with
higher levels of involvement than simple ones.
Their purchasing process is also perceived as being longer, harder, riskier, and more
complex. According to Clark and Belk (1978), consumers will usually spend more time
looking for product information in the case of high-involvement products, in order to make
a wise purchase decision and reduce the risks associated with it. Hoyer and MacInnis
(2001) also stated in their book entitled “Consumer Behavior” that most prior conducted
studies classified low and high-involvement products based on “the extent of risk perceived
by consumers.” Kapferer and Laurent (1982), along with Kapferer (1998), also agree that
a product’s level of involvement is directly correlated to its level of associated risk.
From another perspective, Martin (1998) claims that along with conjuring positive
feelings, memories are also evoked when a high-involvement product is being examined
by a consumer. Such claim follows the same thought process as Pattersen’s (1993)
statement mentioned earlier, due to the fact that both researchers bring forth the affective
and cognitive aspects related to high-involvement products. Indeed, memories represent a
very personal and unique consumer characteristic. More importantly, they have the
capability of influencing a consumer’s emotions and desires, which in turn can positively
or negatively influence his purchasing decision.
Gu, Park and Konana (2012) also claim that such type of product is usually more
durable, require a greater amount of time and efforts to gather purchasing information and
is considerably riskier to acquire, when viewed from a financial and affective standpoint.
Examples of durable products include cars, electronic and consumer appliances as a wrong
purchase decision will lead to serious financial repercussions and may even oblige
customers to deal with a poor product for a relatively long duration of time (Kapferer and
Laurent, 1985). Another interesting point brought forth by Gu, Park and Konana (2012) is

7
that “word-of mouth (WOM) may have a greater influence on consumer purchase decisions
high-involvement products” (p. 183). In this case, WOM refers to any opinions shared
online or physically, between two or more consumers, regarding past user experiences and
current or past product reviews (Gu, Park and Konana, 2012).
Two main types of WOM information can be identified, more precisely internal or
external word-of-mouth. Internal WOM is hosted by retailers and usually originates from
salespeople or sales-related information sources, such as a company’s website, brochures
or specification sheets. External WOM, however, is hosted by third-party intermediaries,
such as websites specialized in product reviews or independent consultants or experts (Gu,
Park and Konana, 2012). More information regarding this specific type of variable will be
provided further in this chapter.
Such findings demonstrate that, similarly to the definition of the consumer
satisfaction concept, there is not one standard or globally used definition for the concept
of high-involvement products from a B2C perspective, and almost none in a B2B context.
For the purpose of this research, the following pages and remaining sections of this study
will assume that high-involvement products have the capability to influence a consumer’s
emotions and desires, are more durable and complex, and involve a longer, riskier and
intricate purchasing process in comparison to low-involvement products.
1.3 Determinants of Consumer Satisfaction
Next to having accurately established the definitions of both consumer satisfaction
and high-involvement product concepts, we must clearly identify which determinants
compose and influence this summary affective response that is the concept of consumer
satisfaction. This will allow for a more precise orientation of this research, and lead to the
creation of a testable conceptual model. A vast array of non-economic factors have the
potential to influence consumer satisfaction, however, due to the fact that this research will
focus on interpreting and analyzing B2B consumer satisfaction related to high-involvement
products, more precisely business aircraft, careful identification of such determinants must
take place.
According to the literature, non-economic factors such as service quality, perceived
value, purchase expectations, perceived performance, perceived desires, level of trust,
information communication and satisfaction, product attribute satisfaction, existing

8
relationship quality, and positive disconfirmation effect all have the ability to negatively
or positively influence the outcome of B2B consumer satisfaction, depending on both the
type of product or service that had been purchased, and its purchasing context (Agnihotri
et al., 2015; Churchill and Surprenant, 1982; Cronin, Brady and Hult, 2000; Ekinci, Dawes
and Massey, 2008; Fayawardhena, 2010; Gil-Saura, Frasquet-Deltoro and Cervera-Taulet,
2009; Kohli, Devaraj and Mahmood, 2004; Lam, Shankar and Murthy, 2004; Madaleno,
Wilson and Palmer, 2007; Molinari, Abratt and Dion, 2008; Ramaseshan, Rabbanee and
Hui, 2013; Rauyruen, Miller and Barrett, 2007 and Spreng, MacKenzie and Olshavsky,
1996).
It must be noted that the position of such above-mentioned determinants in the
various conceptual models examined always varied, and no consistent order or level of
importance could be identified. Indeed, according to Cronin, Brady and Hult (2000): “[…]
model structure appears highly dependent on the nature of study.” (p. 196). As such, current
literature offers many different approaches to the consumer satisfaction problematic,
however, it was particularly difficult to identify specific non-economic determinants
pertaining to B2B consumer satisfaction regarding high-involvement products. To do so,
we reviewed several existing conceptual models that laid out the foundation for certain
studies in various academic fields. However, five specific models played an instrumental
role in the conception of the one that will be used, in order to successfully conduct this
research.
1.4 Conceptual Models Examined
Prior to conceiving the conceptual model on which this research will be based,
several models in the field of consumer satisfaction and high-involvement products’
research were examined. As stated earlier by Cronin, Brady and Hult (2000) the structure
of each model varied according to the nature of the study, however, several aspects were
identified and played an instrumental role in the conception of this research’s conceptual
model. Those aspects can be better understood by examining five specific models assessed
during this literature review.
1.4.1 Disconfirmation of Expectations Paradigm
Four out of five models, more precisely the ones of Patterson (1993), Patterson,
Johnson & Spreng (1997), Voss, Parasuraman & Grewal (1998) and Spreng, MacKenzie

9
& Olshavsky (1996) emphasize the importance of comparing pre and post-purchase
expectations and perceived performance of the product or service, following its acquisition.
Such comparison is in line with Giese and Cote (2000) second component of consumer
satisfaction where the consumer will compare either the performance of the product or the
experience of the service he purchased to some previously established standards.
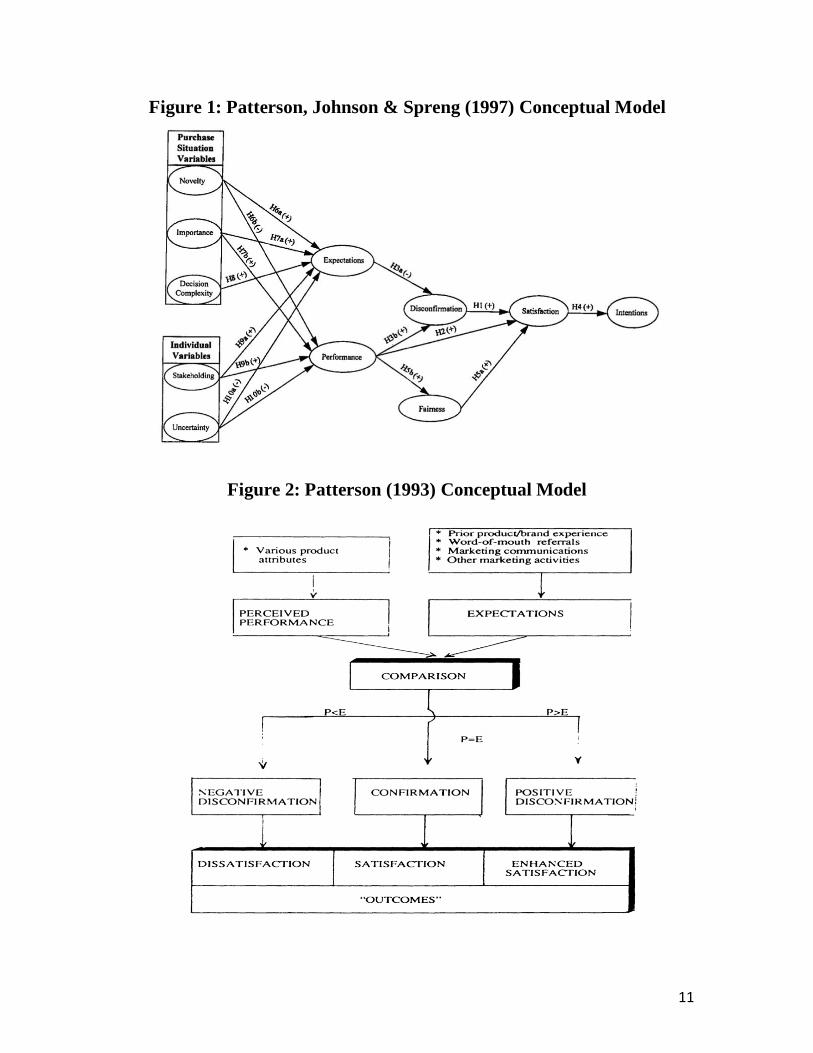
According to Patterson (1993), this process can also be referred to as the
disconfirmation paradigm, where satisfaction is directly linked to “the size and direction
of the disconfirmation experience” (p. 451). He also claims that this disconfirmation is also
related to the consumer’s initial expectations about a specific product’s performance
(Patterson, 1993). In this case, the term “expectation” is introduced. According to Churchill
& Surprenant (1982) and Patterson (1993), expectations are supposed to “reflect product
performance and create a frame of reference about which one makes a comparative
judgment” (p. 451). They are also formed by prior knowledge or experience of products’
attributes, exposure to certain external stimuli such as price or advertising and reference
groups’ information like WOM or product usage observation (Patterson, 1993).
All four of these models use the disconfirmation of expectations paradigm, in order
to assess the overall consumer satisfaction related to a specific product or service. In short,
consumer dissatisfaction is an outcome when there is a negative disconfirmation, more
precisely when perceived performance is inferior or smaller than consumer expectations.
However, consumer satisfaction or enhanced satisfaction are possible outcomes when there
is a confirmation or positive disconfirmation, more precisely when perceived performance
is equal to or larger than consumer expectations (Patterson, 1993). In order to fully
understand the meaning of the concept of “disconfirmation,” it is imperative to define what
the concept of “perceived performance” means in these conceptual models.

10
1.4.2 Perceived Performance and Product Attributes
This concept relates to the comparison of product performance to prior
expectations, once consumers have purchased and used it. The result being either positive
or negative disconfirmation, when perceived performance either exceed or is inferior to
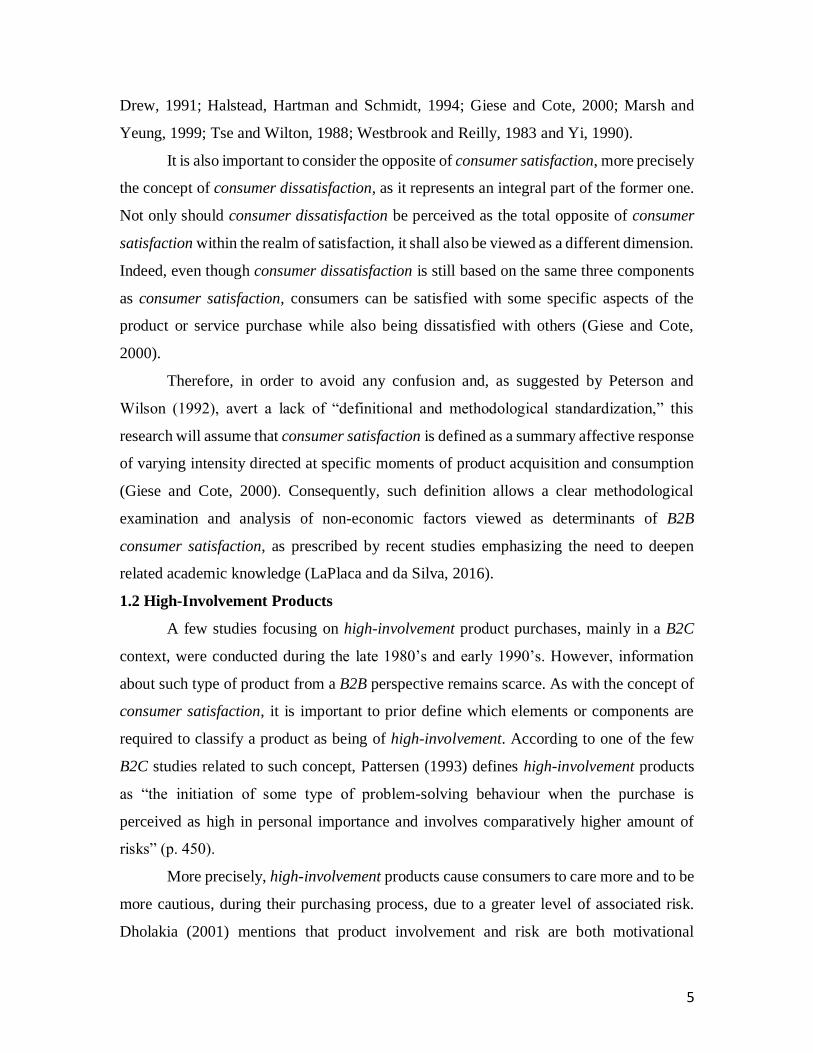
prior expectations (Patterson, 1993). Patterson, Johnson & Spreng’s (1997) conceptual
model depicted below (cf. figure 1) pushes this concept further by taking into consideration
decision complexity and the type of product involved in the process. More precisely, many
authors suggest that different satisfaction processes operate depending on the product
category involved, such as high or low-involvement products (Anderson, 1994; Bolton and
Drew, 1991b; Cadotte et al., 1987; Halstead et al., 1994; Oliver, 1989; Spreng et al., 1996).
However, according to Patterson, Johnson & Spreng (1997), there is a lack of consistent
results in regards to high-involvement products and some studies in the past literature
demonstrated a stronger effect of performance, whereas others demonstrated a stronger
effect of disconfirmation; this effect will be explained in the following subsection. Such
claim therefore supports the objective of this research to deepen academic knowledge
related to consumer satisfaction for B2B high-involvement products.
It is also interesting to compare the influence of product attributes on either
perceived performance or performance expectations. Patterson’s (1993) conceptual model
represented below (cf. figure 2) is conceived in such a way that product attributes directly
influence perceived performance, whereas Patterson, Johnson & Spreng (1997) and Voss,
Parasuraman & Grewal’s (1998) models (cf. figures 1 and 3) do not utilize this variable.
Instead, Patterson, Johnson & Spreng’s (1997) model indicates the influence of purchase
situation and individual variables, such as novelty, importance, stakeholding and
importance, on both performance and expectations factors. From another standpoint, Voss,
Parasuraman & Grewal’s (1998) model reflect the influence of both objective price and
quality cues variables on both pre-purchase price perceptions and performance
expectations factors. The model then evolves to both objective price and performance
variables influencing post-purchase price and performance perceptions.
11
Figure 1: Patterson, Johnson & Spreng (1997) Conceptual Model
Figure 2: Patterson (1993) Conceptual Model

12
Figure 3: Voss, Parasuraman & Grewal (1998) Conceptual Model
1.4.3 The Effect of Disconfirmation
The effect of disconfirmation relates to the extent if prior expectations have been
met or not (Patterson, 1993). More precisely, it consists in evaluating whether or not all
expectations have been met, according to specific comparison standards, following the
purchase and usage of a product or service. As mentioned earlier, most conceptual model
examined during this literature review, except the one from Madaleno, Wilson & Palmer
(2007) (cf. figure 4) utilizes this concept in order to assess overall consumer satisfaction.
It is important to mention that Oliver (1980) pointed to the importance of measuring
disconfirmation differently from expectations, as product usage or consumption can alter
the retention of expectations. In other words, Oliver (1980) indicates that product
experience can cause consumers to forget their initial expectations over time. This finding
therefore emphasizes the importance of measuring the effect of disconfirmation separately
from the effects of known expectations on consumer satisfaction.

13
Figure 4: Madaleno, Wilson & Palmer (2007) Conceptual Model
1.4.4 Price and Quality
Voss, Parasuraman & Grewal (1998) model (cf. figure 3) attempts to demonstrate
that pre-purchase expectations are influenced by both price and quality information, and
that overall consumer satisfaction is impacted not only by performance, product quality
and expectations, but also pricing. The emphasis placed on pricing is beneficial to this
research, due to the fact that high-involvement products are often much more expensive
than low-involvement ones and pricing, along with other financial characteristics of the
transaction, play an important role in determining overall consumer satisfaction. The
authors of this model also demonstrate that once consumers are placed in uncertain
environments, which also constitute another aspect linked to high-involvement products,
are most likely to utilize price as a hint in developing pre-purchase performance
expectations (Voss, Parasuraman & Grewal, 1998).
One of the most important findings associated with this model and study pertains
to the fact that performance expectations have a significant impact on satisfaction and
performance perceptions solely when price and product performance/quality are consistent.
In short, the level of performance delivered by the product must match the product’s price
level, in order for consumers to truly associate their quality, performance and satisfaction

14
judgments with their initial pre-purchase performance expectations (Voss, Parasuraman &
Grewal, 1998). Therefore, a high price and low-quality product or a low price and high-
quality product will lead to inconsistent matches between consumer post-purchase
satisfaction judgments and pre-purchase performance expectations. Voss, Parasuraman &
Grewal (1998) also indicate that consumers who purchased low price and high-quality
products were more likely to be satisfied than the ones who purchased high price and low-
quality products. More precisely, consumers who were less price tolerant and more
demanding, concerning pre-purchase pricing, are more likely to exhibit higher satisfaction
levels than less demanding and more price tolerant ones.
Finally, Voss, Parasuraman & Grewal (1998) mention a notable point about
reference pricing, during their discussion about future research opportunities. Indeed, they
wonder if the use of a high external reference price would increase consumers’ internal
reference price and, consequently, their price tolerance. It could be debated that this
question is linked to the domains of sales and price equity, which would therefore be linked
to Madaleno, Wilson & Palmer’s (2007) conceptual model that examines determinants of
consumer satisfaction in a multi-channel B2B environment. This model also offers a
broader perspective and understanding of the influence of sales force satisfaction on
consumer satisfaction.
1.4.5 Sales Force Satisfaction and Price Equity
Madaleno, Wilson & Palmer’s (2007) model (cf. figure 4) introduces a new variable
pertaining to sales force satisfaction. The goal of this research being to generate specific
marketing and sales managerial recommendations, in order to improve consumer
satisfaction for B2B high-involvement products, this variable plays a crucial role in
demonstrating the role and influence of sales on overall consumer satisfaction. The authors
characterize this variable as being offered either directly by the manufacturer or fully
owned by an intermediary. This intermediary can then be represented by agents selling
only one particular brand’s products, or resellers selling many different brands’ products.
Madaleno, Wilson & Palmer’s (2007) model also includes a website satisfaction variable,
as today’s consumers have access to an important amount of information online, which
may or not affect their pre-purchase perception of certain products, along with their
satisfaction related to sales force contributions and efforts.

15
Although Madaleno, Wilson & Palmer’s (2007) model does not address this
specific variable in much depth, a particular emphasis will be placed on assessing the role
and impact of sales force and sales support teams onto overall consumer satisfaction, when
examining the different items constituting the conceptual model that will be used for this
research. Indeed, Madaleno, Wilson & Palmer (2007) demonstrated that sales force
satisfaction has a quantifiable impact onto consumer satisfaction, and that further efforts
must be made to understand the role and impact of this specific variable.
In line with Voss, Parasuraman & Grewal’s (1998) model and research, Madaleno,
Wilson & Palmer’s (2007) study also addresses the question of price equity and price
tolerance. Their findings indicate that payment equity has the ability to positively or
negatively influence overall consumer satisfaction. Voss, Parasuraman & Grewal (1998)
were therefore right in assuming that price tolerance, consumer satisfaction and price
equity were interrelated. Such finding is also congruent with Bolton & Lemon (1999) and
Verhoef (2003) studies that demonstrated that customers’ perceptions of prices’ fairness
are formed relatively to competitors’ prices and that pricing mechanisms also play a crucial
role in establishing prices offered by various companies and manufacturers.
1.4.6 Expectations vs. Desires
The previous models examined above have brought forth different aspects ranging
from the paradigm of expectations disconfirmation, the effect of disconfirmation and the
importance and impact of product attributes, perceived performance, price, price equity,
product quality and sales force satisfaction onto consumer satisfaction. Spreng, Mackenzie
& Olshavsky’s (1996) model depicted on the following page (cf. figure 5) adds to the mix
the role, influence and importance of desires when measuring overall consumer
satisfaction. This model is also useful to appropriately differentiate expectations from
desires, as both terms initially entail a similar meaning.

16
Figure 5: Spreng, Mackenzie & Olshavsky (1996) Conceptual Model
The authors first describe expectations as both the probability of an event’s
occurrence, followed by its evaluation consisting of determining its associated level of
“goodness” or “badness” (Spreng, Mackenzie & Olshavsky, 1996). Their definition of such
term is also corroborated by previous studies conducted by authors such as Bearden & Teel
(1983), Westbrook (1987), Churchill & Surprenant (1982), Oliver (1980) and Tse & Wilton
(1988). Similarly to Oliver (1980), they believe that the effect of disconfirmation needs to
be measured separately from expectations, and that expectations must be separated in two
distinct groups. More precisely, the first group is to be composed of predictive expectations
that require the consideration of the probability related to the occurrence of future events.
Whereas the second group is to be composed of judgmental expectations, which require
the use of standards of comparison when evaluating the level of “goodness” or “badness”
associated with an event, product or service usage. Spreng, Mackenzie & Olshavsky (1996)
finally conclude by defining expectations as: “beliefs about a product’s attributes or
performance at some time in the future (Olson & Dover, 1979)” (p. 16).
They carry on to define desires as the most fundamental needs, life goals or desired
end states that can be classified in two generic categories being higher and lower-level
desires. Higher-level desires relate to products that can provide certain benefits, which can
then be narrowed down, in order to identify the specific product attributes desired (Spreng,
Mackenzie & Olshavsky, 1996). These authors also indicate that desires can either be

17
abstract and states, such as security, intermediate benefits, such as products that can
provide an acceptable level of security to its users, or a means to provide the specific
benefits sought by users, such as an aircraft’s anti-stall system which will consequently
provide its users with the desired level of security. Therefore, desires can be defined as
attributes or benefits directly associated with higher-level values or needs, such as for
example safety, security or protection (Spreng, Mackenzie & Olshavsky, 1996).
In their own words, they differentiate expectations from desires by stating that:
“expectations are beliefs about the likelihood that a product is associated with certain
attributes, benefits, or outcomes, whereas desires are evaluations of the extent to which
those attributes, benefits, or outcomes lead to the attainment of a person’s values.” (p. 17).
It must also be noted that, according to Spreng, Mackenzie & Olshavsky (1996),
expectations are malleable and oriented towards the future, whereas desires are stable and
occur mostly in the present.
Thus, this research will assume that desires are stable and present-oriented product
attributes or benefits that are either associated with specific higher-level values/needs or
lead to their fulfillment.
1.4.7 Product Attributes Satisfaction and Information Satisfaction
The model used by Spreng, Mackenzie & Olshavsky (1996) also includes two
satisfaction-related variables pertaining to both the information acquired and used, during
the transaction process, and the attributes of the purchased product or service. Both of these
variables are hypothesized to have a direct impact on the overall level of consumer
satisfaction. Attribute satisfaction pertains to a consumer’s satisfaction with the product
itself, and its attributes. More precisely, attribute satisfaction results from the consumer’s
satisfaction judgment, following its observation of a product’s attributes performance
(Oliver, 1993; Spreng, Mackenzie & Olshavsky, 1996). In other words, the observed
performance of a product’s attributes will either positively or negatively influence a
consumer’s attribute satisfaction.
Information satisfaction pertains to the satisfaction judgment of the information
used, when choosing a specific product or service (Spreng, Mackenzie & Olshavsky,
1996). Such information is likely to originate from a company’s marketing
communications efforts, and more precisely from various sources such as personal selling,

18
advertising campaigns, corporate websites and social media. Gardial et al.’s (1994) study
provides a good example to illustrate information satisfaction. They demonstrated that if
salespeople promise more than they can actually deliver, and if the persuasion-based
expectations used are disconfirmed, consumers will be dissatisfied with the information
used when choosing a service or product (Gardial et al., 1994). It must also be noted that
due to the nature and objectives of this research, a particular emphasis will be placed on
the role and influence of sales-related activities and notions on this specific variable.
1.4.8 Expectations and Desires Congruency
As mentioned earlier, and as depicted by a wide variety of existing academic
studies, the effect of disconfirmation is a widely utilized concept in the field of consumer
satisfaction research. However, Spreng, Mackenzie & Olshavsky’s (1996) model
demonstrates the existence of two similar concepts, more precisely the effects of
expectations and desires congruency. The authors define expectations congruency as: “the
consumer’s subjective assessment of the comparison between his or her expectations and
the performance received.” (p. 18). In other words, expectations congruency represents the
gap between the consumer’s expectations, prior to testing the product, and the actual
performance observed, during product testing.
Spreng, Mackenzie & Olshavsky (1996) propose that this concept has the ability to
directly influence product attribute satisfaction, due to the fact that consumers usually
judge product performance on an attribute level. Furthermore, they propose that it can also
influence information satisfaction if one of the product attributes did not perform as well
as described by prior received product information. In this specific case, it would cause
consumers to be dissatisfied with the information given.
Similarly to the way the authors defined expectations congruency, they describe
desires congruency as: “the consumer’s subjective assessment of the comparison between
his or her desires and the performance received.” (p. 18). Spreng, Mackenzie & Olshavsky
(1996) propose that desire congruency directly influences product attribute satisfaction and
information satisfaction, due to the fact that desires are attributes or benefits directly
associated with higher-level values or needs. Therefore, desires’ congruency can positively
or negatively influence attribute satisfaction on the attribute level. For example, if a
consumer wants the safest business aircraft on the market; if after use, the aircraft is

19
perceived to fulfill such desire and provide such benefit, then he or she will be satisfied
with the product attribute providing such benefit. In this case, the aircraft anti-stall system
would be the product attribute for which the consumer is satisfied, leading to an increased
product attribute satisfaction.
Spreng, Mackenzie & Olshavsky (1996) also bring forth the assumption that pre-
purchase rules used in selecting a service or product infer that consumers buy products they
expect should fulfill their desires. Therefore, a positive relationship is hypothesized
between information satisfaction and desires congruency; A product performance close to
desires should result in a satisfied consumer regarding the information used during the
product selection process. Thus, desires’ congruency also has the ability to directly
influence, either positively or negatively, information satisfaction.
1.5 Assessed Dependent and Independent Variables
1.5.1 Dependent Variable: Overall Satisfaction for B2B High-Involvement Products
As mentioned at the beginning of this chapter, the goal of this research is to identify
which determinants compose and influence consumer satisfaction for high-involvement
products sold in a B2B context. In this case, the dependent variable assessed is consumer
satisfaction for B2B high-involvement products. For this purpose, the global industry of
business aircraft will serve to acquire data and perform scientific observations, as business
aircraft represent high-involvement products sold within a B2B context. If we refer back to
the definition of high-involvement products, established earlier in this chapter, such
products have the capability to influence a consumer’s emotions and desires, are more
durable and complex, and involve a longer, riskier and more intricate purchasing process,
in comparison to low-involvement products.
Business aircraft transactions require a lot of time and efforts on behalf of the
customers, as the duration of the purchasing process ranges between several weeks to many
months, prior to fully completing the transaction and transferring ownership of the aircraft
to the customer. This type of acquisition is also quite expensive, intricate, and involves a
considerable amount of financial risk, similarly to a wide extent of multimillion-dollar
purchases. It must also be noted that business aircraft are extremely complex and
technologically advanced products that require many years of research & development,
20
along with several months to be assembled, certified by civil aviation authorities, and
labelled as being fully operational.
Available information about public and private international corporations indicates
that many of them currently own and operate a business aircraft. Nevertheless, such type
of high-involvement luxury product can also be sold to certain high net-wort individuals in
a business-to-consumer (B2C) context. However, and in response to Molinari, Abratt and
Dion (2008) study demonstrating that: “research in satisfaction in B2B markets is lagging
behind consumer marketing.” (p. 364), this research will focus solely on consumer
satisfaction related to business aircraft sold in a B2B context.
Finally, it must be noted that the concept of consumer satisfaction was defined
earlier in this chapter as a summary affective response of varying intensity directed at
specific aspects of product acquisition and consumption (Giese and Cote, 2000).
1.5.2 Independent Variables
The previous sections of this chapter identified and defined various determinants
capable of influencing consumer satisfaction for B2B high-involvement products. Due to
the fact that this research is based on an adaptation of Spreng, Mackenzie & Olshavsky’s
(1996) conceptual model depicted in their article entitled “A re-examination of the
determinants of consumer satisfaction,” six independent variables were identified and
selected: desires, expectations, desires’ congruency, expectations congruency, product
attributes satisfaction and information satisfaction. However, a review of the existing
literature demonstrated that four of these independent variables, more precisely desires,
expectations, product attribute satisfaction and information satisfaction, can be subdivided
into specific items, in order to allow a more precise assessment of their role and influence
on consumer satisfaction for B2B high-involvement products. This section aims to define
each item subdividing these four independent variables.
1.5.3 Desires
As defined earlier, desires are stable and present-oriented product attributes or benefits that
are either associated with specific higher-level values/needs or lead to their fulfillment
(Spreng, Mackenzie & Olshavsky, 1996). Thus, it can be inferred that customers and
companies possess a wide variety of desires that play an important motivational role in
their decision to purchase a business aircraft. Desires may also have the ability to influence

21
their overall satisfaction for this B2B high-involvement product. This research proposes
that this first pre-purchase independent variable can be subdivided into three specific items:
social status and prestige, convenience, and experience.
1.5.3.1 Social Status and Prestige
As evoked by Kapferer and Bastien (2012) in their book entitled The Luxury
Strategy: break the rules of marketing to build luxury brands, business aircraft are an
integral part of the world of luxury, similarly to yachts and intricate pieces of jewelry, and
can therefore be classified as luxury products. This being established, which motivational
factors play an influential role in convincing companies to purchase a private jet? Their
quest for social status and prestige may be the answer to such question.
According to different authors such as Nelissen and Meijers (2011), de Botton
(2004), Frank (1999), Miller (2009) and Schor (1998), today’s consumer culture seems to
be characterized by a strong attachment to material expenditures as a means of establishing
and describing social relationships. In other words, consumers, and in some instances
companies, are expressing a willingness to pay a premium, in order to obtain luxury-
branded products. Nelissen and Meijers (2011) argue that the reason for this behaviour is
to gain social status.
Hyman (1942) defines social status as a higher position compared to others on
certain dimensions deemed important by society, such as academic knowledge, perceived
level of success, power and wealth. Bierstedt (1970) and Dawson and Cavell (1986) claim
that status refers to the position of an individual, in a group or in society, awarded by others.
On the other hand, Donnenwerth and Foal (1974) defined status as follows: “an expression
of evaluative judgment that conveys high or low prestige, regard or esteem” (p. 786). Such
statements allow an inference that social status relates to the concepts of prestige, power
and wealth, which will be defined further in this section. Other authors such as Bourdieu
(1984) and Hirsch (1976) indicate that utility derived from expenditures delivering no
functional benefits could accumulate from their merits as signals of social status. This
particular statement relates to the concept of conspicuous consumption, which will also be
defined later in this section. Cummins (2005), Miller (2009) and Saad (2007) on the other
hand demonstrate that human preference for consuming luxury goods comes from a

22
tendency to signal traits that could improve status, which implies that purchasing and
displaying certain luxury products could improve a person’s social status.
Indeed, it has been demonstrated that products can be used in a symbolic manner
(Levy, 1978). Goffman (1959), Belk (1988), Ewen (1988) and Braun and Wicklund (1989)
depicted in their studies the fact that consumers purchase, use and display specific types of
products and services, in order to enhance their sense of self, share an image of what they
are like, represent their feelings and thoughts, and attract the types of relationships or
affiliations they wish to have. It is interesting to note that multiple interviews conducted
with aeronautical experts and executives, by major consultancy firms, have demonstrated
that certain corporations use and display their business aircraft to potential customers, in
order to signal their strong financial performance, impress them, and ultimately attract
them. In a similar mindset, Packard (1959) suggested that consumers will purchase, use
and display certain products solely to demonstrate a superior level of status to their
entourage and themselves.
Current academic literature identifies three types of social status. The first type
pertains to status by definition or assignment, such as royalty, the second type is by
achievement, such as military personnel being promoted to a higher rank following an
extraordinary accomplishment, and the third type being status by acquisition, consumption
and display (Brown, 1991; Eastman, Goldsmith and Flynn, 1999; Hayakawa, 1963). This
research will particularly focus on the third type of social status mentioned above and
define this concept as the position of an individual or company, in a group or society,
awarded by others, according to its level of power and prestige engendered by a higher
position compared to others on important cultural dimensions such as wealth and success,
which can substantially be improved by acquiring, consuming and displaying luxury
products.
As mentioned earlier, Donnenwerth and Foal (1974) defined status by associating
it with the concept of prestige. More precisely, they claimed that social status conveys
either a high or low level of prestige, regard or esteem. Vigneron and Johnson (1999) define
prestige by first and foremost establishing two distinct categories of brands and products:
prestige and non-prestige brands. They then carry on by stating that prestige brands exhibit
five perceived values, dependent on a specific socioeconomic framework. Indeed,

23
consumers may perceive such five values differently, due to their different socioeconomic
backgrounds which consequently impact the way they differentiate prestige brands from
non-prestige ones.
The first value exhibited by prestige brands is perceived conspicuous consumption.
More precisely, the act of consuming prestige brands can be perceived by others as a signal
of status and wealth, but their higher price tags only enhance the value of such a signal.
The concepts of wealth and conspicuous consumption will be further defined in this
section. The uniqueness of a brand represents the second value exhibited by prestige
brands; If a particular brand is owned and used by many consumers, it cannot be described
as a prestige brand as it must convey a sense of exclusivity. Prestige brands must also be
associated with specific social values, which can influence either positively or negatively
consumers’ purchasing decision. The fourth value exhibited by prestige brands is perceived
hedonic value; brand selection will be affected by certain subjective intangible benefits
such as aesthetic appeal, which will ultimately contribute to satisfying specific consumers’
emotional desires. Lastly, perceived quality value is an essential element of prestige brands.
In other words, the technical superiority, first-rate care and specialized handcraft skills
needed during the production process are integral components of prestige brands.
Vigneron and Johnson (1999) also state that “prestige products have been used as
an example of extreme-end high-involvement decision-making.” (p. 4). Such statement
therefore indicates that prestige brands/products represent an important portion of the high-
involvement products’ category. It also indicates that both concepts seem to be strongly
interrelated and complementary to each other. Rossiter, Percy and Donovan (1991) support
this statement, due to the fact that their research framework assumes that prestige brands
and products are high-involvement ones, and that social approval, sensory gratification and
intellectual stimulation represent the primary factors in purchasing prestige products. This
research will therefore assume that high-involvement products exhibiting perceived
conspicuous, unique, social, hedonic and quality values, and causing enhanced social
approbation can be defined as prestige brands/products.
As mentioned earlier, Hyman (1942) defined the concept of social status as a higher
position compared to others on certain dimensions deemed important by society. One of
these dimensions was power, it is therefore important to define this concept. Rucker and

24
Galinsky (2008) define power as a psychological state that can be triggered simply by
reminiscing certain events that lead to a feeling of powerlessness or powerfulness. Such
statement is also corroborated by authors such as Anderson and Galinsky (2006), Galinsky,
Gruenfeld and Magee (2003), Magee, Galinsky and Gruenfeld (2007) and Smith and Trope
(2006), who triggered and assessed several participants’ feeling of powerfulness and
powerlessness, by instructing them to recall specific past events that either made them feel
powerful or powerless.
Furthermore, current literature demonstrates that this psychological state engenders
the ability to control both one’s own and others’ resources and outcomes, such as economic
resources, positions of authority, respect from others and expertise just to name a few
(French and Raven, 1959; Hunt and Nevin, 1974; Keltner, Gruenfeld and Anderson, 2003
and Thibaut and Kelley, 1959). It can therefore be inferred that power can vary from one
situation to another, within one individual, and according to the hierarchical arrangement
of each context. In light of the findings conveyed by academic literature, this research will
define power as a psychological state that engenders the ability to control one’s own and
others’ resources and outcomes, depending on both the situation and hierarchical
arrangement of each context.
Veblen (1899) once wrote: “The basis on which good repute in any highly
organized industrial community ultimately rests is pecuniary strength; and the means of
showing pecuniary strength, and so of gaining or retaining a good name, are leisure and a
conspicuous consumption of goods” (pg. 51). The term conspicuous consumption has been
a recurrent one so far, being related to the previously defined concepts of social status and
prestige. O’Cass and McEwen (2004) and Mason (1981) indicate that conspicuous
consumption is often practised in order to improve someone’s level of prestige in society,
by publicly exhibiting opulent wealth to others. Eastman et al. (1999) argued that such
status-seeking behaviour can be observed when someone decides to increase its
consumption of status goods, such as luxury products or prestige brands, in order to
enhance its social status. It must be noted that multiple authors have brought forth a similar
definition, such as McCraken (1988), O’Shaughnessy (1992), Packard (1959) and Bell et
al. (1991). Therefore, this research will define conspicuous consumption as the act of

25
purchasing status goods, more precisely luxury and prestige products, in order to enhance
one’s social status by displaying them to the public eye.
In conclusion, social status can be defined as the position of an individual or
company in society or a specific group, awarded by others, according to its level of power
and prestige engendered by a higher position compared to others on important cultural
dimensions, such as wealth and success. This position can also be substantially improved
by acquiring, consuming and displaying luxury products. On the other hand, prestige is to
be associated with high-involvement products exhibiting perceived conspicuous, unique,
social, hedonic and quality values; thus, procuring its owners enhanced social approbation.
Many authors have demonstrated that individuals attempt to improve their social
status and level of prestige by acquiring luxury products. However, literature remains
scarce in regards to status-seeking behaviour in a B2B context. Could it be possible that
certain companies decide to purchase a business aircraft, in order to enhance their social
status and level of prestige? Such question, along with the scarcity of academic knowledge
related to B2B status-seeking behaviour are arguments supporting the relevancy of this first
item in this research.
1.5.3.2 Convenience
Making flight arrangements for business executives is not an easy task, as they must
not only respect their busy schedules but also afford enough flexibility to be rescheduled,
in case of last-minute changes. Tickets must also be purchased well ahead of time, in order
to guarantee the executive a seat on the specific flight required. Furthermore, commercial
flights generally necessitate executives to arrive at the airport at least two hours prior to
boarding time, in case of international flights, and at least an hour prior to boarding time,
in case of domestic and regional flights.
Such periods of time are required, in order to account for any traffic on the way to
the airport, properly and timely check any out-of-cabin bags, queuing time and clearing
security ahead of boarding time to allow a relatively stress-free and enjoyable travel
experience. However, such requirements demand a considerable amount of time and efforts
on behalf of business executives. In other words, commercial travel is not the most
convenient way of travelling for high-ranked businessmen and businesswomen. This
inconvenience may therefore act as a motivational factor in the purchasing decision of a

26
business aircraft, as it represents a viable solution in the form of a product and service to
such lack of convenience. It could also be hypothesized that convenience positively or
negatively influences overall consumer satisfaction for B2B high-involvement products.
Indeed, some advantages of buying a private jet are that it allows its users to depart
at any time of the day and night from a few hours’ notice, eliminates any waiting time spent
in queues, at security or more generally in airports, eliminates the need for checking-in
luggage, optimizes the intimacy level of its users, offers crucial services such as high-speed
internet connectivity anywhere in the world, and permits last-minute flight plan changes
while being either on the ground or in the air.
Academic literature on convenience has evolved a great deal over time. Copeland
(1923) first depicted the concept of convenience as a products’ category called convenience
goods. This category included intensively distributed goods necessitating minimal time,
physical and mental efforts to purchase. Early marketing usage therefore represented
convenience not as a product characteristic or attribute, but as the amount of time and
efforts necessary in purchasing a good or product (Brown, 1990). It is only later that
academics started to perceive convenience as a product attribute reducing its non-monetary
price, and encompassing different resources such as time, energy and opportunity that
consumers were giving up when purchasing services and products (Etgar, 1978; Kelley,
1958 and Kotler and Zaltman, 1971). More recently, Vargo and Lusch (2004) described
convenience as a new marketing perspective arguing that companies are only capable of
making value proposition to its consumers; thus, proposing that convenience creates value
for its users. Carrigan and Szmigin (2006) also proposed that convenience can be perceived
as a lifestyle choice that improves the quality of life of consumers living demanding and
on-the-go lives; Therefore, linking convenience to the concept of experiential
consumption. Non-monetary cost being central to the concept of convenience, it is also
important to analyze some of the academic literature pertaining to the concepts of time and
effort.
Jacoby, Szybillo and Berning (1976) described the concept of time as a limited and
scarce resource. Similarly, Berry (1979) and Gross (1987) stated that time is a finite
resource that can’t be expanded like money. Other researchers, such as Feldman and
Hornik (1981), associated the expression saving time to achieving a greater efficiency,

27
whereas some like Anderson and Shugan (1991) determined that it was more common to
view time as a cost and not an investment. Another interesting aspect pertaining to the
concept of time is temporal orientation; people do not equally perceive and value time or
time scarcity (Bergadaa, 1990; Durrande-Moreau and Usunier, 1999; Graham, 1981;
Hornik, 1984; Murphy and Enis, 1986 and Shimp, 1982). Gagliano and Hathcote (1994)
also demonstrated that cultural factors have an important influence on the way people
perceive time and how it affects their evaluation of convenience.
In regards to the literature pertaining to the effort concept, Seiders, Berry and
Gresham (2000) and Lovelock (1994) demonstrated that effort, also known as consumers’
energy expenditures, is a type of non-monetary cost that has the ability to influence
convenience and satisfaction, in a similar manner as time. Downs (1961), Mabry (1970)
and Jacoby, Szybillo and Berning (1976) denoted that the usual costs of consumption are
time, effort, and money. In addition, stamina constraints have also been proven to influence
the choice and purchase decision of a consumer amongst different types of products and
services. O’Shaughnessy (1987) and Voli (1998) proved this statement by demonstrating
that consumers established their choice of performance-based products by selecting brands
that were more labour saving; which also allowed them to buy time. Three types of effort
are brought forth by literature, more precisely emotional, cognitive and physical efforts
(Mohr and Bitner, 1995 and Youngdahl and Kellogg, 1997).
In conclusion, this research defines the concept of convenience as a product
attribute or characteristic that reduces its non-monetary cost by allowing its users to save
on resources such as effort and opportunity, to buy time, and to benefit from added value
by being more efficient, which consequently improves their overall quality of life.
Convenience is also believed to positively or negatively influence consumer satisfaction.
1.5.3.3 Experience
As demonstrated earlier in the subsection pertaining to social status and prestige,
business aircraft are incontestably luxury products. Kapferer and Bastien (2012) state that
luxury products are not only products, but also constitute luxury experiences. Luxury
products being manufactured by luxury brands, they carry their respective brand’s
reputation, service quality, exclusive signature and cultural hallmark (Kapferer and
Bastien, 2012). Therefore, purchasing a business aircraft also translates to purchasing a

28
luxury experience. This reflection can be pushed further by deducing that companies’
desire to enhance the flight experience of their high-ranked executives play a motivational
role in their decision to purchase a private jet. It could also be discussed that such enhanced
flight experience may also lead to an improvement of the executives’ life quality, while
also representing an opportunity to publicly display the multiple advantages related to the
purchase and usage of a business aircraft.
Hollbrook and Hirschman (1982) defined an experience as “an individual’s
consumption of and interaction with products or services that involve significant affection”
(pg. 167). Csikszentmihalyi (1990) pushes this reflection further by claiming that an
experience is an event or a context that offers joy, value and captivation, which lead to a
feeling of letting be. Carbone and Haeckel (1994) define this concept as a bundle of sensory
information originating from encounters with products, services and businesses. More
recently, Pitkänen and Tuohino (2006) and Tarssanen and Kylänen (2007) respectively
described an experience as an affective event that has a strong impact on the person
perceiving it, and an emotional occurrence that can lead to personal changes. A review of
the academic literature pertaining to this field demonstrates that the existing definitions of
this concept are various, however, most of them share and point towards an affective
component that has the ability to influence or change a person’s emotions and/or senses.
Same and Larimo (2012) even developed a lexicon of experience ranging from the years
1964 to 2007, which regroups a wide array of definitions brought forth by a multitude of
authors.
Furthermore, certain studies indicate that such concept is related to the fact that
people are increasingly looking for sensations, happiness, a feeling of fulfillment and
specific core values in various market offerings (Fortezza and Pencarelli, 2011). Tynan and
McKechnie (2009) also mentioned the fact that customers and users are eager to obtain
pleasure over functional benefits, while companies are constantly looking for innovative
solutions that will grant them a competitive advantage. Indeed, Pine and Gilmore (1998)
and Holbrook (2000) stated that customer experiences are not only useful to entertain and
educate customers, but also to display specific knowledge, social behaviour and values, or
to offer a visual or aesthetic encounter. Therefore, this concept can simultaneously help
companies to elevate current customers’ and users’ level of satisfaction, but also to attract

29
different ones and serve as an opportunity to publicly display certain values or social
behaviour. In this instance, the concept of experience or experiential marketing, often
evoked by academic literature, offers an optimal solution to both parties involved, more
precisely customers/users and companies.
Ismail (2011) identified several antecedents to customer experience, some being
also present in the customer satisfaction literature. More precisely, this author identified
advertising, price, employees, servicescape, core service, WOM and mood as antecedents
to customer experience. Some of them, such as price and WOM, have been mentioned
earlier in this research. Grönroos (2001) also identified service and experience quality as
an antecedent to specific outcomes like customer satisfaction. Such antecedents are argued
to either positively or negatively affect customer experience, which in turn will impact
brand loyalty (Ismail, 2011). Other authors who have conducted studies in this specific
field, such as Barsky and Nash (2002) and Berry et al. (2002), also argued and asserted that
customer experience can affect loyalty behaviours either positively or negatively. Finally,
Verhoef et al. (2009) also stated that complete customer experience encompasses different
steps such as product search, purchase, usage or consumption and after-purchase
evaluation.
In conclusion, this research defines the concept of experience as a mix of sensory
information originating from encounters with products or services that has an affective
influence on a person’s emotions and/or senses before, during, and after a transaction.
1.5.4 Expectations
As established earlier, and according to Spreng, Mackenzie & Olshavsky (1996),
expectations are: “beliefs about a product’s attributes or performance at some time in the
future (Olson & Dover, 1979)” (p. 16). Patterson (1993) also indicated that they are formed
by prior knowledge or experience of products’ attributes, exposure to certain external
stimuli, such as price or advertising, and reference groups’ information like WOM or
product usage observation. This research assumes that expectations play an important role
in not only motivating customers or companies to purchase a business aircraft, but also in
influencing their level of satisfaction for this B2B high-involvement product. This second
pre-purchase independent variable can be divided into three items: experience and service

30
quality, product performance, and perceived value and premium. The following
subsections will attempt to describe and define each of these items.
1.5.4.1 Experience and Service Quality
As demonstrated in the previous section of this research entitled Desires, and more
precisely in its subsection entitled Experience, purchasing a luxury product, such as a
business aircraft, also translates to purchasing a luxury experience. This subsection places
the emphasis on defining the concepts of experience and service quality and describes the
relatively wide quality spectrum that applies to both of these concepts. Most companies
and consumers who decide to purchase a business aircraft usually have chartered or used
one, in the past. If not, they usually rely on external experts or consultants to advise them,
during the purchasing process. Due to this reason, they are able to compare many aspects
of one particular model or manufacturer to another, including the experience and service
quality offered.
It must first be established that there exists a notable difference between experience
quality and service quality. According to Otto and Ritchie (1996) and Chen and Chen
(2010), experience quality tends to be more subjective in terms of measurements, whereas
service quality is described as being more objective. This can be explained by the fact that
consumers tend to evaluate experience quality as a whole, and not by decomposing it in
different specific parts. Their evaluation is also influenced by their personal background;
therefore, it is self-centric. The authors also mentioned that perceived benefits originating
from experience quality are mostly affective, and experiential and symbolic in nature. Such
statement is in line with Pitkänen and Tuohino (2006) and Tarssanen and Kylänen (2007)
earlier definition of the experience concept. As a reminder, they respectively described an
experience as an affective event that has a strong impact on the person perceiving it, and
an emotional occurrence that can lead to personal changes.
It must also be noted that experience quality, just like service quality, are two
concepts deprived of tangible evidences on which to evaluate their quality level
(Parasuraman, Zeithaml and Berry, 1985). In this instance, some authors such as McConnel
(1968), Olander (1970) and Zeithaml (1981) suggested that price becomes an indicator of
quality, when further information or cues necessary to formulate a quality evaluation are
unavailable. Experience quality may vary largely from one business aircraft model or
31
manufacturer to another. Therefore, how can it be possible to appropriately evaluate
experience quality, and what are some business aircraft components related to this first
concept?
Even though a wide variety of methods may exist to evaluate experience quality,
such as surveys and semi-structured interviews, it is interesting to point out that Otto and
Ritchie (1996) developed an experience quality scale composed of four factors (Chen and
Chen, 2010). More precisely, these four factors are: hedonics, involvement, recognition
and peace of mind. Otto and Ritchie (1996) described hedonics as the consumer’s affective
responses, such as memorability, enjoyment and excitement; Involvement relates to the
desire to have a choice and control in the service offering, to be educated and informed
about the offerings, and being influenced by a sense of mutual cooperation; Peace of mind
is described as the consumer’s concern and need for both psychological and physical safety
and comfort; Finally, Recognition pertains to the fact that consumers must feel important,
confident, and be taken seriously by the selling party. Such scale may therefore be useful
in measuring the experience quality of companies’ executives travelling aboard a business
aircraft.
Some examples of business aircraft functionalities that can impact experience
quality include overall comfort, such as flight smoothness and seats’ comfort, reclining and
sliding capabilities; Cabin ambiance, such as enhanced natural lighting, due to larger-than-
competition windows, and cabin convenience, such as a phone application allowing the
user to control cabin lighting and temperature; The overall quality and accessibility of
onboard amenities, such as fast Wi-Fi and reliable satellite phones/televisions, and the
perceived level of luxury associated with the internal and external completion work, which
includes veneers, leathers, carpets, china and paint job quality, along with the overall cabin
design. Personal attention, and the level of courtesy and confidentiality offered by the
manufacturer’s sales team and employees, pre-and post-purchase, also play an important
role in establishing consumer experience quality (Verhoef et al., 2009).
In regards to the concept of service quality, its definition is considerably different
than the one of experience quality. This concept is described as being considerably more
objective, and its evaluation is a lot more attribute-based and focused on the external
service environment. The scope of service quality is also more specific, brings forth

32
functional and utilitarian benefits, and its psychological representation is described as
being cognitive and attitudinal (Otto and Ritchie, 1996 and Chen and Chen, 2010). Carman
(1990) study was one of the first to demonstrate that consumers tend to break service
quality dimensions into multiple subdimensions, showing the complexity of human
perception when it comes to evaluating service quality. It must be noted that such service
quality dimensions will be described further in this subsection.
Grönroos (1984) described a service as being immaterial and characterizes it as an
activity where production and consumption occur almost simultaneously. A few years later,
Grönroos (1988) refined his view of what constitutes a service by stating that, in order to
be qualified as a service, four basic characteristics must be identifiable. More precisely,
services are relatively intangible, are activities or series of activities rather than things, are
produced and consumed simultaneously, and the customer must participate or be involved
to some extent in the production process. It is important to note that this last characteristic
is in line with a more recent study realized by Vargo and Lusch (2006) which states that
“the customer is always a co-creator of value” (p. 2). Grönroos (1984) also described
service quality as being separable into two distinct dimensions: functional and technical
quality. He described functional quality as being the expressive performance of a service
answering the question of how the consumer receives the service. On the other hand,
technical quality is the instrumental performance of a service, and describes what the
consumer receives as a consequence of his interaction with the company (Grönroos, 1984).
One of the first models used to measure service quality was Grönroos’ (1984)
Nordic Model, which compared the expected to the perceived service performance using
the two-above-mentioned functional and technical quality dimensions. The SERVQUAL
Model was then conceived by Parasuraman, Zeithaml and Berry (1988), which also
compared expected to perceived service performance, however, according to five
dimensions being reliability, responsiveness, empathy, assurances and tangibles. Many
other service quality models (cf. figure 6) then followed these first two, such as Rust and
Oliver’s (1994) Three-Component Model, Dabholkar, Thorpe and Rentz’s (1996) Multi-
level Model, Brady and Cronin’s (2001) adapted SERVQUAL model involving three
dimensions and nine subdimensions, and more recently Petrick and Backman’s (2002)
SERV-PERVAL scale which includes five specific dimensions: quality, monetary price,

33
non-monetary price, emotional response and reputation (Brady and Cronin, 2001 and Chen
and Chen, 2010).
The literature therefore indicates that several authors have attempted to improve the
measurement’s efficiency of service quality by adapting older models and conceiving new
ones, over the last few years. This said, no particular model seems to be predominantly
preferred by academics, and the quest to conceive a globally accepted one continues.
Service quality associated with certain specific services, such as after-sales support,
can also influence overall customer satisfaction, repurchase intentions, and relationship
quality (Rigopoulou et al., 2008). It must also be mentioned that service quality is perceived
by some authors as being an integral part of the overall experience quality (Astrapellos et
al., 2010). The unification of both experience and service quality concepts gave birth to the
concept of service experience (Otto and Ritchie, 1996). Such concept is described by Otto
and Ritchie (1996) as being a holistic, multidimensional measurement of customers’
reactions and feelings in response to a specific service. In light of this finding, this research
will assume that service quality can be characterized as a part of the more holistic
experience quality concept.
Figure 6: Brady and Cronin (2001) Service Quality Literature
Conceptualizations

34
Examples of specific business aircraft customer services include enhanced sales
force and employees’ availability, and going above and beyond customers’ expectations
by providing them with free demonstration flights and access to air shows; Providing
customers with business planning solutions, which allows them to better understand their
needs and select the most appropriate aircraft model; Extensive and courteous after-sales
support worldwide, convenient worldwide maintenance programs, access to an extensive
worldwide network of pilots and crew members, and premium services at certain regional
airports, such as fueling, parking and catering VIP priority.
In conclusion, this research defines experience quality as an intangible concept,
which tends to be subjective in terms of measurement and is evaluated holistically. It
must be noted that its evaluation is self-centric, as it is based on personal past experiences
and knowledge. Perceived benefits originating from such concept are affective,
experiential and symbolic in nature. These benefits may lead to an emotional impact that
can ultimately cause various personal changes, depending on the perceived quality extent
of such benefits by the consumer. A few examples of business aircraft functionalities and
aspects that can positively or negatively influence experience quality are flight
smoothness, perceived level of luxury and the overall degree of courtesy demonstrated by
the manufacturer’s sales team and employees.
In regard to the concept of service quality, this research defines it as being
considerably more objective than the one of experience quality, and its evaluation is a lot
more attribute-based and focused on the external service environment. The scope of
service quality is also more specific, brings forth functional and utilitarian benefits, and
its psychological representation can be described as being cognitive and attitudinal. In
order to accurately evaluate a service’s quality, and both of its technical and functional
quality dimensions, it must be definable as an intangible activity or series of activities
produced and consumed simultaneously, in which the customer must participate or be
involved to some extent in its production process. Service quality is also an integral part
of the more holistic experience quality concept. Some examples of business aircraft
customer services include business planning solutions, ever-ready after-sales support, and
access to an extensive worldwide network of pilots and crew members.
35
1.5.4.2 Product Performance
Companies or customers who decide to purchase a high-involvement product, such
as a business aircraft, need to reflect on many performance-related aspects, prior to signing
a manufacturer’s purchase agreement. Indeed, their predicted usage of the product will
affect their performance requirements. For example, a customer who frequently makes
business trips to London City, England, will require his aircraft to be qualified for steep
approaches, in order to be able to land at this specific airport where many business or
commercial aircraft are technically unable to. Supplementary examples of business aircraft
performance-related aspects will be provided further in this subsection. Furthermore, it is
important to mention that pre-purchase expectations acquired or formed during a previous
business aircraft usage will also positively or negatively influence product performance
satisfaction. A look at the existing literature will allow this research to appropriately define
the concept of perceived performance and elaborate on the influential role it plays in
determining overall consumer satisfaction for B2B high-involvement products.
Zeithaml (1988) stated that products are often chosen solely according to an
evaluation of their extrinsic cues. However, and as mentioned earlier in this research,
purchasing a high-involvement product such as a business aircraft requires a longer, harder,
riskier, and more complex process. According to Clark and Belk (1978), consumers will
usually spend more time looking for product information in the case of high-involvement
products, in order to make a wise purchase decision and reduce the risks associated with it.
Therefore, an evaluation of intrinsic cues also needs to take place. In order to provide
further clarification, extrinsic cues usually relate to physical product-related aspects, such
as for example wing span, whereas intrinsic cues may relate to financial aspects of the
product or its impact on a company’s profitability. This is in line with Slack’s (1991) study
stating that there are internal and external reasons to pursue a specific course of action.
Cronin and Taylor (1992) demonstrated that customers who used direct
performance assessments provided clearer evaluation measurements than those who used
expectations assessments. Indeed, this statement is supported by Neely, Gregory and Platts
(1995) who claimed that the act of measuring and quantifying knowledge is more
satisfactory than hypothetical and qualitative statements pertaining to one particular topic.
The authors also conceived a performance measurement system, in order to effectively

36
quantify the efficiency and effectiveness of actions, which in themselves represent and lead
to performance.
Selnes (1993) also indicated that customers need norms, or comparison standards,
in order to evaluate what is good from mediocre. In this regard, Cadotte et al. (1987)
identified two different types of norms. The first one being the normal perceived
performance of a specific brand, and the second one being the average perceived
performance for a group of similar brands in a determined product category. This second
norm therefore implies that customer experience and knowledge related to a specific
product class may be an important performance determinant and play an important role in
the way customers judge product performance. This is where prior experiences come into
effect and have an influential role on perceived or required product performance.
As mentioned by Neely, Gregory and Platts (1995), performance is a topic that is
often discussed, but not often specifically defined. According to Kotler (1984), the action
of performing refers to a company satisfying its customers, by offering them more
efficiency and effectiveness than its competitors. In this case, the term efficiency relates to
reducing costs and improving profitability, whereas the term effectiveness relates to
product reliability, which can lead to enhanced customer satisfaction (Neely, Gregory and
Platts, 1995). Therefore, it can be inferred that product performance leads to enhanced
effectiveness and efficiency, which can in turn positively impact customer satisfaction.
Some examples of product performance aspects related to business aircraft include range,
maximum takeoff weight, landing and takeoff distance, fuel efficiency, included avionics
suite, seat configuration, maximum speed, cruising speed, and maximum operational
ceiling.
In conclusion, this research defines the concept of product performance as actions
that can both be quantifiable and accomplished by a specific product, which has been
chosen following a thorough evaluation of its extrinsic and intrinsic cues, according to
specific comparison norms, and that lead to enhanced effectiveness and efficiency capable
of positively influencing customer satisfaction.

37
1.5.4.3 Perceived Value and Premium
Current literature defines consumers’ perceived value in a variety of ways. Indeed,
companies purchasing a high-involvement product, such as a business aircraft, also wish to
obtain product value, in order to not only be able to justify its purchase, but also gain a
competitive advantage over their competitors. As stated by Holbrook (1994), customer
value is “the fundamental basis for all marketing activity” (p. 22). It can be argued that the
equity theory represents the foundation of perceived value, as it considers the proportion
of the consumer’s outcome and input to that of the manufacturer’s outcome and input
(Oliver and DeSarbo, 1988). More precisely, Snoj, Korda and Mumel (2004) stated that
customers purchase products to satisfy some of their needs. In other words, they do not
only purchase a product but a combination of attributes which ultimately derive benefits
and value. Finally, the total disutility represented by the sacrifices that were required to
obtain the product must be subtracted. The benefits provided by such product can either
originate from external, internal, intrinsic and extrinsic product attributes, and the sacrifices
required can be represented by the product’s nominal price and all of the other costs related
to its usage (Zeithaml, 1988; Sweeney et al., 1999; Slater and Narvey, 2000; Ulaga and
Chacour, 2001).
Following a similar line of thought, Zeithaml (1988) defined the concept of
perceived value as “the consumer’s overall assessment of the utility of a product based on
perceptions of what is received and what is given” (p. 14). Lovelock (2000) pushed this
definition further by describing value as a trade-off between benefits and perceived costs.
Snoj, Korda and Mumel’s (2004) study accurately summarized several authors’ definitions
of the perceived value concept and accurately identified some of their commonalities. More
precisely, four common aspects were identified. First, a consumer perceives a product’s
value according to his knowledge of its purchasing process and usage. Second, a product’s
value cannot be defined by the organization that manufactures or provides it, as it can only
be defined by consumers’ perception of it. Third, the concept of perceived value is a
multidimensional one. Finally, a majority of the authors agree to state that perceived value
is a trade-off between benefits and sacrifices perceived by consumers in a manufacturer’s
offering.

38
Interestingly, it must also be noted that recent research indicated that perceived
value may represent a better prognosticator of repurchase intentions than product quality
or customer satisfaction (Cronin et al., 2000; Oh, 2000). Cronin et al. (2000), Dodds,
Monroe and Grewal (1991) and McDougall and Levesque (2000) also established that this
concept is an important precursor to behavioural intentions and customer satisfaction.
Bolton and Drew (1991) and Sirdeshmukh et al. (2002) studies also identified perceived
value as an important determinant of customer loyalty in different business sectors such as
commercial air travel, telecommunications and retailing.
Furthermore, the literature also indicates that several authors attempted to measure
perceived value, such as Gale’s (1994) self-reported unidimensional measure and Petrick
and Backman’s (2002) multidimensional scale. However, and as mentioned in Snoj, Korda
and Mumel’s (2004) study, researchers agree that a multidimensional scale is more
appropriate than a unidimensional one, as the measure of the latter one is often criticized
due to its supposition that consumers perceive value similarly. Petrick and Backman’s
(2002) five dimensions’ SERV-PERVAL scale is one out of many multidimensional scales
available to measure perceived value. More precisely, and as mentioned earlier in this
research, their scale is composed of five dimensions being emotional response, monetary
price, non-monetary price, reputation and quality (Chen and Chen, 2010).
Examples of some benefits and added value from owning and using a business
aircraft include enhanced flexibility and reliability of operations, important time savings,
increased productivity for executives, the ability to attract and retain key executives and
the ability to support customers in a more effective manner. The residual value of a business
aircraft can also be perceived as a benefit and therefore added value, due to the fact that
some specific aircraft models lose some of their financial value much faster than others.
Another concept similar to perceived value, and also relevant to this research is
called premium. This research established earlier that business aircraft are a luxury product,
but it is essential to distinguish the difference between luxury motivations and premium
reasons to purchase such a high-involvement product. Indeed, it can be easy to confuse
both types of purchase motivations. Although literature relating to the term premium is
scarce, Kapferer and Bastien’s (2012) book states that premium is not to be confused with
luxury, as it represents a more substantiated and cautious purchase process. Both authors
39
clearly defined luxury as a more irrational purchase process, in order to gain wealth, social
status and prestige. However, they defined premium as the willingness to pay a higher than
average monetary price for specific pragmatic reasons. It can therefore be inferred that
premium is a rational investment based on specific reasons and criteria, such as
performance, price, potential economy of time, affordability and enhanced convenience.
This being established, the earlier subsection of this research entitled Social Status
and Prestige demonstrated that it is possible for companies to exhibit luxury-related
purchase motivations. However, and as stated earlier in the case of a high-involvement
product purchase process, a thoughtful analysis must be performed, and specific criteria
established and fulfilled, prior to acquiring and transferring full ownership of the product
to its owner. A mix of luxury and premium purchase motivations is therefore possible,
especially in a B2B context where companies need to appropriately justify their decision to
purchase a complex and expensive product like a business aircraft. It must also be noted
that the power of a B2B brand or company originates from its capability to substantially
add value at a minimized level of corporate risk; thus, allowing it to gain a medium to long-
term competitive advantage over its close competitors. This is how premium, which
involves a considerate amount of time and caution when purchasing a product, allows
companies to fulfill such objective.
In conclusion, this research defines the concept of a product’s perceived value as a
trade-off between benefits and perceived costs that is influenced by consumers’ knowledge
of its purchasing process and usage. Such concept also represents an accurate indicator of
repurchase intentions, acts as a precursor to customer satisfaction, and represents a
determinant of customer loyalty. Finally, a product’s perceived value cannot be defined by
its manufacturer, as it can solely be attributed according to customers’ perception of it.
In regards to the concept of premium, it encompasses a more substantiated and
cautious purchase process than a luxury-related product. More precisely, it represents the
willingness of consumers to pay a higher than average monetary price for pragmatic
reasons. In other words, it can be defined as a rational investment based on criteria such as
performance, price, economy of time and convenience. It must also be stated that Premium
provides companies with the ability to add value at a minimized level of corporate risk;

40
thus, allowing them to gain a medium to long-term competitive advantage over their close
competitors.
1.5.5 Product Attributes Satisfaction
As stated earlier, business aircraft can be classified as high-involvement products.
As such, they contain a vast range of product attributes. Oliver (1993) states that consumers
are exposed to a concept entitled attribute experience, which consists of perceiving
different service or product features and comparing their attribute performance using
“satisfaction units.” From these observations then results the concept of attribute
satisfaction, which Oliver (1993) describes as being the “psychological fulfillment
response consumers make when assessing performance” (p. 421). Spreng, MacKenzie and
Olshavsky (1996) support Oliver’s (1993) statement and also define attribute satisfaction
as “the consumer’s subjective satisfaction judgment resulting from the observations of
attribute performance” (p. 17).
Martin (1998) also interestingly highlights that high-involvement and relationship-
prone products tend to have specific product attributes in common. The author was able to
identify ten attributes, more precisely nostalgic value, uniqueness, price risk, association,
quality and excellence, sensory appeal, personification, sign value, interactivity and
facilitation. Some of them, such as uniqueness, price risk, quality and excellence,
personification and sign value can easily be associated with a high-involvement product
like a business aircraft. Indeed, customers have the ability to highly personalize their
aircraft, which makes every one of them a unique, high-value and luxurious quality product
that sells at a high price tag.
This research focuses on three distinct types of product attributes satisfaction. More
precisely, product attributes satisfaction related to comfort and luxury, performance and
offered services will be analyzed, in order to determine their influence on overall consumer
satisfaction for B2B high-involvement products. Product attributes related to comfort and
luxury can be defined as product features enhancing consumers’ level of comfort and
influencing their perception of luxury. In line with the earlier subsection of this research
addressing perceived value and premium, Sheth et al. (1988) and Vickers and Renand
(2003) indicated that the status value associated with luxury products is usually perceived
as the most important aspect influencing the selection of such type of products. It can

41
therefore be inferred that the satisfaction level related to comfort and luxury product
attributes play an influential role in the consumers’ purchase decision. Examples of such
type of product attributes include exclusive types of leather, veneer and carpeting inside
the cabin, extensive porcelain ensembles, multiple screen displays, entertainment systems,
wider seats, increased legroom and high-speed wireless internet accessibility.
Product attributes related to performance can be defined as product features directly
influencing the aircraft performance, such as increased engine thrust, state of the art avionic
equipment, enhanced wing flexibility, steep approach capability and available head-up
display. It must also be mentioned that such product attributes lead to enhanced
effectiveness and efficiency capable of positively influencing customer satisfaction, as
mentioned earlier in this research’s subsection regarding product performance.
Finally, product attributes related to offered services can be described as any
features directly or indirectly capable of having an impact on the perceived service quality
associated with the purchase of a business aircraft. There exists a rationale behind the
decision of business aircraft manufacturers to offer such type of product attributes. Indeed,
the available literature, along with Oliva and Kallenberg’s (2003) study, demonstrated that
manufacturers as a whole need to integrate more services into their core offerings for three
specific reasons. First, Anderson et al. (1997), Knecht et al. (1993), Potts (1988) and Quinn
(1992) proved that services tend to generate higher margins than products, important
revenue streams from products with a long-life cycle, such as business aircraft, and tend to
provide a more stable source of revenue due to their resistance to economic cycles. Second,
customers are constantly seeking more services (Oliva and Kallenberg, 2003). Third,
Heskett et al. (1997) stated that services represent a sustainable source of competitive
advantage as they are much harder to imitate than products, which constitutes an essential
strategy for players evolving in such a competitive industry like business aviation.
A few examples of service product attributes related to the purchase and usage of a
business aircraft include an efficient and courteous after-sales support, a personalized
approach during the purchasing process, enhanced service quality and rapidity at service
centres, and a favoured treatment at certain airports in regards to parking and fuelling
priority, along with a special access for crew members at the lounge.

42
In conclusion, this research defines the concept of product attributes satisfaction as
the consumers’ assessment of different services or product features, which relate to the
concept of attribute experience, in order to ultimately be capable of comparing their
attribute performance using “satisfaction units.” From such assessment then results a
psychological fulfillment response and satisfaction judgment from the consumers involved.
1.5.6 Information Satisfaction
As mentioned earlier in this research and taking into consideration that business
aircraft constitute high-involvement products, consumers will spend more time looking for
product information, in order to make a wise purchase decision and minimize associated
risks (Clark and Belk, 1978). This said, Spreng, Mackenzie & Olshavsky (1996) describes
information satisfaction as the satisfaction judgment of the information used, when
choosing a specific product or service. They claim such information usually originate from
a company’s marketing communications efforts, and from various other sources such as
personal selling, advertising campaigns, corporate websites and social media.
This research will assume that information satisfaction can be influenced by three
specific variables. As such, personal selling, word-of-mouth (WOM) communication, and
external experts involved in the purchasing process on the customer’s side, such as external
sales representatives, consultants, brokers, operators, specialized lawyers and chief pilots’
influence on information satisfaction will be examined. Knowledge pertaining to these
sources of information will be deepened thanks to an exhaustive literature review, and their
influence on information satisfaction analyzed. It will then be possible to use this analysis
to measure the extent of the influence of information satisfaction onto overall consumer
satisfaction for B2B high-involvement products.
1.5.6.1 Personal Selling
As stated by Spreng, Mackenzie & Olshavsky (1996), personal selling may
positively or negatively impact overall information satisfaction. This subsection aims at
examining the existing academic literature related to the sale of luxury and high-
involvement products in a B2B context, which can be closely associated with the purchase
process of a business aircraft. Such examination aims at identifying and deepening
knowledge regarding current and potential sales techniques and strategies that could be
used by global business aircraft manufacturers.

43
First of all, it is imperative to define what the concept of personal selling stands
for. According to Tanner and Raymond (2010), current marketing literature is consistent
in defining this concept as an “interactive, personal, paid promotional approach between a
buyer and seller” (p. 222). However, Dixon and Tanner’s (2012) research points out that
field practitioners had a difference of opinion with researchers regarding this definition, as
practitioners believed that sales should be considered a non-linear phenomenon.
Consequently, both parties agreed that a broader definition was required, in order to take
into account the evolution of sales throughout the past years. More precisely, Rackham
(2011) demonstrated that simple products do not require a salesperson to be involved in
the selling process anymore, as technology can easily replace them. However, more
complex products still require a salesperson to be involved. As a result, the author claimed
that the selling field is being split into two different categories; one requiring technology
to enable sales transactions, and one requiring a co-creation process within the different
actors involved in the personal selling process.
Consequently, Dixon and Tanner’s (2012) research defines personal selling as “the
phenomenon of human-driven interaction between and within individuals/organizations in
order to bring about economic exchange within a value-creation context” (p. 10). As
mentioned before, such broader definition allows for more parties to get involved, and also
to include different selling processes, such as the ones involving technology. Due to the
complexity and multitude of processes involved in the selling process of a business aircraft,
this research will use some parts of Dixon and Tanner’s (2012) definition of personal
selling.
When it comes to the literature pertaining to luxury selling, many articles and
research seems to have been done in a B2C context, but it was impossible to identify any
that had taken place in a B2B context. Consequently, such finding highlights the novelty
of this research’s topic. Secondly, literature pertaining to the sales of high-involvement
products in a B2C context is quite sparse, but inexistent regarding sales of high-
involvement products in a B2B context. This said, Patterson’s (1993) article highlights
some interesting principles that may be applied to the selling process of B2B high-
involvement products. Even though this author’s research regard consumer satisfaction
following a high-involvement purchase, he claims dissatisfaction is most often caused by

44
after-sales services, and those companies’ sales departments play an important role in
raising customers’ expectations about their brand, which can be either helpful or hurtful
depending on the product’s performances (Patterson, 1993). Thus, it could be inferred that
after-sales services should not be omitted or underestimated as they play a crucial role in
determining overall consumer product satisfaction, and sales departments should be careful
not to raise consumers' expectations to a point where they cannot be met as it could
negatively impact overall consumer satisfaction. Finally, the author also mentions that
concessions from sales departments can be a good way to directly influence consumers
disconfirmation and compensate for certain negative occurrences that may have taken place
during the selling process (Patterson, 1993).
In regards to B2B selling processes, Åge (2011) interestingly suggests a new
conceptual model encompassing the need for organizational salespeople to adapt to new
technologies, the strategic role of selling within organizations, more frequent team-based
approaches to selling, increased buyer knowledge, and increased emphasis on long-term
relationships with customers. The author’s model includes four categories, respectively
being business standardization, business fraternization, personalization and probationary
business rationalization. The first category, business standardization, can be defined as all
formal and standardized organizational activities that take place during the selling process.
Such of these activities are described by the author as being a hindrance to the development
of business relationships, as they favour a standardized over a more personalized approach
to understanding the needs and problems of the customer, which may demonstrate a lack
of interest or empathy from the seller.
The second category, business fraternization, can be defined as the way two or more
parties develop a business relationship based on respect and understanding, in order to
work towards the accomplishment of a mutual goal. Such relationship can either be
internal, which means that all of the parties involved work within the same large
organization, or external, which denotes that one or more of the parties involved do not
work as part of the same organization as the seller or buyer. This step emphasizes the need
for all parties to be working closely, to trust each other, to know as much as possible about
each other’s marketplace and industry, and to continuously learn from each other.

45
The third category, personalization, refers to all activities related to the attitudes
and dispositions of the parties involved. More precisely, it encompasses aspects such as
how personal relationships may affect the selling process, the seller’s ability to change the
buyer’s perspective and attitude to its products and solutions, the level of trust between all
parties, and the importance of salespeople to have personal selling skills along with an
ability to carefully listen to all the needs of the buyer.
Finally, the last category of Åge’s (2011) B2B selling conceptual model,
probationary business rationalization, can be defined as the ability of all parties involved
to optimally reduce the total cost, financial risk, and operational risk related to the ongoing
transaction, both for the buyer and seller. It must also be mentioned that all of these
mutually dependent and complimentary categories all held together by the concept of
business manoeuvring, which can be defined as the seller’s ability to manoeuvre differently
throughout each of these categories every time they deal with a new buyer, in order to
increase its chances of successfully closing the transaction by more accurately dealing with
all of the transaction’s details, and by offering the buyer a truly personalized purchasing
experience. This proposed model also supports Dixon and Tanner’s (2012) claim that
personal selling should be perceived as a non-linear phenomenon.
Hartmann, Wieland and Fargo’s (2018) research entitled Converging on a New
Theoretical Foundation for Selling also brings forth several interesting aspects pertaining
to personal selling, high-involvement products, and even customer satisfaction. Similarly
to Dixon and Tanner’s (2012) article, the authors also pointed out that increasing market
complexity, technological advancements, a higher number of offerings, and customers’
access to information, just to name a few, contribute to the need for a more robust
theoretical selling foundation that better explains the role of sales in value co-creation,
along with a more holistic approach in sales research and practise (Hughes, Le Bon and
Malshe, 2012; Rapp et al., 2017). Relying on concepts from Baldwin’s (2008), and
Baldwin and Clark’s (2000) research, Hartmann, Wieland and Fargo (2018) introduces the
existence of “thin” and “thick” crossing points from a sales perspective. More precisely,
thin crossing points refer to “a location at which a service can efficiently be exchanged for
service” (p. 3) or at which an exchange of service can be done through simple interactions
(Hartmann, Wieland and Fargo, 2018). Based on this definition, an example of a thin

46
crossing point could be the online purchase and home delivery of an item via a popular
sales platform, such as Amazon or Ebay. On the other hand, the authors describe thick
crossing points as requiring the formation of deeper and more complex interactions
between all of the actors involved in a transaction, as common ground design rules may
not yet have been established; such common ground design rules being the various norms,
representations, and even rules that guide exchange practises related to a particular product
(Kjellberg and Helgesson, 2006). Thick crossing points can also be associated with
discontinuous solutions and emergent markets (Hartmann, Wieland and Fargo, 2018).
Based on these definitions, it could therefore be assumed that the selling process of
high-involvement products, such as a business aircraft, can be associated with the concept
of thick crossing points, due to the fact that such transactions consistently require the
cooperation of many different actors and the implementation of many unique solutions. In
this case, the authors refer to a service ecosystems perspective of sales, which is in fact an
overlapping of different institutional arrangements, the involvement of a broad set of actors
who communicate differently and use a various array of tools, a phenomenon of value co-
creation, salespeople limited ability to change the way buyers act and think, and an
exchange of information amongst all actors which results in the formation of mutually
beneficial relationships (Hartmann, Wieland and Fargo, 2018).
In addition, the authors highlight the fact that thick crossing points consistently
evolve to become thin crossing points over time, due to technological advancements and
changes in the market place. Furthermore, a combination of thick and thin crossing points,
as part of one sale offering, can also be considered a competitive advantage, as it can lead
to a reduction of the total number of competitors. Finally, their research highlights the fact
that it can sometimes be beneficial for salespeople to lose sales if their offering is not as
good as the one of a competitor, in order to leave a good impression of their brand, which
in turn affects customers’ perception of the thick and thin crossing points their company
has to offer (Hartmann, Wieland and Fargo, 2018).
The rise of the influence of social media also has an important role to play regarding
customer satisfaction in B2B personal selling. As mentioned by Agnihotri et al. (2016),
social media not only provides salespeople with a means to communicate more
responsively with their customers, but also to provide them with a more positive experience

47
that meets their expectations; thus, leading to a higher level of customer satisfaction in a
B2B context. This is especially important as the rising level of cooperation, knowledge and
value co-creation between customers and manufacturers has placed customers on a similar
footing with sellers (Greenberg, 2010). This statement is in line with Dixon and Tanner’s
(2012) research that puts forth the fact that value creation is a direct result of personal
selling. Social media therefore represents a way for B2B firms and their sales force to
adapt to customers’ increasing expectations (Hibbert, Winklhofer and Temerak, 2012).
In conclusion, this research defines the concept of personal selling as a human-
driven interaction within individuals and/or organizations, in order to create not only an
economic exchange within a value co-creation context, but also thin crossing points
through the alignment of organizational arrangements and the optimization of relationships
(Dixon and Tanner, 2012; Hartmann, Wieland and Fargo, 2018). It was also possible to
associate the selling process of high-involvement products to the concept of thick crossing
points, which can be defined as exchange locations requiring the formation of deeper and
more complex interactions between all of the actors implicated in the selling process.
In addition, a new B2B selling conceptual model conceived by Åge (2011) was
described. This model encompasses four categories that could allow organizational
salespeople to optimize their performance and adapt to today’s complex and dynamic B2B
selling processes. Finally, it was established that salespeople need to create and maintain
strong relationships with all actors involved in the transaction, as today’s sales environment
can be described as a service ecosystem in which value co-creation is of the utmost
importance for all organizations and/or institutions implicated (Hartmann, Wieland and
Fargo, 2018).
1.5.6.2 Word-of-Mouth Satisfaction
The global business aircraft industry can also be defined as a niche market, where
most key players and primary actors, such as top executives from each major manufacturer,
usually know each other on a personal basis. Most secondary actors, such as external sales
representatives, aviation consultants, brokers, and operators, also detain a certain level of
notoriety in their respective field and often interact with each other. Therefore, word-of-
mouth (WOM) plays a critical role in such type of close-knit business environment not only
for primary and secondary actors, but also for current and potential buyers. Indeed,
48
referencing plays an important role for manufacturers’ sales departments in their attempt
to reach out to a greater number of potential customers. Furthermore, WOM may also have
the influence to either positively or negatively impact overall customer satisfaction for B2B
high-involvement products, such as business aircraft.
An in-depth look at the current WOM literature demonstrated that most of the
current academic literature focused on retail sales, except some that examined the impact
of WOM in the case of high-involvement products purchase, and how customer satisfaction
may be positively or negatively influenced.
As defined earlier in this research, WOM refers to any opinions shared online or
physically, between two or more consumers, regarding past user experiences and current
or past product reviews (Gu, Park and Konana, 2012). According to Gu, Park and Konana
(2012), two main types of WOM information exists, more precisely internal or external
word-of-mouth. Internal WOM is hosted by retailers and usually originates from
salespeople or sales-related information sources, such as a company’s website, brochures
or specification sheets. On the other hand, external WOM is hosted by third-party
intermediaries, such as websites specialized in product reviews or independent consultants
or experts.
Gu, Park and Konana (2012) mentioned that consumers’ willingness to research
pre-purchase information can suggest that external WOM may have a significant influence
on sales of high-involvement products, which can be described as durable products with
complex functionality, high price, and long life. Three reasons can explain why external
WOM sources have a greater influence on sales than internal sources. First, Tedeschi (2006)
demonstrated that such type of WOM source enjoys a better recognition and reputation as
a product information source. Second, they are usually more specialized, offer greater
depth, and more insights about complex products (Gu, Park and Konana, 2012). Finally,
the authors also state that external WOM sources can not only provide regular product
reviews from existing users/customers but also ones from professionals and experts, which
are often perceived as more credible in the eyes of customers. Interestingly, the results from
Gu, Park and Konana’s (2012) research indicated that consumers have most often already
made up their minds about the purchase of a high-involvement product, when they reach or

49
contact a retailer/manufacturer, which also indicates that the influence of internal WOM
sources is limited when it comes to purchasing such type of product.
Bowman and Narayandas (2001) also claimed that WOM engagement is correlated
with a firm’s customers’ loyalty and their level of satisfaction with its products. Indeed,
the authors stated that loyal customers are more likely to engage in negative WOM, when
they are dissatisfied with the company’s products. However, this statement is far from
being unanimous in the existing literature, as multiple other researchers claimed that loyal
and satisfied customers will instead engage in positive WOM (Swan and Oliver, 1989;
Westbrook, 1987). Several other authors also demonstrated that consumer satisfaction is
expected to impact the likelihood to engage in WOM and the number of referrals given
(Anderson, 1998; Wangenheim and Bayon; 2007). It can, therefore, be established that
there exists a strong link between consumer satisfaction and consumers’ likelihood to
engage in WOM.
The concept of product involvement, which can be defined as the degree to which
a person finds a product relevant, has also been proven to impact the probability to engage
in WOM (Dichter, 1966; Richins and Bloch, 1986 and Westbrook, 1987). In addition,
Wangenheim and Bayon (2007) also proved that newly acquired customers will be more
likely to engage in positive WOM and provide referrals, as their average level of
satisfaction was found to be greater than the one of medium and long-term customers.
Finally, companies or manufacturers willing to invest in buzz management, which can be
defined as the proactive creation of WOM, as part of their promotional and referral
strategies should use a wide variety of sources, due to the fact that outreach efficiency
increases proportionally to the number of sources used (Godes and Mayzlin, 2004).
As Herr, Kardes and Kim’s (1991) research puts forth, WOM can exert a strong
influence on customers’ judgment of products. However, the authors also mentioned that
vividly accessible product information has a greater influence on judgment than WOM, and
the accessibility of printed negative diagnostic information will also critically reduce the
influence of WOM on product judgment.
Academic literature also describes the concept of electronic WOM (eWOM) as
having a strong influence on companies’ sales performance. This concept can be defined
as the communication of product information to customers via the Internet and becomes
50
increasingly important as B2B sales teams are increasing their social media usage, as
mentioned in the previous subsection of this research (Rosario et al., 2016). Indeed, many
authors proved that eWOM has a significant monetary effect on sales excluding other
marketing mix effects (Chen, Wang and Xie, 2011; Chevalier and Mayzlin, 2006; Moe and
Trusov, 2011). However, it must be noted that such research were done in a B2C context,
and results may vary in B2B context. Nevertheless, Rosario et al. (2016) proved that for
products with a higher financial risk, such as high-involvement ones exchanged in a B2B
context, eWOM can have a strong positive impact on a company’s sales performance when
product reviews were prominently displayed on platforms imposing higher posting costs.
In conclusion, this research defines the concept of word-of-mouth as any opinions
shared online or physically, between two or more consumers, regarding past user
experiences and current or past product reviews. Two types of WOM were also described,
more precisely internal and external word-of-mouth. The concept of electronic word-of-
mouth is also defined as the communication of product information to customers via the
Internet. According to the literature, the way customers engage in both of these concepts
can be linked and thought to be influenced by the previously defined concept of consumer
satisfaction, their level of loyalty towards a specific company, and their level of product
involvement; defined as the degree to which a customer finds a product relevant. Both
forms of WOM are also known to have an influence on a company’s sales performance, its
customer acquisition or referral process, and more generally on its customers’ product
judgment/evaluation.
1.5.6.3 External Experts’ Involvement
As mentioned in the personal selling subsection, this research assumes that the sale
of a B2B high-involvement product requires a process of value co-creation by both seller
and buyer. This therefore implies that many actors may be involved simultaneously in the
purchasing process of such type of product. As mentioned by Weitz and Bradford (1999),
and Wotruba (1991), contemporary selling negotiations usually involve multiple actors,
and “an increasing emphasis on collaborative relationships between sellers and buyers has
complicated the traditional transaction-based selling process” (Åge, 2011; p. 1574). Often
times, some of these actors happen to be assisting the buyer during the purchasing process,
51
as he may be a first-time buyer and requires guidance or might also necessitate different
experts’ opinions about the product and its competitors’ offerings.
Some of the actors involved in the purchasing process on both the buyer or seller’s
side of the transaction are known as external experts. More precisely, these experts have
no official affiliation with either the buyer or the seller and conduct their business
independently from them. In the case of the purchasing process of a business aircraft, many
external experts may be involved simultaneously, on both the buyer and the seller’s side of
the transaction. However, and for the purpose of this research, a particular emphasis will
be placed on the experts involved exclusively on the buyer’s side. A few examples of
external experts evolving in the business aircraft industry include external sales
representatives, aviation consultants, brokers, aircraft operators, specialized lawyers and
chief pilots. Some of them may sometimes be involved on the seller’s side of the
transaction, but it is a much rarer occurrence as large organizations such as global business
aircraft manufacturers usually have access to a plethora of resources internally. It is
believed that these external actors could play a role in shaping overall customer satisfaction
for B2B high-involvement products like business aircraft.
Indeed, such experts have the capability to positively or negatively influence a
customer’s expectations in regards to a product’s performance and experience, its
perceived value, and the quality of service offered by its manufacturer. As described earlier
in this research, raising or lowering the buyer’s expectations will also affect his
disconfirmation of expectations process. More precisely, Patterson (1993) proved that a
customer’s satisfaction is directly linked to “the size and direction of the disconfirmation
experience” (p. 451). He also claimed that disconfirmation can be related to the consumer’s
initial expectations about a specific product’s performance or attributes (Patterson, 1993).
Therefore, this research assumes that external experts could not only influence a customer’s
information satisfaction during the selling process, but also his overall satisfaction of a
B2B high-involvement product.
Although current academic literature regarding the involvement and the impact of
external experts on overall customer satisfaction is quite sparse, and almost nonexistent,
some articles do mention the influence of external actors/experts during the selling process.
This influence can then be implied to play an important role in shaping not only a

52
customer’s information satisfaction, but also his overall satisfaction, due to the reasons
described earlier in this subsection. Relying on research completed by Bolander et al.
(2015) and Plouffe et al. (2016), Hartmann, Wieland and Fargo (2018) emphasize the
importance of external actors to selling and sales processes, as they can either engage in
institutional maintenance by promoting the benefits of a product or a solution to buyers or
do the opposite and push the buyers towards a different product/solution. These authors
also claim that the participation of these external actors/experts play a crucial role in
various organizations’ selling processes, and even propose that new platforms be created
in order to amplify their influence on buyers (Hartmann, Wieland and Fargo, 2018).
In conclusion, this research assumes that external actors/experts play an important
role in organizations’ selling processes, and have the ability to either positively or
negatively influence customers’ information and overall satisfaction for B2B high-
involvement products, by either raising or lowering their expectations towards a product’s
performance, experience, and value; thus, consequently affecting buyers’ disconfirmation
of expectations mental process, which has been proved to play a crucial role in determining
their overall level of satisfaction.
1.6 Conclusion
This chapter and literature review introduced various concepts, definitions,
theoretical components, and previous academic researches, along with their respective
conceptual models, necessary to not only identify the gaps between previous academic
studies and this research, but also help the reader understand the multitude of concepts that
support and motivate the completion of such research. For clarification purposes, and in
order to recap every concept definition examined during this chapter, the following table
regroups all of such definitions together (cf. Table 1):
Table 1: Concept Definitions Recap Table
Concept Examined Definition
Consumer Satisfaction A summary affective response of varying intensity directed at specific
moments of product acquisition and consumption.
High-Involvement Products Products that have the capability to influence a consumer’s emotions and
desires, are more durable and complex, and involve a longer, riskier and
intricate purchasing process in comparison to low-involvement products.
Negative Disconfirmation Perceived product performance inferior or smaller than consumer
expectations, which results in consumer dissatisfaction.
Positive Disconfirmation Perceived product performance equal to or larger than consumer
expectations, which results in consumer satisfaction.

53
Table 1: Concept Definitions Recap Table (Continued)
Concept Examined Definition
Expectations The probability of an event’s occurrence, followed by its evaluation
consisting of determining its associated level of “goodness” or
“badness”.
Desires Stable and present-oriented product attributes or benefits that are either
associated with specific higher-level values/needs or lead to their
fulfillment.
Product Attributes’
Satisfaction
A consumer’s assessment of different services or product features that
relate to the concept of attribute experience, in order to ultimately be
capable of comparing their attribute performance using “satisfaction
units”, which results in a final satisfaction judgement.
Information Satisfaction The satisfaction judgment of the information used, when choosing a
specific product or service.
Expectations’ Congruency The consumer’s subjective assessment of the comparison between his or
her expectations and the performance received.
Desires’ Congruency The consumer’s subjective assessment of the comparison between his or
her desires and the performance received.
Social Status
The position of an individual or company in society or a specific group,
awarded by others, according to its level of power and prestige
engendered by a higher position compared to others on important
cultural dimensions, such as wealth and success.
Prestige Concept associated with high-involvement products exhibiting
perceived conspicuous, unique, social, hedonic and quality values; thus,
procuring its owners enhanced social approbation.
Convenience
A product attribute or characteristic that reduces its non-monetary cost
by allowing its users to save on resources such as effort and
opportunity, to buy time, and to benefit from added value by being more
efficient, which consequently improves their overall quality of life.
Experience A mix of sensory information originating from encounters with products
or services that has an affective influence on a person’s emotions and/or
senses before, during, and after a transaction.
Experience Quality
An intangible concept, subjective in terms of measurement and
evaluated holistically. Its evaluation is self-centric, as is based on
personal past experiences and knowledge. Perceived benefits are
affective, experiential and symbolic in nature, and may lead to an
emotional impact that can ultimately cause various personal changes.
Service Quality
An intangible activity or series of activities produced and consumed
simultaneously, in which the customer must participate or be involved
to some extent in its production process; More objective than experience
quality, and more focused on the external service environment.
Product Performance
Actions that can be quantifiable and accomplished by a specific product
chosen following a thorough evaluation of its extrinsic and intrinsic
cues, according to specific comparison norms, and that lead to enhanced
effectiveness and efficiency capable of positively influencing customer
satisfaction.
Perceived Value
A trade-off between benefits and perceived costs that is influenced by
consumers’ knowledge of its purchasing process and usage. Accurate
indicator of repurchase intentions, acts as a precursor to customer
satisfaction, and represents a determinant of customer loyalty
Premium A rational investment based on criteria such as performance, price,
economy of time and convenience.
Comfort & Luxury
Attributes
Product features enhancing consumers’ level of comfort and influencing
their perception of luxury.
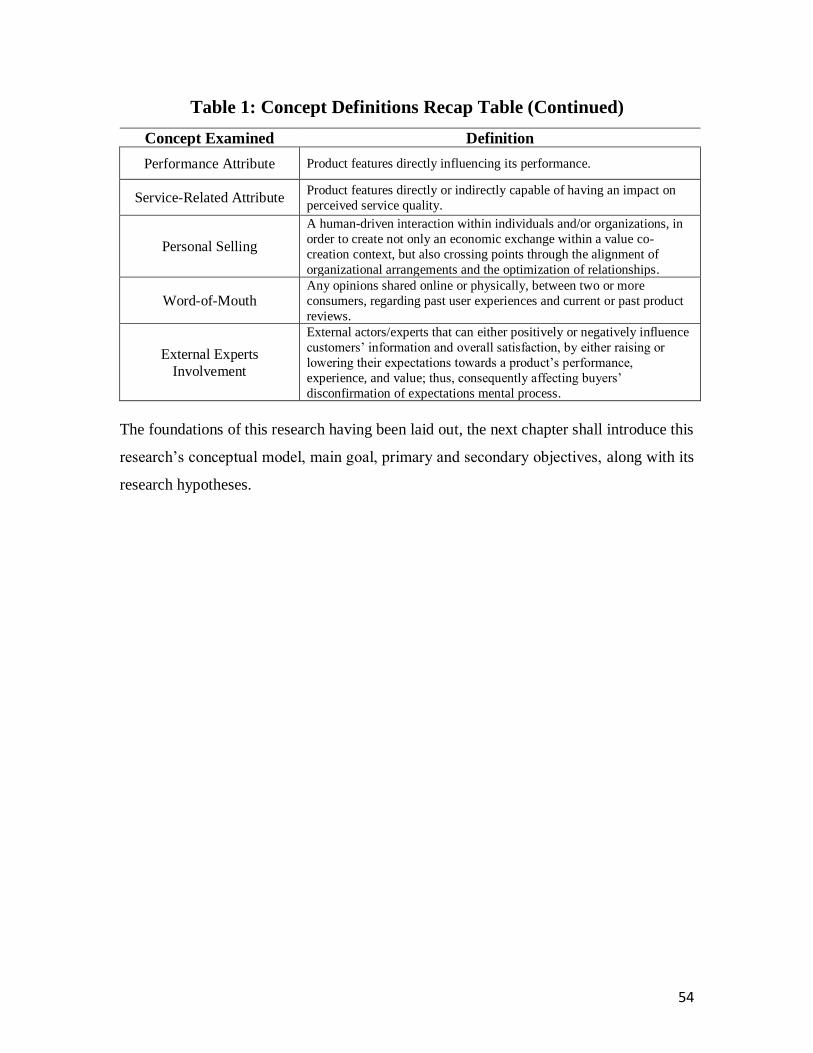
54
Table 1: Concept Definitions Recap Table (Continued)
Concept Examined Definition
Performance Attribute Product features directly influencing its performance.
Service-Related Attribute Product features directly or indirectly capable of having an impact on
perceived service quality.
Personal Selling
A human-driven interaction within individuals and/or organizations, in
order to create not only an economic exchange within a value co-
creation context, but also crossing points through the alignment of
organizational arrangements and the optimization of relationships.
Word-of-Mouth Any opinions shared online or physically, between two or more
consumers, regarding past user experiences and current or past product
reviews.
External Experts
Involvement
External actors/experts that can either positively or negatively influence
customers’ information and overall satisfaction, by either raising or
lowering their expectations towards a product’s performance,
experience, and value; thus, consequently affecting buyers’
disconfirmation of expectations mental process.
The foundations of this research having been laid out, the next chapter shall introduce this
research’s conceptual model, main goal, primary and secondary objectives, along with its
research hypotheses.

55

56
Chapter 2: The Conceptual Model and Research Hypotheses
The literature review described during the previous chapter served to define and
elaborate on various concepts that will be studied and act as variables of this research’s
conceptual model. More precisely, consumer satisfaction, high-involvement products, the
determinants of consumer satisfaction, the paradigm of expectations disconfirmation,
perceived performance, product attributes, the effect of disconfirmation, price, quality,
sales force satisfaction and price equity are all key concepts that will be explored during
this research. On the other hand, the independent variables of this conceptual model were
identified as expectations, desires, product attributes satisfaction, information satisfaction,
expectations and desires congruency, social status, prestige, convenience, experience,
experience and service quality, product performance, perceived value and premium,
personal selling, word-of-mouth satisfaction, and external experts’ involvement. Finally,
the main dependent variable of this research’s model was identified as consumer
satisfaction for B2B high-involvement products, more precisely business aircraft.
The theoretical foundations of this research being laid out, the following lines will
serve to describe and explain this research’s conceptual model, along with the hypotheses
that ensue from it. More precisely, the first section of this chapter will bring forth and
thoroughly describe the main problematic, multiple objectives and theoretical framework
of this research. Such section will then be followed by a second one that will meticulously
outline its conceptual model and introduce the tested hypotheses.
In regards to the conceptual model, the direct relationships of both pre-purchase
variable desires and expectations with both desires congruency and expectations
congruency post-purchase variables will be analyzed, in order to identify any
disconfirmation effect between a consumer’s pre-purchase and post-purchase desires and
expectations.
Furthermore, the direct effects of both desires congruency and expectations
congruency constructs onto the information satisfaction construct, along with its
subconstructs, will also be analyzed, in order to not only quantify the extent of such effect,
but also identify its various consequences.
Finally, the direct effects of both product attributes’ satisfaction and information
satisfaction variables onto the dependant overall consumer satisfaction for B2B high-
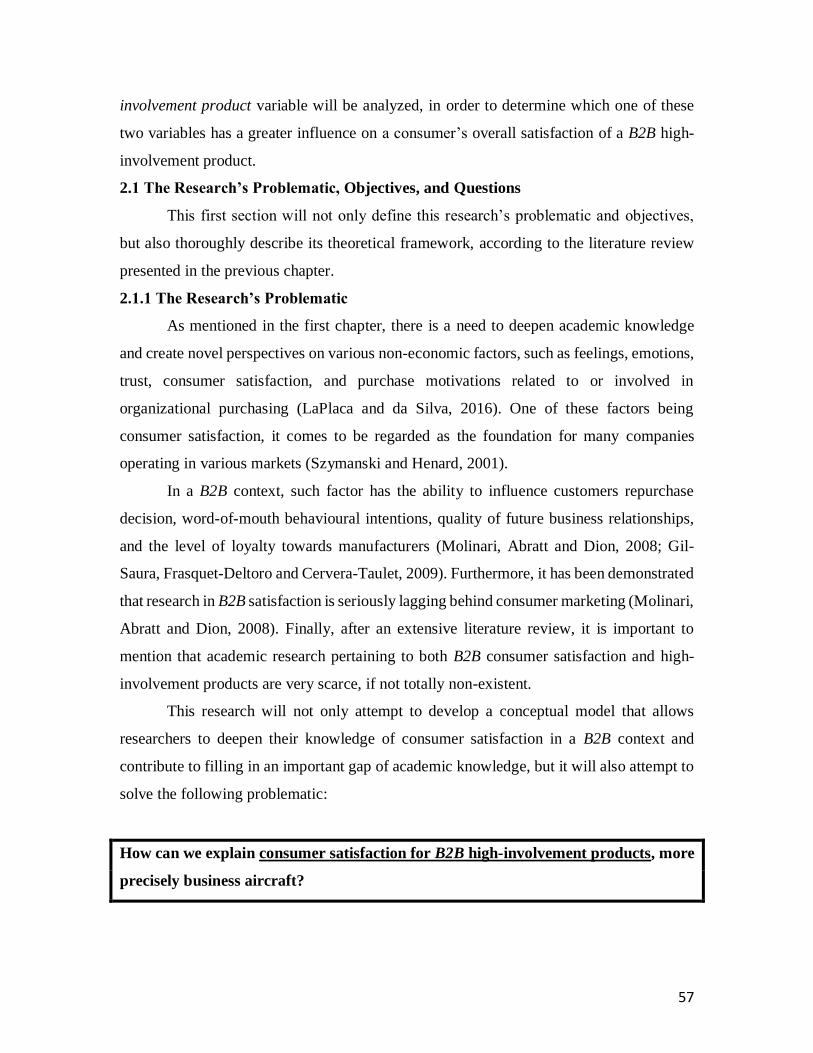
57
involvement product variable will be analyzed, in order to determine which one of these
two variables has a greater influence on a consumer’s overall satisfaction of a B2B high-
involvement product.
2.1 The Research’s Problematic, Objectives, and Questions
This first section will not only define this research’s problematic and objectives,
but also thoroughly describe its theoretical framework, according to the literature review
presented in the previous chapter.
2.1.1 The Research’s Problematic
As mentioned in the first chapter, there is a need to deepen academic knowledge
and create novel perspectives on various non-economic factors, such as feelings, emotions,
trust, consumer satisfaction, and purchase motivations related to or involved in
organizational purchasing (LaPlaca and da Silva, 2016). One of these factors being
consumer satisfaction, it comes to be regarded as the foundation for many companies
operating in various markets (Szymanski and Henard, 2001).
In a B2B context, such factor has the ability to influence customers repurchase
decision, word-of-mouth behavioural intentions, quality of future business relationships,
and the level of loyalty towards manufacturers (Molinari, Abratt and Dion, 2008; Gil-
Saura, Frasquet-Deltoro and Cervera-Taulet, 2009). Furthermore, it has been demonstrated
that research in B2B satisfaction is seriously lagging behind consumer marketing (Molinari,
Abratt and Dion, 2008). Finally, after an extensive literature review, it is important to
mention that academic research pertaining to both B2B consumer satisfaction and high-
involvement products are very scarce, if not totally non-existent.
This research will not only attempt to develop a conceptual model that allows
researchers to deepen their knowledge of consumer satisfaction in a B2B context and
contribute to filling in an important gap of academic knowledge, but it will also attempt to
solve the following problematic:
How can we explain consumer satisfaction for B2B high-involvement products, more
precisely business aircraft?

58
Not only will solving this problematic help to determine the role and influence of specific
determinants of consumer satisfaction onto the overall level of consumer satisfaction for
B2B high-involvement products, more precisely business aircraft, but it shall also serve to
assess the impact of desires and expectations congruency on post-purchase information
satisfaction. Such process will also allow the influence analysis of both product attributes
and information satisfaction variables in consumers’ purchasing decision, in order to
determine which one of them plays a more important role, during the purchasing process
of a B2B high-involvement product.
2.1.2 The Research’s Objectives
This research’s objectives can be presented using two distinct sections. In the first
one, the principal objective, which includes the main contribution this study wishes to
make, shall be described. The second section will then introduce all of the operational
objectives, steps, and activities required, in order to accomplish the principal objective.
This research’s problematic being four parts, the principal objective can therefore
be distinctly separated. It must also be mentioned that it is by accomplishing certain
operational goals that this main objective will be achieved. Such goals are essential to
properly explain the concrete operations necessary to this research’s successful realization,
and also to answer it's problematic. In other words, the operational objectives shall serve
to describe the practical task that will be achieved.
In this conventional hypothetico-deductive approach, the principal objective is to
generate managerial sales recommendations aimed at business aircraft
manufacturers and operators, based on results obtained via a survey sent throughout
the global industry. More precisely, such recommendations will be based on an
analysis that aims to pin point the most influential satisfaction determinant in
consumers’ decision to purchase a business aircraft, and determine consumers’
overall level of satisfaction. Such analysis will also aim to explore the role of each
satisfaction determinant present in this research’s conceptual model, and assess the
possibility that desires and expectations congruency may affect information
satisfaction. From this principal objective stems five distinct operational objectives:
1. Explore the academic literature related to the main concepts of consumer
satisfaction and high-involvement products, along with their respective

59
components, and attempt to deepen knowledge pertaining to several consumer
satisfaction determinants.
2. Explore and describe some of the existing conceptual models used to explain the
concepts of consumer satisfaction and high-involvement products, along with their
various constructs and end effects, in order to apply such concepts to a B2B sales
context.
3. Empirically test the retained variables, in order to understand the impact of desires
and expectations congruency onto information satisfaction, and identify the most
influential consumer satisfaction determinant in a consumer’s decision to purchase
a business aircraft, by consecutively identifying the role and influence of each
consumer satisfaction determinant onto consumers’ overall satisfaction level for
B2B high-involvement products.
4. Determine consumers’ overall satisfaction level.
5. Contribute from a managerial perspective by generating sales recommendations,
discussing the principal limitations of this research, and describing some future
research opportunities.
It must be mentioned that the first two operational objectives were achieved in the
previous chapter, which pertained to the literature review, whereas the last three will be
achieved in the following pages. In regards to this research’s problematic, the conceived
conceptual model will evaluate several independent and dependent variables, and shall be
introduced in the next section of this chapter. Furthermore, it must be noted that the various
concepts and theories related to this conceptual model’s variables were defined and
explained, during the previous chapter. More precisely, the independent and dependent
variables retained are the following ones:
Independent variables:
• Pre-purchase desires
• Pre-purchase expectations
• Post-purchase desires congruency
• Post-purchase expectations congruency
• Post-purchase product attributes satisfaction
• Post-purchase information satisfaction

60
Dependent variable:
• Overall consumer satisfaction for B2B high-involvement products
2.1.3 The Research’s Questions
The fact of knowing the role and influence of such consumer satisfaction
determinants will allow our research team to determine customers’ level of satisfaction for
B2B high-involvement products, and generate effective managerial sales recommendations
aimed at global business aircraft manufacturers and operators. This research’s problematic
focuses on the following four research questions:
1. What is the impact of desires and expectations congruency onto post-purchase
information satisfaction?
2. What is the role and influence of post-purchase product attributes and information
satisfaction onto consumers’ overall level of satisfaction for B2B high-involvement
products?
3. Which determinant of consumer satisfaction has the most influence in consumers’
decision to purchase a business aircraft, and what is their overall level of
satisfaction?
4. What are some effective managerial sales recommendations aimed at global
business aircraft manufacturers and operators?
A deductive reasoning based on a hypothetico-deductive approach shall be used to
answer the above-stated problematic. More precisely, this specific approach consists to use
an academic literature review as a foundation on which to emit research hypotheses, in
order to ultimately compare them to reality (Gavard-Perret, Gotteland, Haon & Jolibert,
2012). The use of this approach is motivated by the essence of our research objectives,
which consist of exploring, describing, verifying, and mastering new expertise (Evrard,
Pras & Roux, 2009).
The methodological approach used during this research follows a quite popular
scientific marketing trend. Indeed, many authors were able to prove that the hypothetico-
deductive approach is a well-established one in the field of marketing research. Hudson &
Ozanne, 1988, along with Simonson, Carmon, Dhar & Drolet, 2001 proved that nearly
eighty percent of all scientific articles published worldwide follow this trend.

61
This research proposes to increase the knowledge relative to the influence of
consumer satisfaction determinants onto consumers’ overall satisfaction level, in a B2B
context, and regarding high-involvement products, more precisely business aircraft.
Furthermore, it also aims to deepen knowledge relative to the impact of desires and
expectations congruency onto information satisfaction. By doing so, sales people evolving
in this field may be able to not only better understand the impact of some of their sales
techniques onto consumers’ overall level of satisfaction, but also allow them to pin point
the most effective determinant of consumer satisfaction and consequently refine their
strategy, in an effort to simultaneously increase both their deal closure rate and consumers’
overall level of satisfaction.
Therefore, four hypotheses involving independent variables from this model will
be emitted. More precisely, two hypotheses will regard pre-purchase desires and
expectations, and post-purchase desires and expectations congruency, in order to estimate
the existing gap between pre-and post-purchase desires and expectations. Two other
hypotheses regarding the relationship between desires and expectations congruency with
information satisfaction shall also be emitted, in order to estimate the impact of these first
two independent variables onto the last one mentioned. Lastly, two hypotheses involving
this research’s dependent variable will be emitted and attempt to examine the direct
relationship between product attributes and information satisfaction with consumers’
overall level of satisfaction, in an effort to determine which one of these two independent
variables has a greater influence on the dependent variable. Every single one of this
research’s hypotheses will be clearly stated, and further described in the following pages.
2.2 The Research’s Conceptual Model and Hypotheses
This second section aims to present this research’s conceptual model, along with
the hypotheses that ensue from it. The problematic, main and operational objectives, along
with the dependent and independent variables retained shall serve to formulate specific
research hypotheses that will eventually be tested.
This research’s main objective being to generate managerial sales
recommendations for global business aircraft manufacturers and operators, it is crucial to
better understand how overall consumer satisfaction for B2B high-involvement products
may be affected by various customer satisfaction determinants. Such knowledge shall also

62
serve to establish which one of them has the most influence in a consumer’s decision to
purchase a business aircraft. This said, the thorough literature review completed in chapter
1 focused on such above-mentioned concepts and allowed the creation of a conceptual
model from which various hypotheses ensued.
First, this conceptual model will be presented, in order to provide a visual
representation of the hypotheses, and the organization of its research constructs. Second,
the research hypotheses will be introduced, by beginning with the ones related to desires
and expectations congruency, then followed by the ones related to product attributes and
information satisfaction, and finally with the ones directly related to overall customer
satisfaction for B2B high-involvement products.
2.2.1 The Research’s Conceptual Model
According to many authors, such as Gavard-Perret et al. (2012), conceptual models
can be described as simplified miniature representations of reality. In other words, they can
be portrayed as quite useful representations of reality, which can sometimes be too complex
to be described using solely words. In this line of thought, the following conceptual model
will encompass only the most important elements necessary to provide an accurate
representation of reality.
This research’s conceptual model is depicted on the following page (cf. figure 7)
and will allow the following variables and concepts to be accurately tested and analyzed:
1. The direct relationship between pre-purchase desires and post-purchase desires
congruency.
2. The direct relationship between pre-purchase expectations and post-purchase
expectations congruency.
3. The direct effect of desires congruency onto information satisfaction.
4. The direct effect of expectations congruency onto information satisfaction.
5. The direct effect of product attributes’ and information satisfaction onto the overall
level of consumer satisfaction for B2B high-involvement products.
6. The role and influence of each consumer satisfaction determinant retained onto the
overall level of consumer satisfaction for B2B high-involvement products, along
with measuring consumers’ overall level of satisfaction.

63
The methodology used to measure such direct effects and relationships involving
the independent and dependent variables will be thoroughly explained in the next chapter
of this research.
Figure 7: The Research’s Conceptual Model
This conceptual model (cf. figure 7) is inspired from the one conceived by Spreng,
Mackenzie & Olshavsky (1996) and introduced in their article entitled “A Reexamination
of the Determinants of Consumer Satisfaction.” The decision was made to use this specific
model, due to its relative simplicity, the coherent organization of all its constructs, and the
fact that its dependent variable already assessed the concept of consumer satisfaction. Both
desires and expectations congruency constructs also contributed to make it more original
and help it stand out from the various other ones examined. It was then simplified and
modified, based on a clear organization of the concepts and elements retained, following
the completion of the literature review. More precisely, it was adapted to depict not only
the process leading to overall consumer satisfaction, according to a variety of studies
achieved by academicians and field experts, but also to incorporate several concepts related
to the sale of high-involvement products in a B2B context. Thus, making it a fairly accurate
and simplified representation of how consumers’ overall satisfaction is formed, following
their purchase and usage of a business aircraft. Furthermore, the evaluation of both desires
and expectations congruency, along with their respective influence onto information
satisfaction, makes it an original model from a sales perspective.
64
This model will be tested using six main hypotheses. All of them will be used to
measure the direct effects and relationships between the existing pre-purchase and post-
purchase variables. In the first place, the relationships between pre-purchase desires &
expectations, and post-purchase desires & expectations congruency will be assessed,
respectively represented by H1 and H2. In the second place, the direct effects of desires
and expectations congruency onto information satisfaction will be measured, respectively
represented by H3 and H4. Lastly, the direct effects of product attributes and information
satisfaction onto the overall level of consumer satisfaction for B2B high-involvement
products will be assessed, respectively represented by H5 and H6. The following section
shall distinctly introduce each one of the hypotheses mentioned above, while supporting
them with elements previously covered in the literature review completed in chapter 1.
2.2.2 The Research’s Hypotheses
The problematic, main and operational objectives, along with the independent and
dependent variables retained allowed the formulation of six research hypotheses. Based on
the main concepts and elements reviewed during the literature review, and then retained in
this research’s conceptual model, the following lines will introduce and describe each one
of these main six hypotheses.
The relationship between pre-purchase desires and post-purchase desires
Congruency
The first hypothesis of this research involves the disconfirmation paradigm. This
concept is described in the previous chapter as the consumer’s comparison of the degree of
fulfilment of his post-purchase desires to a previously established frame of reference,
which in this case can be identified as his original pre-purchase desires (Churchill &
Surprenant, 1982; Patterson, 1993). This said, Yi (1990) pointed out that even though
raising desires and/or expectations about a product can enhance perceived product
performance, it can also increase the magnitude of disconfirmation. In this line of thought,
Spreng, Mackenzie & Olshavsky (1996) claimed that the higher and more stringent a
consumer’s pre-purchase expectations and/or desires are, the less likely that the product
will meet those expectations and/or desires, the lower the scores on a disconfirmation
measure, and the lower the resulting satisfaction level.

65
Such findings lead the way to the formulation of the following first hypothesis:
Hypothesis 1 The more stringent pre-purchase desires are, the lesser post-
purchase desires congruency will be.
The relationship between pre-purchase expectations and post-purchase
expectations congruency
Due to the fact that this research hypothesizes that the relationship between pre-
purchase expectations and post-purchase expectations congruency is similar to the one
between desires and desires congruency explained previously, and that it also involves the
disconfirmation paradigm, the following hypothesis may be emitted:
Hypothesis 2 The higher pre-purchase expectations are, the lower post-purchase
expectations congruency will be.
The direct effect of desires congruency onto information satisfaction
As stated by Spreng, Mackenzie & Olshavsky (1996), consumers will invest a
considerable amount of time and efforts in selecting and purchasing products they expect
will fulfill their desires. This is also especially true for the purchase of a high-involvement
product, as this specific type of product was defined earlier as one requiring consumers to
invest a considerable amount of time looking for product information, in order to ultimately
make a wise purchase decision and reduce the affective and financial risks associated with
it (Clark and Belly, 1978; Gu, Park and Konana, 2012). This said, it could therefore be
inferred that there exists a positive effect and relationship between desires congruency and
information satisfaction. To be put in simpler terms, if the product’s post-purchase
performance is close to the consumer’s pre-purchase desires, then it is highly probable that
the consumer will be satisfied with the information used in making the choice. It must also
be mentioned that for the purpose of this research, three specific sources of information
satisfaction will be assessed; more precisely, personal selling, word-of-mouth (WOM) and
external experts’ involvement. This assumption leads to the following hypothesis:
Hypothesis 3 The higher post-purchase desires congruency is, the higher post-
purchase information satisfaction will be.

66
The direct effect of expectations congruency onto information satisfaction
Similarly to desires, consumers usually have specific expectations in regards to the
products they purchase, especially in the case of B2B high-involvement ones, where their
performance may not only impact their level of satisfaction, but also directly or indirectly
affect the business entity that purchased them (Kapferer and Laurent, 1985). Expectations
congruency being defined as: “the consumer’s subjective assessment between his
expectations and the performance received,” it may also directly and positively influence
information satisfaction, as consumers are likely to be dissatisfied if the product does not
meet the specific performance and requirements given by the information they received
prior to its purchase (pp. 18, Spreng, Mackenzie & Olshavsky, 1996). Once again, it must
be noted that the disconfirmation paradigm plays a crucial role in the following hypothesis:
Hypothesis 4 The higher post-purchase expectations congruency is, the higher
post-purchase information satisfaction will be.
The direct effect of product attributes’ satisfaction onto overall consumer
satisfaction for B2B high-involvement products
As demonstrated in the chapter 1, many authors such as Martin (1998), Oliver
(1993), Sheth et al. (1988), Spreng, Mackenzie & Olshavsky, (1996) and Vickers and
Renand (2003) claimed that product attributes do not only play an influential role in
consumers’ purchase decision, but also in their overall level of satisfaction. Spreng,
Mackenzie & Olshavsky, (1996) also indicates that a clear distinction between individual
product attributes’ satisfaction and overall satisfaction must be maintained, due to the fact
that product attributes’ satisfaction is not its only antecedent.
More precisely, the authors claim that overall satisfaction is in fact based on overall
experience and a variety of different consumer satisfaction determinants, as indicated
earlier in this research. Nevertheless, it can be inferred that while being distinct, product
attributes’ satisfaction and overall satisfaction are positively correlated constructs, because
individual product attributes’ performance will directly, and either positively or negatively,
affect overall consumer satisfaction. In other words, if product attributes’ satisfaction is

67
positive, so will be consumers’ overall level of satisfaction. This assumption, therefore,
leads to the following hypothesis:
Hypothesis 5 The higher post-purchase product attributes’ satisfaction is, the
higher overall consumer satisfaction will be.
The direct effect of information satisfaction onto overall consumer satisfaction
for B2B high-involvement products
Many different sources of information exist; however, this research focuses on three
specific sales-related ones. More precisely, the emphasis is placed onto personal selling,
word-of-mouth (WOM), and external experts’ involvement. Together, these three sources
of information designate what this research refers to as information satisfaction. This said,
many authors described these sources as persuasion-based promises or expectations
(Gardial et al., 1994; Spreng and Dixon, 1992; Spreng, Mackenzie & Olshavsky, 1996;
Woodruff et al., 1991). Interestingly, these authors also mentioned that they could be
perceived by customers as proclaiming performance standards that could either be achieved
or disconfirmed, following product purchase. Similarly to product attributes’ satisfaction,
information satisfaction is a determinant that has a lot of influence onto overall consumer
satisfaction, due to the fact that it can directly, either positively or negatively, affects
overall experience, which in turn directly impacts overall consumer satisfaction. It can,
therefore, be claimed that information satisfaction and overall consumer satisfaction are
positively correlated constructs. This assumption leads to the last hypothesis this research
will test:
Hypothesis 6 The higher post-purchase information satisfaction is, the higher
overall consumer satisfaction will be.

68
Overview of the research’s hypotheses
As a final overview of this research’s hypotheses, the following table (cf. Table 2)
will recap all of the main hypotheses previously explained and emitted.
Table 2: Recap Table of the Research’s Hypotheses
Hypothesis 1 The more stringent pre-purchase desires are, the lesser post-
purchase desires congruency will be.
Hypothesis 2 The higher pre-purchase expectations are, the lower post-
purchase expectations congruency will be.
Hypothesis 3 The higher post-purchase desires congruency is, the higher post-
purchase information satisfaction will be.
Hypothesis 4 The higher post-purchase expectations congruency is, the higher
post-purchase information satisfaction will be.
Hypothesis 5 The higher post-purchase product attributes’ satisfaction is, the
higher overall consumer satisfaction will be.
Hypothesis 6 The higher post-purchase information satisfaction is, the higher
overall consumer satisfaction will be.
2.3 Conclusion
This chapter introduced the research problematic, the principal and operational
objectives, the concepts retained and incorporated in this research’s conceptual model, the
conceptual model itself, along with the main hypotheses that ensued from it. Many
elements from the literature review were also used to explain and support the emitted
hypotheses.
As a summary, the problematic this research will attempt to solve is the following:
How can we explain consumer satisfaction for B2B high-involvement products, more
precisely business aircraft?
The principal objective is to generate managerial sales recommendations aimed at
business aircraft manufacturers and operators, based on results obtained via a survey
sent throughout the global industry. More precisely, such recommendations will be
based on an analysis that aims to pin point the most influential satisfaction
determinant in consumers’ decision to purchase a business aircraft, and determine
consumers’ overall level of satisfaction. Such analysis will also aim to explore the role

69
of each satisfaction determinant present in this research’s conceptual model, and
assess the possibility that desires and expectations congruency may affect information
satisfaction. All of the retained concepts present in this conceptual model were supported
by the literature review of chapter 1. Finally, this research problematic focuses on the
following four research questions:
1. What is the impact of desires and expectations congruency onto post-purchase
information satisfaction?
2. What is the role and influence of post-purchase product attributes and information
satisfaction onto consumers’ overall level of satisfaction for B2B high-involvement
products?
3. Which determinant of consumer satisfaction has the most influence in consumers’
decision to purchase a business aircraft, and what is their overall level of
satisfaction?
4. What are some effective managerial sales recommendations aimed at global
business aircraft manufacturers and operators?
The proposed conceptual model incorporates diverse consumer satisfaction
determinants acting as independent variables, such as pre-purchase desires, expectations,
post-purchase desires and expectations congruency, product attributes’ satisfaction and
information satisfaction; All of them leading to the evaluation of consumers’ overall
satisfaction for B2B high-involvement products, which represents the dependent variable.
This model was adapted to depict not only the process leading to overall consumer
satisfaction, according to a variety of studies completed by academicians and field experts,
but also to incorporate several concepts related to the sale of high-involvement products in
a B2B context. By doing so, a fairly accurate and simplified representation of consumers’
overall level of satisfaction for business aircraft was created. Furthermore, the evaluation
of both desires and expectations congruency, along with their respective influence onto
information satisfaction, makes it an unprecedented model from a sales perspective. Six
main hypotheses ensued from this model and will be tested to allow the generation of
managerial sales recommendations aimed at global business aircraft manufacturers and
operators. The following chapter will introduce the chosen research methodology and all
of the steps that ensue from it.

70

71
Chapter 3: The Research’s Methodology
The main objective of this chapter is to introduce the methodology that was used in
this research. In order to test the research hypotheses emitted in the previous chapter, a
survey was built with an intent to test each construct from the conceived conceptual model,
by sending it to several business aircraft industry professionals across the world. Such type
of data collection will allow the acquisition of cross-sectional data, a relatively accurate
measurement of all variables pertaining to the stakeholders involved on the customers’ side
of the selling process of a business aircraft, and will also prove to be useful in determining
the overall level of satisfaction for business aircraft owners.
As a reminder, this research’s principal objective is to generate managerial sales
recommendations aimed at business aircraft manufacturers and operators, based on
results obtained via a survey sent throughout the global industry. More precisely,
such recommendations will be based on an analysis that aims to pin point the most
influential satisfaction determinant in consumers’ decision to purchase a business
aircraft, and determine consumers’ overall level of satisfaction. Such analysis will also
aim to explore the role of each satisfaction determinant present in this research’s
conceptual model, and assess the possibility that desires and expectations congruency
may affect information satisfaction. In order to accomplish such objective, the selected
approach regroups all of the elements above in one single study.
The first section of this chapter will introduce in detail the method used to collect
the data. First, every step of the data collection process will be described, along with the
conditions in which the research was executed. Finally, all of the independent and
dependent variables’ measurement instruments shall be described in the second section.
3.1 The Data Collection Method
This first section will introduce the data collection method used to accomplish this
research’s principal objective. After having defined what a cross-sectional data collection
consists of, the selected investigation field will be described, along with the examined
population, the steps leading to the development of the questionnaire, the distribution
method, and finally the chosen analytical and modelling methods.

72
3.1.1 The Cross-Sectional Data Collection Method Defined
A cross-sectional data collection can be defined as the examination of a
phenomenon or an event at a specific moment in time. In other words, such data collection
method focuses on a very specific period of time called a cross-section or transverse
section. This type of method, along with the observation of a specific population at a
precise moment in time, is widely used in the fields of marketing and sales research
(Steenkamp and Baumgartner, 2000). It must also be mentioned that if the same individuals
are being studied or observed multiple times during a period of time, such type of method
is then called a longitudinal research. The data collection method selected for this research,
more precisely the cross-sectional method, will allow the acquisition of cross-sectional
data that will be used to create and carry out statistical models and analyses, such as an
analysis of variance (ANOVA) and/or a regression analysis.
In this case, a survey will be sent out to various business aircraft industry
professionals, in order to acquire cross-sectional data that will then be used to perform
such types of analyses.
3.1.1.1 The Population and Sample
Global business aircraft manufacturers and operators are consistently looking for
ways to improve their sales performance. Consumer satisfaction being closely related to
consumers repurchase decision and word-of-mouth behavioural intentions, this research
field appeared to be closely related to the objective of such high-involvement products’
manufacturers. Also, many of their customers evolve within a B2B context, which
represents a particularly interesting opportunity to deepen academic knowledge pertaining
to B2B personal selling.
The selected population for this research is global, and comprises stakeholders from
all around the world that currently are or have been involved in the purchasing process of
a business aircraft on the customer’s side. Current and past business aircraft owners are
also comprised in this research’s population. For clarification purposes, business aircraft
manufacturers’ executives or employees are not part of the examined population. It is
important to mention that a few of them were inadvertently invited to respond to the
questionnaire, but their responses were then removed from the final and exploitable sample
of respondents, in order to avoid skewing the dataset with responses originating from

73
elsewhere than from the customer’s perspective. Furthermore, all stakeholders and
business aircraft owners aimed by this research are either evolving within the global
business aircraft/aerospace industry or not. In fact, they may be working in several different
fields such as legal, finance, consultancy, flight operations, aircraft maintenance,
engineering, external sales representatives, and various other ones.
3.1.1.2 Qualitative Pre-Survey Sample
Prior to beginning the data collection process, seven informal interviews with Sales
Directors, sales support employees and executives from a global business aircraft
manufacturer were completed, along with multiple meetings involving many of its Vice-
Presidents. These informal interviews and meetings took place over a few weeks and were
quite useful in improving and refining the first version of this research’s conceptual model.
Indeed, they helped identify the higher order constructs that should be included, along with
the appropriate measurement tools that should be used. Lastly, such interviews and
meetings did not only end up being very useful in the identification and selection of the
conceptual model’s items, but also in determining the most accurate level of complexity
and overall length of the questionnaire. Once all of these meetings and discussions were
completed, along with this research’s literature review, a questionnaire was fully
developed.
3.1.1.3 Quantitative Data Collection Sample
The data collection process was completed relatively quickly, more precisely within
a period of ten days. Using the Qualtrics survey platform, the final questionnaire was
globally sent via email to a sample of 14,279 people identified as potential stakeholders
currently playing or having played an active role in the purchasing process of a business
aircraft on the customer’s side, or as current/past business aircraft owners. It must be
mentioned that such sample was obtained using the specialized JETNET.com aviation
database, which consists of a private database specializing in information and intelligence
gathering on business and commercial aircraft operating worldwide. More details on how
our research team was granted access to this private database, the creation of the sample
population, and the distribution process of the questionnaire will be provided further in this
chapter. During the ten days of the data collection process, two email reminders were sent
at an interval of three days to the participants who had not either started or finished the

74
questionnaire. Out of the 14,279 email addresses used in the distribution process, 1787
bounced or turned out to be invalid, which means that the questionnaire was successfully
distributed to a total of 12,492 participants worldwide. Out of the 12,492 participants
reached, 200 accepted the invitation and responded to the entire questionnaire, and 187
accepted the invitation but did not completely finish the questionnaire. Therefore, those
numbers represent a 3.05% response rate, and a 51% completion rate amongst a total of
387 responses. After a thorough cleaning of the dataset, only those respondents who
completed 50% or more of the questionnaire were retained. As a result, a final and
exploitable sample of n = 244 respondents was obtained. Out of this final number of
respondents, 43% were identified as current or past business aircraft owners, and 57% as
stakeholders who currently are or have been involved in the purchasing process of a
business aircraft on the customer’s side. The majority of the respondents, more precisely
76.5% were based in North America, followed by 17.9% based in Europe, and roughly
5.6% scattered across six other geographical locations. It must be noted that all percentages
have been rounded to the nearest decimal and/or round number, for reasons of conciseness.
3.1.2 The Questionnaire
For communication purposes and due to the fact that the global aerospace industry
uses English as its primary language, the questionnaire was solely conceived in English.
Furthermore, using such language greatly facilitated its creation. Indeed, the questionnaire
did not only attempt to measure various preferences and opinions of industry professionals,
but also complex psychological concepts such as desires and expectations congruency,
along with customer satisfaction. This said, such concepts were originally explained and
discussed in depth throughout various scientific articles written in English. Therefore,
using such language greatly contributed to minimize the risk of misinterpreting several key
concepts and constructs, by attempting to translate them in French, along with some of
their respective measurement tools/instruments.
All measurement instruments used in this questionnaire were selected according to
their psychometric qualities and this research’s objectives. Following Hambleton’s (2001)
recommendation, a particular emphasis was also placed on the task of formulating
questions and concepts’ definitions using common business-related terms and vocabulary.
Gavard-Perret et al.’s (2012) recommendations were also useful to avoid biasing the

75
questions. More precisely, important efforts were made to use a familiar and precise
vocabulary, avoid redundancy and doubling questions, avoid questions inciting a specific
response, and also avoid long questions. Once all of them were formulated, they were then
regrouped not only by concept, but also by higher order construct represented in this
research’s conceptual model. Overall, the final version of the questionnaire (cf. Annex 1)
was composed of nineteen different subgroups, each assessing a different higher order
construct, and requiring approximately 20 minutes to complete. This relatively long
duration can be explained by the fact that each section contained one or two concepts’
definitions, which respondents were required to read, in order to properly understand the
exact meaning of all following questions. This said, the final questionnaire’s subgroups
were organized as follows:
• General introduction
• General questions (6 questions)
• Section 1 – Consumers’ desires (11 questions)
• Section 1.1 – Social status & prestige (5 questions)
• Section 1.2 – Convenience (3 questions)
• Section 1.3 – Experience (3 questions)
• Section 2 – Consumers’ expectations (13 questions)
• Section 2.1 – Experience & service quality (5 questions)
• Section 2.2 – Product performance (3 questions)
• Section 2.3 – Perceived value & premium (5 questions)
• Section 3 – Product attributes’ satisfaction (12 questions)
• Section 3.1 – Luxury & comfort attributes (4 questions)
• Section 3.2 – Performance attributes (4 questions)
• Section 3.3 – Service-related product attributes (4 questions)
• Section 4 – Information satisfaction (13 questions)
• Section 4.1 – Personal selling satisfaction (4 questions)
• Section 4.2 – Word-of-mouth satisfaction (5 questions)
• Section 4.3 – External experts’ satisfaction (4 questions)
• Section 5 – Desires’ congruency (4 questions)
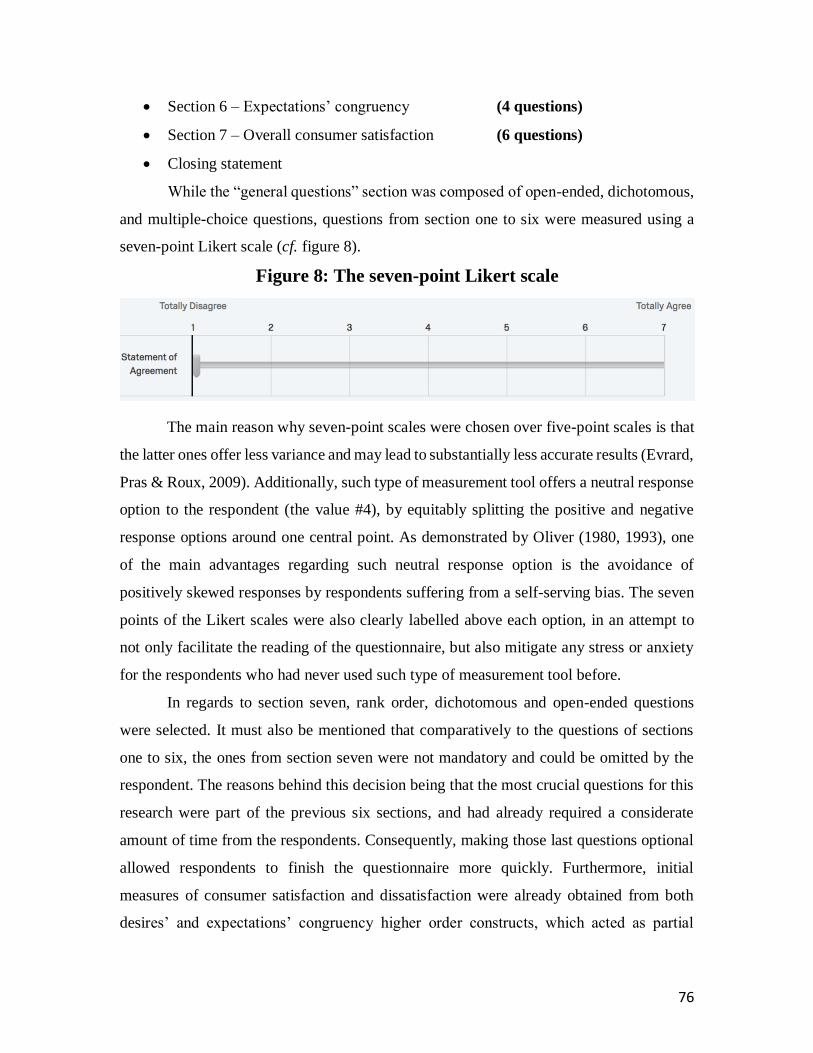
76
• Section 6 – Expectations’ congruency (4 questions)
• Section 7 – Overall consumer satisfaction (6 questions)
• Closing statement
While the “general questions” section was composed of open-ended, dichotomous,
and multiple-choice questions, questions from section one to six were measured using a
seven-point Likert scale (cf. figure 8).
Figure 8: The seven-point Likert scale
The main reason why seven-point scales were chosen over five-point scales is that
the latter ones offer less variance and may lead to substantially less accurate results (Evrard,
Pras & Roux, 2009). Additionally, such type of measurement tool offers a neutral response
option to the respondent (the value #4), by equitably splitting the positive and negative
response options around one central point. As demonstrated by Oliver (1980, 1993), one
of the main advantages regarding such neutral response option is the avoidance of
positively skewed responses by respondents suffering from a self-serving bias. The seven
points of the Likert scales were also clearly labelled above each option, in an attempt to
not only facilitate the reading of the questionnaire, but also mitigate any stress or anxiety
for the respondents who had never used such type of measurement tool before.
In regards to section seven, rank order, dichotomous and open-ended questions
were selected. It must also be mentioned that comparatively to the questions of sections
one to six, the ones from section seven were not mandatory and could be omitted by the
respondent. The reasons behind this decision being that the most crucial questions for this
research were part of the previous six sections, and had already required a considerate
amount of time from the respondents. Consequently, making those last questions optional
allowed respondents to finish the questionnaire more quickly. Furthermore, initial
measures of consumer satisfaction and dissatisfaction were already obtained from both
desires’ and expectations’ congruency higher order constructs, which acted as partial

77
measures of this research’s dependent variable. Nevertheless, the fact that questions from
section seven were mostly subjective and relied on the respondents sharing their views,
opinions and recommendations based on their extensive field experience regarding
possible consumer satisfaction and/or dissatisfaction occurrences allowed the acquisition
of very interesting data that proved to be quite useful in measuring the dependent variable
of this research. Such manifestation is also in line with Geer (1988) and Reja et al.’s (2003)
findings which demonstrated that open-ended questions have the ability to provide richer
and more insightful responses than close-ended questions, while still accurately
representing respondents’ underlying attitudes in regards to specific subjects. The strategy
of including open-ended questions to a quantitative questionnaire is also proven to add
significant value and depth to both results and underlying conclusions (Harland and Holey,
2011). Lastly, it was assumed, prior to the conception of this research’s questionnaire, that
the majority of its respondents would not be identified as current or past business aircraft
owners. Therefore, it was thought somewhat illogical to ask participants to evaluate
consumers’ level of satisfaction using a Likert scale, if most of them would in fact be
identified as stakeholders involved in the purchasing process of a business aircraft, and not
as current or past owners. In the end, this assumption proved to be right, due to the fact that
the majority of the retained respondents, more precisely 57%, were identified as
stakeholders who currently are or have been involved in the purchasing process of a
business aircraft on the customer’s side. This said, the specific methods used to acquire
data related to the dependent variable will be thoroughly explained further in this chapter.
Obtaining the final version of this questionnaire required the submission of four
different drafts to specific members of HEC Montreal’s marketing faculty. It is important
to mention that the earlier versions were judged to be too long and complex. Indeed, five
different variants of Likert scales were originally used, but had to be reduced to solely one
common form throughout the different sections. A substantial amount of time and effort
was therefore invested, in order to shorten and simplify those previous versions and
ultimately obtain the final one. The following section will explain the method that was used
to pretest the final questionnaire.

78
3.1.3 The Questionnaire’s Pretest
According to Jolibert and Jourdan (2006), the process of pretesting a questionnaire
consists to interrogate a small sample of individuals selected within the reference
population of the study, in order to identify any mistakes, and make sure questions are well
formulated and understood by respondents. The pretest of this research’s questionnaire was
completed in two successive steps. First of all, and as mentioned earlier, four different
drafts were submitted to two different members of HEC Montreal’s marketing faculty.
Such drafts were deemed too long and complex to be submitted to participants. Therefore,
they were shortened by deleting questions judged unnecessary, and using only one form of
Likert scale. More precisely, scales ranging from “Totally Disagree” to “Totally Agree”
were ultimately selected. Once the final draft obtained and deemed satisfactory, according
to both marketing experts, the second step was undertaken.
First, a randomly selected sample of 100 participants was formed from the bigger
14,379 participants’ research sample. The final draft was then distributed electronically via
email, using the Qualtrics survey platform. Every email invitation was personalized to
include both the proper salutation and last name of each participant contacted. As a result,
and out of the 100 randomly selected email addresses, six of them bounced and did not
reach the intended industry professionals. In total, ninety-four participants were reached,
nine surveys were started, and five full responses were recorded, which corresponds to an
approximate 9,57% response rate and 56% completion rate. The five responses were then
carefully analyzed, in order to identify any sections of the questionnaire that could be
deemed problematic. With an average recorded duration of 46 minutes amongst all
respondents, the ninety-five questions draft was again deemed to be too long and had to be
shortened even more. Many of the optional multiple-choice and rank-order questions of
section seven were also left blank, which indicated an acute fatigue of the respondents.
Interestingly, however, four out of five respondents had responded to the open-ended
questions, in order to share their opinions and recommendations. As a result of these
observations, twenty-two questions among sections one to six were deleted, and four out
of ten multiple-choice and rank order questions from section seven were also removed.
However, all three open-ended questions were retained. It must also be noted that none of
79
the respondents complained about the length or complexity of the final draft pretested,
which confirmed the questions’ clarity and adequate flow.
As a result of this pretest, the final version of the questionnaire included six optional
general questions, fifty-seven mandatory seven-point Likert scale questions, along with six
optional open-ended, rank order and dichotomous questions. This sixty-nine questions’
final questionnaire was also conceived to have a maximum duration of approximately 20
to 25 minutes.
3.1.4 The Questionnaire’s Distribution
This subsection will explain the method used to distribute the final questionnaire to
all selected participants. First and foremost, it must be noted that this research and its final
questionnaire received the approval from HEC Montreal Research Ethics Board (REB),
prior to beginning the data collection process; Such approval was obtained by timely
completing the appropriate electronic documents, and exposing the intended methodology
of this research to the board. As a result, all of the necessary approbations from the REB
and one participating company (whose identity will remain anonymous) were received on
time, and allowed the data collection process to take place as initially planned.
As mentioned earlier, our research team was fortunate enough to be granted access
to the JETNET.com specialized aviation database for the duration of our research. More
precisely, this database specializes in listing most of all business aircraft transactions
occurring globally. Owners, operators, sellers, buyers, home bases, recent flight activities,
registration numbers, but most importantly, contact information are all listed and frequently
updated on their online platform. It must also be noted that the price to access this type of
database can sometimes be upwards of tens of thousands of dollars. Therefore, both the
Vice-President and Director of Marketing and Strategy of a global business aircraft
manufacturer were approached, in order to obtain such exclusive access without having to
pay such an exorbitant amount of money. After meeting with them, and explaining the
ultimate objective of this research, they kindly accepted to allow our research team to
access the JETNET.com database, by using their department’s login credentials.
However, such access was granted only for a limited period of time, during which
it was possible to extract the contact information of multiple current and/or past business
aircraft owners, along with the one of potential stakeholders currently or previously
80
involved in the purchasing process of a business aircraft on the customer’s side. The
database’s powerful filtering and reporting tools proved to be quite useful in identifying
these two specific types of individuals amongst millions of listed participants. It was also
agreed that this contact information would have to not only be totally deleted once
completion of this research, in order to fully safeguard the anonymity and confidentiality
of this research’s participants, but also fulfill academic purposes only. As a result, 14,379
names and email addresses were extracted from the database. The dataset was then
manually verified and properly formatted, as a Microsoft Excel document, in order to be
uploaded onto the Qualtrics survey platform.
In regards to the possible distribution methods of a questionnaire, they are quite
various, ranging from postal mail, telephone, electronically via the Internet and/or in
person/face-to-face. For this research’s questionnaire, the electronic distribution method
was selected, more precisely via email using the Qualtrics survey platform. This particular
method is advantageous because it allows participants to take their time to respond to the
questions, and also guarantees their anonymity. Furthermore, it is probably the simplest
method to use if the questionnaire is to be sent to worldwide participants, as it is the case
with this research. Indeed, the selected participants were based either in North America,
Central America, South America, Europe, Scandinavia, Asia-Pacific, the Middle East,
Russia or Africa. This method also allowed the acquisition of partially completed
questionnaires, which eliminated the risk of losing data.
The final questionnaire was therefore sent to all participants via a personalized
email using the Qualtrics survey platform. Indeed, each email included the proper
salutation and last name of each participant, according to the dataset previously extracted
from the JETNET.com database. These emails were also linked to the main investigator’s
HEC Montreal email address, in order to facilitate exchanges. Following Schneider &
Johnson’s (1995) recommendation, HEC Montreal’s name and logo was strategically
displayed in the invitation email, survey’s introduction, and at the top of each survey page,
in order to significantly increase the response and participation rate of industry
professionals. The participants were also invited to reply to the invitation email if they
wished to receive a summary of the research’s results. This tactic was used as an incentive
to increase the response and participation rate of the targeted professionals. In total, two

81
reminders were sent at an interval of three days, which significantly contributed to increase
the total number of responses received. In total, the data collection process lasted ten days,
and allowed the collection of 387 responses.
Interestingly, many industry professionals also replied to the invitation email to ask
for a results’ summary, upon completion of the study. Furthermore, a surprisingly high
number of them expressed an interest in this research, and wished to contribute by sharing
either insights or some of their professional experiences/observations related to the
business aircraft industry by sending a private email to the research team.
3.1.5 Cleaning and Validating the Dataset
3.1.5.1 Cleaning the Dataset
Once the acquired dataset was extracted from the Qualtrics survey platform, and
uploaded into the SPSS statistical analysis software, the first step was to clean it. In order
to do so, all responses were filtered in ascending order, according to their recorded progress
rate. As a result, many responses were identified as partially incomplete. The option to
impute missing data was considered, however, the questionnaire had been built in such a
way to consecutively investigate each construct and sub-construct of this research’s
conceptual model individually. Furthermore, participants had no choice but to finish an
already begun section, prior to recording their responses and moving onto the next one, as
all questions from sections one to six were made mandatory. Due to this reason, all
participants who did not fully complete the questionnaire were not able to access different
sections, as they could not skip one that was already begun but incomplete. This said, the
option to impute missing items necessitate at least one recorded response from each
section. In this case, many sections were left incomplete. Consequently, it was deemed
impossible to rely on any imputation methods.
Due to this situation, a decision was made to delete any responses with a recorded
progress rate smaller than fifty-one percent. As explained earlier, the questionnaire was
built to still be analyzable even though participants may not have fully completed it, which
also allowed the retention of an optimal number of responses. A fifty-one percent progress
rate corresponded to a participant having responded to all questions up to the product
attributes’ satisfaction section of the questionnaire. Therefore, this threshold allowed us to
analyze these participants’ responses to both consumer’s desires and expectations sections.

82
The fact that they had completed at least two sections also allowed the execution of certain
statistical analyses that would have been impossible to carry out with solely one completed
section. As a result, 143 responses were discarded, and a total of 244 were retained. Out of
these 244 responses, 218 of them corresponded to a hundred percent progress rate, five of
them to a ninety-one percent progress rate, another five of them to an eighty-six percent
progress rate, four of them to an eighty percent progress rate, two of them to a seventy-five
percent progress rate, another four of them to a sixty-three percent progress rate, three of
them to a fifty-six percent progress rate, and another three of them to the minimal
requirement of a fifty-one percent progress rate.
All variables were then appropriately labelled and renamed, if necessary, in order
to facilitate their identification and interpretation in the various statistical analyses.
Table 3: Questionnaire Distribution Recap Table
Total Emails Sent 14,279 Completion Rate 51%
Invalid Emails 1,787 Discarded
Responses 143
Full Responses 200 Final Exploitable
Sample 244
Partial Responses 187 Business Aircraft
Owners in Sample 43%
Total Responses 387 Stakeholders in
Sample 57%
Response Rate 3,05% Average Response
Time 24 minutes
3.1.5.2 Validating the Dataset
Once the cleaning completed, the validity and reliability of all obtained results were
verified, using two consecutive statistical analyses. Indeed, the results’ sturdiness highly
depended on the quality of the chosen measurement instruments. As such, one statistical
procedure, more precisely the dimension reduction, and one statistical test examining the
Cronbach Alpha’s coefficient of each construct respectively provided crucial information
about the convergent validity and internal reliability of these measurement instruments.
Both statistical tests were executed by using IBM’s statistical analysis software SPSS.
Following Jolibert & Jourdan’s (2006) recommendation, the first step undertaken
was to execute an exploratory factor analysis, in order to not only identify each scale’s

83
dimensions, but also its constituting items. Indeed, analyzing the correlation of each item
with the total score of each scale does not allow the detection of many dimensions within
it, therefore, Jolibert & Jourdan (2006) suggest executing this particular analysis prior to
determining the internal reliability of the research’s constructs and subconstructs. To do
so, the dimension reduction analysis method provided by SPSS was utilized. This method
allowed a close examination of the existing correlations between each item and factor, also
called loadings. For the purpose of this research, all items with a loading greater or equal
to 0,5 were conserved, whereas each one demonstrating a loading inferior to 0,5 were
deleted. This decision is in line with Jolibert & Jourdan (2006) and Kaiser & Rice’s (1976)
recommendations to delete all items with a loading inferior to 0,5, as they do not
appropriately represent the factors retained. In other words, all loadings greater than 0,5
indicate that each related item is strongly correlated with one particular dimension. Finally,
an orthogonal rotation method was also used, more precisely the Varimax rotation, in order
to conserve independent factors, which can facilitate the creation of graphical
representations and the execution of other statistical analyses such as regressions, due to
the fact that it eliminates the phenomenon of multicollinearity between variables (Jolibert
& Jourdan, 2006). The following table illustrates the results of this dimension reduction
analysis (cf. Table 4). Please note that this table is a personal creation, and screenshots
from SPSS related to each construct and subconstruct’s analysis can be found in the annex
section (cf. Annex 2).
Table 4: Dimension Reduction Analysis Results
Construct
Subconstruct Items Loadings
Desires Social Status & Prestige
SocialStatus1
SocialStatus2
SocialStatus3
SocialStatus4
SocialStatus5
0,860
0,891
0,928
0,917
0,850
Desires Convenience
Convenience1
Convenience2
Convenience3
0,901
0,896
0,872
Desires Experience
Experience1
Experience2
Experience3
0,857
0,897
0,833

84
Table 4: Dimension Reduction Analysis Results (Continued)
Construct
Subconstruct Items Loadings
Expectations Experience & Service
Quality
ExperienceQual1
ExperienceQual2
ExperienceQual3
ExperienceQual4
ExperienceQual5
0,753
0,877
0,793
0,852
0,840
Expectations Product Performance
ProdPerf1
ProdPerf2
ProdPerf3
0,884
0,877
0,831
Expectations Perceived Value & Premium
PerceivedValue1
PerceivedValue2 PerceivedValue3
PerceivedValue4
PerceivedValue5
0,817
0,859 0,848
0,849
0,885
Desires Congruency
DesiresCong1
DesiresCong2
DesiresCong3
DesiresCong4
0,765
0,794
0,754
0,819
Expectations Congruency
ExpectCong1
ExpectCong2
ExpectCong3
ExpectCong4
0,763
0,834
0,720
0,796
Product Attributes
Satisfaction Luxury & Comfort Related
LuxuryComfort1
LuxuryComfort2
LuxuryComfort3
LuxuryComfort4
0,924
0,915
0,893
0,625
Product Attributes
Satisfaction Performance Related
PerfoAtt1
PerfoAtt2
PerfoAtt3
PerfoAtt4
0,901
0,896
0,839
0,735
Product Attributes
Satisfaction Service Related
ServiceAtt1
ServiceAtt2
ServiceAtt3
ServiceAtt4
0,913
0,900
0,862
0,560
Information Satisfaction Personal Selling
PersonalSelling1
PersonalSelling2
PersonalSelling3
PersonalSelling4
0,859
0,855
0,238
0,844
Information Satisfaction WOM Satisfaction
WOM1
WOM2
WOM3
WOM4
WOM5
0,875
0,873
0,862
0,811
0,775
Information Satisfaction External Experts Involved
ExternalExp1
ExternalExp2 ExternalExp3
ExternalExp4
0,904
0,898 0,877
0,853

85
Regarding the previous table (cf. Table 4), and more precisely the loadings
pertaining to both desires and expectations congruency constructs, the rotated component
matrix from the dimension reduction analysis demonstrated that both constructs contained
not solely one, but two distinct dimensions: a positive and a negative one. Keeping in mind
that both constructs play crucial roles in this research, the deletion of two out of four
original items in each scale, due to poor loadings, would have caused both scales to lose a
considerable degree of integrity, and would have rendered the data pertaining to both
constructs useless. Therefore, a decision was made to retain both positive and negative
dimensions in each construct, which led to the appropriate modification of this research’s
conceptual model, by adding two subconstructs representing a positive and negative
dimension to each desires and expectations congruency constructs. For sake of
clarification, the positive dimension was found to measure consumers’ satisfaction level,
whereas the negative dimension measured consumers’ dissatisfaction level. The adapted
conceptual model will be presented in the following chapter.
Furthermore, another decision was made to retain the third item of the personal
selling subconstruct, despite its poor loading (PersonalSelling3: 0,238), due to the fact that
this specific item is required not only to assess customers’ degree of satisfaction regarding
personal selling, but also in determining customers’ overall satisfaction level for B2B high-
involvement products. One reason why this item loaded poorly is that it required
participants to share their degree of dissatisfaction, and not satisfaction, about the quality
of personal selling encountered during the purchasing process of a business aircraft. As
such, this cause the presence of one negative-dimension item amongst positive ones.
Nevertheless, the decision to retain this specific item, despite its poor loading, did not
drastically deteriorate the internal reliability of the personal selling subconstruct. Indeed,
the value of this subconstruct’s Cronbach Alpha coefficient, when keeping all four original
items, was of 0,805, compared to 0,909 when the third item was removed (cf. Annex 3).
Consequently, this specific subconstruct was deemed reliable in both cases.
The second step was to insure the internal reliability of all subconstructs. As
mentioned by Jolibert & Jourdan (2006), Cronbach’s Alpha is one of the most frequently
used statistical tests to accomplish such task. This coefficient indicates the degree of
measurement of multiple items supposed to collectively measure a single construct or

86
subconstruct (Jolibert & Jourdan, 2006). For the purpose of this research, a coefficient
greater or equal to 0,6 was deemed to be satisfactory, as consumer satisfaction for B2B
high-involvement products, more precisely business aircraft, is a fairly new research topic
and was never explored before. This decision is in line with Joseph F. Hair et al.’s (2016)
statement that a coefficient located between 0,6 and 0,7 is acceptable for an exploratory
research, and one greater than 0,7 is recommended for a more advanced research. However,
the same authors also warned researchers to be careful in presence of coefficients greater
than 0,90, and even more so when their values exceed 0,95, due to the fact that they usually
signify that the variables’ indicators are measuring the same phenomenon and that the
construct or subconstruct’s measurement is invalid (Joseph F. Hair et al., 2016). To verify
the internal reliability of this research’s subconstructs, the SPSS reliability analysis
function was used. Due to the fact that all Cronbach Alpha coefficients were greater or
very close to 0,6, all measurement instruments used in this research were deemed reliable.
The following table illustrates the results of this internal reliability analysis (cf. Table 5).
Table 5: Internal Reliability Analysis Results
Construct
Subconstruct Cronbach’s Alpha
Desires Social Status & Prestige
0,943
Desires Convenience
0,932
Desires Experience
0,910
Expectations Experience & Service
Quality 0,923
Expectations Product Performance
0,917
Expectations Perceived Value & Premium
0,922
Desires Congruency Positive Dimension
0,570
Desires Congruency Negative Dimension
0,705
Expectations Congruency Positive Dimension
0,548
Expectations Congruency Negative Dimension
0,709

87
Table 5: Internal Reliability Analysis Results (Continued)
Construct
Subconstruct Cronbach’s Alpha
Product Attributes
Satisfaction Luxury & Comfort Related
0,895
Product Attributes
Satisfaction Performance Related
0,910
Product Attributes
Satisfaction Service Related
0,882
Information Satisfaction Personal Selling
0,805
Information Satisfaction WOM Satisfaction
0,909
Information Satisfaction External Experts Involved
0,926
Please note that the previous table is a personal creation, and screenshots from SPSS related
to each subconstruct’s analysis can be found in the annex section (cf. Annex 4).
It is important to mention that some of the subconstructs’ coefficients were greater
than 0,9: social status & prestige (0,943), convenience (0,932), experience (0,910),
experience & service quality (0,923), product performance (0,917), perceived value &
premium (0,922), performance related attributes (0,910), WOM satisfaction (0,909), and
external experts’ involvement (0,926). Nevertheless, none of them were above the critical
value of 0,95, and due to their close proximity to 0,9, along with the uniqueness of this data
collection process, a decision was made to retain all of them. Furthermore, both coefficients
pertaining to the positive dimension of desires congruency (0,570) and expectations
congruency (0,548) came out to be smaller than 0,6. However, due to their close proximity
to the minimal acceptable threshold of 0,6, along with their crucial importance in the
achievement of this research, a decision was made to retain both of them.
The following lines will now describe which modelling methods were considered,
along with the ones that were ultimately retained for the successful completion of this
research.

88
3.1.6 Selecting the Appropriate Modelling Methods
3.1.6.1 Measuring the Dependent Variable
Our calculation of a global satisfaction measure utilized not only Likert scales
assessing customers’ level of satisfaction for specific subconstructs, but also their level of
importance in deciding whether or not to purchase a business aircraft. Consequently, the
resulting method allowed our research team to determine customers’ overall level of
satisfaction while accounting for the importance of specific product attributes involved in
their decision-making process. The fact of accounting for the level of importance provides
a more precise measure of overall satisfaction.
To obtain a general satisfaction score, we used the following procedure. First, the
satisfaction score of the following three product attributes, along with this specific
subconstruct of information satisfaction was measured using seven-points Likert scales:
luxury & comfort attributes, performance attributes, service-related attributes, and personal
selling satisfaction. The first three attributes relate to the product of interest, whereas
personal selling satisfaction can be associated with the quality of information received prior
to the purchase. For each product attribute, along with the information satisfaction
subconstruct, the participant had to indicate its level of importance in a consumer’s
decision to purchase a business aircraft, using a seven-point Likert scale ranging from 1
(little importance) to 7 (most important). Each of these four satisfaction determinants was
then multiplied by its respective importance coefficient. Such four multiplication scores
(level of satisfaction * level of importance) were then added, and lastly divided by a
theoretically perfect score of 196 (7*7 = 49 * 4 = 196). This manipulation allowed us to
obtain an overall score measured in percentage. Therefore, the overall satisfaction score
can range from 0% (completely dissatisfied) to 100% (completely satisfied).
This new SPSS variable was also renamed OverallSatisfaction in the database. All
four components of overall satisfaction were also computed individually, using SPSS’s
compute variable function, in order to obtain further information about the degree of
satisfaction and importance related to each one of them. Further details regarding
participants’ overall degree of satisfaction, and each of the four individual components will
be provided in the upcoming chapter. Another advantage of this method is that it allowed
the execution of regression analyses with all subconstructs from both product attributes

89
and information satisfaction constructs. Finally, a more thorough examination of these
regressions will also be made in the upcoming chapter. It must be noted that various
measurement alternatives for the dependent variable of this model were also considered.
To obtain more information about them, please refer to the annex section (cf. Annex 18).
Please note that the correlation matrix involving all the final constructs and their
corresponding descriptive statistics are presented in the annex section (cf. Annex 19).
3.1.6.2 Testing the Research Hypotheses
All six main hypotheses of this research will be tested in the upcoming chapter,
using linear regression analyses. To do so, SPSS’s linear regression function was used. In
order to validate each main hypothesis, the direction, value and degree of signification of
all causal coefficients, also known as Beta coefficients (), was examined. Such
coefficients will be presented and regrouped in one table, and then interpreted, according
to each hypothesis examined. It must be noted that although six main hypotheses were
previously emitted, each one was tested individually for each subconstruct involved, which
generated a grand total of thirty sub-hypotheses. The significance of all obtained results
was verified, by examining both the p-value and T-statistic associated with each regression.
This is in line with Urbach &Ahlemann’s (2010) statement that T-statistics and the T-
student test allow researchers to test the significance of causal relationships. The R2 of each
sub-hypothesis will also be examined. As mentioned earlier, each sub-hypothesis along
with its results will be examined and interpreted individually in the upcoming chapter.
3.1.6.3 Analyzing Section Seven Measurement Instruments
All additional results originating from section seven’s measurement instruments
will be examined and interpreted using relatively simple statistical analyses, such as
frequency and descriptive analyses. It must be noted that such results aimed to provide
additional background information regarding customers’ overall level of satisfaction for
B2B high-involvement products. They provided complementary insights and also offered
a different perspective than the sole examination of the satisfaction scores provided by the
earlier-described method to analyze this research’s dependent variable. In other words, the
optional questions and measurement instruments from section seven ultimately proved to
be useful not only in the generation of managerial sales recommendations, but also in
accomplishing this research’s secondary objectives.
90
3.2 The Selected Measurement Instruments
This second section will introduce the measurement instruments used to measure
the higher order constructs of this research’s conceptual model, along with their respective
first-order constructs. It must be noted that all of these constructs’ measurement tools are
based on either existing instrument from the current academic literature, and/or some
adaptations or combinations of them.
Each higher order construct from section one to six, along with its respective
subconstructs, were measured using seven-point Likert scales. This specific measurement
instrument was selected not only due to its overall psychometric quality, according to the
current academic literature, but also its high degree of reliability, validity, and this
research’s objectives. On the other hand, the dependent variable of this research, more
precisely the overall consumer satisfaction for B2B high-involvement products, was not
only measured using the specific method described in the previous subsection, but also
with the support of dichotomous, rank order, and open-ended questions. The following
lines will explain in detail the choice of such measurement tools for each retained higher
order constructs.
As mentioned in the previous chapter, this research’s conceptual model includes six
different higher order constructs that act as independent variables, and one acting as the
dependent variable. Four of them contain three subconstructs each, and two of them are
originally exempt from any. Whereas the pre-purchase desires & expectations, and post-
purchase product attributes’ & information satisfaction constructs respectively include
three subconstructs. The conceived measurement Likert scales were inspired in part by
Spreng, MacKenzie and Olshavsky’s (1996) research and methodology. These authors did
not actually use a questionnaire and Likert scales as part of their data collection process,
but instead a series of personal semi-guided interviews. Therefore, the Likert scales
conceived to measure the desires, expectations, and desires’ & expectations’ congruency
constructs were inspired from the described interview process. In regards to the
measurement instruments of both product attributes’ and information satisfaction
constructs, they had to be built from scratch, as no other previous academic research could
be identified measuring such types of constructs.
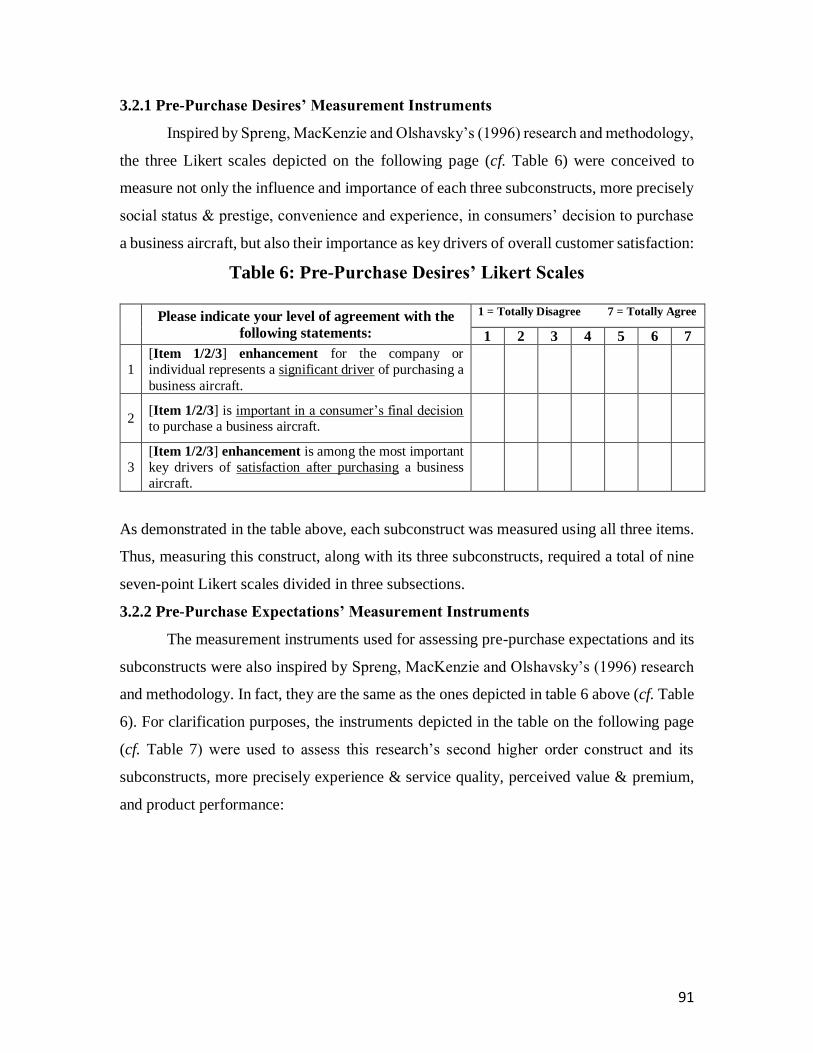
91
3.2.1 Pre-Purchase Desires’ Measurement Instruments
Inspired by Spreng, MacKenzie and Olshavsky’s (1996) research and methodology,
the three Likert scales depicted on the following page (cf. Table 6) were conceived to
measure not only the influence and importance of each three subconstructs, more precisely
social status & prestige, convenience and experience, in consumers’ decision to purchase
a business aircraft, but also their importance as key drivers of overall customer satisfaction:
Table 6: Pre-Purchase Desires’ Likert Scales
Please indicate your level of agreement with the
following statements:
1 = Totally Disagree 7 = Totally Agree
1 2 3 4 5 6 7
1
[Item 1/2/3] enhancement for the company or
individual represents a significant driver of purchasing a
business aircraft.
2 [Item 1/2/3] is important in a consumer’s final decision
to purchase a business aircraft.
3
[Item 1/2/3] enhancement is among the most important
key drivers of satisfaction after purchasing a business
aircraft.
As demonstrated in the table above, each subconstruct was measured using all three items.
Thus, measuring this construct, along with its three subconstructs, required a total of nine
seven-point Likert scales divided in three subsections.
3.2.2 Pre-Purchase Expectations’ Measurement Instruments
The measurement instruments used for assessing pre-purchase expectations and its
subconstructs were also inspired by Spreng, MacKenzie and Olshavsky’s (1996) research
and methodology. In fact, they are the same as the ones depicted in table 6 above (cf. Table
6). For clarification purposes, the instruments depicted in the table on the following page
(cf. Table 7) were used to assess this research’s second higher order construct and its
subconstructs, more precisely experience & service quality, perceived value & premium,
and product performance:
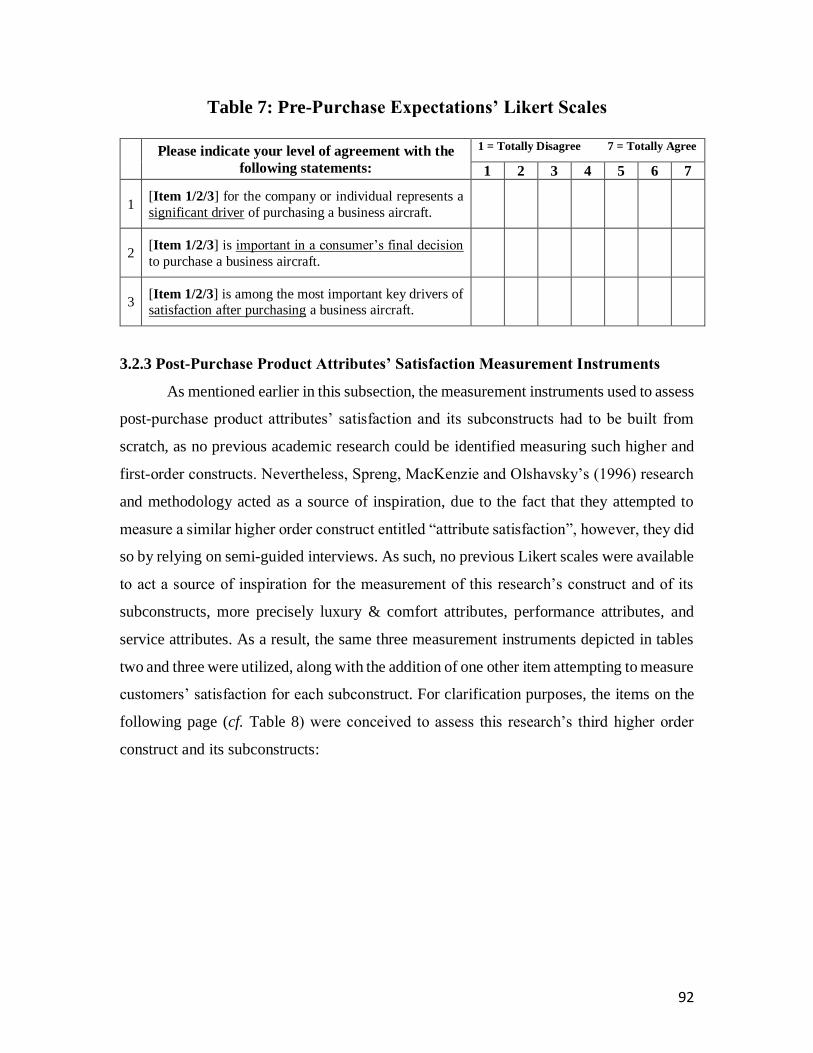
92
Table 7: Pre-Purchase Expectations’ Likert Scales
Please indicate your level of agreement with the
following statements:
1 = Totally Disagree 7 = Totally Agree
1 2 3 4 5 6 7
1 [Item 1/2/3] for the company or individual represents a
significant driver of purchasing a business aircraft.
2 [Item 1/2/3] is important in a consumer’s final decision
to purchase a business aircraft.
3 [Item 1/2/3] is among the most important key drivers of
satisfaction after purchasing a business aircraft.
3.2.3 Post-Purchase Product Attributes’ Satisfaction Measurement Instruments
As mentioned earlier in this subsection, the measurement instruments used to assess
post-purchase product attributes’ satisfaction and its subconstructs had to be built from
scratch, as no previous academic research could be identified measuring such higher and
first-order constructs. Nevertheless, Spreng, MacKenzie and Olshavsky’s (1996) research
and methodology acted as a source of inspiration, due to the fact that they attempted to
measure a similar higher order construct entitled “attribute satisfaction”, however, they did
so by relying on semi-guided interviews. As such, no previous Likert scales were available
to act a source of inspiration for the measurement of this research’s construct and of its
subconstructs, more precisely luxury & comfort attributes, performance attributes, and
service attributes. As a result, the same three measurement instruments depicted in tables
two and three were utilized, along with the addition of one other item attempting to measure
customers’ satisfaction for each subconstruct. For clarification purposes, the items on the
following page (cf. Table 8) were conceived to assess this research’s third higher order
construct and its subconstructs:

93
Table 8: Post-Purchase Product Attributes’ Satisfaction Likert Scales
Please indicate your level of agreement with the
following statements:
1 = Totally Disagree 7 = Totally Agree
1 2 3 4 5 6 7
1 Consumers are usually satisfied with the [Item 1/2/3]
related attributes of their business aircraft.
2
[Item 1/2/3] attributes for the company or individual
represent a significant driver of purchasing a business
aircraft.
3 [Item 1/2/3] attributes are important in a consumer’s
final decision to purchase a business aircraft.
4
[Item 1/2/3] attributes are among the most important
key drivers of satisfaction after purchasing a business
aircraft.
3.2.4 Post-Purchase Information Satisfaction Measurement Instruments
The measurement instruments used to assess this construct and its subconstructs
also had to be conceived from scratch, but some assistance was once again provided by
Spreng, MacKenzie and Olshavsky’s (1996) research and methodology, as the authors also
assessed a higher order construct called “information satisfaction.” However, very little
assistance was provided by this article, as they also assessed this specific construct using
semi-guided interviews, and very little information was provided regarding which
questions were asked during such interviews. As a result, a combination of the Likert scales
used to assess the previous constructs and their subconstructs were used to measure these
specific ones, more precisely personal selling, word-of-mouth (WOM), and external
experts’ satisfaction. Even though changes made to the three items used in the
measurement of all previous constructs are insignificant, one or two items were added for
each subconstruct of this specific construct, in order to truly adapt and improve the
accuracy of their assessment. Therefore, the instruments on the following pages were
conceived (cf. Tables 9,10,11) according to the specific subconstruct of information
satisfaction measured:

94
Table 9: Personal Selling Satisfaction Likert Scales
Please indicate your level of agreement with the
following statements:
1 = Totally Disagree 7 = Totally Agree
1 2 3 4 5 6 7
1
Consumers are usually dissatisfied with the personal
selling quality experienced, during the purchasing
process of their business aircraft.
2 Personal selling quality represents a significant driver
in the purchase of a business aircraft.
3 Personal selling quality is important in a consumer’s
final decision to purchase a business aircraft.
4
Personal selling quality is among the most important
key drivers of satisfaction after purchasing a business
aircraft.
In the case of the personal selling subconstruct, the first item (cf. Table 9) was
modified to express a sentiment of dissatisfaction instead of satisfaction, as Bowman and
Narayandas’s (2001) research proved that people have a greater propensity to share their
degree of dissatisfaction than satisfaction. Consequently, by inciting more participants to
accurately reflect their level of agreement about this statement, this slight modification will
prove to be quite important in the accomplishment of this research’s main objective, more
precisely the generation of managerial sales recommendations.
In regards to the WOM subconstruct, two measurement instruments were added to
the three items utilized in the assessment of all previous higher and first-order constructs.
More precisely, the customer’s likeliness to purchase a business aircraft from one specific
manufacturer, according to his exposure to both positive and negative WOM, was
measured using the first two Likert scales depicted in the table on the following page (cf.
Table 10). The creation of these two items is mostly based on Herr, Kardes and Kim’s
(1991) research that puts forth the fact that positive and negative word-of-mouth do not
only exert a strong influence on customers’ judgment of products, but also on their
purchase intention.

95
Table 10: Word-of-Mouth Satisfaction Likert Scales
Please indicate your level of agreement with the
following statements:
1 = Totally Disagree 7 = Totally Agree
1 2 3 4 5 6 7
1
A consumer is more likely to purchase a business aircraft
from one specific manufacturer if he was exposed to
positive word-of-mouth about that specific
manufacturer.
2
A consumer is less likely to purchase a business aircraft
from one specific manufacturer if he was exposed to
negative word-of-mouth about that specific
manufacturer.
3 Word-of-mouth represents a significant driver in the
purchase of a business aircraft.
4 Word-of-mouth is important in a consumer’s final
decision to purchase a business aircraft.
5
Word-of-mouth is among the most important key
drivers of satisfaction after purchasing a business
aircraft.
Finally, the last subconstruct of this construct, more precisely external experts was
measured using the same three similar items used to assess all of the previously examined
higher and first-order constructs. However, an additional item was used to measure the
influence of external experts on customers’ purchase decision. Indeed, according to Gu,
Park and Konana’s (2012) research, external WOM hosted by independent experts may
have a significant influence on sales of high-involvement products, such as business
aircraft. These authors’ findings demonstrated that consumers have most often already
made up their minds about the purchase of a high-involvement product, when they reach
out to or contact a retailer/manufacturer. Therefore, the items depicted on the following
page (cf. Table 11) were conceived in order to assess the external experts’ subconstruct.

96
Table 11: External Experts’ Satisfaction Likert Scales
Please indicate your level of agreement with the
following statements:
1 = Totally Disagree 7 = Totally Agree
1 2 3 4 5 6 7
1
A consumer is more likely to purchase a business aircraft
from one specific manufacturer if one or multiple
external experts specifically recommended that
manufacturer.
2 External experts represent a significant driver in the
purchase of a business aircraft.
3 External experts are important in a consumer’s final
decision to purchase a business aircraft.
4
External experts are among the most important key
drivers of satisfaction after purchasing a business
aircraft.
3.2.5 Desires’ and Expectations’ Congruency Measurement Instruments
Similarly to the measurement instruments used to assess both product attributes’
and information satisfaction’s higher order constructs and their subconstructs, the items
used to measure desires and expectations congruency had to be conceived from scratch.
Some insights could be derived from Spreng, MacKenzie and Olshavsky’s (1996) research
and methodology, as both higher order constructs also played a key role in their conceptual
model, however, much of the information provided did not prove to be useful for this
particular research. As a result, four seven-point Likert scales were conceived for each
higher order construct, in order to not only measure consumers’ pre-purchase desires’ and
expectations’ degree of fulfillment, following the purchase of their business aircraft, but
also their related degree of dissatisfaction and the impact of the two congruency constructs
on both product attributes’ and information satisfaction constructs. For clarification
purposes, the measurement instruments depicted on the following page (cf. Table 12) were
conceived to assess both of this research’s essential constructs.

97
Table 12: Desires’ and Expectations’ Congruency Likert Scales
Please indicate your level of agreement with the
following statements:
1 = Totally Disagree 7 = Totally Agree
1 2 3 4 5 6 7
1
Consumers’ pre-purchase desires/expectations are
usually fulfilled, following the acquisition of their
business aircraft.
2
After purchasing a business aircraft, a consumer is likely
to express dissatisfaction about the degree of fulfillment
of his pre-purchase desires/expectations.
3 Desires/expectations congruency is likely to positively
affect consumers’ level of information satisfaction.
4 Desires/expectations congruency is likely to negatively
affect consumers’ level of information satisfaction.
3.2.6 Section Seven Measurement Instruments
As mentioned earlier, a combination of dichotomous, rank order and open-ended
questions from section seven were used to provide additional information and results about
this research’s dependent variable. It must be noted that such results were complementary
to the method described earlier, in order to measure customers’ overall satisfaction. In
regards to the sole dichotomous question of section seven, the following query was asked
to the participants:
“Which variable between product attributes satisfaction and information satisfaction
has the most influence on a consumer’s overall business aircraft satisfaction?”
Two choices were then given to respondents, more precisely “product attributes
satisfaction” and “information satisfaction.” The reason why this question was included in
the questionnaire being that it was deemed useful to know which of the two higher order
constructs has the most influence onto overall consumer satisfaction, according to
respondents. Indeed, such question allowed them to directly identify the most influential
component of overall consumer satisfaction, according to their extensive field experience.
However, it is understood that this first question will only play a supportive role in the
generation of managerial sales recommendations, due to the fact that its results will not
allow the execution of elaborate statistical analyses. More details and results related to this
measurement instrument will be provided in the next chapter.

98
Two rank order questions were also included in section seven, in order to measure
the influence of each subconstructs constituting both product attributes’ and information
satisfaction constructs, onto consumers’ overall business aircraft level of satisfaction. More
precisely, the following statement was presented twice to the participants:
“Place the concepts listed below in ascending order of influence on the overall satisfaction
of a business aircraft consumer.”
The participants were then asked to rank the three different subconstructs pertaining to the
product attributes’ satisfaction construct on a scale of one to three, and then repeat the same
task for all three subconstructs of the information satisfaction construct. For clarification
purposes, the presented product attributes’ satisfaction subconstructs were luxury &
comfort attributes, performance attributes and service-related attributes. On the other hand,
the ones for information satisfaction were personal selling, word-of-mouth and external
experts’ involvement. A statistical analysis was then performed to determine the weighted
influence of each above-mentioned subconstructs onto the overall satisfaction of business
aircraft consumers. This analysis was performed by multiplying the respective degree of
influence of both product attributes satisfaction and information satisfaction constructs,
obtained from a frequency analysis of the above dichotomous question, with the frequency
of their three respective subconstructs. Consequently, the resulting values represented the
weighted influence of all six subconstructs onto consumers’ overall satisfaction. Such
information proved to be useful in identifying the most important subconstructs to include
in the final managerial sales recommendations. These results, along with the calculation
used to obtain them, will be examined more in-depth in the upcoming chapter.
Finally, three open-ended questions were included in the last segment of section
seven. These questions were conceived in order to obtain more depth, and richer insights
than with only quantitative methods in regards to three specific topics. More precisely,
consumer dissatisfaction related to the purchasing process and any physical and/or
performance aspects of a business aircraft, consumer dissatisfaction related to
manufacturers’ sales department and/or salespeople, and possible improvements for
manufacturers’ sales department and/or salespeople. For clarification purposes, the

99
participants were asked to provide any opinion and/or insights, after being presented with
the following three queries:
1. “What are some aspects related to their business aircraft that consumers are least
satisfied with? This may include any product attributes, functionalities or
aspects/steps of the purchasing process.”
2. “What are some aspects that consumers are least satisfied with, in regards to
business aircraft manufacturers’ sales department and/or salespeople?”
3. “What are some aspects that business aircraft manufacturers’ sales department
and/or salespeople should improve? Please provide any recommendations you
may have.”
Following Bowman and Narayandas’s (2001) recommendations, all queries required
participants to express a sentiment of dissatisfaction, due to the fact that people tend to
have a greater propensity to share their degree of dissatisfaction than satisfaction. Such
strategy was, therefore, used to incite a maximum of participants to share their opinion
and/or insights about the above-mentioned topics. The responses to the first two open-
ended questions were then coded and analyzed, in order to obtain quantitative data that will
provide further support to generate insightful managerial sales recommendations. More
precisely, all responses to the first query were coded using product attributes and
information satisfaction subconstructs, whereas the responses pertaining to the second
query were coded using three identified categories: salespeople transparency/honesty,
salespeople overall knowledge and salespeople timeliness of follow-up. For clarification
purposes, if a response to the first query was deemed to be demonstrating a certain degree
of dissatisfaction regarding one or many subconstructs from both product attributes and
information satisfaction constructs, these specific subconstructs were identified. The same
task was then executed for all responses to the second query, however, the three above-
mentioned categories replaced the six subconstructs from both product attribute and
information satisfaction constructs.
The responses to the last open question were not coded, due to the high subjectivity
of their contents. Indeed, the recommendations obtained varied significantly from one
participant to another, and it was very difficult to identify redundant themes, words or
100
topics that could ultimately be coded and quantitatively analyzed. Furthermore, even if all
responses would have been coded and analyzed, the statistical outcomes would not have
revealed samples of different categories large enough to be deemed either reliable and/or
significant. It must also be mentioned that this research aimed to generate its own
managerial sales recommendations based on factual scientific data acquired through of a
rigorous and methodical process, without being biased by previously emitted personal
opinions or judgments. Nevertheless, all recommendations were still examined, and some
did offer interesting insights and/or general ideas that could be objectively harvested for
the purposes of this research. Further details regarding the most interesting responses to
this last query, along with frequency analyses of the codification of the first two open-
ended questions will be provided in the following chapter.
3.3 Conclusion
The objective of this third chapter was to disclose the selected methodology of this
research. As a result, the first section of this chapter introduced not only the preferred data
collection process, more precisely the cross-sectional method, but also the selected
population and sample comprised of global current or past business aircraft owners, along
with global stakeholders that currently are or have been involved in the purchasing process
of a business aircraft on the customer’s side.
The selection of this population and sample can be explained by the fact that
academic research pertaining to the business aircraft industry, especially regarding sales
and marketing is quite scarce, if not inexistent. This can be explained by the fact that such
industry professionals or salespeople have a very limited amount of time to answer surveys
or grant interviews to interested researchers, being consistently involved in time-
consuming projects or travelling from one location to another. Furthermore, the
confidentiality aspect is quite important in the aerospace industry, not only due to the fact
that extensive sums of money are often invested in the development of new products,
technologies or projects, but also that the level of industrial competitiveness is amongst
one of the highest of all industries combined. Therefore, many business aircraft
professionals or salespeople tend to avoid or turn down any invitations to participate in
academic researches requiring them to share relatively sensitive information or data.

101
The development of the final questionnaire, its pretest, its distribution using the
Qualtrics survey platform, and the key role played by the specialized aviation database
JETNET.com were also explained. The selected modelling methods used to not only
measure the dependent variable of this research, but also test and verify the research
hypotheses emitted in the previous chapter were then presented. Then followed the second
section of this chapter, in which the chosen measurement instruments were introduced.
Three to five seven-point Likert scales were either adapted from the existing academic
literature, conceived from scratch or resulted from a combination of both to measure the
six independent higher order constructs of this research, along with their subconstructs. On
the other hand, a combination of dichotomous, rank order and open-ended questions were
used to provide additional insights regarding consumers’ overall satisfaction for B2B high-
involvement products. Now that the preliminary steps of this research have been explained,
its awaited results and their interpretation will be unveiled in the upcoming chapter.

102

103
Chapter 4: The Results
The main objective of this chapter is to present the results generated by this
research. More precisely, the first section will introduce the adapted conceptual model,
resulting from the validation of the dataset explained in the previous chapter.
The second section will then bring forth the results stemming from the test of all
six previously emitted main research hypotheses, including the examination of the
direction, value and degree of signification of their causal coefficients, also known as Beta
coefficients (). These coefficients will also be individually interpreted, along with their
respective significance. This section will also provide statistical information regarding not
only the measurement of this conceptual model’s dependent variable, but also each of the
four individual components that compose it. Such information aims to provide some
insights regarding the average overall satisfaction of all participants, and the degree of
satisfaction and importance related to each individual component. This shall also allow all
four components to be compared against each other.
Finally, the third section will introduce all results originating from any one of
section seven measurement instruments, which include the sole dichotomous question of
this research, the weighted influence of both product attributes and information satisfaction
subconstructs onto consumers’ overall satisfaction, the frequency analysis of both coded
open-ended questions, and the most interesting insights that can be gained from some of
the responses to the third open-ended question.
4.1 The Adapted Research Conceptual Model
As mentioned in the previous chapter, the original conceptual model of this research
had to be adapted, following the dataset validation process, as two dimensions were
actually present in both expectations and desires congruency constructs. More precisely, a
positive and negative dimension were found to be present, which led to the appropriate
modification of this research’s conceptual model, by adding two subconstructs
representing a positive and negative dimension to each desires and expectations
congruency constructs. For sake of clarification, the positive dimension is found to measure
consumers’ satisfaction level, whereas the negative dimension is measuring consumers’
dissatisfaction level. This aspect must be taken into consideration, when interpreting the

104
results from the hypotheses’ test in the next subsection. As a result, the following figure
(cf. Figure 9) represents the adapted conceptual model obtained:
Figure 9: The Adapted Research Conceptual Model
4.2 Hypotheses’ Tests and Dependent Variable Analysis
4.2.1 Testing the Research Hypotheses
In this second section, results stemming from linear regression analyses used to test
all six research hypotheses previously emitted in chapter 2 will be presented. As mentioned
earlier, the direction, value and degree of signification of all causal coefficients, also known
as Beta coefficients (), will be examined, in order to validate each hypothesis. Such
coefficients will also be presented and regrouped in one table, and then interpreted,
according to each hypothesis examined. The significance of all obtained results will be
verified, by examining both the p-value and T-statistic associated with each regression.
Finally, it must be noted that each research hypothesis and its results will be examined and
interpreted individually.
As a reminder, six main research hypotheses were emitted in the third chapter of
this research. First, the relationship between pre-purchase desires and post-purchase desires
congruency is examined. It is hypothesized that the more stringent pre-purchase desires
are, the lesser post-purchase desires congruency will be. Second, the relationship between
pre-purchase expectations and post-purchase expectations congruency is examined. A
similar hypothesis is emitted, more precisely that the higher pre-purchase expectations are,

105
the lower post-purchase expectations congruency will be. Third, the direct effect of desires
congruency onto information satisfaction is observed, which leads to the hypothesis that
the higher post-purchase desires congruency is, the higher post-purchase information
satisfaction will be. Fourth, the direct effect of expectations congruency onto information
satisfaction is then scrutinized. Similarly, it is hypothesized that the higher post-purchase
expectations congruency is, the higher post-purchase information satisfaction will be. It
must be noted that these last four hypotheses will be individually tested for each of the two
distinct dimensions that were recently added to both desires and expectations congruency
constructs. Fifth, the direct effect of product attributes satisfaction onto overall consumer
satisfaction for B2B high-involvement products will be examined. In this case, it is
hypothesized that the higher post-purchase product attributes’ satisfaction is, the higher
overall consumer satisfaction will be. Finally, the direct effect of information satisfaction
onto overall consumer satisfaction for B2B high-involvement products will also be
investigated. This observation leads to the sixth and last main research hypothesis being
that the higher post-purchase information satisfaction is, the higher overall consumer
satisfaction will be.
The table on the following page (cf. Table 13) provides the Beta coefficient (), p-
value, T-statistic, R2, and adjusted R2 related to each one of the six main hypotheses
mentioned above. Although six main hypotheses were previously emitted, each one will
be tested individually for each subconstruct involved, which will generate a grand total of
thirty sub-hypotheses. Each one of them will then be interpreted and examined
individually, further in this section. Screenshots of each test can be found in the annex
section (cf. Annex 8).

106
Table 13: Research Hypotheses Test Results
Hypothesis Observed Relationship/Effect
Beta () P-value T-statistic Validated
Hypothesis 1.1a Social Status & Prestige → Desires
Congruency (Positive Dimension) -0,030 0,653 -0,450 NO
Hypothesis 1.2a Convenience → Desires
Congruency (Positive Dimension) 0,245 0,000 3,796
NO,
significant but
in opposite
direction
Hypothesis 1.3a Experience → Desires Congruency
(Positive Dimension) 0,160 0,020 2,345
NO,
significant but
in opposite
direction
R2 (R2 adjusted) 0,097 (0,085)
Hypothesis 1.1b Social Status & Prestige → Desires
Congruency (Negative Dimension) 0,163 0,020 2,346 YES
Hypothesis 1.2b Convenience → Desires
Congruency (Negative Dimension) 0,022 0,741 0,331 NO
Hypothesis 1.3b Experience → Desires Congruency
(Negative Dimension) 0,049 0,485 0,699 NO
R2 (R2 adjusted) 0,036 (0,023)
Hypothesis 2.1a Experience & Service Quality →
Expectations Congruency (Positive
Dimension)
0,043 0,543 0,609 NO
Hypothesis 2.2a Product Performance →
Expectations Congruency (Positive
Dimension)
0,125 0,106 1,624 NO
Hypothesis 2.3a Perceived Value & Premium →
Expectations Congruency (Positive
Dimension)
0,145 0,052 1,958
NO,
significant but
in opposite
direction
R2 (R2 adjusted) 0,062 (0,049)

107
Table 13: Research Hypotheses Test Results (Continued)
Hypothesis Observed Relationship/Effect
Beta () P-value T-statistic Validated
Hypothesis 2.1b Experience & Service Quality →
Expectations Congruency
(Negative Dimension)
0,075 0,303 1,033 NO
Hypothesis 2.2b Product Performance →
Expectations Congruency
(Negative Dimension)
-0,084 0,287 -1,068 NO
Hypothesis 2.3b Perceived Value & Premium →
Expectations Congruency
(Negative Dimension)
0,083 0,275 1,094 NO
R2 (R2 adjusted) 0,012 (0,002)
Hypothesis 3.1a Desires Congruency (Positive
Dimension) → Personal Selling 0,242 0,000 3,745 YES
Hypothesis 3.2a Desires Congruency (Positive
Dimension) → WOM Satisfaction 0,161 0,015 2,455 YES
Hypothesis 3.3a Desires Congruency (Positive
Dimension) → External Experts
Involved
0,341 0,000 5,461 YES
R2 (R2 adjusted) 0,058 (0,054)
Hypothesis 3.1b Desires Congruency (Negative
Dimension) → Personal Selling 0,102 0,126 1,535 NO
Hypothesis 3.2b Desires Congruency (Negative
Dimension) → WOM Satisfaction 0,225 0,001 3,473
NO,
significant but
not as
expected
Hypothesis 3.3b Desires Congruency (Negative
Dimension) → External Experts
Involved
0,225 0,001 3,467
NO,
significant but
not as
expected
R2 (R2 adjusted) 0,010 (0,006)
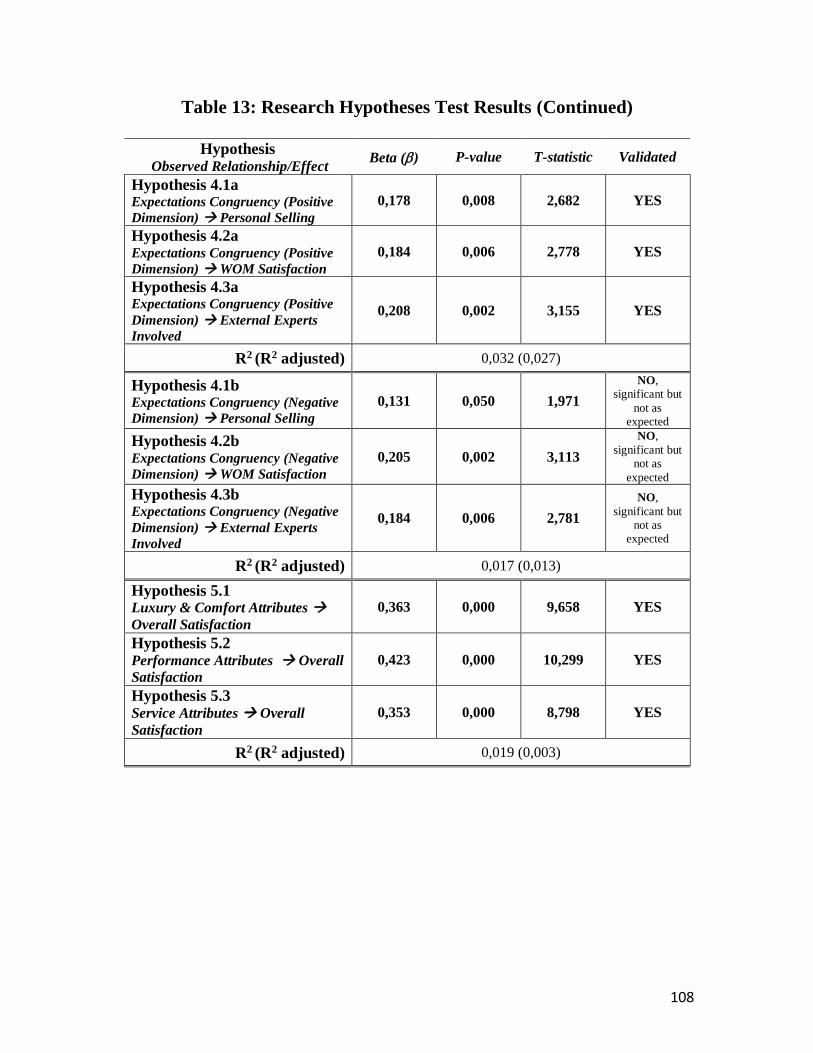
108
Table 13: Research Hypotheses Test Results (Continued)
Hypothesis Observed Relationship/Effect
Beta () P-value T-statistic Validated
Hypothesis 4.1a Expectations Congruency (Positive
Dimension) → Personal Selling 0,178 0,008 2,682 YES
Hypothesis 4.2a Expectations Congruency (Positive
Dimension) → WOM Satisfaction 0,184 0,006 2,778 YES
Hypothesis 4.3a Expectations Congruency (Positive
Dimension) → External Experts
Involved
0,208 0,002 3,155 YES
R2 (R2 adjusted) 0,032 (0,027)
Hypothesis 4.1b Expectations Congruency (Negative
Dimension) → Personal Selling 0,131 0,050 1,971
NO,
significant but
not as
expected
Hypothesis 4.2b Expectations Congruency (Negative
Dimension) → WOM Satisfaction 0,205 0,002 3,113
NO,
significant but
not as
expected
Hypothesis 4.3b Expectations Congruency (Negative
Dimension) → External Experts
Involved
0,184 0,006 2,781
NO,
significant but
not as
expected
R2 (R2 adjusted) 0,017 (0,013)
Hypothesis 5.1 Luxury & Comfort Attributes →
Overall Satisfaction 0,363 0,000 9,658 YES
Hypothesis 5.2 Performance Attributes → Overall
Satisfaction 0,423 0,000 10,299 YES
Hypothesis 5.3 Service Attributes → Overall
Satisfaction 0,353 0,000 8,798 YES
R2 (R2 adjusted) 0,019 (0,003)

109
Table 13: Research Hypotheses Test Results (Continued)
Hypothesis Observed Relationship/Effect
Beta () P-value T-statistic Validated
Hypothesis 6.1 Personal Selling → Overall
Satisfaction 0,442 0,000 6,908 YES
Hypothesis 6.2 WOM Satisfaction → Overall
Satisfaction 0,034 0,587 0,545 NO
Hypothesis 6.3 External Experts Involved →
Overall Satisfaction 0,072 0,245 1,166 NO
R2 (R2 adjusted) 0,015 (0,001)
Prior to beginning the interpretation of the above results, it is imperative to further
clarify the meaning of both desires and expectations congruency constructs’ positive and
negative dimensions. As stated earlier, the positive dimension measures consumers’
satisfaction level and indicates a positive relationship between both subconstructs. On the
other hand, the negative dimension measures consumers’ dissatisfaction level and indicates
a negative relationship between both observed subconstructs. Readers must keep this
aspect in mind, during the following interpretations.
The first main hypothesis emitted in chapter 3 was the following:
Hypothesis 1 The more stringent pre-purchase desires are, the lesser post-
purchase desires congruency will be.
This hypothesis predicts a negative relationship between pre-purchase desires and post-
purchase desires congruency. Sub-hypotheses 1.1a, 1.2b and 1.3b were all found to be
insignificant, each one exhibiting a p-value greater than 0,05. However, sub-hypotheses
1.2a, 1.3a and 1.1b were all significant with p-values above 0,05 and respective beta
coefficients of 0,245, 0,160, and 0,163. Nevertheless, both sub-hypotheses 1.2a and 1.3a
were not validated, as they predicted a positive relationship between both convenience and
experience subconstructs and the positive dimension of desires congruency. Indeed, and as
stated before, main hypothesis 1 predicted a negative relationship between both constructs
involved. Such relationship is, however, predicted by sub-hypothesis 1.1b, as it relates the
social status & prestige subconstruct to the negative dimension of desires congruency, and
demonstrates a p-value of 0,020, and a beta of 0,163. In this context, this specific sub-

110
hypothesis is validated, as it depicts a negative relationship between consumers pre-
purchase desire for social status & prestige, and their post-purchase degree of social status
& prestige fulfilment. In other words, the higher the pre-purchase desire for social status
& prestige, the lesser the degree of fulfilment for this specific desire.
Interestingly, the fact that both sub-hypotheses 1.2a and 1.3a were significant but
not validated, and sub-hypothesis 1.1b was significant and validated, demonstrates that this
first main hypothesis is ambivalent. This term can be described, according to the
Cambridge English Dictionary (2019), as: “having two opposite feelings at the same time”.
Indeed, the results demonstrate the presence of not only a positive relationship between
both desires for convenience and experience, and their degree of post-purchase fulfilment,
but also a negative relationship between consumers’ pre-purchase desire for social status
& prestige, and their degree of post-purchase fulfilment. In other words, the higher the
desire for convenience and experience prior to purchasing a business aircraft, the higher
the degree of fulfilment for both of these specific desires is after purchasing it. It could also
be interpreted in the sense that purchasing a business aircraft confers enhanced level of
convenience and experience to their owners. However, the higher consumers’ desire for
social status & prestige is, prior to purchasing a business aircraft, the lesser their post-
purchase degree of fulfilment will be. In other words, the results seem to indicate that
purchasing a business aircraft does not necessarily confer any social status & prestige to
their owners. It is important to note that this research being exploratory in nature, it would
be important to double-verify such conclusions with a different conceptual model
specifically adapted to B2B high-involvement products.
The second main hypothesis was the following:
Hypothesis 2 The higher pre-purchase expectations are, the lower post-
purchase expectations congruency will be.
This hypothesis predicts a negative relationship between pre-purchase expectations and
post-purchase expectations congruency. In this case, only one of the six sub-hypotheses
was found to be significant, more precisely 2.3a exhibited a p-value of 0,052 and a beta of
0,145. As such, it was not found to be statistically significant, as it indicates a positive
relationship between pre-purchase perceived value & premium and the positive dimension
of the expectations congruency construct, which corresponds to the opposite of what the

111
second main hypothesis, stated above, was supposed to predict. In other words, the higher
the pre-purchase expectations are regarding perceived value & premium, the higher the
post-purchase degree of fulfilment for this specific consumer expectation. This can also be
interpreted in the sense that consumers appear to be satisfied with not only the perceived
value of their business aircraft, but also the degree of premium it confers upon them, after
purchasing it. One explanation for this result could be that the model used, which was
originally conceived for B2C products, is not the right fit for the test of a B2B hypothesis,
such as this second one.
The third main hypothesis was the following:
Hypothesis 3 The higher post-purchase desires congruency is, the higher post-
purchase information satisfaction will be.
In this case, a positive relationship/effect is predicted between both desires’ congruency
and information satisfaction constructs. The results indicate that five out of six sub-
hypotheses were found to be significant with p-values smaller than 0,05, more precisely
3.1a, 3.2a, 3.3a, 3.2b and 3.3b. This said, only three exhibited the relationship predicted by
the third main hypothesis stated earlier, and were thus validated. Such three sub-hypotheses
(3.1a, 3.2a and 3.3a) demonstrated beta coefficients of 0,242, 0,161 and 0,341 respectively.
All three of them can be interpreted in the sense that consumers who fulfilled their pre-
purchase desires such as social status & prestige, experience and convenience following
the acquisition of their business aircraft should also demonstrate a high level of satisfaction
pertaining to the information received by means of personal selling, word-of-mouth, and
external experts during the purchasing process.
Similarly to the first research hypothesis, this third one is also ambivalent as sub-
hypotheses 3.2b and 3.3b were found to be significant, but demonstrate an opposite effect
than what this third main hypothesis originally predicted. Indeed, these two sub-hypotheses
demonstrate that customers who did not fulfill their pre-purchase desires, after purchasing
their business aircraft, could nevertheless demonstrate a high level of satisfaction
pertaining to the information received by means of word-of-mouth and external experts
involved during the purchasing process. The fact that the sub-hypothesis pertaining to the
personal selling subconstruct (3.1b) was not found to be significant depicts a one-way
positive relationship between consumers’ desires congruency and personal selling

112
satisfaction. In other words, this indicates that a good salesperson will play a key role in
helping consumers fulfill their pre-purchase desires, which will also result in a high level
of personal selling satisfaction. However, the results indicate that the opposite cannot be
true; consumers who did not fulfill their pre-purchase desires will tend to be dissatisfied
regarding the information received by means of personal selling, along with its quality.
Such finding allows us to emit that consumers may perceive salespeople as guides.
More precisely, the ones who truly help consumers select the right product for their needs
and desires, which consequently increases such consumers’ likelihood to fulfill their pre-
purchase desires, will be perceived as having provided good product information. As a
result, such consumers will also be satisfied regarding the overall personal selling quality
experienced during the purchasing process. However, consumers who were not guided in
the right direction by salespeople are likely to be dissatisfied regarding the information
received by means of personal selling, along with its quality, which shall also cause their
pre-purchase desires to be left unfulfilled after the acquisition of their business aircraft.
This one-way relationship can also infer that consumers perceive personal selling has
having more importance than WOM and insights given by external experts, when
purchasing a business aircraft.
The fourth main hypothesis was the following:
Hypothesis 4 The higher post-purchase expectations congruency is, the higher
post-purchase information satisfaction will be.
This hypothesis predicts a positive relationship/effect between the expectations’
congruency and information satisfaction constructs. All six sub-hypotheses 4.1a, 4.2a,
4.3a, 4.1b, 4.2b and 4.3b were all found to be significant with p-values smaller than 0,05
and demonstrated beta coefficients of 0,178, 0,184, 0,208, 0,131, 0,205 and 0,184
respectively. Therefore, these results indicate that sub-hypotheses 4.1a, 4.2a and 4.3a were
all validated, as they also represented a positive relationship between the positive
dimension of the expectations congruency constructs and all three subconstructs of the
information satisfaction construct, more precisely personal selling, WOM satisfaction and
external experts involved. However, this fourth main hypothesis is also ambivalent, as sub-
hypotheses 4.1b, 4.2b and 4.3b were also found to be significant, but demonstrate an
opposite relationship to what was originally predicted by this fourth main hypothesis. In

113
other words, these last three sub-hypotheses indicate that even though customers may not
have fulfilled their expectations after the acquisition of their business aircraft, they may
nevertheless express satisfaction regarding the information received by means of personal
selling, word-of-mouth and the external experts involved in the transaction. This could be
interpreted in the sense that, in both case scenarios, the fact of receiving information
provides satisfaction to consumers. Once again, it would be crucial to verify such
aforementioned conclusions using a different research model specifically adapted to B2B
high-involvement products.
The fifth main hypothesis was the following:
Hypothesis 5 The higher post-purchase product attributes’ satisfaction is, the
higher overall consumer satisfaction will be.
This hypothesis predicts a positive relationship between the product attributes’ satisfaction
construct and the dependent variable of this research, the overall consumer satisfaction for
B2B high-involvement products. The results indicate that all three sub-hypotheses 5.1, 5.2
and 5.3 were all significant with p-values smaller than 0,05 and beta coefficients of 0,363,
0,423 and 0,353 respectively. These results indicate that the higher consumers’ level of
satisfaction is regarding the luxury & comfort, performance, and service attributes of their
business aircraft, the higher will also be their overall level of satisfaction. It is also possible
to claim that performance attributes have the most importance in determining consumers’
business aircraft overall satisfaction, due to the fact that the beta coefficient associated with
this specific subconstruct is the highest one of all. Luxury & comfort attributes then rank
second in terms of importance, followed by service-related attributes, when determining
consumers’ overall satisfaction level. This can also be interpreted as consumers perceiving
performance attributes as the most important type of product attributes, when purchasing a
business aircraft, respectively followed by luxury & comfort, and service-related attributes.
The sixth and last main research hypothesis was the following:
Hypothesis 6 The higher post-purchase information satisfaction is, the higher
overall consumer satisfaction will be.
This hypothesis predicts a positive relationship between the information satisfaction and
overall consumer satisfaction constructs. According to the results obtained, only one sub-
114
hypothesis (6.1) out of three was found to be significant. The relationship between the
personal selling subconstruct and this research’s dependent variable exhibited a p-value of
0,000 and a beta coefficient of 0,442. This sub-hypothesis is therefore validated. It
demonstrates that the more consumers are satisfied regarding the information received by
means of personal selling, along with the quality of personal selling experienced during the
purchasing process, the higher will be their level of overall satisfaction. The fact that both
sub-hypotheses pertaining to the word-of-mouth and external experts subconstructs were
not found significant also means that they do not seem to have any influence onto
consumers’ level of overall satisfaction. Therefore, it can be interpreted that salespeople
play a key role in shaping consumers’ overall level of satisfaction.
In conclusion, nineteen sub-hypotheses out of thirty were found to be significant,
and eleven were validated. The first main hypothesis was partly validated, the second one
remains invalidated, the third, fourth and fifth ones were fully validated, and the sixth one
was partly validated. It must also be noted that the first, third and fourth main hypotheses
were found to be ambivalent. Nevertheless, the test of specific hypotheses, such as the
second and fourth ones that demonstrated opposite relationships, could have been omitted,
due to the fact that the conceptual model on which they are based was originally conceived
for B2C products. Therefore, and as mentioned before, it would be crucial to double-verify
the outcome of such hypotheses in a future research on the matter, using a novel and fully
adapted conceptual model for B2B high-involvement products.
4.2.2 Dependent Variable Analysis
This subsection will take closer a look at the results from this research’s dependent
variable, more precisely overall satisfaction for B2B high-involvement. Indeed, the method
and formula presented in the previous chapter allowed the calculation of the participants’
level of business aircraft overall satisfaction in percentages. As a reminder, the level of
overall satisfaction was calculated according to the level of importance of each satisfaction
subconstruct measured, more precisely luxury & comfort, performance, service-related
attributes, and personal selling. The fact of accounting for the level of importance provides
a more precise measure of overall satisfaction, as it prevents the final result from being
biased by individual measures of satisfaction deemed less important by participants. All
four individual components were then combined to determine participants’ overall level of

115
satisfaction. The following table (cf. Table 14) presents the obtained results. This table is a
personal creation, and the screenshot from SPSS can be found in the annex section (cf.
Annex 9):
Table 14: Overall Satisfaction Results
Minimum Maximum Mean Std. Dev
Participants’ Overall Satisfaction
Level 0,097 0,898 0,563 0,128
As represented above, the participants expressed an average overall satisfaction level of
approximately 56,3%. The most satisfied participant expressed a satisfaction level of
89,8% and the least one 9,7%. A standard deviation of 12,8% is present amongst the
obtained results. These results seem to indicate that there is a lot of room left for
improvement, when it comes to consumers’ overall level of satisfaction regarding their
business aircraft. Indeed, none expressed being completely satisfied and very few being
highly satisfied.
As mentioned earlier, two categories of respondent answered this research’s
questionnaire, more precisely present and past business aircraft owners, along with
stakeholders who currently are or have been involved in the purchasing process of a
business aircraft on the customer’s end. This said, the following table (cf. Table 15)
provides the satisfaction level of each category of respondent. This table is a personal
creation, and the screenshot from SPSS can be found in the annex section (cf. Annex 10):
Table 15: Overall Satisfaction per Category of Respondent
Minimum Maximum Mean Std. Dev
Business Aircraft Owners’ Overall
Satisfaction 0,2857 0,7704 0,5494 0,1125
Stakeholders’ Overall Satisfaction 0,0969 0,8980 0,5692 0,1347
As represented above, present and past business aircraft owners expressed an average
overall satisfaction level of approximately 54,9%, compared to 56, 9% for stakeholders.
These results also indicate that stakeholders seem to be more extreme in their way of
expressing their overall satisfaction, due to the fact that the minimum and maximum
satisfaction level reported are respectively lower and higher than the ones corresponding
to business aircraft owners. Nevertheless, the average satisfaction level for both category

116
of respondent is very similar, as only a 2% difference exists. As such, stakeholders seem
to be slightly more satisfied in average than business aircraft owners. The following
subsection shall attempt to provide clarifications regarding these results.
4.2.3 Individual Satisfaction Components Analysis
This subsection will provide an analysis of the results pertaining to each individual
component composing participants’ overall level of satisfaction. As stated earlier, each
component attempts to measure a particular subconstruct’s level of satisfaction, according
to its perceived level of importance by participants. Four satisfaction subconstructs were
individually examined, more precisely luxury & comfort attributes, performance attributes,
service-related attributes, and personal selling. The following table (cf. Table 16) presents
the results obtained in percentage. A screenshot of the descriptive analysis from SPSS may
be found in the annex section (cf. Annex 11):
Table 16: Individual Components Satisfaction/Importance Results
Satisfaction Component Examined Satisfaction
Mean Std. Dev
Luxury & Comfort Attributes 0,628 0,201
Performance Attributes 0,663 0,214
Service-Related Attributes 0,534 0,214
Personal Selling 0,424 0,209
The above results indicate that participants expressed an average overall satisfaction level
of 66,3% in regards to business aircraft performance attributes and the relative importance
it has in shaping their level of overall satisfaction. Luxury & comfort product attributes,
service-related product attributes and personal selling were respectively ranked second,
third and fourth in terms of satisfaction, and according to their level of importance. Such
results indicate that consumers are least satisfied with the personal selling aspect of
purchasing a business aircraft, along with its service-related product attributes. Indeed,
participants indicated being satisfied at only 42,4% in regards to personal selling, compared
to 53,4% in regards to business aircraft service-related product attributes.
It was also considered important to examine individually the level of satisfaction,
along with the level of importance of each subconstruct, in order to provide additional
background information. Therefore, the following results were obtained using SPSS’s

117
descriptive analysis function, and each subconstruct’s Likert scale assessing its level of
importance in a consumer’s decision to purchase a business aircraft. Each result was then
manually converted from a seven-point Likert scale score to a percentage (each score was
divided by 7), in order to make its interpretation easier. The following table (cf. Table 17)
regroups such results. A screenshot of the descriptive analysis may be found in the annex
section (cf. Annex 12).
Table 17: Subconstructs’ Satisfaction and Importance Results
Subconstruct Examined Rank Satisfaction
Mean Rank
Importance
Mean
Luxury & Comfort
Attributes 1 0,783 2 0,785
Performance
Attributes 2 0,780 1 0,830
Service-Related
Attributes 3 0,682 3 0,762
Personal Selling 4 0,609 6 0,714
Word-of-mouth N/A N/A 5 0,733
External Experts N/A N/A 4 0,756
The results obtained indicate that participants are most satisfied about the luxury & comfort
attributes of their business aircraft, but they consider performance attributes as the most
important aspect when purchasing an aircraft. Furthermore, it suggests that participants are
least satisfied in regards to the personal selling encountered during the purchasing process,
and that it is also the least important aspect to consider, when deciding whether or not to
purchase a business aircraft.
4.3 Section Seven Measurement Instruments’ Results
This section will introduce the results obtained by each one of section seven
optional measurement instruments. More precisely, the frequency analysis of the
dichotomous question, the weighted influence of both product attributes and information
satisfaction subconstructs onto consumers overall satisfaction, the frequency analysis of
both coded open-ended questions, and the most interesting insights that can be gained from
some of the responses to the third open-ended question. As a reminder, these results aim to
provide additional background information pertaining to customers’ overall level of
satisfaction for B2B high-involvement products. They are thought to provide
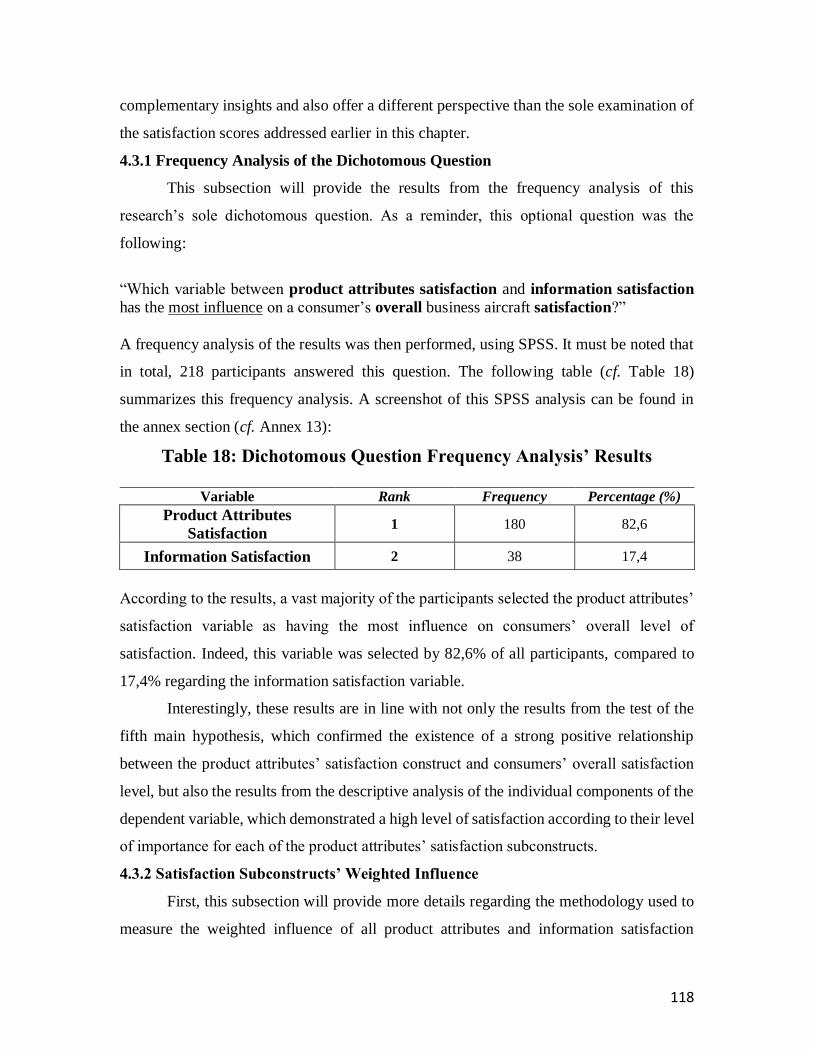
118
complementary insights and also offer a different perspective than the sole examination of
the satisfaction scores addressed earlier in this chapter.
4.3.1 Frequency Analysis of the Dichotomous Question
This subsection will provide the results from the frequency analysis of this
research’s sole dichotomous question. As a reminder, this optional question was the
following:
“Which variable between product attributes satisfaction and information satisfaction
has the most influence on a consumer’s overall business aircraft satisfaction?”
A frequency analysis of the results was then performed, using SPSS. It must be noted that
in total, 218 participants answered this question. The following table (cf. Table 18)
summarizes this frequency analysis. A screenshot of this SPSS analysis can be found in
the annex section (cf. Annex 13):
Table 18: Dichotomous Question Frequency Analysis’ Results
Variable Rank Frequency Percentage (%)
Product Attributes
Satisfaction 1 180 82,6
Information Satisfaction 2 38 17,4
According to the results, a vast majority of the participants selected the product attributes’
satisfaction variable as having the most influence on consumers’ overall level of
satisfaction. Indeed, this variable was selected by 82,6% of all participants, compared to
17,4% regarding the information satisfaction variable.
Interestingly, these results are in line with not only the results from the test of the
fifth main hypothesis, which confirmed the existence of a strong positive relationship
between the product attributes’ satisfaction construct and consumers’ overall satisfaction
level, but also the results from the descriptive analysis of the individual components of the
dependent variable, which demonstrated a high level of satisfaction according to their level
of importance for each of the product attributes’ satisfaction subconstructs.
4.3.2 Satisfaction Subconstructs’ Weighted Influence
First, this subsection will provide more details regarding the methodology used to
measure the weighted influence of all product attributes and information satisfaction

119
subconstructs onto consumers’ overall satisfaction. The obtained results shall then be
examined and interpreted accordingly.
This analysis was performed by multiplying the respective degree of influence of
both product attributes satisfaction and information satisfaction constructs, obtained from
a frequency analysis of the dichotomous question, with the frequency of their three
respective subconstructs, which was obtained by executing a frequency analysis of both
rank-order questions. Consequently, the resulting values represented the weighted
influence of all six subconstructs onto consumers’ overall satisfaction. As a reminder, both
rank-order questions were the following:
“Place the concepts listed below in ascending order of influence on the overall satisfaction
of a business aircraft consumer.”
The participants were then asked to rank the three different subconstructs pertaining to the
product attributes’ satisfaction construct on a scale of one to three, and then repeat the same
task for all three subconstructs of the information satisfaction construct. The results from
the dichotomous question’s frequency analysis having been already examined, the table
(cf. Table 19) below provides the results from both rank-order questions’ frequency
analyses. It must be noted that a total of 203 participants responded to the first rank-order
question, and 195 to the second one. A screenshot of this specific SPSS analysis can be
found in the annex section (cf. Annex 14):
Table 19: Rank-order Questions’ Frequency Analyses’ Results
Satisfaction Subconstruct Rank Mean Mode Maximum Minimum Luxury & Comfort
Attributes 2 2,25 3 3 1
Performance Attributes 1 1,49 1 3 1
Service-Related Attributes 3 2,27 2 3 1
Personal Selling 3 2,09 2 3 1
Word-of-mouth 2 2,03 3 3 1
External Experts 1 1,88 1 3 1
For clarification purposes, a mean value closer to 1 indicates that most participants
ranked that particular satisfaction subconstruct first, which also indicates that they perceive

120
it as having the most influence on consumers’ overall satisfaction. On the other hand, a
mean value closer to 3 represents a satisfaction subconstruct having the least influence on
consumers’ overall satisfaction. As a result, it was possible to rank each subconstruct from
the product attributes’ and information satisfaction constructs, in ascending order of
influence onto consumers’ overall satisfaction. In regards to the product attributes’
satisfaction construct, the results indicate that the most influential subconstruct is a
business aircraft performance attributes, followed by its luxury & comfort attributes, and
lastly its service-related attributes. For the information satisfaction construct, the most
influential subconstruct was found to be the information received by means of external
experts involved in the transaction, followed by word-of-mouth, and lastly personal selling.
Now that each subconstruct and its respective construct were assigned scores and
rankings, the table below (cf. Table 20) will provide the weighted influence of all product
attributes and information satisfaction subconstructs onto consumers’ overall satisfaction,
using the methodology described earlier. More precisely, each subconstruct’s mean will be
multiplied by its respective construct frequency expressed in percentage. A resulting score
will then serve to rank all six satisfaction subconstructs, in ascending order of influence.
Table 20: Subconstructs’ Weighted Influence onto Overall Satisfaction
Satisfaction Subconstruct Final
Rank
Construct
Frequency
Subconstruct
Mean Total Score
Luxury & Comfort Attributes 2 0,826 2,25 0,826*2,25 = 1,859
Performance Attributes 1 0,826 1,49 0,826*1,49 = 1,231
Service-Related Attributes 3 0,826 2,27 0,826*2,27 = 1,875
Personal Selling 6 0,174 2,09 0,174*2,09 = 0,364
Word-of-mouth 5 0,174 2,03 0,174*2,03 = 0,353
External Experts 4 0,174 1,88 0,174*1,88 = 0,327
The final results obtained are not surprising, as they reflect the ones obtained from
both constructs and satisfaction subconstructs’ frequency analyses. It is important to
remember that a mean value closer to 1 signifies a high level of influence, and a mean value
closer to 3 a low level of influence. Therefore, the lowest score of each construct represents
its most influential subconstruct; the overall most influential construct being product
attributes’ satisfaction. Consequently, this analysis identifies performance attributes as the

121
satisfaction subconstruct having the most influence onto consumers’ level of overall
satisfaction, respectively followed by luxury & comfort attributes, service-related
attributes, external experts involved, word-of-mouth, and lastly personal selling.
These results are congruent with the ones obtained from the testing of the main
research hypotheses. More precisely, the highest beta coefficient obtained (0,463), during
the test of the fifth main hypothesis, was the one depicting the relationship between the
performance attributes’ subconstruct and the overall consumer satisfaction. The second and
third highest ones (0,363 and 0,353) were respectively related to the relationships between
the luxury & comfort attributes, and the service-related attributes to the dependent variable
of this research. As such, both analyses reflect the same results in regards to the product
attributes’ satisfaction construct.
However, there are notable differences when it comes to the information
satisfaction construct. Indeed, results obtained during the testing of the sixth main
hypothesis indicated that the relationship between the personal selling subconstruct and
this research’s dependent variable was the strongest one, with a beta coefficient of 0,442.
In other words, personal selling satisfaction was depicted as the most influential
subconstruct of all three, both sub-hypotheses pertaining to WOM satisfaction and external
experts (6.2 and 6.3) having been found insignificant. However, this analysis identified the
external experts and WOM satisfaction subconstructs as having more influence onto
consumers’ overall satisfaction than the personal selling subconstruct.
As mentioned earlier, results from section seven optional measurement instruments
are only examined and interpreted in order to provide additional background information
to the testing of the main research hypotheses, and analyses of the dependent variable and
its individual components. Such results shall be prioritized over the ones described in this
section.

122
4.3.3 Open-ended Questions’ Analysis and Results
This last subsection will present the results obtained from the frequency analysis
of both coded open-ended questions, along with the most interesting insights gained from
some of the responses to the third open-ended question.
The two optional open-ended questions that were coded are the following:
1. “What are some aspects related to their business aircraft that consumers are least
satisfied with? This may include any product attributes, functionalities or
aspects/steps of the purchasing process.”
2. “What are some aspects that consumers are least satisfied with, in regards to
business aircraft manufacturers’ sales department and/or salespeople?”
As a reminder, the six terms used for the coding of the first question were also the
subconstructs of both product attributes and information satisfaction constructs. Indeed,
every aspect of dissatisfaction mentioned by the participants was matched to one or more
of this research’s six satisfaction subconstructs. The codification of each response was then
manually inputted into SPSS’ database. A value of “1” was used to express a feeling of
dissatisfaction pertaining to either one of the six subconstructs, whereas a value of “0” was
used if the participant did not express any dissatisfaction. The table below (cf. Table 21)
provides the results of the codification frequency analysis of this first open-ended question.
It is important to note that a total of 141 participants answered this first open-ended
question. SPSS screenshots of this frequency analysis can be found in the annex section
(cf. Annex 15):
Table 21: Open-ended #1 – Codification Frequency Analysis’ Results
Aspect of Dissatisfaction Rank Frequency Percentage (%)
Luxury & Comfort Attributes 4 19 0,104
Performance Attributes 2 51 0,280
Service-Related Attributes 1 61 0,335
Personal Selling 3 50 0,275
Word-of-mouth 6 0 0,000
External Experts 5 1 0,005

123
As a result, most participants express dissatisfaction regarding business aircraft
service-related attributes, respectively followed by performance attributes, the quality of
personal selling experienced, luxury & comfort attributes, external experts’ involvement,
and lastly word-of-mouth.
The majority of dissatisfaction aspects related to business aircraft service attributes
mentioned included: the cost of planned and unscheduled maintenance, parts, labour,
mandatory services, such as annual inspections, mandatory and optional technological
updates, along with the overall quality of after-sales service and follow-up, the long-time
intervals required to complete inspections and repairs, the lack of interim lift options and
flexibility, and the overall level of availability and serviceability at manufacturers’ service
centres.
In regards to performance attributes, most participants mentioned: higher than
planned costs of operation, lower than advertised real-life performances, mostly pertaining
to aircraft range, speed, payload, airport accessibility, fuel consumption, along with poor
aircraft functionalities and reliability.
A lot of dissatisfaction was also expressed about the quality of personal selling
experienced during the transaction process. The aspects mentioned by participants
included: overselling, overpromising, products’ false representation, the lack of follow-up
from sales after the transaction, misleading information and presentations, deceptive
product comparisons, the purchasing process’ length and complexity, low level of
communication, and overly pushy salespeople.
A few responses included dissatisfaction aspects pertaining to luxury & comfort
product attributes, such as: poor quality of the cabin’s interior and systems, available cabin
configuration, high option prices, such as for coffee makers, wireless internet and
microwave ovens, cabin size, seat comfort, high customization costs, cabin noise, and poor
training related to the cabin’s equipment.
Finally, one response expressed dissatisfaction regarding external experts, by
mentioning inaccurate costs forecasts prepared by external consultants or sales
representatives.
Three codification terms were used for the coding of the second open-ended
questions, more precisely dissatisfaction pertaining to salespeople’s transparency/honesty,

124
overall knowledge, and timeliness of follow-up. The same methodology as question one
was used. The following table (cf. Table 22) will provide the results of the codification
frequency analysis of this second question. It must be noted that a total of 135 participants
answered it. SPSS screenshots of this frequency analysis can be found in the annex section
(cf. Annex 16):
Table 22: Open-ended #2 – Codification Frequency Analysis’ Results
Aspect of Dissatisfaction Rank Frequency Percentage (%)
Salespeople’s
Transparency/Honesty 1 58 0,487
Salespeople’s
Overall Knowledge 2 39 0,328
Salespeople’s
Timeliness of Follow-up 3 22 0,185
As a result, a majority of participants expressed dissatisfaction regarding
salespeople’s transparency and honesty during the purchasing process, respectively
followed by a lack of overall knowledge, and a poor timeliness of follow-up after the
transaction.
The majority of dissatisfaction aspects associated with salespeople’s transparency
and honesty mentioned by participants included: being too pushy, not fairly mentioning
the negative aspects related to the aircraft, not being truthful, providing misrepresentative
data, lying, providing unreliable information, not following through with promises,
overstating performance, downgrading and badmouthing competitors, limiting given
information, being arrogant and using hard sales tactics, and pushing consumers towards
an aircraft that is not suited for their needs.
Participants also mentioned several dissatisfaction aspects related to salespeople’s
overall product knowledge. Such aspects included: lack of hands-on knowledge, preferring
to deal with pilots than salespeople, lacking experience about the products, exhibiting
indifference about the products, not being knowledgeable about competitors’ products, not
being competent, and not being able to properly guide customers through the complex
purchasing process.
Finally, a few comments were made regarding salespeople’s timeliness of follow-
up. Such comments include: a too lengthy purchasing process combined with a slow
response rate from salespeople, a poorly personalized approach by sales, inability to pursue
125
business relationships after sales are concluded, the need to build long-term relationships
before initiating the purchasing process, the lack of timely feedback, and poor
communication skills.
The last open-ended question that was examined but not coded is the following:
“What are some aspects that business aircraft manufacturers’ sales department and/or
salespeople should improve? Please provide any recommendations you may have.”
A total of 109 participants provided recommendations of all types. For the many reasons
mentioned in the previous chapter, such responses were not coded. However, some of them
provided interesting insights that were used towards the formulation of managerial sales
recommendations. The following lines will regroup six of the most compelling responses.
The most interesting ones addressed aspects such as the importance of salespeople
to attend any kind of networking events that high net worth individuals may also attend.
Indeed, this particular participant suggested that salespeople and sales department should
diversify their field activities and involvement outside of the aerospace industry, and
provided examples with events such as NFL’s Super Bowl, Hollywood’s Oscars
celebration and Monaco’s Formula One Grand Prix. The importance of obtaining previous
customers’ referrals was also mentioned in this specific response.
Another participant suggested that salespeople should be more respectful to
customers by being more patient, better listeners and constantly having a positive attitude.
According to this participant, many salespeople are often pushy and arrogant, which causes
customers to avoid them and contact a different manufacturer.
The importance for salespeople to appropriately manage customers’ expectations
by involving more stakeholders with hands-on expertise during the purchasing process was
also mentioned. According to this participant, demonstration pilots, ground technicians,
and the usage of demonstrator aircraft should be involved in the transaction process more
often, in order to provide accurate and trustworthy product information to customers.
Another participant indicated that too much sales data and information is coming
from the United States, which does not appropriately reflect reality for foreign customers
facing much different economic and geopolitical situations. He claimed that sales
information should be adapted to the consumer’s geographical location. He then supported
this statement with an example involving Indian consumers.

126
A fifth participant stood out from the lot by suggesting that manufacturers should
adopt a different compensation structure for their sales force, in order to prioritize quality
over quantity. This comment was most likely referring to the fact that most manufacturers
prefer using a commission structure to remunerate their salespeople, rather than solely
paying fix salaries.
Finally, a sixth participant suggested that manufacturers should implement
specifically designed webpages or online accounts for customers. Such webpages would
provide up-to-date information regarding the manufacturing progress of their aircraft. This
response can be related to the large number of references about manufacturers’ lengthy
purchasing process and salespeople poor communication/follow-up habits.
4.4 Conclusion
This chapter introduced this research’s adapted conceptual model and the results
stemming from the test of all six previously emitted main research hypotheses. Statistical
information regarding the measurement of this conceptual model’s dependent variable and
each of the four individual components that compose it was also provided. Finally, the
results from any one of section seven measurement instruments were then examined and
interpreted.

127

128
Chapter 5: Managerial Recommendations, Discussion, Limitations &
Future Research Perspectives
This last chapter shall introduce the managerial sales recommendations based on
the results presented in chapter 4, along with a discussion, this research’s limitations, and
some potential future research perspectives. The discussion shall be divided in two
subsections. The first subsection will attempt to provide answers to the research objectives
and questions brought forth in chapter 2, using the results and hypotheses’ tests from the
previous chapter. The second subsection will include a reminder of this research’s
problematic and the theoretical framework on which its conceptual model is based. The
conceived conceptual model, along with its overall fit will also be discussed. Lastly, certain
limitations of this study and future research perspectives shall be presented.
5.1 Managerial Sales Recommendations
This first section will introduce the sales recommendations this research aimed to
generate, since its beginning. Such recommendations intend to improve business aircraft
manufacturers and operators’ sales performance, along with their customers’ overall level
of satisfaction. Each one of them is based on the results examined in the previous chapter,
along with the analysis of the three open-ended questions. As such, this research brings
forth the following ten managerial sales recommendations for business aircraft
manufacturers and operators. Please note, the reference pages are indicated in parentheses:
1. Salespeople should act as guides or consultants to customers. They should strive to
help them select the type of aircraft most suited to their needs by being respectful,
active listeners and continuously demonstrating a positive attitude. Arrogant and
snobbish behaviours need to be avoided at all costs (see pages 111 & 123-124).
2. Salespeople should cultivate business relationships in a similar fashion to
friendships. Such relationships shall have existed long enough prior to the
beginning of the purchasing process, and be judiciously maintained after the close
of the transaction. Salespeople shall avoid exhibiting a “sell and forget” attitude
(see page 124).
3. Salespeople should appropriately manage customers’ expectations, by being fully
transparent and honest in regards to the product information provided. Such
information should also include the product’s limitations and actual costs of
ownership. It is critical that salespeople avoid overselling, being pushy, and making
false promises (see pages 123-124).

129
4. Salespeople should accordingly personalize the manner by which they approach
customers. This personalization shall take into consideration various factors, such
as customers’ geographical location and cultural settings. Sales presentations and
any other supportive data shall also be appropriately adjusted (see pages 123-124).
5. Salespeople should involve experienced stakeholders into the purchasing process
more often, such as pilots and ground technicians. It must be noted that these
stakeholders shall have a considerate amount of “hands-on” expertise with the
product sold. Sales department should also make better use of their demo aircraft,
in order to more often provide customers with a glimpse of the real-life experience
associated with the usage of a business aircraft (see page 124).
6. Sales department should invest time and energy into properly educating salespeople
about the technical and operational aspects of their products. If this approach is not
possible, sales department should hire salespeople possessing considerable
knowledge and “hands-on” expertise of their products. Such knowledge is to
include a high level of familiarity with other key players of the industry and their
respective products. Salespeople should never disparage competitors (see page
123).
7. Salespeople should not only respond faster to customers’ requests, but also improve
their overall communication skills. If possible, phone or video conversations, along
with face-to-face meetings should have precedence over more conventional
electronic communications, such as emails and text messages (see page 124).
8. Salespeople should not only be more present for customers after the close of a
transaction, but also offer better support during the course of the purchasing process
(see page 123).
9. Sales department should consider the option of paying their sales force with fixed
salaries, rather than commissions, in order to promote the quality of business
relationships over quantity, and also prevent salespeople from adopting a “sell and
forget” attitude. Sales quotas should be maintained (see page 125).
10. When interacting with customers, salespeople should bring forth the fact that
business aircraft confer their owners with an enhanced level of convenience and a
better flight experience. Performance attributes, along with the aircraft’s value,
ability to buy time and save money shall constitute the basis of the offer (see pages
115-125 and 133).
Many of these recommendations may seem simple and logical, but they are in fact based
on the many previous results examined during chapter 4. Furthermore, and as mentioned
by Åge’s (2011), personal selling need not to be complicated, as it relies on all the parties
involved to work together, trust each other, and continuously learn from each other to

130
eventually create a business relationship based on respect and understanding, in order to
work towards the accomplishment of a mutual goal. This, in essence, is what these
recommendations strive to accomplish.
5.2 The Discussion
As stated earlier, this second section shall be divided in two subsections. The first
one will attempt to provide answers to the research objectives and questions brought forth
in chapter 2, using the results and hypotheses’ tests from the previous chapter. On the other
hand, the second subsection will include a reminder of this research’s problematic, the
theoretical framework on which its conceptual model is based, along with a discussion of
the conceived conceptual model and its overall fit in this particular research.
5.2.1 Answers to the Research’s Objectives and Questions
As stated in chapter 2, the problematic focuses on four research questions, which
also include different objectives. Certain questions and objectives may have been already
answered previously, however, they shall be reiterated for clarification purposes. The first
research question aimed to understand the impact of both desires and expectations
congruency onto information satisfaction.
In regards to the impact of desires congruency onto information satisfaction, the
test of the third research hypothesis demonstrated that consumers who fulfilled their pre-
purchase desires are likely to be satisfied in regards to the information they received by
means of personal selling, word-of-mouth and external experts during the purchasing
process. However, the interesting part is that consumers who did not fulfill their pre-
purchase desires could also be satisfied about the information received through WOM and
external experts, but not the one received by means of personal selling. Indeed, the
relationship between desires congruency and personal selling is unidirectional and
indicates that a good salesperson will play a key role in helping consumers fulfill their pre-
purchase desires, which shall also result in a high level of personal selling satisfaction. In
other words, salespeople can be compared to guides helping consumers select the right
product for their needs. This one-way relationship also implies that consumers perceive
personal selling has having more importance than WOM and insights given by external
experts when purchasing a business aircraft.

131
The impact of desires congruency onto information can therefore be described as
ambivalent, when it comes WOM and external experts’ satisfaction, but solely positive in
regards to personal selling. The significant and mutually beneficial relationship existing
between desires congruency and personal selling may not be understated, and definitely
plays a crucial role in shaping consumers’ overall level of satisfaction.
On the other hand, the impact of expectations congruency onto information
satisfaction is much different. More precisely, the results obtained from the testing of the
fourth main research hypothesis revealed that it is fully ambivalent. This means that
whether or not consumers’ pre-purchase expectations are fulfilled, they may nevertheless
express satisfaction regarding the information received by means of personal selling, word-
of-mouth and the external experts involved in the transaction. In other words, this indicates
that consumers are, in both case scenarios, satisfied about receiving information. Therefore,
it can be claimed that expectations congruency has a constant positive impact onto
information satisfaction.
The second research question aspired to determine the role and influence of both
product attributes and information satisfaction constructs onto consumers’ overall level of
satisfaction. This can be answered by re-examining the results obtained from the testing of
both main hypotheses five and six.
Such results indicate that each product attributes satisfaction’s subconstructs has a
different degree of positive influence onto this research’s dependent variable. The most
influential one being performance attributes with a beta coefficient of 0,423, and then
respectively followed by luxury & comfort attributes ( = 0,363), and lastly service-related
attributes ( = 0,353). These findings are corroborated by section seven subconstructs’
weighted influence analysis, which also ranks all product attributes satisfaction’s
subconstructs in the same order. The fact that all three sub-hypotheses 5.1, 5.2, and 5.3
were found to be significant, compared to only one (6.1) related to the information
satisfaction construct, indicate that as a whole product attributes satisfaction exerts more
influence onto consumers’ overall satisfaction than information satisfaction.
Indeed, the testing of the sixth hypothesis demonstrated that personal selling ( =
0,442) is the only subconstruct from information satisfaction that exerts positive influence
onto customers’ overall level of satisfaction; both WOM and external experts subconstructs

132
having been found insignificant. However, it must be noted that personal selling has a
greater beta coefficient than performance attributes, which indicates that it is the most
influential subconstruct out of both product attributes and information satisfaction
constructs. Furthermore, results obtained from section seven’s dichotomous question
corroborate such conclusions, by indicating that approximately 82,6% of all respondents
selected product attributes satisfaction as having the most influence on consumers’ overall
level of satisfaction. On the other hand, only 17,4% of them selected information
satisfaction as the most influential of both satisfaction determinants. In short, product
attribute satisfaction can be claimed as the construct having the most influence onto
consumers’ overall level of satisfaction, whereas personal selling is the subconstruct with
the most influence onto consumers’ overall satisfaction level.
The third research question aimed at determining the most influential satisfaction
determinant in consumers’ decision to purchase a business aircraft. The fact that this
research’s conceptual model contains six different satisfaction determinants, which
consists of each construct, means that each subconstruct’s level of importance in
consumers’ decision to purchase a business aircraft must be examined. The importance
level of all product attributes and information satisfaction subconstructs was already
determined in subsection 4.2.3. The table (cf. Table 23) on the following page shall
therefore provide not only the level of importance of all desires and expectations
subconstructs, but also reiterate the one of each product attributes and information
satisfaction subconstruct. As mentioned earlier, this score of importance was obtained by
analyzing each subconstruct’s Likert scale assessing its level of importance in a consumer’s
decision to purchase a business aircraft. Each result was then manually converted from a
seven-point Likert scale score to a percentage, in order to make its interpretation easier. A
screenshot of the descriptive analysis from SPSS used to populate such table can be found
in the annex section (cf. Annex 17):
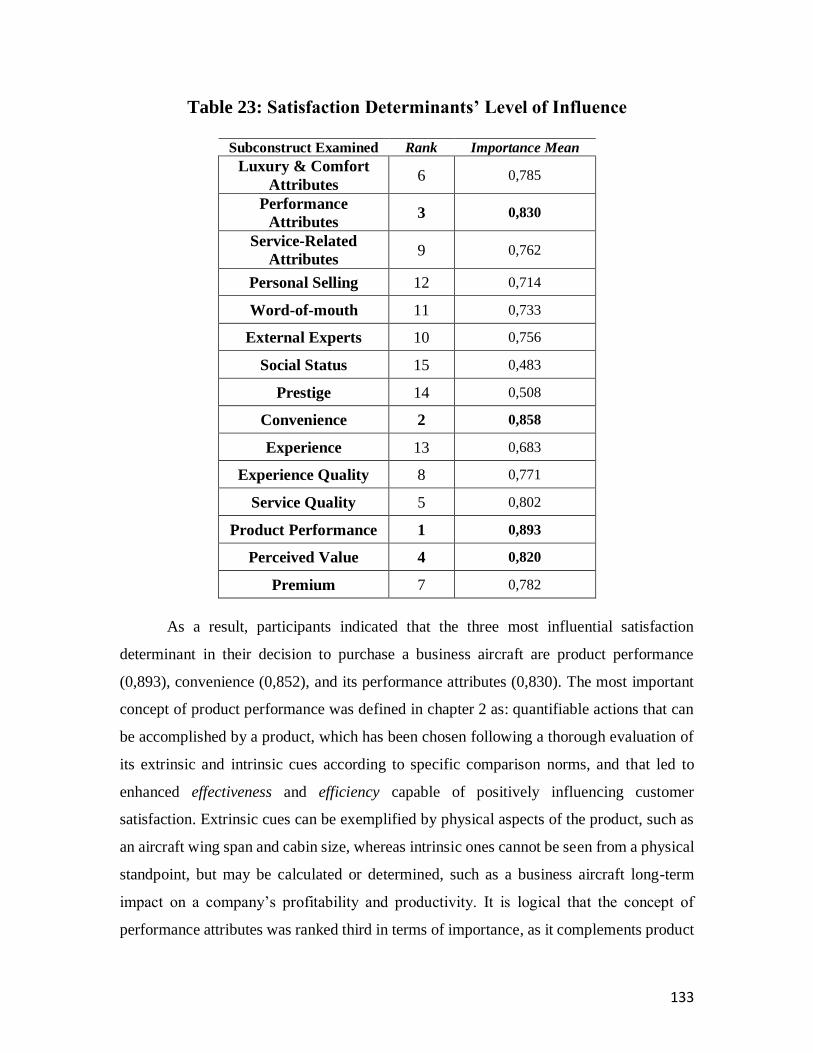
133
Table 23: Satisfaction Determinants’ Level of Influence
Subconstruct Examined Rank Importance Mean
Luxury & Comfort
Attributes 6 0,785
Performance
Attributes 3 0,830
Service-Related
Attributes 9 0,762
Personal Selling 12 0,714
Word-of-mouth 11 0,733
External Experts 10 0,756
Social Status 15 0,483
Prestige 14 0,508
Convenience 2 0,858
Experience 13 0,683
Experience Quality 8 0,771
Service Quality 5 0,802
Product Performance 1 0,893
Perceived Value 4 0,820
Premium 7 0,782
As a result, participants indicated that the three most influential satisfaction
determinant in their decision to purchase a business aircraft are product performance
(0,893), convenience (0,852), and its performance attributes (0,830). The most important
concept of product performance was defined in chapter 2 as: quantifiable actions that can
be accomplished by a product, which has been chosen following a thorough evaluation of
its extrinsic and intrinsic cues according to specific comparison norms, and that led to
enhanced effectiveness and efficiency capable of positively influencing customer
satisfaction. Extrinsic cues can be exemplified by physical aspects of the product, such as
an aircraft wing span and cabin size, whereas intrinsic ones cannot be seen from a physical
standpoint, but may be calculated or determined, such as a business aircraft long-term
impact on a company’s profitability and productivity. It is logical that the concept of
performance attributes was ranked third in terms of importance, as it complements product
134
performance. Indeed, it relates to specific performance aspects, such as an aircraft range,
speed, fuel consumption, passenger seats, etc. Finally, participants also pointed out to the
crucial importance of convenience, a concept previously defined as: a product attribute or
characteristic that reduces its non-monetary cost, by allowing its users to save on resources
such as effort and opportunity, to buy time, and to benefit from added value by being more
efficient, which consequently also improves their overall quality of life.
In short, the sole most influential satisfaction determinant is product performance,
but it can be claimed that a product’s performance, time-saving, and money-making
abilities constitute the most influential aspects that customers consider when purchasing a
B2B high-involvement product, such as a business aircraft.
The second part of the third research question, which also consisted of an objective,
planned to comment participants’ global level of satisfaction. As seen in subsections 5.2.2
and 5.2.3, participants expressed an average satisfaction level of 56,3%. The most satisfied
participant demonstrated a satisfaction level of 89,8%, and the least one a level of 9,7%.
Those results indicate that on average there is a lot of room left for improvement, in terms
of consumers’ overall satisfaction. None of the participants expressed being completely
satisfied and very few being highly satisfied. Furthermore, the results from the individual
satisfaction components’ analysis demonstrated that, relatively to their level of importance,
most participants are satisfied at 66,3% when it comes to business aircraft performance
attributes, then respectively followed by luxury & comfort attributes (62,8%), service-
related attributes (53,4%), and personal selling (42,4%). Therefore, it can be claimed that
business aircraft manufacturers and operators should make it a priority to improve their
personal selling quality. Finally, they should also attempt to improve the overall quality of
their after-sale products and services.
In regards to the fourth research question, it was previously answered in the first
section of this chapter, by generating ten managerial sales recommendations for business
aircraft manufacturers and operators. This also caused our research team to successfully
accomplish our main research objective.

135
5.2.2 Discussion of the Problematic, Theoretical Framework and Conceptual Model
This research is based around the idea that there exists an important gap between
business-to-business (B2B) theory and practice (Gummeson, 2013; Ruiz, Kowalkowski,
2014; LaPlaca, da Silva, 2016). Thus, there is a need to deepen academic knowledge and
create novel perspectives on various non-economic factors, such as feelings, emotions,
trust, consumer satisfaction, and purchase motivations related to or involved in
organizational purchasing (LaPlaca and da Silva, 2016). Furthermore, consumer
satisfaction is not only regarded as the ultimate objective a company aims for when
designing and selling a product, but also as a key element when it comes to consumers
repurchase decision, word-of-mouth behavioural intentions, quality of future business
relationships, and the level of loyalty towards manufacturers (Molinari, Abratt and Dion,
2008; Gil-Saura, Frasquet-Deltoro and Cervera-Taulet, 2009).
Business aircraft manufacturers and operators evolve in very uncertain markets, and
are facing increasing global competitiveness (Hickie, 2006). Consequently, their
operational objectives include looking for ways to continuously improve their sales
performance and rentability. Consumer satisfaction being closely related to consumers
repurchase decision and word-of-mouth behavioural intentions, this research field is
closely related to this objective of business aircraft manufacturers. Also, the fact that most
of their customers evolve within a B2B context represent a particularly interesting
opportunity to deepen academic knowledge pertaining to B2B personal selling.
Furthermore, Rackham (2011) demonstrated that even though the sale of simple
products does not require salespeople anymore as technology can easily replace them,
selling complex products, such as business aircraft, requires the involvement of
experienced salespeople, along with a co-creation process within the different actors
involved in the transactional process. Åge (2011) also pushed this reasoning further by
emphasizing the need for organizational salespeople to adapt to new technologies and more
frequent team-based approaches to selling, the strategic role of selling within organizations,
increased buyer knowledge, and increased emphasis on long-term relationships with
customers. Indeed, increasing market complexity, technological advancements, a higher
number of offerings, and customers’ access to information are all elements that contribute
to the need for a more robust theoretical selling foundation that better explains the role of

136
sales in value co-creation, along with a more holistic approach in sales research and practise
(Hughes, Le Bon and Malshe, 2012; Rapp et al., 2017).
Therefore, and in response to these authors, the main objective of this research
became the formulation of managerial sales recommendations for business aircraft
manufacturers and operators, by adapting Spreng, MacKenzie & Olshavsky’s (1996)
conceptual model with satisfaction determinants thought to be involved in business aircraft
customers’ purchase decision. Specific relationships and effects contained within such
conceptual framework were then analyzed, in order to better understand the satisfaction
determinants that influence customers’ overall level of satisfaction, and decision to
purchase such complex B2B high-involvement products. Obtained results were then
interpreted, in order to accomplish this research’s main objective and potentially improve
business aircraft manufacturers’ sales performance, along with their customers’ overall
level of satisfaction. More precisely, the examination of the effects of desires and
expectations congruency onto information satisfaction, and the influence of product
attributes and information satisfaction onto consumers’ overall level of satisfaction allowed
the identification of the most influential satisfaction determinants in customers’ purchasing
decision, a better comprehension of what business aircraft confer to their owners, which
pre-purchase desires or expectations may be fulfilled by their purchase, along with the most
important extrinsic and intrinsic cues sought by customers.
Such results were obtained by relying on a thorough literature review, some of our
personal beliefs and knowledge of the industry, and by formulating six main research
hypotheses which were ultimately subdivided into thirty sub-hypotheses for precision
purposes. An in-depth questionnaire was then sent to 14,279 worldwide stakeholders
identified as currently playing or having played an active role in the purchasing process of
a business aircraft on the customer’s side, or as current/past business aircraft owners. As a
result, 387 participants accepted to either fully or partially complete the questionnaire. This
data collection process allowed all research hypotheses to be tested, the problematic to be
resolved, and all objectives to be accomplished, using a mix of quantitative and qualitative
analytical methods described in the two previous chapters.
The conceived conceptual model turned out to be appropriate for the testing of
several hypotheses, but not all of them. More precisely, the second hypothesis regarding

137
the direct relationship between pre-purchase expectations and post-purchase expectations
congruency remains invalidated. The fact that such model was inspired from one originally
used in a business-to-consumer (B2C) environment may partly explain this occurrence.
Indeed, most concepts retained and incorporated into such model had been predominantly
used in B2C researches, but not in a B2B context. However, the literature indicated that the
concept of expectations, which relates to the second and still invalidated hypothesis, also
applied to a B2B environment. Therefore, this occurrence incited its inclusion in this
research’s conceptual model. Perhaps the obtained results would have been different, if our
research team would have selected different expectations’ subconstructs, but this event
indicates that the conceived conceptual model would require several adjustments, prior to
being used again in future B2B researches.
Nevertheless, our research team is satisfied with its overall fit and the results it
allowed us to gather. Indeed, the fact that no other academic research was previously done
within the global business aircraft industry explains the exploratory nature of this specific
study, along with all the challenges encountered and overcame along the way pertaining to
the overall fit of this model. From a step back, it allowed us to successfully solve this
research’s problematic, which aimed at better understanding customer satisfaction for B2B
high-involvement products, accomplish the principal objective of generating managerial
sales recommendations for business aircraft manufacturers and operators, and lastly
provide an answer to all four research questions previously brought forth.
5.3 The Limitations
Just like any other academic research, our results are not exempt of weaknesses.
Indeed, this research has a certain amount of limitations, which will be explained in the
following lines.
The first limitation regards fact that the questionnaire was sent to not only current
or past business aircraft owners, but also stakeholders currently playing or having played
an active role in the purchasing process of a business aircraft on the customer’s side. More
precisely, it was assumed by our research team that such stakeholders possessed
considerable knowledge of the business aircraft industry and of owners’ satisfaction level,
but it is impossible to exclude the probability that some of these stakeholders may not have
been as knowledgeable as we thought, or simply decided to share their personal opinions

138
rather than genuine information. Consequently, this could have biased the collected data
and results obtained. It would be pertinent to achieve a similar study by collecting data
solely from present or past business aircraft owners. By doing so, researchers would most
likely acquire higher quality information and insights related to the satisfaction concepts
examined.
The questionnaire used during the data collection process can also be perceived as
another limitation, due to its extensive length and complexity. Indeed, the targeted
investigation field was composed of very busy stakeholders and present or past business
aircraft owners that did not have a lot of free time on their hands. Therefore, the length of
the questionnaire, along with its many often complicated conceptual definitions might have
dissuaded many participants from either fully completing it, or simply attempting it; thus,
limiting the amount of responses obtained. It would be pertinent to attempt a similar
research, but by using either a shorter questionnaire, two complementary ones, and/or semi-
guided interviews with specifically targeted present or past business aircraft owners.
Indeed, the fact of using one shorter questionnaire or two complementary ones could help
researchers obtain a greater number of participants and data. On the other hand, including
interviews in the data collection process, or solely using them like Spreng, MacKenzie &
Olshavsky (1996) did in their research, could lead to the acquisition of much different
insights and results pertaining to the different concepts examined. It could also make it
easier for researchers to verbally explain the concepts studied, rather than doing so in
writing, which can lead to long definitions that may either be difficult to understand or
simply misunderstood.
Finally, one last limitation can be found in the fact that no Likert scales were
included in the questionnaire to measure the dependent variable, more precisely business
aircraft customers’ overall satisfaction. Consequently, this forced us to explore various
alternate measurement methods. As a result, a combination of Likert scales used to measure
different aspects of subconstructs was turned into a formula, which provided customers’
overall level of satisfaction relatively to specific subconstructs and their respective degree
importance in customers’ decision to purchase a business aircraft. Nevertheless, the
questions from section seven used to measure this research’s dependent variable were
mostly qualitative, and did not allow the execution of more elaborate statistical analyses

139
than basic descriptive or frequency analyses. The use of Likert scales could have allowed
the execution of regression analyses between some independent variables and the
dependant one, which could have provided different results and outcomes than the ones
obtained.
5.4 Future Research Perspectives
As demonstrated in chapter 1, academic studies pertaining specifically to the
aerospace industry and the business aircraft industry are quite rare, if not inexistent.
Therefore, many different research perspectives exist and are simply awaiting to be
contemplated. This said, the following lines will bring forth several research perspectives
related to this study.
This research was built around a conceptual model comprising many different types
of satisfaction determinants. As a result, this allowed the collection of a few insights for
each one of these satisfaction determinants, and their respective subconstructs. However,
a similar research could be planned to examine solely one type of satisfaction determinant,
such as business aircraft after-sale services or product attributes satisfaction. Consequently,
all of the results obtained would pertain to that specific type of satisfaction determinant
and generate much more in-depth insights. It would allow researchers to not only scratch
the surface of many, like what this research did, but actually dive into one specific business
aircraft satisfaction determinant’s dimension.
A similar research could also be attempted, but instead of interrogating business
aircraft customers, salespeople would be questioned. This would allow the comparison of
customers and salespeople’s standpoint regarding business aircraft overall satisfaction. It
would also facilitate the identification of gaps between manufacturers and customers’
satisfaction perspectives. Interesting managerial recommendations could then be drafted
and presented to business aircraft manufacturers and operators.
Finally, this research examined the various existing relationships and effects of
satisfaction determinants onto overall customer satisfaction for B2B high-involvement
products, the case of business aircraft. However, it would be quite interesting to either
reproduce this research or attempt a similar one for another type of B2B high-involvement
product, such as luxury yachts, automobiles, and/or helicopters. By doing so, comparisons
could be established between these various types of products and customers, which could

140
result in quite interesting insights. Afterward, these insights or results could then be used
by such product manufacturers for various reasons or goals, like this research’s primary
objective to help business aircraft manufacturers and operators boost their sales
performance, and customers’ overall level of satisfaction.
5.5 Conclusion
This chapter exposed ten managerial sales recommendations aimed at business
aircraft manufacturers and operators, a discussion of this research’s objectives, questions,
problematic, theoretical framework, conceptual model, and motivations. Some of its
limitations were then examined and discussed, along with future research perspectives
either directly related to the business aircraft industry or not, in order to enhance academic
knowledge pertaining to both personal selling and satisfaction for B2B high-involvement
and luxury products. The future research perspectives introduced also brought forth either
new or complementary methodologies to this research.

141
General Conclusion
To conclude, this research attempted to respond to the need to deepen academic
knowledge pertaining to customer satisfaction and personal selling in B2B environments.
As mentioned several times, multiple researchers have argued, in the last few years, that
there exists an important gap between business-to-business (B2B) theory and practice
(Gummeson, 2013; Ruiz, Kowalkowski, 2014; LaPlaca, da Silva, 2016). In order to do,
this research focused on customers’ overall satisfaction for B2B high-involvement
products, more precisely business aircraft.
The problematic it attempted to solve was the following: How can we explain
consumer satisfaction for B2B high-involvement products, more precisely business
aircraft?
Its principal objective was to generate managerial sales recommendations aimed
at business aircraft manufacturers and operators, based on results obtained via a
survey sent throughout the global industry. More precisely, such recommendations
will be based on an analysis that aims to pin point the most influential satisfaction
determinant in consumers’ decision to purchase a business aircraft, and determine
consumers’ overall level of satisfaction. Such analysis will also aim to explore the role
of each satisfaction determinant present in this research’s conceptual model, and
assess the possibility that desires and expectations congruency may affect information
satisfaction. Finally, this research problematic focused on the following four research
questions:
1. What is the impact of desires and expectations congruency onto post-purchase
information satisfaction?
2. What is the role and influence of post-purchase product attributes and information
satisfaction onto consumers’ overall level of satisfaction for B2B high-involvement
products?
3. Which determinant of consumer satisfaction has the most influence in consumers’
decision to purchase a business aircraft, and what is their overall level of
satisfaction?
4. What are some effective managerial sales recommendations aimed at global
business aircraft manufacturers and operators?
142
The test of all six research hypotheses and thirty sub-hypotheses, the measurement
instruments of the questionnaire’s last section, and the analysis of the dependent variable
allowed the collection of insightful results related to many of this research’s objectives.
Only the second main research hypothesis remains invalidated, and three were found to be
ambivalent. Furthermore, such results allowed us to confirm that business aircraft do confer
an enhanced level of convenience and flight experience to their owners. However, it does
not confer any social status or prestige. Product attributes satisfaction was also found to
have the most influence onto consumers’ overall level of satisfaction, compared to
information satisfaction, and personal selling has a beneficial impact customers’ pre-
purchase desires degree of fulfilment. In other words, a good salesperson will play a key
role in helping consumers fulfill their pre-purchase desires, but the opposite will be
damaging. It was also demonstrated that participants expressed an average overall
satisfaction level of approximately 56,3% and are particularly dissatisfied regarding
service-related attributes and personal selling. The most influential satisfaction
determinants in customers’ decision to purchase a business aircraft were also determined
as product performance, convenience, and performance attributes. Therefore, an aircraft’s
performance, ability to buy time and save money constitute the most important aspects that
customers consider, when acquiring a business aircraft.
All of the obtained results allowed the accomplishment of this research’s primary
objective, which consisted to generate managerial sales recommendations aimed at
business aircraft manufacturers and operators. Indeed, ten managerial recommendations
aimed at improving such manufacturers’ sales performance and customers’ overall
satisfaction were brought forth at the end of chapter 5.
Lastly, some of this research’s limitations were then examined and discussed, along
with future research perspectives either directly related to the business aircraft industry or
not, in order to enhance academic knowledge pertaining to both personal selling and
satisfaction for B2B high-involvement and luxury products. Such future research
perspectives brought forth either new or complementary methodologies to this research.

143
References
Åge, L. (2011). Business maneuvering: a model of B2B selling processes. Management
Decision, 49(9), 1574-1591.
Agnihotri, R., Dingus, R., Hu, M., & Krush, M. (2016). Social media: Influencing customer
satisfaction in B2B sales. Industrial Marketing Management, 53, 172-180.
Anderson, C., & Galinsky, A. D. (2006). Power, Optimism, and Risk-Taking. European
Journal of Social Psychology, 36 (July), 511–36.
Anderson, E. W. (1994). Cross-Category Variation in Customer Satisfaction and
Retention. Marketing Letters 5 (1): 19-30.
Anderson, E. W. (1998). Customer Satisfaction and Word of Mouth. Journal of Service
Research, 1 (1), 5-17.
Anderson, E., Fornell, C., & Rust, R. (1997). Customer Satisfaction, Productivity, and
Profitability: Differences Between Goods and Services. Marketing Science, 16(2),
129-145.
Anderson, E. W., & Shugan S. M. (1991). Repositioning for Changing Preferences: The
Case of Beef Versus Poultry. Journal of Consumer Research, 18 (September), 219-32.
Anderson, R. (1973). Consumer Dissatisfaction: The Effect of Disconfirmed Expectancy
on Perceived Product Performance. Journal of Marketing Research, 10(1), 38.
Astrapellos, K., Costa, G., & Astrapellou, X. (2010). The quality of service experience in
outdoor activities programs. International Journal of Sport Management Recreation
& Tourism, 5: 77-87.
Babić Rosario, A., Sotgiu, F., De Valck, K., & Bijmolt, T. (2016). The Effect of Electronic
Word of Mouth on Sales: A Meta-Analytic Review of Platform, Product, and Metric
Factors. Journal of Marketing Research, 53(3), 297-318.
Baker, D., & Crompton, J. (2000). Quality, satisfaction and behavioral intentions. Annals
of Tourism Research, 27(3), 785-804.
Baldwin, C. Y. (2008). Where Do Transactions Come From? Modularity, Transactions,
and the Boundaries of Firms. Industrial and Corporate Change, 17 (1), 155–95.
Baldwin, C. Y., & Clark, K. B. (2000). Design Rules: The Power of Modularity, MIT Press.
Barsky, J., & Nash, L. (2002). Evoking emotion: Affective keys to hotel loyalty. Cornell
Hotel and Restaurant Administration Quarterly, 43(1), 39–46.

144
Bearden, W. O., & Teel J. E. (1983). Some Determinants of Consumer Satisfaction and
Complaint Reports. Journal of Marketing Research, 20 (February), 2.
Belk, R. W. (1988). Third World Consumer Culture, Marketing and Development, Erdogan
Kumuc and A. Fuat Firat, eds., Greenwich.
Belk, R. W. (1988). Possessions and the Extended Self. Journal of Consumer Research, 15
(September), 139-168.
Bell, S.S., Holbrook, M.B., & Solomon, M.R. (1991). Combining aesthetic and social value
to explain preference s for product styles with incorporation of personality and
ensemble effects. To Have Possessions: A Handbook on Ownership and Property.
Journal of Social Behaviour and Personality, Vol. 6 No. 6.
Bergadaa, M. (1990). The Role of Time in the Action of the Consumer. Journal of
Consumer Research, 17 (December), 289-302.
Berry, L. L., Carbone, L. P., & Haeckel, S. H. (2002). Managing the total customer
experience. MIT Sloan Management Review, 43(3), 85–89.
Berry, L., Seiders, K., & Grewal, D. (2002). Understanding Service Convenience. Journal
of Marketing, 66(3), 1-17.
Berry, L. L. (1979). The Time-Buying Consumer. Journal of Retailing, 55 (Winter), 58-
69.
Bierstedt, R. (1970). The social order (2nd ed.). New York, N.Y.: McGraw-Hill.
Bolton, R. N., & Drew, J. H. (1991). A Multistage Model of Customers' Assessments of
Service Quality and Value. Journal of Consumer Research, 17 (March): 375-384.
Bolander, W., Satornino, C. B., Hughes, D. E., & Ferris, G. R. (2015). Social Networks
Within Sales Organizations: Their Development and Importance for Salesperson
Performance. Journal of Marketing, 79 (6), 1–16.
Bolton, R. & Lemon, K. (1999). A dynamic model of customers’ usage of services: usage
as an antecedent and consequence of satisfaction. Journal of Marketing Research,
36(2), pp. 171–186.
Bourdieu, P. (1984). Distinction: A Social Critique of the Judgment of Taste. London:
Routledge.
Boutang, J., & De Lara, M. (2016). Risk Marketing. Retrieved from: https://hal.archives-
ouvertes.fr/hal-01353821v2

145
Bowman, D., & Narayandas, D. (2001). Managing Customer-Initiated Contacts with
Manufacturers: The Impact on Share of Category Requirements and Word-of-Mouth
Behavior. Journal of Marketing Research, 38(3), 281-297.
Brady, M., & Cronin, J. (2001). Some New Thoughts on Conceptualizing Perceived
Service Quality: A Hierarchical Approach. Journal of Marketing, 65(3), 34-49.
Braun, O., & Wicklund, R. (1989). Psychological antecedents of conspicuous
consumption. Journal of Economic Psychology, 10(2), 161-187.
Brown, D. (1991). Human universals (1st ed.). New York: McGraw-Hill.
Brown, L. G. (1990). Convenience in Services Marketing. Journal of Services Marketing,
4 (Winter), 53-59.
Cadotte, E. R., Woodruff, R. B., & Jenkins, R. L. (1987). Expectations and Norms in
Models of Consumer Satisfaction. Journal of Marketing Research, 24 (August), 305-
314.
Cambridge University Press. (2019). Ambivalent. Cambridge Academic Content
Dictionary.
Carbone, L. P., & Haeckel, S. H. (1994). Engineering Customer Experiences. Marketing
Management, Vol. 3, No. 3, 8-19.
Carman, J. M. (1990). Consumer Perceptions of Service Quality: An Assessment of the
SERVQUAL Dimensions. Journal of Retailing, Vol. 66, 33-55.
Carrigan, M., & Szmigin, I. (2006). Mothers of Invention: Maternal Empowerment and
Convenience Consumption. European Journal of Marketing, Vol. 40, No. 9/10, 1122–
1142.
Chen, C., & Chen, F. (2010). Experience quality, perceived value, satisfaction and
behavioral intentions for heritage tourists. Tourism Management, 31(1), 29-35.
Chen, Y., Wang, Q., & Xie, J. (2011). Online Social Interactions: A Natural Experiment
on Word of Mouth Versus Observational Learning. Journal of Marketing Research,
48 (April), 238–54.
Chevalier, J. A., & Mayzlin, D. (2006). The Effect of Word of Mouth on Sales: Online
Book Reviews. Journal of Marketing Research, 43 (August), 345–54.
Churchill, G., & Surprenant, C. (1982). An Investigation into the Determinants of
Customer Satisfaction. Journal of Marketing Research, 19(4), 491.

146
Clarke, K., & Belk, R. W. (1978). The effects of product involvement and task definition
on anticipated consumer effort. H. K. Hunt, ed. Advances in Consumer Research, Vol.
5.
Copeland, Melvin T. (1923). Relation of Consumers’ Buying Habits to Marketing
Methods. Harvard Business Review, 1 (April), 282-89.
Cronin, J., Brady, M., & Hult, G. (2000). Assessing the effects of quality, value, and
customer satisfaction on consumer behavioral intentions in service
environments. Journal of Retailing, 76(2), 193-218.
Cronin, J. J., & Taylor, S. A. (1992). Measuring service quality: a reexamination and
extension. Journal of Marketing, Vol. 56, 55–68.
Csikszentmihalyi, M. (1990). Flow: The psychology of optimal experience. New York,
NY: Harper & Row.
Cummins, D. D. (2005). Dominance, status, and social hierarchies. In D. Buss (Ed.), The
evolutionary psychology handbook (pp. 676−697). New York: Wiley.
Dabholkar, P., Thorpe, D. I., & Rentz, J. O. (1996). A Measure of Service Quality for Retail
Stores. Journal of the Academy of Marketing Science, 24 (Winter), 3-16.
Dawson, S., & Cavell, J. (1986). Status Recognition in the 1980's: Invidious Distinction
Revisited. ACR Proceedings.
de Botton, A. (2004). Status Anxiety. London: Penguin Books.
Dholakia, U. M. (2001). A motivational process model of product involvement and
consumer risk perception. European Journal of Marketing, 35(11) 1340-136.
Diaz Ruiz, C., & Kowalkowski, C. (2014). Market representations in industrial marketing:
Could representations influence strategy?. Industrial Marketing Management, 43(6),
1026-1034.
Dichter, E. (1966). How word-of-mouth advertising works. Harvard Business Review,
44(6), 147-166.
Dixon, A., & Tanner, J. (2012). Transforming Selling: Why It Is Time to Think Differently
About Sales Research. Journal of Personal Selling & Sales Management, 32(1), 9-13.
Dodds, W., Monroe, K., & Grewal, D. (1991). Effects of Price, Brand, and Store
Information on Buyers' Product Evaluations. Journal of Marketing Research, 28(3),
307.

147
Donnenwerth, G., & Foal, U. (1974). Effect of resource class on retaliation to injustice in
interpersonal exchange. Journal of Personality and Social Psychology, 29(6), 785-
793.
Downs, A. (1961). A Theory of Consumer Efficiency. Journal of Retailing, 37 (Spring),
6-12.
Durrande-Moreau, A., & Usunier, J-C. (1999). Time Styles and the Waiting Experience.
Journal of Service Research, 2 (2), 173-86.
Eastman, J. K., Goldsmith, R. E., & Flynn, L. R. (1999). Status consumption in consumer
behaviour: Scale development and validation. Journal of Marketing Theory and
Practice, 7 (3), 41–51.
Ekinci, Y., Dawes, P., & Massey, G. (2008). An extended model of the antecedents and
consequences of consumer satisfaction for hospitality services. European Journal of
Marketing, 42(1/2), 35-68.
Etgar, M. (1978). The Household as a Production Unit. Research in Marketing, Vol. 1,
Jagdish N. Sheth, ed. Greenwich, CT: JAI Press, 79-98.
Evrard, Y., Pras, B., & Roux, E. (2009). Marketing: Fondement Et Méthodes Des
Recherches En Marketing. Paris: Dunod.
Ewen, S. (1988). All consuming images (1st ed.). New York: Basic Books.
Farquhar, J., & Rowley, J. (2009). Convenience: a services perspective. Marketing
Theory, 9(4), 425-438.
Feldman, L. P., & Hornik, J. (1981). The Use of Time: An Integrated Conceptual Model.
Journal of Consumer Research, 7 (March), 407-19.
Fortezza, F., & Pencarelli, T. (2011). Experience marketing: specific features and trends.
The Wish Days case study, Journal of Marketing Trends, 1(6): 57–69.
Frank, R. (1999). Luxury Fever. New York: The Free Press.
French, J. R. P., Jr., & Raven, B. (1959). The Bases of Social Power. Studies in Social
Power, 150–67.
Gagliano, K. B., & Hathcote, J. (1994). Customer Expectations and Perceptions of Service
Quality in Retail Apparel Specialty Stores. Journal of Services Marketing, 8 (1), 60-
69.
Gale, B. T. (1994). Managing customer value: Creating quality and service that customers
can see. New York: Free Press.

148
Galinsky, A. D., Gruenfeld, D. H., & Magee, J. C. (2003). From Power to Action. Journal
of Personality and Social Psychology, 85 (September), 453–66.
Gardial, S. F., Clemons, D. S., Woodruff, R. B., Schumann, D. W., & Burns, M. J. (1994).
Comparing Consumers' Recall of Pre-purchase and Post-purchase Product Evaluation
Experiences. Journal of Consumer Research, 24 (March), 548-6.
Gavard-Perret, M.-L., Gotteland, D., Haon, C., & Jolibert, A. (2012). Méthodologie De La
Recherche En Sciences De Gestion: Réussir Son Mémoire Ou Sa Thèse. Pearson.
Geer, J. (1988). What Do Open-Ended Questions Measure?. Public Opinion
Quarterly, 52(3), 365.
Giese, J., & Cote, J. (2002). Defining Consumer Satisfaction. Academy of Marketing
Science Review, 2000(1), 2-28. Retrieved from:
https://www.researchgate.net/profile/Joan_Giese/publication/235357014_Defining_
Consumer_Satisfaction/links/5419a5790cf203f155ae0afb/Defining-Consumer-
Satisfaction.pdf.
Gil‐Saura, I., Frasquet‐Deltoro, M., & Cervera‐Taulet, A. (2009). The value of B2B
relationships. Industrial Management & Data Systems, 109(5), 593-609.
Godes, D., D. Mayzlin. (2004). Using online conversation to study word of mouth
communications. Journal of Marketing Science, 23(4) 545-560.
Goffman, E. (1959). The presentation of self in everyday life (1st ed.). New York: Anchor
Books.
Graham, R. J. (1981). The Role of Perception of Time in Consumer Research. Journal of
Consumer Research, 7 (March), 335-42.
Greenberg, P. (2010). The impact of CRM 2.0 on customer insight. Journal of Business
and Industrial Management, 25(6), 410–419.
Gross, B. L. (1987). Time Scarcity: Interdisciplinary Perspectives and Implications for
Consumer Behavior. Research in Consumer Behavior, 1-54.
Grönroos, C. (1984). A Service Quality Model and Its Marketing Implications. European
Journal of Marketing, 18 (4), 36-44.
Grönroos, C. (1988). Service Quality: the Six Criteria of Good Perceived Service
Quality. Review of Business, 9 (Winter 1988), (3), 10-14.
Gu, B., Park, J., & Konana, P. (2012). Research Note —The Impact of External Word-of-
Mouth Sources on Retailer Sales of High-Involvement Products. Information Systems
Research, 23(1), 182-196.
149
Gummesson, E. (2014). The theory/practice gap in B2B marketing: reflections and search
for solutions. Journal of Business & Industrial Marketing, 29(7/8), 619-625.
Halstead, D., Hartman, D., & Schmidt, S. L. (1994). Multisource Effects on the Satisfaction
Formation Process. Journal of the Academy of Marketing Science, 22 (Spring), 114-
129.
Hambleton, R. K. (2001). The Next Generation of the Itc Test Translation and Adaptation
Guidelines. European Journal of Psychological Assessment, Vol. 17, No. 3, 164-172.
Harland, N., & Holey, E. (2011). Including open-ended questions in quantitative
questionnaires—theory and practice. International Journal of Therapy and
Rehabilitation, 18(9), 482-486.
Hartmann, N., Wieland, H., & Vargo, S. (2018). Converging on a New Theoretical
Foundation for Selling. Journal of Marketing, 82(2), 1-18.
Hayakawa, S. (1963). Symbol, Status, and Personality. The English Journal, 53(5), 389.
Herr, P., Kardes, F., & Kim, J. (1991). Effects of Word-of-Mouth and Product-Attribute
Information on Persuasion: An Accessibility-Diagnosticity Perspective. Journal of
Consumer Research, 17(4), 454.
Heskett, J. L., Sasser, W. E., & Schlesinger, L. A. (1997). The Service Profit Chain, Free
Press, New York, NY.
Hibbert, S., Winklhofer, H., & Temerak, M. S. (2012). Customers as resource integrators
toward a model of customer learning. Journal of Service Research, 15(3), 247–261.
Hickie, D. (2006). Knowledge and competitiveness in the aerospace industry: The cases of
Toulouse, Seattle and north-west England. European Planning Studies, 14(5), 697-
716.
Hirsch, F. (1976). The Social Limits to Growth. Cambridge, MA: Harvard University
Press.
Holbrook, M., & Hirschman, E. (1982). The experiential aspects of consumption:
Fantasies, feelings, and fun. Journal of Consumer Research, 9, 132–140.
Hornik, J. (1984). Subjective vs. Objective Time Measures: A Note on the Perception of
Time in Consumer Behavior. Journal of Consumer Research, 11 (June), 615-18.
Holbrook, M. B. (2000). The Millennial Consumer in the Texts of Our Times: Experience
and Entertainment. Journal of Macromarketing, 20(2): 178–192.

150
Holbrook, M. B. (1994). The nature of customer's value: An axiology of service in
consumption experience. in R. T. Rust, & R. L. Oliver (Eds.), Service quality: New
directions in theory and practice (pp. 21–71). Thousand Oaks, CA: Sage Publications.
Hoyer, W. D., and MacInnis, D. J. (2001). Consumer behavior. Houghton Miffin
Company.
Hudson, L. A., & Ozanne, J. L. (1988). Alternative Ways of Seeking Knowledge in
Consumer Research. Journal of Consumer Research, 14, 4, 508-521.
Hughes, D. E., Le Bon, J., & Malshe, A. (2012). The Marketing-Sales Interface at the
Interface: Creating Market-Based Capabilities Through Organizational Synergy.
Journal of Personal Selling & Sales Management, 32 (1), 57–72.
Hunt, S. D., & Nevin, J. R. (1974). Power in a Channel of Distribution: Sources and
Consequences. Journal of Marketing Research, 11 (May), 186–93.
Hyman, H. H. (1942). The Psychology of Status. New York: Columbia University.
Ismail, A. (2011). Experience Marketing: An Empirical Investigation. Journal of
Relationship Marketing, 10(3), 167-201.
Jacoby, J., Szybillo, G. J., & Berning, C. K. (1976). Time and Consumer Behavior: An
Interdisciplinary Overview. Journal of Consumer Research, 2 (March), 320-39.
Jayawardhena, C. (2010). The impact of service encounter quality in service evaluation:
evidence from a business‐to‐business context. Journal of Business & Industrial
Marketing, 25(5), 338-348.
Johnson, M., Nader, G., & Fornell, C. (1996). Expectations, perceived performance, and
customer satisfaction for a complex service: The case of bank loans. Journal of
Economic Psychology, 17(2), 163-182.
Jolibert, A., & Jourdan, P. (2006). Marketing Reseach: Méthodes De Recherche Et
D'études En Marketing. Paris: Dunod.
Kaiser, H. F., & Rice, J. (1974). Little Jiffy Mark 4. Educational and psychological
measurement, 34, Spring, 111-117.
Kapferer, J., & Bastien, V. (2012). The luxury strategy: break the rules of marketing to
build luxury brands (2nd ed.). London: Kogan Page.
Kapferer, J. (1998). Les marques, capital de l'entreprise. Éditions Organisation.
Kapferer, J., & Laurent, G. (1982). La sensibilité aux marques. Éditions Organisation.

151
Kelley, E. J. (1958). The Importance of Convenience in Consumer Purchasing. Journal of
Marketing, 23 (July), 32-38.
Keltner, D., Gruenfeld, D. H., & Anderson, C. (2003). Power, Approach, and Inhibition.
Psychological Review, 110 (April), 265–84.
Kjellberg, H., & Helgesson, C-F. (2006). Multiple Versions of Markets: Multiplicity and
Performativity in Market Practice. Industrial Marketing Management, 35 (7), 839–55.
Kohli, R., Devaraj, S., & Mahmood, M. (2004). Understanding Determinants of Online
Consumer Satisfaction: A Decision Process Perspective. Journal of Management
Information Systems, 21(1), 115-136.
Kotler, P. (1984). Marketing Management Analysis, Planning and Control. Prentice-Hall,
Englewood Cliffs, NJ.
Kotler, P., & Zaltman, G. (1971). Social Marketing: An Approach to Planned Social
Change. Journal of Marketing, 35 (July), 3-12.
Knecht, T., Leszinski, R., & Weber, F. (1993). Memo to a CEO. The McKinsey Quarterly,
Vol. 4, 79-86.
Lam, S., Shankar, V., Erramilli, M., & Murthy, B. (2004). Customer Value, Satisfaction,
Loyalty, and Switching Costs: An Illustration From a Business-to-Business Service
Context. Journal of The Academy of Marketing Science, 32(3), 293-311.
LaPlaca, P., & da Silva, R. (2016). B2B: A Paradigm Shift from Economic Exchange to
Behavioral Theory: A Quest for Better Explanations and Predictions. Psychology &
Marketing, 33(4), 232-249.
Laurent, G. & Kapferer, J. (1985). Measuring consumer involvement profiles. Journal of
Marketing Research, 22(1) 41-53.
Levy, S. (1978). Marketplace behavior (1st ed.). New York: AMACOM.
Lovelock, C. H. (1994). Product Plus: How Product + Service = Competitive Advantage.
Boston: McGraw-Hill.
Lovelock, C. H. (2000). Service marketing (4th ed.). NJ: Prentice Hall International.
Mabry, B.D. (1970). An Analysis of Work and Other Constraints on Choices of Activities.
Western Economic Journal, 8 (September), 213-25.
Madaleno, R., Wilson, H., & Palmer, R. (2007). Determinants of Customer Satisfaction in
a Multi-Channel B2B Environment. Total Quality Management & Business
Excellence, 18(8), 915-925.

152
Magee, J. C., Galinsky, A. D., & Gruenfeld, D. H. (2007). Power, Propensity to Negotiate,
and Moving First in Competitive Interactions. Personality and Social Psychology
Bulletin, 33 (February), 200–212.
Marsh, H. W., & Yeung, A. S. (1999). The Lability of Psychological Ratings: The
Chameleon Effect in Global Self-Esteem. Personality and Social Psychology Bulletin,
25 (1): 49-64.
Martin, C. (1998). Relationship marketing: a high‐involvement product attribute
approach. Journal of Product & Brand Management, 7(1), 6-26.
Mason, R. S. (1981). Conspicuous Consumption: A Study of Exceptional Consumer
Behavior, St Martin’s Press, New York, NY.
McConnel, J. D. (1968). Effect of Pricing on Perception of Product Quality. Journal of
Applied Psychology, 52 (August), 300-303.
McCraken, G. (1988). Culture and Consumption, Indiana University Press, Bloomington
and Indianapolis, IN.
McDougall, G. H., & Levesque, T. (2000). Customer satisfaction with services: putting
perceived value into the equation. Journal of Services Marketing, Vol. 14, 392–410.
Miller, G. (2009). Spent. Sex, Evolution, and Consumer Behavior. New York: Viking
Penguin.
Moe, W. W., & Trusov, M. (2011). The Value of Social Dynamics in Online Product
Ratings Forums. Journal of Marketing Research, 48 (June), 444–56.
Mohr, L. A., & Bitner, M. J. (1995). The Role of Employee Effort in Satisfaction with
Service Transactions. Journal of Business Research, 32 (3), 239-52.
Molinari, L., Abratt, R., & Dion, P. (2008). Satisfaction, quality and value and effects on
repurchase and positive word‐of‐mouth behavioral intentions in a B2B services
context. Journal of Services Marketing, 22(5), 363-373.
Murphy, P. E., & Enis, B. M. (1986). Classifying Products Strategically. Journal of
Marketing, 50 (July), 24-42.
Neely, A., Gregory, M., & Platts, K. (1995). Performance measurement system
design. International Journal of Operations & Production Management, 15(4), 80-
116.
Nelissen, R., & Meijers, M. (2011). Social benefits of luxury brands as costly signals of
wealth and status. Evolution and Human Behavior, 32(5), 343-355.

153
O’Cass, A., & Frost, H. (2004). Exploring consumer status and conspicuous consumption.
Journal of Consumer Behaviour, 4(1), 25–39.
Oh, H. (2000). Diner’s perceptions of quality, value and satisfaction. Cornell Hotel and
Restaurant Administration Quality, 41(3), 58–66.
Olander, F. (1970). The Influence of Price on the Consumer’s Evaluation of Products.
Pricing Strategy, B. Taylor G. Wills, eds., Princeton, NJ: Brandon/Systems Press.
Oliva, R., & Kallenberg, R. (2003). Managing the transition from products to
services. International Journal of Service Industry Management, 14(2), 160-172.
Oliver, R. L., & DeSarbo, W. S. (1988). Response determinants in satisfaction judgments.
Journal of Consumer Research, 14, 495–508.
Oliver, R. L., & Swan, J. E. (1989). Consumer Perceptions of Interpersonal Equity and
Satisfaction in Transactions: A Field Survey Approach. Journal of Marketing, 5 (2),
21-35.
Oliver, R. (1993). Cognitive, Affective, and Attribute Bases of the Satisfaction Response.
Journal of Consumer Research, 20 (December), 418-422.
Oliver, R. L. (1989). Processing of the Satisfaction Response in Consumption: A Suggested
Framework and Research Propositions. Journal of Consumer Satisfaction,
Dissatisfaction, and Complaining Behavior, Vol. 2: 1-16.
Oliver, R. L. (1980). A Cognitive Model of the Antecedents and Consequences of
Satisfaction Decisions. Journal of Marketing Research, 17 (November): 460-469.
Olshavsky, R., & Miller, J. (1972). Consumer Expectations, Product Performance, and
Perceived Product Quality. Journal of Marketing Research, 9(1), 19-35.
Olson, J. C., & Dover, P. A. (1979). Disconfirmation of Consumer Expectations Through
Product Trial. Journal of Applied Psychology, 64 (2), 179-183.
O’Shaughnessy, J. (1992). Explaining Buyer Behavior. Oxford University Press, New
York, NY.
O’Shaughnessy, J. (1987), Why People Buy. New York: Oxford University Press.
Otto, J. E., & Ritchie, J. R. B. (1996). The service experience in tourism. Tourism
Management, 17(3), 165–174.
Packard, V. (1959) The Status Seekers. David McKay, New York, NY.

154
Parasuraman, A., Zeithaml, V. A., & Berry, L. (1988). SERVQUAL: a multiple item scale
for measuring consumer perceptions of service quality. Journal of Retailing, 64(1),
12–40.
Parasuraman, A., Zeithaml, V. A., & Berry, L. (1985). A conceptual model of service
quality and its implications for future research. Journal of Marketing, 49(4), 41–50.
Patterson, P., Johnson, L., & Spreng, R. (1997). Modeling the determinants of customer
satisfaction for business-to-business professional services. Journal of The Academy of
Marketing Science, 25(1), 4-17.
Patterson, P. (1993). Expectations and product performance as determinants of satisfaction
for a high-involvement purchase. Psychology and Marketing, 10(5), 449-465.
Peng, C., Lee, K., & Ingersoll, G. (2002). An Introduction to Logistic Regression Analysis
and Reporting. The Journal of Educational Research, 96(1), 3-14.
Peterson, R. A., & Wilson, W. R. (1992). Measuring Customer Satisfaction: Fact and
Artifact. Journal of the Academy of Marketing Science, Vol. 20 (Winter): 61-71.
Petrick, J. F., & Backman. (2002). An examination of the construct of perceived value for
the prediction of golf travelers’ intentions to revisit. Journal of Travel Research, 41(1),
38–45.
Pine, B. J., & Gilmore, J. (1998). Welcome to the Experience Economy, Harvard Business
Review, July-August: 97–105.
Pitkänen, K., & Tuohino, A. (2006). Wintry Experiences in Eastern Finland: The
Representations of Experiences in Travel Brochures, in Kylänen, M. (Ed.) Articles of
Experiences. Lapland University Press. 164–185.
Plouffe, C. R., Bolander, W., Cote, J. A., & Hochstein, B. (2016). Does the Customer
Matter Most? Exploring Strategic Frontline Employees’ Influence of Customers, the
Internal Business Team, and External Business Partners. Journal of Marketing, 80 (1),
106–23.
Potts, P.W. (1988). Exploiting your product’s service life cycle. Harvard Business Review,
Vol. 66 No. 5, pp. 32-5.
Quinn, J.B. (1992). Intelligent Enterprise. Free Press, New York, NY.
Rackham, N. (2011). Some Difficult Issues in Selling Today. Keynote speech delivered at
the Sales Educators Academy, Rollins College, Winter Haven, FL, June 2.
Ramaseshan, B., Rabbanee, F., & Tan Hsin Hui, L. (2013). Effects of customer equity
drivers on customer loyalty in B2B context. Journal of Business & Industrial
Marketing, 28(4), 335-346.
155
Rapp, A. A., Bachrach, D. G., Flaherty, K. E., Hughes, D. E., Sharma, A., & Voorhees, C.
M. (2017). The Role of the Sales-Service Interface and Ambidexterity in the Evolving
Organization. Journal of Service Research, 20 (1), 59–75.
Rauyruen, P., Miller, K., & Barrett, N. (2007). Relationship quality as a predictor of B2B
customer loyalty. Journal of Business Research, 60(1), 21-31.
Reja, U., Manfreda, K., Hlebec, V., & Vehobar, V. (2003). Open-ended vs. Close-ended
Questions in Web Questionnaires. Developments in Applied Statistics, 19, 159-175.
Retrieved from:
https://www.researchgate.net/profile/Valentina_Hlebec/publication/242672718_Ope
n-ended_vs_Close-
ended_Questions_in_Web_Questionnaires/links/53f481c10cf2fceacc6e85ee/Open-
ended-vs-Close-ended-Questions-in-Web-Questionnaires.pdf.
Richins, M., & Bloch, P. (1986). After the New Wears off: The Temporal Context of
Product Involvement. Journal of Consumer Research, 13(2), 280-296.
Rigopoulou, I., Chaniotakis, I., Lymperopoulos, C., & Siomkos, G. (2008). After‐sales
service quality as an antecedent of customer satisfaction. Managing Service Quality:
An International Journal, 18(5), 512-527.
Rossiter, J. R., Percy, L., & Donovan, R. J. (1991). A Better Advertising Planning Grid.
Journal of Advertising Research, 31(5), 11-21.
Rucker, D. D., & Galinsky, A. D. (2008). Desire to acquire: Powerlessness and
conspicuous consumption. Journal of Consumer Research, 35, 257–267.
Rust, R. T., & Oliver, R. L. (1994). Service quality: insights and managerial implication
from the frontier. In T. Roland Rust, & Richard L. Oliver (Eds.), Service quality: New
directions in theory and practice (pp. 1–19). Thousand Oaks, CA: Sage.
Ruth, N., & Drew, J. H. (1991). A Longitudinal Analysis of the Impact of Service Changes
on Customer Attitudes. Journal of Marketing, 55 (January): 1-9.
Saad, G. (2007). The Evolutionary Bases of Consumption. Mahwah, NJ: Erlbaum.
Same, S., & Larimo, J. (2012). Marketing theory: experience marketing and experiential
marketing. 7th International Scientific Conference “Business and Management
2012”, 480-488.
Schlesinger, W., Cervera, A., & Pérez-Cabañero, C. (2015). Contrasting quality of service
experience for northern and southern Mediterranean tourists. Euromed Journal of
Business, 10(3), 327-337.
Schneider, K. C., & Johnson, J. C. (1995). Stimulating Response to Market Surveys of
Business Professionals. Industrial Marketing Management, 24, 4, 265-276.

156
Schor, J. B. (1998). The Overspent American. New York: Basic Books.
Seiders, K., Berry, L. L., & Gresham, L. (2000). Attention Retailers: How Convenient Is
Your Convenience Strategy?. Sloan Management Review, 49 (3), 79-90.
Selnes, F. (1993). An Examination of the Effect of Product Performance on Brand
Reputation, Satisfaction and Loyalty. European Journal of Marketing, 27(9), 19-35.
Sheth, J. N., Gardner, D. M., & Garreth, D. E. (1988). Marketing Theory: Evolution and
Evaluation. Wiley, New York.
Shimp, T. A. (1982). Perception of Time in Consumer Research: Comment. Journal of
Consumer Research, 9 (June), 116-19.
Simonson, I., Carmon, Z., Dhar, R., & Drolet, A. (2001). Consumer Research: In Search
of Identity. Annual review of psychology, 52, 1, 249-275.
Sirdeshmukh, D., Singh, J., & Sabol, B. (2002). Consumer trust, value, and loyalty in
relational exchanges. Journal of Marketing, 66, 15–37.
Slack, N. (1991), The Manufacturing Advantage: Achieving Competitive Manufacturing
Operations. Mercury, London.
Slater, S., & Narver, J. (2000). Intelligence Generation and Superior Customer
Value. Journal of The Academy Of Marketing Science, 28(1), 120-127.
Smith, P. K., & Trope, Y. (2006). You Focus on the Forest When You’re in Charge of the
Trees: Power Priming and Abstract Information Processing. Journal of Personality
and Social Psychology, 90 (April), 578–96.
Snoj, B., Pisnik Korda, A., & Mumel, D. (2004). The relationships among perceived
quality, perceived risk and perceived product value. Journal of Product & Brand
Management, 13(3), 156-167.
Spreng, R. A., & Dixon, A. L. (1992). Alternative Comparison Standards in the Formation
of Consumer Satisfaction/Dissatisfaction. In Enhancing Knowledge Development in
Marketing: 1992 Educators' Proceedings, Robert P. Leone and V. Kumar, eds.
Chicago: American Marketing Association, 85-91.
Spreng, R., MacKenzie, S., & Olshavsky, R. (1996). A Reexamination of the Determinants
of Consumer Satisfaction. Journal of Marketing, 60(3), 15-34.
Steenkamp, J., & Baumgartner, H. (2000). On the use of structural equation models for
marketing modeling. International Journal of Research In Marketing, 17(2-3), 195-
202.

157
Sweeney, J., Soutar, G., & Johnson, L. (1999). The role of perceived risk in the quality-
value relationship: A study in a retail environment. Journal of Retailing, 75(1), 77-
105.
Szymanski, D., & Henard, D. (2001). Customer Satisfaction: A Meta-Analysis of the
Empirical Evidence. Journal of The Academy of Marketing Science, 29(1), 16-35.
Tanner, J. F., & Raymond, M. A. (2010). Principles of Marketing: How Marketing Gets
Done. Nyack, NY: Flat World Knowledge.
Tarssanen, S., & Kylänen, M. (2007). A Theoretical Model for Producing Experiences –
A Touristic Perspective, in Kylänen, M. (Ed.) Articles on Experiences 2, Lapland
University Press, 134–154.
Teas, R. (1993). Expectations, Performance Evaluation, and Consumers' Perceptions of
Quality. Journal of Marketing, 57(4), 18-42.
Tedeschi, B. (2006). Help for the merchant in navigating a sea of shopper opinions. The
New York Times (September 6). Retrieved from:
http://www.nytimes.com/2006/09/04/tec.
Thibaut, J. W., & Kelley, H. H. (1959). The Social Psychology of Groups. New York:
Wiley.
Tse, D. K., & Wilton, P. C. (1988). Models of Consumer Satisfaction: An Extension.
Journal of Marketing Research, 25 (May): 204-212.
Tynan, C., & McKechnie, S. (2009). Experience marketing: a review and reassessment.
Journal of Marketing Management, 25(5–6): 501–517.
Ulaga, W., & Chacour, S. (2001). Measuring Customer-Perceived Value in Business
Markets. Industrial Marketing Management, 30(6), 525-540.
Urbach, N., & Ahlemann, F. (2010). Structural Equation Modeling in Information Systems
Research Using Partial Least Squares. Journal of Information Technology Theory and
Application, 11, 2, 5.
Vargo, S. L., & Lusch, R. F. (2006). Service-dominant logic: What it is, what it is not, what
it might be. In R. F. Lusch, & S. L. Vargo (Eds.), The service-dominant logic of
marketing: Dialog, debate, and directions (pp. 43–56). Armonk, NY: ME Sharpe.
Vargo, S., & Lusch, R. (2007). Service-dominant logic: continuing the evolution. Journal
of The Academy of Marketing Science, 36(1), 1-10.
Vargo, S. L., & Lusch, R. (2004). Evolving to a New Dominant Logic for Marketing.
Journal of Marketing, 68(1): 1-17.

158
Veblen, T. (1899/1994). The Theory of the Leisure Class. New York: Dover.
Verhoef, P. (2003). Understanding the effect of customer relationship management efforts
on customer retention and customer share development. Journal of Marketing,
67(October), 30-45.
Verhoef, P., Lemon, K. N., Parasuraman, A., Roggeveen, A., Tsiros, M., & Schlesinger,
L. A. (2009). Customer experience creation: Determinants, dynamics and management
strategies. Journal of Retailing, 85, 31-41.
Vickers, J., & Renand, F. (2003). The Marketing of Luxury Goods: An exploratory study
– three conceptual dimensions. The Marketing Review, 3(4), 459-478.
Vigneron, F., & Johnson, L. W. (1999). A Review and a Conceptual Framework of
Prestige-Seeking Consumer Behavior. Academy of Marketing Science Review, 1999
(1), 1-15.
Voli, P. K. (1998). The Convenience Orientation of Services Consumers: An Empirical
Examination. Doctoral dissertation, College of Business and Public Administration,
Old Dominion University.
Voss, G., Parasuraman, A., & Grewal, D. (1998). The Roles of Price, Performance, and
Expectations in Determining Satisfaction in Service Exchanges. Journal of
Marketing, 62(4), 46-55.
Wangenheim, F., & Bayón, T. (2007). Behavioral Consequences of Overbooking Service
Capacity. Journal of Marketing, 71(4), 36-47.
Weitz, B. A., & Bradford, K. D. (1999). Personal Selling and Sales Management: A
Relationship Marketing Perspective. Journal of the Academy of Marketing Science, 27
(2), 241–54.
Westbrook, R. A. (1987). Product/Consumption-Based Affective Responses and
Postpurchase Processes. Journal of Marketing Research, 24 (August), 258-264.
Westbrook, R. A. (1980). Intrapersonal Affective Influences on Consumer Satisfaction
with Products. Journal of Consumer Research, 7 (June): 49-54.
Westbrook, R. A., & Reilly, M. D. (1983). Value-Percept Disparity: An Alternative to the
Disconfirmation of Expectations Theory of Consumer Satisfaction. Advances in
Consumer Research, Vol. 10, 256-261.
Woodruff, R. B., Clemons, D. S., Schumann, D. W., Gardial, S. F., & Bums, M. J. (1991).
The Standards Issue in CS/D Research: A Historical Perspective. Journal of Consumer
Satisfaction/Dissatisfaction and Complaining Behavior, 4, 103-109.

159
Wotruba, T. (1991). The Evolution of Personal Selling. Journal of Personal Selling &
Sales Management, 11(3), 1-12.
Yi, Y. (1990). A Critical Review of Consumer Satisfaction. In Review of Marketing. Ed.
Valarie A. Zeithaml. Chicago: American Marketing Association, 68-123.
Youngdahl, W. E., & Kellog, D. L. (1997). The Relationship Between Service Customers’
Quality Assurance Behaviors, Satisfaction, and Effort: A Cost of Quality Perspective.
Journal of Operations Management, 15 (1), 19-32.
Zeithaml, V. (1988). Consumer Perceptions of Price, Quality, and Value: A Means-End
Model and Synthesis of Evidence. Journal of Marketing, Vol. 52, July, pp. 2-22.
Zeithaml, V. (1981). How Consumer Evaluation Processes Differ Between Goods and
Services. in Marketing of Services, J. Donnelly W. George, eds., Chicago: American
Marketing, 186-190.

160

161
Annexes
Annex 1 – The Final Questionnaire

162

163

164

165

166

167

168

169

170

171

172

173

174
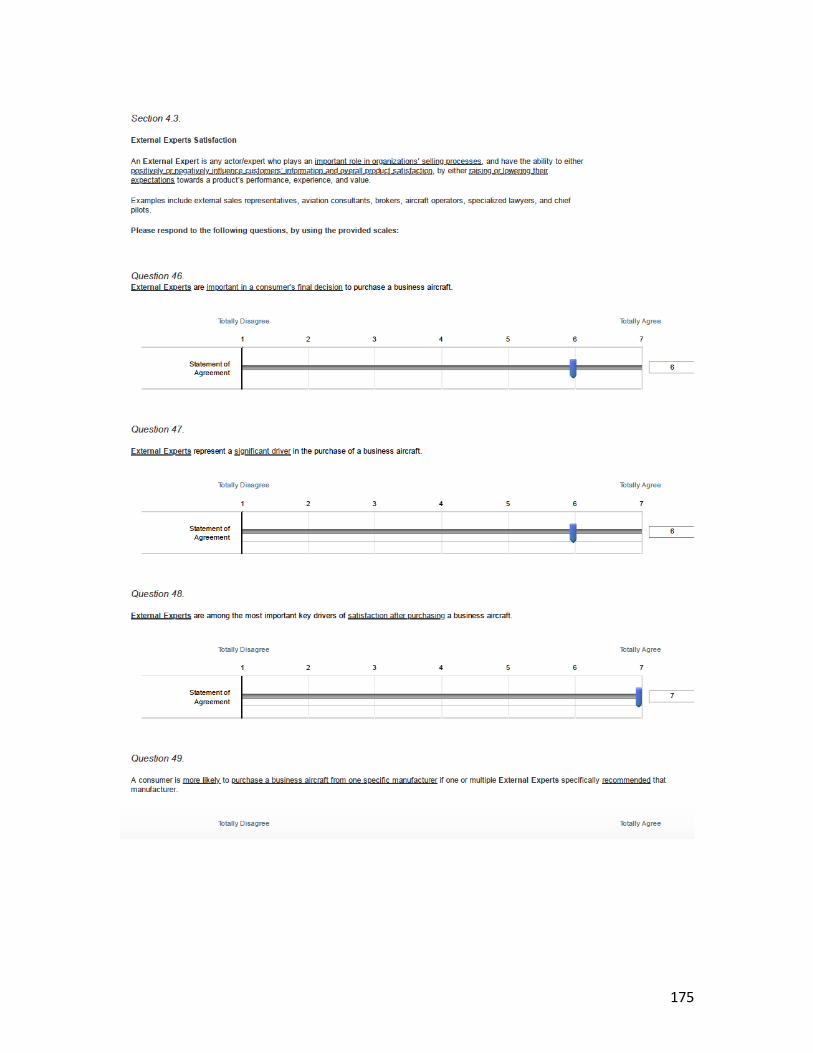
175

176

177

178

179
Powered by :
Please note: The respondents did not see the questions and sections numbers, and were able
to track their overall progress using a progression bar (in %) at the top of each survey page.

180
Annex 2 – Screenshots of the SPSS Dimension Reduction Analysis’ Results
1. Desires; Social Status & Prestige
2. Desires; Convenience

181
3. Desires; Experience
4. Expectations; Experience & Service Quality
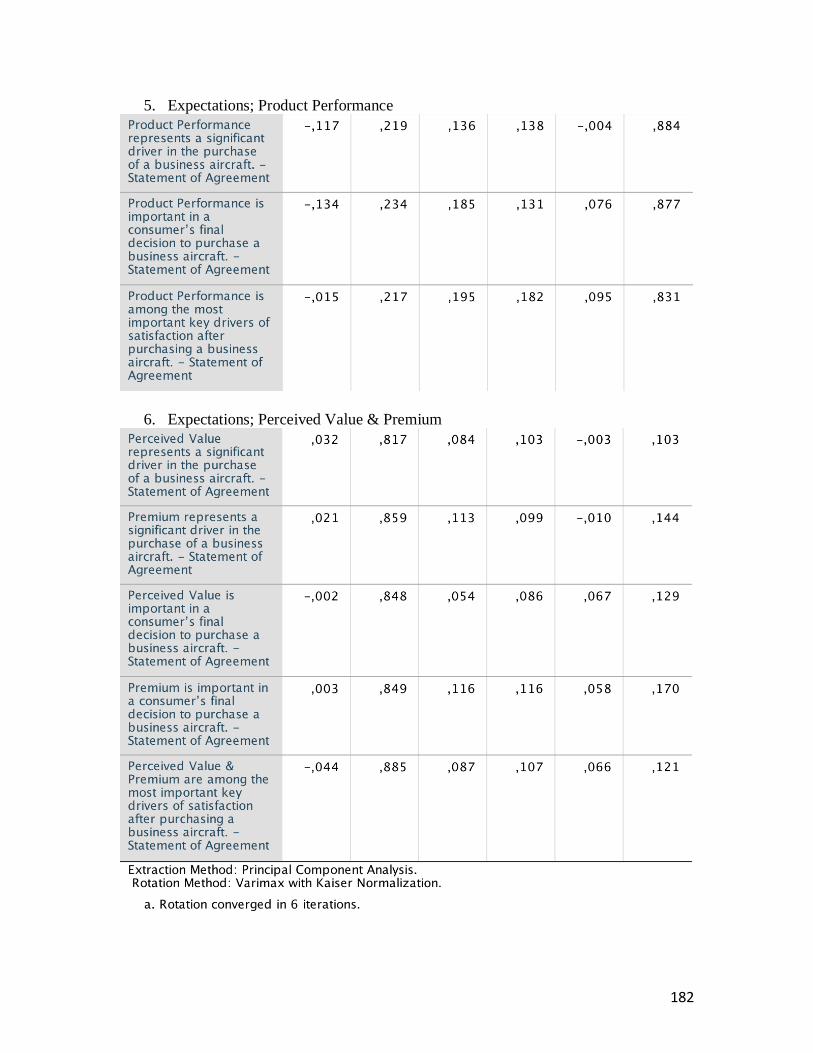
182
5. Expectations; Product Performance
6. Expectations; Perceived Value & Premium

183
7. Desires Congruency
8. Expectations Congruency

184
9. Product Attributes Satisfaction; Luxury & Comfort Related
10. Product Attributes Satisfaction; Performance Related

185
11. Product Attributes Satisfaction; Service Related
12. Information Satisfaction; Personal Selling

186
13. Information Satisfaction; WOM Satisfaction
14. Information Satisfaction; External Experts Involved

187
Annex 3 – Internal Reliability of the Personal Selling Subconstruct
1. Screenshot of SPSS’ internal reliability analysis without deleting item
PersonalSelling3
1. Screenshot of SPSS’ internal reliability analysis with the deletion of item
PersonalSelling3

188
Annex 4 – Screenshots of the SPSS Reliability Analysis’ Results
1. Desires; Social Status & Prestige
2. Desires; Convenience
3. Desires; Experience
4. Expectations; Experience & Service Quality
5. Expectations; Product Performance

189
6. Expectations; Perceived Value & Premium
7. Desires Congruency; Positive Dimension
8. Desires Congruency; Negative Dimension
9. Expectations Congruency; Positive Dimension
10. Expectations Congruency; Negative Dimension
11. Product Attributes Satisfaction; Luxury & Comfort Related

190
12. Product Attributes Satisfaction; Performance Related
13. Product Attributes Satisfaction; Service Related
14. Information Satisfaction; Personal Selling
15. Information Satisfaction; WOM Satisfaction
16. Information Satisfaction; External Experts Involved

191
Annex 5 – Screenshot of Responses’ Codification from Open-Ended Question #1
Please note that this screenshot represents only a fragment of the entire database.

192
Annex 6 – Screenshots of the SPSS Logistic Regression Analysis’ Results
1. Dependent Variable: Luxury & Comfort Attributes Dissatisfaction
2. Dependent Variable: Performance Attributes Dissatisfaction
3. Dependent Variable: Service-Related Attributes Dissatisfaction
4. Dependent Variable: Personal Selling Dissatisfaction

193
5. Dependent Variable: WOM Dissatisfaction
**None of the participants expressed dissatisfaction in regards to the WOM subconstruct.
Therefore, the following error message appeared**
6. Dependent Variable: External Experts Dissatisfaction

194
Annex 7 – Screenshot of the SPSS Linear Regression Analysis’ Results

195
Annex 8 – Screenshots of the SPSS Research Hypotheses Test Results
1. Hypothesis 1a: Desires → Desires Congruency (Positive Dimension)
2. Hypothesis 1b: Desires → Desires Congruency (Negative Dimension)
3. Hypothesis 2a: Expectations → Expectations Congruency (Positive Dimension)

196
4. Hypothesis 2b: Expectations → Expectations Congruency (Negative Dimension)
5. Hypothesis 3.1a: Desires Congruency (Positive Dimension) → Personal Selling
6. Hypothesis 3.2a: Desires Congruency (Positive Dimension) → WOM Satisfaction
7. Hypothesis 3.3a: Desires Congruency (Positive Dimension) → External Experts

197
8. Hypothesis 3.1b: Desires Congruency (Negative Dimension) → Personal Selling
9. Hypothesis 3.2b: Desires Congruency (Negative Dimension) → WOM
Satisfaction
10. Hypothesis 3.3b: Desires Congruency (Negative Dimension) → External Experts
11. Hypothesis 4.1a: Expectations Congruency (Positive Dimension) → Personal
Selling
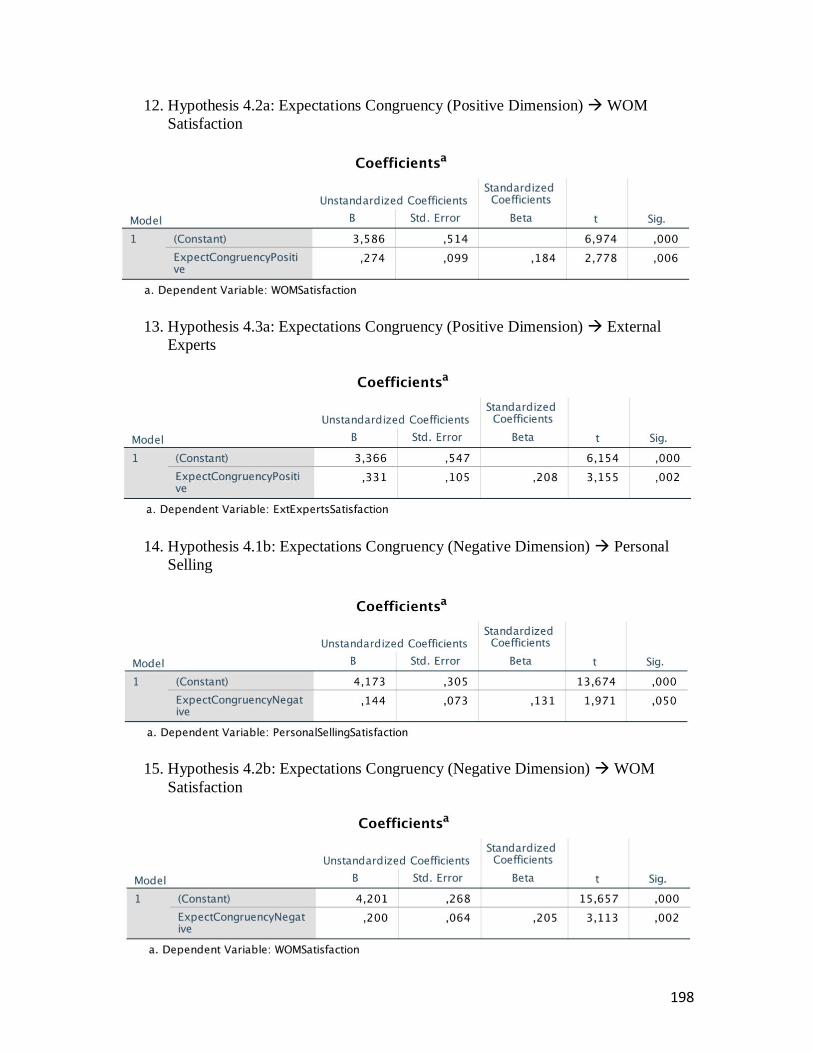
198
12. Hypothesis 4.2a: Expectations Congruency (Positive Dimension) → WOM
Satisfaction
13. Hypothesis 4.3a: Expectations Congruency (Positive Dimension) → External
Experts
14. Hypothesis 4.1b: Expectations Congruency (Negative Dimension) → Personal
Selling
15. Hypothesis 4.2b: Expectations Congruency (Negative Dimension) → WOM
Satisfaction

199
16. Hypothesis 4.3b: Expectations Congruency (Negative Dimension) → External
Experts
17. Hypothesis 5: Product Attributes Satisfaction → Overall Satisfaction
18. Hypothesis 6: Information Satisfaction → Overall Satisfaction

200
Annex 9 – Screenshot of the SPSS Overall Satisfaction Results Analysis
Annex 10 – SPSS Screenshot Satisfaction Results per Category of Respondent
Annex 11 – SPSS Screenshots Individual Components Satisfaction Results Analysis

201
Annex 12 – SPSS Screenshot Satisfaction & Importance Descriptive Analysis
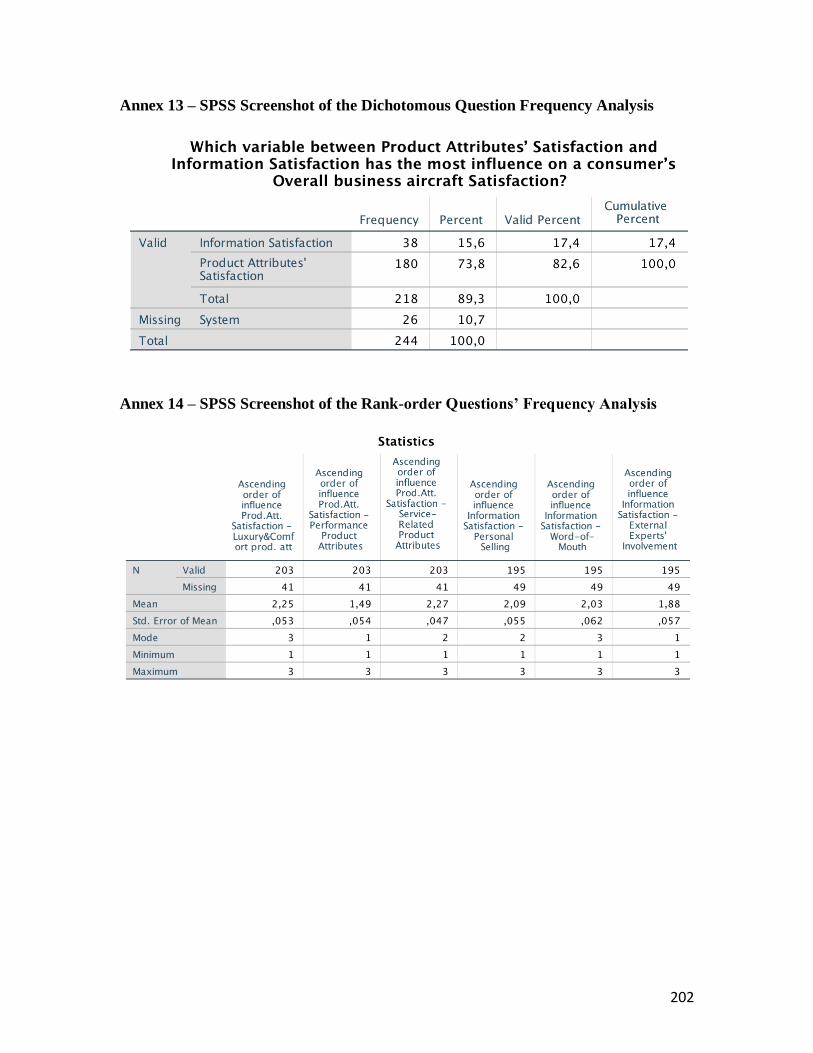
202
Annex 13 – SPSS Screenshot of the Dichotomous Question Frequency Analysis
Annex 14 – SPSS Screenshot of the Rank-order Questions’ Frequency Analysis

203
Annex 15 – SPSS Screenshots of the Codification Frequency Analysis (1st Question)
1. Luxury & Comfort Attributes Dissatisfaction
2. Performance Attributes Dissatisfaction
3. Service-related Attributes Dissatisfaction

204
4. Personal Selling Dissatisfaction
5. WOM Dissatisfaction
6. External Experts Dissatisfaction

205
Annex 16 – SPSS Screenshots of the Codification Frequency Analysis (2nd Question)
1. Salespeople’s transparency and honesty
2. Salespeople’s Overall Knowledge
3. Salespeople’s timeliness of follow-up

206
Annex 17 – SPSS Screenshot Subconstructs’ Importance Level Descriptive Analysis

207
Annex 18 – Alternate Methods Considered to Measure the Dependent Variable
Various alternate methods were considered to measure the dependent variable of
this research, more precisely customers’ overall satisfaction for B2B high-involvement
products. The first one aimed to combine frequency analyses of both rank-order questions
from section seven with the results obtained from the codification of both first and second
open-ended questions. More precisely, results from both distinct analyses would have been
multiplied by each other, and this method would have provided a certain scale of influence
and importance regarding all six subconstructs from both product attributes and
information satisfaction constructs. By doing so, the subconstructs with the most influence
onto customers’ overall satisfaction could have been identified. However, this method
would not have provided a specific degree of customer satisfaction, which is what this
research’s dependent variable aims for. The fact that questions from section seven were
not mandatory could have also caused a problem of sample size and significance, if not
enough participants would have answered them.
The option to utilize a logistic regression was then contemplated. In this case, all
responses from the first open-ended question were interpreted in such a way as to determine
if participants were satisfied or not, regarding several categories linked to the purchasing
process of a business aircraft. The dependent variable in this instance being dichotomous
(satisfied or not satisfied), this type of analysis would have fitted perfectly. Indeed, as
mentioned by Peng, Lee and Ingersoll (2002), this type of regression is usually well suited
for describing and testing hypotheses about relationships between a categorical/binary
outcome variable, and one or more categorical/continuous predictor variables.
As such, results originating from the codification of section seven’s first open-
ended question were manually entered in SPSS’s database, using a binary method. More
precisely, the first step was to codify all responses using six distinct categories
corresponding to all six subconstructs from both product attributes and information
satisfaction constructs. For example, if a participant’s response would express
dissatisfaction regarding a business aircraft performance attributes, this specific
subconstruct would be identified/coded. The second step was to input all six different
categories used during the previous step into the SPSS database; as such, six new columns
were then created. These categories were: luxury & comfort attributes’ dissatisfaction,

208
performance attributes’ dissatisfaction, service-related attributes’ dissatisfaction, personal
selling dissatisfaction, WOM dissatisfaction and external experts’ dissatisfaction. These
new columns allowed our research team to flag the categories identified in each of the 141
responses obtained. To do so, a binary codification method was used. For example, if two
categories were identified in the first response, such as one and three, a “1” would be
entered in the columns corresponding to categories one and three. The remaining categories
would be populated with “0”. In other words, this would indicate that this particular
participant expressed dissatisfaction regarding a business aircraft luxury & comfort, and
service-related attributes. However, this participant could be deemed satisfied regarding
the remaining categories populated by “0”, which in this specific instance would be the
second, fourth, fifth and sixth ones. A screenshot from SPSS exemplifying this specific
task can be found in the annex section (cf. Annex 5).
Once all results were appropriately codified in SPSS, the binary logistic function
of the software was used to execute the logistic regression analyses. Six logistic regressions
were executed, because six possible outcomes of dissatisfaction were possible. Each
possible outcome represented the dependent variable, in every single analysis. However,
the independent variables for each one of these six analyses were always the same ones,
more precisely the six different subconstructs/categories used to codify the responses.
Unfortunately, this method was ultimately not retained, because results from all six logistic
regressions were insignificant. Indeed, the p-value related to each one of the six categories
used to codify the responses of the first open-ended question turned out to be greater than
0,05. Screenshots of the results from this logistic regression can be found in the annex
section (cf. Annex 6). The insignificance of such results, and the inability to use this
particular type of regression analysis, can be explained by the relatively small sample size
of participants who answered to the first open-ended question on which it was based, more
precisely 141 participants, and its small variance. The fact that all questions from section
seven were not made mandatory also contributed to this outcome.

209
Annex 19 – Correlation Matrix and Descriptive Statistics