Embed Size (px)
Citation preview
Hospitality ReviewVolume 31Issue 4 FIU Hospitality Review v.31 i.4 Article 8
February 2015
Customer Satisfaction and Behavioral Intentions:The Case of Aruba-- Small Island NationYang CaoUniversity of South Carolina, [email protected]
Robin DiPietroUniversity of South Carolina, [email protected]
Gerald KockUniversity of Aruba, [email protected]
Follow this and additional works at: https://digitalcommons.fiu.edu/hospitalityreview
Part of the Business Administration, Management, and Operations Commons, Food andBeverage Management Commons, Food Science Commons, Gaming and Casino OperationsManagement Commons, Recreation, Parks and Tourism Administration Commons, TourismCommons, and the Tourism and Travel Commons
This work is brought to you for free and open access by FIU Digital Commons. It has been accepted for inclusion in Hospitality Review by anauthorized administrator of FIU Digital Commons. For more information, please contact [email protected].
Recommended CitationCao, Yang; DiPietro, Robin; and Kock, Gerald (2015) "Customer Satisfaction and Behavioral Intentions: The Case of Aruba-- SmallIsland Nation," Hospitality Review: Vol. 31 : Iss. 4 , Article 8.Available at: https://digitalcommons.fiu.edu/hospitalityreview/vol31/iss4/8
Customer Satisfaction and Behavioral Intentions: The Case of Aruba--Small Island Nation
AbstractTourism studies related to small island destinations have become a research stream amongst many academicsin recent years. The current study investigates tourist satisfaction related to a tour operator on the island ofAruba that specializes in jeep and bus tours. As there is an increased expenditure pattern for these types ofactivities, companies are looking for ways to improve customer satisfaction and behavioral intentions. Resultsindicate that tourists are generally satisfied with the tour company; however a difference in satisfaction ratingswas obtained for respondents 61 years old or above. Four factors were extracted from tourists’ satisfactionattributes and three of these factors, including the overall tour value, tour guide, and sound systems usedduring these tours, were found to be strong predictors of behavioral intentions measured by the likelihood torebook and the likelihood to recommend the tour company to family and friends. Operational and marketingstrategies were suggested based on the findings of the study.
KeywordsSmall island nation, Aruba, tour operators, customer satisfaction, behavioral intentions
This article is available in Hospitality Review: https://digitalcommons.fiu.edu/hospitalityreview/vol31/iss4/8
Customer Satisfaction and Behavioral Intentions: The Case of Aruba – Small
Island Nation
Introduction
The importance of tourism in small island nations has been extensively
addressed in the literature (Craigwell, 2007; Croes, 2006; Jackman, Lorde, &
Alleyne, 2011; Lewis, 2004). External economic contributions to the small island
economies are somewhat dominated by travelers to the island, comprising more
than 50% of export earnings (Bull & Weed, 1999; Hutchings, 1996; Shaw &
Williams, 1994). Tourism tends to be viewed as an export industry in these
locations that generates foreign exchange for them, creates jobs and encourages
economic diversification of the location (Lewis, 2004). Small island nations have
been defined as having a population threshold of less than 1.5 million people and
a small land mass; they also have smaller governments with limited resources.
They are open to trade and investment and rely heavily on those to help support
their economy (von Tigerstrom, 2005).
More specifically, Poon (1990) classifies islands as being small (<1
million inhabitants) and large (>1 million inhabitants), therefore creating a better
benchmark for measuring tourism related impacts on small island tourism
economies for this particular study. Small islands with their geographic,
economic, social, and environmental characteristics have been associated with
tremendous diseconomies of scale and difficulty remaining economically
sustainable (Pigliaru, Brau, & Lanza, 2007).
Small island tourism economies, especially the case of the Caribbean
region, have traditionally relied on the development of their tourism industry. In
doing so, they have to reduce the risks associated with the depletion of its natural
resources. These natural resources, which are essential to their tourism income,
can be easily depleted from both a direct and indirect exploitation of their delicate
environmental assets. Many local, regional and international policy makers,
academics, and private entities are continuously expressing serious concerns
about protecting the islands’ environmental assets. One of the main reasons is that
customer satisfaction rates, both for the destination and its local businesses, is
considered as a critical determinant of how well it performs on a local, regional
and global market (Crouch & Ritchie, 1999). Protecting the natural resources of
the location can ensure that the tourism industry continues to thrive.
Therefore, the need for ensuring that tourists are satisfied and continuing
to enhance the economy in these types of locations is essential. The purpose of the
current study is to focus on helping to create a more complete understanding of
how customer satisfaction rates are influenced by strategic choices and decision
making processes in small island economies. More specifically, it will investigate
how small and medium enterprises (SMEs) on small island nations perform with
their customer satisfaction rates, and what factors influence customers’ behavioral
intentions, measured through likelihood to rebook and likelihood to recommend
the tour company to family and friends. For this study, a tour operator in Aruba
will be investigated and analyzed. The results of the current study could benefit
the tour company and ultimately the island of Aruba, which can then be used as a
benchmark for other small island economies in the region.
Aruba, with less than one (1) million inhabitants is considered a small
island that has traditionally relied on the development of its tourism industry, and
this is why it was chosen as the context of the current study. In general, the island
of Aruba has been remarkably successful in pursuing the strategy of tourism
specialization (Algieri, 2006; Croes, 2005; Croes, 2006, Lanza, Temple, & Urga,
2003; Oyewole, 2001; Pigliaru, Brau, & Lanza, 2007). Aruba is a small island of
69 square miles located in the southern Caribbean Sea, where tourism accounts
for a total of 87% of the GDP according to a World Tourism and Travel Council
estimate (WTTC, 2013a) and which ranked third among 35 tourism-dependent
countries based on travel and tourism’s total contribution to employment
(Jackman et al., 2011; WTTC, 2013b). A recent report said that the overnight
visitor arrival growth of Aruba in 2012 and 2013 is 5.4% (WTTC, 2013b) and it is
considered one of the islands with the highest number of repeat visitors in the
region. Travel and tourism accounted for 14.8 percent of total GDP and is
expected to increase its share by almost two percentage points to 16.5 percent by
2014. Aruba has such high popularity as a Caribbean island destination due to its
pleasant weather, beautiful coastal areas, and safe social and political environment
(Vanegas & Croes, 2003).
As a consequence, over the years, Aruba has been intensively developed
to meet the increasing tourism demand. Aruba is among the fastest developing
Caribbean islands in terms of population growth, which has doubled since the
mid-1980s (Cole & Razak, 2011), and they had close to 1 million tourism arrivals
in 2012 (Caribbean Tourism Organization, 2012). Major tourism markets of
Aruba are tourists from the United States (around 65%), followed by tourists from
Venezuela (11%), Europe (9%), and Canada (5%) (Caribbean Tourism
Organization, 2010).
However, despite promising numbers in terms of tourism arrivals,
concerns such as the overdevelopment, capacity, and overuse of natural resource
issues are broadly discussed among scholars (Cole & Razak, 2011; Croes, 2005;
Vanegas & Croes, 2003). Jackman, Lorde, Lowe and Alleyne (2011) studied
eighteen small islands with developing status in the period of 2000-2007 and the
results revealed that Aruba was among the eighteen islands that didn’t show a
strong competitive advantage at any point during the eight-year period. Based on
these results, the researchers further pointed out that the tourism products offered
by the islands should be upgraded as a way to improve the overall
competitiveness of these small islands (Jackman, et al., 2011). According to Cole
(2012), tourist satisfaction influences fluctuations in demand in small island
nations. This overall satisfaction influences tourists’ willingness to pay higher
prices for destinations and influences whether or not they will revisit a destination
(Bull & Weed, 1999).
This study will inform research on tourist satisfaction and behavioral
intentions in order to expand the knowledge base regarding small island
economies. Specific research questions are addressed following the review of
literature. The following section describes the research that has informed the
current study related to tourist satisfaction, satisfaction attributes, and behavioral
intentions.
Literature Review
Tourist Satisfaction
Satisfaction can be generally defined as a customer’s evaluation of the
provision of consumption-related service and products (Oliver, 1997). According
to Walker (1995), customer satisfaction is customers’ subjective comparison of
what the customer expected and what they perceived when they received the
service or product. Customer satisfaction in the tourism context is generally
referred to as tourist satisfaction. From the tourism organization’s standpoint,
understanding what factors create satisfaction in tourists is an ongoing challenge
for tourism managers in order to help them provide and design an experience for
tourists who are more likely to recommend and revisit their destination (Maunier
& Camelis, 2013). As an important component of the tourism products and
services provided by a location (Yoon & Uysal, 2005), tourist satisfaction could
enhance a company’s reputation in the marketplace, help the company obtain
market share, and reduce relevant costs such as transaction costs and costs of
failure (Anderson, Fornell, & Lehmann, 1994; Chi & Qu, 2008; Song, van der
Veen, Li, & Chen, 2012).
In the tourism context, tourist satisfaction is traditionally measured
through the comparison between tourists’ expectations and their perceptions
(Oliver, 1980). This expectancy disconfirmation framework perspective holds that
tourists would be satisfied if their perceptions meet their expectations prior to the
experience (Berry, Parasuraman, & Zeithaml, 1994). The major criticism of this
measurement is that tourists’ expectations are difficult to measure, which are also
influenced by factors such as their experiences of other destinations, similar
products, and previous knowledge (Maunier & Camelis, 2013). Such factors
could be referred to as a bundle of previous experiences to be compared to when
tourists evaluate their satisfaction levels (Yoon & Uysal, 2005). The comparison
between their preferred standard and their perceptions can be referred to as norm
theory (Yoon & Uysal, 2005). In a similar vein, tourist satisfaction can be seen
from the costs/benefits perspective, the equity theory, that tourists will be satisfied
if they perceive their benefits overweight the costs of the tourism experience
(Oliver & Swan, 1989).
Some other scholars (Pizam, Neumann, & Reichel, 1978), asserted that
performance-only technique is a more appropriate method to measure tourists’
satisfaction (Deng, 2007; Fuchs, & Weiermair, 2004), where only tourists’ post-
experience perceptions are measured. In these cases, an on-site survey was
applied and considered as a useful tool to provide a more general understanding
of tourist satisfaction (Coghlan & Pearce, 2010). In sum, previous studies have
used a number of methods guided by different theories in order to measure tourist
satisfaction. This study has applied the performance-only method using on-site
surveys to study tourist satisfaction at a tour operator in Aruba. Tourist
satisfaction is evaluated through different attributes that comprise the overall
satisfaction of the trip.
Satisfaction Attributes
Due to its importance in destination management and strategic planning,
tourist satisfaction is emphasized in the literature and there has been an increase
in the number of studies analyzing different attributes measuring satisfaction in
tourism, travel, and hospitality (Chi & Qu, 2008; Kozak & Rimmington, 2000,
Song et al., 2012). From the tourists’ viewpoint, tourist satisfaction is evaluated
through services and facilities at the tourist destination (Maunier & Camelis,
2013). Tourists receive a variety of services during the trip and each attribute
measuring those services contributes to their overall satisfaction. As a specific
type of tourist satisfaction, attribute satisfaction is generally defined as the
customers’ evaluation of attribute performance (Baker & Crompton, 2000;
Spreng, MacKenzie, & Olshavsky, 1996). It is suggested that attribute satisfaction
is a direct antecedent of overall satisfaction with a tourism experience (Chi & Qu,
2008), which means that attribute satisfaction could help to explain a great
amount of variance related to the overall satisfaction with a tourist destination
(Chi & Qu, 2008; Spreng et al., 1996).
Different attributes that comprise tourist satisfaction continues to receive
great attention. Attributes at a destination can be classified based on their different
influences on tourist satisfaction (Alegre & Garau, 2010). As suggested by Song
et al. (2012), tourist satisfaction is influenced by a variety of factors not limited to
service quality. Other factors can be addressed in the tourist satisfaction
investigations. Consistent with this perspective, Marcussen (2011) confirmed that
tourist satisfaction leads to intention to return, but he also emphasizes other
factors that help to predict the intention to return, such as the nearness of the
destination to the market, previous experience with the destination, socio-
demographics, and additional trip characteristics.
Based on different contexts, satisfaction attributes are customized to
reflect the specific features at a destination. For example, tour guides can be an
important attribute to help and communicate with the tourists during their trips
and provide the image for the destination. Tour guides’ performance is a critical
factor that influences tourists’ satisfaction and behavioral intentions (Huang,
Weiler, & Assaker, 2014). Reisinger and Waryszak (1994) included “satisfaction
with the tourist guide” as a satisfaction attribute in a study of Japanese tourists
visiting Australia, and found that Japanese tourists are generally satisfied with the
services of Australian tourist guides, but they perceived that they are not
informative enough to meet their expectations. Farías (2010) also found that the
role of tour guides and their communication with the customers is critical in
developing the relationship between the tour company and the tourists through
activities such as touring, exploring, and visiting the destinations. In a recent
study of Huang et al. (2014), tour guides’ performance was found to positively
impact tourist satisfaction and behavioral intentions in a context of heritage
destination. They contributed to the literature by directly linking the tour guides’
performance to tourist satisfaction. Therefore, tour guides’ performance has taken
an important role in investigating tourists’ satisfaction, especially in the
experience of package tours where tour guides generally lead them through the
overall experiences (Huang, Weiler, & Assaker, 2014). The following section will
discuss behavioral intentions and the relationship with satisfaction.
Behavioral Intentions
One important theory in explaining individuals’ behaviors is the Theory of
Planned Behavior (TPB). First proposed by Azjen (1988, 1991), the Theory of
Planned Behavior states that individuals’ actual behaviors could be predicted
through behavioral intentions as well as their perceived behavioral control. It is
believed that if properly measured, behavioral intentions are very strong
indicators of most social behaviors (Ajzen, 1988). Three constructs are considered
as antecedents of behavioral intentions: attitudes, subjective norm, and perceived
control. Following this widely accepted theory, many studies have been
conducted in the hospitality and tourism industry to understand behavioral
intentions in order to predict tourists’ actual behaviors of visitation to a tourist
destination or tourist attraction (Baker & Crompton, 2000; Buttle & Bok, 1996;
Lam & Hsu, 2006; Hsu & Huang, 2012).
Apart from the powerful predictor related to actual behavior, advantages
of behavioral intentions are discussed and summarized in the previous studies.
According to Zeithaml, Berry, and Parasuraman (1996), behavioral intentions
have positive associations with customer retentions. Tourists who expressed
positive behavior intentions are more likely to provide positive word-of-mouth
information about the location, recommend the location to other customers, revisit
the destination (repurchase behavior), and pay premium prices (Anderson et al.,
1994; Chi & Qu, 2008; Kozak, 2001; Kozak & Rimmington, 2000; Yoon &
Uysal, 2005). In other words, these effects are components of destination loyalty,
and therefore behavioral intentions are major antecedents of loyalty (Chi & Qu,
2008). Repeat tourists on the other hand have been found to perceive a revisited
destination more positively than a first time visitor. An example of this was found
in Kozak and Rimmington’s (2000) study of tourist satisfaction in Mallorca,
Spain, a popular off-season holiday destination, where they determined that first
time tourists to the destination expressed lower satisfaction level with all assessed
attributes than that of repeat tourists to the location.
In the tourism context, research has been focused on the tourists’
behavioral intentions and recommendation intentions. A handful of recent studies
have investigated the role of behavioral intentions in the tourism sector (Chi &
Qu, 2008; Kozak, 2001; Kozak & Rimmington, 2000; Yoon & Uysal, 2005; Yu &
Goulden, 2006; Williams & Soutar, 2009). Also, Petrick (2004) contributed to the
literature by finding satisfaction, quality, and value were all strong predictors of
cruise passengers’ behavioral intentions. In addition, return intentions were found
to positively and significantly influence passengers’ intention to recommend to
others (Petrick, 2004).
Lam and Hsu (2006) tested the Theory of Planned Behavior (TPB) among
potential Taiwanese travelers to Hong Kong and confirmed the partial utility of
TPB applied in a destination context. Subjective norm and perceived behavioral
control rather than attitude were predictors of behavioral intentions. In a similar
manner, Hsu & Huang (2012) studied relationship between behavioral intentions
and actual behaviors of the tourists from Tier I cities in China. They proposed an
extended planned behavior model by adding the motivation construct as an
antecedent. The empirical results further confirmed the validity and usefulness of
TPB and concluded that subjective norm has the most impact on behavioral
intention, followed by perceived behavioral control and attitude, respectively
(Hsu & Huang, 2012).
Hutchinson, Lai, and Wang (2009) studied the structural relationships
among perceived quality, value, satisfaction on behavioral intentions among golf
travelers. They found that tourist satisfaction and value have significant
influences on behavior intentions. They contributed to the literature by dividing
behavioral intentions into three independent constructs: revisit intentions, word-
of-mouth intentions, and search for alternatives. Among these three constructs of
behavioral intentions, word-of-mouth was found to be most influenced by
satisfaction.
Consistent with this finding, Chen and Chen (2009) studied heritage sites
in Taiwan and also found that tourists’ satisfaction and perceived value have a
direct impact on behavioral intentions. Tourist satisfaction served as a mediation
factor between experience quality and behavioral intentions. In a similar vein,
Baker and Crompton (2000) investigated the mediation effect of tourist
satisfaction between perceived quality and behavioral intentions and suggested
that though tourist satisfaction is a useful predictor of behavioral intention, it is
not as strong as perceived quality (Baker & Crompton, 2000).
In sum, previous studies have acknowledge the importance of behavioral
intentions in the tourism context, and considerable studies have generally reached
the consensus that tourist satisfaction has a direct impact on behavioral intentions
(including intention to revisit and word-of-mouth recommendations) (Chi & Qu,
2008; Kozak & Rimmington, 2000; Yoon & Uysal, 2005; Williams & Soutar,
2009). Therefore, understanding customer satisfaction and how that relates to
behavioral intentions are critical for destination marketing and tourism planning,
especially for the small island nations where tourism generates the majority of
revenue and jobs in the destination. Taking guidance from the abovementioned
studies the purpose of the current study is focused on helping to create a more
complete understanding of the tourism industry in Aruba by investigating
customer satisfaction and behavioral intentions related to SMEs related to tourism
related tour operators. The study also provides operational and marketing
strategies for the private sector in Aruba’s tourism economy in order to provide
some insight for other regions of the Caribbean or small island nations.
Specifically the current study will assess customer satisfaction and its relationship
to behavioral intentions, measured through likelihood to rebook and likelihood to
recommend the tour company to family and friends.
The research questions guiding the current study are as follows:
1. What are tourists’ perceptions regarding a variety of attributes of a tour
company that provides jeep and bus tours in Aruba such as friendliness of guide,
safety of tour, sounds system, value of tour, etc.?
2. What are the dimensions of tourist satisfaction attributes for bus and jeep tours
in Aruba?
3. Are there any statistically significant differences in tourists’ satisfaction level
related to various demographic factors?
4. Do the different attributes of a tour company that are related to customer
satisfaction predict behavioral intentions (tourists’ likelihood to rebook, and
likelihood to recommend a tour with the company to family and friends)?
Methods
Research Design
For the purpose of this research, the questionnaire was developed which
contained close-ended questions such as: a) satisfaction attributes of the tour; b)
intentions to book another tour; and c), intentions to recommend the tour to other
people, in order to examine the level of tourists’ satisfaction and their behavioral
intentions related to the tour and the tour company. A 6-point Likert type scale
was applied in this survey, with 1= very dissatisfied and 6= very satisfied. The
researchers chose this type of scale in order to have respondents commit to either
the positive or negative side of the scale. A 6-point Likert scale can provide a
higher trend of discrimination as well as higher reliability than that of 5-point or
7-point Likert scales (Chomeya, 2010). Additionally, 6-point Likert scales also
have higher reliability and validity than 4-point Likert scales (Chang, 1994).
Other questions asked included respondents’ demographics, the type of tour they
participated in, and open-ended comments about the tour.
Study Site
The data of the current study was collected from one of tour companies in
island of Aruba, a small island in the southern Caribbean Sea. In particular, a
local bus and jeep tour company was approached and the researchers requested to
measure their visitors’ customer satisfaction ratings related to the services they
provide. This local company is selected as the study site because it was
considered one of the major tour operators in Aruba, which has a fifty-year
history of operation. Further, it provides a wide range of services for tourists,
including underwater tours, sailing, and bus and jeep tours. Bus tours (island
tours) include the Aruba sightseeing bus tour and the Discover Aruba bus tour and
the jeep tours (off-road tours) contain tours of a local beach named Baby Beach
and the Natural Pool (a naturally made cove formation with beautiful blue ocean
water).
This study used simple random sampling method to collect data. During
the month of March of 2011, the tour operator allowed researchers to randomly
survey guests that were scheduled to take part on their bus and jeep tours. There
were 28 randomly selected tours throughout the month representing each day of
the week (Monday-Friday) that were used to collect data. During the data
collection process, all customers were approached and were asked to complete a
short survey related to the satisfaction ratings about the tour they just participated
immediately after each tour.
A total of 322 surveys were handed out with a total of 182 completed
surveys for a response rate of 56.52%. To answer the four research questions, the
data was then analyzed using descriptive statistics, Exploratory Factor Analysis,
ANOVA and Independent Samples T Test, and Hierarchical Multiple Regression
analysis using SPSS version 20 accordingly. Specifically, descriptive statistics
was used to understand tourists’ perceptions on the bus and jeep tour in Aruba,
Exploratory Factor Analysis was used in order to determine the dimensions or
factors of tourist satisfaction, which then shows the relationships between various
attributes or items. ANOVA and Independent T Test were used in order to
determine if there were statistically significant differences between the tour
attributes as they related to a variety of demographic factors, and Hierarchical
Multiple Regression was used in order to determine if the tour attributes and
customer satisfaction related to those attributes predicted behavioral intentions of
the tourists.
Results
Tourists’ Perceptions of Bus and Jeep Tour
Table 1 shows the demographic profile of the respondents. Most of the
tourists were from North America, with the largest majority of tourists from the
United Sates (n=200, 73.3%) and Canada (n=45, 16.5%), followed by 5.5% who
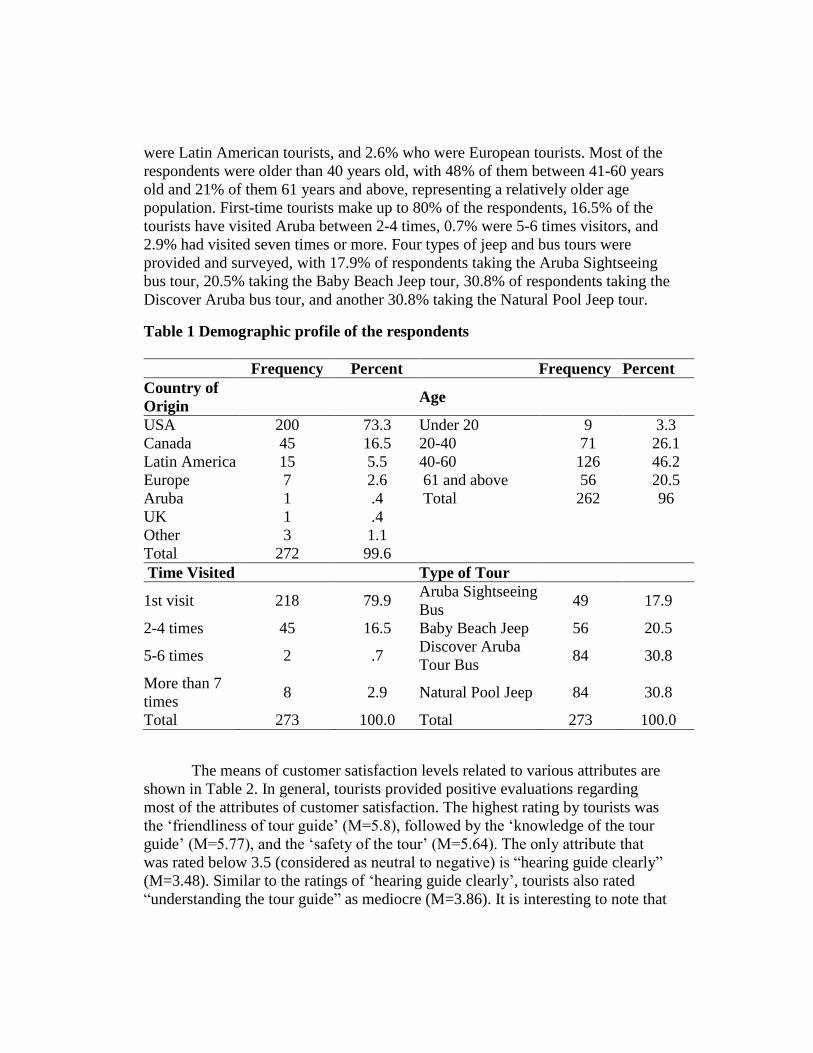
were Latin American tourists, and 2.6% who were European tourists. Most of the
respondents were older than 40 years old, with 48% of them between 41-60 years
old and 21% of them 61 years and above, representing a relatively older age
population. First-time tourists make up to 80% of the respondents, 16.5% of the
tourists have visited Aruba between 2-4 times, 0.7% were 5-6 times visitors, and
2.9% had visited seven times or more. Four types of jeep and bus tours were
provided and surveyed, with 17.9% of respondents taking the Aruba Sightseeing
bus tour, 20.5% taking the Baby Beach Jeep tour, 30.8% of respondents taking the
Discover Aruba bus tour, and another 30.8% taking the Natural Pool Jeep tour.
Table 1 Demographic profile of the respondents
Frequency Percent Frequency Percent
Country of
Origin
Age
USA 200 73.3 Under 20 9 3.3
Canada 45 16.5 20-40 71 26.1
Latin America 15 5.5 40-60 126 46.2
Europe 7 2.6 61 and above 56 20.5
Aruba 1 .4 Total 262 96
UK 1 .4
Other 3 1.1
Total 272 99.6
Time Visited Type of Tour
1st visit 218 79.9 Aruba Sightseeing
Bus 49 17.9
2-4 times 45 16.5 Baby Beach Jeep 56 20.5
5-6 times 2 .7 Discover Aruba
Tour Bus 84 30.8
More than 7
times 8 2.9 Natural Pool Jeep 84 30.8
Total 273 100.0 Total 273 100.0
The means of customer satisfaction levels related to various attributes are
shown in Table 2. In general, tourists provided positive evaluations regarding
most of the attributes of customer satisfaction. The highest rating by tourists was
the ‘friendliness of tour guide’ (M=5.8), followed by the ‘knowledge of the tour
guide’ (M=5.77), and the ‘safety of the tour’ (M=5.64). The only attribute that
was rated below 3.5 (considered as neutral to negative) is “hearing guide clearly”
(M=3.48). Similar to the ratings of ‘hearing guide clearly’, tourists also rated
“understanding the tour guide” as mediocre (M=3.86). It is interesting to note that
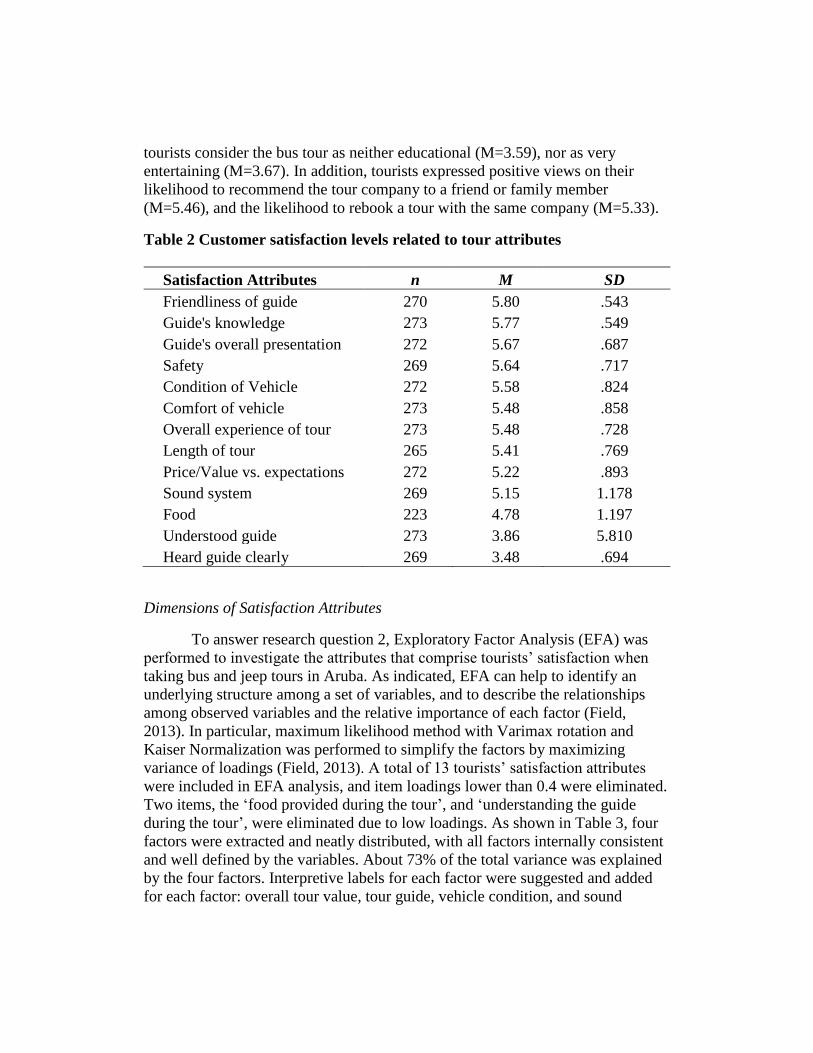
tourists consider the bus tour as neither educational (M=3.59), nor as very
entertaining (M=3.67). In addition, tourists expressed positive views on their
likelihood to recommend the tour company to a friend or family member
(M=5.46), and the likelihood to rebook a tour with the same company (M=5.33).
Table 2 Customer satisfaction levels related to tour attributes
Satisfaction Attributes n M SD
Friendliness of guide 270 5.80 .543
Guide's knowledge 273 5.77 .549
Guide's overall presentation 272 5.67 .687
Safety 269 5.64 .717
Condition of Vehicle 272 5.58 .824
Comfort of vehicle 273 5.48 .858
Overall experience of tour 273 5.48 .728
Length of tour 265 5.41 .769
Price/Value vs. expectations 272 5.22 .893
Sound system 269 5.15 1.178
Food 223 4.78 1.197
Understood guide 273 3.86 5.810
Heard guide clearly 269 3.48 .694
Dimensions of Satisfaction Attributes
To answer research question 2, Exploratory Factor Analysis (EFA) was
performed to investigate the attributes that comprise tourists’ satisfaction when
taking bus and jeep tours in Aruba. As indicated, EFA can help to identify an
underlying structure among a set of variables, and to describe the relationships
among observed variables and the relative importance of each factor (Field,
2013). In particular, maximum likelihood method with Varimax rotation and
Kaiser Normalization was performed to simplify the factors by maximizing
variance of loadings (Field, 2013). A total of 13 tourists’ satisfaction attributes
were included in EFA analysis, and item loadings lower than 0.4 were eliminated.
Two items, the ‘food provided during the tour’, and ‘understanding the guide
during the tour’, were eliminated due to low loadings. As shown in Table 3, four
factors were extracted and neatly distributed, with all factors internally consistent
and well defined by the variables. About 73% of the total variance was explained
by the four factors. Interpretive labels for each factor were suggested and added
for each factor: overall tour value, tour guide, vehicle condition, and sound
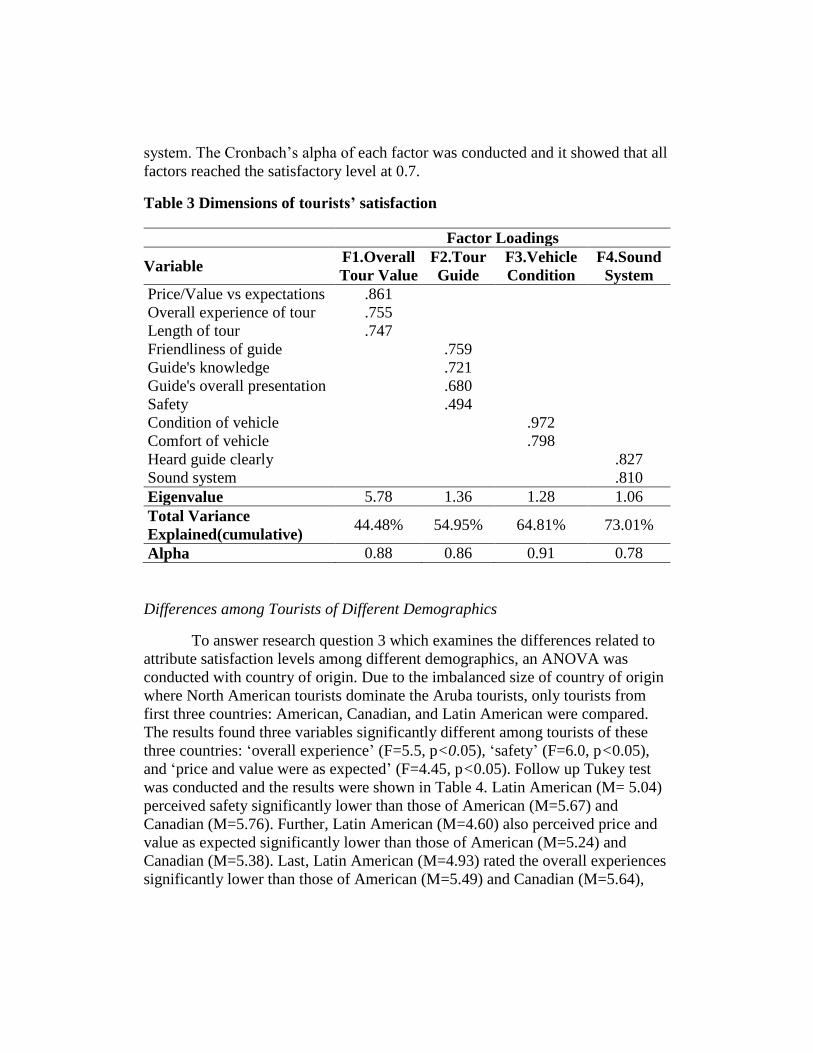
system. The Cronbach’s alpha of each factor was conducted and it showed that all
factors reached the satisfactory level at 0.7.
Table 3 Dimensions of tourists’ satisfaction
Factor Loadings
Variable F1.Overall
Tour Value
F2.Tour
Guide
F3.Vehicle
Condition
F4.Sound
System
Price/Value vs expectations .861
Overall experience of tour .755
Length of tour .747
Friendliness of guide .759
Guide's knowledge .721
Guide's overall presentation .680
Safety .494
Condition of vehicle .972
Comfort of vehicle .798
Heard guide clearly .827
Sound system .810
Eigenvalue 5.78 1.36 1.28 1.06
Total Variance
Explained(cumulative) 44.48% 54.95% 64.81% 73.01%
Alpha 0.88 0.86 0.91 0.78
Differences among Tourists of Different Demographics
To answer research question 3 which examines the differences related to
attribute satisfaction levels among different demographics, an ANOVA was
conducted with country of origin. Due to the imbalanced size of country of origin
where North American tourists dominate the Aruba tourists, only tourists from
first three countries: American, Canadian, and Latin American were compared.
The results found three variables significantly different among tourists of these
three countries: ‘overall experience’ (F=5.5, p<0.05), ‘safety’ (F=6.0, p<0.05),
and ‘price and value were as expected’ (F=4.45, p<0.05). Follow up Tukey test
was conducted and the results were shown in Table 4. Latin American (M= 5.04)
perceived safety significantly lower than those of American (M=5.67) and
Canadian (M=5.76). Further, Latin American (M=4.60) also perceived price and
value as expected significantly lower than those of American (M=5.24) and
Canadian (M=5.38). Last, Latin American (M=4.93) rated the overall experiences
significantly lower than those of American (M=5.49) and Canadian (M=5.64),
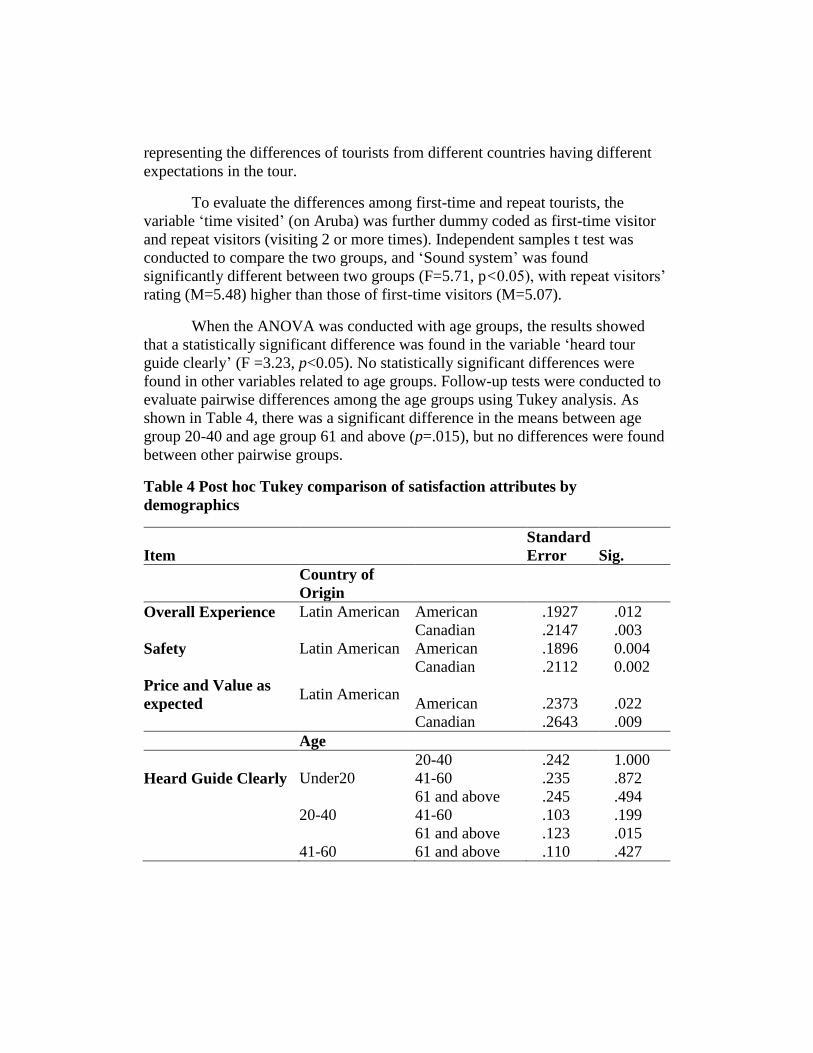
representing the differences of tourists from different countries having different
expectations in the tour.
To evaluate the differences among first-time and repeat tourists, the
variable ‘time visited’ (on Aruba) was further dummy coded as first-time visitor
and repeat visitors (visiting 2 or more times). Independent samples t test was
conducted to compare the two groups, and ‘Sound system’ was found
significantly different between two groups (F=5.71, p<0.05), with repeat visitors’
rating (M=5.48) higher than those of first-time visitors (M=5.07).
When the ANOVA was conducted with age groups, the results showed
that a statistically significant difference was found in the variable ‘heard tour
guide clearly’ (F =3.23, p<0.05). No statistically significant differences were
found in other variables related to age groups. Follow-up tests were conducted to
evaluate pairwise differences among the age groups using Tukey analysis. As
shown in Table 4, there was a significant difference in the means between age
group 20-40 and age group 61 and above (p=.015), but no differences were found
between other pairwise groups.
Table 4 Post hoc Tukey comparison of satisfaction attributes by
demographics
Item
Standard
Error
Sig.
Country of
Origin
Overall Experience Latin American American .1927 .012
Canadian .2147 .003
Safety Latin American American .1896 0.004
Canadian .2112 0.002
Price and Value as
expected Latin American
American .2373 .022
Canadian .2643 .009
Age
Heard Guide Clearly Under20
20-40 .242 1.000
41-60 .235 .872
61 and above .245 .494
20-40 41-60 .103 .199
61 and above .123 .015
41-60 61 and above .110 .427
Satisfaction Attributes and Behavioral Intentions
To investigate research question 4, hierarchical multiple regression was
applied to further investigate to what extent each factor contributes to tourists’
behavioral intentions (likelihood to rebook and likelihood to recommend).
Hierarchical regression allows the order of entry of variables based on theoretical
considerations (Field, 2013). As presented earlier, the relative importance of each
factor was identified among tourists’ satisfaction items, the order of entry is
determined based on the EFA results. Therefore hierarchical regression analysis
was appropriate for the current study which allows for the control of each factor.
As shown in Table 5, the first step involves overall tour value, and the second step
includes both overall tour value and tour guide. Then vehicle condition and sound
system were added to the model in step 3 and step 4, respectively, to test the tourists’
satisfaction factors on tourists’ likelihood to rebook. Variance Inflation Factor (VIF)
and Tolerance were examined and the concern of multicollinearity was not detected
based on the recommendation of tolerance value above 0.1 and VIF below 10 (Hair
et al., 1998).
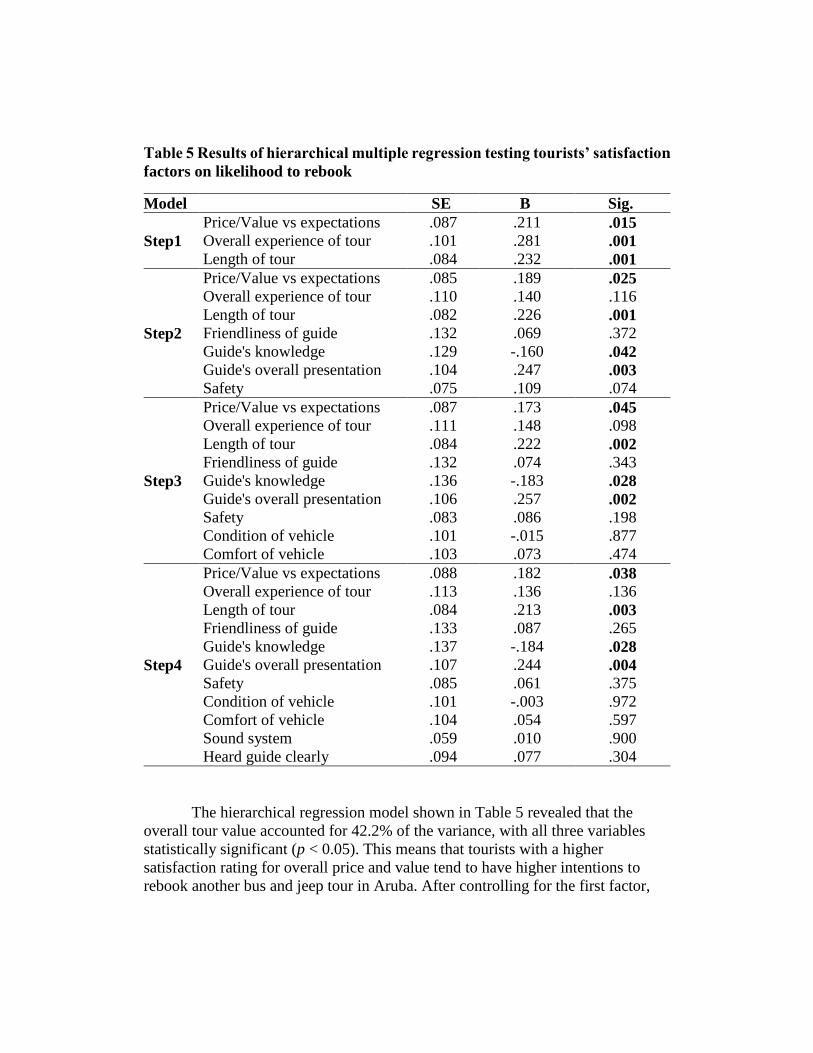
Table 5 Results of hierarchical multiple regression testing tourists’ satisfaction
factors on likelihood to rebook
Model SE B Sig.
Step1
Price/Value vs expectations .087 .211 .015
Overall experience of tour .101 .281 .001
Length of tour .084 .232 .001
Step2
Price/Value vs expectations .085 .189 .025
Overall experience of tour .110 .140 .116
Length of tour .082 .226 .001
Friendliness of guide .132 .069 .372
Guide's knowledge .129 -.160 .042
Guide's overall presentation .104 .247 .003
Safety .075 .109 .074
Step3
Price/Value vs expectations .087 .173 .045
Overall experience of tour .111 .148 .098
Length of tour .084 .222 .002
Friendliness of guide .132 .074 .343
Guide's knowledge .136 -.183 .028
Guide's overall presentation .106 .257 .002
Safety .083 .086 .198
Condition of vehicle .101 -.015 .877
Comfort of vehicle .103 .073 .474
Step4
Price/Value vs expectations .088 .182 .038
Overall experience of tour .113 .136 .136
Length of tour .084 .213 .003
Friendliness of guide .133 .087 .265
Guide's knowledge .137 -.184 .028
Guide's overall presentation .107 .244 .004
Safety .085 .061 .375
Condition of vehicle .101 -.003 .972
Comfort of vehicle .104 .054 .597
Sound system .059 .010 .900
Heard guide clearly .094 .077 .304
The hierarchical regression model shown in Table 5 revealed that the
overall tour value accounted for 42.2% of the variance, with all three variables
statistically significant (p < 0.05). This means that tourists with a higher
satisfaction rating for overall price and value tend to have higher intentions to
rebook another bus and jeep tour in Aruba. After controlling for the first factor,
tour guide (friendliness of tour guide, guide’s knowledge, overall presentation,
and safety) accounted for an additional 4.8% of the variance in likelihood to
rebook the bus and jeep tour. Guide’s knowledge (β=-.16, p<.05), guide’s overall
presentation (β=.25, p<.05) were statistically significant predictors of intention to
rebook. Step 3 and step 4 added vehicle condition and sound system factors
respectively, and the results revealed that these four variables were not
statistically significant predictors of the likelihood to rebook. This means that
even though these four variables were important factors in explaining tourists’
satisfaction, they were not necessarily important factors in predicting the
likelihood to rebook the bus and jeep tour.
Hierarchical multiple regression was applied again (as shown in Table 6)
to test to what extent each tourists’ satisfaction factor contributed to likelihood to
recommend the tour company to friends and family. No multicollinarity concern
was detected among the independent variables. Step one accounted for 57.4% of
the variance indicating the overall tour value and price (β=.22, p<.05), and the
overall experience of the tour (β=.54, p<.05), were strong predictors of the
likelihood to recommend. Step 2 added 5% of the variance, including significant
predictors of friendliness of guide, guide’s overall presentation, and safety. Step 3
added condition of vehicle and none of the two variables were significant
predictors. Step 4 examined the sound system with all of the other factors
controlled, and the results revealed that ‘heard guide clearly’ (β=.17, p<.05), is a
significant predictor determining likelihood to recommend.
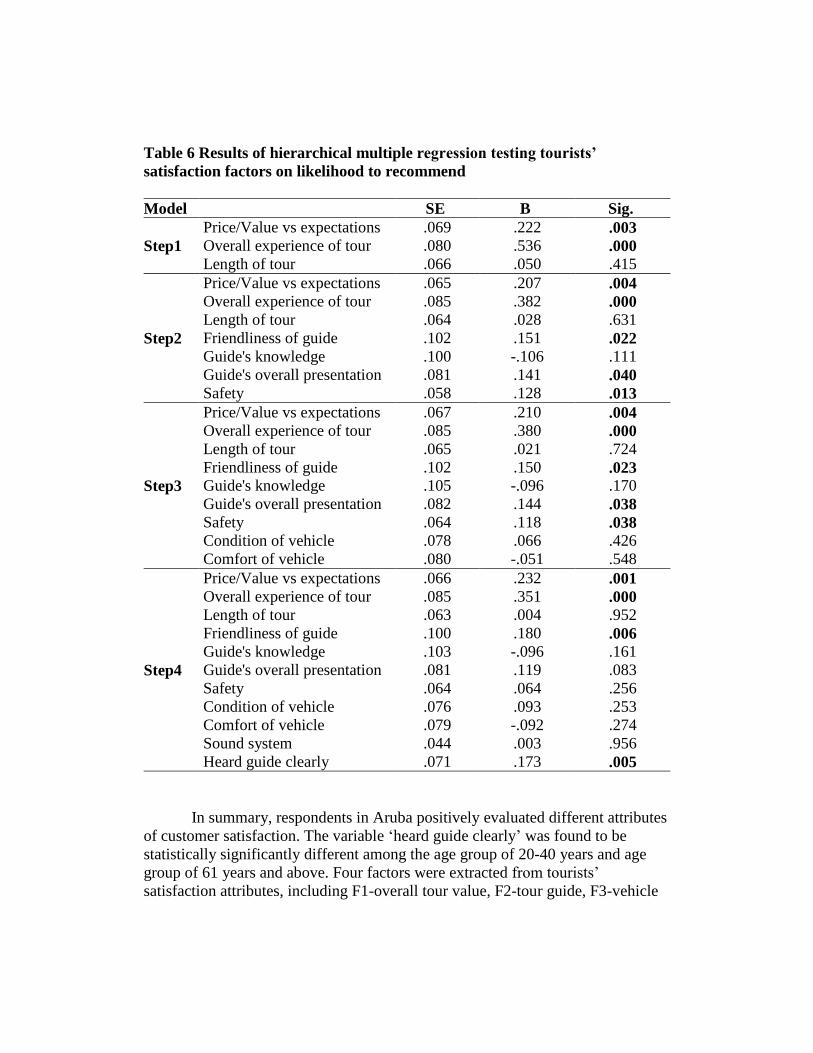
Table 6 Results of hierarchical multiple regression testing tourists’
satisfaction factors on likelihood to recommend
Model SE B Sig.
Step1
Price/Value vs expectations .069 .222 .003
Overall experience of tour .080 .536 .000
Length of tour .066 .050 .415
Step2
Price/Value vs expectations .065 .207 .004
Overall experience of tour .085 .382 .000
Length of tour .064 .028 .631
Friendliness of guide .102 .151 .022
Guide's knowledge .100 -.106 .111
Guide's overall presentation .081 .141 .040
Safety .058 .128 .013
Step3
Price/Value vs expectations .067 .210 .004
Overall experience of tour .085 .380 .000
Length of tour .065 .021 .724
Friendliness of guide .102 .150 .023
Guide's knowledge .105 -.096 .170
Guide's overall presentation .082 .144 .038
Safety .064 .118 .038
Condition of vehicle .078 .066 .426
Comfort of vehicle .080 -.051 .548
Step4
Price/Value vs expectations .066 .232 .001
Overall experience of tour .085 .351 .000
Length of tour .063 .004 .952
Friendliness of guide .100 .180 .006
Guide's knowledge .103 -.096 .161
Guide's overall presentation .081 .119 .083
Safety .064 .064 .256
Condition of vehicle .076 .093 .253
Comfort of vehicle .079 -.092 .274
Sound system .044 .003 .956
Heard guide clearly .071 .173 .005
In summary, respondents in Aruba positively evaluated different attributes
of customer satisfaction. The variable ‘heard guide clearly’ was found to be
statistically significantly different among the age group of 20-40 years and age
group of 61 years and above. Four factors were extracted from tourists’
satisfaction attributes, including F1-overall tour value, F2-tour guide, F3-vehicle
condition, and F4-sound system. Additionally, overall tour value, tour guide and
sound system were found to be strong predictors of behavioral intentions (the
likelihood to rebook and the likelihood to recommend the tour company).
Discussion and Implications
As indicated in the results, tourists were generally satisfied with the jeep
and bus tours provided by the tour company where the surveys were distributed
on Aruba. They believed that the tour guides were friendly and knowledgeable,
but at the same time tourists, aged 61 or above, expressed their concerns about
hearing the guide clearly. Furthermore, tourists expressed the same concern in
understanding the tour guides, especially during the tour.
Operational strategies are drawn from these results. Tourists from Latin
American countries in general perceived their overall experiences, safety, and
price and value as expected significantly lower than Americans and Canadians. It
is suggested that tour managers should pay more attention to these factors on
Latin Americans. Further, repeat customers rated “sound system” significantly
higher than those of first time visitors, indicating more tolerant level for repeat
customers than those of firs time tourists. Besides the improvement of sound
system, more attention should be paid to first time tourists in order to cater their
needs and wants. Given the fact that many of the tourists were older (61 years and
older) who may not have outstanding hearing abilities, as younger tourists might,
tour guides should pay special attention to the volume of their voices, the quality
of their sound systems used in the buses and jeeps, and to ensure that they are
heard and understood by all of the tourists.
In addition, tour companies may also want to consider using an advanced
sound system and headphones in the jeeps and buses that people can wear while
on the tours to provide a more isolated sound system during the tour. They could
also provide a written script to people in order to ensure that people on the tour
receive all of the information about the history and highlights of the island. These
could also be strategies touted in marketing campaigns in order to help people
select the correct tour company during their visit on the island. There are several
tour companies on Aruba and this could help to create a competitive advantage
for them to implement better sound systems in the vehicles.
It is interesting to note that tourists rated the satisfaction level close to the
neutral or negative rating with regards to the tours being educational or
entertaining. This means that the jeep and bus tours as service products do not
have a clear image to the tourists taking the tours. Building a clear image is
important for destinations and tour operators in order to help differentiate
themselves from other destinations and tour companies, and also help tourists to
create a memorable travel experience.
In response to the paucity of a strong image, alliance of new products and
projects to the existing geographic tourism area are encouraged not only to
diversify the offerings to the tourists, but also to prevent new burden to the
intensively developed island (Razak, 2007). In particular, marketing strategies are
suggested to initiate a theme of these tours as educational, entertaining, or
culturally oriented to better serve the tourists.
Specific to the bus and jeep tour, more parts of the bus tour could be
designed to enhance the themes, such as a short movie introducing the tour, and
retail opportunities that sell the theme related products. By describing the tours as
educational, entertaining, or culturally oriented, companies can help tourists
choose the tour that most fits their interests. In addition, a clearer image of Aruba
could be introduced during the tour, including the culture and history of the island
in order to add to the educational, entertaining, or culturally oriented components
of the tourist experience. This could also help to focus the tour company on the
components of the tour that most fit the needs of their specific customer relative
to the type of tour that they choose (educational, entertaining, or culturally
oriented).
As mentioned earlier, Aruba is a small island with limited capacity and
resources, thus enhancing the existing tourism products and services rather than
constructing new projects is the key for sustainable development. Continuous
improvements on the quality of tourist experiences aligned with slowing down the
growing pace are possible avenues for future tourism development in Aruba (Cole
& Razak, 2011). Following this line of thought, the current study has found four
key factors of tourist satisfaction attributes in the jeep and bus tour. Specifically,
the overall tour value account for up to 45% of the variance, representing strong
indicators of tourists’ satisfaction. Four factors together explained 73% of the
total variance, which demonstrates that the overall value of the tour, as well as
overall experience have a strong impact on tourists’ satisfaction.
Three factors of tourist satisfaction: overall tour value, tour guide, and
sound system, have been found to be strong indicators of behavioral intentions.
The vehicle condition was an important factor in tourists’ satisfaction, but it’s not
a predictor of behavioral intentions. The results were consistent with many of the
studies in the destination literature where tourists’ satisfaction was the antecedents
of the behavioral intentions (Chi & Qu, 2008; Chen & Chen, 2009; Kozak, 2001;
Kozak & Rimmington, 2000; Yoon & Uysal, 2005). In this study the four factors
are found to explain 47.8% of the variance of the likelihood to rebook, and 57.4%
of the variance of the likelihood to recommend, which are considered as strong to
capture customer behavioral intentions.
In particular, the current study has confirmed the importance of overall
value in predicting behavioral intentions, as suggested by previous studies (Chen
& Chen, 2009; Hutchinson et al., 2009). This study also further highlighted that
Latin Americans perceived ‘price and value as expected’ significantly lower than
those of North Americans. It is recommended that marketing strategies should be
made on the overall value of the bus and jeep tours to attract more tourists, and
pay special attention to Latin American tourists. This is in line with the idea that
more products and services should be created and provided to the tourists so that
more value is added to the existing tourism products. As another important factor
of tour guide, this study also supported the findings of Farías (2010) and Huang et
al. (2014) that tour guides play a critical role in building the relationship between
the tour company and the tourists; and quality of the communications should be
ensured to facilitate the service. The overall sound system is found to be another
strong indicator to predict behavioral intentions. This factor can be considered as
more related to the specific context of bus and jeep tour in Aruba. As discussed
earlier, destination managers need in Aruba need to pay special attention of sound
system to especially serve the need of older tourists.
Conclusions
This study has investigated tourist satisfaction and behavioral intentions
using the case of Aruba as a small island destination. With limited space and
resources available, Aruba should implement long-term tourism development
strategies to address the sustainable issues facing the small islands. Focusing on
economic factors alone is not sufficient in examining the elements influencing
tourism demand (Ridderstaat, Oduber, Croes, Nijkamp, & Martens, 2014), Aruba
should fully utilize existing facilities to make it more sustainable and competitive.
The current study has confirmed the importance of tourist satisfaction on
the behavioral intention in a tourist context, especially for Small Island Tourism
Economies. It has supported previous studies of overall value and tour guide as
important attributes in predicting behavioral intentions. The sound system, in
addition, is pointed out to be another attribute that need to be addressed in the bus
and jeep tours in Aruba. The results further showed that the marketing strategies
still need to focus on the different attributes of tourist satisfaction to attract repeat
tourists. Given the fact that about 20% of the respondents in the survey are repeat
tourists to the island, which is considered fairly high; it becomes crucial for the
tour company to encourage repeat customers and to spread the positive word-of-
mouth.
Limitation and Future Research
This study is not free of limitations. The management team of the tour
company designed the questionnaire and several demographic characteristics such
as gender and household income, were not reported Future studies may include
these important factors and provide a more comprehensive view on the tourists’
demographics. In addition, the survey was given to people specifically taking a
jeep or bus tour on Aruba; therefore the results may not be generalized to other
small island tourism destinations.
Future directions for research of tourism on small islands can generate a
questionnaire that covers other satisfaction attributes such as accommodation,
restaurants, and transportation related to the destination and not just the tour
companies. The current Central Bureau of Statistics (2013) report that is
disseminated by the island nation of Aruba is also not specific enough to illustrate
a more elaborated purpose of visit of tourists visiting the island. General terms
such as “vacation”, “honeymoon”, “visit friends” etc. are listed on their
questionnaire. It is suggested to add other related activities that tour operators
provide on the island such as snorkeling, scuba diving, wind surfing, jeep safari,
kayaking, and other recreation activities be added so that a more detailed survey
of tourist satisfaction can be done.
References
Ajzen, I. (1988). Attitude, personality and behavior. Milton Keynes, England: Open University
Press.
Ajzen, I. (1991). The theory of planned behavior. Organizational Behavior and Human Decision
Processes, 50, 179-211.
Alegre, J., & Garau, J. (2010). Tourist satisfaction and dissatisfaction. Annals of Tourism
Research, 37(1), 52-73.
Algieri, B. (2006). International Tourism Specialisation of Small Countries. International
Journal of Tourism Research, 8, 1-12.
Anderson, E.W., Fornell, C., & Lehmann, D.R. (1994). Customer satisfaction, market share, and
profitability: Findings from Sweden. Journal of Marketing, 58(3), 53-66.
Baker, D., & Crompton, J. (2000). Quality, satisfaction and behavioral intentions. Annals of
Tourism Research, 27, 785-804.
Berry, L. L., Parasuraman, A., & Zeithaml, V. A. (1994). Improving service quality in America:
lessons learned. Academy of Management Executive, 8(2), 33–52.
Bull, C., & Weed, M. (1999). Niche markets and small island tourism: the development of sports
tourism in Malta. Managing Leisure, 4(3), 142-155. doi: 10.1080/136067199375814.
Buttle, F., & Bok, B. (1996). Hotel marketing strategy and the theory of reasoned action.
International Journal of Contemporary Hospitality Management, 8(3), 5-10.
Caribbean Tourism Organization. (2010). Individual Country Statistics. Retrieved from
http://www.onecaribbean.org/content/files/Strep1AnguillaToBonaire2010.pdf on October
20.
Caribbean Tourism Organization. (2012). Latest Statistics 2012, April 11, 2013. Retrieved from
http://www.onecaribbean.org/content/files/18April2013Lattab2012.pdf
Central Bureau of Statistics (2013). Retrieved from http://www.cbs.aw/ on October 20.
Chang, L. (1994). A psychometric evaluation of 4-point and 6-point Likert-type scales in relation
to reliability and validity. Applied Psychological Measurement, 18(3), 205-215.
Chen, C.F., & Chen, F.S. (2009). Experience quality, perceived value, satisfaction and
behavioral intentions for heritage tourists. Tourism Management, 31(1), 29-35.
Chi, C., & Qu, H. (2008). Examining the structural relationships of destination image, tourist
satisfaction and destination loyalty: An integrated approach. Tourism Management,
29(4), 624-636. doi:10.1016/j.tourman.2007.06.007
Chomeya, R. (2010). Quality of psychology test between Likert scale 5 and 6 points. Journal of
Social Science, 6(3):399-403.
Coghlan, A., & Pearce, P. (2010). Tracking affective components of satisfaction. Tourism and
Hospitality Research, 10(1), 42-58.
Cole, S. (2012). Synergy and congestion in the tourist destination life cycle. Tourism
Management, 33(5), 1128-1140.
Cole, S., & Razak, V. (2011). Island Awash–Sustainability Indicators and Social Complexity in
the Caribbean. In Quality-of-Life Community Indicators for Parks, Recreation and
Tourism Management (pp. 141-161). Springer Netherlands.
Craigwell, R. (2007). Tourism competitiveness in small island developing states. Working
papers UNU-WIDER research paper, World Institute for Development Research.
Croes, R. R. (2005). A cost/benefit analysis concerning tourism specialization and economic
performance: the case of Aruba. Latin Americanist.
Croes, R. R. (2006). A paradigm shift to a new strategy for small island economies: Embracing
demand side economics for value enhancement and long term economic stability.
Tourism Management, 27(3), 453-465.
Crouch, G. I., & Ritchie, J. R. B. (1999). Tourism, Competitiveness, and Societal Prosperity.
Journal of Business Research, 44, 137-152.
Deng,W (2007). Using a revised importance-performance analysis approach: the case of
Taiwanese hot springs tourism. Tourism Management 28, 1274–1284.
Farias (2010). Sightseeing Buses: Cruising, timing and the montage of attractions, Mobilities, 5
(3), 387–407.
Field, A. (2013). Discovering Statistics Using IBM SPSS Statistics (4th ed.). Los Angeles, CA:
Sage Publishing.
Fuchs, M. & Weiermair, K (2004). Destination benchmarking: An indicator-system’s potential
for exploring guest satisfaction. Journal of Travel Research, 4(2) 212–225.
Hair, JF, Anderson, RE, Tatham RL, & Black, WC (1998). Multivariate data analysis, 5th ed.
Pearson Education, Singapore.
Hsu, H. C. & Huang, S. (2012). An Extension of the Theory of Planned Behavior Model for
Tourists. Journal of Hospitality & Tourism Research, 36: 390
Huang, S. S., Weiler, B., & Assaker, G. (2014). Effects of interpretive guiding outcomes on
tourist satisfaction and behavioral intention. Journal of Travel Research,
0047287513517426.
Hutchings, C. (1996). Trouble in paradise, The Geographical Magazine, January 1996, pp. 20–22
Hutchinson, J., Lai, F., & Wang, Y. (2009) Understanding the relationships of quality, value,
equity, satisfaction, and behavioral intentions among golf travelers. Tourism
Management, 30(2), 298-208.
Jackman, M., Lorde, T., Lowe, S., & Alleyne, A. (2011). Evaluating tourism competitiveness of
small island developing states: a revealed comparative advantage approach. Anatolia,
22(3), 350-360. doi: 10.1080/13032917.2011.626311
Kozak, M., & Rimmington, M. (2000). Tourist satisfaction with Mallorca, Spain, as an off-
season holiday destination. Journal of Travel Research, 38(1), 260–269.
Kozak, M. (2001). Repeaters’ behavior at two distinct destinations. Annals of Tourism Research,
28(3), 784-807.
Lam, T., & Hsu, C.H. (2006) Predicting behavioral intention of choosing a travel destination.
Tourism Management, 27(4), 589-599.
Lanza, A., Temple, P., & Urga, G. (2003). The implications of tourism specialisation in the long
run: an econometric analysis for 13 OECD economies. Tourism Management, 24(3), 315-
321.
Lewis, A. (2004). Rationalising a tourism curriculum for sustainable tourism development in
small island states: A stakeholder perspective. Annual Conference Proceedings for
Association for Tourism in Higher Education, 77-87.
Marcussen (2011). Determinants of tourist satisfaction and intention to return. Tourism, 203-221.
Maunier, C., & Camelis, C. (2013). Toward an identification of elements contributing to
satisfaction with the tourism experience. Journal of Vacation Marketing, 19(1), 19-39.
Oliver, R. L. (1997). Satisfaction: a behavioral perspective on the consumer. Irwin: McGraw-Hill
Company.
Oliver, RL (1980). A cognitive model of the antecedents and consequences of satisfaction
decisions. Journal of Marketing Research 17, 460–469.
Oliver, R.L., & Swan, J.E. (1989). Equity and disconfirmation perceptions as influences on
merchant and product satisfaction. Journal of Consumer Research, 16, 372-383.
Oyewole, P. (2001). Prospects for developing country exports of services for the year 2010:
projections and public policy implications. Journal of Macro marketing, 21(1), 32-46.
Petrick, J. F. (2004). The roles of quality, value, and satisfaction in predicting cruise passengers’
behavioral intentions. Journal of Travel Research, 4(2), 397–407.
Pigliaru, F., Brau, R., & Lanza, A. (2007). How Fast are Small Tourist Countries Growing? The
1980-2003 Evidence. Cagliari, Italy: University of Cagliari.
Pizam, A., Neumann, Y., Reichel, A. (1978). Dimensions of tourist satisfaction with a
destination area. Annals of Tourism Research, 5(3), 314-322.
Poon, A. (1990). Flexible Specialization and Small Size: The case of Caribbean Tourism. World
Development, 18(1), 109-123.
Razak, V. (2007). From culture areas to ethnoscapes: An application to tourism development.
Journal of Regional Policy, 373, 199–212.
Reisinger Y., & Waryszak, R. (1994). Japanese tourists' perceptions of their tour guides:
Australian experience. Journal of Vacation Marketing, 1:28.
Ridderstaat, J., Oduber, M., Croes, R., Nijkamp, P., & Martens, P. (2014). Impacts of seasonal
patterns of climate on recurrent fluctuations in tourism demand: Evidence from Aruba.
Tourism Management, 41, 245-256.
Shaw, G. , & Williams, A. (1994) Critical Issues in Tourism: A Geographical Perspective,
Oxford: Blackwell.
Song, H., van der Veen, R., Li, G., & Chen, J.L. (2012) The Hong Kong tourist satisfaction
index. Annals of Tourism Research, 39(1), 459-479.
Spreng, R. A., MacKenzie, S. B. & Olshavsky, R. W. (1996), A reexamination of the
determinants of consumer satisfaction. Journal of Marketing, 60,(3) pp. 15-32.
Vanegas, M., & Croes, R. R. (2003). Growth, development and tourism in a small economy:
Evidence from Aruba. International Journal of Tourism Research, 5(5), 315-330.
von Tigerstrom, B. (2005). Small island development states and international trade: Special
challenges in the global partnership for development. Melbourne Journal of International
Law, 6, 402-431.
Walker, J.L. (1995). Service encounter satisfaction: conceptualized. Journal of Services
Marketing, 9(1), 5-14.
Williams, P., & Soutar, G. N. (2009). Value, satisfaction and behavioral intentions in an
adventure tourism context. Annals of Tourism Research, 36(3), 413-438.
World Travel and Tourism Council (WTTC) (2013a). Economic Data Search Tool. Retrieved
fromhttp://www.wttc.org/research/economic-data-search-tool/ on November 18
World Travel and Tourism Council (WTTC) (2013b,). Travel & Tourism Trends and Economic
Impact. Retrieved from
http://www.wttc.org/site_media/uploads/downloads/WTTC_monthly_update_September
_2013.pdf on November 08
Yoon, Y., & Uysal, M. (2005). An examination of the effects of motivation and satisfaction on
destination loyalty: A structural model. Tourism Management, 26(1), 45–56.
Yu L., & Goulden, M. (2006). A comparative analysis of international tourists’ satisfaction in
Mongolia. Tourism Management, 2 (7) 1331–1342.
Zeithaml, V. A., Berry, L. L. and Parasuraman, A. (1996). The Behavioral Consequences of
Service Quality. Journal of Marketing, 60 (2), p.31-46