Embed Size (px)
Citation preview

Customer Relationship Management
Chapter 5 Customer portfolio management
+ WHITE PAPER
A.Y. 2017-2018Prof. Gennaro Iasevoli
UNIVERSITÀ
LUMSAMs in Marketing & digital communication

Customer portfolio definition
A customer portfolio is the collection of mutually exclusive customer groups that comprise a business’s entire customer base.

Objectives of Customer Portfolio Management (CPM)
CPM aims to optimize business performance – whether that means sales growth, enhanced
customer profitability or something else –
across the entire customer base.
It does this by offering differentiated value propositions to different segments of customers.

CUSTOMERS
Prospect Current Ex
AIMS
To get customers
To increase loyalty To get customer
back
ANALYSIS AND TARGETING
Segmen
tation
Customer portfo
lio mngt

How B2B customers differ from B2C customers
Fewer in number Bigger in size Closer relationships with suppliers Derived demand Professional buying Direct purchase

Basic disciplines for CPM
market segmentation sales forecasting activity-based costing customer lifetime value estimation data mining

Market segmentation definition
Market segmentation is the process of dividing up a market into more-or-less homogenous subsets for which it is possible to create different value propositions.

Intuitive vs. data-based segmentation

Market segmentation process
1.
identify the business you are in2.
identify relevant segmentation variables
3.
analyse the market using these variables4.
assess the value of the market segments
5.
select target market(s) to serve

Types of competitor (kitchen furniture example)
Benefit competitors●
other companies delivering the same benefit to customers. These might include window replacement companies, heating and air-conditioning companies and bathroom renovation companies.
Product competitors●
other companies marketing kitchens to customers seeking the same benefit.
Geographic competitors●
these are benefit and product competitors operating in the same geographic territory.

Criteria for segmenting consumer markets
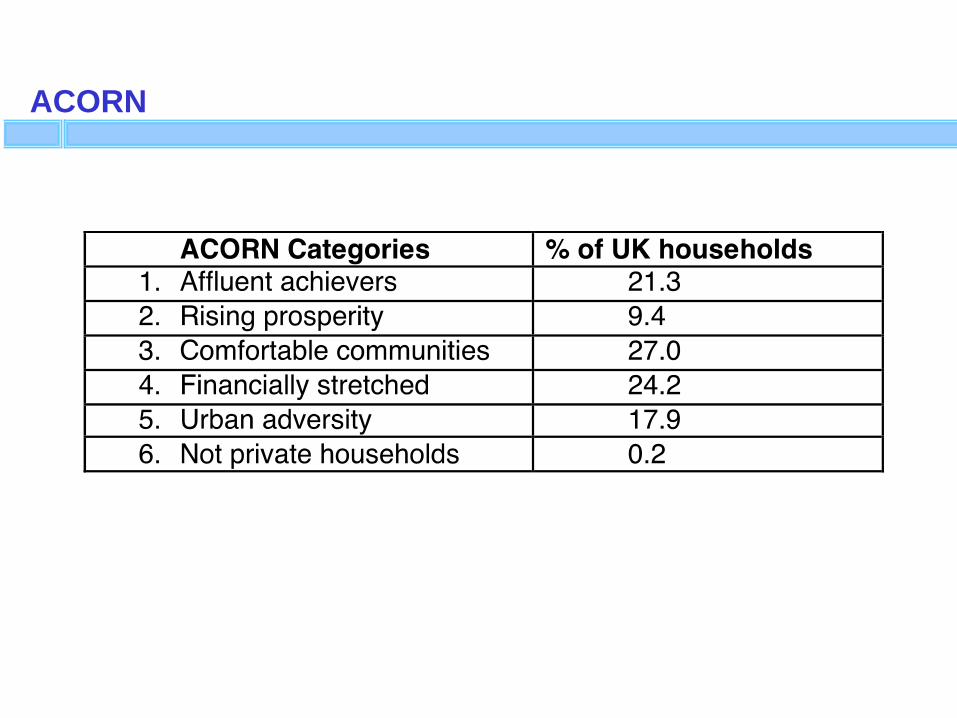
ACORN

Bivariate segmentation of the chocolate market

Criteria for segmenting business markets

Examples of ISIC codes

IBM targets 18 industry sectors
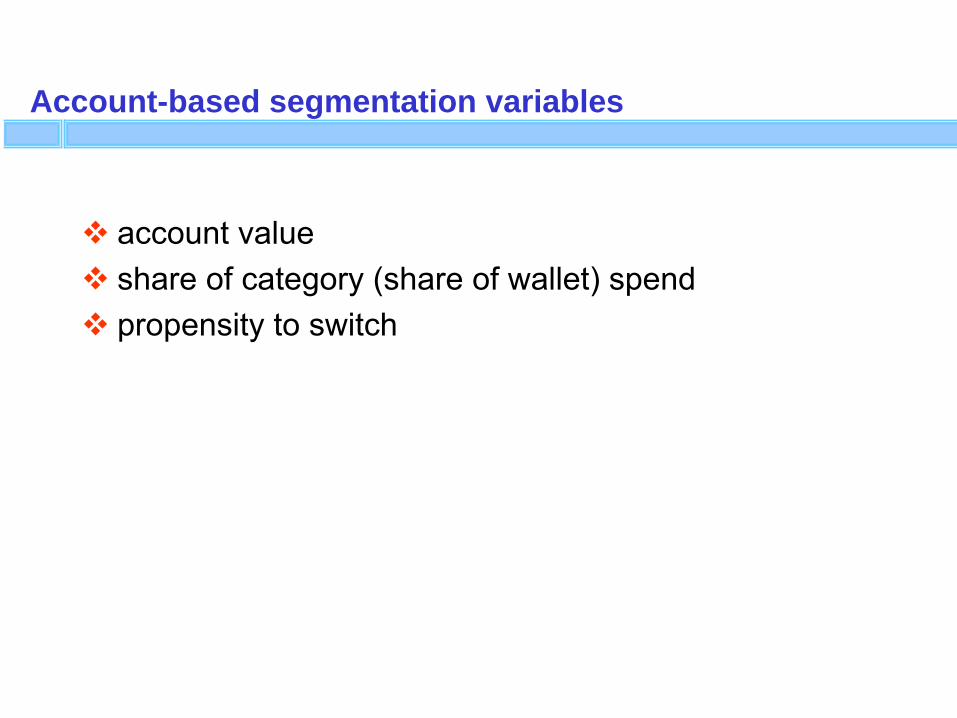
Account-based segmentation variables
account value share of category (share of wallet) spend propensity to switch

Evaluation of segmentation opportunities

McKinsey/GE customer portfolio matrix

Sales forecasting methods
Qualitative methods●
Customer surveys
●
Sales team estimates
Time-series methods●
Moving average
●
Exponential smoothing●
Time-series decomposition
Causal methods●
Leading indicators
●
Regression models
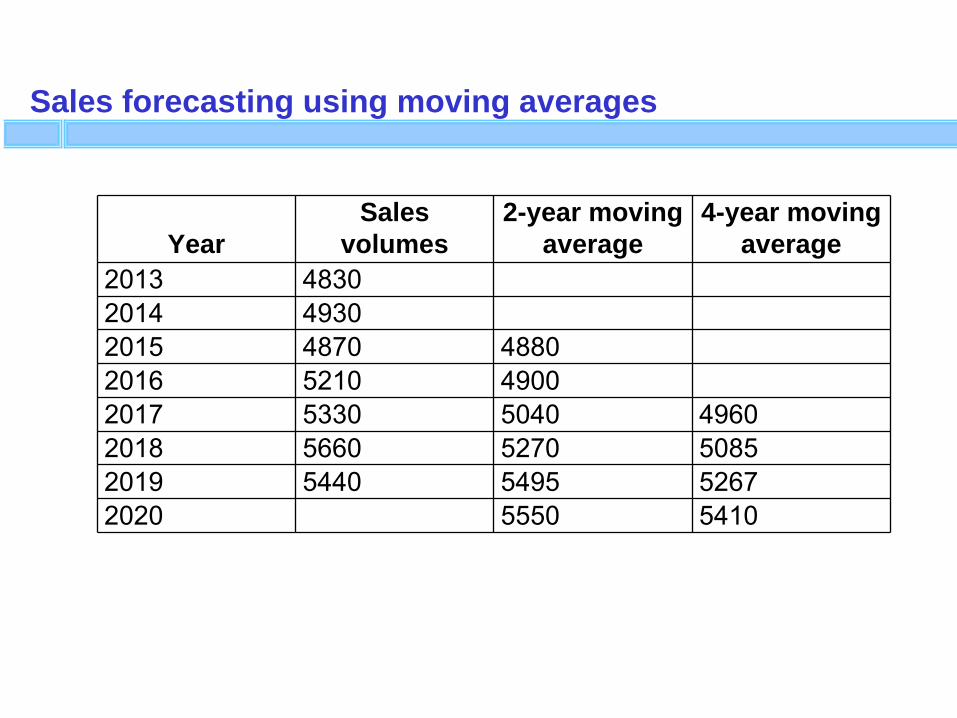
Sales forecasting using moving averages
YearSales
volumes2-year moving
average4-year moving
average2013 48302014 49302015 4870 48802016 5210 49002017 5330 5040 49602018 5660 5270 50852019 5440 5495 52672020 5550 5410

Activity-based costing 1
Costs do vary from customer-to-customer. Some customers are very costly to acquire and serve, others are not. Customer acquisition costs
●
Some customers require considerable sales effort to shift them from prospect to first-time customer status: more sales calls, visits to reference customer sites, free samples, engineering advice, guarantees that switching costs will be met by the vendor.
Terms of trade●
Price discounts, advertising and promotion support, slotting allowances (cash paid to retailers for shelf space), extended invoice due dates.

Activity-based costing 2
Customer service costs●
Handling queries, claims and complaints, demands on salesperson and contact centre, small order sizes, high order frequency, just-in-time delivery, part-load shipments, breaking bulk for delivery to multiple sites.
Working capital costs●
Carrying inventory for the customer, cost of credit.

Advanced MarketingCRM Process Cycle
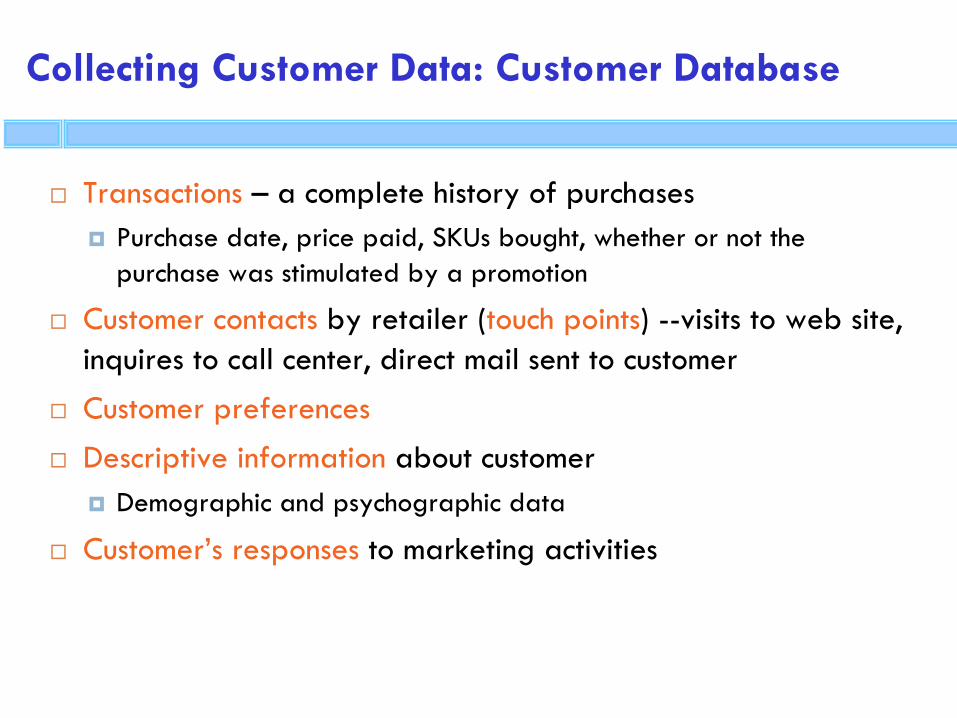
Collecting Customer Data: Customer Database
Transactions –
a complete history of purchases
Purchase date, price paid, SKUs bought, whether or not the purchase was stimulated by a promotion
Customer contacts by retailer (touch points) --visits to web site, inquires to call center, direct mail sent to customer
Customer preferences
Descriptive information about customer
Demographic and psychographic data
Customer’s responses to marketing activities

Collecting Customer Data:
Identifying
Information
Approaches that store-based retailers use:
Asking for identifying information
Telephone number, name and address
Offering frequent shopper cards
Loyalty programs that identify and provide rewards to customers who patronize a retailerPrivate label credit card (that has the store’s name on it)
Connecting Internet purchasing data with the stores

Privacy Concerns
Control over Collection
Do customers know what information is being collected?
Do customers feel they can decide upon the amount and type of information collected by retailers?
Control over Use
Do customers know how the information will be used by the retailer?
Will the retailer share the information with third parties?
Steve Cole/Getty Images

YOU FIND NEXT TOPICS IN WHITE PAPER

PHASE 2: ANALYZING CUSTOMERS PROFILING
The main aim of this phase is to make a ranking of customers through a precise rating: “rating for ranking”
The customer marketing aims are defined on the basis of the ranking

CUSTOMER ANALYSIS
PORTFOLIO ANALYSIS
STATIC DYNAMIC
1VARIABLE
2VARIABLES
N VARIABLES

Customer Pyramid
Platinum BestMost loyalLeast price sensitive
80-20 rule:80% of sales or profits come from 20% of the customers

4%
Selling % Profits %
26%
20% 29%
50% 55%
30% 70% 16%
NUMBER OF CUSTOMERS %
PORTFOLIO ANALYSIS WITH ONE VARIABLE

The 80:20 rule or Pareto principle

Customer profitability by sales volume quintile

WHICH IS THE INFLUENCE OF THE 5% OF CUSTOMERS ON THE PROFITS?
9 5 7
5
9 5 8
5
9 5 7
2
52 5
5 1 5
52 8
100 %
90%80%70%60%50%40%30%20%10%0%
Customer
s
Profits
Customer
s
Profits
Customer
s
Profits
Credit cards Cosmetics Telephone marketLong Distance

PORTFOLIO ANAYLIS AND PYRAMID
ABC ANALYSIS
It involves the use of a single variable (usually revenue) to analyze the importance of the customer's business portfolio
Customers are ranked in descending order according to thevariable
Usually Pareto Paradigm is confirmed (rule 20/80)
Average 1‐12
customers=282.807
Average 30 customers= 157.380
Average 13‐30 customers=
73.762

CUSTOMER ANALYSIS
PORTFOLIO ANALYSIS
STATIC DYNAMIC
1VARIABLE
2VARIABLES
N VARIABLES

CUSTOMERS PORTOFOLIO ANALISIS USING 2 VARIABLES (CUSTOMERS MATRIX)
We use two variables
Matrixs are more realible and to identify Key Clients
It’s difficult to chose two variables
There are three different typologiesMatrices of customer profitability: economic variablesMatrices of the competitive situation of customers estimate the customers' competitiveness in key marketsMatrices of customer relations: non-economic variables (satisfaction, no complaints, ease of maintenance, etc.)
CUSTOMERS PORTOFOLIO ANALISIS USING 2 VARIABLES (CUSTOMERS MATRIX)

USING SHARE AND SIZE OF WALLET

CUSTOMERS TYPOLOGIES AND THE RELATIONSHIP BETWEEN
LOYALTY AND SATISFACTION
CUSTOMER SATISFACTION
Very Unsatisfied
Very Satisfied
100%
40%
20%
0%
60%
80%
Unsatisfied Nor satisfied Neither unsatisfied
LEVEL OF
Satisfied
es
postlesHostages Loyalty area A
Indifference area
Defection area
Almost apostl
Protesters Mercenaries

Shapiro et al.’s customer portfolio matrix

How costs vary between customers

Fiocca’s CPM model: step 1
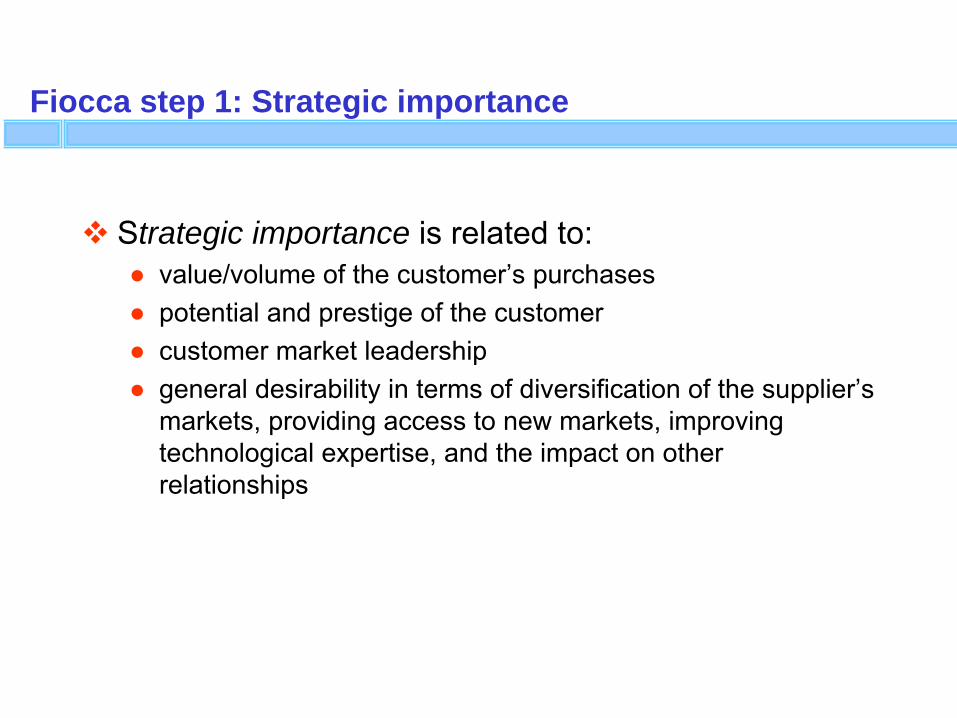
Fiocca step 1: Strategic importance
Strategic importance is related to:●
value/volume of the customer’s purchases
●
potential and prestige of the customer●
customer market leadership
●
general desirability in terms of diversification of the supplier’s markets, providing access to new markets, improving technological expertise, and the impact on other relationships
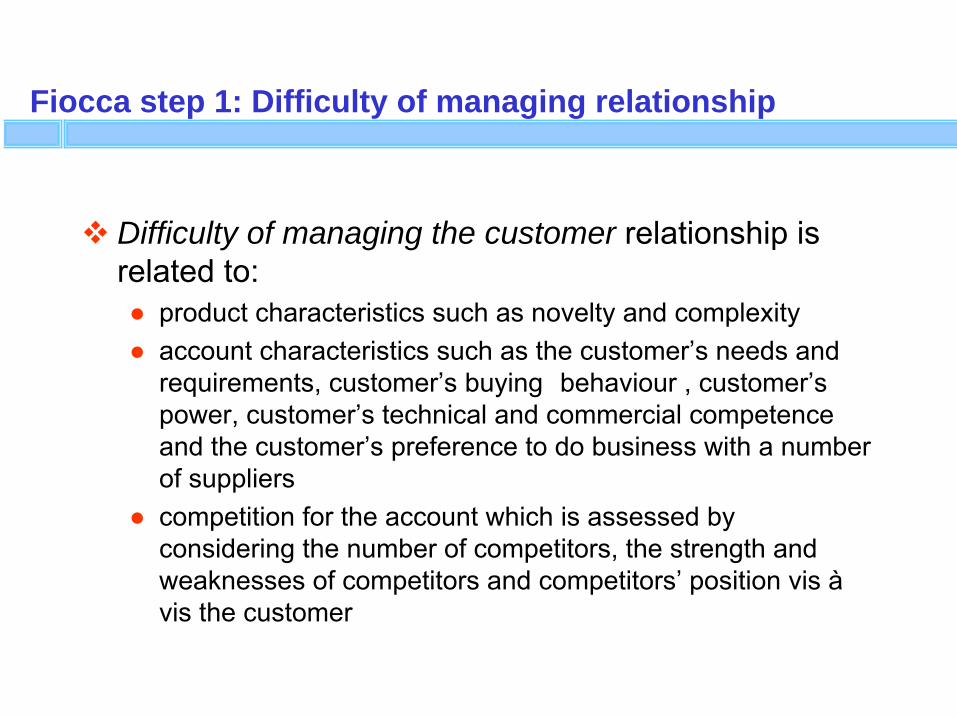
Fiocca step 1: Difficulty of managing relationship
Difficulty of managing the customer relationship is related to:●
product characteristics such as novelty and complexity
●
account characteristics such as the customer’s needs and requirements, customer’s buying
behaviour , customer’s
power, customer’s technical and commercial competence and the customer’s preference to do business with a number of suppliers
●
competition for the account which is assessed by considering the number of competitors, the strength and weaknesses of competitors and competitors’
position vis
à
vis
the customer

Fiocca step 2
Assess key easy and key difficult accounts:●
The customer’s business attractiveness
●
The strength of the buyer/seller relationship

Fiocca step 2: Customer’s attractiveness

Fiocca step 2: Strength of relationship
the length of relationship the volume or dollar value of purchases the importance of the customer (percentage of
customer’s purchases on supplier’s sales) personal friendships cooperation in product developmentmanagement distance (language and culture) geographical distance

Fiocca step 2: Strategic options

Turnbull and Zolkiewski’s 3D model

Additional CPA tools
SWOT analysis BCG matrix analysis

Boston Consulting Group (BCG) matrix

CUSTOMER ANALYSIS
PORTFOLIO ANALYSIS
STATIC DYNAMIC
1VARIABLE 3
VARIABLES2VARIABLES

RFM Analysis
Used by catalog retailers and direct marketers Recency: how recently customers have made a purchase Frequency: how frequently they make purchases Monetary: how much they have bought

RFM Target Strategies

CUSTOMERS ANALYSIS BASED ON 3 VARIABLES ( FRM METHOD)
CUSTOME R
Frequency Recency Monetary Scorefrequency
Scorerecency
Scoremonetary
TOTAL
Auto rossi 1 July 400.000 5 10 16 31
Moto Bianchi
2 April 150.000 10 5 6 21
Verdi Elettro
2 February 550.000 10 5 22 37
HYPOTHESIS
Recency = 15 for the third 4 months period; 10 for the second; 5 for thr
first
Frequency = number od agreements dealed in the period X 5
Monetary = 0,004% of the value
37

Margin multiples

Preparation for data mining
1.
Define the business problem you are trying to solve.2.
Create a data mart that can be subjected to data mining.
3.
Develop a model that solves the problem. This is an iterative process of developing a hypothetical solution to the problem (also known as model building), testing and refinement.
4.
Improve the model. As new data are loaded into the data warehouse, further subsets can be extracted to the data mining data mart and the model enhanced.

Data mining for CPM
Clustering techniques●
CART
●
CHAID
Decision trees Neural networks

Credit risk training set
Name Debt Income Married? Risk
Joe High High Yes Good
Sue Low High Yes Good
John Low High No Poor
Mary High Low Yes Poor
Fred Low Low Yes Poor

Cross-tabulation of dependent and independent variables

Decision tree output

CUSTOMER ANALYSIS
PORTFOLIO ANALYSIS
STATIC DYNAMIC
1VARIABLE 3
VARIABLES2VARIABLES

Other
New
ProspectProspectcustomers
Small
Medium
Customers
DYNAMIC ANALISYS OF THE PORTAFOGLIO : THE MIGRATION
Other
ect
New
Prospect Prosp
customers
Medium
Large
Customers
PERIOD To PERIOD T+1
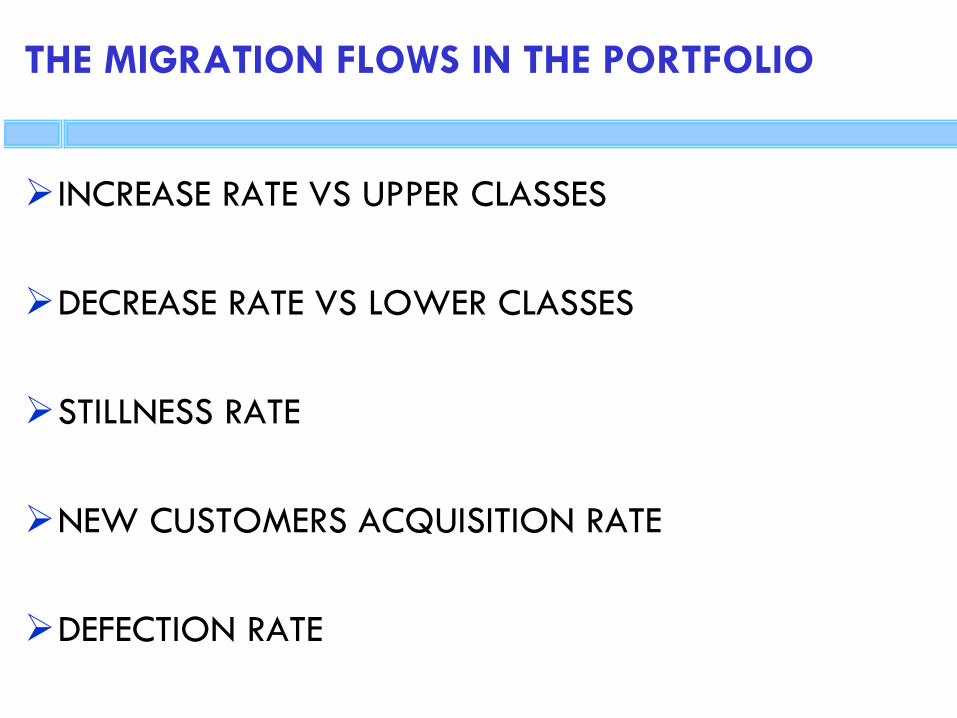
THE MIGRATION FLOWS IN THE PORTFOLIO
INCREASE RATE VS UPPER CLASSES
DECREASE RATE VS LOWER CLASSES
STILLNESS RATE
NEW CUSTOMERS ACQUISITION RATE
DEFECTION RATE

INDEXS FOR CP ANALYSIS
Customer at beginning
Customer end period- NewCustomer
1 - CRR
1
Customer Retention Rate (CRR) =
Es. Customer at beginning=100; Customer end period=120; New customer acquired in the period =40CRR = (120-400)/100 = 80%
Defection rate = 1
CRREs. CRR =80%Defection rate = (1-
0,80) = 20%
Es. CRR =80%CLT= 1/(1-
0,80) = 5 years
Customer Life Time =
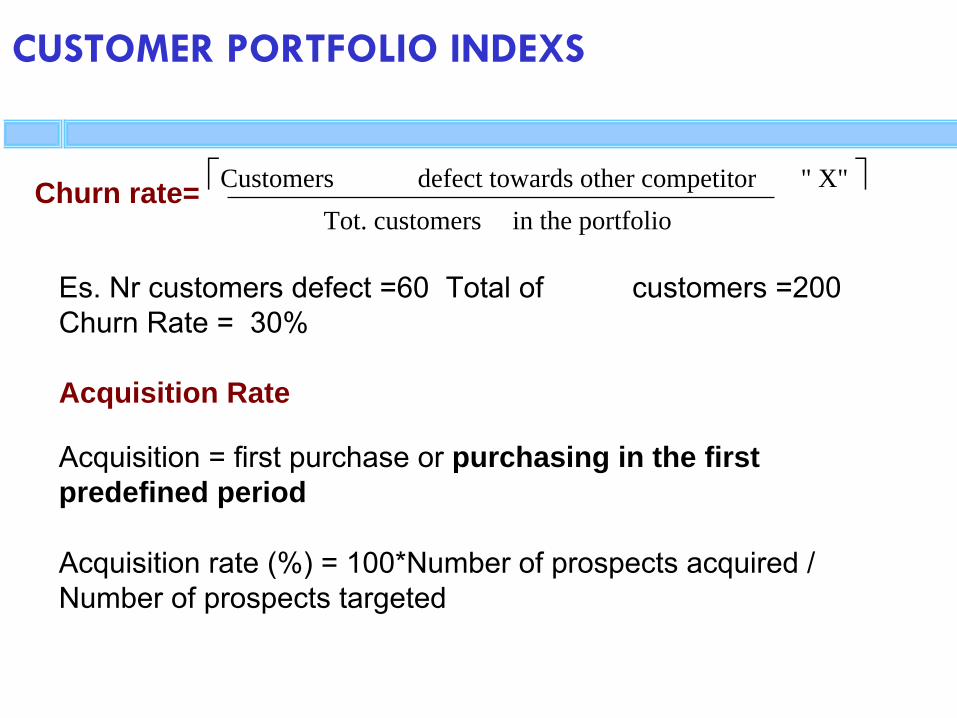
CUSTOMER PORTFOLIO INDEXS
Tot. customers in the portfolioChurn rate= Customers defect towards other competitor " X"
Es. Nr customers defect =60 Total of customers =200
Churn Rate =
30%
Acquisition Rate
Acquisition = first purchase or purchasing in the first predefined period
Acquisition rate (%) = 100*Number of prospects acquired / Number of prospects targeted

P(Active)
P(Active)
Probability of a customer being active in time t
P(Active) = P(Active) = (T/N)n
Where: n = the number of purchases in a given period,
T= is the time of the last purchase
N= Observation period

P(Active) of the two customers in the 12th month of activity: Customer 1: T = (8/12) = 0.6667 e nr purchases = 4P(Active)1= (0.6667)4 = 0.197And for Customer 2: T = (8/12) = 0.6667 e nr purchases= 2P(Active)2= (0.6667)2 = 0.444
Customer 1
Customer 2
Observed period End of period
Month 12Month 8 Month 18Month 1
X = purchase

CUSTOMER LIFE TIME VALUE
(WHITE PAPER)
Customer Life Time Value:
AGM: Average gross margin in period t
P active: Probability of a customer being active in time t
i: I customer
t: time when CLTV is calculated
T: number of periodsd: discount rate
T
t1
t(1 d)
P active AGM it
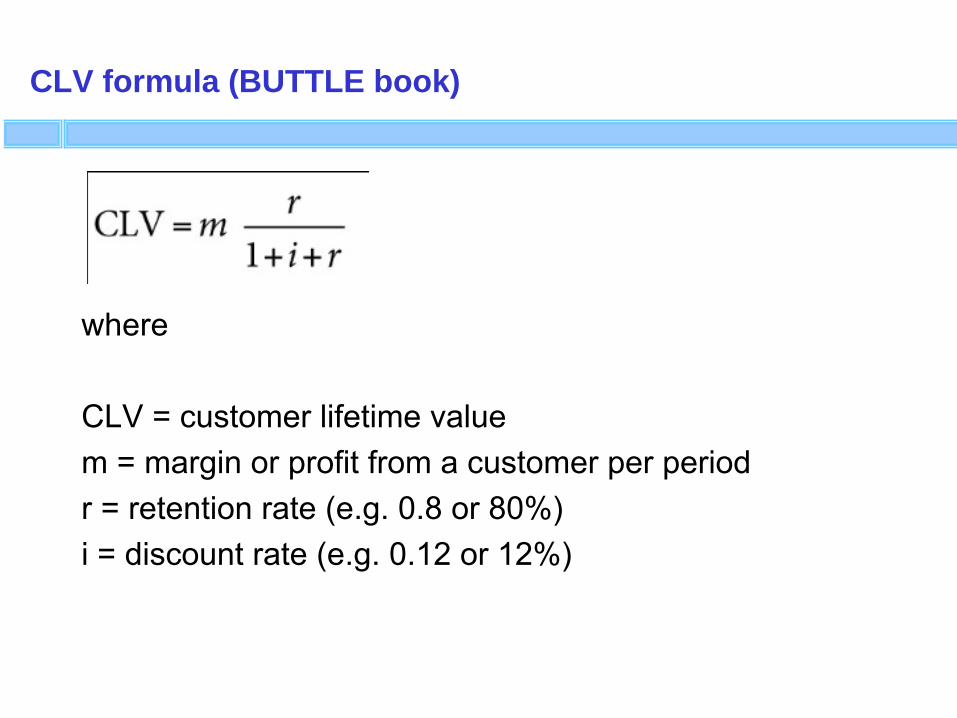
CLV formula (BUTTLE book)
where
CLV = customer lifetime valuem = margin or profit from a customer per periodr = retention rate (e.g. 0.8 or 80%)i = discount rate (e.g. 0.12 or 12%)

ABC in a claims processing department

How ABC helps CPM
When combined with revenue figures, it tells you the absolute and relative levels of profit generated by each customer, segment or cohort
It guides you towards actions that can be taken to return customers to profit
It helps prioritize and direct customer acquisition, retention and development strategies
It helps establish whether customization, and other forms of value creation for customers, pays off

CLV formula
where
CLV = customer lifetime valuem = margin or profit from a customer per periodr = retention rate (e.g. 0.8 or 80%)i = discount rate (e.g. 0.12 or 12%)

Neural networks
Neural networks, also known as machine-based learning,
are another way of fitting a model to existing
data for prediction purposes. Neural networks can produce excellent predictions
from large and complex datasets containing hundreds of interactive predictor variables, but the neural networks are neither easy to understand nor straightforward to use.
Neural networks are represented by complex mathematical equations, with many summations, exponential functions and parameters.

Strategically significant customers 1
High future lifetime value customers●
These customers will contribute significantly to the company’s profitability in the future.
High volume customers●
These customers might not generate much profit, but they are strategically significant because of their absorption of fixed costs, and the economies of scale they generate to keep unit costs low.

Strategically significant customers 2
Benchmark customers●
These are customers that other customers follow. For example, Nippon Conlux supplies the hardware and software for Coca-Cola’s vending operation. Whilst they might not make much margin from that relationship, it has allowed them to gain access to many other markets. ‘If we are good enough for Coke, we are good enough for you’, is the implied promise. Some IT companies create ‘reference sites’
at some of their more demanding customers.

Strategically significant customers 3
Inspirations●
These are customers who bring about improvement in the supplier’s business. They may identify new applications for a product, product improvements or opportunities for cost reductions. They may complain loudly and make unreasonable demands but, in doing so, force change for the better.
Door openers●
These are customers that allow the supplier to gain access to a new market. This may be done for no initial profit, but with a view to proving credentials for further expansion. This may be particularly important if crossing cultural boundaries, say between west and east.

SSC’s at a Scandinavian timber processor
Economic return
Future business potential
Learning value
Reference value
Strategic value by
providing access to new markets
strengthening incumbent positions
building barriers to new entrants
This company considers five attributes in identifying their strategically significant customers:

Seven core customer management strategies
1.
Protect the relationship2.
Re-engineer the relationship
3.
Grow the relationship4.
Harvest the relationship
5.
End the relationship6.
Win-back the customer
7.
Start a relationship


![CRIMINOLOGIA [ CRI ] - lumsa.it · CRIMINOLOGIA [ CRI ] Offerta didattica a.a. 2013/2014 Docenti:ANGELO MANGIONE Periodo: Secondo Ciclo Semestrale Obiettivi formativi Acquisizione](https://img.pdfslide.us/doc/110x75/5c18156309d3f205588c6598/criminologia-cri-lumsait-criminologia-cri-offerta-didattica-aa.jpg)