Embed Size (px)
Citation preview

CUSTOMER PERCEPTIONS OF BANKING PRODUCTS ANDSERVICES IN KERALA WITH REFERENCE TO SPECIFIC
CUSTOMER SEGMENTS IN THE URBAN AREA
Thesis submitted to the
COCHIN UNIVERSITY OF SCIENCE AND TECHNOLOGY
for the award of the degree of
DOCTOR OF PHILOSOPHY
under the Faculty o_/‘Social Sciences
byJAZEELA M
under the .s'upcrvi.s'i(m ofDr. K C SANKARANARAYANAN
SCHOOL OF MANAGEMENT STUDIESCOCHIN UNIVERSITY OF SCIENCE AND TECHNOLOGY
Kochi - 680 022. Kcrala
January 2001

DECLARATION
I declare that this thesis entitled ‘Customer perceptions of Banking
Products and Services in Kerala with reference to Specific Customer
Segments in the Urban Area‘ is an original research work done by me
under the supervision of Dr. K.C.Sankaranarayanan, Dean, Faculty of
Social Sciences, Cochin University of Science and Technology,Kochi. I further declare that this has not previously formed the basis
for the award of any Degree, Diploma, Associateship, Fellowship or
4%Kochi 682 022 JAZEELA. MJanuary 22,2001
other similar title or recognition.
Dr. K.C.SankaranarayananDean
Faculty of Social SciencesCochin University of Science & TechnologyKochi-682 022
CERTIFICATE
This is to certify that the thesis entitled “Customer Perceptions of BankingProducts and Services in Kerala with reference to Specific Customer Segmentsin the Urban Area” is a bonafide record of the research work canied out byJazeela M under my Supervision and guidance and that no part thereof hasbeen presenteu for any other degree.
Uw 4»lfiggw- L/
Dr. K.C. SANKARANARAYANAN(Supervising Guide)
Kochi-682 022January 9, 2001.

CERTIFICATE
This is to certify that the thesis entitled “Customer Perceptions of BankingProducts and Services in Kerala with reference to Specific Customer Segmentsin the Urban Area” is a bonafide record of the research work canied out byJazeela M under the guidance of the doctoral committee comprising of thefollowing members and that no part thereof has been presented for any otherdegree.
Dr. F NCIS C A/TLQ rm) —~—-Lt I Do? é~<.aV;)sYY‘/‘V—’.C-6"'Q
lflto » L.Dr. K C SANKARANARAYANAN
KOCHI-682 022Januaiy 9, 2001.

ACKNOWLEDGEMENT
I have immense pleasure to record my deep felt gratitude to my supervisor,Dr. K.C.Sankaran-arayanan , Dean . Faculty of Social Sciences, Cochin University ofScience and Technology, for his valuable guidance and incessant support throughoutthe course of the study. I am indebted to him beyond words for the troubles he hastaken to guide me through the academic and procedural requirements.
I am thankful to Dr. K.CIeorge Varghese, Director, School of Management Studiesfor his support in complying with many academic requirements for the completionof this work. My sincere thanks are due to Prof. K. Kalyanaraman for his valuablehelp and guidance for the analysis ofdata.
I acknowledge my deep felt indebtedness to Mr. Dileep Krishnaswamy. ManagementConsultant for guiding me in my efforts to use certain advanced analyticaltechniques.
While much of my acknowledgements relate to the successful completion of thisthesis work , my thanks are due in no less a measure to all those senior academiciansin the Doctoral Committee for providing me with an opportunity to do this researchwork in Cochin University of Science and Technology.
I owe very special thanks to Ms. Neena Joseph, Faculty, Institute of Management inGovernment for her unstinted help without which it would not have been possible totide over many difficult situations during my research work. I admire the selfless wayin which she spent time and effort to encourage and support me.
I cannot but thank each and every bank official who has cooperated with me atdifferent stages of my data collection. I am also thankful to Mr. Krishna Kumar for hisexcellent support in data entry. My thanks are also due to Mr. K. K. Krishnakumar,Mr. Kabeer and Mr. Ajaya Kumar for their wholehearted cooperation in wordprocessing
I sincerely thank the administrative and library staff of School of ManagementStudies, Department of Applied Economics and University office for their support.
The successful completion of this report was possible due to the support andmotivation provided by my husband, Dr. A.M. Sherif and the remarkable patienceshown by my children, Nazneen and Salman. I remember with much admiration thepatience and cooperation received from all my other family members. I attribute thesuccessful completion of this work to the blessings of the Almighty.
22 January 2001 ]azeela. M
CONTENTS
Abb reviarions
Lisr 0fTnbIcs
List of Figures
Chapter I INTRODUCTIIION
Chapter 2 MARKETING OF BANKING PRODUCTSAND SERVICES THEORETICALCONSIDERATIONS
Chapter 3 BANKING IN KERALA- AN OVERVIEW
Chapter 4 CUSTOMER PERCEPT IONS OF BANKINGPRODUCTS AND SERVICES - ANALYSISOF DATA
Chapter 5 CONCLUSIONS AND RECOMMENDATIONS
Appendices
Bibliography
vi
\.1'i
xviii
36
167
207
364
393
418
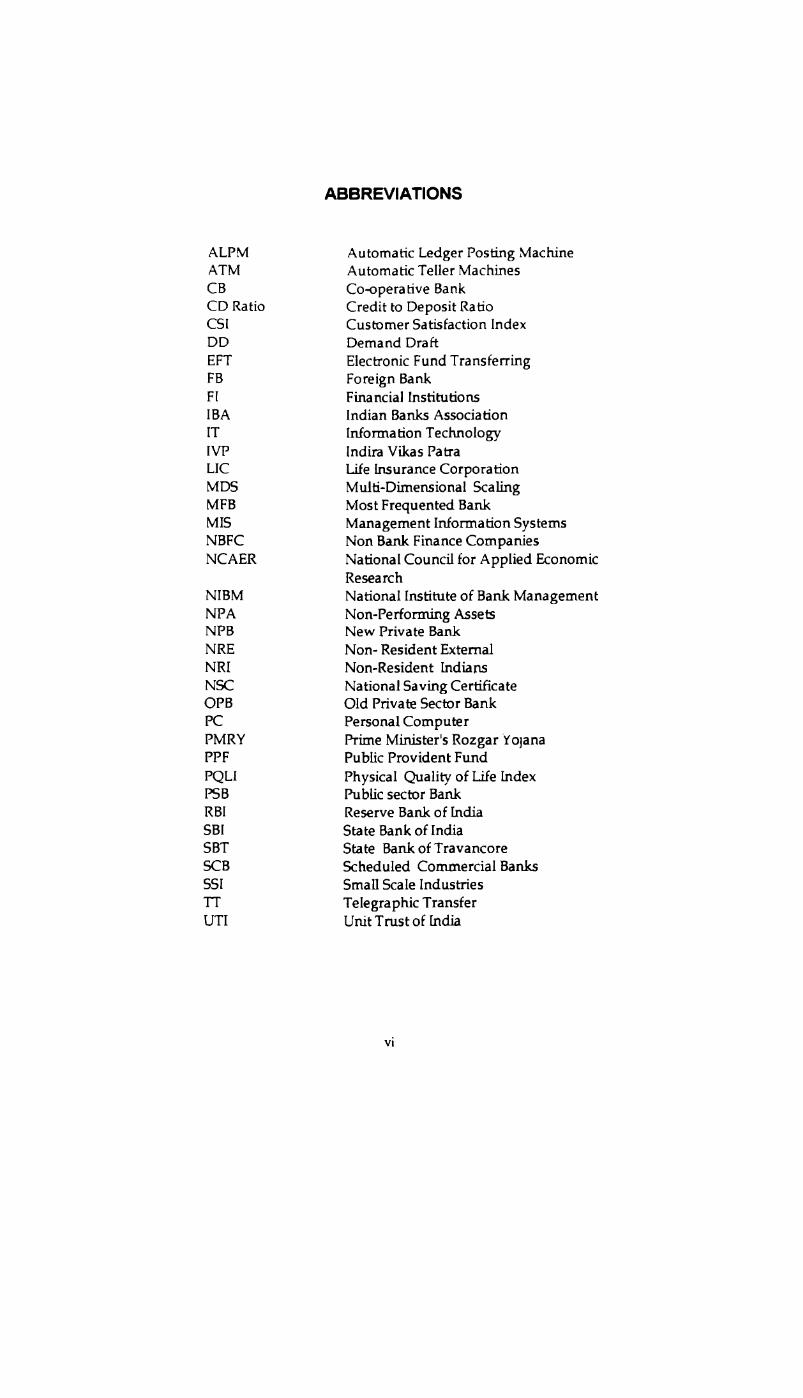
ABBREVIATIONS
ALPM Automatic Ledger Posting MachineATM Automatic Teller MachinesCB Co-opera tive BankCD Ratio Credit to Deposit RatioCSI Customer Satisfaction IndexDD Demand Dra FtEFT Electronic Fund TransferringFB Foreign BankFl Financial InstitutionsIBA Indian Banks AssociationIT Information Technology[VP Indira Vikas PatraLIC Life Insurance CorporationMDS Multi-Dimensional ScalingMFB Most Frequented BankMIS Management Information SystemsNBFC Non Bank Finance CompaniesNCAER National Council for Applied Economic
ResearchNIBM National Institute of Bank ManagementNPA Non-Performing AssetsNPB New Private BankN RE Non- Resident ExternalNRI Non-Resident IndiansNSC National Saving CertificateOPB Old Private Sector BankPC Personal ComputerPMRY Prime Minister's Rozgar YoyanaPPF Public Provident FundPQLI Physical Quality of Life IndexPSB Public sector BankRBI Reserve Bank of IndiaSBI State Bank of IndiaSBT State Bank of TravancoreSCB Scheduled Commercial BanksSSI Small Scale IndustriesTT Telegraphic TransferUTI Unit Trust of India
vi

LIST OF TABLESSI. Table Title PageNo. No. No.1 1.1 Distribution of Commercial Bank Branches by 3
Bank Groups and by Population-Groups in India
2 2.1 Bank Attributes Frequently Used in Positioning 87
3 2.2 Time Taken to Deposit Cash and Obtain Receipts 91
4 2.3 Time Taken for Collection of Local Cheques 92
5 2.4 Time Taken for Collection of Outstation Cheques 92
6 2.5 Time Taken to Obtain a New or Renewed Fixed Deposit 92Receipt
7 2.6 Time Taken for Encashment of Fixed Deposit Receipts 93
8 2.7 Time Taken to Purchase a Bank Draft 93
9 2.8 Time Taken to Receive Remittance Through Telegraphic 93Transfer
10 2.9 Attitude and Efficiency of the Stafl‘ 9411 2.10 Customer Satisfaction in Public Sector Banks - 96
Survey-1997
12 2.11 Savings of Households in Financial Assets- 115Percentage Distribution of Total
2.12 Aggregate Deposits of Non-Banking Companies 122
14 2.13 Resources Mobilised by Mutual Funds during 1993-94 127to 1998-99 (April-March)
15 2.14 Financial Performance of Scheduled Commercial Banks 130based on Bank Groups for the Years 1996-97and 1998-99

SI. Table Title Page16 2.15 Net Profit (Loss) as a Percentage of Total Asset 133
from 1991-92 To 1998-99 for Various Bank Groups
17 2.16 Net Non-Perfonning Assets as a percentage of 134Total Assets from 1991-92 to l998-99- by Bank Groups
18 2.17 Distribution of Deposits of Scheduled Commercial Banks 135according to Type - March 1997
19 2.18 Distribution of Deposits and Credit of Scheduled 136Commercial Banks-by Population Groups - March1997
20 2.19 Distribution of Deposits and Credit according to Bank 137Group and Population Groups- March1997
21 2.20 Maturity Pattern of Deposits of Scheduled Commercial 138Bank according to Bank Group- March 1997
22 3.1 Distribution of I-lotseholds by Household Income 173
23 3.2 Change in Age Distribution 17424 3.3 Occupation of Employed Persons in Urban Areas 175
as on 1990-91
25 3.4 Distribution of Households with Bank 176Account / Debt- 1990-91
26 3.5 Disribufion of Deposits and Credits in Rural, 177Semi- Urban and Urban Areas of KeralaMarch 1997.
27 3.6 Possession of Consumer Durables in Urban area 178
28 3.7 Per Capita Consumer Expenditure in Southern 180States

SI. Table Tifle PageNo. No. No.29 3.8 Distribution of Bank Branches of Selected Banks 184 - 185
according to Population Group March-1992
30 3.9 Distribution of Bank Branches of Major Banks by 188Districts — March 1992
31 3.10 Deposits and Advances of Selected Banks in Kerala 190 - 191— March 2000
32 3.1 1 Distribution of Deposits according to Type of Accounts 193and Population Groups- March 1997
33 3.12 Distribution of Difl°erent types of Deposits according to 195Bank Groups-March 1997
34 3.13 Distribution of Deposits and Credit in the Districts 197
35 3.14 Distribution of Advance, Credit and Small Borrowing 198according to Bank Group
36 3.15 Maturity Pattern of Term Deposits of Scheduled 201Commercial Banks
37 4.1 Distribution of Samples for Household Segment 212based on the Population in the Three Districts
38 4.2 Distribution of Samples for Traders and Small Scale 212Industries based on the Three Districts
39 4.3 Distribution of Respondents Dealing with Different 216Bank Groups in the Household Segment
40 4.4 Number and Percentage of Respondents Dealing with 217more than One Bank
ix

SI. Table Title PageNo. No. No.41 4.5 Major Bank Group Respondents Dealing with Other 218
Banks
42 4.6 Most Frequented Banks of Respondents based on 219Frequency of Use
43 4.7 Respondents‘ MFBs- Distribution based on Different 222Bank Groups
44 4.8 Reasons for Selecting MFBS and Other Banks 223 - 224
45 4.9 Number of Respondents indicating ’Better Service‘ 226as the Reason for Choice of MFB
46 4.10 Number of Respondents indicating ‘Safety’ 227as the Reason for Choice of MP B
47 4.11 Number of Respondents indicating 'Neamess' as 227the Reason for Choice of MFB
48 4.12 Analysis of Weightages Assigned by Respondents to 229difierent Reasons for Choice of MFBs and Other Banks
49 4.13 Weightages Assigned to Reasons for Choice of MFB and 233Other Banks- Wilcoxon's Test Statistics
50 4.14 Ratings for Customer Satisfaction in Different Bank 236Groups
51 4.15 Results of Chi - Tests based on Table 4.14 237
52 4.16 Updating of Pass Books-Ratings for Customer 239Satisfaction among Different Bank Groups53 2394.17 Results ofChi - Tests based on Table 4.16

SI. Table Tifle PageNo. No. No.54 4.18 Proper Entries of Transactions- Rating for Customer 239
Satisfaction among Different Bank Groups
55 4.19 Results of Chi - Tests based on Table 4.18 240
56 4.20 Cheque Encashment- Rating for Customer Satisfaction 240among Different Bank Groups
57 4.21 Results of Chi - Tests based on Table 4.20 240
58 4.22 Collection of Outstation Cheques- Rating for Customer 241Satisfaction among Different Bank Groups
59 4.23 Results of Chi - Tests based on Table 4.22 241
60 4.24 Issue of Drafls- Ratings for Customer Satisfaction among 241Different Bank Groups
61 4.25 Results of Chi — Tests based on Table 4.24 242
62 4.26 Cash Transfer by Telegraphic or Electronic Services- 244Rating for Customer Satisfaction in Different Bank Groups
63 4.27 Results of Chi - Tests based on Table 4.26 244
64 4.28 Payment through Saving Account- Rating for Customer 246Satisfaction among Difierent Bank Groups
65 4.29 Credit Card Operations- Rating for Customer 246Satisfaction among Different Bank Groups
66 4.30 Safe deposit/Locker services- Rating for Customer 247Satisfaction among Different Bank Groups
67 4.31 Credit/Overdraft Facilities- Rating for Customer 247Satisfaction among Different Bank Groups
xi

SI. Table Title PageNo. No. No.68 4.32 Financial Guidance and Assurance- Ratings for Customer 249
Satisfaction among Different Bank Groups
69 4.33 Results of Chi Square Tests based on Table 4.32 249
70 4.34 Friendliness of Staff and Counter Service- 249Rating for Customer Satisfaction among DifferentBank Groups
71 4.35 Friendliness of Staff and Counter Service- 250Rating for Customer Satisfaction among DifferentBank Groups
72 4.36 Complaint-free Pprocessing- Rating for 250Customer Satisfaction among Different Bank Groups
73 4.37 Results of Chi - Tests based on Table 4.36 250
74 4.38 Speedy Processing - Rating for Customer 251Satisfaction among Different Bank Groups
75 4.39 Results of Chi - Tests based on Table 4.38 25I
76 4.40 Reliability of Accounting - Rating for 251Customer Satisfaction among Different Bank Groups
77 4.41 Results of Chi - Tests based on Table 4.40 252
78 4.42 Descriptive Statistics of Rating for the Dimensions 253of Service Quality among Household Segment
79 4.43 Correlations between Overall Satisfaction and 255Dimensions of Service Quality
80 4.44 Correlations Between Overall Satisfaction and 255Difierent Services
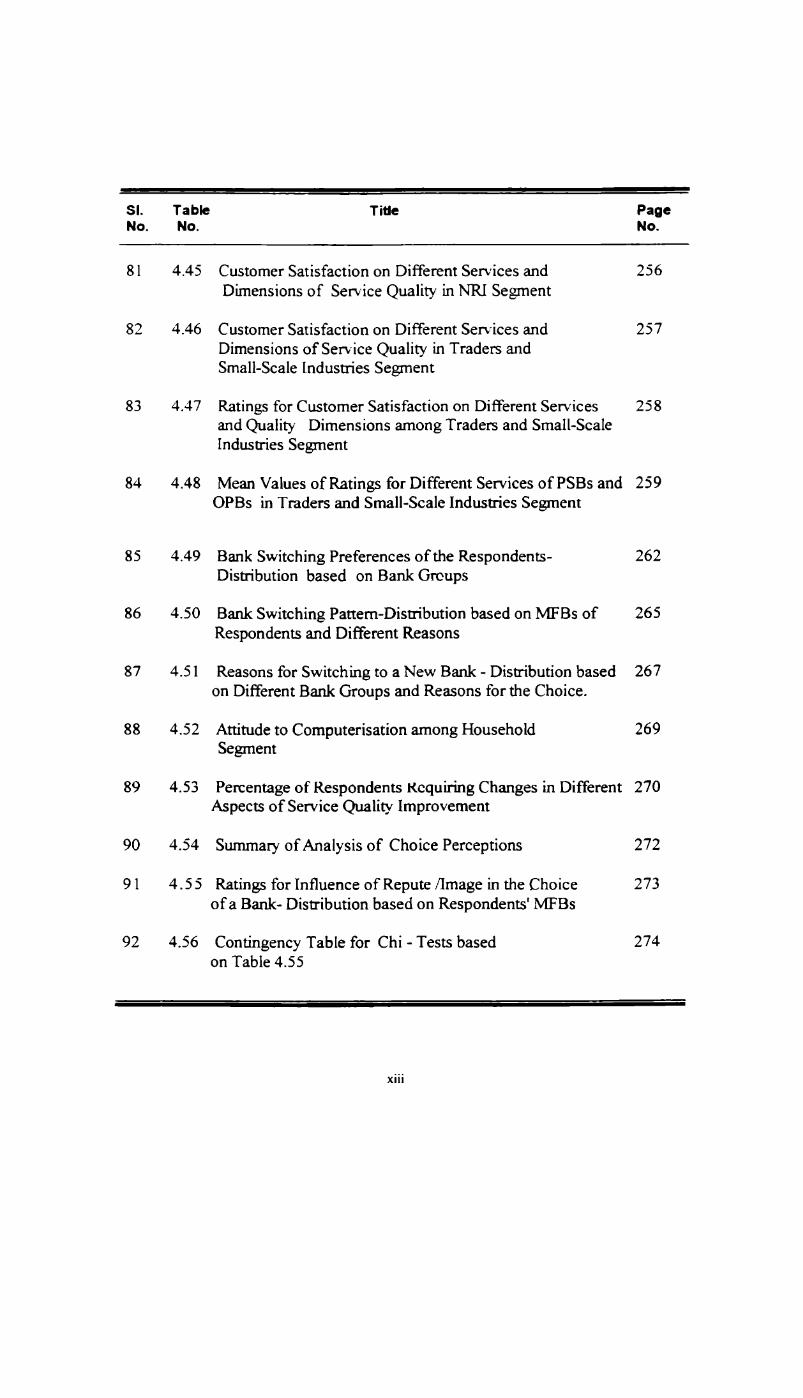
SI. Table Title PageNo. No. No.81 4.45 Customer Satisfaction on Different Services and 256
Dimensions of Service Quality in NRI Segment
82 4.46 Customer Satisfaction on Different Services and 257Dimensions of Service Quality in Traders andSmall-Scale Industries Segment
83 4.47 Ratings for Customer Satisfaction on Different Services 258and Quality Dimensions among Traders and Small-ScaleIndustries Segment
84 4.48 Mean Values of Ratings for Different Services of PSBs and 259OPBs in Traders and Small-Scale Indusuies Segment
85 4.49 Bank Switching Preferences of the Respondents- 262Distribution based on Bank Groups
86 4.50 Bank Switching Pattem-Distribution based on IVEBS of 265Respondents and Different Reasons
87 4.51 Reasons for Switching to a New Bank - Distribution based 267on Difierent Bank Groups and Reasons for the Choice.
88 4.52 Attitude to Computerisation among Household 269Segment
89 4.53 Percentage of Respondents Requiring Changes in Different 270Aspects of Service Quality Improvement
90 4.54 Summary of Analysis of Choice Perceptions 272
91 4.55 Ratings for Influence of Repute /Image in the Choice 273of a Bank- Distribution based on Respondents‘ MFBS
92 4.56 Contingency Table for Chi - Tests based 274on Table 4.55
xiii
94
95
96
97
98
99
100
101
102
103
104
106
4.57
4.58
4.59
4.60
4.61
4.62
4.63
4.64
4.65
4.66
4.67
4.68
4.69
4.70
Results of Chi Square Tests based on Table 4.56
Rating for influence of Retums Offered in the Choiceof a Bank- Distribution based on Respondents‘ l\/fl=Bs
Contingency Table for Chi -Test based onTable 4.58
Contingency Table for Chi -Test based on Table 4.59
Rating for Influence of 'Will-Choose-On1y-PublicSector-Banks' Attitude - Distribution based onRespondents’ MFBS
Contingency Table for Chi Test based on Table 4.61
Results of Chi-Tests based on Tab1e4.62
Rating for Influence of 'Neamess' Aspect in theChoice of Bank-Distribution based on Respondents’ MFBS
Contingency Table for Chi Test based on Table 4.64
Results of Chi - Tests based on Table 4.65
Rating for Influence of ’Will-ChooseOnly-a-Private- Bank’ Attitude- Distributionbased on Respondents’ MFBs
Contingency Table for Chi -Tests based on Table 4.67
Results of Chi — Tests based on Table 4.68
Rating for Influence of ‘Presence of ElectronicFacilities' in the Choice of Bank- Distribution based onMFBS of Respondents’
xiv
276
277
278
278
279
280
280
281
282
282

SI. Table Title PageNo. No. No.107 4.71 Contingency Table for Chi - Test based on Table 4.70 284
108 4.72 Results ofChi - Tests based on Table 4.71 284
109 4.73 Ratings for Influence of 'Multi-Bank 285Preferences’ - Distribution based on Respondents‘MFBs
1 10 4.74 Contingency table for Chi -Tests based on Table 2854.73
1 1 1 4.75 Results of Chi - Tests based on Table 4.74 286
112 4.76 Perceptions about Influence of ‘Service’ on Choice 286of Bank - Distribution based on MFBS of Respondents
1 13 4.77 Contingency Table for Chi - Tests based on 287Table 4.76
114 4.78 Descriptive Statistics of Ratings for Different Factors 289Influencing Choice of Banks based on Respondents’MFB.
115 4.79 Age and Factors Influencing Choice of Banks 290 - 291
116 4.80 Descriptive Statistics for Various Factors Influencing 292 - 294Choice of Banks among Different Age Groups
1 17 4.81 ANOVA- Factors Influencing Choice of Bank 295 - 296among Men and Women
118 4.82 Descriptive Statistics for Various Factors Influencing 297
Choice of Bank among Men and Women
1 19 4.83 ANOVA- Factors Influencing Choice of Banks and 299 - 300Education of Respondents

121
122
123
124
125
126
127
128
129
4.86
4. 87
4.88
4.89
4.90
4.91
4.92
4.93
4.94
4.95
4.96
Descriptive Statistics for Various Factors Influencing 301 - 303Choice of bank among Different Education Groups
ANOVA-Factors Influencing Choice of Bank and 305 - 306Profession of Respondents
Descriptive Statistics for Various Factors Influencing 307 - 309Choice of Bank among Different Occupational Groups
ANOVA- Factors Influencing Choice of Bank among 31 1Different Income Groups
Descriptive Statistics of Various Factors Influencing 312 - 313Choice of Bank among Different Income Groups
Configuration Derived in 2 Dimensions- Stimulus 316Co-ordinates obtained fi'om MDS
Distribution of MFBs based on Age of Respondents 319 - 320
Distribution of MFBs among Men and Women 320
Distribution of MFBs among Different Educational 322Groups
Distribution of MFBs among Different Occupational 323Groups
Distribution of MFBs among Different Income Groups 325
Distribution of MFBs among Respondents with 326Employed and unemployed Spouses
Distribution of MFBs among Diflerent Community 327Groups
SI. Table Tifle PageNo. No. No.133 4.97 Distribution of Different Invest:ment Schemes among 330
Bank Groups
134 4.98 Choice of Long-Term Investments 332135 4.99 Pattern of Preference for Investments in Banks 333
for Different Periods
136 4.100 Preference of Respondents for Need-based Investments 334
137 4.101 Respondents‘ Investment in Non- Bank Schemes 336
138 4.102 Pattern of Investment Mix of Respondents 339
139 4.103 Availing of Loans from Non-Scheduled Commercial 341Banks
140 4.104 Availing of Loans fi'om Banks and Reasons- Distribution 342of Respondents by Bank Groups
141 4.105 Loan Sources Utilised by Respondents-Distribution 344based on their MFBs
142 4.106 Comparison Between PSBS and Private Sector Banks 346based on the Key Attributes for Sourcing Loans
143 4.107 Rankings Obtained for Different Loan Sources 347
144 4.108 Availing of Loans from Banks for Various Purposes- 349A closer look
145 4.109 Rotated Component Matrix 352146 4.110 Banks & Attributes Composite Perception Mapping 353
147 4.111 Configuration Derived in 2 Dimensions- Stimulus 354Coordinates
xvii

LIST OF FIGURES
SI. Figure Title PageNo. No. No.1 2.1 The Process of Strategy Development 53
2 2.2 Segmenting Dimensions in Banking 74
3 2.3 Market Segments in the Households Banking 78Sector
4 2.4 Positioning ofBanks-an Illustration 845 2.5 Perceptual Map of Banking Products 96
6 2.6 Service Quality Information System 997 2.7 Demand for ATMs 1 178 2.8 Organisational Structure of Co-operative Credit 124
System (as at the end of March 1998)
9 2.9 Organisational Structure of Financial Institutions 126
10 2.10 Structure and Asset Classification of 129Scheduled Commercial Banks
1 1 2.1 1 Net Profit Share of Bank Groups 131
12 3.1 Maturity Pattern of Term Deposits in Kerala and 202India
13 4.1 Percentage of Major Bank group Respodents 218Dealing with Other Bank groups
14 4.2 Percentage of Respondents with Difierent Banks as 219their First, Second and Third Bank Choices
15 4.3 Number of Respondents Dealing with Different 222Bank group Vs Number Using it as Their MFB
xviii

SI. Figure Title PageNo. No. No.16 4.4 Percentage of Respondents with Different Reasons 224
for choosing MFB and Other Banks
17 4.5 Percentage of Respondents Indicating 'Service'. ‘Safety’ 228and 'Nearness' as the Reasons in each Bank Group
18 4.6 Customer Satisfaction in Different Bank Groups 236
19 4.7 Mean of Service Quality Dimensions of Bank Groups 254
20 4.8 Customer Satisfaction in Various Services of 260PSBs and OPBS-Comparison of Mean Ratings
21 4.9 Percentage to Total of Respondents who Want to 263Switch to Different Bank Groups
22 4.10 Percentage to Total of Respondents who 266Want to Switch fi'om each Bank Group for 'Retums',‘Safety’, ‘Service’ and ‘Neamess’
23 4.1 1 Percentage to Total of Respondents who Want to Switch 268to each Bank Group on account of 'Retums',‘Safety’, 'Service', ' Better Image’ and 'Nearness'
24 4.12 Percentage of Respondents Requiring Improvement in 270Key Service Quality Aspects
25 4.13 Percentage of Respondents in each Bank Group 273Rating 'Repute of Bank‘ as a Reason for Choice
26 4.14 Percentage of Respondents in Each Bank Group Rating 275'Retums' as a Reason for choice of Bank
xix

SI. Figure Title PageNo. No. No.27 4.15 Percentage of Respondents in Each Bank Group Rating 278
the aspect ‘Will-choose—only—a-Public-Sector-bank‘as a Reason for Choice
28 4.16 Percentage of Respondents Rating 'Neamess' as a 281Reason for Choice of Bank
29 4.17 Percentage of Respondents in Each Bank Group Rating 283‘Presence of Electronic Facilities’ as a Reason for Choiceof Bank
30 4.18 Percentage of Respondents in Each Bank Group 285Rating Preference for Dealing With Multiple Banks
31 4.19 Percenatge of Respondents in Each Bank Group Rating 287
Services as a Reason for Choice of a Bank
32 4.20 Mean Ratings for Various Factors of Bank Choice 294among Different Age Groups
33 4.21 Ratings for Various Factors of Bank Choice among 298Men and Women
34 4.22 Mean Ratings for the Various Factors of Bank 304Choice among Diflerent Educational Groups
35 4.23 Mean Ratings for Vajous factors of Choice of Bank 304based on Educational groups
36 4.24 Mean Ratings for Factors of Choice among Different 309Occupational Groups
37 4.25 Mean Ratings for Various Factors among Different 313income Groups
SI. Figure Title PageNo. No. No.38 4.26 Derived Stimulus Configuration - Euclidean Distance 318
Model
39 4.27 Distribution of lvfl7Bs of Respondents based on Age 321Groups
40 4.28 Distribution of MFBs based on Educational Level of 322Respondents
41 4.29 Distribution of MFBs based on Diflerent Occupational 323SWUP5
42 4.30 Distribution of Respondents in Different Income Groups 326
43 4.31 Percentage of Respondents who have Sourced Loans from 345PSBs, OPBS and CBS -Comparison with their MFBs
44 4.32 Derived Stimulus Configuration-Banks & Attributes 355Euclidean distance model

CHAPTER 1
INTRODUCTION
1.1 Background of the Study
Commercial banks form an important component of the financialsystem of a country The multiple and varied responsibilities ofbeing an instrument for initiating and enhancing economicdevelopment of various segments of a society and of generatingprofits for survival have made the banking activities much complex.
For the very same reason, banks are operating in an overall policyframework set by regulatory agencies, which control the finaucsalsystem as a whole.
The financial market, of which the banks constitute a major part.operates much differently from the commodity market. In India,since the nationalisation of banks in 1969. the Reserve Bank of
India (RBI) and the government had all along been providing aprotected environment to banks in conducting thci" business. The
inflow of deposits from people was, in fact, possible with hardlyany marketing effort from the side of banks. Deposits weremobilised largely through branch level initiatives to achieve certain
yearly targets. The banks’ resource deployment, on the other hand,
was more or less controlled by the government and RBIregulations. The protectionist policies of the government alsoprevented the emergence of competition in the industry. Even when
commodities markets devised strategies to fight competition, banks

functioned as if they were in a seller's market with consumershaving little choice. Today. in Indian banking. 87.18% of theplayers in the urban and metropolitan areas are Public Sector Banks
(PSB) and they have a total operational base of 44,976 branches(Table 1.1). The process of economic reforms and deregulation,however, has brought about dynamic changes in the philosophy ofbanking activities. Bankers now have greater flexibility in operation
and are allowed to have a market-oriented approach. Competition is
slowly setting in and the market is gradually turning into a buyer's
market. Now, banks have to respond to the growing competition in amercurial external environment.
Over the period of 1991-97, the market share of PSBs has comedown. There have also been changes in the ownership pattern ofbanks, making the managements more responsible for viableoperations. Many of the reforms during the past one decade havepaved the way for new players in the industry, viz., New PrivateBanks (NPB), Non Bank Financial Companies (NBFC) and Foreign
Banks (FB).1 The new players gained their advantages mostly bymaintaining lean structures, limited number of branches, nichemarkets, product specialisation and modern technology supportedservices. Obvious differences in working styles of private sectorbanks as compared to PSBs are noticeable in the areas of assetliability management, product development, organisationalstructure, target marketing, and customer relations. Theseobservations converge to imply the need for marketing bankingproducts and services, hitherto a less important area in the bankingindustry.
IQ
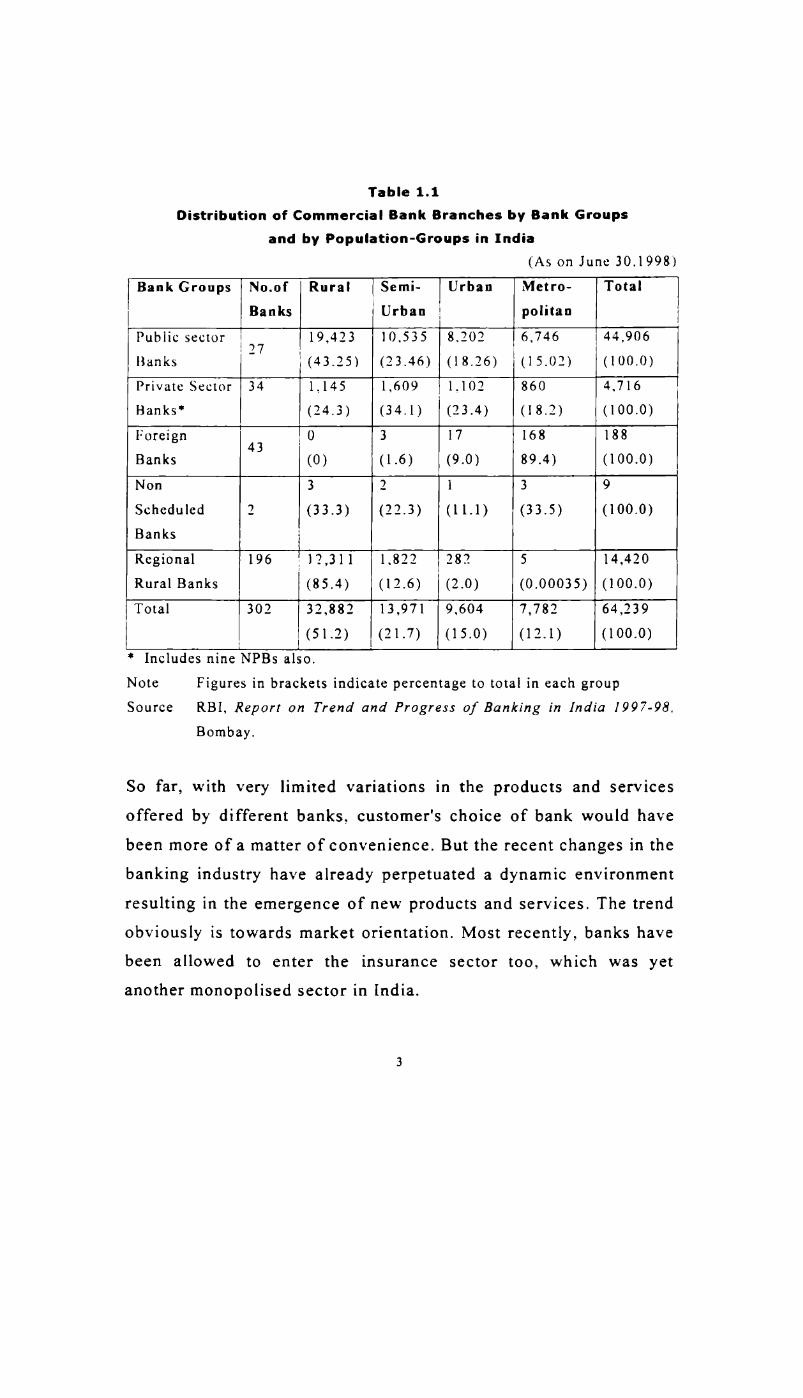
Table 1.1Distribution of Commercial Bank Branches by Bank Groups
and by Population-Groups in India(As on June 30.1993")
BankGroups No.01" Rural Semi- Urban Metro- TotalBanks Urban politan
Public sector 27 I 19,423 10,535 8.202 6,746 44,906Banks ‘ (43.25) (23.46) (18.26) (15.02) (100.0)Private Sector 34 1,145 1,609 1.102 860 4.716Banks‘ (24.3) (34.1) (23.4) (18.2) (100.0)Foreign 43 0 3 17 168 188Banks (0) (1.6) (9.0) 39.4) (100.0)Non 3 2 1 3 9Scheduled 2 (33.3) (22.3) (11.1) (33.5) (100.0)Banks
Regional 196 3 12,311 1.322 282 5 14,420Rural Banks 1 (85.4) (12.6) (2.0) (0.00035) (100.0)Total 302 32,882 13,971 9,604 7,782 64,239
(51.2) (21.7) (15.0) (12.1) (100.0)* Includes nine NPBs also.
Note Figures in brackets indicate percentage to total in each groupSource RBI, Report on Trend and Progress of Banking in India 1997-98.
Bombay.
So far, with very limited variations in the products and servicesoffered by different banks, customer's choice of bank would have
been more ofa matter of convenience. But the recent changes in the
banking industry have already perpetuated a dynamic environment
resulting in the emergence of new products and services. The trendobviously is towards market orientation. Most recently, banks have
been allowed to enter the insurance sector too, which was yetanother monopolised sector in India.

But. as of now. there is ambiguity with regard to the nature andscope of marketing in the banking industry For instance. tillrecently. the perception of customers with regard to various banking
products and services were a matter of little concern. though banksused to provide personalised services to their important clientele.Of late. most ofthe banks have realised that customer orientation is
imperative to face the challenges ahead, if not to seize the newopportunities to survive and grow. The study on customerperceptions of banking products and services, therefore, is intended
to elucidate this aspect of banking.
1.2 Problem Definition
In spite of industrial backwardness and the overall lull in economic
activities, Kerala has been a fertile ground for the growth of banks,
especially private banks. One of the apparent reasons is the‘money-order’ economy whereby, since several decades, there has
been a steady inflow of money from Keralites working abroad andin other states of India. In any case, starting with the successstories of the ‘Chitti companies‘, Kerala gave birth to a few privatebanks that have had phenomenal growth. Some of these privatesector banks do have a national presence. These banks were in the
rapid growth trajectory even before ‘liberalisation’ in the early1990s. The success of these private banks as well as thenationalised banks took place under rather a protected environmentwherein customers had very limited choice.

With the gradual opening up of the Indian economy, a number ofNew Private Banks. Foreign Banks and Non Bank FinanceCompanies have entered the market to offer competition to the PSBsand Old Private Banks (OPB). The encouraging growth of banking
institutions as compared to other businesses in the state shows thatcustomers have tremendous trust in banks. But it is anticipated that
PSBs in future may face more competition from such new banks and
old private banks. based on the assumption that these banks would
create a competitive edge over the PSBs by becoming morecustomer oriented. While the FBs come with a multinational
experience of banking in a competitive environment, the NPBs have
the advantage of starting with customer oriented business practicemodels. With the legacy of about half a century, the PSBs and theOPBs, on the other hand, may require time for this changemanagement, which again depends on the actual customer needs and
aspirations. The time, therefore, is ripe enough to study thecustomer perceptions with regard to banking products and services
so as to obtain enough basis for product innovations ‘and systemic
changes with a view to remain competitive.
1.3 Earlier Studies Done
Nationwide surveys were done by the government and businessjournals to rate the service quality levels of banks in India.Extensive studies with regard to various aspects of customersatisfaction and their impact on performance of banks operating indifferent market segments were done in the United States ofAmerica and in some European countries. Much of the exploratory
analyses were done depending on these studies, as this aspect is

rather an unexplored area in the context of Kerala. Formulation ofarguments. however, is done keeping in mind the dimensions ofcultural differences and the gaps in technology usage. To avoidpossible errors in adopting the theories of customer behaviour from
such advanced countries to that of a place like Kerala. the studyextensively depends on the observations of professionals in thelocal banking industry It cannot. however. be ignored that. with the
wave of ‘globalisation’ cutting across the continents, and evenwithout that, Keralites' migratory tendencies, expose them to manya new thing. The analyses and reports in business magazines alsoprovided a potential source of information that helped to arrive atplausible hypotheses that fitted well into the banking environmentof the target population
Bateson (1990) explains that one of the primary causes of servicedesign failures is the lack of understanding of the evolving needsand preferences of targeted customers.2 Heskett (1990); Heskett et
al. (1990); Quinn (1992), and Rust and Oliver (1994) argue thatimportant characteristics of a service firm are its viability toascertain its competitive position within a target market and satisfy
customers better than the competition.3 Hence knowledge ofperceived similarity and divergence in resources and capabilitiesmay be often important for competitive advantage. It can, therefore,
be argued that competitive advantage is a customer perception.which is translated into organisational capabilities and resource-use
pattern by competing firms to attract the customer segments.
Greg (1998) found in a study involving a focal bank and itscompetitors that there was high a degree of concordance between

the focal bank and its competitors in terms of perceived image.‘ It
was further realised that all significant determinants of commercialcustomer preference for the focal bank are dimensions of preference
that are common to its competitors in the target market. All threefirms under study were perceived as good choices for commercialloans and deposits. Professionalism in customer service is anotherperceived determinant of preference shared by the focal bank withone of its primary competitors. The focal bank may choose toreposition itself since its perceived market image is similar with the
perceived image of its competitors for the target market chosen.5
The argument is that banks need a perceptual differential in terms of
image to achieve a competitive advantage in its target markets. Alimitation in drawing parallels with the findings of the above studyis that the target market focused is a standard metropolitan area inthe United States of America and may have little relation to thedimensions of marketing of mega banks, which operate in severalproduct markets in vast areas. Further, the premise of this study is a
market where customers revise their preferences rapidly. Thislimitation can be overcome by using adaptive methods formodeling customer's perceptions of banking products and serviceson a market-to-market basis since the preference pattern in thetarget population in this study may be less similar to the onediscussed above. The earlier study considers three individual banks
whereas the present study takes into account homogeneous bankgroups in Kerala for exploring the possible customer perceptualvariations. The determinants of predictor variables, viz., customerpreferences are adapted to the conditions existing in the bankingindustry in Kerala while formulating the hypotheses.

Difference in customer preferences or satisfaction level may be adeterminant of customer's bank selection decisions. Decker er al.
(I992) argued that perceived differences among banks are the truedeterminants of customer's bank selection decisions.6 There are
significant dimensions of customer preferences that differentiateone bank from the other. Greg suggested that a bank may attempt to
reposition itself by restructuring its delivery system to enhanceperceived images ofcustomer preferences that currently do not exist
in the target markets.7 He also concluded that characteristics of
banks such as progressiveness, financial stability, experience ofloan officers, aggressiveness to get and keep business, interest rates
on loans and deposits, extensiveness of services and service fees,convenience of branch locations, and general quality of servicesappear to be fertile areas for future enquiry However, none of thevariants measuring these particular dimensions of image wereassessed as significant determinants of the overall preference forbanks in the target segment. It follows from the above observation
that variation in perceptions with respect to one or two products orservices does not influence the overall image perception ofcustomers about the banks.
The determinants of overall image will be different from those for
the choice of different products by different target segments.However, customer satisfaction levels for the various services and
products offered by the gamut of financial Institutions (F15) mayvary with regard to the specific products needed by differentcustomer groups. In respect to variation in customer satisfactionlevels among the banks, the differences may be perceived withregard to the overall effect of a few core products only, since
majority of bank customers use only a selected few services. In fact.there is considerable lack of knowledge about other products thatthe banks offer.
The National Bench Marking Study (1999) to prepare the FinancialClient Satisfaction Index in American banks concluded thatcustomer's willingness to buy other products are significantlyinfluenced by their overall satisfaction of the bank.3 The study used
27 satisfaction attributes for the compilation. The most importantattributes driving satisfaction from the customer's point of view are
the human interaction issues, such as correcting errors promptly,courteous employees, and professional behaviour. Providing goodpersonal service is more important to clients than eitherconvenience or products. but various studies by Winsted (1997);Donthu and Yoo (1998); and Mattila (1999), done in differentregions of the world suggest that there is variation in the attributesof customer satisfaction with respect to service products acrossdifferent cultures.9 Mattila (1999) explains that customers withwestern cultural background are more likely to rely on the tangible
cues from the physical environment to evaluate service quality than
their Asian counter parts.‘“—' The study included Asian Indians which
may be considered as the closest to Indian environment with minor
variations. It is implied that a service product customer in adeveloping nation like India would be less interested in the physical
environment but look for personal service component. The premise
of an argument in the study is that locational advantage will beconsidered only next to service quality in the changedcircumstances in the industry though service quality is defined as a
collective index of several attributes including locational advantage.

The research questions the assumption of locational advantage asthe most significant determinant of choice of a bank. However. astudy made by Krishnaswamy er al. (1980) concluded thatlocational advantage was the most important reason in choosing a
bank and its deposits except in certain occasions.” It is to be noted
that this study was done in a period when the competition waspractically absent. The current phase of banking is characterised by
its transformation from the traditional to the technology-oriented
systems. Hence changing over to electronic banking maysubstantially diminish the importance of the locational aspect in amatter of few years from now.
A study on customer satisfaction and the determining factors in the
Small-Scale Industries (SS1) sector revealed that their expectations
in general about banks were found to be ’timely credit’, ‘quickservices’, 'adequate support’ and 'market information support’ 12 The
significant factors affecting choice of banks by SSI clients were‘willingness to accommodate credit needs fully’, ‘low interest rates’
and ‘quick and efficient services‘ If a bank fails to meet thesespecific needs of an SS1 client it is likely that the service qualityperception would be unfavourable.
Rajagopalan Nair (1994), in his study on rural bank marketing,concluded that rural customers consider security and liquidity as the
major prerequisites for the choice of deposits and not interest rates
unless the competitors offer better interest rates.” Rural customers
also deal with many banks at a time. Their service qualityperceptions were more favourable to OPBs, though their most
10

preferred banks were the nationalised banks indicating that thesecurity aspect overrides service quality perceptions in the choice
of banking products. An urban customer will have, but, moresophisticated needs and the level of customer service demanded may
vary vastly from his rural counterpart's requirement. Urban banking.
today, is in a transitional phase with bankers adopting technologyinnovations in designing the popular convenience products of banks.
In future. service quality perceptions will be influenced by thedegree of technology adoption in a bank.
In a study which evaluated the impact of information technology(IT) on service quality, it was found that, irrespective of use of IT,attributes such as speed of transaction, accuracy of information and
image of the bank had significant influence on quality of service.The first two aspects mentioned above imply the need for usingmodern Technology.” Findings also supported the view that anybank, which pays attention to these attributes, is likely to achievehigher quality of service. Though the specific needs or perceptions
for'different products may vary from customer to customer, a fewkey dimensions such as speed of processing and reliability will bedemanded by all. At the same time speed in service delivery willalso be used as a significant differential for targeting at certaintarget segments.
Pradeep K. Das (1997) evaluated the competitive advantage ofdifferent bank groups using matrix analysis based on eight twinparameters.” FBs, State Bank Associates and private banks werefound to have considerable advantage over the other groups. This
study, however, did not consider the NPBs and F15 and the premises
ll
of research is the early post-reform phase. Nature of competitionhas changed drastically since then and banks have undergone vast
restructuring exercises too. Competition needs to be studied in thenew settings.
Velayutham (1997). in a comparative performance analysis ofbanks. observes that private sector banks and foreign banks are nomatch to PSBS in terms of infrastructure. size of branch network and
resources. The level of retail banking conducted by PSBs is soimmense that it cannot be challenged in the near future by privatesector banks.” The perspective on competition in banking ischanging. The euphoria that the OPBs, and FBs would competeeffectively with PSBs is giving place to realities. PSBs will remaindominant in the foreseeable future.
There is another view on the issue of competition. Technology isnow able to deliver the advantages of reach without the attendantparaphernalia and costs associated with a lumbering branchnetwork. As Automated Teller Machines (ATMs), Telebanking, and
more recently, net banking practices proliferate, a bank will needfewer branches to achieve critical mass. Brick-and-mortar branches
will co-exist with electronic delivery channels to provide multiple
options to the customers. "5 ICICI Bank is already planning toprovide web-kiosks at every ATM outlet. Similarly, Times Bankaims to take the share of its retail business to 20 per cent bydesigning Millennium Centers with banking kiosks offering ATMs,
telebanking, and net-banking facilities. Hence, FBs may notincrease their size overnight. But they will have new opportunities,
in strength areas such as foreign exchange trading, derivatives,
credit cards, or fund raising abroad. The older foreign banks aremoving out of their niche markets to penetrate down the upper endmarket 17 But. a nationwide survey to measure the consumerperceptions about various banks in India reflected that PSBs stillreign supreme in the aspects of customer loyalty. image andcustomer orientation. though NPBS obtained better rankings forcustomer orientation than their overall rank based on a set ofaspects.” Local banks in different regions also obtained higherrankings showing strong influence of regional emphasis of suchbanks.
PSBs may appear to be impermeable to competition from privatesector banks. But there are other dimensions to competition thanwhat is felt from withm the industry. This also points to the aspectof low operational efficiency haunting the PSBs. A way to coverup the thin margins would be increasing the volume of business and
for that banks will have to look for new avenues of income through
innovative products and repositioning themselves in the market 19
Banking industry as a whole is passing through a transitional periodwhich calls for emerging from a regulated era to reorient itself tothe deregulated environment. Both PSBs and OPBs would haveproblems with bringing in the corrections warranted by the situation
as they carry the legacy of the old systems. Deregulation has alsoresulted in several NPBs set up by established FIs with strong client
support. Both in the area of loans and deposits they are able toattract customers. Corporates have since long started desertingbanks and turning to other sources of finance. There will not be adramatic realignment in terms of size by either the new banks or the
Fls, but there will be a bigger role for many 2° Competition can

come from substitute products and new products of other financialplayers.
The market positioning of the bank groups were not examined inmost of the above analyses except the nationwide consumerperception study mentioned above which considered the nationalmarket. Local variations were observed in this study, mostly interms of customer perceptions. This indicates that regionaldifferences do exist. Further. attributes of choice behaviour for
different products offered by the banks as well as other financialsector players were not taken into account. The present study,therefore, is intended to be more comprehensive and also considersdifferent sets of attributes to learn the perceptions of customersabout major banking products and services. Besides, it also studiesthe overall perceptions and behaviours with respect to choice ofbank.
The competitive environment in Kerala has certain uniquedimensions. Banks in Kerala face a unique problem of shrinkingopportunities in the corporate sector for both loans and fee basedincome, largely due to the sluggish performance of the industrialsector. CD ratio has been dropping consistently over the years toabysmal levels. This compelled banks to distribute their creditoutside the state and also explore niches like traders, professionals,and personal loan segments. These niches appear to be too small for
a sustained profitable operation. Moreover, it is susceptible tocompetition from new entrants and the existing NPBs. A favourable
and sustainable image is warranted to remain competitive in suchniche market segments. The present study hence intends to do a
14

relative positioning of bank groups from the point of view ofcustomers in their choice of various banking products.
What has been indicated above is only the gist of the generalobservations made during the literature survey. More specific andsignificant observations relevant to specific issues of this research
are referred to in the appropriate places in this report.
1.4 Objectives of the Study
In the light of what has been said above, the following objectiveswere set for the present study:
- To study customer's choice behaviors with respect toselection of banks.
I To analyse the variations in customer satisfaction with respect
to different bank groups.
I To study the leading factors in the choice of credit and depositproducts and the nature of perception of customers.
I To examine the variation in the perceived images of customers
with respect to different bank groups with a view to evolvepossible segmentation strategies.
I To evaluate the nature of competition between bank and non
bank financial products.
15
1 .5 Hypotheses
In order to meet the above objectives. this study has chosenattributes relating to customer behaviour with respect to differentproduct categories and bank groups. based on which the followinghypotheses were formulated:
1 The weightages assigned by customers to various reasons forchoice oftheir Most Frequented Bank (MFB) are not the sameas those for other banks.
2. The overall customer satisfaction level with respect todifferent bank groups vary.
3. Customers’ present choice of MFB and their perceptions ofvarious factors influencing the choice of banks aredependent
4». The attitude of customers towards the factors influencingchoice of banks vary among different income. education, andoccupation groups.
3. Public Sector Banks, Old Private Banks, Foreign Banks, andNew Private Banks are differently positioned in the perceptionof customers.

To examine the variation in the level of customer satisfaction of
different bank group customers, various core services provided by
banks and service quality perceptions on a set of dimensions werealso considered. in addition to the variable of ‘overall customersatisfaction level’ Customer satisfaction on each of the coreservices and service quality dimensions were taken as variables fortesting their dependence on bank groups and statistical analyseswere done in the case of each of these variables.
The objectives of the current study also necessitated examining afew possible arguments as stated below:
1. The barrier between class banking and mass banking is likely to
widen in the perception of customers, giving rise to opportunitiesfor Private sector banks, FBs and PSBs to possibly segment theirmarket.
2. The customer perceptions of PSBS, OPBs, NPBS, and FBs asseparate entities differ based on their core competencies and skillsin different areas.
3. Customers may prefer to follow a portfolio investment patternwith respect to banks by investing in a variety of financial products
offered by Fls as well as by public and private sector banks. Theprivate sector banks may continue to enjoy geographical andcommunal preferences.
4. Investments in IT will have a demonstration effect with respect to
image of banks and quality of services, though it may not have a
l7
significant impact on attracting new customers in the immediatefuture. However. the presence of Automatic Teller Machines(ATMs) and Home banking services may enhance the satisfaction ofcustomers of such banks considerably
1.6 Scope of the Study
As of 1999. the state of Kerala has 3210 offices of scheduledcommercial banks (SCBS). In all, there are 48 commercial banksoperating in Kerala, which includes PSBs, OPBs, NPBS. FBs, and
Gramin Banks. The urban areas give a complete picture of thecompetition in the present day banking scenario with the presenceof all bank groups. Semi-urban areas of Kerala have 2196 and urbanareas have 593 as on March 1995.“ The study focuses on theselected segments ofthe urban customers in Kerala which is capable
of giving the finer aspects of variation in customer behaviour in the
purchase of banking products and services. Considering theexhaustive nature of such an exercise, all the districts in the state
have not been brought under the purview of the study. Instead. three
districts with largest volume of business in terms of deposits,advances, and number of offices have been short listed asrepresentative regions for a focused study.
The study focuses on the retail customer segment and theirperceptions on the various products or services offered to them. Non
Resident Indians (NRIs), and Traders and Small—ScaIe Industriessegments have also been included in the study with a view to obtain
a comparative picture with respect to perception on customersatisfaction and service quality dimensions and bank choice
18

behaviour. The research is hence confined to customer behaviour
and the implications for possible strategies for segmentation withinthe retail segment customers.
1.7 Methodology
The study is primarily aimed at bank customers and theirperceptions of different banking products offered by the banksbelonging to different categories in the urban areas of Kerala.Before narrowing down to the key factors that influenced thechoice of a bank, it was essential to understand the marketingstrategies adopted by the banks. In the absence of any previousstudy on this topic in the context of Kerala, it was necessary to doan exploratory research.
The first step was to understand the concepts of bank marketing and
to study the trends and progress of banks in India and then to focuson the Kerala scenario. For this, a detailed literature survey wasconducted.
1.7.1 Literature Survey
The literature survey was carried out in two directions. One wasaimed at the collection of national and state level banking statisticsas well as review of advertisement tools like brochures andpamphlets of banks to get some idea about their products andmarketing mix. The other direction of survey was aimed atstudying the approaches in bank marketing, evolution of bankingindustry. the earlier studies done on related topics, observations

made on the subject by different agencies and individualresearchers.
The sources of secondary data consisted of published books.statistical reports. journals. independent survey reports. articles inbusiness magazines. annual reports of banks. reports of variouscommittees on bank reforms. bank websites, and reports innewspapers. The published documents to which references weremade are indicated under ‘Notes and References’ in the respective
chapters. They are also indicated in the Bibliography given towardsthe end ofthe thesis report.
1.7.2 Preliminary Survey
As mentioned earlier. an exploratory research was required tounderstand the nature of marketing practices in banks andspecifically on the aspect of customer orientation. Thus, initially, abrief questionnaire was prepared with open-ended questions to getthe views of banking professionals. A structured questionnaire tocollect some secondary data from a selected sample of banks wasalso used simultaneously.
Interview with Banking Professionals
Senior officials at the head offices of a few leading banks in allcategories were contacted and supplied with two sets ofquestionnaires. One was for collecting data on the major banksshort-listed and the other for the officials to opine freely withregard to the current introduction of reforms in banking industry
and its influence on the marketing scene of banking products. Thequestions were pertaining to the key areas of customer orientation.Another objective of this preliminary survey was to obtain a pictureabout their marketing orientation. They were able to supply withinformation on the strengths and weaknesses of the banks in thecurrent environment and about opportunities and threats that theyexpect in the future. Banks in all the categories, i.e.. PSBs. OPBS.NPBs and FBs were contacted for their responses. Observationsmade during this preliminary survey provided a direction for afocused study
Interview with Opinion Leaders
Faculty in Marketing, Management. and Banking in differentinstitutions were contacted to formulate a theoretical framework inwhich the banking scenario in Kerala can be discussed. Aninteractive session on ‘Customer relations in Banks‘ could bearranged with the participation of a group of Branch Managers. Thisprovided valuable insights into their perceptions about customersatisfaction.
The preliminary survey 1'95<-"-‘Tl. the following points to ponder:
- Banks will have to market their products and go in forstrategic market planning
I The public sector banks are not allowed to function on a levelplaying ground with New Private Banks and Foreign Banks
due to its social development obligations and regulatoryaspects which place them in a disadvantageous position.

I Customer orientation and enhancement of service quality may
have to be achieved by employing suitable technologysolutions.
I New products should be introduced to attract purchase ofcredits.
I Banks will have to become more customers friendly, havemore flexible structures and simple systems and procedures to
serve their customers more effectively.
I Customers will exercise their choice of banks and will develop
distinct criteria for doing so.
I In future, service quality and customer satisfaction wouldhave significant influence on the choice of banks.
IT investment is not a necessary evil but a value addition expectedby customers. The rate at which banks in Kerala would implement
an IT enabled functioning would also depend on the basicinfrastructure facilities such as telecommunication, quality power.
etc. and above all the availability of funds for huge capitalinvestment. However. one can expect a chain reaction once the basic
‘need’ undergoes a drastic transformation into a ‘demand’ triggered
by technology (as in the case of phenomenal PC and Internetpenetration that has taken place in India as-a-whole during the pastfew years).
IQ IQ

Based on the findings of the literature survey and the aforesaidpreliminary survey hypotheses were formulated and designing of thetools for data collection were done.
1.7.3 Design of Tools for Data Collection and Testing
Separate questionnaires for the following selected segments weredesigned to collect primary data:
Household customers (Retail banking customers)
Non-Resident Indians (NRIS)Traders and Small-Scale Industries
The questionnaires consisted of the following types of questions:
Closed ended questionsDichotomous
Open-ended questions
Rating on Likert scaleRank order
Multiple rating scales for perceptual mapping
The broad areas dealt with in the questionnaire were:
Choice of banks and influencing factors
Degree ofcustomer satisfaction with their present banks
Degree ofsatisfactions on core services
Customer behaviour in buyingfinancial products and services
Perceptions about credit products
Perceptions about electronic banking
Relative perceptions about different types of banks
Since most of the questions dealt with perceptions and attitudes.respondents were guided prior to the answering of questionnaire.However. the language was made simple and most of the questions
had exhaustive list of options to choose from so that they did nothave to recall and respond.
Sampling
The selected segments for the study constituted the householdsegment (retail banking customers), NRIs, and Traders & SmallScale Industries segment in the urban areas in Kerala. However,the NRIs and Traders and Small-Scale Industries segments wereincluded only for a comparative analysis. The household segmentwas the major focus group for the study.
Customers show more heterogeneity in behaviour with regard tochoosing the banks or products in the metro or urban area. SinceKerala has no metro cities the next level, viz., the urban area was
chosen. The perceptions of customer segments can be highlyvarying and the differences may be felt more clearly in the urbanenvironment. which have more number of banks with diverse
capabilities in different core competency areas. Urban areas may
also have different banking substitutes distinct from what isprevalent in the rural or semi urban areas. These reasons haveinfluenced in choosing the aforementioned segments for the study.

In Kerala. the semi-urban area has more branches than the urban
area. Further. State and Central Co-operative banks have 372branches in semi-urban areas and 60 in urban areas. Urban Co
operative banks have 27 offices.“ All the NBFCS. NPBs (at the timeof study) and FBs are located in the urban areas only. These areasprovide ample scope for studying the competitive advantage andrelative positioning of banks. A sample. which contains users of all
types of banks in the market, would thus provide a better picture ofcompetition and relative perceptions.
Sampling Units
Within the urban areas, six districts were considered for preparing ashortlist of the districts to be included in the study. They wereThiruvananthapuram. Ernakulam, Pathanamthitta, Kozhikode,Thrissur. and Kottayam. This was narrowed down to three districtsin the following manner.
The criteria for selecting the districts were: a) the number ofbranches of major banks in public and private category, b) size ofdeposits and advances, and c) their geographical representations andthe presence of different players of the financial services market.Ranks were given to choose the top three., The districts, whichtopped among the six districts with respect to the above criteriawere chosen, viz.. Thiruvananthapuram, Ernakulam and Thrissur.
Sample Size
The study intended to analyse the perceptions of customers in theurban centres of the three districts. The sample frame was the
I») |J|
number of people having a Savings Bank Account in any bank in the
urban areas in the case of retail segment. The total umber of people
having Savings Bank Account in any ofthe banks in the urban areawas taken as the universe. The total number of Savings bankaccounts in Kerala is 25.25.091(l993).n Considering the fact thatcustomers maintain accounts with many banks at the same time. use
of the above data as universe was not really meaningful. Further.since bank customer groups are highly heterogeneous. representing
each group according to the size of the stratum is difficult in twoways. First of all, large sample size will have to be considered foreach stratum and it places budgetary constraints on the researcher to
do such an exhaustive study. Secondly, an exact source list in eachstratum is not available, as many banks cannot reveal theircustomers‘ addresses to anyone since it questions depositors‘ right
for privacy. Hence in the household segment, a sample size of 400was chosen for the study. Since use of banking services requiredawareness about banking practices and a fair degree of knowledgein financial products it was decided to survey respondents withhigher monthly income and the cut off level was fixed as Rs.5000per month, to focus on the required target population. This sample
was split approximately in proportion to the urban population ineach ofthe districts included in the study. Thus sample sizes of 100,
200 and 100 respectively were used for Thiruvananthapuram.Ernakulam and Thrissur. Data collection was done by exit surveysin various banks. In the absence of a source list, it was thought thatthe effective way to pick up the right sample would be an exitsurvey in banks. Accordingly data collection was done by exitsurveys at various banks.

For NRIs, and Traders and Small-Scale Industries segments. sample
sizes of 50 and 100 were used. NRI segment. however. includedrespondents from Middle East countries only The Traders andSmall-Scale Industries segment was also proportionately dividedamong the three districts according to the ratio of their population.As stated earlier. these two segments were covered only to obtain a
comparative picture with the results of the focus group viz.. theretail banking segment ( household segment).
Sampling Method
Since this study is fairly extensive a multi-stage sampling designhas been adopted. For this purpose, major banks from among thePSBs, OPBS, NPBs and FBs were selected based on their overall
performance indicators. A listing of the branches of these banks ineach district was made. From each representative area (i.e., thedistrict) a branch belonging to each bank group was selected toconduct an exit interview. Traders and Small-Scale Industries
segment is more diverse than the retail customers of a bank. Hence,
it was required to use the method of ‘convenience samplino.according to the choice of researcher so that more control over thequota may be applied. Among NRIs, the focus was mainly on those
in the Middle East countries. For the three segments covered.different questionnaires were used, though most of the questionswere meant for collecting information of similar nature from each
segment. The sample questionnaires are given as Appendices 1 to 3.

1. 8 Period of Survey
The survey was conducted over a period of six months and all theselected segments were simultaneously interviewed.
1.9 Data Analysis
The primary data collected were processed, tabulated and analysedby employing the following statistical tools mentioned below andusing SPSS computer package:
I Tests of Correlation (Pearson Chi-Square, Likelihood ratioand Wilcoxon Matched Pair Test).
I ANOVA for studying the variances of attributes amongdifferent groups of respondents.
I Multivariate analysis like, factor analysis, cluster analysis,and multi-dimensional scaling, etc.
Suitable mathematical tools such as mean, ratios and percentageswere also used.
1.10 Scheme of the Report
The report has been presented as per the following scheme:
Chapter 1. Introduction
This chapter provides information about the background of thestudy, problem definition. objectives, hypotheses, methodology,tools used for data analysis and scope and limitations of the study

Chapter 2. Marketing of Banking Products and ServicesTheoretical Considerations
It discusses in detail the concepts of financial services marketing.earlier studies done in various customer related issues in marketing
of banks and their products in India and elsewhere. bankingscenario in India and the impact ofthe recent changes on marketingorientation of banks.
Chapter 3. Banking In Kerala -An Overview
This chapter gives an account of the characteristics of banking inKerala, role of private banks and. the favourability of socioeconomic aspects for growth of banking in Kerala. Further, itpresents the analysis of basic banking statistics of Kerala.
Chapter 4. Customer Perceptions of Banking Products andServices - Analysis of Data
This part of the report gives a detailed description of the methodsused for conducting the survey, results of data analysis, descriptiveand graphical presentation of the findings and inferences drawnfrom the study.
Chapter 5. Conclusions and Recommendations
The inferences drawn from the study and recommendations of theresearcher are included in this chapter. The recommendations alsoinclude stating the strategy implications for the bank groupsconsidered in the study

1.11 Limitations of the Study
The current study has the following limitations:
The sample frame of the study does not represent all the urbanareas. It had to be assumed that the districts chosen would represent
the opinion of urban bank customers in general. Further the study in
urban area itself was sufficiently extensive that certain importantcustomer groups like agricultural loanees, beneficiaries of thevarious schemes and development banking could not be included.whose perception on customer satisfaction do not come into thepicture. However. since the focus is on marketing of bankingproducts to urban customers, the selected segments were expected to
give relevant information on possible target marketingopportunities.
The sample frame had to be limited for want of time and budget.Since the exit poll method was used for data collection more time
was required for picking the right sample. This and theaforementioned constraints anticipated at the time of sample design
have influenced the researcher in deciding on the possible samplesize.
This is primarily a consumer perception study. Obtaining banker'sperception about their service quality levels and productattractiveness would have enriched the study considerably. But itwas found that there was considerable reluctance on the part ofbanks to provide information on internal records. For instance. there
may be reluctance to part with the information on number of saving

accounts. current accounts. deposits. customer groups. andmarketing strategies they are adopting now. However. such data was
obtained through the various reports and banking statisticspublished by RBI.
1.12 Topics for Further Research
1. A Study ofthe Impact of Electronic Banking on CustomerSatisfaction in Banks.
2. A Critical Evaluation of the Changes in Perceptions of Customers
about Public Sector Banks- A Longitudinal Analysis.
3. Old and New Private Banks- A comparative Study of their
Marketing Practices.
4. Class and Mass Banking Strategies of Banks in Kerala- ADiscriminant Analysis in the Retail Segment of the industry.
5. Risk Perceptions ofCus:c_-u-.ers on Electronic Banking Systems
Notes and References:
I. The classification of banks (and the abbreviations usedalongside) such as SBI and Associates, Nationalised Banks

(excluding SBl and Associates group). Old Private Banks (OPB).New Private Banks (NPB). and Non-Bank Finance Companies(NBFC) are as used in Reserve Bank of India reports. All OPBs
were set up before the nationalisation of banks in 1969 and NPBscame after the financial sector reforms of 1991 NBFCs have
been divided into three broad categories. viz.. (a) those accepting
public deposits as defined in the Companies (Acceptance ofDeposits) Rules. 1975 and the RBI Act. (b) those not acceptingpublic deposits, and (c) core investment companies not accepting
public deposits.
2. J. E. G. Bateson, 'Evaluating the Role and Place of Marketing inService Firms’. in D.E. Bowen. R. B. Chase, and T.G. Cummings
(eds), Service Management Effectiveness. Jossey Bass, SanFrancisco, 1990, pp. 324-344.
. J.L.Heskett. ‘Rethinking strategy for Service Management ', in
D.E. Bowen, R. B. Chase, and T.G. Cummings (eds), Service
9)
Management Effectiveness, Jossey Bass San Francisco, 1990,pp. 17-40.
James L. l-leskett, W.Earl Sasser, Jr., and Christopher W .L Hart,
Service Breakthroughs: Changing the rules of the game, FreePress, New York.1990.
J.B. Quinn, Intelligent Enterprises, Free Press, New York, 1992.
4. Greg M Lepak, ' Bayesian approach for analysing the services of
banking institutions’, The Journal of Consumer Affairs; Vol. 32.,
No.1, Summer 1998, pp.12l-144.
bl Ix)

5. M. E. Porter, Competitive advantage: Creating and SustainingSuperior Performance. Free Press. New York. 1985
6. K. Chazeh and W H. Decker. 'l-low Customers Choose Banks’
Journal 0/‘Retail Banking. Vol.l4 (winter), 1992-1993.pp. 41-44.
7 Greg M Lepak. 0p.cit.,
8. The result ofthe National Bench Marking study conducted inpreparation for the new ABA (American Banks Association)Financial Client Satisfaction Index (FCSI) as reported in‘Satisfied Customers more likely to buy other bank products,study finds‘, Journal of Bank Marketing, Vol.31, No.8, 1999,p.54.
9. Naveen Donthu, and Yoo Boonghe, ‘Cultural Influences onService Quality Expectations’, Journal of Service Research,Vol.2. 1998, pp.l78-186.
Catherine Frazier Winsted, 'The Service Experience in TwoCultures: A Behavioural Perspective‘, Journal of Retailing,Vol.73, No.3, 1997, pp.337-360.
10. Anna S. Mattila. 'The Role of Culture in the Service Evaluation
Process’, Journal ofService Research, Vol.1, No.3, 1999.pp. 50-61.
11. O.R Krishnaswamy, and C. Sreenivas, 'Deposit Mobilisation inBanks-A survey’, Yojana, October 16-31, 1980, Vol.XXVI.No.19, pp.19-20.
33

12. K. Ramesha. ‘Banking Expectations and Bank Selection’, [BABulletin, Vol.2]. No. 9, 1999. pp. 20-25.
13. Rajagopalan Nair. Rural Bank Marketing in Kerala. DoctoralThesis. Department of Commerce. University of Kerala. 1994.
14. This survey was done by a team from the Indian Institute ofmanagement. with the support of M/s. Canbank ComputerServices Ltd. in 1996. The results are reported in [BA Bulletin.January 1997. pp. 42-44.
15. Pradeep K. Das, ‘Competitive Advantage of Bank Groups inIndia- A Matrix Analysis’, [BA Bulletin, January 1997,pp.l6-21.
16. T.K.Velayutham, ‘Competition in Banking-The ChangingPerspective’, The Economic Times, July 11-17, 1997
17 Ibid.
18. Romesh Sobti, Chief Executive, ABN Amro Bank, Quoted in ‘AWalk in the Dark‘, Business India, December 29, 1997January 11, 1998, p.69.
19. The Financial Express-FE MODE Survey 'Public Sector BanksHold Their Own’. November, 1998, pp.Sl-53.
20. M. S Verma, Chairman, SBI, quoted in ‘Between Size and aFocus‘, The Financial Express-FE BRIS Survey, November199s,p.17
34

21. Romesh Sobti. op. (:it.,
I\) I0 . Classification of population groups is based on 1991 Census.Source: Statistical Tables related to Banks in lndia—l995-96.
Department of Statistical Analyses and Computer Services.RBI. Bombay.
23. Department of Statistical Analyses and Computer Services. RBI.Statistical Tables Related to Banks in India-1994-1995,
Bombay.

CHAPTER 2
MARKETING OF BANKING PRODUCTS AND SERVICES
- THEORETICAL CONSIDERATIONS
2.1 Introduction
The discussions in the previous chapter indicate the changessweeping across the banking industry in India and the possiblestrategy implications in bank marketing. These changes are likely toinfluence customers‘ perceptions about different banks and theirproducts and services too. The purpose of this research study is toevaluate the perceptions of customers as applied to the bankingindustry in Kerala - the state with a legacy of unique, dynamic, andgrowing banking history, right from the pre-independence era. Thetheoretical background against which such an evaluation is done isdetailed out in this chapter.
Bank marketing is relatively a recent concept. The marketingpractices in the banking industry was mostly confined to depositmobilisation campaigns or image building exercises. A goodamount of literature relating to the theoretical framework of bankmarketing have come out in the West, when the banking systemthere underwent changes somewhat akin to what Indian banks arefacing now. In the absence of any such detailed work available inthe context of India, the discussion on the theoretical considerationsof the study has been borrowed substantially from those westernconcepts.
36

There is a misconception that marketing is a separate and distinctset of tasks as far as banking industry is concerned. Many bankersbelieve that the activities of the banks are entirely different fromthose ofthe commodities market and that the elements of marketing
have little to do with the banking business. A financial product is
still not reckoned as a ‘product’ in the market such as a car ortoothpaste. It may also be hard to believe that ‘money‘ is a productto be developed to suit the needs of consumers. advertised and sold.
To some extent. this belief is largely due to the heavy risk involvedin lending and the need for specialised finance related knowledge in
viably conducting the banking business. Further, banks also have to
share the larger responsibility of supplying money for business and
individuals at acceptable prices, as part of the social developmentprocess of the country, in which banks have a critical role to play.When banks were passing through a transitional phase in the West,towards a market orientation, this point was emphasised in theeditorial pages of the Wall Street Journal as:
Bankers are becoming like everyone else inbusiness, and that is where the danger lies...The essence of being a banker is to stand apartfrom the excitement and to serve business and
the community without joining in businessactivity.l
Economic growth and performance of banks are often linked to each
other. In fact, this was responsible for bringing in more stringentregulations to control the activities of all the financial institutions
by the government. The skeptics of marketing approaches in
37

banking for long held that the scope of being marketing orientedis highly restricted by the regulatory mechanism. The interestregulation regime existed in India, in fact, limited the possibility offlexible pricing of products and services. The conflicting interestsof conducting business and the commitment to social development
often diminished the role of marketing. Some time in the past, thesituation was more or less the same in the West too.
A major turning point with regard to adoption of market orientationin the banking industry was the publication of Theodre Levitt'sMarketing Myopia, which was positively looked upon by theindustry leaders in the US. 2 They realised that ‘money’ is also a
product, which is to be made appealing, distinctive, and competitive
to specific target markets. In the West, the banking industry hasgrown through several distinct phases marked with characteristicchanges in customer’s needs with respect to products, sophistication
and convenience. This chapter explores how banking turnedmarketing oriented in the West and, much later, in India and thetheories evolved from time to time to study those aspects whichcontributed to the whole change process.
2.2 Bank's Focusing on People
Bank's focusing on people began with the thrust on retail market for
sourcing funds, though it was not a new phenomenon. T-his hadevoked great excitement among the retail customers. Banks looked
for newer ways to serve this segment leading to the introducticn ofa variety of products like branch banking, credit cards and ATM"sand improved customer services. The excessive deposits thus
38

gathered from the customers necessitated the invention of ‘creditproducts’ and, in turn, techniques for selling these products. Thebusiness customers became as valuable as depositors. Consumersassumed the dual roles of depositors and borrowers. Emergingcompetition forced the banks to come up with better offers. Thebanking products became more diverse; product lines wereextended: the customers became more knowledgeable: andcompetition was unavoidable as in any other industry Banks gettingmore oriented towards customers was more visible in their training
of personnel, introduction of specialisation and professionalism.Right from the support staff to the branch managers had to sell; and
selling became everyone's job. 3 Banks emphasised on providing a
full service capacity to its retail customers with an array of creditand deposit products and later started exploring potential segments
like business customers for expanding their business. Productvarieties like mortgage and merchant banking were developed forthese segments. Later, convenience products like Electronic FundTransferring (EFT) and ATMs were introduced to provide customers
with the advantage of speed and convenience in delivery ofservices. Change in life styles of people, international expansions of
companies and increased mobility of people gave rise to highlysophisticated products in the 'convenience' category. whichdemanded the employment of marketing techniques akin to thosedemanded other physical products. At this stage of discussion onmarketing approaches, it is essential to see how banking productsfits into the framework of marketing theories.
39
2.3 Marketing of Financial Services - Theoretical Considerations
Marketing of services is relatively a new concept. It has beenborrowed heavily from the concepts of marketing of physical goods
propounded long ago. Any business activity or trade can't dowithout marketing their products and strategic planning of theiractivities. Before narrowing down on the theories of marketing offinancial services, it is appropriate to understand and definemarketing from a strategic management perspective. One definition
of marketing is:
Marketing is an integrated business activity directed atidentifying, creating, and servicing demand.4
Marketing activities cannot be seen as isolated tasks to beperformed by a separate department. They are closely integratedwith the strategic planning activities in any successful organisationand involve all those tasks of accounting, research, development,finance, etc performed by the banks to satisfy the customer needs. It
can be better explained like this. When a customer seeks banks that
are trustworthy, banks are trying to satisfy their security needs. Theextent to which different consumers need financial security alsovaries and that is why banks offer time deposits for varying periods.
A customer who buys a credit card will be seeking to satisfy hisprestige needs apart from his convenience needs. A consumer islooking towards satisfying his various needs like security,convenience, prestige or freedom when he purchases a financialproduct.
40

As the definition says, marketing will also aim at creating demandfor new products. New products may be the results of a series ofactivities entailing identifying the opportunities. evaluating andchoosing viable ones and designing effective marketing mix for the
product by combining price, product. distribution and promotion.This is what makes a marketing oriented firm different from aselling oriented firm. In Finding these opportunities the business istrying to study their customers’ needs that can create a potentialdemand for a product offering. The final part of this definitionexplains that the success lies in servicing the demand satisfactorily.
Once a need is created for a product and market developed it mustbe served. Customer loyalty can be expected only if organisationsare able to meet customer expectations continually. It is alsoincumbent on the organisations to maintain a competitive edge or a
differentiating element to get continued support from the customersince competition in the long run, may lead to the introduction ofcomparable products in the market by the rivals.
Whether the banking industry the world over views marketing in its
right perspective or not is open for a debate even now. Historically,
banking industry had production orientation, which graduallyturned into selling orientation. What separates both thesephilosophies is yet to be understood with clarity by bankers.5
Theodore Levitt (1960) explains that selling focuses on the needs of
the seller; marketing on the needs of the buyer.‘ Selling ispreoccupied with the seller's need to convert product into cash;marketing with the idea of satisfying the needs of the customer by
means of the product and the whole cluster ofthings associated with
41

creating, delivering and finally consuming it. The selling conceptbegins with the product and asks the question ‘How can westimulate a profitable volume of sales?‘ Essential to this approachis the heavy use of promotion and sales effort. The marketingconcepts begins with the consumer and asks ‘What consumer needs
in this target market are not being satisfied and how can I satisfythem?‘
Thus marketing orientation should permeate all functional areas ofa
business. Many managers do selling and justify that they havemarket orientation. The organizational charts of most of the banks
bears testimony to this. The banks will have a public relation, sales
or advertising department, which is supposedly taking care of thisfunction. But it may also be an implication of low levels ofcompetition in the market.
Banks operating profitably might have excessive confidence inmaintaining the status quo in growth that marketing techniques are
relegated to redundancies. Sometimes the opposed views onadvantages of adopting marketing approaches still persist, perhaps,
due to the fact that despite the FCCCSSIOI1 in economies all over the
world some banks continue to grow. However, all businesses aresubjected to the vagaries of environment and change is inevitable. A
major threat may be competition, a relatively new dimension in the
case of Indian banks. Entry of new banks is an indication of thepotentials existing in certain customer segments. It is also seen that
the new banks invariably try to develop strategic plans and givemore emphasis on serving specific target markets in a better waythan the rest.
42

lt is clear that understanding the market is primary to planning ofbusiness and it is being realised by an increasing number of banksand Fls today. It is imperative that competitors of banks should notbe left out in the evaluation of business environment. The financialservices market including both direct and indirect competitors as awhole will impinge on the banking products market since thederegulation has also enhanced the scope of banking substitutes.
2.3.1 Financial Products - Definition and Characteristics
Financial product is defined as activities, benefits, andsatisfactions, connected with the sale of money, that offer to usersand customers, financial related value. 7
Suppliers of financial services include Banks, Insurance Companies,
Credit Card Business, Housing Loans, Stock Exchanges, LeasingCompanies, National Savings, Unit Trusts, NBFCS, etc. Howeverbanks are the major players. All the financial services are targetedboth at the individual and corporate customers. According to thetype of services these broader markets can be further split intodifferent groups of services as given below.
Commercial banks
The main functions of commercial banks are
0 Safekeeping, which involves firms and individuals storingtheir funds with banks for safe keeping and earning an interest
on the same. All the deposit taking functions will fall in tothis.
43
o Lending of funds.
0 Providing a variety of financial services that are indirectlyrelated to the above two functions including transmissionservices.
The main sectors in financial service may then be grouped into five
specific categories of service.
0 Cash accessibilities through various means ranging fromsavings accounts to virtual banking with the help of clientserver technologies.
0 Asset security by way of money deposits and safety lockers
0 Money transfer or Payment services
0 Deferred payment or loans
o Financial advice by way of advices on investments, wills,taxation, leasing, mergers, acquisitions and so on.
Characteristics of Financial Services
Financial services have certain characteristics, which make theirmarketing difficult to some extent. Some of these features are:
a) lntangibility
A bank's products cannot be 'sensed' by a customer by touching,tasting. smelling, seeing or hearing. It is not possible to display orstore the services a bank can offer which prevent banks from usingindirect channels of distribution to reach the different geographicalsegments. The customer is deprived of the opportunity to see or use
44

the product in a pre—purchase evaluation process to justify thepurchase on a psychological plane. This gives the customer afeeling of discomfort and it might also lead to a delay or reluctancein making the purchase decisions. Bankers involve in personalselling with a wide network to tackle this difficulty and try to reachthe customers in every corner of the country This is whymiddlemen are absent in banks. The high infrastructure expense inthe banking industry may be attributed to this aspect. Demonstrationor display of product are also not possible for such products. Useof promotional methods is almost restricted to the extent of usingimage building themes or information about products or servicesonly. Banks can certainly overcome this problem by projecting thephysical environment as an evidence for customer orientation andpromote personal selling. The service providers will have tocommunicate to customers about the benefits they get from theproducts to reduce such uncertainties of customers in decisionmaking.
b) lnseparability
Another obstacle in marketing of services is the inseparability ofthe service from its provider. The service process may henceconsume more time and each individual customer will have to be
attended personally. An implication of the inseparability factor isthat standardisation of service quality levels will be difficult toensure since it may depend on individual service providers.However, meeting expectations is the key to customer satisfaction.Customers‘ expectations are influenced by aspects like pleasantinteractions with bank personnel, showing concern for customerspersonal banking related needs, past experiences if any and changes
45

in such needs from time to time.” Understanding the customers’expectations also demands empathetical approach by the bankpersonnel. Further. trust and commitment are the key factors indeveloping long—term relationships with the customers.9 Thisnaturally leads to the need of providing excellent services, thecorner stones of which are reliability, empathy and responsiveness.
Rust and Zahorik (1993). Heskett et al (1994) and Rust and Zahorik
and Keininghenn (1994) suggest that service quality leads tocustomer satisfaction or relationship strength, to relationshiplongevity and further to customer profitability.” Training ofpersonnel and designing of the product-service components of abank product, hence, are primarily important and are to be donewith care in creating the atmosphere of service excellence.
Yet another dimension of the inseparability aspect is that thefinancial services need to be simultaneously produced andconsumed. This gives rise to two types of limitations. One, the time
available may have to be judiciously used because the servicesshould be available to customer at the time they want and two, itshould be available at a place from where a customer want it to buy.
In other words a customer will seek both time and place utility‘ While locating the saleswhile considering financial services.‘
outlet banks will have to ensure that it is convenient to the various
customers located at different places, the working hours may be.planned and the resource are allocated in an optimal way to renderthe services in a satisfying way. This may also affect pricing, since
the cost of direct distribution for any product is very high compared
to indirect placing. Definitely electronic banking is an alternative
46

whereby some of the tasks performed by service personnel can betransferred to the customers as self service. This would also mean
saving of time and cost as electronic processing speeds up thedelivery too.
c) Highly lndividualised Marketing System
Banks may have to keep a one to one relationship with most of theindividual customers. Usually physical goods get distributedthrough a number of established middlemen. But financial servicemarketers will have to reach their customers by opening outlets indifferent locations convenient to them. This will push up the costof placing. In lending to individuals or corporates also eachcustomer should be personally attended and the officer doing the jobwill have to engage in need-based product design for each. Theservice quality hence will vary considerably according to thesituation, mood of personnel, behavior of customers and the roleexpectations of one about the other. For each customer a marketingmix will have to be developed, especially, the corporate customerneeds more time with the bank personnel. Such delays may consumemore time and control of quality may be difficult. This is the keyreason for avoidance of indirect channels in financial servicesmarketing which otherwise would have relieved the banks of someofthe marketing functions. Customer loyalty can be ensured only ifa bank is able to continually serve a customer's individualisedneeds, which demands an examination and follow-up of the natureand potential of the existing customer base. It is hence essential totrack the personal profile, purchase histories, transactional values,and responses of customers to different product promotions toensure loyalty and hence profitability. It has been proved throughempirical studies that retaining customers and reducing customer
47
defections are highly beneficial and cost effective strategies indoing business. Quantifying and classifying existing knowledgeabout customers is a daunting task demanding sound management ofinformation systems and databases. The whole process oftrackingdown customer knowledge needs a great deal of initiative from thepersonnel and ample infrastructural supports by way of computersand networking. Further. the marketing strategies would vary widelyfrom product to product and customer to customer. For instance. acorporate customer and an NR1 need to be targeted with differentmarketing strategies. Profitability is achieved only through prudentand efficient management of marketing a variety of products and ahost of other specialised financial and accounting aspects.
d) Lack of Special Identity
Banks are almost sold as ‘generic products’, though not in the strictsense. 12 The reason why a particular firm is chosen is often relatedto the convenience factor. Competition adds on to this problem. Theconvenience factors are generally offered as a ‘package‘ whichinclude branch location, a wide range of services, safety andcomparable interest rates. In the early banking system in India theinterest rate regime made a bank's products and services moregeneric that banks were left with no flexibility to vary the benefitsoffered to a customer and thus gain any advantage over the otherplayers. Porter (1980) has put forward the theory of competitiveadvantage that elaborates the five dimensions that impactcompetitive edge to a product. ” A product should be perceived asproviding some unique features or experience to customers in orderto gain any competitive advantage. Customers usually look towardsthe ‘value’ a product may offer while purchasing a specific brand ofa product. This ‘value’ could also be contributed by price,premiums, opportunity costs in terms of time and convenience and
48

other value additions which the consumers perceive as exceedingthe sum total of all costs associated with purchasing a product.Another dimension is the psychological ownership felt by thecustomers towards a product. Acquiring such dimensions ofcompetitive advantage and the desired market position is not easilypossible due to the generic nature of banking products. To acommon man one bank is much similar to another. Some banks takethis advantage for granted and anticipate that customers will cometo them automatically. The common man may not have thespecialised knowledge required to evaluate a bank’s efficiency andperformance and the differences in an objective manner.
0) Heterogeneity
Financial Services firms offer a very wide range of services to avariety of segments. Different customers need different treatments.
Risks associated with selling different products also varyconsiderably. Further, the extent of attention needed, accuracy offorecasts, and pricing methods differs in individual cases. The case
of popular banks in India is much complex as they are obliged tocater to all customers irrespective of the size of deposits or loanthey need whereas foreign or privzzte banks are allowed to fix thelimit of deposits or loan amounts they deal with. Multiplicity ofproducts makes it difficult to standardise the products. Applying a
common marketing mix may be all the more impractical. Due to theaforementioned difficulties advertisements of banks mostly stress
on their ‘one-stop selling’ advantages. Research studies done in the
area of branding of banking products also suggest that suchexcercises of product branding had only little impact on customerperceptions.
49

f) Geographical Dispersion
Banks have to have a branch network without which they cannotreach their customers. The advanced countries have long beforeovercome this requirement through electronic processing and ATMS
in important centers. Earlier. Indian banks went on a franticbranching out with the same objective. The intention behind banks‘
penetrating to rural pockets was to serve people in all strata of thesociety. Eventually, this frenzied branch expansion with no regard
to evaluation of viability proved to be costly for the PSBS. Going by
the present rate of IT penetration into the daily life of the commonman, as of now, other options such as ATMS and tele-banking arewithin the vicinity, at least in urban and semi-urban areas. Thisclearly indicates that banks will have to maintain a balance onphysical expansion, resource utilisation and profitability.Notwithstanding the wide scale expansion, Indian banks have notexperimented much with placing strategies to enhance profitability.
The placing strategy of Indian banks was controlled by the branchlicensing policy of RBI, insistence on prior approval system,requirement for development of social banking and inculcatingsavings habits among rural people. But this situation no longerexists. PSBs have already achieved its objectives of branchexpansion. Banks are now opening specialised branches for specific
customer segments like NRIs, exporters, entrepreneurs,industrialists and personal banking in order to overcome the‘placing problems. Technology deployment can now solve thisproblem effectively, even though, it demands large-scaleinvestments. Branch level profitability management is another

relevant area of discussion with respect to placing. However. in the
present day context. optimising the 'placing‘ cost need not mean the
same as setting up of ‘brick and mortar‘ offices. Many customerswould be able to interact with banks without having to gophysically to an office.
g) Fluctuation in Demand
Financial institutions, instruments and markets that constitute thefinancial sector act as a conduit for transfer of financial resources
from the net savers to net borrowers. Any market imperfectioncondition hence would lead to operational inefficiency in the banks.
The market for bank products are very sensitive to economicconditions; especially, if corporate sector performance is poor banks
will be highly affected. In India forecasting for loans are madebased on industrial growth rate and performance of economy.Similarly for certain products like personal loans unlessaggressively promoted, the demand remains low. When other sectors
of the financial market under-perform banks are flooded withdeposits, which tilts the balance of assets and liabilities. Marketcorrections applied by regulatory agencies, from time to time, willalso influence the demand. Further, increasing competitionsinitiated by the reforms cause inevitable changes in the market with
declining profits in traditional banking business and opening up ofopportunities in investment banking, securities, trading andinsurance. A greater degree of preparedness is hence warranted inbanking to tide over the consequences of frequent fluctuations indemand and policy changes.

h) Labour Intensity
The financial service sector is highly labour intensive. One reasonwhy banks are operating with very thin spread is that their salary
expenses are often _very high. The financial products require lengthyprocedures and documentation that the labour input will be veryhigh. The regulations and tight supervisions on banks by thegovernment add to the paper work too. Each transaction need to becarefully recorded to avoid frauds and misrepresentations and hence
each individual customer may need personal attention. The banks all
over the world face the problem of overstaffing to different degrees
due to the same reasons. Another consequence of labourintensiveness is that it leads to higher prices and in turn it mayaffect the viability of operations also.
2.3.2 Market Planning in Banking
The rapid pace of changes in the banking industry have also resulted
in more number of banks taking to strategic planning to identifythreats and opportunities and to optimise resource usage forachieving the competitive advantage. Most of the conceptual skills
introduced into bank marketing have been originated from themanufacturing industry, banking calls for a distinct set ofapproaches in marketing. Corporate planning in banks is initiatedwith strategic planning process (see Figure 2.1)

EoE._o_a>uo 5325 _o 332.. on» I ad Saar.
r.__:.r.u~_ _5_a2_/._
.,£a_3uE_E:> o_m3....___:..5. .r.:=_._ :2_u<
._E..._=.:r.s::.:._:._ _3_.:.._>_
_n._c_u=.._ _:2:=o.__>__H._
=c_:v.:._u>::..E:_cU 4:_..:
.r.u._:.;.=u_2r :o._:.».o._u_E:u._E:U
:_u:__»..r.u.nm<::_:no._ —=.J.C:.J
.nnu=u>:oa.E< .3_:._—2
Ck _,....:..,.:u_é.a_5>.:Z6E 5./_.=.._>_
:o:£:oEmux Ea:c:E_._uQ n;_._=§

The success of any business is its ability to adapt to its change that
is taking place in its relevant environment. It is postulated that in an
information environment, those systems that process informationmost effectively are the ones most likely to be ‘selected‘ forsurvival.” Failure to sense the changes around a business willeventually lead to its demise or stagnation. Changes may havepositive as well as negative implications. but how fast a firm picks
it and prepare itself to adapt to the changed situations willdetermine the future ofthe business.
Banks can utilise the strategic planning tools to observe and studythe environment, analyse for threats and opportunities to evolve acomprehensive market plan that would lead to the achievement ofits goals. Strategic marketing process involves activities such asmarket segmentation, environmental analysis, the selection of target
markets for the firm's segmentation effort, and development ofappropriate marketing mix for the different segments targeted.Strategic planning guides a Firm in examining its relative position in
the market, potentials, and environment and in formulating thepossible marketing strategies.
The first step in the strategic planning in banks would hence bestudying the market priorities.” The bank's strategic plan makesexplicit the market priorities, which determine resource allocation,the assumptions behind the choice of market priorities, the timing of
strategic moves, an estimate of the environment in which the bank
will have to function, and the expected rate of progress in strategy
implementation. Environmental analysis of a business hence entails
the study ofthreats and weaknesses faced by it.

An environment threat will be considered as a challenge posed byunfavourable trend or specific disturbances in the environment that
would lead, in the absence of purposeful marketing action, to thestagnation or demise of a company. product or service.”’ The extentof damage the threat will cause to the organisation, and theprobability of realisation of such prediction should be ascertainedby the business.
Similarly, opportunities are attractive markets in which a business
is likely to enjoy a differential advantage.” Bank's distinctivecompetencies are its resources and capabilities. When thesecompetencies are matched with the opportunities it will achievecompetitive advantage. For instance, if a bank wants to tap thepotential of export oriented firms it should possess the necessaryexpertise in the line. If it does not have the expertise the firm willbe wasting its resources.
Key factors that impact the environment of banks would be
a) Technological Development
Computers were once anathema to bank employees owing towidespread fear of large-scale job cuts that may result from it. Now
they have realised the potentials of electronic data processing as aresult of continuous awareness generation and computer trainingimparted to bank personnel.
Foreign banks were the pioneers in this field in India and Indian
55
banks lagged behind global standards considerably for long in thisaspect. It was technology that changed the face of banking services
across the world. Technology has a crucial role in designing anddeveloping new products for small segments as well as for the mass
market in the financial services business in the developed nations.The convenience products invariably use modern technologies such
as Electronic Fund Transferring (EFT). ATMs, Home Banking. andTelebanking do away with the concepts of brick and mortarbank’ 13 It provides them with the advantages of faster transactions
and speedy delivery of services. Banking is the highest spender intechnology among all the services industries in the world is. Though
[T assumes greater importance in the financial services industry,sometimes it may overshadow other factors of production.”
One of the difficulties in marketing of banking services is the direct
distribution of its services, which demands heavy investment inbranch networks. The greatest advantage of IT implementation inbanks would be the elimination of office space requirements instrategic locations entailing large-scale investment. Anotheropportunity is the ready availability of information at any time and
location enabled by networking technology.
Technological change in information processing affects the banks in
three ways. Firstly, the size and potential growth for an individual
bank has increased, secondly, it has expanded a bank's capacity to
compete in the market place and thirdly, it determines the costdynamics 20
The scope for new banks and small banks to become viable
56

notwithstanding their narrow networking of offices has also beenenhanced by the advent of technology. The NPBs and FBs in India
are good examples for this. In fact. they are treading in theadvantage of modern technology enabled services to woo the upmarket segment. Back office automation and implementation ofmanagement information systems (MIS) are taking place in manyPSBs and OPBs in India. Though the leading private sector banksand the public sector giants have targets for automation,implementation is taking place at a slower pace. Banks invariablyhave to go for automation as the competitors would overtake them,
especially, in the urban and metro centers. Further, increasinginternet connectivity and reduced rates for internet access willencourage more Personal Computer (PC) based home bankingcustomers. Limitations of banking hours could thus be overcomesignificantly.
Meanwhile, in a networked environment, the security issues assume
a critical dimension. As the novelty value of new technology fades
away, there is a possibility of in-built computer security comingunder threat. A range of issues such as hidden costs, viruses,unauthorised use of pirated softwares, obsolescence, sottwareupgradation, ensuring vendor supports and continued power supply
are associated with PC computing which need attention too. Thusthe technology implementation offers banking industry with a large
number of opportunities and threats as well. Considering the smallnumber of home PCs in India massive change is not anticipatedimmediately. It is however, anticipated that the up market customersand the NRIs will be increasingly demanding on line transactionsand transfer of information. However, in India it is a matter of time
57

and improvement in infrastructure facilities. which may hinder thepenetration of information technology to the common man's level.
How customers perceive this change is yet to be measured correctly
Being too enthusiastic about modernising technology is not simplythe reason for bringing in the change. Often, the dimension ofachieving competitor parity overrides these apprehensions. Thecosts and other factors such as applicability should also beevaluated before leaping into any decision.
b) Cultural and Social Environment
A significant dimension of socio-cultural change is the'homogenisation' of cultures. Most of the urban areas of the world
are witnessing such a transformation. This is attributable to amultitude of aspects like urbanisation, migration from rural areas,and of late, globalisation, giant strides in technologicaldevelopment, and increased mobility of people. Nuclear families,longer life spans, consumerism, and emphasis on higher education
have made financial planning in the family units a necessity. Banks
have also been able to respond to the changing needs of people andhence more or less have transformed into their financial advisors.
On the one hand, this has necessitated the need for transactional
banking products and on the other hand it has created a variety ofsavings and credit products to serve a wide range of increasingneeds of the customers.
The socio-cultural fabric has changed drastically not only in theurban areas but also in the rural areas. The most significant
dimension ofthe change has been the emergence of a large numberof middle class households with increasing affinity for acquiringconsumer goods and other comforts in life. The percentage ofmiddle class households in the population has gone up from 33.6%
to 39.5% between the period of 1985-86 to 1992-1993. The growthhas been much faster in the rural areas (26.1% to 32.1%) than in the
urban areas (from 54.9% to 56.7%) during the same period.“NCAER study indicate that 70% of color TV sets, 77% of mopedsand 65% of washing machines have been purchased by the medium
income group during 1992-93 over and above a number of otherconsumer soft goods like shampoo, tooth paste, toilet soaps, etc.”In rural areas too, a good proportion of (65.5% to 73.6%) lowerclass got upgraded to middle class status.
NCEAR survey results shed more light on the transition of ruralpopulation. The rural market was also caught by the frenzy ofconsumerism. During 1992-93, 47% of black and white TV setsand 49.5% of cassette recorders were sold in rural markets.” A
sequel to these changes is the gaining popularity of consumer loans
for such purchases. Banks made use of these opportunities byintroducing a band of need based consumer credit products. Thishas also been possible due to obvious shifts in the value systemsand attitude to life of people.
Another cultural dimension in banking is the scope of communitybanking or ethnic banking. The community banking of some oldprivate banks in India explains the influence of regional andcultural influence in banking. Community banks in UK and US also
fall back on the ethnic communities to market their product. But,
59

of late. some of the leading OPBs in India began expanding theirstrongholds beyond their geographical limits. thanks to theincreasing mobility of people that has led to the vanishing of theregional barriers. At the same time they also bank on their localfeel advantages in such regional pockets and use the marketintelligence for sound credit risk assessment. By adopting thisstrategy, they have also succeeded in building an indirect entrybarrier to competition in their domains. 24
Changes in family structures and priorities have also caused theintroduction of specific financial products. Banks are beingincreasingly relied for financial planning for the purposes ofchildren's education and marriage as families become morechildren-centric. Pensioners are benefited by various retirementplans for securing their lives. Thus, nowadays an array of life cycleproducts starting from the ones for newborns to the retired peopleare made available in the banking supermarket nowadays.
Another socio-cultural aspect in banking_that needs attention is theincreasing investor awareness about the various choices availableto them. As a consequence, a customer may demand morecustomisation and sometimes localisation in the design of financialproducts. For instance, a majority of investors based in southernIndia prefer low risk, fixed income and close proximity-driven
5 Equallyfinancial instruments due to socio-cultural reasons}relevant is the qualitative changes brought in by the process ofindustrialisation. urbanisation and information explosion. Workingwomen in the urban and semi-urban areas, professionals, teenagersand children have become the target of consumer goods marketing
60

which obviously indicate that there are growing tendencies toaccumulate material comforts of life. This may in turn increase thedemand for credit products and people may learn how to do more offinancial planning for such purchases.
Banks enjoys considerable customer support in safekeeping ofmoney, though. now, the Fls and mutual funds have made foray intothis domain of the banks. This, in fact, indicates a trend towardsinvestors tending to be more sensitive in their choice. However,these changes have not been very significant in order to make anyobvious impact on deposit mobilisation of banks.“ Unlike consumergoods which are bought by evaluating their merits and demerits,financial product purchase is image-driven. Banks reigning in thedeposit market may be due to this predominant aspect. However, thenewly induced competition in the industry is thought to givesubstantial challenge to the existing image of banks as safe havensfor the savings of people. Further, the attitude to risk relatedinvestment might vary among different social, professional oreducational groups. This, in fact, offers banks an opportunity forsegmentation. All the socio-cultural aspects discussed could beeffectively used for product differentiation and hence marketsegmentation. Hence effective use of marketing approach inbanking involves identifying possible segmentation variables anddesigning different marketing mixes to cater to the varied needs ofsuch segments.
c) Legal and Economic Environment
Banking industry in the past was constricted by regulatoryobligations and structural rigidities. Trade and industry also
61

suffered under the license-regime, the effects of which alsoreflected in the banking industry Banks enjoyed protection andcould manage to operate with low productivity for fairly a longperiod. A revamping of the system was necessitated by theunprecedented economic crisis and the exposure of the notorioussecurities scam during the period 1990-1992.
Reforms in the financial sector introduced in 1991 was a landmark
in the history oflndian banking inasmuch as it threw open the banks
to competition, aiming at achieving better quality of services,efficiency, technological advancement, attaining of the capability to
attract foreign capital by acquiring global standards and eventually
to integrate the system with the economy to enable its growth.Banks were allowed more autonomy in their operations, though not
complete freedom. With a view to enhance the overall efficiencyand health of the whole banking system, prudential norms wereenforced by RBI. These norms. related to aspects such as achieving
and maintaining capital adequacy, provisioning, income recognition
and greater transparency in the final accounts of banks and thesewere pursued with more vigour than eve_r before.
For over two decades since the nationalisation of banks in 1969, no
new banks were allowed in the private sector. RBI now permits FBs
to open more branches in the interiors, on a case-by-case approval
basis. The 1993 framework of guidelines enabled the entry of new
private sector banks too.” To compete effectively with non-bankintermediaries, banks were also permitted to undertake newactivities like investment banking, insurance, security trading, etc.
62

Banks had to shift from the traditional lines to fee-based services
and strive to achieve profitability through minimising costs. Withthe amendment of nationalisation act. state owned banks were also
allowed to access the market for raising funds from the public.which demanded greater accountability.
Infusion of competition is thought to strengthen the financial sector
and in turn help banks achieve greater competitive advantage.Moreover, the demand will also become market-driven and hence
the banks more marketing oriented. Both the productive sectors and
financial sectors will have to restructure themselves to cope with
the challenges of the market-oriented economy envisaged by thereforms measures.
d) Competitive Environment
Deregulation has paved the way for competition in the industry,also bringing with it wide scale technological development, in the
area of automation, networking and product designing. However, the
structure and nature of competition is also constantly changing.Banks will have to respond to these changes with suitable strategic
choices. Strategic planning in bank marketing thus would entailobserving the changes and deciding on appropriate strategicchoices. A detailed discussion on the influence of change incompetitive environment in the Indian banking industry has beendone in section 2.5.1
63

2. 4 Customer Behaviour Related to Banking Products andServices
Analysis of customer behaviour is an essential input in planningmarketing strategies. Consumer behaviour guides in marketsegmentation, one of the important tools in bank marketing. Thebehavioural aspects ofa bank customer are given less importance in
the financial analysis of bank products. It cannot be ignored that itis the customer who creates the demand for products and any changein these needs would affect the demand also. Customers have
different preferences and a purchase decision is effected afterconsidering the range of services offered by the banks. Thesevariations may be related to the psychological differences amongindividuals on aspects such as attitude, motives, social class needs,
culture, etc. This can be studied only with the help of marketresearch studies on customer behavior and their preference patterns.
Customer behavior is influenced by three sets of factors, viz.,external factors, internal factors, and the consumer process. Culture,
occupation, social class and geographic location are factors whichexternally influence customers. Culture is a mix of beliefs,attitudes, and ways of doing things by reasonably homogenous setof people. 23 Culture explains how and why people behave as they
do and also transcends to their buying behaviour. Education,upbringing, religious beliefs, and living conditions are the factorsthat would shape up the culture of a person. Origin of private banks
in India can be largely attributed to the needs of specific cultural orcommunal groups. Even now some banks survive only on this aspect
of customer behaviour, though, of late they have realised the need

for expanding outwardly. breaking the boundaries of their smallsegments. In the United Kingdom, not less than several hundredsmall bank branches exist. just to cater to the needs of variousethnic groups.” This aspect serves as a key factor in the overseasmarket development of Banks.
A person belonging to a particular community or cultural groupwould be more comfortable with borrowing from a bank serving the
community or that cultural group. Cultural differences are also feltin the choice behaviors of customers.” Influence of culturaldimensions on customer satisfaction was explained in Chapter 1.Cultural influences on the choice of products by Keralites have also
been discussed later in Chapter 3. Some of the very popularfinancial products had, in fact, originated in Kerala and even now in
certain parts of the state unique financial products such as'panappayattu' are in use. Similarly it has already been mentionedthat the degree of risk taking might vary among different culturalor regional segments.
A key segmenting dimension in banking is the social class to which
a customer belongs. It influences the usage pattern and attitude tothe lending instruments and deposits. People having highereducation and socio-economic status have more favorable attitude
towards credit products than others. They tend to use products like
' Attitude to saving also showscredit cards more frequently.’variations across different social classes. People belonging to lower
strata of the society tend to perceive savings accounts or bankdeposits as a tangible security shield. This may be due to the factthat education equips people to evaluate the options and thus
65

optimise their purchase decisions. However. sometimes-behavioural
characteristics might overshadow such influences. Some of theobservations that may find application in developing marketingstrategies for segmentation based on social classes are given below.
I Different social classes exist and target marketing wouldenable banks to tap the potential in such segmentsIncome need not be the most determinant factor insegmentation. Psychological differences largely remainunexplored in the Indian markets.
In the financial products marketing, the opinion of reference groupshas considerable influence on customer's choices. A customer is
more likely to share the attitude of his or her reference group. Ifinformation obtained by a customer contradicts with what thereference groups believes in, the customer will also developunfavourable attitude towards the product. Marketing people canidentify suitable reference groups to build up favourable image and
opinion. This is especially true in marketing to retail segmentswhich often look for reliable sources of information. The over
dependence of customers on image in the services industry can bebest explained by the problem of credibility of information sourcesand the intangible nature of the service. In the case of banks,studies have shown that customer choice is largely decided by the
opinion of peers, parents and relatives.”
Family plays an important role in the choice of a bank. Youngsters
tend to choose the banks of their parents. Martineau (1958)conducted a study among students opening account for the first time
66

in their life and found that ‘parental influence‘ ranked second to'location_ of banks‘ in their choice of bank.” Product needs also vary
across different life cycle stages of a family Rajashekar and Paul(1999) have found the relative importance of the choice criteriaacross life cycle segments. 3‘ Individuals in the bachelor stage(young. single people not living at home) emphasise the importance
of such criteria as 'nearness to home‘. ‘overall quality of service‘.‘reputation’. ‘ease of qualifying for free checking accounts bymaintaining a minimum balance’, and ‘fast service and being able to
obtain all financial services at one location’ For newly marriedcouples (with children under 6 years—termed as full nest I),attributes such as 'location', ‘reputation’, ‘availability of mortgageloans‘, ‘low interest rates on loans‘ and ‘good financial advices’ were
found to be the important choice criteria. For older couples,'location', ‘good financial advice‘, ‘experienced personnel‘, ‘safetyof funds‘, ‘paying highest rates on savings‘ and ‘overall quality ofservices‘ were important. The study revealed interesting attitudinalpattern among members of different life cycle stages. Those in the
bachelor stage are ambitious as their goal is to double their money
in the future and they appear to be less loyal to their financialinstitutions as it makes no difference to them whether they deal witha local bank or a new bank. Meanwhile, members of full nest I and
II stages have great desire to provide money needed by theirchildren to go to college, invest in a safe avenue with steady returns
and offering convenience and are bargain oriented. Older members
are more value oriented than empty nest 1 counter parts. Thefindings clearly suggest that bankers have opportunity in targetingthe different groups with suitable market mix variables particularly
with respect to product, pricing and location strategy.
67
Psychological Influences
Aspects such as motivations. perceptions. attitudes and beliefs arethe psychological influences. Influences of these factors may not be
obviously pronounced in the case of choice behaviours. But it mayinfluence the customer satisfaction deregulation and servicequality expectations of specific customer segments.
Motivation and Perceptions
The bank’s task of understanding the customers involves knowinghow one perceives its financial services and the overall image.Mostly people see banks as public organisations established for the
development of economy and to serve the interest of the public.People may sometimes perceive different banks as cold, arrogant,friendly, trustworthy, safe for the rich, private, public and so on.The common man is not aware of the multitude of functions of
banks, but may be more familiar with these images acquired bybanks over a long period of market presence. These perceptions can
be turned into favourable images by a bank with the help ofeffective advertisements. Different customer segments may be thus
attracted by achieving their desired service quality levc':;; and byserving their specific needs. Factors such as ambience of interiors,counter position, layout of booths and lighting can affect the waypeople perceive a bank’s image, though they need not be thedetermining dimensions. The present study focuses on the different
aspects of customer perceptions about different bank groups andtheir products. It is anticipated that the findings would give someimplications of the different strategies to be adopted in attractingthe different segments. Positioning strategies may also be used for
68

the above purpose. How positioning strategies may be favourablyused by banks to obtain the attention of specific segments is alsoexplained in section 2.4.l ofthis chapter.
Attitudes and Beliefs
An attitude is a person's point of view toward something.”lt can beabout a product. advertisement, firm or idea. Basic attitude involve
liking or disliking and they have action implication whereas beliefs
are not action oriented. Entry of NPBs and NBFCS leads us torealise the importance of market segmentations. NPBs primarilyserve such niche segments with specific requirements for custommade products. The increasing number of customer surveys toanalyse the need of customers also indicate that they have becomequite demanding about what they want. Customer’s attitude towards
speed in delivery of services and simplicity of procedures haveundergone changes over the years. Similarly, in choosing financial
products, customer's attitude to risk, returns and convenience havealso been subjected to changes. Corporate customers and personalloanees have already started showing discomfort in dealing withless efficient banks and tendencies to move over to banks or
financial institutions offering better services. Their expectationsrelate to facilities for EFT, speed in sanctioning loans, portfoliomanagement, etc. In the retail segment also there have beenindications that people are dissatisfied with the traditional servicesor prc-ducts offered by banks and may switch to others for betterservices.
69

Personal Characteristics
Personal characteristics refers to a person's life cycle stage, age,employment. s0cio—economic status and personality Some ofthese
aspects have been discussed already in the foregoing sections.Socio-economic variables such as occupation, employment status.level of education and income are commonly used in segmentation.
An advantage of computerisation in branches is that the branchbanker is able to access information about the customers at anypoint of time. The computerised branches might have CustomerInformation File module (CIF), which documents all information
about a customer that helps in cross selling of a bank's products and
branch specific customer relationship programs. At present, a fewcomputerised branches are using it, though only restrictively. 36Such information pertains mostly to the aforementioned socioeconomic ‘aspects of customers. Other variables that can have animpact on consumer behaviour are the length of residence, numberand type of financial institutions dealing with and types of accountsand time held.
The Consume.’ Frocess and Loyalty
Consumer purchase decisions are made haphazardly, though certain
dominant features might influence the choice of financialinstitutions in general. Choice of specific financial products mayinvolve a decision making process consisting of different phases
such as getting aware of the need, searching for alternatives,evaluation of the options, choice of a product and post-purchase
70

evaluation. At each stage, their information needs may also change.
Understanding the information needs of customers at these different
phases is hence essential for planning marketing communications.However. it has been observed that customers do not often seek the
finer details of schemes and services through the advertisements.
Most ofthe information required is passed over the counter by bank
personnel. Counter staff should have good product knowledge and
communication skills to take up this responsibility. The postpurchase phase is also crucial in the sense that a bank staff should
be able to provide assurance to the customers about the benefitsand reinforce their purchase decision so as to ensure loyalty of theCUSIOITICF.
Banks in India generally enjoy good patronage by customers.Despite the introduction of many new schemes, bank deposit stillreign superiority in the household savings. This clearly illustrates
popularity of banks among common people. Interestingly, products
like National Savings Certif1cates(NSC), Unit Trust of Indiaschemes(UTI), etc, though carry higher returns, have not been as
popular as bank deposits. Some banks are pat.-cnised by customers
irrespective of the service quality levels they maintain. These are a
few aspects that makes one to probe into the reasons of customer
loyalty in banking industry. From the perspective of bankersensuring customer loyalty is important for the following reasons. 37
0 Customer turnover is costly to banks as processing is timeconsuming and labour intensive, which, in turn, affectstheir profitability too.
71

0 Existing customers may help in cross selling a bank'sproducts and in doing word-of-mouth advertising topotential customers.
Fry (1973) conducted a study among university graduates to identify
banks patronised by them at specified periods before. during. and
after their time at the university.” Also questions pertaining torespondent‘s location, loan status, parents’ socio-economicclassification, etc. were included. The study made some importantconclusions such as
o If a person is non-mobile (stays in one place) the branch
coverage has effect on loyalty.
0 Prior patronage increases the likelihood of loyalty infuture.
0 Students tend to patronise the same bank as their parents.
The influence of prior patronage increases the possibility of acustomer remaining with a bank in future too. Ensuring loyalty of
present customers requires only less effort than what is required
for attracting new accounts. Traditionally three factors haveaffected the choice of banks - the distance of the bank from home.
office and shopping centers and the kind of relation that thecustomer may have with the bank. Once a bank choice is made by a
customer it is likely to remain unchanged for a long time

2. 4.1 Segmentation Strategies in Bank Marketing
Market segmentation and studying consumer behaviour are thekey pre—marketing activities. These activities will help a firm to
answer questions such as:
> What are the objects customers buy or are interested inbuying?
> Why do they buy what they buy and for what differentreasons different customer groups buy?
> How do they take the decisions and who all will influence
the process?
> What process does a customer uses to buy, especially thecorporate customers?
> At what occasions and with what periodicity they buy?
> And from where do they buy‘?
An overall market consists of several different market segments and
each represent an opportunity. Market segmentation allows. thestrategic planner to prioritise segments and consequentlyopportunities to achieve a differentiation in those segments.” Anysegment identified should then be measurable, accessible,substantial and defensible. Segmentation is done by identifying the
variables that can effectively divide the heterogeneous market intosmaller markets.
73

Figure 2.2
segmenting Dimensions in Banking
4:
CustomerRelated
L
Demographics
4
Scgmcntin gDimensions
NeedsAttitudesActivitiesInterestsOpinions
J}
Situationrelated
J: Jr
Benefits offered(may be product
features)
Consumptionor Use
PatternsBrand
FamiliarityBuying
Situation
lGeographic
iAll others , i. e.,
Age. Sex,Family Size.
Income
Source: E.Jerome Mcarthy, Andrew A Brogowicz and John F GrzmpotTeachers '3 manuelfor Basic Marketing, lllinoust Richard & Irwin, 1978
74
Figure 2.2 presents a general picture of the segmentationdimensions that may be used by banks for target marketing.However. there are different dimensions which may be effectivelyused in market segmentation. A few important dimensions arediscussed in the following sections.
There are basically three approaches to segmentation, viz., based on
social class. geographic, and demographic characterisitics ofcustomers. Geographic segmentation refers to a firm programmingdifferential products and services for people living in differentgeographical areas. For instance, in banking markets may bedivided as urban, semi-urban or rural areas and treated differently.
A good example of this differential treatment for differentgeographic regions is the NR1 services of some banks in India,which went to the extent of hard copies of e-mail messagesreceived from the customer abroad to his rural home. Similarlyvalued customers in rural areas may get very personalised services.Urban customers are offered diversified services like payment ofutility bills through their banks.
Social Class
There are perceptional differences across the social classes also.The relationship between save-spend behaviour and social classexplains that the higher the social class higher will be the savingsaspirations and that lower socio-economic groups show morespending aspirations.” Their spending aspiration refers to theattitude of ‘buy now, pay later’ while the higher income group has
75

the tendency to postpone their purchases. Berry (1969) classifiedvarious social classes according to their perceptional attitude intheir financial outlook.“ He has given the following classification.
0 The ‘sophisticated investor‘ - belonging to upperclass or upper-middle class.
0 The ‘time consuming‘ segment — belonging to uppermiddle or middle class.
a The ‘caution first‘ segment - belonging to lowermiddle class.
0 The ‘rainy day’ segment — belongs to lower-middleclass - lower class.
Low-status groups go for savings account, which is more tangible
and offer instant liquidity while those belonging to the high-statusclass will be more interested in ‘investment', which involves somerisk and long-term commitments, but higher returns.
A segmentation approach based on social class hence would require
collection and updation of information about customers and theprospects. The whole process oftracking down customer knowledge
thus needs plenty of initiative from the bank personnel and ampleinfrastructural support. Further, the marketing strategies would vary
widely from product to product and customer to customer.Profitability is achieved only through a prudent and efficientmanagement of marketing a variety of products and a host of otherspecialised financial services to different customer segments.
76
Buying Situations
Buying situations may be used at a preliminary stage for definingbroader markets. The private moneylenders have effectivelytargeted the 'contingency' loan seekers though the ethical issuesremain to be sorted out. Banks sell products basically to individuals
and business customers in different buying situations. The segments
trade. industry (medium. large. small and micro). professionals, self
employed people. etc may require financial assistance for theirvarious activities like, project implementation, regular productionor day to day business operations, purchases. packing, exports, etcfrom time to time. Information on different buying situations is very
essential in responding to such specific needs of customers indifferent buying situations. Banks widely use this as a basis oftarget marketing.
Cross Sagmontations
Certain segments in the household banking sector are considered to
have significant influence on the segmentation approaches of Indian
Banks. These segments are shown in Figure 2.3. These have beenevolved through several discussions with a wide number of ‘(makers
and customers. 43 However, they are quite known to all and some of
them are being already served differently by various financialservice firms. A detailed description of these groups, however, isnot given here. Each group has a specific set of needs related totheir age, occupation, or motives. Directing the marketingcommunications to these segments may be relatively easy too. That
may be the reason why such segments look more attractive tobankers for target marketing.
77

Figure 2.3Market Segments in the Households Banking Sector
Emerging Ma1l\'el Scgnicnls(I louschold Banking Sector)
Senior’ Clll/.CnS
Students
J Domestic Tourists
Working Women
InvestorsH Community
HousewivesN
Defence PersonnelI
Young Salaried$ People
Source: Rajeev. K Seth, Marketing of Banking Services, MacMillan lndia.New Delhi. 1997
To effectively target market to these segments a branch officeshould be equipped with customer knowledge management system.
computerised or manual, as a part of this general managementprocess. The researcher has culled the observations and
78
generalisations from various research studies on the characteristicsof Indian consumer in the retail-banking segment. As such, there is
no comprehensive database from which such information can bedrawn. An important source would be the study conducted byNIBM in [986 and the periodic surveys of NCAER. The NIBMstudy had collected data on savings patterns. motives. reasons.preferences. non-saver‘s opinion and several other issues. The result
of this study is still being held relevant by bankers for takingimportant decisions, though it is a little out-dated now.” A fewconclusions of the NIBM study are presented below. Therespondents were drawn from urban areas of Bombay.
0 Eighty percent to eighty five percent of bank saversare either professionals or workers. A large section of
production workers are untapped by banks.
0 Seventy six percent to eighty seven percent ofinvestments in financial assets by non-bank savers go
to instruments like post-office savings, LIC, PPF. chitfunds etc.
0 Most important reasons for saving amongst banksavers are provision for emergencies, provision forold age and marriage, in that order.
0 Suitable location of a bank branch and quality of itsservices are the two main criteria for selection of bank
by bank savers.
0 Foreign and Gramin banks have an edge over publicand private sector banks in terms of quality of servicethey offer.
79

Thirty one percent of respondents expressed that thesystems and procedures of banks should improve, 28%
said that customer service should improve and 18%wanted new and better services.
9% of respondents had closed a savings account due toinsufficient funds and unfavourable attitude of bank
employees.
The institutional investors were more demanding ingetting quality of services and speed of delivery ofservices.
Rural segments exhibited strong preference forinvestment in physical assets, especially in farmassets.
About 84-86% of rural customers were satisfied with
the services, though they also thought it shouldimprove.
Ninety five percent of rural people had invested inbank schemes compared to 68% of the urbanpopulation.
Rural people were more interested in the quality ofservice rendered by Gramin banks than higherinterests elsewhere.
Misri (1998) in his recent assessment about banks and branding is
that consumers primarily choose a bank on the basis of its ownattributes rather than for its various products and services.“ Studieshave also shown that Indian customer associates a bank primarily
‘savings‘ needs.” More than 70% of respondents
80

associated only three generic services with a bank a savingsaccount. a fixed deposit and a current account. It was also proved in
the above study that about seven years of product branding had very
little impact on customer perception.
A study sponsored by American Express Bank showed that animportant aspect that prompted Indian customers’ banking decisionwas the trust they had in a bank and the integrity ofcommunication in the advertisements. It is the image or name ofthe
bank than the product features that attracted the customers.Research respondents also pointed out that they often failed tounderstand the claim of higher interest rates and other advantages of
the banking products and services in advertisements and they were
also skeptical about such hyped up claims.“ The threat of bankfailures have made them more cautious in their investment choices.
Another study among 10,000 credit card holders came up with thefollowing observations"
0 65% ofthe cardholders were unaware of the rates levied or
the methodology used for interest calculation and found ittoo complex.
0 Majority of credit card holders belonged to the age group of25-35.
0 Credit cards were mostly used for travel or entertainmentand for purchase of consumer durables.
o Eighty percent reported that the interest rates were high.
0 A large proportion of the cardholders did not know thedifference between a credit card and a debit card.
31

Sophisticated financial products might take even more time tobecome popular in Indian financial markets. The huge consumersupport to bank deposits tell us how inclined the customers aretowards ‘vanilla‘ investments with just higher interests involving
little or no complex calculations to be done by the customer beforepurchase.
Segmentation themes vary widely as seen from the elaboration onthe aspects in the foregoing sections. In banking, finely tunedsegmentation strategies are not needed, though several product and
service segments are possible. A multiple segmentation strategy isthe one mostly used, though, obviously, some segments overlap incertain cases as mentioned earlier. An easier way to segment themarket is to identify the very basic needs of all the customers ofbank in a particular market area and group it on the basis ofdemographic characteristics. If common dimensions are removedfrom each group, segments with heterogeneous characteristics canbe identified. Banking needs thus identified mostly include thefollowing 43:
Financial security0 Convenience.
0 Quick and friendly service.0 Low loans rates.
0 Hassle free loan process.0 Personnel service
0 Investment counseling.0 Retirement advice.

o Credit availability
0 Ample car parking in bank premises
0 High interest savings instruments.
0 Prestige service.
This. however. is only a general list though fairly adequate.Clustering techniques is highly effective in grouping customers intodifferent clusters with similar characteristics. Discriminant analysis
is yet another method in which standardised discriminantcoefficients of a set of variables are used to separate two groups of
customers showing different or opposite behaviours. The presentstudy concentrates more on the positioning of products or services.
Positioning refers to the perceptional relationship of a firm and itsproducts and services to its customers. Management’s goals andstrategies will depend on the existing positioning of the firm’sproducts. Positioning is highly relevant in product differentiation.An earlier attempt in this direction is the one used by Velverde indifferentiating the four popular Fls, viz., American Express,Prudential, Morgan Guarantee Trust and Money Market Funds. 49
83

‘J .:lm:-added
Low
Figure 2.4
DUSIIIOIIIIIQ N1.-Hr.‘
Positioning of Banks-An Illustration
MINK 5;‘5
‘«.
\‘
l
V. LION.a‘.~..;~J
(American Emressl
MULE
lMoney Martel F undsl
HORSE
(Prudential)
Ellen! or Product Line ‘-‘v'-L18
Source: Nelson Valverdc. ‘Developing Profitable Strategies that don't
Box You in’, Bank Marketing, June 1983. pp.l-16
Indications ofthe Positioning Matrix shown in Figure 2.4
Strategy
MINK (Narrow line/high value added)
LION (wide line/high value added)
Key factors for success
Exclusive, specialty image, unique or high
quality products. High piicc/high margin.
Personal service/advice and expensive
presentation.
Leader "class” image.
Creative marketing
High price/high margin
Personnel service, powerfiil, aflluent
presentation
84
C ontd.

C onm.
MULE (narrow line,’ Value conscious. consistent image.low value added) Mass marketing. Low price- low margin.
Non-personal or self-service. Non
difierentiated. identical
presentation.
HORS E (wide line/low value ‘Good Buy’. Convenient image
Added) High volume, economies ofscaleLow price-low margin. Low or
selfservice efficiency of
operation presentation.
The bank attempting a high value added and a wide product linestrategy is positioning itself as :1 Lion i-. the industry, whichrequires the bank to take up a ‘leadership’ image in the industry byoffering personnel service and powerful affluent presentation. Theaggressive position of American Express is the result of thisstrategy
Banks should identify their positions and shape up and control theperception as a consistent part of its strategy. The task facing thecompetitive banks is to decide whether to position themselves aschallengers to the leader or as specialists in ‘niches’ which are toounattractive to the leader. Less dominant banks may resort toexpensive promotional efforts. lower prices, and thus ensuringadded value than the leader. In effect most challengers enter intoprice-based competition unless their products are unique. Thus it isessential to understand their relative position in the market placesince consumer’s decisions about the products and services areinfluenced by such images.
85
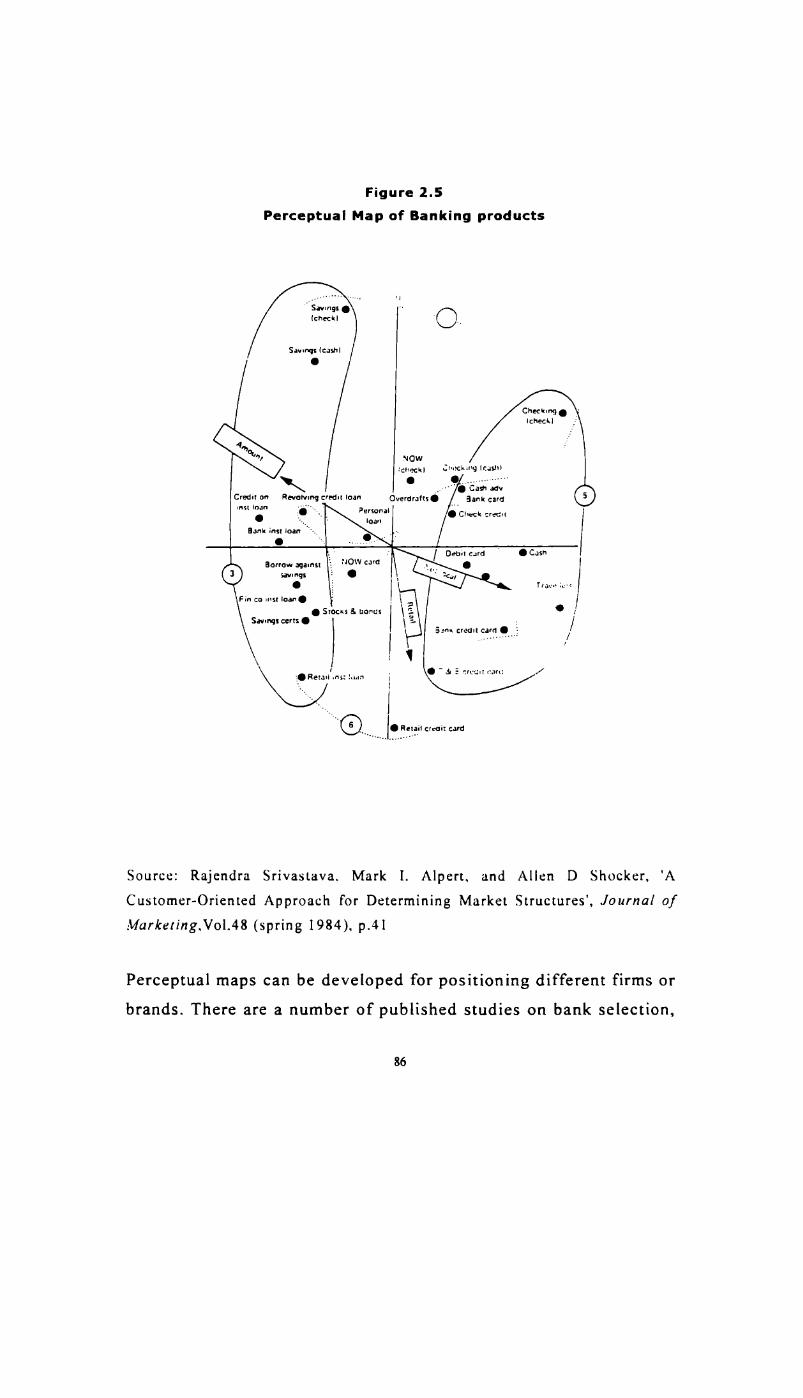
Figure 2.5Perceptual Map of Banking products
..
Savings (cash!0
NOW
;c,,,_.c“ .2:--.~cL.ng (cash)
. .......... -Q Lash advCredit on Revolving credit loan Q,,e,¢,_-mg. gank “,6
mm "3" P*"°"“| . Check :r=-cur' loanBank inst loan . _ ..
_ ' 5 / Debit card C C-IS"Borrow against ‘-_ "ow ""1 ,u_( _ Qsavings . ' =c,,,. l'ra\.~-- i,_--:Fin cu msr loan. I. Sroc-cs 5. none; _ . :Savmqs certs O ._ /
/
Source: Rajendra Srivastava. Mark I. Alpert, and Allen D Shocker, ‘ACustomer-Oriented Approach for Determining Market Structures’, Journal ofMar/ceIing.Vol.48 (spring 1984), p.41
Perceptual maps can be developed for positioning different firms or
brands. There are a number of published studies on bank selection,
86

which may help in developing the criteria for mapping theperception. But. the relevant set of criteria may vary for differentsegments of bank customers. A list of attributes frequently used in
positioning is given in the Table 2.1
\O®\lO\ J>L»JlJ>—
Table 2.1
Bank Attributes Frequendy Used in Positioning
. Free Checking service. Drive-in service
. Bank statement service
. Mail service
. Competent teller service
. Competitive interest rates
. Bank Hours
. Friendly, helpful personnel
. Convenient Location
and parking
10.
11.
12.
13.
I4.15.
16.
17.
18.
19.
20.
21.22
Best saving ratesInterest in me as a customerFirst with new services
Offers a greater variety of financial servicesTrust servicesBank for families and individuals
Bank for small business peopleBank for medium and small business
Bank for large business
Modern buildingsEfficient bank employees
A progressive bank. Speed of service
Source: Compiled from various journals
Lo.) . Recommended by liiends. Reputation. Availability of credit
. Service charge on checkingaccounts
. Overdrafi privileges on checkingaccounts
. Full-service firm
offering parking. Hours of operation. Interest payment of savingsaccounts
Special service for youthsSpecial service for womenNew account premium or gillsA large growing bankA very conservative bankDoes a lot of advertisingBar:k's advertising is interesting
Nruloru0‘Ln-J=
31.
32.
33.
34.
35.
36.
37.
3 8. Advertising tells me the bank wants me39. Has the best bank management40. Interest in helping our city grow41. Makes it easy to cash checks42. Auxiliary banks service43. Personalised service
87
Today. sophisticated analytical techniques such as MultiDimensional Scaling (MDS). Economical Discriminant Analysis or
Factor Analysis are available to produce the compositerepresentation. How a bank is placed in consumer's mind isobtained from such maps. which will help in strengthening thecurrent image or repositioning it in the desired way. A detaileddiscussion of the methodology is. however. beyond of the scope ofthe discussion here.
2. 4. 2 Service Quality Dimensions and Measurement
Among the Indian bank customers, especially, among corporatecustomers, there is an outcry for improvement in quality of service.In all the. service oriented industries it is now felt that there is an
increasing tendency to please the customers. Service quality isconsidered a f'irm’s competitive edge over its rivals in the markets.In banking it is particularly relevant due to the complex nature ofthe products on offer. It was also evident from the conclusions ofthe earlier studies presented in the earlier sections that a great dealof attention need to be spared in the area of service qualityenhancement in Indian banks. But it would be possible only if anevaluation of the current level of service quality is ascertained.Equally important is the measurement of customer’s expectations of
quality levels.
Initial exercise in this direction may involve the identification ofthe dimensions or aspects that are relevant to the measurement ofquality of service and the development of a suitable scale formeasuring it. Suitable instruments can be developed with the help of
88

several statements representing the dimensions identified in thefirst step. Parasuraman et al ([988) has developed a comprehensive
instrument to measure the service quality applicable to allindustries. which is known as SERVQUAL50 The context ofstatements can be adapted to the respective service area served by
the firm under study The following principles may be kept in mind
when developing such quality measurement instruments."
1. Service quality is more difficult for the consumer to evaluate
than the quality of a physical good. It is important to identifymeasurable dimensions or to state it in measurable terms.
2. Service quality is based on consumer’s perception of the outcome of the service and their evaluation of the process bywhich the service was performed, knowing customerexpectations and also customer knowledge management isparticularly relevant in this context.
3. Service quality perceptions result from a comparison of what a
consumer expected prior to the service and the perceived levelof service received.
Consumer’s expectations are influenced by advertisements and their
image perceptions. For instance, an economy oriented service firm
cannot project a ‘high quality’ image since it may drive away thecustomers who might take it to be a ‘high price’ firm. Customersmay search for information when they become aware about a need.
They would use information from their experience and
89

recommendations by others, especially in the purchase of serviceproducts.
Services tend to be high in experience and credence qualities. while
goods tend to be high in search qualities.” Search qualities areattributes that consumers can evaluate prior to purchasing a service
or good. Experience qualities are attributes that consumers canevaluate only during or after the consumption process. Credencequalities are attributes that consumers have difficulty in evaluating
even after the consumption is complete. Service quality perceptions
about a product vary from person to person and so is the evaluation
of the same. However, customers can provide valuable information
concerning the process by which the service is performed. Internal
measures like transactions done per hour, time taken for processing,
etc are also used for measuring service quality, though, customer'sevaluation is much superior to internal data. Customers are able togive comparative information. Consumers evaluate five dimensions
of services quality.” These are:
1. Tangibles-refers to the physical facilities, their equipment,
and the appearance of employees.
2. Reliability—is the ability of the service firm to perform the
service promised dependably and accurately.DJ . Responsiveness—is the readiness of the staff to help the
customers and provide prompt services.
4. Assurance-pertains to the knowledge and courtesy of thecompanys employees and their ability to inspire trust andconfidence in the customers toward the service provider.
90

5. Empathy-is the caring, individualised attention the servicefirm provides each customer.
The aforementioned SERVQUAL instrument consists of statements
reflecting these five dimensions of service quality The abovediscussion mostly pertains to general applicability of service quality
dimensions and its measurements in service industry. An aspect that
may restrict measurement of service quality using a standardinstrument is that different bank groups like PSBs, OPBs, NPBSand FBs are not operating on a level playing ground and that itmight yield unrealistic observations. But in marketing of a banks‘services, customers’ needs are more important and they need not be
aware of the limitations a bank may have.
The first ever study to evaluate quality of customer services inbanks was done by NIBM in 1974 and later in 1984.54 Both theses
surveys used wide sample designs. Data were drawn from Bombaycity only to ensure uniformity of the sample, for a meaningfulcomparison. A number of service quality aspects with respect todelivery of services were measured. The results are presented inTables 2.2 to 2.9.
Table 2.2Time Taken to Deposit Cash and Obtain Receipts
Percengge of Rmpondents TakingYear of Less than 10 10-30 Over 30 TotalSurvey minutes minutes minutes
1974 72 24 04 1001984 84 16 00 100Source: Vikalpa, Ahmedabad, July-September 1990, pp. 23-29
91

Table 2.3Time Taken for Collection of Local Cheques
l Year of Percentage of Respondents takingStudy l minute 2-3 minutes Over 3 Total
minutes1974 19 67 14 100T6§4 05 86 09 ' "10o t
Source: As in Table 2.2
Table 2.4Time Taken for Collection of Outshtion Cheques
Year of Percentage of Respondents TotalSurvey Takingless than 15 more than 15minutes minutes1974 89 1 1 100
1984 91 O9 100Source: As in Table 2.2
Time Taken to Obhin a New or Renewed Fixed Deposit ReceiptTable 2.5
Year of Percentage of Respondents takingéSurvey less than l 15-30 over 30 Total
15 minutes M minutes minutes‘1974 43 ‘P 33 24 100I? 1934 I7 ' 68 15 l00I
Source: As in Table 2.2

Table 2.6Time Taken for Encashrnent of Fixed Deposits Receipts
Year I Percentage of Respondents Totalof takingSurvey less than 15 15-30 over 30
minutes minutes minutes
1974 43 33 23 1001984 10 47 43 100
Source: As in Table 2.2
Table 2.7Time Taken to Purchase a Bank Draft
Year Percentages of Respondents Totalof takingSurvey less than 30 30-60 Over 60
minutes minutes minutes1974 57 26 17 [001984 75 14 1 1 100Source: As in Table 2.2
Table 2.8Tune Taken to Receive Remittance Through Telegraphic Transfer
Year Percentage of Respondents Totalof takingStudy . ' 2-3 over 31 mmute ; . .I mmutes mmutes1974 75 | 16 09 1001984 02 : O5 93 100
"2Source: As in Table 2.2
93

Table 2.9Attitude and Efficiency of the Staff
Source: As in Table 2.2
The statistical analysis of the data showed that the followingbankingCUSIOITICTSI
services have improved in the perception of bank
Year Number of complaints regarding | TotalofSurvey Misbehaviour Errors DelaysI974 12 36 52 l00I984 26 33 36 100
> Time taken to deposit cash and obtain receipt.> Time required for collection of local cheques.
> Time taken to issue or renew a fixed deposit receipt.> Time taken to purchase a bank draft.
The service dimension that has not improved or deteriorated is thetime required for collection of out station cheques and those on the
decline are time taken to encash a fixed deposit receipt and timetaken to receive remittance through telegraphic transfer.
Using decrease-in-time-taken to interpret quality levels seems to be
inadequate, as it does not consider the other important qualitydimensions. Table 2.9 indicates that attitude has not improved butdeteriorated. The study concluded that services improved in that it
protected the banks’ promotional interests, but customer orientation
in real terms did not improve.
94

Another study to assess the quality of services in public sectorbanks was done inl997 55 The parameters or methodology used are
not available. The study results are presented in Table 2.10. On thewhole, the findings of the survey showed that none of the banks‘consumer service was rated below ‘C’ viz.._ equalent to a rating of50 or more points out of I00.
95

Table 2.10Customer Satisfaction in Public sector Banks -Survey-1997Banks Norlhem Eastern North
EasternCentral Western Southem
Allahabad Bank AAndhra BankBank of BarodaBank oflndia >>>CD
Bank 0 I‘Maharzmhlra
>>>>:1 F233 (‘$375351 >>>>>
AAB
Canara BankCentral Bank ofIndia
>3: SW 35> U337 >33 >>
Corporation BankDena BankIndian BankIndian OverseasBank
>>> (‘.0-‘JESS >>>>
Oriental Bank ofCommerce
3* >UJ>> 3 >W'CUC3 ('3 CD > > >>>>
Punjab & SindBank
0 >
Punjab NationalBank
> >
State Bank ofIndia
ID > >
State Bank ofBikaner & Jaipur
‘CD
State Bank ofHyderbad
>
State Bank ofIndore
>
State Bank ofMlsoreState Bank ofPatiala
> >
State Bank ofSaurastra
>
_.S‘tate Bank ofTravancore
3*
Syndicate BankUco BankUnion Bank ofIndia
>>> >>>
United Bank ofIndia
U! > >U7> >
Vijaya Ba.nk >
A: 75 Rating Marks and above.B: 60 Rating Marks.C; 50-60 Rating Marks.Source: As reported in [BA Bulletin, Special issue, March 1997, p. 127
96

There has also been various committees appointed by the RBI tolook into the issue of service quality in banks. This is elaboratedseparately in sections 2.6.3
These recommendations were certainly instrumental in bringingabout a qualitative change in customer services in banks. In onesense, such changes were much needed to attain efficiency andglobal standards as envisaged by the process of liberalisation andderegulation. The frenzied adoption of IT solutions is also a part ofthe quality improvement efforts. Role of [T in service qualityimprovement is also discussed in detail under section 2.4.2.1.
Dimensions of service quality in banking need to be spelt out more
specifically using relevant parameters. Aspects like accessibility,cost, returns, speed, choice, product range, staff knowledge,flexibility, operational convenience, technology, courtesy,punctuality, accountability and several other factors can influencethe quality thanks to the varied nature of services and wide varyingnature of customers. Besides, quality may also be evaluated in terms
of how specific services are delivered. Service quality initiativesare constantly being developed in the financial service sectors.Lewis (1993) defined and summarised various definitions,determinants and measures of quality with reference to financialservices.” Another study suggest that there are seven elements ofcustomer service that should be investigated in the financialservices consumption time, professionalism, waiting time,courtesy, attentiveness, accuracy and ability.” Some studiesconfirm that individuals find waiting time in queues unacceptable
97

and as a reflection of poor service quality.” Computerisation hashelped in improving the quality of service by speeding up theprocess. This is particularly relevant as the new players deliberately
try to be different in these respects in order to 'skim‘ the market.The customer will perceive these factors as a composite experience
to draw the quality level. though weightages assigned can vary from
customer to customer. Hence. bankers cannot afford to ignore anyone segment. Service quality upgradation is possible only with the
concerted effort of employees at all levels. The initiatives taken by
RBI in issues relating to functional autonomy, better incentives,skill upgradation of employees and removal of bureaucraticrigidities are essential steps in achieving comparability with NPBSand FBs.
The public sector banks lack the infrastructural facilities to providethe right environment for employees to contribute towards qualityimprovement. The task of improving services in organisations isalso a complex process. The bank must be very certain about whatto do on multiple fronts such as technology, service systems,employee selection, training and education and development ofappropriate reward systems. the firm will derive much benefit from
building up an effective service quality information system. Such an
information system will take up the activities as explained by themodel shown in Figure 2.6.
98

Figure 2.6Service Quality Information System
Encourages andenables management to
incorporate the voice of thecustomer into decision-making
Reveals customersService priority
Identifies serviceScrvifie improvement prioritiesQuamy _ and guides resource[f‘f°”m“‘°“ allocation decisionsSystem
Allows tracking of company& competitor ‘s serviceperformance over time
Discloses the impact ofservice quality
Offers performance-baseddata to reward excellent service
and correct poor service
Source: L.Beny, On Great Service: A Framework for Action,Free press, New York, 1995, p.37
Complaint processing, market surveys, employee field reporting,employee surveys and service operating data capture are somemeans of getting such information. The most important aspect isusing the data on customer and service-processing details incomputer to design value-added services.” Whether computerisation
in banks has helped them in achieving higher levels of efficiencyneed to be evaluated objectively. The next section discusses thoseaspects.
99

2.4.2.1 Role of IT in Service Quality Development
In the West. it was the advent of computers and ATMs that caused a
revolutionary change in quality levels or distinctly changed the face
of banking. In India PSBs are trying to catch up with NPBs andI-‘Bs. through complete automation and networking, though the pace
is very low. The recent recommendations of Vasudevan Committee
on ‘Technology Upgradation in the Banking Sector‘ (1999) insisted
on the need for computerising all branches of banks dealing withgovernment transactions.“ A number of other recommendations on
aspects like data security, data warehousing and data mining (totrace individual customer databases) and development of MIS were
also laid down to strengthen the on going process ofcomputerisation in Indian banks. The unions opposedcomputerisation in banks in the initial stages. The historicagreement signed between Indian Banks‘ Association (IBA) and the
trade unions in 1993 marked the beginning of the process of rapid
automation. Now, there is a conscious attempt to bring down theresponse time by cutting delays using ALPMs (Automatic LedgerPosting Machines) and computers in a big way. But, the full utilityof such automation have not reached the customers. New breed of
services like ATM, Telebanking, home-based PC banking, customer
terminals. anywhere banking, etc offer multiple benefits tocustomers. mainly tremendous convenience to customers.Computerisation of a branch, however, has now focused mainly onfront-end transactions or the customer related activities. The NIBM
study looked into the attributes affected by computerisation.Customers felt that pass book updating, availability of information
100

on customers account, regular updating of balances. clarity of passbook entries and time to issue cheque books improved aftercomputerisation. though speed has not improved. Branchcomputerisation. however, did not progress as envisaged. The key
objectives of the whole process were reduction in waiting time,provision for value added service, making available large span oftime for transacting business and provision of single windowservice at branches have not yet fully materialised.“ There is adifference in efficiency between computerised and noncomputerised banks, which might lead to gradual weakening of less
efficient banks. Similarly less efficient banks can drag the speed of
computerised branches taking into account the fact that a customerdo not belong to only one branch. Hence, in the absence ofnetworking, a computerised branch constitutes a moribundinvestment.“ Banks have not been able to reap the benefits ofbranch automation as yet, due to the aforesaid reasons. Simplyconverting a manually operated branch into a fully computerisedbranch without networking will not bring in the expected results.More importantly, automation had little impact on the attitudinalaspects of service delivery. However, there are encouraging signsgiven by the introduction of seven days banking, 24 hours banking,
and ATMS by PSBs and OPBS in selected urban regions. ATMS in
particular, are capable of transforming the traditional conceptsconnected to banks. FBs and NPBs are miles ahead in setting upATMs and internet banking services. The idea of transactingthrough ATMs has not picked up as expected in the mass market.
In the West, IT was introduced into the industry at a time in the1980’s when banks were at the verge of a collapse attributed by the
lOl
increasing tendency of disintermediations. Technology was not just
seen as an aid to speed up processing and reduce losses. but as anopportunity for innovation in service delivery Adoption oftechnology was also done very objectively by looking into thefeasibility aspects. Though ATMs were widespread. novel schemeswere introduced to attract customers back to banks for generating
more business. Effective MIS helped the banks in getting completeinformation about a customer and eventually to cross sell the otherproducts. In India, the compartmentalised approach incomputerisation has been responsible for the unfeasible state of the
gamut of operation. But, of late, it has been identified that only acomplete or almost complete networking of the banks will bring the
desired and tangible benefits. Unless there is a bank-wide digitalnervous system and interconnection among the branches, financialtransaction cannot be online and service quality aspects will not befully satisfied.“ Moreover, partial automation will invite securityproblems and tracing of the frauds will become almost impossible.The central vigilance commission that looks into the possibility of
frauds insists that banks must computerise at least 70% of theiroperations by 1“ January 2001.64
It is too early to evaluate the impact of bank automation and otheronline facilities like ATMS and internet banking as the practice has
not become very wide except in metros. This remains the exclusive
domain of the ‘class banking’ category of customers. But it isexpected that customers’ expectations will rise further, especially,with regard to EFT and speedier delivery of services. Some specific
strategies for improving the quality of customer services that can beconsidered are
102

0 Designing products to suit the needs of customers.
0 Continuous efforts to improve the product and quality ofinteraction with the customers.
0 Faster adoption of technology keeping in view theconvenience of customers. Orienting employees to adapt totechnology transformation.
0 Providing value added products through the use oftechnology and providing speedy and efficient paymentsystems.
0 Networking all the branches and developing suitableManagement Information Systems.
0 Improving work culture and making it more customeroriented.
0 Focusing more on preventing complaints than treating it.
2. 6 Evolution of Banking in India
Banks in India have also shown the capability to absorb changesalong with time, however, not in the scale of what happened in theWest. Banks here are emerging from a multitude of issuesentangling them, which require a discussion at length. A briefchronological account of the process of transition of Indian banks
from early periods to date is given below.
The origin of banking in India dates back to Vedic periods. Vedicrecords between 2000 B.C and 1400 B.C have several references to
taking and giving of credits and even prescriptions on interest ratespermissible in different cases. Banking flourished in the pre
103

independence era mostly serving the business and industry. Later. in
the earlier years of the post-independent period banks were lessaccessible to the underprivileged. Commercial banks patronisedwholesale banking and small accounts were not favoured due to the
operational costs involved. The credit need of the weaker sectionswas at the mercy of cut-throat money lenders. This had invitedsocial controls to be imposed on these banks and supposed to have
brought historical changes in the banking industry The banksunderwent a period oftransition consisting oftwo distinctive phasesas detailed in the sections given below. The characteristics of all the
three phases after the independence have been discussed.
Pre-Nationalisation Era (up to 1969)
This period is characterised by strong accounting orientation, rigidrules, limited choices, and dominance of security requirements overcustomer's needs. Each transaction was meticulously recorded andmaintained. Banks were few in numbers and mostly concentrated intowns. Till the mid seventies at least 63% of banks were located in
towns with population above 25,000. Business prospered in spite of
this inward looking approach, which would appear to be archaic and
orthodox according to today's standards. The banker had sharedclose relationships with a few customers showing traces ofcustomer-centrism right in those times. For the very same reasonthis period is also known as the class-banking era. The banks hadnot yet started penetrating the masses until 1969, which marked the
beginning of a new era. The nationalisation of banks placed moresocially oriented responsibilities on banks.
l04

Post Nationalisation Era (1969-1980)
During this period the services of banks were extended to weakersections and small industries. Regional disparities in creditdisbursals were rectified. The riding interest of this period was thatthe money needs of neglected sectors has to be protected from theprofit motives of private moneylenders and thus the controlmechanism was made comprehensive and rigorous. In order to reach
the rural areas public sector banks went on a branch expansionspree, reaching even to the remotest corners. The size of such mass
marketing efforts of the banks in India is considered to be the most
extensive ever undertaken by any country in the world. Banks stillheld the seller's viewpoint. Reaching out to the masses never meant
that customer needs were identified or products were shaped to cater
their needs. The banks had a set of product offerings evolved bythem and the selling terms were to fall in line with the regulatorycontrols of government agencies. But, the customers were gettingexposed to organised and regulated ways of banking for the firsttime in their life. Whatever they could ‘buy’ was what the bankscould ‘produce and sell’ The bank services were to be considered asa favour extended to such sections. The basic attitude towards
customers remained the same regardless of urban or ruraldifferences. When compared with the urban-focused expansion in
the West during the same period, the rural banking here could beexemplified as banking sector serving the larger interests of thesociety.
The banks in the West indulged in money-making interests. Theyhad to be reminded quite often about their ideal and expected
105

roles in the society. In India the social development objective wasrealised through strict interest rate regulations and by imposing onbanks adherence to norms set by RBI. The rural banking focus.however. does not imply the presence of marketing orientation inunderstanding the customer's perception or needs and complainthandling are concerned. Target based performance obligations ofbanks provided little flexibility for branch managers to experimentwith innovations. But irrespective of segments served, any businesswill have to identify its customers’ needs and change.
There were predictive signs of banks turning into marketingdirection in this era too. In fact, the loan products like IntegratedRural Development Programme (IRDP) was an innovation. This was
also extensively marketed. The thoughtless expansion of banks had
to be checked owing to unviable operations of certain offices. Itbecame inevitable that only a reorientation of the activities tostrengthen the existing offices would help in tiding over theproblems. Banks were slowly shifting their focus to strategicplanning which also involved a few elements of market planning.
Bank Marketing Era (1980- till date)
The realisation that the banks cannot be run like ‘conducting anoffice’ and that the business need to satisfy its customers to survive
and grow, has come to stay. This by no means imply that ruralbanking blocks the growth of banks or prevents them from becoming
market oriented. Each segment of the bank's market needs specific
strategies to serve their customers and to retain them. If, in theearlier period stress was on deposit mobilisation and growth of
106

assets. which is indicative of growing in ‘size’, the latter phase paid
more attention to bottom line performance. viz.. operationalefficiency, financial productivity, profitability and customersatisfaction. The reforms introduced in 1991 was a watershed
development in the banking industry.“ Interest rates were partiallyfreed and banks were offered more flexibility in the area ofoperations, branch expansion, and technology adoption. Besides,several initiatives for streamlining the operations of bank such assupervision. debt recovery, priority sector lending, etc were alsotaken. This apart, the entry restrictions on private banks and foreign
banks have also been loosened creating a highly competitiveenvironment for all banks. To understand the extent of market
orientation required in today's environment it is essential to studythe nature of competition. An in-depth analysis of the competitiveenvironment of Indian banking industry is done in the followingsection.
2.6.1 Post-Reform Competitive Environment in the Industry-Anoverview
Competition is not harmful to the players in the industry. It widens
the market, motivates the players to innovate and improve, enlarges
the product mixes, enables offering of products at competitiveprices, and hastens introduction of new technology and productdevelopment. It is not without disadvantages, though as it mightlead to unhealthy price wars. Besides, it is quite possible that fastrates of new product development might cause faster obsolescence
and target or niche marketing might push up the cost of marketingdifferentiated products to various customer segments.
107

Banks have to be seen as a part of the large financial system. Forthe very same reason competition in the financial markets assumes a
different dimension. According to Porter (1985) competition in an
industry is rooted in its underlying economies. and competitiveforces exists that go well beyond the established combatants in a
particular industry The five key forces are potential entrants.competition within the industry, suppliers. substitutes. and buyers.“
In India, the entry barriers to new banks have been alreadyremoved. Also, restrictions on existing organisations diversifyinginto banking services no longer exists, which may contribute tointensification of competition. Competition among substituteproducts would be a critical aspect in evaluating the intensity ofoverall competitive environment. For instance, post offices deals in
money transfer by telegraphic transfer (TT) and have also havedeposits scheme like banks. Corporates raise funds by usingcommercial papers instead of taking loans. All these raise threat tobanks, in lending as well as borrowing. At present, competitionsfrom within the industry, viz., from private banks and foreignbanks, are marginal as they concentrate on specific segments andcore competency areas. Regional influences of OPBs are also aforce to reckon with. Competition would prompt any seller to adopt
marketing techniques. For banks, particularly small banks and new
entrants, the solution lies in market segmentation in differentspecialised areas.
Patil (1996) explains that banks in India enjoyed protection for solong.“ They have been the major players in the financial system and
often performance of economy and banking were seen as one and
108

the same. There were not any other major players, which could offer
any competition to them. The overall regulatory frameworkgoverning the financial system remained unhelpful for emergenceand growth of major players other than banks while at the same time
the pattern of bank's resource deployment was primarily outside thecontrol of banks. As a result of this the financial system continued
to be a seller's market with borrowers having limited choices ofproducts. Patil explains that:
Even as students of economics. we were told that acompetitive system was inherently wasteful as itencouraged large amount of advertisement and otherneedless expenditure. We were constantly told that aplanned economy, on the other hand, was capable ofoptimising scarce resources. One can say with a faredegree of confidence that Fabian economics has not really
loosened its grip on our thinking. Most of us are stillpassing through a transitional process ofthinking and weare not yet fully convinced that markets and competition
can do well to the financial system.“
Whether banks are ready to face the market forces is anotherquestion raised by many in the industry. Banks have little freedom
in the recruitment of their staff and determining their salaries andother benefits. Nor they are completely free to choose the patternof lending or interest rates that are market oriented. They have not
yet completely come out of the clutches of rigid systems and workpractices.
109
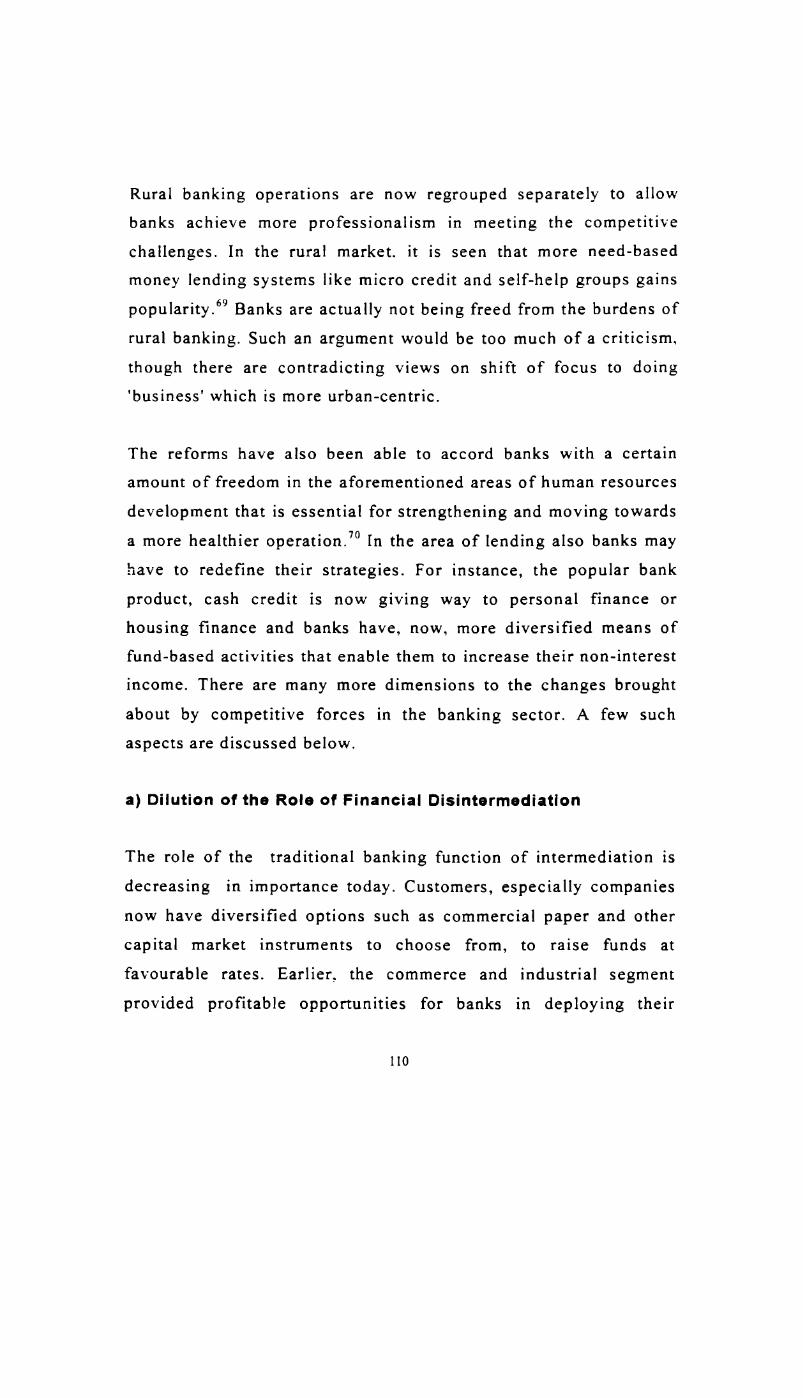
Rural banking operations are now regrouped separately to allowbanks achieve more professionalism in meeting the competitivechallenges. In the rural market. it is seen that more need-basedmoney lending systems like micro credit and self-help groups gains
popularity.” Banks are actually not being freed from the burdens of
rural banking. Such an argument would be too much ofa criticism,
though there are contradicting views on shift of focus to doing‘business’ which is more urban-centric.
The reforms have also been able to accord banks with a certainamount of freedom in the aforementioned areas of human resources
development that is essential for strengthening and moving towards
a more healthier operation.” In the area of lending also banks mayhave to redefine their strategies. For instance, the popular bankproduct, cash credit is now giving way to personal finance orhousing finance and banks have, now, more diversified means offund-based activities that enable them to increase their non-interest
income. There are many more dimensions to the changes brought
about by competitive forces in the banking sector. A few suchaspects are discussed below.
a) Dilution of the Role of Financial Disintormediation
The role of the traditional banking function of intermediation isdecreasing in importance today. Customers, especially companiesnow have diversified options such as commercial paper and othercapital market instruments to choose from, to raise funds atfavourable rates. Earlier, the commerce and industrial segmentprovided profitable opportunities for banks in deploying their
110

credit, which was a major source of their income. The availabilityof such alternate sources for raising funds for the corporate sectorhas not only deflated the income of banks but also. of late, causedunproportional building up of deposits leading to higher interestexpenses. Now, banks will have to frantically search for alternatives
to channelise more income for sustaining themselves. RBI has alsostressed the need for market research to scout for new markets and
products as well. A flurry of products unto now very rarely ornominally handled, though not entirely new, have been consideredas alternatives for filling up the existing gaps in income and forfuture growth. These include services like merchant banking,leasing, factoring, investment counseling, need based consumerfinance, telebanking, housing, and the latest addition, insurance.
b) Rising Consumer Expectations and Changing Perceptions
Economic development, exposure to media, and adoption of globaloutlook in life styles have resulted in wide scale changes in theexisting social and income classes. This has given rise to a sizeableupmarket consumer segments. These strata show distinctivelydifferent preferences for banking products and their expectationlevels also vary. Factors like convenience, speed, and customerservices assume equal status with returns and security in theirperceptions about banking services. They want the banks to takecare of their financial needs in a friendly way. Banks operating with
the super market concepts are, in fact, targeting at meeting theseneeds.
111

c) Deregulation
The aggressive financial reform programmes introduced in 1991 isreckoned as a second revolution in the banking industry after thenationalisation of banks in l969.This was initiated with a view to
make banking operations more viable and contributing to the growth
of economy as part of a larger programme to revive the saggingIndian economy. The imperatives of this reform process wereprogressive deregulation of interest rates, a diversified competitivemarket place, market-determined exchange rate mechanism, andtechnological changes. The interest rate structure has beensimplified to include mainly three or four rates and the moneymarkets have been completely freed. The banks are now able to fixthe interest on deposits and loans taking into account their overallliquidity conditions and demand factors. It is expected that thiswould lead to the development of innovative financial products, thedemand of which will be market driven. This requires greaterexpertise in the technical side of managing their investmentportfolios as well as distribution of instruments.
d) The Stress an Asset Liability Management
Banks are required to do the balancing act of marketing both loans
and deposits, which entails maintaining liquidity, and at the sametime being profitable. This is what makes the banking business more
risky and complex. The imposition of norms for maintaining acertain level of liquidity and observance of interest rates, thoughemployed in the larger interest of checking unacceptable practices,
restrict the much needed flexibility in responding to the market

conditions. The new approach recommended is a comprehensive one
that enables continuous process of planning. organising andcontrolling asset and liability volumes, maturities. rates and yieldsequivalent to the exercise of product mix planning.“
a) The Challenges of Technological Changes
Banking industry is the highest spender in terms of technologyamong the various services industries. Banks in the advanced anddeveloped nations have already experienced sweeping changes. The
brick and mortar concepts of branch banking have long back became
obsolete and people need go rarely to banks for meeting theirbanking needs.” Modernising of banks in India, especially, at thecustomer's end is likely to consume large-scale capital. But now,this is tried in selected branches of the urban areas considering the
need for 24 hours banking and speed of service delivery.Revolutionary changes are expected in this area. Global competency
in business calls for automation at the back end too. The big banks
are already at developing payment system networks interlinking thebranch level, zonal level, and head office level. It will alsonecessitate a change in the overall outlook of banks on improvingservices, premises and training personnel in acquiring moreprofessionalism. As such, the use of modern technology is a unique
selling proposition (USP) of certain upper-end banks and specialbranches of PSBs and OPBs. Going by the trend in other countriesATMs, telebanking and home banking would gradually transformfrom a luxury to a necessity at least in the urban areas.
113
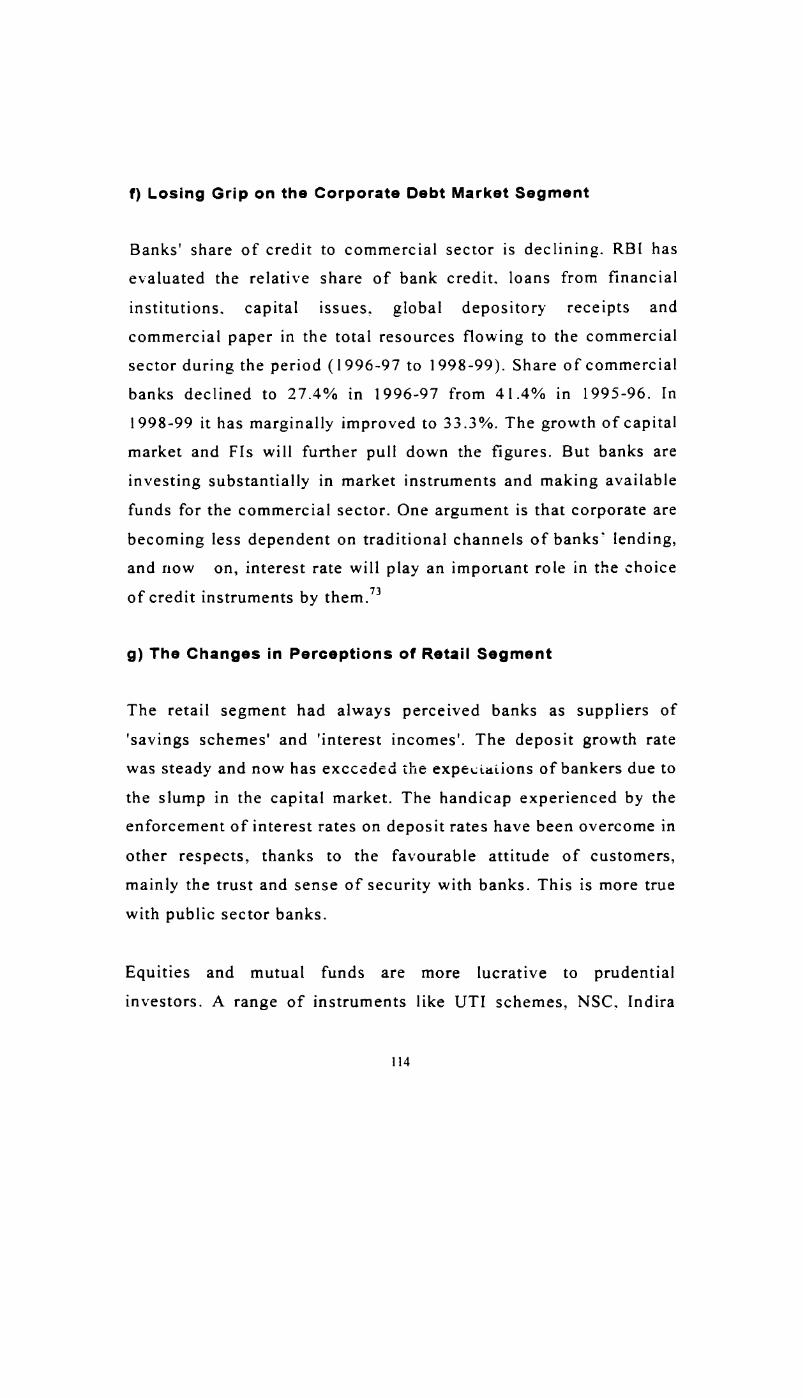
f) Losing Grip on the Corporate Debt Market Segment
Banks‘ share of credit to commercial sector is declining. RBI hasevaluated the relative share of bank credit. loans from financial
institutions. capital issues, global depository receipts andcommercial paper in the total resources flowing to the commercialsector during the period (1996-97 to 1998-99). Share of commercialbanks declined to 27.4% in 1996-97 from 41.4% in 1995-96. In
1998-99 it has marginally improved to 33.3%. The growth of capital
market and FIs will further pull down the figures. But banks areinvesting substantially in market instruments and making available
funds for the commercial sector. One argument is that corporate are
becoming less dependent on traditional channels of banks’ lending,
and now on, interest rate will play an important role in the choiceof credit instruments by them.”
9) The Changes in Perceptions of Retail Segment
The retail segment had always perceived banks as suppliers of‘savings schemes‘ and ‘interest incomes’. The deposit growth ratewas steady and now has exceeded the expectations of bankers due to
the slump in the capital market. The handicap experienced by theenforcement of interest rates on deposit rates have been overcome in
other respects, thanks to the favourable attitude of customers,mainly the trust and sense of security with banks. This is more true
with public sector banks.
Equities and mutual funds are more lucrative to prudentialinvestors. A range of instruments like UTI schemes, NSC, Indira
I14

Vikas Patra (IVP). post office savings schemes are also directcompetitors to bank deposits. The pattern of savings of householdsin financial assets tell that since 1991-92 financial savings ofhousehold have consistently exceeded physical savings (land. house
and the like). In 1997-98 the household savings amounted to 10.3%
of GDP while household savings in physical assets were 8% ofGDP The changes in consumers‘ switching pattern from oneinstrument to the other for parking their savings is evident in theinformation in Table 2. 11
Table 2.11
Savings of Households in Financial AssetsPercentage Distribution of Total
Source: Report on Currency and Finance 1999-2000, RBI, Mumbai
115
Sl.No 1 Type of Assets Year1990- 1992- 1994- 1995- 1997- 19985 91 93 95 96 9s 99
1 Currency 10.6 8.2 10.9 13.2 7.2 10.62 Bank Deposits 31.9 36.8 38.4 32.0 44.5 36.93 Non Bank deposits 2.2 7.5 7.9 10.6 4.4 7.44 Life Insurance 9.5 8.8 7.8 11.1 10.9 11.05 Provident Fund 18.9 18.4 14.6 17.8 18.4 18.6
1 and Pension Fund6 Claims in 13.4 14.8 9.1 7.7 12.4 13.0
E Government
7 ; Shares and 18.4 10.2 9.3 7.1 2.1 2.4i Debentures
8 I Units of UTI 5.8 7.0 2.7 0.2 0.3 0.99 iTrade Debt(net) -0.3 -1.7 -0.3 0.3 -0.2 -0.1

Bank deposits remains the largest avenue of household savingsfollowed by claims on government (IVP. NSC etc.), though it also
had a staggering growth pattern. Deposits with NBFC haverecovered after a sharp fall in 1997-98. The withdrawal of taxexemption to government's small savings schemes and the sluggishperformance of the stock market have impacted NBFCS favourably
Provident Fund and Life Insurance were almost steady. A onepercentage lowering or raising of interest rates of bank deposits or
other cash instruments can disturb this picture considerably. Retailsegment showed significant sensitivity to such fluctuations. Itshould also be noted that once the Indian capital market regains its
shape, and overcomes the problems of large-scale fluctuations,banks would see investors fleeing to this area.
Returns and tax savings need not be the only influencing factors ofcustomer’s choice behaviour. The technological revolution that istaking over the traditional bank concepts also are capable ofbringing about sweeping changes in consumer needs. The singlemost factor influencing the choice of bank 'nearness' may getredefined, by incorporating the advantages of ATMs and homebanking. It is interesting to find that PSBs are the largest buyers ofATMs. A typical teller transaction cost is Re.1 and an ATMtransaction costs only 40 paise. Apart from NPBs and FBs a largenumber of PSBs and even Co-operative banks are lining up to buy
ATMs to be set up in different places. This is evident in thestatistics of orders placed by Indian banks for ATMS (see Figure2.7)
116

Figure 2.7Demand for ATMs
Order Placed for ATMs by IndianBanks
1997 1998 1999 2000Year I] No of ATMS
Note Figure for year 2000 is projected
Source Economics Times, 'ATM Cos Smile as Banks Go
Auto’. May 25, 2000
This definitely indicates the increasing customer demand for theproduct. Banks, in such a situation, will try to acquire competitorparity in providing enhanced services to the customers. Theopening up of personal banking counters in leading cities of Keralaalso is a result of increased customer demand for specialisedservices. The number of banks introducing Sunday banking hoursand evening counters are also on the increase. Payment of utilitiesthrough bank is also being offered in leading cities by banksfocusing on the retail market. There are more options for customers
to choose from and the differentiating element is the service quality
and technology.
117

h) Competition from New Entrants and Private Banks
The greatest asset of public sector banks will be its vast spreadofbranches or its mass-market reach. The present study focuses on
competition in urban areas where the presence of strong competitors
like private banks. foreign banks, new private banks and NBFCS can
provide a different picture. The urban market environment urges the
banks to develop niche segments, build core competencies intechnology and train skilled specialists to cope with competition.Private banks have specialised branches such as NRIs, capitalmarket, leasing, housing finance, SSI, etc in order to target marketto these segments. The typical consumer needs are quick servicedelivery and a band of personal needs products all with the help ofbranch automation and networking. The private banks have alsobeen quick in responding to the aforementioned changes in theneeds of customers.
Private banks have come out of their regional cocoons to meet the
challenges posed by the competitive markets and to defendthemselves against the threat of mergers and takeover attemptswaiting to swallow ‘them up. Some of the OPBS are also crippledwith NPAs and thin spreads. They are also objectively pitching in to
create alternate ways of credit deployment which include carfinance, loans against demat shares, various cash managementservices, retail finance, educational loans, depository services,housing finance, loans against demand shares, etc.
The following arguments would establish that for the new entrants
the development of a retail branch network is not very important."
ll8

The belief that. small and predominantly urban, banks cannot match
the quantum of deposits of large state-run banks with a countrywide
network is. debatable. The top five banking centers (urban andmetropolitan areas) in the country account for 35% of the totaldeposit mobilisation. top 30 centers for 49% of depositmobilisation, and the top 100 centers for 60% of total deposits. This
suggests that private banks, even if they keep their branchnetworking at a bare minimum, will not face difficulties in deposit
mobilisation. Further, the public sector banks have only 8% of their
branches in the top 5 centers and the rural and semi—urban centers
account for about 67% of state-run banks.” The new private sector
banks have already proved that they have immense potential to tapthe deposit base with a smaller network in the urban centers.
The old private banks also have started offering value addedservices like ATMs, round the clock banking and telebanking. They
still bank on relationship banking and geographical specialisationthough, of late, they have realised the need for strengthening theirbranch network, felt more so because of the takeover threats.However the old private banks are likely to face competition from
the new generation banks which have the competitive edge of being
new, lean, professional and technologically oriented. It is certainthat they would penetrate those niche segments, which havespecialized banking needs and would raise more fee-based income. 76
NPBs, though small in number, constitute a significant share in the77 However theirtotal assets of all private sector banks (37.1%)
small size may endanger their survival. The current judgment ofbrand strength based on the strength of their promoters is fairly
ll9

inadequate since credibility is the most important factor in decidingthe brand strength. Some of the NPBs have huge customerknowledge base and support of parent organisation that enablescustomers to evaluate the risk and judge their credibility
Foreign banks have an unnoticed presence in termsof size and reach
in the market. They have the highest interest spread in the industry
They stand out in the market as ‘being different’ They focus on afew areas they are confident of. Their philosophy is better reflected
in what the Deutsche Bank's chief has to say:
It is important to stay focused, there is no point intrying to be all things to all people.”
ANZ Grindlays Bank, Standard Chartered Bank and HSBC havegood urban networking enabling them to build a large retail basewith products like credit cards, personal financial services,advances against shares, mortgages, car finance and other products.Citibank is a household name in the card business and in retail
banking they have been successful in creating a brand identity.
Non-Bank Finance Companies
NBFCS have grown sizeably both in volume and number terms. The
number of NBFCS grew from 7063 in 1981 to 51,929 in 1996.79
Regulated deposit of registered companies was Rs.38, 676 crores in
1996. Of these, nearly 20% of the companies used to submit returns
to RBI. The higher rate of return on deposits offered by NBFCs has
attracted a large number of small savers. NBFCS were subjected to
120

relatively less degree of regulation as compared with banks. Theyare not a homogeneous sect, but consists of 8 categories like Hire
purchase, house finance. chit funds etc requiring different types ofsupervision and regulation. The post reform growth of NBFCs canbe attributed to three main factors.“ The inefficiency of PSBs, thedecision of the government to extend banking loans to industry and
agriculture and the ability of NBFCs to pay higher interest todepositors than scheduled commercial banks. NBFCs have barged in
to areas where banks were operating besides helping the smallentrepreneurs to get loans easier and quicker. Banks have beenallowed entries into areas like leasing and consumer finance, whichwere the domain of NBFCS. However, the NBFCS have not picked
their slot in the competitive picture as yet. Further, the currentregulation for NBFCS substantially constrains its viability bycausing increased spreads. For instance, GE Capital, a financecompany, is widely popular abroad. However, some NBFCS havebeen highly successful in satisfying the banking needs of thepeople.
121

-_
Amo:mm_ m=o_.a>v =.:m::Q Ex “8._:om_a:o_m_.6.n_ i
LR.m.~..~.$m §Q£~ o.m2.$ _.omBm- _.:§.__~ ooaomo 2.o$~_ 22: 2:9. -02..
8o.;n;~ o£.o8._..~ 32.2. ~.8§._ 2.3.3. .38 ...NS:: foomo 3.2: -32
momoooza _.32_~ «.23 ~.__n$._ m.om~_m_ 252 32.2 38% wozaw -30.
.53&3. 32.3. .»S~m~ nS.8~_ ...on2~_ 3.3 0.5.8 o.:.o.om 023.: -82
8V393. m.o$: oo.\.:o :;8_ o.cmSo o_.o2=. ...%$.. 3.83 33.. -82
8w.£__m 3%? 3o: SE3 oioom o_..~$v 25.8 3.3: o_+S~ -32
.0383. 3%: 5.03.0 Samoa o_._m_- 2.82 o~.cmN\._ 8.3.2 2.2.8 -82
mzmoaov mzmoaoc fifioaou mzmoaou mzmoaou wzmomou
_...._£ Bucsxm ,n9~_..m..w_\ .23 Bucoam Ba__..m3_ % _so._..... B.E..m. B.a_....h5_. .8>
—50u _U=u._o mU__._mQF_O0 oo:aE._-:o= xcan =02 w0_:NQEOU 00.55:: 453 :02
no.:anEou m:_._:an-:oz no nzuonun 23234
3.~ 033.

Cooperative Banks
Cooperative banking system supplements the commercial banks‘activities in mobilising savings and meeting the credit needs of the
local population. This system consists of rural banks with acomprehensive network and urban cooperative banks known asPrimary Cooperative Banks (PCBS). A large number of PCBSshowed better performance than the commercial banks in 1998-99,
but others have shown signs of weakness too.“ Total income ofPCBS increased significantly by 23.7% during this period. Ninetyfive percent of their total income came from interest." Figure 2.8presents the structure of the Cooperative Credit System in thecountry.

Figure 2.8
Organsafional Structure of Co-operative Credit System
J.
(as at the end of March 1998)
Co- operative Banks
lJ
Rural C ooperative Banks
l
lPrimary Co-operative
Banks (PC B)
1Short-terrn Long-tenn creditcredit structure structure
Two Tier Three tier Unitary structure Federalstructure structure SCARDB (8) Structure
SCB (12) 360 SCB (16) 429 10.73 Branches‘ SCARDB (I 1)Branches Branches 81 Branches S
PACS CCB (367) PCARDB2840 l2,l28 Branches
___L__| PCB ([936)PACS 08 @33,3 30 N Branches ‘
SCB State Cooperative BankSCARDBPACSC(IBPCBPCARDB
Banks* Includes 17 districts offices.$ Includes 19 districts offices.@ Position as at the end of March 1999.NoteSource
State Cooperative Agriculture and Rural Development BanksPrimary Agricultural Credit SocietiesDistrict Central Cooperative BanksPrimary Cooperative BanksPrimary Cooperative Agriculture and Rural
Figures in brackets indicate number of respective branchesReport on Trend and Progress of Banking in India 1998, RBI
Development

Financial Institutions
Both banks and FIs are. in fact. entering into each others domain.Fls are disbursing short-term loans and banks entering into longterm financing. Fls. however. has a decisive role in financingmedium and large sized corporate houses. The structures of Fls are
given in Figure 2.9. As far as the retail-banking segment isconcerned the performance of the mutual funds. UTI, LIC. and GIC
schemes have more relevance. Resource mobilisation by mutualfunds during 1998-99 declined. UTI had started mutual funds in1964, and private sector institutions started mutual fund business
only in 1993. The largest chunk of funds raised under the fixedincome scheme has been through UTI’s US-1964.“
Mutual Funds (MF) provide professional management,diversification, liquidity, transparency. flexibility, and possibilityof capital appreciation.“ Mutual funds have been particularlysuccessful in developed countries. Over USS 3 trillion worthAmerican household savings is invested in more than 5000 suchschemes. In India, mutual fund is an emerging avenue for personalsavings and has enabled small and medium investors in remotelyaccessible places to reap the benefits of their investments. Mutualfunds are not doing very well recently due to structural problems in
the economy. Another customer related factor is that many people
are not knowledgeable about the product. Besides. the absence of aphysical location or a face for investors in the rural areas hasadversely affected its success. Total number of mutual fundregistered with SEBI is 40, as on March 31, 1999. However, MFshave not grown big enough to pose a threat to bank deposits. Banks
125

have also entered into the MF market. However. private Sector MFs
are more popular than the bank sponsored ones as seen from Table
2.l3. Though the growth of the industry shows a staggering trendMF industry is very hopeful about the changes in policies thatwould work in favour of MFs.
Figure 2.9Organisational Structure of Financial Institufions
All Financial Institutions
All India State Level Other InstitutionsFinance Institutions —|Institlirions
Specialised Investment RefinanceA“ India Financial Institutions InstitutesDevelopment InSl1l1ll.lQnS UTI, LIC, NABARD,[DBL ICICI. SIDBI, EXIIVI Bank, RCTC, GIC & NHB“BL '[1:C1 ICICI Venture Subsidiaries’ (fonnerly
TDICT, TF C I,IDF C )
SFCs SIDCS
ECGC DICGC
Fig 2. 10- Organisational structure of financial InstitutionsSource: Report on Trend and progress of Banking in IndiaI998-99. RBI. Mumbaj.

Table 2.13Resources Mobilised by Mutual Funds during 1993-94 In 1998-99 (April-March)
(figures in Rs.crorcs)
M“‘“‘'' F“''‘‘ 1993-94 1994-95 1995-96 1996-97 1997.93 1993.991. Bank 148.11 765.49 113.3 5.9 242.96 253.18
sponsored
1. S131 MF 1()5.00 218.26 76.00 2.61 190.11 248.()42. Canbank MF 43.11 205.55 2.71 1.69 , 52.85 5.143. Indian bank 94.40
MF4. BOIMF 53.49 ..5. PNBMF 155.95 10.32 ..6. BOB MF - 37.84 24.27 1.60 .. ..238.61 576.29 234.81 136.85 205.55 576.42
11. F1s.sponsored
227.23 319.68 64.88 -32.4 1 -19.2 17.637. GICMF ALICMF 11.38 68.97 116.51 169.25 99.75 377.54IDBIMF - 187.64 53.42 - 125.00 181.25
111. Unit trust oflndia 9297.00 861 1.00 6314.00 3043.00 2875.00 170.00(7.453) (6800) (-2877) (-855)a (2592) (1308)
IV. Private sector 1559.52 1321.79 133.03 863.58 1 678.29 2090.37MFSTotal (1+[I+1l]+1V) 11243.24 11274.57 5832.86 2036.67 4001.8 3089.97
P ProvisionalNo amountsNot applicable
a Excludes re-investment sales
Notes 1. For UTI. the figures are gross value (with premium) of net sales under all domatieschemes and for other mutual timds, figures represents net sales under all on going schemes.
Ix)
La)
. Figures in brackets in case ofUTl pertain to net sales at face value.
. Data exclude amounts mobilized by off scheme funds and through roll over schemes.
Source 'UTl and respective mutual fiJnds'. Report on Trend and Progress of Banking in India1998- 99, RBI. Mumbai
127

Competition among banks may be based on price. quality of service.
products. offer of specialised services. technology. skills, locationadvantages. and strategy of early entry. An analysis of the basicbanking statistics is done in the following sections to understand the
overall nature of competition in the banking industry ofthe country.
Public sector banks are the predominant players in the bankingindustry with more than 80% share in the total assets of allscheduled commercial banks (SCBs). Among PSBs there are twomajor groups. viz., SBI and Associates and nationalised banks(Figure 2.10). Old private banks constitute the major portion of theprivate sector banks. Of late NPBs have started eating into themarket share of old private sector banks.

Figure 2.10Structure and Asset Classification of Scheduled Commercial
Banks
SCBs
Public Sector Private Sector Foreign BanksBanks (27) Banks (34) (44)81.01% 10.93% 8.06%
Nationalised State Bank Old Private New PrivateBanks (19) Group (8) Banks (25) Banks (9)62.89% 37.11% 62.93% 37.07%
SB1 (1) SB1 Associates77.83% (7)22.17%
Notes 1 Figures in brackets indicates number of banks in each group2. Figures in % indicate the share of assets ofeach sub group
in the total assts of respective groupSource Report an Trend and Progress ofBan/cing In India 1998-99. RBI, Mumbai.
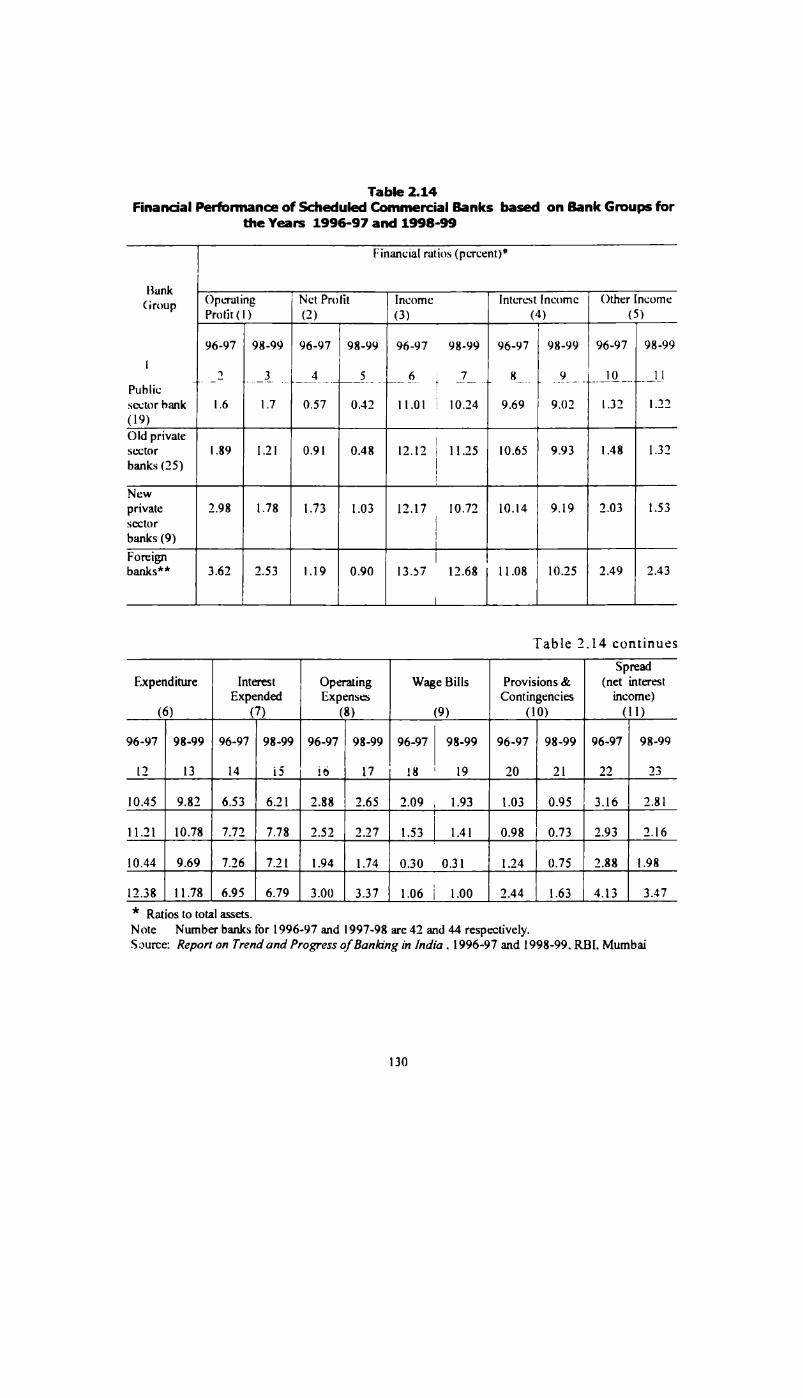
Table 2.14Financial Performance of Scheduled Commercial Banks based on Bank Groups for
the Years 1996-97 and 1998-99
Financial ratios ( percent)"
(lkrztfllkp ()pcruting Nct Profit Incomc Interest Income Other IncomePro1it(1) (2) (3) (4) (5)96-97 98-99 96-97 98-99 96-97 98-99 96-97 98-99 96-97 98-99
I
T. -3 _l. __4,,,.___§__ ____ I J_ 1L__ __9__ , J9- _ _1,1Publicsector hank 1.6 1.7 0.57 0.42 11.01 1 10.24 9.69 9.()2 1.32 1.22(19)Old privatesector 1.89 1.21 0.91 0.48 12.12 1 11.25 10.65 9.93 1.48 1.32banks (25) 1
1
Newprivate 2.98 1.78 1.73 1.03 12.17 10.72 10.14 9.19 2.03 1.53sector 1banks (9) 1Foreignbanks** 3.62 2.53 1.19 0.90 13.57 12.68 11.08 10.25 2.49 2.43
I
Table 2.14 continues
SpreadExpenditure Interest Operating Wage Bills Provisions& (net interest
Expended Expenses Contingencies income)(6) (7) (3) (9) (10) (11)96-97 98-99 96-97 98-99 96-97 98-99 96-97 98-99 96-97 98-99 96-97 98-99
12 13 14 15 16 17 18 ' 19 20 21 22 2310.45 9.82 6.53 6.21 2.88 2.65 2.09 1.93 1.03 0.95 3.16 2.8111.21 10.78 7.72 7.78 2.52 2.27 1.53 1.41 0.98 0.73 2.93 2.16
10.44 9.69 7.26 7.21 1.94 1.74 0.30 0.31 1.24 0.75 2.88 1.98
12.38 11.78 6.95 6.79 3.00 3.37 1.06 1.00 2.44 1.63 4.13 3.47* Ratios to total assets.Note Number banks for 1996-97 and 1997-98 are 42 and 44 respectively.Source: Report on Trend and Progress of Banking in India . 1996-97 and 1998-99. RBI. Mumbai
130

Emerging competition, and banks foray into new fields of activitieshave been instrumental in changing the net profit structure ofvarious bank groups. Starting from 1991-92, net profits declinedand after 1995-96. it started recovering (see Table 2.14). Oldprivate banks‘ performance was better in 1994-95, though their net
profits declined later. This pattern is observed in the operations of
NPBs and FBs too though they had better net profit to total assetsthan the PSBs. The decline in ‘net profit to total assets‘ may be due
to the fact that, the non-performing assets of OPBs. NPBs and FBShave gone up. The share of net profits of foreign banks has beenconsiderably eroded during the period 1991-92 to 1998-99 from30.41% to 14.88% (Figure 2.11). SBI and Associates have put up
better show by raising their share of net profit from 19.27% to31.46 while the share or nationalised banks declined.
Figure 2.11Net Profit Share of Bank Groups
1997-98
i Private Barks
I NatioralisedBarks
E1831 8. Asslciates
E 0 Foreign Barks39.54%
Contd.
131

1991-92
6.44%
30.41% uPrrvate BarnsI Nalionalised
BanksDSBI & Assiciates43.88% _[:1 Foreign Banks
19 27%
1998-99
14.39%: 15.21‘:/o
Pn'\ate BanksI Nationalised Banks
DSBI & Assiciates314-’% :3 Foreign Banks
Source Report on Trend and Progress 0fBanking in India (various issues).RBI, Mumbai
Private sector banks improved steadily capturing a share of 15.2%.possibly due to the entry of NPBs after 1991-92 which have been
performing well above the average of all SCBs. Nine new privatebanks have been set up since 1991, subsequent to the liberalisation
in the banking sector. They have been able to get a market share of
37.1% among the private sector banks also. They have the highest‘net profit to asset’ ratio (see Table 2.15). Though they have low
income compared to FBs and OPBs they have low expenditure
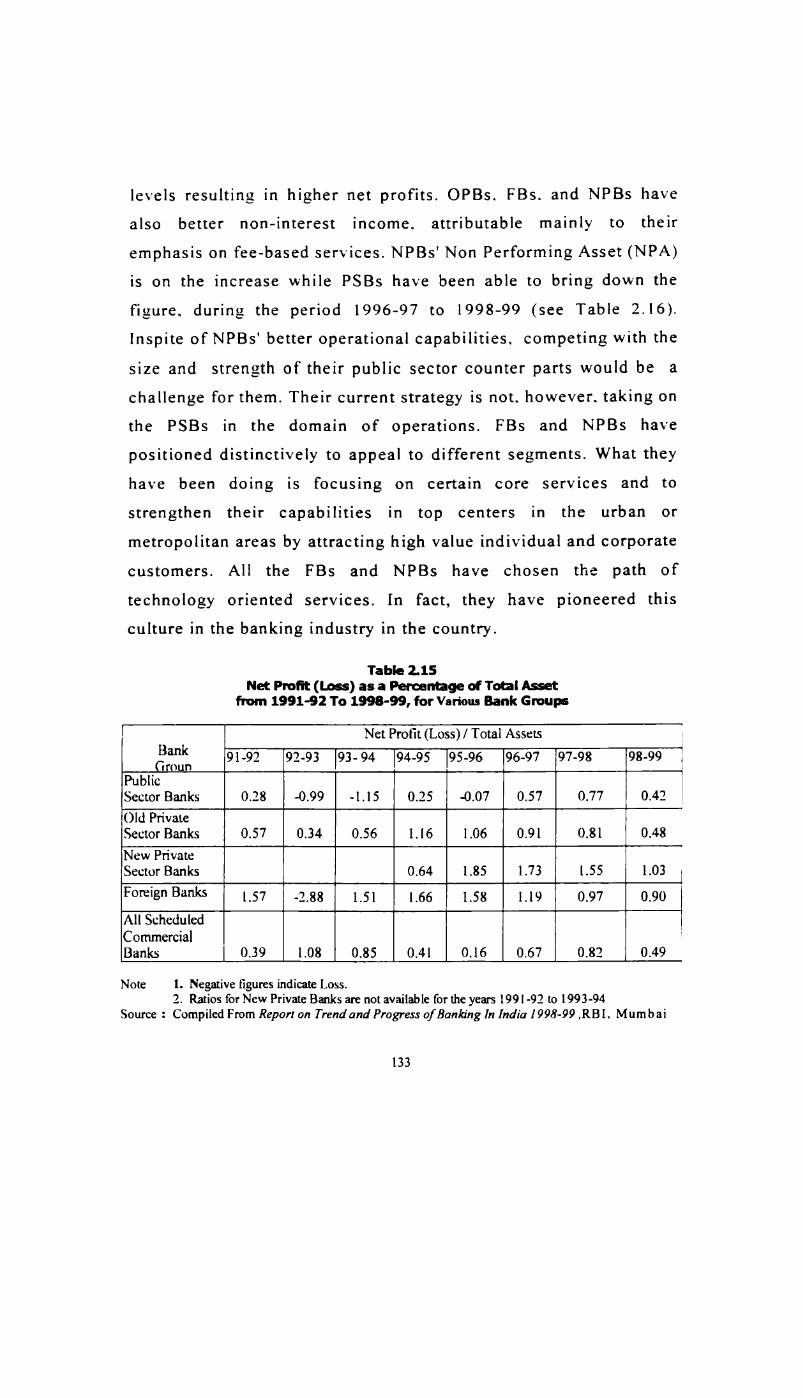
levels resulting in higher net profits. OPBs. FBs. and NPBs havealso better non-interest income. attributable mainly to theiremphasis on fee-based services. NPBs' Non Performing Asset (NPA)is on the increase while PSBs have been able to bring down thefigure. during the period 1996-97 to 1998-99 (see Table 2.16).lnspite of NPBs' better operational capabilities. competing with the
size and strength of their public sector counter parts would be achallenge for them. Their current strategy is not. however. taking onthe PSBs FBs and NPBs havepositioned distinctively to appeal to different segments. What they
in the domain of operations.
have been doing is focusing on certain core services and tostrengthen their capabilities in top centers in the urban ormetropolitan areas by attracting high value individual and corporatecustomers. All the FBs and NPBs have chosen the path oftechnology oriented services. In fact, they have pioneered thisculture in the banking industry in the country.
Tab|e2.15Net Profit (Loss) as a Percentage ofTotal Asset
from 1991-92 To 1998-99, for Various Bank Groups
Net Profit (Loss) / Total Assets
Bank 91-92 92-93 93- 94 94-95 95-96 96-97 97-98 98-99Grnun
PublicSector Banks 0.28 -0.99 -1.15 0.25 -0.07 0.57 0.77 0.42Old PrivateSector Banks 0.57 0.34 0.56 1.16 1.06 0.91 0.81 0.48New Private
Sector Banks 0.64 1.85 1.73 1.55 1.03 1Foreign Banks 1.57 -2.88 1.51 1.66 1.58 1.19 0.97 0.90All Scheduled 1Commercial ‘Banks 0.39 1.08 0.85 0.41 0.16 0.67 0.82 0.49Note 1. Negative figures indicate Loss.
2. Ratios for New Private Banks are not available for the years 1991-92 to 1993-94Source : Compiled From Report on Trend and Progress of Banking In India 1 998-99 ,RB1. Mumbai
133
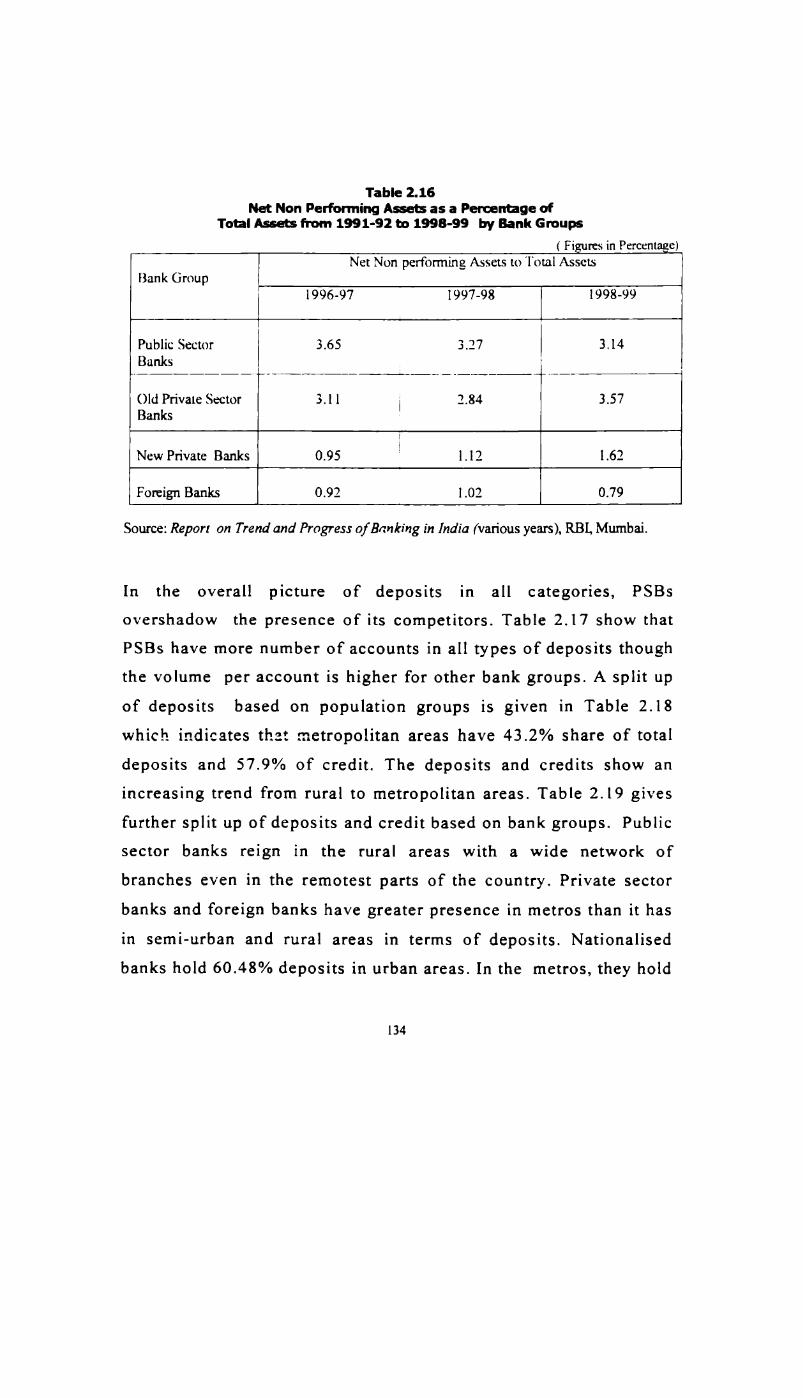
Table 2.16Net Non Performing Assets as a Percentage of
Total Assets from 1991-92 to 1998-99 by Bank Groups( Figures in Percentage)
Net Non performing Assets to Total AssetsBank Group 1996-97 1997-98 1998-99
Public Sector 3.65 3.27 3.14Banks.2 ____ _.r_- 1 _ _} _()ld Private Sector 3.1 1 2 2.84 3.57Banks '
1New Private Banks 0.95 ’ 1.12 1.62Foreign Banks 0.92 1.02 0.79
Source: Report on Trend and Progress 0fBrmkir1g in India (various years), RBI, Mumbai.
1n the overall picture of deposits in all categories, PSBsovershadow the presence of its competitors. Table 2.17 show thatPSBs have more number of accounts in all types of deposits thoughthe volume per account is higher for other bank groups. A split up
of deposits based on population groups is given in Table 2.18which indicates that metropolitan areas have 43.2% share of totaldeposits and 57.9% of credit. The deposits and credits show anincreasing trend from rural to metropolitan areas. Table 2.19 givesfurther split up of deposits and credit based on bank groups. Publicsector banks reign in the rural areas with a wide network ofbranches even in the remotest parts of the country. Private sectorbanks and foreign banks have greater presence in metros than it has
in semi-urban and rural areas in terms of deposits. Nationalisedbanks hold 60.48% deposits in urban areas. In the metros, they hold
134
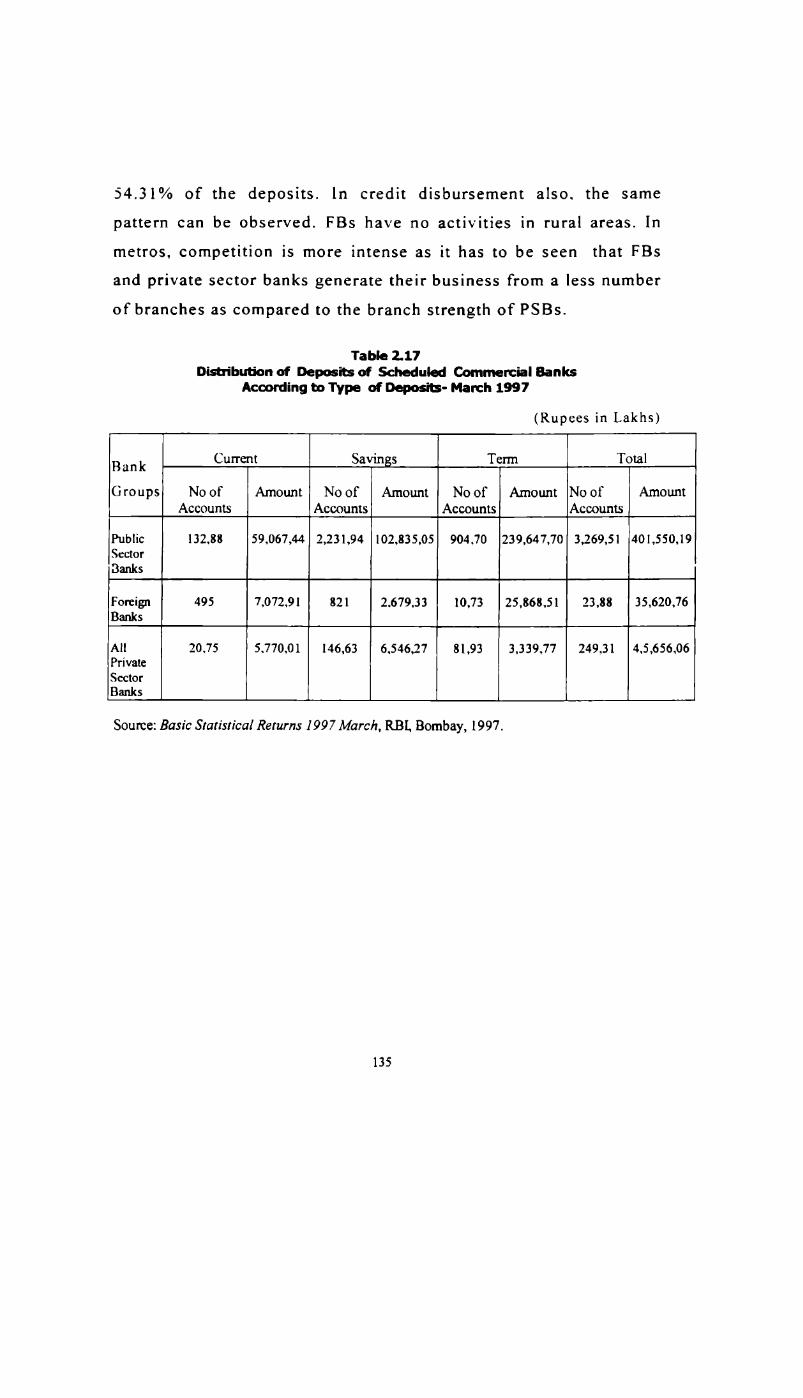
54.31% of the deposits. ln credit disbursement also. the samepattern can be observed. FBs have no activities in rural areas. Inmetros, competition is more intense as it has to be seen that FBs
and private sector banks generate their business from a less number
of branches as compared to the branch strength of PSBS.
Table 2.17Distribution of Deposits of Scheduled Commercial Banks
According to Type of DoposiIs- March 1997
(Rupees in Lakhs)
B a n k Current Savings Term TotalGroups No of Amount No of Amount No of Amount No of AmountAccounts Accounts Accounts AccountsPublic 132,88 59,067,414 2,231.94 102,835.05 904,70 239,647.70 3,269.51 401,550.19SectorBanks
Foreign 495 7,072.91 821 2.679.311 10,73 25,868.51 23,88 35,620,76Banks
All 20.75 5.770,01 146,63 6,546.27 81,93 3.339,77 249,31 4.5,656,06PrivateSectorBanks
Source: Basic Statistical Returns 1997 March, RBI, Bombay, 1997.
135

Table 2.18Distribution of Deposits and Credit of Scheduled Commercial
Banks-by Populafion Groups (March1997)
( in Rupees Lakhs)
Population Group No. Of Offices Deposits Credit(1) (3) (3) (4)Rural 32.909 73769.70 32525.22(50.5) (14.7) (11.4)
Semi-Urban 13.931 98045.13 37383.60(21.4) (19.6) (13.1)Urban 0,061 112577.67 49930,94(15.5) (22.5) (17.6)
Metropolitan 8.213 216163.87 164533.54(12.6) (43.2) (57.9)All India 65,111 S00556,37 284373,30(100) (100) (100)
Note : Figures in brackets show percent of all India total(Inclusive of Regional Rural Banks)
Source: As in Table 2.17
Table 2.19of Deposits and Credit According to Bank Groups
and Population Groups (Marvel-11997)(Rs in Lakhs)
Population SBI& Nationalised banls Foreign banksgoup Associates 'Deposits Credit Deposits Credit Deposits Credit1 2 3 4 5 ,‘ 6 7
Rural 1678850 780626 4118.739 1691019 5(5500) (13339)
Semi-urban 3534,59 1512473 50000,20 1686396 ' 10441 227 A(3902) (6575) (3)Urban 3189107 1617081 68089,54 2754902 778,58 162,60(2132) (6446) (16)Metropolitan 40843.83 4393040 117400.07 7780231 3473777 2634.041(1614) (5612) (165)
Contd.
136

Contn.
Population ()ther Scheduled Commercial TotalBanks
group Deposits Credit Deposits Credit8 9 10 1 1Rural 3135.97 1207,94 73769.70 32525.22(1141) (32909)Semi-urban 8781.83 3780.98 98045.13 37383.60(1576) (13931)Urban 10581 .79 5613,20 112577.67 4993092(1089) (10061)Metropolitan 23156.46 1645291 21616387 164533.54(812) (8210)Source: As in Table 2.17
Maturity pattern of deposits reveal certain preferences ofdepositors. Maturity pattern of Regional Rural Banks (RRB) areshown in the Table 2.20. RRBs get more long-term deposits, viz.,
deposits with maturity above 5 years, mainly due t.) the lack of
knowledge of people in other investment options and trust inbanks as a more tangible investment avenue. SBI and Associates
and nationalised banks have more deposits in the one to twoyears and three to five years categories while FBs have maximum
deposits in the six months to one year category. Deposits of five
years and above maturity were the least popular with FBs. Inprivate sector banks, deposits of up :3 90 days maturity weremore popular. Public sector banks have depositors who seek more
safety and who are more image-driven while FBs and privatesector banks attract prudential investors who may temporarilypark their funds to be diverted to other better options.
137

Table 2.20Maturity Pattern of Deposim of Scheduled Commercial Bank
According to Bank Group- March 1997(As percent to total in each bankgroup)
Period of SBI & Nationalized Foreign Ribs Sobs"'Maturity Associates Banks Banks
(Amount)() - 90days 7.5 8.4 19.3 6.9 20.591 days-6 5.3 5.1 7.2 3.1 10.0months6 Months— 10.6 9.1 34.4 5.2 9.3<1year1 year- 22.1 21.8 17.6 14.1 20.5<2yeais2 years- 21 20.8 8.2 13.1 14.2<3years3 years- 20.8 21.5 11.9 17.9 15.8<5years5 years& 12.7 13.2 1.4 39.8 9.7Above
Total (100.00) (100.00) (100.00) (100.00) (100.00)"‘0SBs include other scheduler’ commercial banksSource: As in Table 2.17
In general a few characteristic features competition in bankingindustry of India would bezss
1. There exists a near perfect competition in the bankingindustry due to the presence ofa large number of users andproviders of similar other services. None of the branchesare able to influence the price or demand-supply levels of
banking products in any significant manner.
2. Competition in the banking industry is essentially demanddriven rather than supply-driven. Customers look forfinancial products, which suit their needs rather thanstandardised deposits or loan products.
138

Lo)
adequacy, priorityexchanges and location of their head office.
. Competitive advantage can be acquired through developing
core competencies based on skills and by creating expertise
in niche segments. Volume based business developmentthrough targeting at specific high-value segments is thestrategy of many new entrants in the industry.
Banks now aim at sustainable market shares based on core
competencies with long-term perspective.
.Competition in the banking industry is not necessarilyinternal. It may be from substitute products of non-bankfinance companies, F15, corporates, and capital market.
. Competition also exists within the different segments ofbanking industry like foreign bank, public sector, privatesector, and new private sector banks.
Competitive environment in banking industry can be elaboratedbased on the five forces model of Michael Porter.
a) Threat of Entry
Entry of private banks, both Indian and foreign, is permitted subject
to certain conditions with respect to paid up capital, capitallisting of shares on stock
NPBS, unlike OPBs
sector lending,
and PSBs, have modest target for priority sector lending and aninterest advantage of starting on a clean slate with no burden of
139

NPAs and unionised work forces. However. the high cost ofinvestment in technology can be an entry barrier for new banks.
b) Threat of Substitutes
Banks faced the threat of substitution from a variety of sources.Bank deposits face competition from schemes of NBFCS.manufacturing companies. mutual funds, bonds. governmentschemes, and stock market investments, though they are not perfect
substitutes to bank deposits in terms of their maturity profile,liquidity, risk and return characteristics, etc. However, significant
impact of substitution is visible in the deployment of credit.Companies directly access capital from savers avoidingintermediation of banks. Hire purchase schemes of NBFCs aresubstitutes for term loans of banks.
c) Bargaining Power of Suppliers
Bargaining power of suppliers has strengthened with the removal of
administered interest rate structure. Both high-risk takers and riskaverters have the tendency to move to high-yield investments andsuch shift will reflect immediately when there is a fall in interestrate.
d) Bargaining Power of Buyers
In banking the raw material as well as finished goods is money.Buyers of banking services are the borrowers and users of fee-based
services of banks. Currently, since the complete deregulation of
140

interest rates have not taken place, borrowers do not enjoy muchpower of bargaining. But. if complete deregulation of interest rate
and the evolution of effective pricing mechanism come in place.highly credit worthy borrowers will be able to exert considerablepressure in getting finer rates from banks. Fee-based services willalso be priced on the basis of their actual cost.
9) Competition within the Industry
As the number of players increase competition is also likely toincrease. The players make use of many dimensions of advantages
such as the extend of technology adoption, financial health,structural aspects, cost of funds, competitive strength in differentsegments, efficiency levels, legacy of long years of experience and
customers‘ perception and image of the bank in attractingcustomers. Banking reforms were, in fact, introduced with theobjective of creating a competitive environment in the industry.
2.6 Customer Satisfaction in Indian Banks- a Paradigm Shift
Banking is a people oriented business. Like in any other businesscustomer satisfaction is the ultimate aim of any bank. The aspect of
customer service has been brought to the forefront anticipating anincreasing competition in the industry and also due to the fact that,
differentiation by quality of customer services is particularlysuitable for smaller banks intending to take a customisation position
in service operations. The term customer service is narrowlyperceived by many including customers, as friendly faces and
141
smiles. It has been vaguely mentioned as something related only tothe services obtained at the front office. from a public relationofficer or from the complaint handling mechanism. Manydimensions of customer satisfaction are not given proper attention.
as translating all the elements of customer satisfaction intoquantifiable parameters is rather a difficult task. In the presentcircumstances it seems somewhat impractical as far as all the banks
are not operating on a level playing ground. It is sometimes branded
as ‘unnecessarily hyped up jabbering of management experts. This
viewpoint needs to be examined critically. First, the concept has not
been comprehended in its right perspective, secondly, there is apreconceived notion that banking business is much more serious and
complicated than maintaining customer service. It is true thatvarious committees have been formed and recommendations made
by them are relegated to redundancies.
Of late, the urgency of refocusing is increasingly being felt. Butmost of the exercises in the name of improving customer serviceshave been superficial to the extent of establishing a complainthandling mechanism, technological upgradation or celebrating thecustomer's day or week. A few banks have taken efforts to train and
orient their employees.
Competitive environment in banking has given the customers thefreedom to choose. Just like they evaluate toothpastes and carsamong the options available, banking products will also besubjected to customers’ evaluation. It becomes essential that banks
meet the expectations of customers. Banks have seldom asked the
customers as to what they expect. The early banking period had
witnessed banks going in for image building exercises for attractingdeposits. Today, to satisfy the customers banks have to embrace adifferent working culture that has to be totally customer oriented.Study of factors contributing to customer satisfaction would thusentail looking at what defines customer orientation.
Customer service qualities in banking pertains to accessibility, cost.returns, speed. choice, product range, flexibility, operationalconvenience. technology, courtesy, punctuality, accountability etc.The degree of satisfaction will depend on the favourability ofaspects such as the following.“
I Branch location
I Variety of servicesI PriceI Systems and proceduresI Delegation and decentralisation
I Mechanisation and computerisationI Competitive efficiencyI Complaint redressalI Skills and attitude of personnelI Office design and ambience
Measurement of customer satisfaction without taking intoconsideration the above factors would be ineffective. "7Constructing an index such as customer satisfaction (CS1) for thepurpose has been thought of as an innovative idea. So far, no bankhas undertaken such an effort. The idea of CSI is to evolve a
mechanism for a scientific assessment of the performance of banks
143

in serving the clients. This has been necessitated by the fact that the
standard of customer service is gauged on the basis of vagueimpressions. judgments, and sporadic incidents wherein the element
of prejudice and bias play a dominant role.
Further, the multi-service activities of banks like savings deposits,
term deposits. current deposit, remittance of funds, lockers, loansand advances. corporate-services, foreign exchange dealings, etc,and multiple customer segments, and widely varying geographical
areas of operation make developing a CSI a rather complicatedprocess. Standardisation across these various products and customer
segments will be practically difficult. The problem is furthercomplicated by the differential treatment meted out to public sector
banks and foreign banks. The measure of customer satisfaction bycounting on the rate of complaint redressal is archaic andmisleading.
Earlier policy measures gave more thrust to reducing customercomplaint and customer redressal. Customer satisfaction can beachieved only through setting standards and by striving to attain the
targets in a planned manner by all the employees. Customereducation is another means to improve satisfaction and triggeringthe demands from a well informed customer. Customer audits will
also help in pin pointing the aspects warranting attention by bankers
as it speaks about what a consumer expects. This can eventuallyhelp in evolving a healthy bank-customer relationship.
144

2. 6. 1 Factors Causing Dissatisfaction
a) Systems and Procedures
The systems and procedures in banks have been made rigid keeping
in view. the legal, accounting. and book keeping purposes. Theseprocedures are cumbersome and considerably reduce the speed ofdelivery of services. Besides, designing the office layout andorganising the different departments demand greater attention too.
These will help in a smooth sequencing of activities resulting inincreased efficiency For instance, a demand draft can be preparedfrom the voucher itself and can be handed over to the applicantwithout any delay. The customer is usually held up till all thedocumention processes are over.
Electronic offices in the West have long back revolutionisedbanking whereby the 'brick and mortar‘ branches have disappeared
and most of the bank customers never go to the banks at all.Technological advancement has made possible telebanking andhome banking. In a very nominal scale, at least some of the urbanbranches in major cities of India have initiated this.
b) Slow Pace of Automation
Indian banks have been slow in adopting computerisation.Electronic innovations have been half-heartedly accepted. Coupled
with the problem of inadequate capital to make investments inautomation, most of the banks continue to function in the oldfashion. The non-computerised branches will nullify the efficiency
145

of computerised branches since banking has to be seen as the sumtotal of a network system offering easy transaction.
c) Indifferent Employee Attitude
Simple transactions take long time to get completed. Unmannedcounters. lack of warmth on the part of employees. etc are not rare.It can be argued that customers never complain about employees not
being warm but it should be remembered that habitually customersdo not like to complain. Trade unionism, sometimes, provide undue
protection towards such shortcomings in dealing with customers.
d) Thrust on Complaint Handling
As mentioned above the customer service improvement is limited to
complaint handling rather than prevention. The theory suggests thatthe actual number of dissatisfied customers would be many timesmore than those who actually complain." Equating customerservices with the presence of a complaint redressal mechanismwould not serve the purpose, though it is important.
e) Cost Price Disparity
The service charges for various services in banks are, in fact, verynominal. It was revised long back. Foreign banks are able to provide
better service because they are able to charge higher. The cost ofissuing a demand draft comes to about Rs.40 up to Rs.5000 whereas
the bank charges very less. Costing exercises take long time tofinish. The latest cost schedules were developed in 1989-1990. By
146

this time high inflation rates might have hiked the actual cost.Customers are but prepared to pay more for faster and efficientservices now and banks can adopt a price differential for providingbetter quality services to those customers who are very particularabout it.
Some specific strategies for improving the quality of customerservice are:
0 Designing products to suit the needs and expectation ofcustomers.
0 Continuous efforts to improve the product and quality ofinteraction with customers.
0 Faster adoption of technology, keeping in view of theconvenience of the customers. This also involves orientingemployees to adapt to technology transformation.
0 Providing value added products through the use of technologyand providing speedy and efficient payment systems
0 Networking all the branches and developing suitablemanagement information systems.
0 Improving the work culture and making it customer oriented.
o Focusing more on preventing complaints than solving them.
2. 6. 2 Complaint Redressal-The Banking Ombudsman
This idea was mooted with a view to speed up the complaintredressal by avoiding the usual lengthy court procedures in settling
the disputes between banks and customers. The banking ombudsman
scheme is an independent grievance redressal machinery, which will
147
confine its activities to resolve complaints about provision ofbanking services.
2. 6. 3 Policy Level Implications of Customer Service Levels
Various committees and working groups were constituted in the past
to recommend ways and means to improve the standard of customer
services. The first committee to be set up was headed by R. KTalwar had made 176 recommendations, covering areas such asdeposit accounts, remittances and collections, loans and advances,
discipline and bank employees’ attitudes, etc among various otheraspects. Some of the important recommendations of the committee
which were implemented subsequently were:
I Establishment of complaint cells at different levels startingfrom the branch up to the head offices.
I Time norms for a variety of transactions (the norms were to bedisplayed prominently in branch offices for customers‘awareness).
- Increased emphasis on interface between bank executives andcustomers. CUSi.u1ueI'S are free to meet the bank executives
from the branch level upwards without prior appointmentbetween 3 to 5 PM on specified days.
The progress and impact of the above measures were evaluatedperiodically. RBI conducted a survey in 1985, which revealed themany facets of improvements in customer service. In 1986, NCAER
conducted a survey of customer responses to the functioning ofcustomer's service centres, which showed that in 82% of the cases,
148

quality of customer redressal was found to be satisfactory. Risingexpectations demanded further attention to the issue of enhancedcustomer service quality in the different segments ofthe market. Toexamine this demand a committee on customer service in banks was
appointed under the chairmanship of M.N Goiporia to find out thereasons for poor customer service in banks. The committee wasentrusted with the following tasks:
Identifying structural and operational rigidities in the bankingsystem
I Identifying ways and means of upgrading technology in banks
I Addressing deficiencies in services and suggesting ways toimprove the work culture among bank employees.
The committee identified as many as 97 areas in which existinglevels were inadequate. The important recommendations made bythe committee dealt with extended business hours for certain
services, working on Sundays and holidays in certain areas,introduction of technology in key areas, specialised branches forcertain customer segments, improving products like demand andbank orders and various other issues targeted at making the bankingsystem more customer oriented.
The above recommendations have much larger scope as far ascustomer orientation and marketing orientation are concerned. The
recommendations, however, did not mention about certain important
aspects like differential pricing for services with different qualitylevels and about the personnel management aspect or punitivemeasures, such as denial of promotions, increments. etc in instances
where customers services are not properly rendered.
149

The above recommendations brought little improvement in the level
of customer service. Without the earnest participation of all theemployees the implementation of the recommendation will beineffective. Meanwhile. banks faced increased criticism from the
public and the media. which adversely affected the image of thebanks.
This. in fact is an evidence of growing expectation and demands ofcustomers. Some policy level measures were also taken to tackle theissue of low levels of customer service. A few ofthem are:
1.
L4)
During 1992-93, the RBI initiated speedy action relating toadvancing of working hours, extension of business hours.acceptance of small denomination notes, exchange of spoiledor mutilated notes. immediate credit to local cheques up toRs.5000, payment of interest at enhanced rates on delayedcollection of out-station instruments.
.During the same period a format of complaint book oncustomer service was designed with adequate number ofperforated copies to enable their acknowledgement to be givento the complainant, to be forwarded to the controlling officewith the remarks ofthe branch manager indicating the positionregarding the disposal of the complaints within a time frame.
. In December 1994, banks were advised to undertake exerciseon manpower redistribution or redeployment of employeesamong the branches in consultation with the IBA.
150
. The banks were also advised not to insist upon photographs ofdepositors/account holders in the case of new savings bankaccounts without cheques facility and fixed and other termdeposits up to a maximum amount of Rs.10,000 especially, inrural and semi-urban areas in order to avoid inconveniencecaused to small depositors.
. The RBI, in May 1995, prescribed a time frame to ensuretimely credit to customers against various instruments.Besides. RBI had asked all commercial banks to urgentlyconstitute a committee under a general manager to identifyareas and factors responsible for delays in collection of outstation instruments and give suggestions.
.For expeditious and inexpensive resolution of customercomplaints against deficiency in banking services, theBanking Ombudsman Scheme was introduced in June 1995.Fifteen Ombudsman are now functioning in India.
. The commercial banks, in September 1995, were instructed topay a penal interest of 2% above the prevailing bank rate fordelayed credit to the beneficiaries’ accounts.
. RBI launched the Electronic (Credit) Clearing Services (ECS)in April 1995 for effecting bulk payment transactions such asinterest, dividends, etc. The facility is available at Mumbai,Chennai, New Delhi and Calcutta. RBI introduced facilitiesfor payment of utility bills (electricity, telephone etc) atChennai (August 1994) and Mumbai (March 1996).
9. The RBI has also started an Electronic Funds Transfer
151

System in February 1996. lt facilitates transfer of funds(maximum limit Rs.2.000) from one center to anotheracross banks with availability of funds assured on the daynext to the day of transfer. This facility is available atMumbai. and Chennai (in 1960 branches of 27 public sectorbanks)
10. Around 1400 branches have been fully computerised tillJune 1996. (Facilities like pass book printing, self- serviceterminals for customers, terminals at customers places, etchave been installed in many branches).
11. The banks were asked to introduce initially in the urban andmetropolitan centers, single window service for issue of draft,
pay orders, bankers cheques etc. up to Rs.10_,00O forexpeditious rendering of services.
12. The stand-alone ATMs at places other than branches andextension counters were allowed to provide functionalfacilities like pin changes; requisition for cheques books;balance enquiry; statement of accounts and inter-accounttransfer at the same center.
2.6.4 Customer Perceptions and Expectations
Perceptions is the process by which people select, organise andinterpret information to form a meaningful picture of the world. Aperson or a customer for that matter acts according to his perception

about a product or a service. Customers are exposed to a number ofstimuli or information. Each person fits this information into hismind-set. This information is stored in the mind in his own way,which is influenced by several factors like education. background.
past experience. etc of the person. Marketers are worried about how
customers will perceive their messages, products or services. Hence
all marketers will try to develop favourable perceptions about theirproducts in the customer’s mind. Similarly, customers developexpectations about the ‘value’ they will derive from buying aproduct. If these expectations are not met, customers will not besatisfied. Knowing a customer is thus very relevant in developingthe desired perception.
A common man may perceive getting loans from banks as acumbersome process though he has no past experience and he mightget this information from someone known to him. In the absence of
any efforts from the bank’s part to remove this unfavourable posture
of customers, such a perception will persist. Hence performing up to
the expectations and knowing the perceptions for taking correctivesteps are equally important. Similarly, customers do not know about
some products and facilities unless they are educated about it.Customers are valuable sources of information for:
0 Evaluating the effectiveness of products or services.
0 Modifying or designing products or services.
0 Removing misconceptions about products or services.
0 Spotting new opportunities for target marketing.
153

The gains of collecting information from customers will evolvelong-term benefits. Comparative perceptions of bank images have
also proved to be of importance in strategic management of banks as
pointed out already in section 2.3.2
2.7 Conclusion
Banks have a significant role to play in building up the economy ofa country. Banking industry all over the world has undergoneradical changes during the recent times. In India. the industry hasentered a new phase, as a result of the liberalisation andderegulation initiated in 1991. After the nationalisation of banks in1969, this is reckoned as another transition period, perhaps, much
more influential than the former and capable of revolutionising the
whole concept of banking in many respects. Firstly, the reformshave unleashed competition into the industry. Secondly, thetransition has more to do with the adoption of technology andthirdly, it has brought the customer to the focus of all the operations
and attitudinal changes. Marketing of banking products thus become
inevitable. Applying the principles and techniques of marketing has
certain difficulties with respect to banking products. The multitude
of products or service categories and customer groups make it even
tougher. However, the basic concepts are the same with any product.
A financial product is a combination of benefits and services. The
generic nature of most of the banking products makes it difficult todifferentiate one brand from the other. Customers traditionally used
image of the bank and convenience factors as criteria for choosing
their banks. But competition has led to the introduction ofdifferentiating aspects like service quality and customer
154

satisfaction. which is a composite whole of several aspects.Competition in urban areas is thus taking a new form with the use
oftechnology. to offer a wide range of convenience products. It willbe long before PSBs and OPBs achieved the kind of progress FBsand NPBS have already made in this area. PSBs and OPBs have to
compete with others on an uneven playing ground. It is quiteapparent that PSBS and OPBs have to change their attitude andculture in general to achieve more efficiency and customerorientation. It. however, do not imply that FBs and NPBS are safein the market. They have to survive among the giants and severalother NBFCS and Fls. Their distinctiveness is the quality of services
and core competencies to serve certain niche segments. They arealso looking for newer potential market segments that can be viablyserved.
Service quality as a differentiating element is gaining importancein today’s competitive scenario. Customer satisfaction and servicequality are closely related, and comprise ofa number of factors like
convenience, cost, returns, staff, attitude, speed, etc. Howcustomers perceive these aspects with respect to different bankgroups is important in deciding the marketing and positioningstrategies. The basis of marketing approach in banking is henceknowing the customers, knowing the business, knowing thecompetitions, and realising the importance of being different. It isevident from the discussions that central to the understanding ofthe
marketing approach is the realisation that ‘money‘ can be sold as a
product and the focus of all activities hence would the customer.
155

Notes and References:
Id
5
\l
. May 12. 1974
. Thomas W Thompson, Leonard L. Berry and. Philip H.Davidson,
Planning, Van Nostrend Reinhold Company, New York. 1987.p.107.
Banking Tomorrow: Managing Markets Through
. Ibid., p. 108.
. R. Eric Reiden Bach and Robert E Pitts, Bank Marketing: A
Guide to Strategic Planning, Prentice Hall, Eaglewood Cliffs,NJ, 1986, p.l.
. lbid., p.8.
. Theodore Levitt, ‘Marketing Myopia‘, Harward Business Review,
July-August, 1960, pp.45-56.
Arthur Meidan, Marketing 0fFinancial Services, MacMillanPress, London, 1996, p.l.
. A. Parasuraman, Valerie A. Zeithaml and L.L Berry,
‘Expectations as a Comparison Standard in Measuring ServiceQuality:
Marketing, Vol.58, 1994, pp.l32-139.
An Assessment of a Reassessment’, Journal of
R.M Morgan and S.D Hunt, The Commitment-Trust Theory
156

10.
ll.
12.
14.
of Relationship Marketing‘, Journal ofMarketing, Vol.58.
1994, pp.20-38.
R.T Rust.. and A.J Zahorik. Customer Satisfaction.
Customer Retention and Market Share‘. Journal o_fRetailing.
Vol.69. 1993. pp.l93-215.
J.L Heskett, T.O Jones, G.W Loveman, W.E Sasser, jr. andL.A Schlesinger, Putting the Service profit Chain to Work‘Harwara’ Business Review, March—April, 1994, pp.l64-174.
R.T Rust., A.J Zahorik and T.L Keiningham, Return onQuality: Measuring the Financial Impact of your Company’sQuest for Quality’, Probus, Chicago, Illinious,l994.
A product provides time utility to a customer if he is able
to purchase it at the time they want and place utility gives thecustomer the convenience of getting the product at the place
customer would like to shop from.
Products that have no brand at all other than identification of
their contents and the manufacturer or middleme.
. Micheal E Porter, Techniques for Analysing Industries,
Competitors and Competitive Strategy, Free Press, New York,1980.
Noel McGinnis_. ‘Networking: A Way to Manage Our Changing
World‘, The Futurist , June 1984, p.9.
157

l5. Derek F Channon, Bank Strategic Management and
Marketing, John Wiley and Sons. UK. 1986. p.8.
16. Philip Kotler. Marketing Management. Eaglewood Cliffs.
NJ: Prentice Hall. 1980. p.99.
l7 Ibid.
18. The conventional bank branches are referred to as brick and
mortar banks which are being increasingly replaced byelectronic terminals and other forms of banking such astelebanking and homebanking through internet. It is expectedthat bricks-and-mortar banks with marginal profitability or thestagnant ones are likely to get converted into such 'full serviceelectronic banks’ or mini-offices as had happened in theadvanced countries.
19. Jayantilal Jain, ‘The future of Information Technology in
Banks‘, in Narendra Jadhav (ed.), Challenges to IndianBanking: Competition, Globalisation and Financial Market,MacMillan India, New Delhi,l996, p.332.
20. George J Vojta, ‘New Competition and its Implication for
Banking’, The Magazine of Bank Administration, Vol. 9, No. 7,1933, p.36.
21. Excerpts from a Survey by the National Council of Applied
Economic Research (NCAER) on Consumption Patterns of
I58

Select. Manufactured, Consumer Goods. as reported in ‘Markets
for Consumer Products (Part I & II)‘ The Hindu-Business line,
September 15-16, 1994.
22. Ibid.
23. NCAER. 0p.cit.
24. K.R Ramamurthy, Strategic Repositioning: Need ofthe Hour:Old Private Sector Banks‘ The Hindu-Business Review,December 15. 1999.
25. K.A Chankar, Wowing Individual Investors Right’, BrandEquity95, Bombay 1995, p.68.
26. Economics Times, Banks Top Deposits Mobilisation List’,Bombay, November 11, 1998.
27 In order to introduce greater competition in the banking system
RBI gave approval in principle for the establishment of newbanks in private sector in 1992-93.
28. E.Jerome Mc Carthy. and William D Perreault, Jr., Essentials
of Marketing, Irwin McGraw-Hi1ll,1997, New York, p.120.
29. A Joy, C Kim, and M Lorohe, Ethnicity as a FactorInfluencing the Use of Financial Services‘ Internationaljournal ofBank Marketing, Vol. 9, No. 4, 1991, pp.l0-16.
159

30 Anna S Mattila, ‘The Role of Culture in the Service Evaluation.
Process‘ Journal of Service Research. Vol.1. No.3. 1991.pp.50-6l
3| M.C Lenora. 'Segmentory Credit Card Holders by Behaviour'
Journal ofRetail Banking. Vol.13. No.1, Spring 1991. pp.24-29.
32. P Martineau, ‘Social Classes and Spending Behaviour’, Journal
ofMarketing, Vol.22, October 1958, pp.12l-30.
33. Ibid.
34. Rajashekar G Javalgi, and Paul Dion, ‘ Life Cycle Segmentation
Approach to Marketing Financial Products and Services’, TheServices Industries Journal, Vol.19, Issue 13, London, July
1999, pp.74-96.
35. E.Jerome Mc Carthy and William D Perreault, Jr., op.cz't.,p.l14.
36. Ghosh D.Roy, ‘Customer Knowledge Management: Branch
Level Significance’, Vinimaya, Vol II, No. 1,1999, pp.50-53.
37 Arthur Meidan, op. cit., pp.31-32.
38 J.N Fry, ‘Customer’s Loyalty to Banks- A Longitudinal Study’,
Journal 0fBusiness, September 1973, pp.5 17-25.
39. R.Eric Reidenbach and Robert E. Pitts, op.cit., p.60.
160

40
4|
42.
43.
44.
46.
47
48.
49.
.Arthhur Meidan. 0p.cit.. p.37
L.L Berry. ‘Marketing-The time is now’, Savings and Loan
News(US/1). April 1969. pp.60-l
Rajeev V.K Seth. Marketing ofBanking Services, MacmillanIndia. New Delhi, 1997, p.38.
National Institute of Bank Management (under the aegis of
Indian bank’s Association), All India Savings and DepositsTrends and Patterns, Pune, 1986.
Economic Times-Brand Equity, ‘Banking on Branding’, October
1993, p.7-13.
.Ibid.
lbid.
Results of Survey conducted by Credit Card and Management
Consultancy (CCMC), as reported in Show Me the Money‘ inEconomic Times, October 4, 1998.
Eric R Reidenbach and Robert E Pitts, op.cit., p.73
Nelson Valverde , ‘Developing Profitable Strategies That Don't
Box You in’, Bank Marketing, June 1983, pp.l-16
l6l

50. Parasuraman, Zeithaml and Berry, op.cit.
51. A. Parasuraman, Valerie A. Zeithaml and Leonard L Berry ‘A
Conceptional Quality and its Implications for Future Research‘
Journal ofMarketing, Vol.49, Fall 1985, pp.4l-50.
52. Valerie A. Zeithaml, ‘How Customer Evaluation Process Differ
Between Goods and Services’ in J.Donnelly and W.George(eds). Marketing of Services, Chicago: American MarketingAssociation, 1981, pp.l86-190.
. A. Parasuraman, V A. Zeithaml and L.L. Berry, 'SERVQUAL:
A Multiple-Items Scale For Measuring Consumer Perceptions Of
LII Lo)
Service Quality’, Journal of Retailing, Vol.64 (Spring 1988),pp.l2-40.
54. As reported in Vikalpa, July-September 1990, pp.23-29
55. Indian Banks Association, Survey on Public Sector Banks
Customer Service: 1996-1997, as reported in [BA Bulletin,special ISSUC, March-1997
56. B. R Lewis, ' Service quality: Recent Developments in
Financial Services‘, International Journal ofBank Marketing,
Vol.11, No.6, 1993, pp.l9-25.
57. J. A F.Nicholls, S. Roslow, J. Tsolikis, ‘Time is Central‘,
International Journal 0fBank Marketing, Vol.11, No.5, 1993,
pp.12—18.
162

58. J. C Chebet. and P.Filiatrault. 'The Impact of Waiting in Lineon customer‘, lnternatinal Journal ofBank Marketing, Vol.1 1.
No.2, 1993. pp.35-9.
59. Leonard L.Berry and A. Parasuraman. ‘Listening to the
Customer-The Concept Of Service Quality Information System’.
Sloan Management Review, Spring 1997, pp. 65-75.
60. Vital. N, Full Spectrum Thinking AndComputerisation’, Economic Times, September 16, 1999.
61. Excerpts from the study conducted by Indian Institute of
Management with the support of M/s. Canbank ComputerServices Ltd. on the impact of Computerisation of Indian Banks,
as reported in [BA Bulletin, Special Issue, March 1997
62. V.Nagadevara and S. Iagdeesh, ‘Total Branch Automation
Customer Perceptions’, [BA Bulletin, Special issue, March 1997
63 R.Narasimhan, ‘Can Computerised Branch Run DifferentlyThe Hindu, April 26, 1999.
64. Economic Times, September 16, 1999
65. Liberalisation and deregulation in the financial sector
encompass interest rate and other price deregulation measures,
removal of direct credit controls and mandatory investmentregulations, measures designed to promote entry of new
163

competitors, supportive merger and ownership policy, prudential
regulation and reliance on indirect tools for control andtransparency
66. Micheal Porter, 0p.cit.
67. R.H Patil. ‘Contemporary Banking: Competition and Markets‘
in Narendra Jadhav (ed), Challenges to Indian Banking:Competition, Globalisation and Financial Markets, MacMillanIndia. New Delhi, 1996, p.105.
68.1bid.
69. Rajiv Handa, ' Banking ofa Different Sort‘, The I-Iina'u, July 30,1997
70. Report of Narasimham Committee (2) Recommendations on
Systems and Methods in Banks, 1998.
71. C.Rangarajan, ‘Indian Financial System: Current Issues, Future
Challenges’ in Narendra Jadhav (ed), Challenges to IndianBanking: Competition, Globalisation and Financial Markets,MacMillan India, New Delhi, 1996, p.7.
72. Mary Crystal, ‘That was Then, This is Tomorrow’, Bank
Marketing, Washington, December 1997/January 1998, pp.28-52.
164

73. C.R.L Narasimhan, Changing profile of Banks: 15 it for thecommon good The Hindu, January 17, 2000.
74. The Financial Express-FE Select. ‘Expanding the Horizons‘
November 1998. p.21
75. Ibid
76. The non-interest income of both NPBs and FBs are higher than
that of other bank groups. 20.56% income of NPBs and 26.01%of FBs is from non-interest income, while other groups have13.16% as reported in Report on Trend and Progress ofBankingIn India I998-99, RBI.
77 Ibid.
78. The Financial Express-FE select, Differentiation is the Game’,November 1998, p.25.
79. RBI, Report on Trends and Progress in Banking in India 19992000, Mumbai.
80. Abhijit Roy, ‘Whither Non-Bank Finance Companion’, TheHindu, December 17, 1997
81. Report on Trend and Progress ofBanking in India, I998-99,op.cit., p.100.
82. Ibid.
165

83. Ibid.
84. Ashish Saboo. ‘Trials and Tribulations’. Economic Times.
December 2, I997
85. K.S Gopal. Competition in the Banking Industry" [BA
Bulletin. New Delhi, January 1997, pp. 1 1-15.
86. l(.C Chakrabarty, ‘Customer Service in Banks, The Challenges
Ahead’. IBA Bulletin, Special Issue, 1997, pp.23-26.
37 lbid.
88. K.C.Chakrabarty, Customer service in Banks: Search for a New
Paradigm‘, in Narendra Jadhav (ed), Challenges to IndianBanking: Competition, Globalisation and Financial Market’,MacMillan, New Delhi, 1996, p.202.
166

CHAPTER 3
BANKING IN KERALA - AN OVERVIEW
3.1 Introduction
Kerala is a tiny stretch of land tucked in the southern part of India
with a spread of 38863 sq.km. and a population of 2.9 lakhs (1991).
A naturally protected strip of land with Arabian Sea on the westernside and mountain ranges on the eastern side, is blessed with regular
monsoons and moderate climate. The early trade relations withforeign countries and the generally favourable geographical andclimatic conditions have helped its people achieve a higher socioeconomic level when compared to the other states in the country. In
many respects, the people of Kerala enjoy a better standard ofliving. The higher educational spread and social awareness havelead to the growth and spread of banking culture in the state.Banking have long been in existence in Kerala and have foundinroads into the life of even the common man. In fact, for a statewhich has been depending on the remittances of its non-residentpopulation, this was rather a necessity. With the result, Kerala now
tops among all states in terms of number of bank offices per lakh of
population. 1
Economic development and growth of banking in any region areconsidered to be complementary to each other. Generally, progress
in social development is supposed to impact trade, commerce and
banking. But the state of Kerala provide a paradoxical
167

developmental experience of high social development with pooreconomic performance. This has been rather well connected to the
over-emphasis on social development. stagnation of the productivesectors and a continual dependence on the inflow of non-residentremittances. a situation which is often called the ‘money ordereconomy’ The growth of banking industry in Kerala. therefore. ismore or less attributable to the steady inflow of non-residentdeposits. The huge NR1 deposits in some banks have even erodedthe profitability of these banks and have raised their cost ofdeposits. However, saving in bank deposits are also popular acrossall population groups. On the contrary, loans do not enjoy acorresponding popularity in the state. Credit to Deposit Ratio (CDratio). a key indicator ofa buoyant banking business, has been verylow in Kerala since many years. Imbalance between deposit andcredit is often attributed to the heavy NRI remittances. But it hasmany other dimensions such as poor credit absorption in the statedue to the stagnation in the industrial and agricultural sector.
Given the above background, the savings of people get channelisedinto safer avenues like bank deposits or physical assets. Thepreponderance of private sector banks, Chitty and Kuri companies,
and private money lenders is yet another significant dimension ofthe banking scenario in Kerala. The banking culture is thus a part of
the social milieu of the state. Further, the high inclination toconsumerism and the strong desire among the people to constantlyupgrade their social status and quality of life offer suitable marketfor retail credit for the banks. The state thus provide a uniquepicture in terms of financial product purchase behaviour. Thefollowing sections examine the socio-economic aspects that have
168

been largely responsible for the increased popularity of bankingactivities here. The socio-economic aspects, which might influence
the banking habits of people in the urban areas and the generaltrends of banking in the state have also been discussed in thesesections.
3.2 Historical Importance of Banking in Kerala
Private banking had a significant impact on the economy of Kerala
since historic times. Private money lenders and Hundi merchantswere the two types of indigenous bankers in Kerala. Theseactivities were mostly concentrated around Thrissur and Thiruvalla
regions. Tamil Brahmins who were Hundi merchants undertookearly dealings in money matters in Thrissur. Banks, private firms,and individuals conducted the Chitties and Kuries. 'Pana Payattu', a
unique financial product was popular in the Malabar area. It wasthe Syrian Christians of Thrissur who initiated modern bankingmethods in Kerala. They started banks by forming joint stockcompanies and made good progress in it. South Indian Bank andThe Catholic Syrian Bank were among the important private banksin those times. The only non-Christian bank started during thosedays was Dhanalekshmi Bank. The Cochin Nair Bank set up by the
Nair Community was merged with the State Bank of Travancore.Similarly, in Thiruvalla and other Christian dominated regions also,
banks were set up,of which Palai Central Bank is more known for its
failure among the erstwhile private banks in India. Though some ofthese institutions met with disastrous ends, they have contributedlargely to the growth of banking business in Kerala.
169

In the early 1930s. a number of small entrepreneurs were attracted
towards setting up small banks that could be registered under theCompanies Act of the Travancore Government. The first to register
was the Ambalapuzha Christian Bank followed by Catholic SyrianBank in 1918. Later. a number of small banks like Bank of Deccan
(I919), The Central Banking Corporation of Travancore (I926),Kottayam Bank (1926), The Palai Central Bank (1927), Bank ofCochin (1928), South Indian Bank (1929), Travancore ForwardBank (1929), Tranvancore Federal Bank (I931-which later becamethe Federal Bank), The Oriental Insurance and Banking Union(1933), The Indian Insurance Banking Corporation (1933), and The
Nanchanad Bank (1937) were registered. Between 1950 and 1970,as many as 150 banks were operational in the state, which shows the
scale of potential for banking prevalent in the state, even at such anearly stage of development. But in the 19605, private banking inKerala underwent devastating changes, mainly as a consequence ofthe fall of the Palai Central Bank. Subsequently, the survival ofsmall banks came under severe threat. Some of the small banks
were merged with stronger ones like South Indian Bank, FederalBank and State Bank and finally shrunk to just seven private sector
banks through Iiquidations, amalgamations, and mergers. Theprivate banks since then have strived to achieve remarkableprogress. especially, in the rural and semi-urban areas, but mostlyin certain regional domains. Then the nationalisation of Banks inIndia in the year 1969 paved the way for many nationalised banksand State Banks into this state. Currently the most wide-spreadbank in Kerala is State Bank of Travancore with 550 offices (as on
170

December 1999). Nationalised banks have also been able tosuccessfully function in the state.
On the non-banking sector also, Kerala witnessed a mushroominggrowth of private financial unincorporated bodies (PFUBS) starting
from the late 1970s till early 1980s. Much later. they were knownas ‘blade companies’ These companies mainly target at the smallinvestors to mobilise their funds and unfortunately, many have been
trapped by a large number of unscrupulous operators among them.Though these companies met with disastrous ends in the mid 1980s,
they have managed to stage a come back again as visible from the
increasing number of new such companies started since 1992. There
are about 500 NBFCs in Kerala, which are registered with RBI, andabout 12,000 in total including those in the unrtrganised sector.
Banking in Kerala is thus very much a part and parcel of the life ofa Keralite whose high social awareness, yearning for financialsecurity and affluence, combined with higher educational levelshave enabled the industry to grow and prosper inspite of thelackluster economic growth.
3. 3 socio-economic Aspects and Growth of Banking
Banks have a predominant role in every Malayali's life. The highliteracy levels and general educational levels among both men andwomen have created an awareness of formalised saving avenues.The advancement in socio-economic well being of people had been a
topic of study in many a forum, because of its mismatch with thelow economic growth in the state. The state with a per capitaincome lower than the national average has a per capita
17l

consumption higher than the all-India average.2 Of the 12 statesstudied by Morris and Mc Alpin with 1971 data, Punjab. which was
the richest state in India then, came next to Kerala with a physical
quality of life index (PQLI) of 50 only.’ The PQLI of Kerala hasalways been much higher than the national average.‘
The natural conditions in the state provide a conducive environment
for peaceful living, when compared to the neighbouring states withextreme climatic conditions. The place has been blessed withabundant natural resources like water, cash crops and a number of
other food crops sufficient for the people to live in a self reliantway, though, these advantages have not been utilised effectively for
growth of the economy. Notwithstanding the backwardness on theindustrial front, banking business flourished in Kerala sincehistorical times. The state has the highest reach of banks, with onebank for 10,000 people. The widespread banking culture in the state
is the result of high educational levels, good social infrastructure,steady inflow of NRI funds and highly monetised economy, rather
than the results of industrial or agricultural activities.
The socio-ennnomic conditions have a significant impact on thechoice of banks, banking products and services and also on theopportunities for new banks and their innovative practices.Consumer behaviour is influenced by both internal and externalfactors relating to a person and mostly deals with socio-cultural andpsychological factors such as personal characteristics. It can thus be
said that savings and consumption pattern of people is an indicationof their socio-economic levels. For instance, the demand forfinancial services by the different classes differs more in the

intensity of usage by the various classes.5 People of lower socialclasses tend to borrow for personal use while upper class for other
purposes like house construction. purchase of durables. etc.6 Similar
variations may also be observed in credit usage.
Demographic Factors
A sample study done by Kerala Statistical Institute (1992) givessome insight into the socio-economic conditions of people inI(erala.7 The study examines changes in the socio-economic aspects
over a period of 1986-87 to 1990-91. During this period, there was
marked increase in the urban households in the income category of
Rs 2000 and above (Table 3.1). Changes in the higher incomehouseholds are not known, as there are no further divisions for the
category of Rs.2000 and above. The fast changes in the incomelevels can change the purchase pattern and savings potential of thefamilies.
Table3.1Distribution of Households by Household Income
Population Year Percentage of Households (by monthlyGroup Income in Rs.)
Below250- 500- 750- 1000- 2000250 499 749 999 1999 Above
Urban 1986-87 7.8 11.7 20.2 15.0 25.1 20.2
1990-91 1.7 3.2 10. 14.0 34.8 36.3Source: Kerala statistical Institute, Socio-Economic Changes inKerala-A study Based on Selected Localities, October 1992.
The type of housing the people have is also a reflection of theirgeneral well being. The above study also gives a picture of the
173

social development based on this aspect. Nearly 93% of householdswith income above Rs.1000 had pucca houses. In rural areas more
people (10.4%) now have tiled or concrete roofed houses.“ A houseis considered as a status symbol and most of the people want it to be
built as strong, durable and self contained structures and also spend
lavishly on it. This is rather true in the case of ofa Keralite.
Table 3.2 shows the changes in age distribution of people. The shiftin the pattern is much visible with regard to people in the age groupof 60 and above (3.4%) which is steadily increasing whilepercentage of people below 14 is on the decline. This indicates thehigher levels of social awareness, education, and better healthservice facilities existing in Kerala. Those in the age range 15-59are also on the increase. Some studies have shown that this is thesegment in need of most of the banking products and services.However, information on age groups between 15-59 would yieldmore useful hints for banks in targeting at specific markets.
Table 3.2Changes in Age Distribution
(as percentage to total)Below 15 15-59 60 and above
Year Male Female Total Male Female Total Male Female Total
1961 43.6 41.7 42.6 50.7 52.3 51.5 5.7 6.0 5.91971 41.1 39.5 40.3 53 54.0 53.5 5.9 6.5 6.21981 36.1 34.0 35.0 56.8 58.1 57.4 7.1 7.9 7.61986-87 33.6 30.1 31.7 59.3 61.6 60.5 7.1 8.3 7.81990-91 29.0 26.4 27.7 62.5 64.1 63.3 8.5 9.5 9.0Source: Census surveys of 1961,1971,1981 and Survey of Kerala Statistical
Institute.
174

As mentioned in the previous chapter segmentation in marketing of
banking products could base on certain key dimensions such as age.
income. and occupation of customers. These factors may alsoinfluence purchasing habits for financial products. Table 3.3presents the distribution of people in different types of occupationsin the urban areas.
Table 3.3Occupation of Employed Persons in Urban Areas as on 1990-91
(Figures in percentage to total)
Percent of EmployedPersons
OccupationMale Female Total
Professional
and Technical 9.5Administrative
ls) DJ IQ 12.5
and Executive 7'8 3‘6 6'9Clerical and
11.2 16.7 12.4RelatedService
Workers 14.6 3.5 12.2Cultivators
5 7 17 6 7 7AgriculturalLabourers 7.3 3.6 6.4Production
and Related 28.9 10.6 24.9Workers
Others 6.4 3.0 5.7Total 100.00 100.00 100.00Source: As in table 3.1
175

It is evident that majority ofthe employed people are either in white
collar or in blue-collar occupations. Another notable aspect is that43.5% of the employed women are in regular paid jobs. Thissegment offers good potential for savings accounts as well as creditproducts.
Popularity of Bank Savings and Credit
Table 3.4 represents the households with bank accounts and debts.Over sixty six percent people in urban area had accounts in bankand only 24.3% had debt. In the rural areas 52% households hadbank accounts while 63.8% had debt.
Table 3.4Distribution of Households with Bank Account] Debt-1990-91
Population Percentage of Percent householdsGroup Households With debt
With Bank
Urban 66.5 24.3Rural 52.0 63.8
Source: As in table 3.1
176

Table 3.5Distribution of Deposits and Credits in Rural, Semi- Urban and Urban
Areas of Kerala-March 1997.(Amount in Rs.Lakhs)
Deposits CreditPopulation .. N91“ No of Amount Amount(xroup offices Accounts
R I 346 l6,946,57 1207.20 691.80‘"3 (10.32) (8.63) (5.2) (6.57)
Semi-Urban 2,241 142862,06 15234,79 5633,83(70.1) (72.74) (65.79) (53.53)
Urban 611 36601,96 6714,48 4198.30(19.11) (18.64) (29) (39.89)
Total 3198 19,64l0,59 23156,48 10,523,93(100) (100) (100) (100)
Note Figures in brackets are percent to total.Source Reserve Bank of India, Basic Statistical Returns
March 1997
Table 3.5 shows how credit usage varies among rural, urban, andsemi-urban populations in Kerala. Though 66.5% had debt in ruralareas in terms of value, urban areas had absorbed more credit(39.89%). Obviously, semi-urban area had the highest debt amongall categories. Urban credit may be due to commercial borrowings in
big volumes compared to larger number of small debts in ruralareas. The trading and agricultural activities in the rural areas also
177
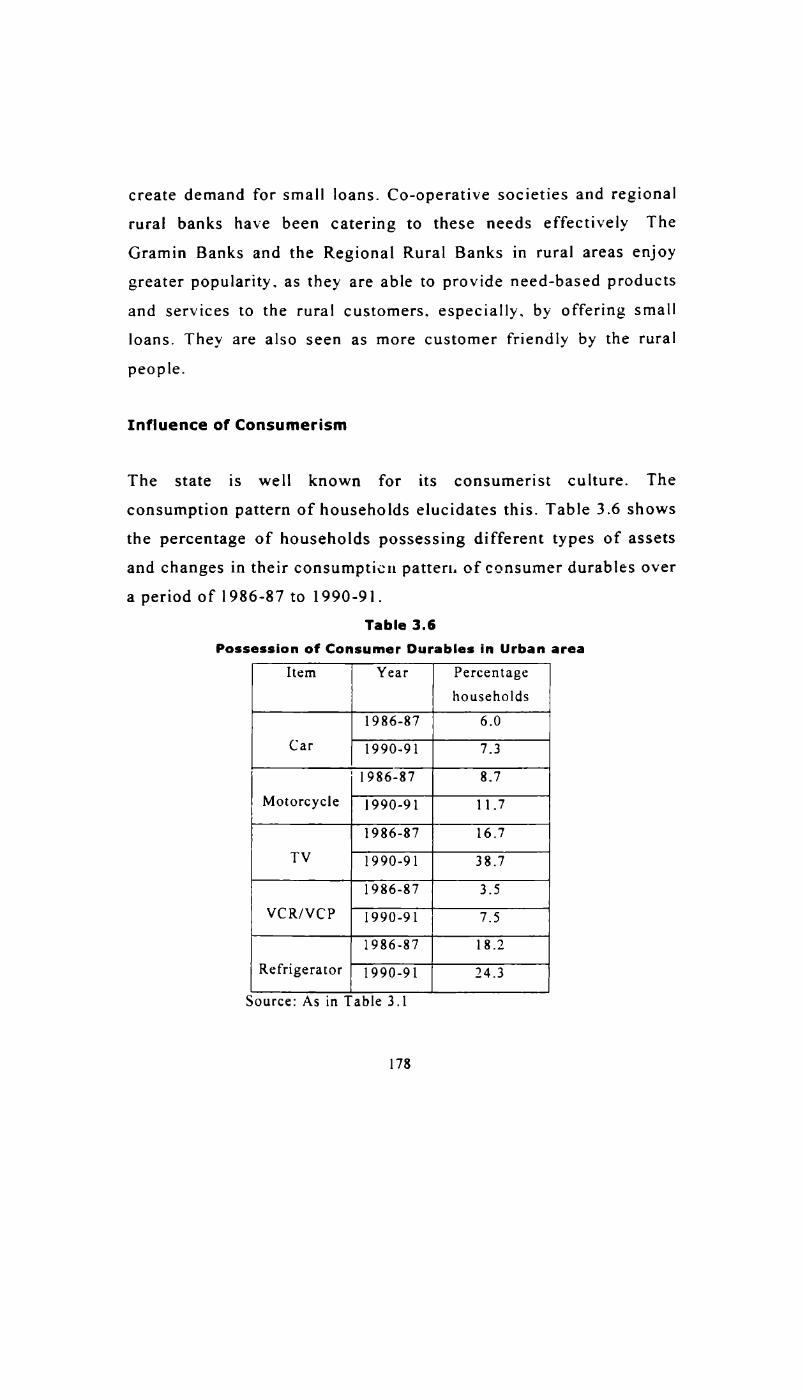
create demand for small loans. Co-operative societies and regionalrural banks have been catering to these needs effectively TheGramin Banks and the Regional Rural Banks in rural areas enjoygreater popularity. as they are able to provide need-based products
and services to the rural customers. especially. by offering smallloans. They are also seen as more customer friendly by the ruralpeople.
Influence of Consumerism
The state is well known for its consumerist culture. Theconsumption pattern of households elucidates this. Table 3.6 shows
the percentage of households possessing different types of assetsand changes in their consumption pattern. of consumer durables over
a period of 1986-87 to 1990-91.Table 3.6
Possession of Consumer Durables in Urban areaItem Year Percentage
households
1986-87 6.0Car 1990-91 7.3
1986-87 8.7Motorcycle 1990-91 11.7
1986-87 16.7TV 1990-91 33.7
1986-87 3.5VCR/VCP 1990-91 7.5
1986-87 18.2Refrigerator 1990-91 34_3
Source: As in Table 3.1
173
Changes in the purchase pattern of motorcycle, TV. VCR or VCPand refrigerators indicate not only the affinity to purchase durables
but also the increase in purchasing power of people in a short span
of five years. But most of the goods. both durable and non-durablepurchased by Keralites are produced outside the state. Besides, data
on per capita consumer expenditure pattern indicate that Keralafigures above the national average and also that the rural per capitaconsumption in Kerala is the highest (Table 3.7) in the country. In
urban areas, in terms of per capita expenditure, Kerala is onlybehind Tamilnadu but above the national average.
Kerala offers a suitable test market for most of the new consumer
goods sold in India. fhis consumerist behaviour is also backed bythe attitude of people towards general well being and affluence. Insuch an environment people will have to plan for their futurepurchases both in terms of saving money for it and financing thepurchases. It is a fact that the largest number of a few leadingbrands of new cars, mobile phones, and several white goods arebeing sold in Kerala, which is relatively a small state in the country.
179

Table 3.7
Per Capita Consumer Expenditure in Southern States(in Rs.)Year I
State 1987-88 5 1992 1987-88 1992Kerala 211.5 ‘L 343 276.2 405
! '1'amil Nadu 154.3 238 248.8 447lKarnataka 149.1 223 222.8 361Andhrapradcsh 160.1 242 230.3 369
India 158.1 247 249.9 399
Source: Indian Economic Information year book-1996,
A NAgarwa1 and Hari Om Varma based on NSS Report No. 311,319. 381 & 397.
In a survey done by Kerala State Planning Board in 1981, it wasreported that the aggregate household savings was 18% while thenational average was only 14%.° Of the gross household savings.44% savings were in the form of various financial assets including
currency holdings and the rest 56% in physical assets. Averagehousehold savings in bank deposits was Rs.258 in the urban areas.10
The above facts put together explain that the educational, social,and attitudinal aspects are favourable for the growth of banking inKerala.
Remittances from Abroad
Another characteristic aspect that has contributed to the growth ofbanking in Kerala is the remittance of Non-Resident Keralites(NRK). This has transformed the socio-economic environment in
180

Kerala to a great extend. Starting from the 19705 till date a majorpart of the savings come by way of NR1 remittances. As on 1998March. Non—Resident External Deposits (NRE) stood atRs.9074.l7crores, which is 47.6% of the total bank deposits. This
could have facilitated industrial growth. and other economicactivities whereby giving a boost to banking business. But in theabsence of any dynamism in the productive sectors of the state. thenon-resident savings found their way into construction andmodifications of houses and other extravaganzas like marriages,purchase of vehicles, improvement of landed properties, etc. Morethan 70% of the savings were spent for these purposes.”
The ‘Blade Companies‘
In the 19905. even before the unpleasant experiences ofthe failureof ‘blade companies‘ had faded away, investors went through themaze of trying their fortune with the so called money-multiplierfinancial products such as ‘Goat’, 'Mangium' and ‘Teak’ schemeswhich lured them with returns so far unheard of. In 1995, a singlesuch company mustered about Rs.4.l2 crores from around 42,000investors.” About 40 such companies collected in all aboutRs.100crores from the gullible investors. The companies fell one byone and investors were left high and dry. Earlier in the mid-80's,the so-called unscrupulous ‘blade companies‘ had looted aroundRs.1000crores from the public.” These incidents, in a way,indicated that there is a fair degree of affinity in people to find asubstitute for the traditional saving schemes of banks and otherfinancial institutions.
181
Migration to Other States
Armed by better educational qualifications Keralites have alwaysshowed migratory tendencies. They have migrated to different partsof India and to other countries as well. mostly in search of gainful
employment. Due to unfavourable conditions in the state, evenKeralite entrepreneurs have migrated to other states. Migratoryphenomenon also had its reflections on banking needs and given riseto more transaction-based businesses to banks. OPBs havesuccessfully tapped this potential by expanding to such places withhigher concentration of migrated work force from Kerala. Some ofthe OPBs went even out of the normal banking activities to provide
a total package of assistance to the ever- increasing new needs ofthe NRKS.
3.3 Banking in Kerala - Basic Statistics and Implications
Banking culture is deeply rooted in Kerala’s socio-economicbehaviour. Public sector banks and private sector banks have made
significant contributions, in their own way, to the economicdevelopment and growth of banking in Kerala. In fact, the state ishome for the top ranking private banks in India that have stood thetest of times and have surpassed many of the critical andtransitional phases in policy and competitive environments in theIndian banking history. They are also able to successfully tide over
fundamental changes in structure and competitive environmentbrought about by the recent reforms. Now, in the post-reformsphase, more foreign banks and new private banks have made theirway into the state with a view to capture the segments with

preference for class banking facilities. The states urban centersnow have more ATMs than before. The changes ushered in by the
post-reforms competitive environment are more evident in theappearance and service quality of banks. Further. the newlyintroduced norms for banking industries make the public sectorbanks more vulnerable to competition as they can no longerfunction in a protective environment as before. Development ofbusiness for the PSBs may mean more versatile activities such as
identifying new opportunities, target marketing, and above all.achieving operational efficiency and higher productivity levelsrather than treading in the advantages of mass-market popularity. In
the following sections an analysis of the basic banking statisticsof Kerala is carried out to understand the nature and scope ofbanking activities.
Branch Spread
Historically, Kerala provided a fertile soil for the growth of banks,
especially, in the private sector. A report entitled ‘Role of KeralaBased Private Sector Banks in the Development of the State‘ states:
As the Travancore-Cochin Banking enquiry commissionspoint out. the number of banks in Travancore (i.e. one of
the three component parts of the present Kerala state) in1929-30 was 258. which contributed about one fifth ofthe
erstwhile British India. 14
If the banks in the princely state of Cochin and Malabar provincewere to be added, the total number of banks in the regioncomprising the present Kerala state would have been not less than
183

one-fourth of the number of banks then existing in the erstwhileBritish India. The number of people per banking office in as earlyas 1955 was the lowest (15891 in Travancore-Cochin). ‘5 Thecorresponding all-India figure was 87.675. It continues to be soCVCYI HOW.
There are 44 scheduled commercial banks and 6 new private sectorbanks operating in the state now (as on December 1999). The totalnumber of branches is 3210 of which 292 are Gramin banks. Kerala
has 32.84% (1999 March) of its banks in the private sector while at
the national level only 7.5% (1999 June) of the total banks are inthe private sector. The share of nationalised banks in the totalnumber of banks (32.07 %) is, lesser than their all-India share(49.i1%).16 SBT has the maximum number of offices in the urbanareas (58 as on 1992 march). Table 3.8 gives the branch spread ofvarious banks against the three population groups in Kerala.
Table 3.8Distribution of Bank Branches of Selected Banks According to
Population Group March-1992Bank Rural Semi- Urban Total
urban
State Bank of 23 133 55 211India (10.9) (63.03) (26.0§)State Bank of
Travancore 58 400 58 516QL24) (77.52) (11.24)
Canara Bank 23 149 29 201(11.44) (74.12) (14.43)
184

C ontn.Bank Rural Semi- Urban Totalurban
Syndicate 20 65 19 104Bank (19.37) (62.5) (18.27)Union Bank 24 64 23 111
(21.62) (57.66) (20.12)Catholic
Syrian Bank 101 67 15 183(55.19) (36.61) (8.2)
DhanalekshmiBank 13 75 13 101(12.87) (74.35) 412.87)
The Federal 123 130 21 274Bank (44.89) (47.44) (7.66)South Indian 49 117 14 180Bank (27.22) (65.00) (7.78)Standard 2 2Chartered (100.00)ANZGrindLays 2 2Bank (100.00)North Malabar
Gramin Bank 46 76 122(37.7) (62.29)
South Malabar
Gramin Bank 140 4 3 147(95.24) (2.72) (2.04)
Note Figures in brackets denote percentage to total.Source: Data presented at State Level Banker's Committee
185

State Bank of Travancore (SBT) is the most dominant bank with a
hopping 550 (as on December 1999) braches spread all over thestate and over 100 outside the state. They were the first bank among
the Indian public or private sector banks to install an ATM in thestate. They have more branches in the urban areas while OPBs such
as Federal Bank, Catholic Syrian Bank and South Indian Bank havesmaller shares of their banks in the urban area. But they have asignificant presence in the semi-urban and rural areas. Theirstrategy of geographical concentration followed in the past isevident in this data. Federal Bank has 47.44% of its offices in semi
urban areas and 44.89% in rural areas. SBI has 10.9% of its banks in
rural areas, OPBs of Kerala also have significant presence outsidethe state. Federal Bank has 110 branches outside the state (as onMarch 1997).” Other leading OPBs, viz., South Indian Bank has156 and Catholic Syrian Bank has 75 branches (as on June 2000)outside the state.
Distribution of Banks according to districts gives some valuableinformation. It illustrates the role of OPBs in the banking scene of
Kerala. In Table 3.9 geographical and communal concentration ofOPBs is evident. The district of Thrissur has more OPBs than anyother districts. Federal Bank, Catholic Syrian bank, DhanalekshmiBank and South Indian bank together has 143 offices. Thrissur has
less number of PSBs (131) while Ernakulam tops in total number of
branches followed by Thiruvananthapuram and Thrissur. Even ahighly commercialised district like Ernakulam has only 142 banks in
the private sector, though of late, all the NPBS in India have opened
branches in the district. Nearly 65% of the banks are public sector
186

banks. Thrissur is the place where modern ways of banking wereintroduced first in the state. This district also witnessed thepioneering private sector banking ventures. A large number ofprivate banks are operating in the district for about almost acentury
187

3:
.23. .»an=_om .EuNm¥ N: 9:3 QU N5 .?::EEeu m5.\.c .._cn..o« J_:.E «Esau.wov=_o:_ .0: Dun mxcan
onzzowDaOZ
a_a._ov_ :_ m.o_:m_v m:o_..a> Up: .—O moEa: .—O m:o__m_>P_nn_< J
N: 2 .2 _N :2. seem :::_.§_ 5.3mNS 3. S N ._E:_ EEEO §_2_§_ £82
,_E£ :._£:_:o ~z<xcum uu:_:mN_U v:Nv:.:mS: _ N N : N ..N on NN ._ 2 N N N __ .::E _:.._E_ 5.3m..NN N _ _ N. N_ N E em 2 NN 2 2 2 3 1:5 :23:_ _ _ oN 2 __ _ N. : .. .. : .23 _§_c_o_2::Eo _ o N E 3. :. N ..N : E N. 2 {am 5:3 u__2_:o
.. N _ N N 3. NN N N _ N N .,_,:5 ._o_._:
N N. 2 .N eN NN NN oN _ N o _ N 1 :3 2.2.5EN 0 2 N E ..N NN 2 3 «N S 2 N.. 3 3 eo2a.::Co 1.5 25
SN N 2 .. 2 N 2 «N Nw 2 I __ N e _N 22.. 2 ,:_£ 22m_.:§ 33: EU is 8:. :_.__s_?_._ .3... .5: :2 :5. .:< 2:. s:__ .E>._. xcmm
«man fits! I uuu_5m_n >N_ nxcnn Nona! no uosucfln scan no :o_u:N__.5u_n
ma u_._m,..

Deposits
Total deposits of commercial banks were Rs. 27143.79 crores inMarch 1998. During the period 1990-1998 the deposits grew fourfolds at a compound growth rate of 19.29%. Total advance alsoincreased during the same period but at a slower rate (14.63%) thandeposits. Consequently, there was steady decline in the creditdeposit ratio. The decline of CD ratio was largely due to thephenomenal growth of NRE deposits, which grew at a compoundrate of 25.6% over the period 1990-98. During 1992-93, NR1deposits recorded a growth rate of 48.1%. The share of NREdeposits in the total deposits was around 29-30% in the late 1980’s
and up to 1991-92. Currently the share of NRE deposits is 46.7%.
With regard to ‘total deposits, four districts hold a combined share
of more than 54.28% of total deposits.” These are Ernakula-m,Trivandrum, Thrissur and Pathanamthitta. The bank with mostnumber of branches and deposits is State Bank of Travancore with21.4% of total deposit (Table 3.10). State Bank of India and itsassociates were thc second most important in terms of total depositsand Canara Bank is in the third position. Among the private sectorbanks, Federal Bank, South Indian Bank and Catholic Syrian Bank
respectively have 1.96%, 6.02%, and 4.5% of total deposits.Nationalised banks collectively mobilised more deposits than theOPBs and also through lesser number of offices than OPBs. A larger
number of OPBs are in the rural sector and deposits from theseareas are smaller in volume.
189

Table 3.10Deposits and Advances of selected banks in Kerala - March 2000
(Rsin Lakhs)
190
Bank No. of Deposits NRE Advance CD ratioBranch Deposits
Sate Bank of 226 428934.00 251342 170712 39.8India
State Bank of 550 818974.00 419775.00 37644.00 45.97Travancorc
Bank of 43 88816.00 63238.00 29155.00 32.83Baroda
Bank oflndia 70 49285.57 17945.94 24987.00 50.7Canara Bank 235 415068.00 238763.00 153350.00 36.95Central Bank 73 79912.00 34212.00 28355.00 35.48oflndia
Corporation 52 45826.00 17484.00 16096.00 35.12Bank
Indian bank 84 114871.77 55664.86 37434.93 32.59Indian 111 181465.00 110851.00 47627.00 26.25Overseas
Bank
Syndicate 115 118813.00 50517.00 41569.00 34.94Bank
Union Bank 127 136805.00 57766.00 70263.00 51.36oflndia
Vijaya Bank 68 62396.74 17522.47 19374.70 31.05
Catholic 208 174735.00 68671.00 49684.00 28.43Syrian Bank
Dhanalekshmi 113 97196.30 13126.34 44851.18 46.14Bank
Contd.

C ontn.Bank No. of Deposits NRE Advance CD ratio
Branch DepositsFederal Bank 294 404113.00 239595.00 175871.00 47.82
Lord Krishna 67 61374.00 16296 23691.00 45.88Bank
Nedungadi 109 81151.00 16818.00 34576.00 42.61Bank
'—Grindlays 1 11533.00 8386.00 3351.00 29.01Bank
British Bank 1 11192.00 9864.49 4938.25 44.12ofthe MiddleEast
Oman 1 8684.51 7699.03 681.7 7.85International
Bank
Source: State Level Banker's Committee, Banking statistics ofKeralaMarch 2000.Trivar1drum.
Table 3.11 presents the distribution of different types of depositsamong the population groups in Kerala. Semi-urban areas have the
largest share of savings and other term deposits among differentpopulation groups and urban areas has more current deposits. Thiswhen compared with the other southern states, it can be observed
that even though the total deposits in Kerala is the least among thefour states, its term deposits per account in all the populationgroups is the highest in Kerala, which indicates the affinity ofpeople to savings with banks.” In the rural segment also the figurewas much above that in other states.
191

In the rural area. it cannot, however. be argued that NRE depositshave escalated the deposit figure.
Further split up of different types of deposits in different bankgroups is presented in Table 3.12. In terms of term deposits, FBshave more volume per deposits and OPBs the least. Rural and semi
urban popularity of OPBs might be the reason why their deposit size
is smaller compared to other banks. Foreign banks have positionedthemselves as ‘class banks’ that they are able to attract high value
deposits, partially due to their norms stipulating higher minimumdeposits. Their savings deposit per account is also the highest. Thelowest savings deposit per account is in nationalised banks. Current
deposits were the highest in State Bank of India and associates both
in terms of total deposits and deposits per account and the least inforeign banks.

Table 3.11Distribution of Deposits According to Type of Accounts and
Population Groups- March 1997(in Rs. Lakhs)
Type Of DIf'°-‘H-" Rural Semi-Urban Urban Total
C“'”"‘ N° °f 44563 31953 200603 277124Deposits Accounts
"’“°‘“" °f 3309 51334 37905 142543d°"°"‘5 (2.74) (3.37) (13.09) (6.16)
Savings No. of 1343166 11253325 2659.21 123674.12De-P°5it5 Accounts
A”‘°‘“" °f 265,10 3204,63 1100,19 456997D°"°"‘ (21.96) (21.04) (16.33) (19.74)
306923 2703323 799672 3314923Tern] N0. ofdeposits ACCOuntS
A'“°‘"" °f 909.00 1151677 473525 17161,02D°P°‘”‘ (75.3) (75.6) (70.52) (74.11)
Total
No. of 1694657 14236206 3660196 19641059Accounts
1207,20 1523479 671443 2315647Total (100.00) (100.00) (100.00) (100.00)Deposits
Note : Figures in brackets are percent to total in each population group.Source: Reserve bank oflndia, Basic Statistical Returns, March 1997
Nationalised banks have more number of accounts in the current
deposits, but the volume of deposits is low. This indicates that they
target at the high volume-low value customer segments.
193

State Bank of India and its associates has the highest term deposit
base in Kerala among the southern states. Term deposits of StateBank of India and others were not only high but also came from the
least number of accounts. It is obviously due to the predominance ofNRE deposits in the banks in the state. But nationalised banks were
stronger in size and volume in the other three states. In other states
nationalised banks are the group with the highest deposits 2°
194

3.
._ _.m 035 E m< 85%9.2» :53 :25 E _So. o. om_:._8:a Ba floxofin E 3.1: u.oZ
898: 898: 898: 8o.oo: 898: 898: 898: 898:
Socmom N883. ~38: Nxsnnn E28. 32...”. 32: 82.2. Leo»
:28. 32: 89.8 SEN. £23.: :2: 30.5. :f.2
52$ m2_.K~ 2.2.2 .82.. .:..oo 2.33. .&.:.S. .82. fies: _..._.22EECE_.62_um SEC:9: 32.8 :...: o..:.8 3.28 :3: £3: :12: $_=_:_2:: 22.2 2.2 noon. 9:: 2:. c5. 32 cm::c.._2.3; $.33 Ago: A~o.m$ 23...; :L..:; :02. 2:23 5.55
Z28 oo:.~:. :3: _c .332 22...: 332.3 «S2 wcmmmm u3_._:5__.z
:: >3 :3: .228 3.63 :33. :.m....: 2.63 2.6:
83.2. nmamooc Eofin n _ 2;... Nu» _ C can .2... 32; N_ Sm mu__._ucm«.a E;52.. ._o .__;m 23m
_:_._OF_< Sn ._O 02 :._—._OE< Eu ._O 02 ~C:OE< Eu .7. OZ. _::CE< 3... ._O 52_w_c._. F_._0._. mm:_>um _:o._:._U
;:c._m ...cum_
m:mo.._uu._o 2?:
$€_a_.wm E .=:oE<V
snag :u.az-u._:o..U scan 3 u..::3u< mzmonun no uu._>a a:u..o=_n no :o_u:.__.:_m_n_
«fin 2...»

The predominance of State Bank of India and associates is chieflyattributed to the wide popularity of State Bank of Travancore asevidenced from its size of comparison with other banks. A noticeableaspect in deposit distribution is that Kerala has the least deposit inthe current accounts in all bank categories.
Credit Consumption
Credit Consumption is relatively very low in the state. The threedistricts, which consume maximum credit are Ernakulam,Thiruvananthapuram, and Kollam in that order (see Table 3.13). Urban
credit consumption is also the highest in these three districts. A splitup of bank credit according to bank groups is presented in Table 3.14.
Deposit amounts are given in the Table 3.14 for comparison. All bank
groups except FBs had almost comparable shares of credit disbursals.State Bank of India and associates, Nationalised banks and otherscheduled commercial banks have respectively 35.19%, 32.10% and32.08% share of credit deployed and FBs had 0.63% share of total.FBs, however, has high-value credit accounts. In the case of smallborrowings also the same order prevails viz., 35.32%, 34.65%, 29.96%and 0.70% respectively for State Bank of India and associates,nationalised banks, other scheduled commercial banks and foreignbanks respectively.
196

Table 3.13Distribution of Deposits and Credit in the Districts- March 1997
(in Rs. Lakhs)
District No. Of Offices 1 Deposits CreditAlappuzha 217 1748562 65094
(7.55) (6.19)Kannur 211 128943 49792(5.57) (4.73)Ernakulam 417 400817 299160(17.31) (28.43)[dukki 101 24074 23098(1.04) (2.19)Kasargod 114 40243 19346(1.74) (1.84)Kollam 188 154664 94899(6.68) (9.02)Kottayam 245 179846 79456(7.77) (7.55)Kozhikode 247 115854 72800(5.00) (6.92)Malapuram 203 93931 43502(4.06) (4.13)Palakkad 238 106300 50206(4.59) (4.77)
Pathanapuram 210 260669 36330— (11.26) (3.45)Thiruvanathapuram 336 337485 111521
(14.57) (10.6)Thrissur 340 282739 90906(12.21) (8.64)Vynad 71 15230 162884(0.66) (1.55)
3198 2315648 1052393Total (100.00) (100.00) (100.00)
Note Figures in brackets are percentage to total.Source: As in Table 3.11
197
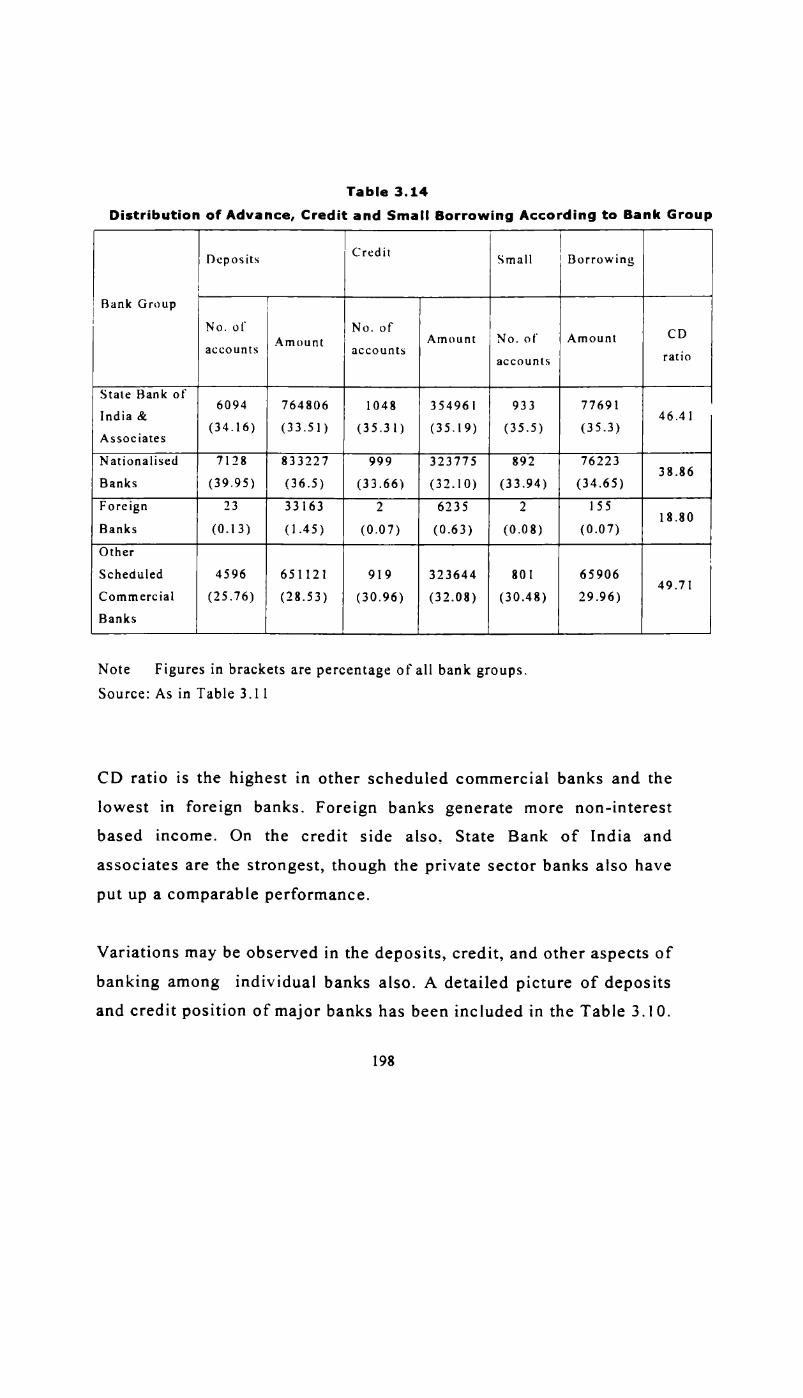
Table 3.14Distribution of Advance, Credit and Small Borrowing According to Bank Group
Deposits Credit Small I Borrowing
Bank Group No. of No. of _ CD. ‘ Amount Amount No.01 Amountaccounts accounts accounts “moState Bank 01'_ 6094 764806 1048 354961 933 77691India & 46.41_ (34.16) (33.51) (35.31) (35.19) (35.5) (35.3)Associates
Nationalised 7128 833227 999 323775 892 76223 38 86Banks (39.95) (36.5) (33.66) (32.10) (33.94) (34.65) AForeign 23 33163 2 6235 2 155 18 30Banks (0.13) (1.45) (0.07) (0.63) (0.08) (0.07) Other
Scheduled 4596 651121 919 323644 801 65906 49 71Commercial (25.76) (28.53) (30.96) (32.08) (30.48) 29.96) 'Banks
Note Figures in brackets are percentage ofall bank groups.Source: As in Table 3.11
CD ratio is the highest in other scheduled commercial banks and the
lowest in foreign banks. Foreign banks generate more non-interestbased income. On the credit side also, State Bank of India andassociates are the strongest, though the private sector banks also haveput up a comparable performance.
Variations may be observed in the deposits, credit, and other aspects of
banking among individual banks also. A detailed picture of depositsand credit position of major banks has been included in the Table 3.10.
198

Sixty five percent of the deposits in the State Bank Group is held byState Bank of Travancore and thirty four percent by State Bank ofIndia. Others in the group have negligible shares. Similarly, among the
nationalised banks, Canara Bank takes the top position in both credit
and deposits. The important banks among the Nationalised bankspresent in Kerala are Canara Bank. Union bank of India, SyndicateBank and Indian Overseas Bank. Union Bank of India has the highest
CD ratio among these banks. In the private sector, Federal Bank.Catholic Syrian bank, and South Indian Bank are prominent. FederalBank has an NRE deposit almost equal to State Bank of India andcredit disbursal which is more than what State Bank of India has.
Federal Bank’s advances are even higher than any individualnationalised bank. NRE deposit constitutes 60% of total deposit ofFederal Bank.
Data on new private banks was however, not available for acomparative discussions here. Among the foreign banks (Table 3.10)performance of HSBC ( formerly known as the British Bank of Middle
East (BBME)) is worth mentioning. HSBC, mainly an NR1 targetingbank, has the highest CD ratio among the FBs in Kerala. Over 88 % of
its deposits constituted NRE deposits. ANZ Grindlays Bank is alsoclosely on the heels of HSBC with strong NRE deposit base.
An analysis of credit and deposit need not completely reveal thestrength of a bank since credit disbursals of different bank groups are
either partially controlled by the norms applicable to each group.Further, the recently introduced norms on capital adequacy and nonperforming assets may force banks to take stringent measures indeploying credits according to their prevalent levels of capital
199

adequacy and NPA. Such measures may compel banks to be strict inevaluating credit applications and also to choose more risk-freeadvances. NPBs and FBs show a tendency to go in for fund-basedincomes in order to reduce the dependence on risky advances. Forinstance, these banks are now trying to tap the salaried employees forselling credit products. which is safer than the other options likefunding business and industry.
CD Ratio
CD ratio of public sector banks declined from 99.69% in 1969 to59.2% in 1996 and 41.43% in March 2000. Since 1969, CD ratio in
Kerala has been much below the national average and steadilydeclining throughout the years. CD ratios of many banks varied widely
during the same period. Canara Bank, the Lead Bank in the state also
showed low CD ratio over the years 1991-97, but has managed toimprove the ratio since 1996. Other major banks like Indian Overseas
Bank and Syndicate Bank have also been showing a poor CD Ratioduring the same period. Consequently Reserve Bank of India set up theD.D Avari committee to examine the reasons for the decline in the
ratio in the state. The committee, after examining the various aspects,
recommended that, banks have to reorient their credit operations insuch a way that they are able to achieve a CD ratio of 60% by 2001 in
two stages, CD ratio of 55% by 1998—99,60% by 2000-2001. 21 Table
3.14 reveals the gaps between projected CD ratios and actual ratio of
selected commercial banks. These gaps have only widened over thesubsequent years. Indian Overseas Bank and Canara Bank haveperformed poorly, though the general trend of growth is negative forall the banks. Though the ratio came down for all the banks groups,

private sector banks’ CD ratio plunged the most over the period 19962000.”
Maturity Pattern of Deposits in Kerala
Most of the term deposits have a maturity period of 3 to 5 years. Term
deposits of 1-2 years maturity are also popular. The least attractivewas the 91 days to six months category of deposits (Table 3.15). Fig3.1 gives a comparative picture ofthe maturity pattern of term deposits
in Kerala and in the whole of India. 1-2 years term deposits are themost popular in India.
Table 3.15Maturity Pattern of Term Deposits of Scheduled Commercial Banks in
|(orala- March 1997
(Figures in percentage)No: of
S1.No. Period of Maturity Accounts Amount
1 Upto 9 days 12.4 10.32 91 days & above but 4.5 3.9
less than 6 months
3 6 months & above but 10.1 10.1less than one year
4 One year & above but 23.7 24.6Less than two years
5 Two year & above but 16.8 18.4Less than three years
6 Three years & above but 18.8 24.8less than five years
7 Five years & above 13.7 7.8Total 100 100Source: As in Table 3.11

Fig 3.1Maturity Pattern of Term Deposits in Kerala and India
25
20 v
1 5
Percentage ofdeposits [1 Kerala
§I lrgifa10
3 4 5 6 7Maturity period in Years
3.4 The New Entrants
The major target market of FBs is the NR1 segment. StandardChartered Bank, which have been here since long time focuses more on
corporate banking. All branches of foreign banks except HSBC, arelocated in Kochi, the commercial capital of Kerala. Apart from this.six new private banks have also opened offices in Kerala (as onDecember 1999) They are Centurion Bank, Induslnd Bank. TimesBank, Global Trust Bank. ICICI Bank (has no personal bankingoperations) and HDFC Bank. NPBS have been pioneering the electronic
banking culture in the urban areas and have positioned themselves on a
different platform in order to be appealing to specific segments. Allthese banks indulge in aggressive marketing efforts by way of personal
selling and advertisements in popular media. The success of such high
tech banks have. in fact, prompted the traditional banks like SBI toopen personal banking branches in a similar fashion in the urbancenters. During the year 1996, these NPBs (barring HDFC and ICICI
bank) together collected Rs.200 crores of deposits, equivalent to 5% of
lxl O I\)

the deposits mobilised collectively by 450 branches of other banksduring the same period. Besides. the entry of NPBS and introductionof personal banking culture in the urban centers have accelerated thepace of OPBs' expansion to regions outside the state. Federal Bank. the
leading OPB in the country strive to project their national presenceaggressively
The new banks enjoy the advantage of starting with a clean slate, with
no legacy of the past, lean staff and technology-led products andservices. Their small size may prove to be of advantage to them inmaintaining the costs of operation to a minimum and in turn to enhance
their productivity. If the past trends are any basis forjudging how the
OPBs and PSBS would be able to cope with the competitive situation,
the entry of NPBs or FBs is likely to cause a reorientation of thegrowth strategies of OPBS and PSBS.
3.4 Conclusion
Kerala has been a fertile ground for the growth of banks. Banking inthe state has nearly a century old history. Even in the preindependence era, Kerala was home to large number of private banks.
These banks have gone through many ups and downs. With thenationalisation of banks, public sector banks assumed a predominantrole with their wide-spread branch network. Gramin banks andCooperative Banks were also able to make their own presence felt inthe state.
Kerala has now the highest branch spread with one bank for 10,000people. The high educational levels, better living conditions, goodinfrastructure facilities and heavy inflow of NR1 funds have
strengthened the base of banking business in Kerala. A unique featureof banking in the state is that almost 40% ofthe total deposits come by
way of NRE deposits. However. the picture on the credit side is notbright. The credits grew at a slower pace than the deposits leading tolowering of CD ratios of many banks. Overall lull in the productivesectors, especially the industrial backwardness of the region is themajor factor causing the decline in CD ratios. Growing NRE depositswidened the gap between credits and deposits further. Since 1969. CDratios steadily declined to fall below the national average. Total credit
disbursed was the least among all major states in India. At the sametime, on the socio-economic front, Kerala offers potential for increased
banking activities. Consumption of durable goods has increasedsharply in the recent years. With the advent of class banks in majorcities, modern banking has also picked up in the state.
The major bank groups competing in the banking industry of the stateare State Bank of India and its associates, nationalised banks and oldprivate banks, of which State Bank of India and associates are thestrongest. The State Bank group tops in total deposits, NRE deposits,credit disbursed and recently in CD ratio too. Kerala has aprcd-.;minance of private banks since historical times and now OPBslike Federal Bank and South Indian Bank have risen to the top in the
national level also. Foreign Banks have not been exceptionally good as
they do in other states, though they are targeting at the ‘class bankingcategory.
Banks will have to find either new channels to route their credit or
increase their income through innovative services. At the same time,
knowing their strong areas and image among the public is important to

plan their future activities. Competition will grow considerably andwill come from within the industry as well as from external sources.Six NPBs have already made their entry. Public sector banks andprivate sector banks. while complying with RBI norms, are also taking
measures to face the market challenges by improving their efficiencyand service quality. The face of banking in the urban areas isgradually changing towards more personal banking oriented servicesand attracting customers with products and services with betterstandards of service quality. All bank groups have plans to starttechnology driven convenience products to suit the changing needs of
the people. In this context, banks will have to go through the exerciseof finding what customers perceive about their products and services,
how the purchase decisions are taken by them, and how theydifferentiate between bank groups or banks. The next chapter dealswith the analysis of customer perception to explore these issues.
Notes and References
1. CMIE, Basic Statistics Relating to States of India, September1994.
2. Ibid.
3. M.David Morris and B.Mc Alpin Michalle, MeasuringCondition oflndia '3 Poor," The Physical Quality 0fLife Index,Promilla and co publishers, New Delhi 1982.
4. State Planning Board, Economic Review, Government ofKerala, 1994.
5. Arthur Maiden, Marketing Financial Services, MacmillanPress, London, 1996,p.26.

.‘°
10
ll
12.
13.
I4.
16.
17.
18
19
20
21
22
. Ibid.
Kerala Statistical Institute. Socio-economic Changes inKerala- A Study Based on Selected Localities, Trivandrum.October 1992.
. Ibid, p.19.
Sate Planning Board. Report on the Survey ofH0useh0ld'sSavings and Investment, Trivandrum. 1981.
. Ibid.
. P R Gopinathan Nair, ‘Migration of Keralites to ArabWorld’, in B.A Prakash (ed), Kerala's EconomyPerformance, Problems, Prospects, Sage Publications Indiapvt. Ltd, New Delhi,l994.
India today, September 15, I995.
Ibid.
As quoted in K.C Chacko, History ofthe Federal BankLtd, Alwaye, The Federal Bank Ltd, Alwaye, 1979, p.4l- 42.
.lbid., p.43.
Reserve Bank of India, Report of Trends and Progress ofBanking in India, 1998-99, Bombay, 1999, p.218.
The Federal bank Limited , Annual Report 1997-98,Alwaye, I998.
. Reserve Bank of India, Basic Statistical Return 1997March, Bombay, I997
. Ibid.
. Ibid.
. Canara Bank, Report ofthe Committee on CD ratio inKerala, Bombay, July 1994.
. State Level Bankers Committee, Banking Statistics ofKerala (various issues), Trivandrum.
CHAPTER 4
CUSTOMER PERCEPTIONS OF BANKING PRODUCTSAND SERVICES- ANALYSIS OF DATA
4.1 Introduction
Banking in Kerala has its roots in the pre-independence era. Infact. at least three of the OPBs which have a national presencenow have their origins in Kerala. Further. the banking statistics
of Kerala show that an average person in the state has a bettersavings potential than his counterpart in some of its neighbouring
states. Both consumption and household savings rates in the state
are above the national averages. The large number of accounts inthe rural population is yet another evidence for the popularity of
banks among the people. Kerala also tops in bank-spread among
the states in India. Non-bank finance companies have alsoenjoyed investor support, especially, from the small investors ofsemi-urban areas. The mid 1980s and late 1990s, however,witnessed the crumbling down of many such companies.
The factors that contributed to the growth of banking culture inthe state have already been discussed in detail in Chapter-3.However, the savings potential and the credit consumptionpattern in the state give a contradicting picture. This could bemainly attributed to the stagnation in the industrial sector anddecline of viable avenues of investment such as capital marketsor non-bank finance companies for the enthusiastic investors.These factors, in fact, have rejuvenated the trust people had inbanks. Apart from this, the socio-economic environment inKerala continues to offer increased potential for more and variedbanking activities. Investors are still watchful of attractive
207

deposit options and borrowers are looking forward to bettertreatment and lower rates of interests. The overall pictureindicate a transformation in the banking needs of the people. The
demand for convenience based banking services is on the increase
as visible from the setting up of new private bank branches in theurban as well as semi-urban areas. As explained in earlierchapters. increased competition is felt in the industry as a resultof the reforms process initiated in the early 1990s. The changesunleashed by the reform process have forced the banks to attainmore efficiency and customer orientation. The new entrants have
been quick to respond to these customer needs. PSBs thoughmoving at a slower pace, are also definitely heading towardsequipping them with modern facilities. NPBs, the recent entrants
with sound backing of parent organisations, are primarily vyingfor their share in the class banking segment. PSBs and OPBshave also awakened to the potential of target marketing tocertain class banking segments. It can be said that there is arealisation in the banking sector that demand for their productswill be market-driven in future and customers would decide their
choices based on their perceptions about different banks andtheir products or services. The banks can no longer exist in aseller’s market. This has prompted the banks to view the markets
very objectively and study the customer needs for a more focused
banking.
The impact of changes being introduced in banks and change intheir outlook to customers have hardly been studied in thecontext of Kerala. Perceptions of customers about different banks
and the various services offered are highly relevant inunderstanding the image each bank or bank group has among
208

their customers as well as others. The discussion on themarketing approaches in banking and the current trends inbanking in India in the earlier sections leads us to believe thatcustomers' choice of banks in future will depend on theperceptions they have about different aspects of banks, theirproducts or services in relation to the capabilities of each bankor bank groups in meeting those banking needs. The present studylooks into the choice behaviours of customers of commercial
banks with respect to some major products or services of bankgroups. Such a study can help in identifying the possiblesegments which need differential treatments and which can offer
the banks competitive advantages in the market. The study wasconfined to the household segments in the urban areas of Kerala.The segments, NRIs and Traders & Small-Scale Industries were
also included for obtaining a comparative picture of the customer
behaviour in the banking business. The detailed methodology of
the survey and the analysis of the data are presented in thischapter.
4.2 Survey of Bank Customers - Methodology
The major segment selected for the study was the householdsegment of in the urban areas of the state. As mentioned earlier
NRIs and Traders & Small-Scale Industries segments were alsoincluded for comparative purposes. However, the main focus ofthe study is on the household segment. The segments selectedfor this research work tend to possess different sets ofperceptions on the quality dimensions and product design. Thecustomers show more heterogeneity in behaviour with respect to
choosing the banks or products in the metro or urban area. Since
209

Kerala has no metro cities the next level, i.e., urban areas were
chosen. The customer perceptions can be highly varying and feltmore clearly in the urban environment where the number ofbanks, their variety and substitutes are more than those in therural and semi—urban areas. These reasons have influenced in
focusing on the aforementioned segments.
In Kerala, as of 1996, the semi—urban area has more branches(2253) whereas the urban area has 594 offices. Further, State and
Central Co-operative banks have 372 branches in semi—urbanareas and 60 (1996) in urban areas. Urban Co-operative bankshave 27 offices. All the NBFCS and FBs are located in the urban
areas only. These areas provide ample scope for studying thecompetitive advantages enjoyed by the banks as well as theirrelative positioning. A sample, which contains users of all typeof banks in the market, would thus provide a better picture ofcompetition and relative perceptions. The methodology of surveywas sequenced as given below.
I Collection of basic banking statistics and list of banks ineach bank groups to shortlist the districts and banks for thesurvey
I Sample selection as per sampling design explained below
I Pre-testing of questionnairesI Field survey and collection of data
I Processing and analysis of data

4.2.1 Sampling Design
Sampling Units
Within the urban areas. 6 districts were short-listed first. Theywere Thiruvananthapuram, Ernakulam, Pathanamthitta,Kozhikode. Thrissur and Kottayam. The list was furthernarrowed down to three considering the limitations in conducting
an exhaustive study in all these districts. The criteria forselecting the districts were (a) the level of urbanisation,characterised by the number of branches of major banks in thepublic and private sectors (b) size of deposits and advances (c)their geographical representation nature and (d) the presence ofdifferent players in the financial services market. Ranks weregiven to choose the top three districts, which had at least threetop positions in the criteria, considered. The districtsThiruvananthapuram, Ernakulam and Thrissur were thus chosenas the sampling units.
Sample Size
The study intended to analyse the customers’ perceptions inurban centers of the three districts. The sample frame was thenumber of people having savings account in any banks in theurban areas in the case of household segment. A sample size of400 was selected for this segment since a comprehensive list ofthe number of bank customers was not available. Further, the
tendency of bank customers to maintain multiple accounts alsoprevented using the number of savings accounts as a base. ForNRIs and Traders & Small-Scale Industries segments, sample
211

sizes of 50 and 100 were chosen. Since use of banking services
required awareness about banking practices and a fair degree ofknowledge in financial products it was decided to Fix the cut off
level of income as Rs.5000 per month. The sample to be collected
from the three districts was approximately proportionedaccording to the urban population ofthe districts as given below.
Table 4.1Distribution of Samples for Household Segment based on the
Population in the Three DistrictsSl.No Districts Urban Population as % of Sample
Population total of the three size(in Lakhs) districts used
1 Thiruvananthapuram 257.29 23.40 1002 Ernakulam 541.62 49.20 2003 Thrissur 301.20 27.37 100Table 4.2
Distribution of samples for Traders and Small Scale Industriesamong the Three Districts
Ernakulam Thiruvananthapuram Thrissur Total50 23 27 100Sampling Method
Since this study is fairly extensive a multi-stage sampling design
has been adopted. Three districts, which have the highestvolumes of deposits and credit, were chosen first. In the nextstage, major banks from each bank group were selected. In eachdistrict, the branches of these banks were chosen and an exitsurvey was done to collect the data. Since there were no NPBs or
FBs in Thrissur at the time of this survey, the samples for these
bank groups were collected mainly from Ernakulam andThiruvananthapuram. However, for the other segmentsconvenience sampling was used. SSIs, retail shops, smallbusinesses. and professional & Self employed people wereincluded in this sample.
Bank customers and their needs and preferences are highlyheterogeneous among the segments. Representing each groupaccording to the size of the stratum is difficult in two ways.Large sample sizes will have to be considered for each stratumand it places budgetary constraints on the researcher to do such
an exhaustive study. Secondly, exact source list in each stratumis not available since many banks cannot reveal their customers’
addresses considering the depositor’s right for privacy. Hence itwas thought that the effective way to pick up the right samplewould be an exit survey in banks. For this purpose major banksfrom among the PSBs, OPBs, NPBs and FBs were selected based
on their overall performance indicators. The branches of thesebanks in each district was listed out and from each representative
area a branch of each bank group was selected and an exitinterview with those who had income above Rs.5000 per monthwas conducted. Traders and Small-Scale Industries segment ismore diverse than the retail customers of a bank. Hence, it was
required to use the method of convenience sampling, accordingto the choice of researcher so that more control over the quotacan be applied. Among NRIs, the focus was mainly on those inthe Middle East countries. For the three segments, differentquestionnaires were used, though most of the questions weremeant for collecting information of similar nature from eachsegment.

Period of Survey
The survey was extended over a period of 6 months and all theselected segments were simultaneously interviewed.
4.3 Processing and Analysis of Data
The data collected was scrutinised first for missing and deceptive
data. More number of samples were collected to get the requiredsample size for the study. Questionnaires with insufficient datawere discarded. The primary data collected were then coded,tabulated and analysed with the help of statistical andmathematical tools and using standard SPSS package. Thespecific techniques used included:
I Tests of correlation (Pearson Chi-Square, Likelihood ratioand Wilcoxon Matched Pair test).
- ANOVA for studying the variances of attributes amongdifferent groups of respondents.
I Multi-Variate analyses like, factor analysis, clusteranalysis, and multi-dimensional scaling, etc.
The findings of the study are presented in the following sections
under different headings.
4.3.1 Customers‘ Choice of Banks
A customers‘ choice of bank can be influenced by various factors.
A unique nature of bank selection is that, a large number of thecustomers might have dealings with more than one bank at a
time. Hence a respondent chosen as a sample from a bank might

have accounts in other banks too. The respondents’ MFB need not
be the selected bank. The most frequented bank is the one which
a respondent is using for getting services such as savings bankoperations. money transfers. issue of DD, safe deposit lockers,etc whereas other banks may be chosen for specific products likethe various deposit schemes or loans. in the case of householdsegment. Further, the choice behaviour for these differentservices need not be the same. For frequent interactions, factorslike returns offered or safety of banks need not have anyinfluence. At the same time, for high-involvement product likedeposits or loans, customers may search for more informationand the related factors may be considered separately or incombination, according to their needs. This was why the MFBand others were separately considered for studying the reasonsfor choice of different banks. Further, earlier studies have shown
that people associate banks mostly with savings bank operationsand fixed deposits. The generic nature of bank. products is alsoattributed to the popularity of these key products or servicesamong most of the customers. A differentiation is felt only when
a customers‘ volume and value of transactions are high. Theoverall perception of the services of a bank, hence, would beevaluated by the level of quality of these popular services. Forthese reasons. the study uses MFB of a respondent as a variablein examining the variations in attitudes and behaviour in relation
to choice of banks and various banking products.
Respondent's bank-choice behaviour was studied in differentways. Initially, the respondents were asked to indicate the bankgroups, which they interacted with for meeting their various
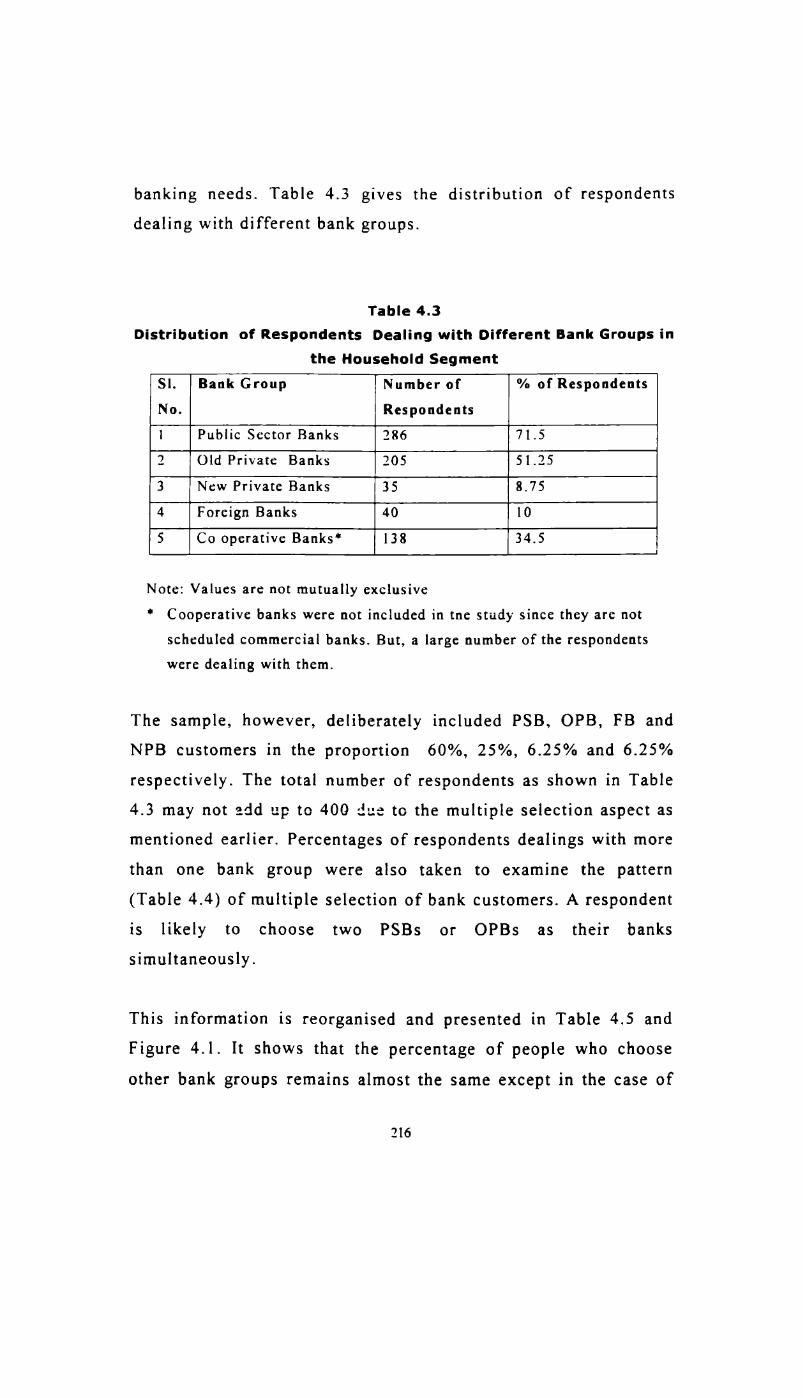
banking needs. Table 4.3 gives the distribution of respondentsdealing with different bank groups.
Table 4.3Distribution of Respondents Dealing with Different Bank Groups in
the Household SegmentSl. Bank Group Number of % of RespondentsNo. Respondents1 Public Sector Banks 286 71.52 Old Private Banks 205 51.253 New Private Banks 35 8.754 Foreign Banks 40 105 Co operative Banks‘ 138 34.5
Note: Values are not mutually exclusive
"' Cooperative banks were not included in tne study since they are not
scheduled commercial banks. But, a large number of the respondents
were dealing with them.
The sample, however, deliberately included PSB, OPB, FB andNPB customers in the proportion 60%, 25%, 6.25% and 6.25%respectively. The total number of respondents as shown in Table
4.3 may not add up to 400 due to the multiple selection aspect as
mentioned earlier. Percentages of respondents dealings with more
than one bank group were also taken to examine the pattern(Table 4.4) of multiple selection of bank customers. A respondent
is likely to choose two PSBs or OPBs as their bankssimultaneously.
This information is reorganised and presented in Table 4.5 andFigure 4.1. It shows that the percentage of people who chooseother bank groups remains almost the same except in the case of
216
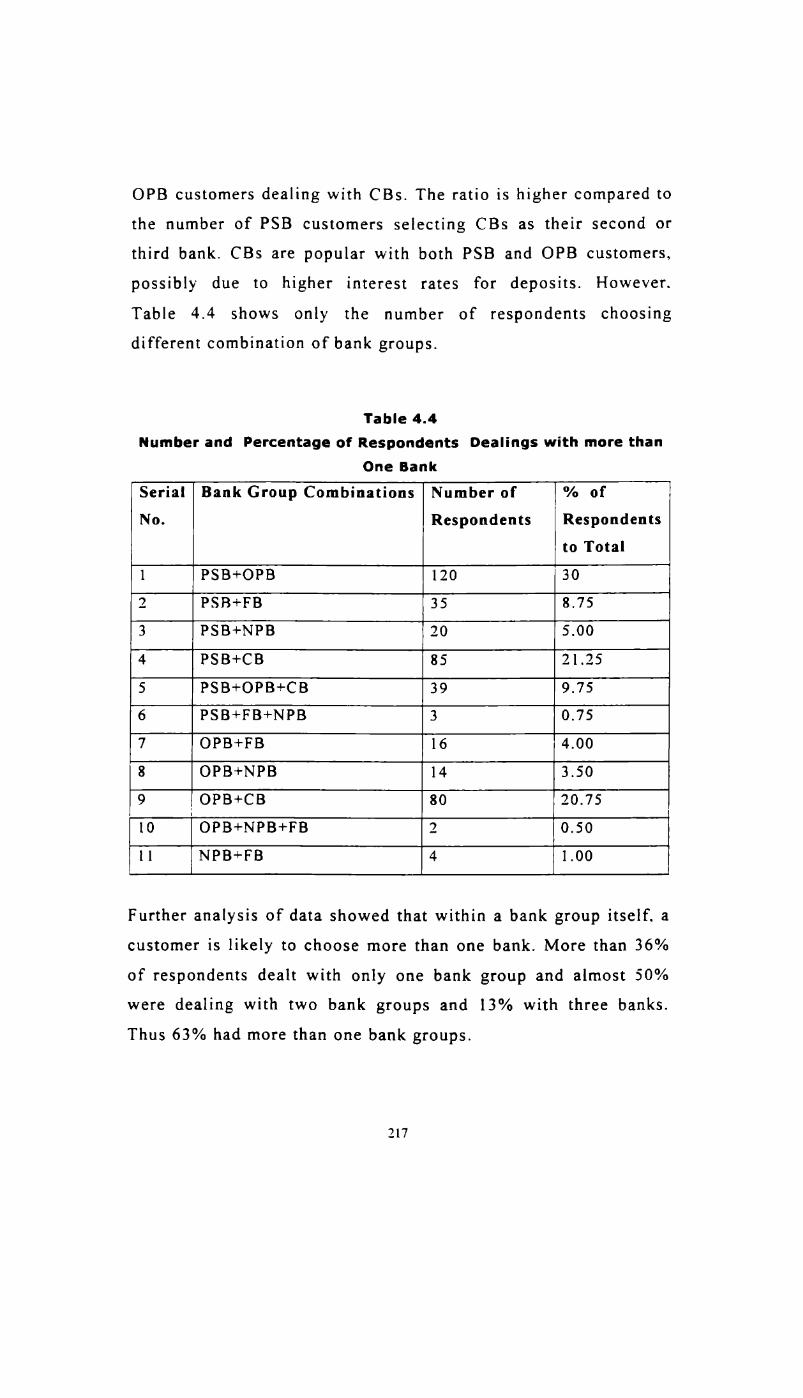
OPB customers dealing with CB5. The ratio is higher compared to
the number of PSB customers selecting CBs as their second orthird bank. CB5 are popular with both PSB and OPB customers,
possibly due to higher interest rates for deposits. However.Table 4.4 shows only the number of respondents choosingdifferent combination of bank groups.
Table 4.4Number and Percentage of Respondents Dealings with more than
One Bank
Serial Bank Group Combinations Number of % ofNo. Respondents Respondents
to Total1 PSB+OPB 120 302 PSB+FB 35 8.753 PSB+NPB 20 5.004 PSB+CB 85 21.255 PSB+OPB+CB 39 9.756 PSB+FB+NPB 3 0.757 OPB+FB 16 4.008 OPB+NPB 14 3.509 ‘OPB+CB 80 20.7510 OPB+NPB+FB 2 0.5011 NPB+FB 4 1.00
Further analysis of data showed that within a bank group itself, acustomer is likely to choose more than one bank. More than 36%
of respondents dealt with only one bank group and almost 50%were dealing with two bank groups and 13% with three banks.Thus 63% had more than one bank groups.

Table 4.5Major Bank Group Respondents Dealing with Other Banks
Major Bank Number of Respondents Dealing with OtherGroups Bank Groups
OPB PSB NPB [CB FB FB+NPB
PSB (Number) 120 20 85 35 3Total 286
percentage 41.96 6.99 29.72 12.24 1.04OPB(N“"‘b°') 120 14 so 16 2Total 205Percentage 58.53 6.89 39. 02 7.8() 0.98
Note Figures in Italics are percentage of total number of respondentsdealing with each major bank group (totals given in Brackets)
Figure 4.1l‘___" ‘IPercentage of Major Bank group Respodents
Dealing with Other Bank groups
%
of respondents
Bank groups used as Other Banks
A separate analysis was done to examine the preference ofrespondents with respect to their choice of MFBs. Table 4.6presents the pattern of MFB choice of respondents. In the table,

based on how frequently a customer uses a bank. MFBs have been
grouped under three categories as MFB I, MFB [I and MFB III.
Table 4.6Most Frequented Banks of Respondents based on Frequency of UseBank Most Frequented Most Frequented Most FrequentedGroup Bank _[ Bank ll Bank lll
Number % Number % Number %
PSB 240 60.00 104 26.00 27 6. 75OPB [00 25.00 77 19.25 28 7 00NPB 25 6.25 9 2.25 l 0.25FB 25 6.25 12 3.00 1 0.25CB 10 2.50 72 18.00 49 12.25Total 400 100 274 68.5 78 19.50
Figure4.2
Percentage of Respondeuuts with Different! Banks as Their First, Second and Third
Bank Choices IiiI! §2 13 W
1 1.'E1MFI3_§g
. _ 1 -iIMFB2iro 10 20 so 4o so so 7o.gMF31r.
% of respondents —__g

More than 68% of total respondents had a second bank and19.5%, a third bank. There were also respondents dealing withmore than three banks. A very small percentage had evendealings with more than two PSBs. This is evident from the factthat 60% of the respondents have PSBs as their MFB I, 26% havePSB as MFB ll and 6.75% have PSBs as MFB III. Thus a
significant percentage of respondents had chosen more than onebank in the PSB group itself. It is to be recalled here that only71.5% of the total respondents dealt with PSB group. For thesame reason, the data in Tables 4.4 and 4.5 need not match with
the data presented in Table 4.6.
Among OPB customers this was not very evident. PSBs have apredominant influence over the bank customers in general.Though the sample included 60% of PSB customers, respondent's
first, second and third choice of banks indicated strongpreference for PSBs. OPBs have also showed almost a similarpattern but to a lesser degree. OPBs were chosen as MFB I, IIand III respectively by 25%, 19.25% and 7% of total respondents
(see Figure 4.2). However Table 4.3 indicates that more than 50%
of customers had chosen an OPB group bank for either frequentdealings or for specialised services. Similarly CB5 are popular as
second or third bank among the respondents, obviously due toadvantages enjoyed by them in the case of certain products. The
pattern observed with NPBs and FBs also shows that majority of
those who deal with them use their services very frequently (seeTable 4.7 and Figure 4.3).

A fact to be considered while analysing the above trend is thatOPBs have more presence and importance in the semi-urban orrural areas whereas PSBs have a wider base in urban areas of the
state. This could be the reason for more people choosing PSBs astheir MFBs. NPBs and FBs also have most of their branches in
the urban areas. Hence an analysis of semi-urban areas wouldhave given a different pattern of MFB choices, particularly with
respect to OPB group. For a very long time they have beenbanking on the geographical and communal preferences of people
in the semi- urban and rural areas. However, they have beencoming out of their regional shells to boost their image and make
a national presence. OPBs have also been utilising the potentialof community banking for Keralites residing outside Kerala byopening branches in various parts of India.
The present market in Kerala is clearly dominated by PSBs. Infact, the sampling method had no control over the sample's MFB.
The only criterion of including a sample was whether therespondent had dealings with a particular bank chosen for thestudy or not. Among NRIs and Traders & Small-Scale Industries
segments also, PSBs dominated. Seventy five percentage offormer and sixty percent of the latter had dealings with them.OPBS had 21% of the NRI respondents and 24% of the Traders
and Small-Scale Industries segment. Foreign banks are foundpopular with 4.5% of NRIs. However, 34% of NRI respondentsdeal with both PSB and FB, possibly due to the direct remittance
facilities offered by FBs in selected places outside India. 84% ofNRIS had a second bank.
221
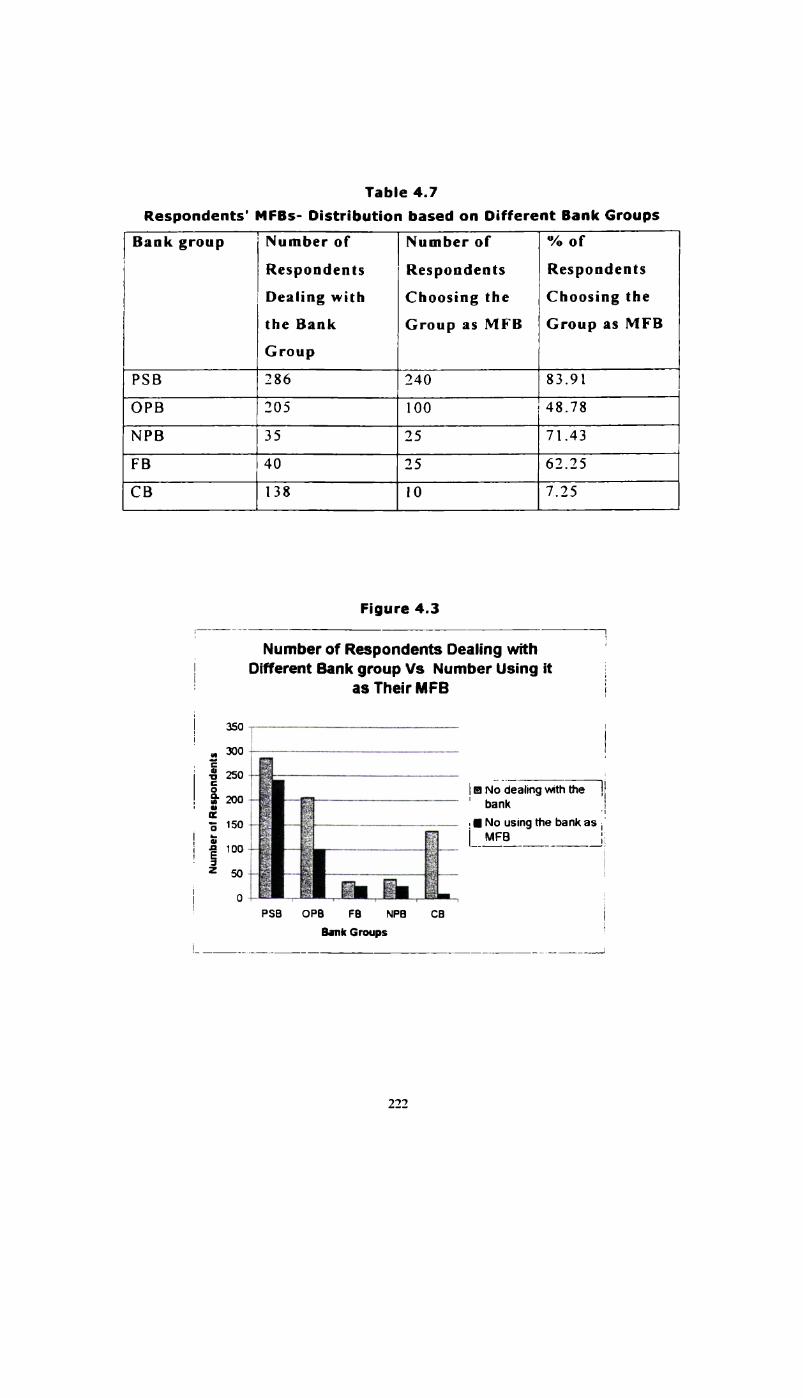
Table 4.7Respondents’ MFBs- Distribution based on Different Bank Groups
Bank group Number of Number of % ofRespondents Respondents RespondentsDealing with Choosing the Choosing thethe Bank Group as MFB Group as MFBGroupPS8 286 240 83.91OPB 205 100 48.78NPB 35 25 71.43FB 40 25 62.25CB 138 lo 7.25
Figure 4.3
Number of Respondents Dealing with IDifferent Bank group Vs Number Using it
as Their MFB
3503 300 —3 |No dealing with the ,3 _ . *‘”‘“*““’”“ ' bank ,§ , ___e.__--._._.-_-22 ,|No using the bankasi'a |_ MFB :i.n _, --—————--*-—EZ
222
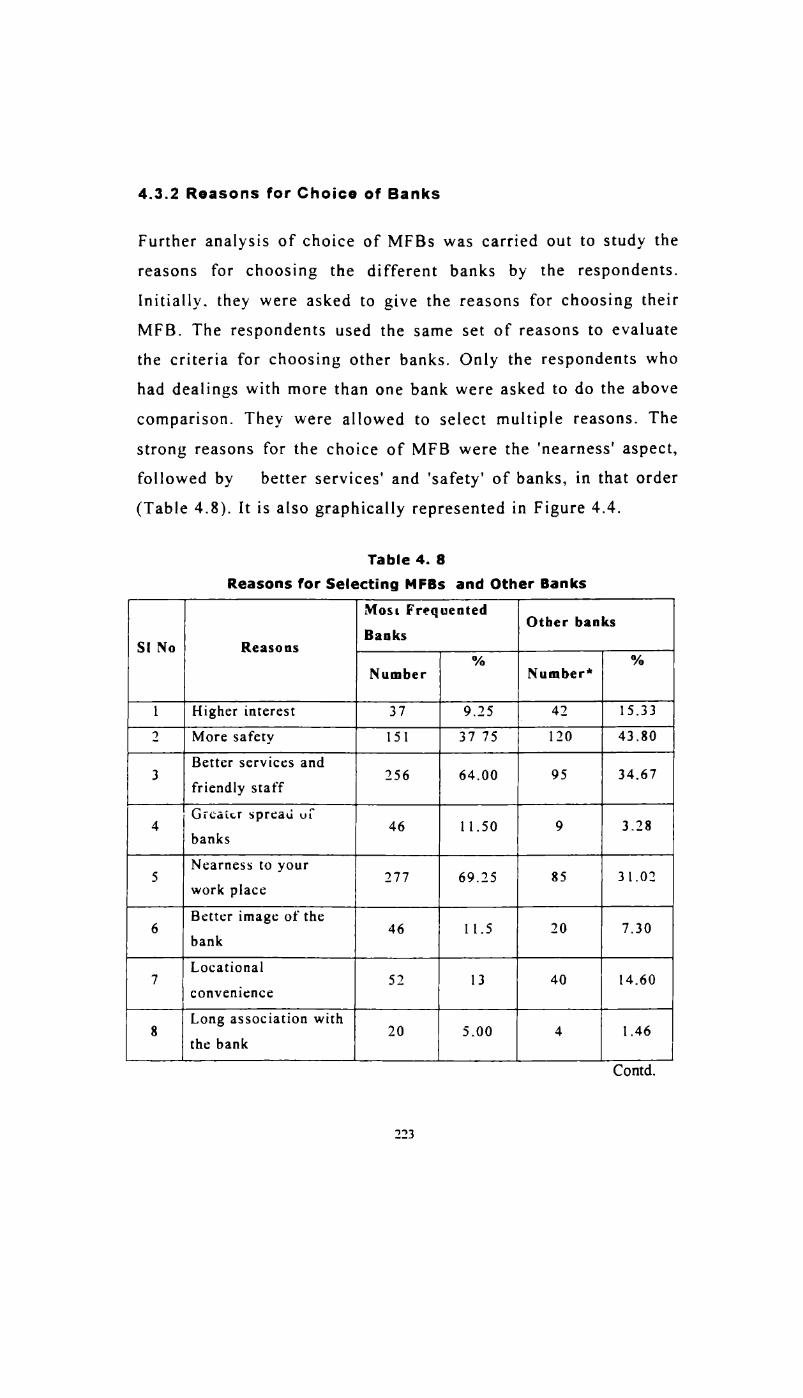
4.3.2 Reasons for Choice of Banks
Further analysis of choice of MFBs was carried out to study thereasons for choosing the different banks by the respondents.Initially. they were asked to give the reasons for choosing theirMFB. The respondents used the same set of reasons to evaluatethe criteria for choosing other banks. Only the respondents whohad dealings with more than one bank were asked to do the above
comparison. They were allowed to select multiple reasons. Thestrong reasons for the choice of MFB were the 'nearness' aspect,followed by better services‘ and ‘safety’ of banks, in that order(Table 4.8). It is also graphically represented in Figure 4.4.
Table 4. 8Reasons for Selecting MFBs and Other Banks
Most Fro.-quented Other banksBanksSl No Reasons % %Number Number*
1 Higher interest 37 9.25 42 15.332 More safety 151 37 75 120 43.80
Better services and3 . _ 256 64.00 95 34.67friendly staff
Greater spread of4 46 1 1.50 9 3.28banks
Nearness to your5 277 69.25 35 31.02work place
Better image of the6 46 11.5 20 7.30bank
Locational7 _ 52 13 40 14.60convenience
Long association with8 20 5.00 4 1.46the bank
Contd.
223

Contn.Most Frequented Other banksBanks
Sl No Reasons % %Number Number*
Suggested by
9 employer for salary 57 14 35 °7 9.85remittance
l() Other reasons if any 14 3.5 6 2.19
"‘ Total number in this case is the number of respondents dealing withmore than one bank. i.e.. 274.
"la of Respondents
Figure 4.4
Percentage of Respondents with DifferentReasons for choosing MFB and Other Banks
so70
so 7'so4030 r20 1
10 ;i—
Luv.
.‘.-‘N
~".J'.""'J':.Ԥ_-1 it-Cshoice of MFBs ii
I I Choice of Other
L_I3anks
.~._' -.." ;._.-» mg "-9 -'-..':..-;u.~x:e' .‘-u: .. W"
- '»-_«..i', 2.m—'.t-. '.;l4“i"z-'1.--.»"._:i‘-"-"j
natah
Reasons for choice
Note: The order of reasons are the same as given in Table 4.8
224

Ranks Assigned by the Respondents for the Reasons forChoice of MFBs and Other fianks
MFBS Other Banks1. Nearness 1 Safetyld Id. Better services offered . Better Service3. Safety 3. Nearness4. Suggested by employer 4. Higher Interest5 Locational convenience 5. Suggested by employer6. Greater spread of branch 6. Locational convenience6. Image of the bank 7 Better image7 Higher interest 8. Greater spread of branches8. Long association with the bank 9. Long association with the bank
The first three reasons remained the same for the above cases
though the ranking was different. Choice of MFB was stronglyinfluenced by the 'nearness' aspect followed by ‘better service‘and ‘safety’ ‘Safety’ was the most important reason for the choice
of other banks. The world over, bank choice is influenced by the
'nearness' aspect though it need not be the single most importantfactor. An interesting observation is that, in the choice of MFBs,
‘higher interest rate‘ gets a low priority. At the same time, itassumes more importance in the choice of other banks, butrelatively less important than the factors like 'nearness', ‘safety'and ‘service’ Earlier studies have shown that Indian customers
primarily associate a bank with their savings needs. Thisobviously involves the three generic products, namely, savingsaccount, fixed deposits and, current accounts that demandfrequent visits to the bank. It has also been found that branding
of bank products are not effective in marketing the products. The
reason why a particular bank is selected is related to convenience
factors that are offered as a package comprising branch location,

uniform services or products and more or less similar rates ofinterests. To a common man, one bank is much similar to another.
Further. it is also observed that an average bank customer doesnot comprehend the complex interest calculations or productadvantages fully. But if a customer who needs specific productsor services he would exercise the choice by considering different
options. The Tables 4.9 to 4.11 illustrate that bank groups other
than PSB score more on the aspect of ‘service’ as a reason forchoice of bank whereas ‘safety’ and 'nearness' are more frequently
cited for choosing PSBs as most frequented banks (see Figure4.5). Only three major factors have been considered for makingthis comparison. The pattern also implies that customers wouldexercise their choice of banks according to their specific needs.
Table 4.9Number of Respondents indicating
‘Better Service‘ as the Reason for Choice of MFB
TBank Group‘ Number of TotalA RespondentsPSB 139 240% to total 57.92 100.00()PB 2! 100% to total 81.00 100.00FB 22 25% to total 88.00 l0().00NPB 19 25% to total 76.00 100.00Total 263 400% to total 65. 75 100.00"‘ Bank group corresponding to the MFB
226

Table 4.10Number of Respondents indicating ‘Safety’
as the Reason for Choice of MFBBank Number of TotalGroup‘ RespondentsPSB 105 240% (0 total 43. 75 100.00OPB 32 I00% to (oral 32.00 100.00FB 3 25% to total 12.00 100.00NPB 4 25% to total 16.00 100.00Total 147 400% to total 36.75 100.00
"' Bank group corresponding toMFB
Table 4.11Number of Respondents indicating 'Nearness'
as The Reason for Choice of MFB
Bank No of respondents TotalGroup‘PSB 168 240% to total 70.00 100.00OPB 76 100% to total 76.00 100.00FB 19 25% to total 76.00 100.00NPB 12 25% to total 48.00 100.00Total 281 400% to total 70.25 100.00
‘Bank group corresponding to the MFBs

Figure 4.5
Percentage of Respondents indicatingService, Safety and Neamess as the Reasons
in each Bank Group
-5 3 100 — uE 2 80 ~3 ° 60 8S 1: _:3 40 userviceE -5 20 ~g 3 O lSafety
OPB C1NearnessBank groups ' " T
Among the Traders & Small-scale lndustries segment,'nearness','efficient services‘ and ‘safety’ were cited as thereasons for choosing their banks by 55%, 25% and 15% ofrespondents respectively. Though, the percentage varies, the rankorder remained the same as in the case of the household segment.
The NRI segment was strongly disposed to the 'nearness' aspect(80%) followed by ‘better services‘ (58.4%), ‘trust in bank‘(41.6%) and ‘suggested by peers‘ (33.33%). ‘Interest rates‘.‘spread of branch‘, ‘service charges‘ and ‘fast remittance facility‘
got low scores as was observed in the case of household segment.
To see whether customers assigned different weightages for these
factors in the choice of MFB and other banks, respondentsdealing with more than one bank were asked to give theirpreference scores for the reasons. They were asked to evaluateall the reasons on a 9-point scale in ascending order ofimportance. The relative preference scores were analysed usingMatched Pair Tests. Weightage or preferences assigned for eachreason in the choice of MFB and other banks were subjected to
228

Wilcoxon's Matched Pair tests. A detailed description of thestatistical tests is given in the Table 4.12.
Table 4.12Analysis of weightages Assigned by Respondents to different
Reasons for Choice of MFBs and Other BanksFactor Number of Mean Std. Max Min
Respondents DeviationChoice of MFR 65 1.0615 0.3904 1.00 4.00Early association
Suggested by 53 5.8679 0.3418 5.00 6.00employer
Image of bank 125 3.0960 0.4293 2.00 4.00Higher interest 239 2.9582 1.1768 6.00 2.00rates
Locational 83 5.1446 0.6075 4.00 7.00advantagesNearness of bank 274 8.7527 0.5025 7.00 9.00Safety of bank 274 7.1127 0.5319 6.00 9.00Better services 274 8.0873 0.5263 7.00 9.00Wider branch 67 4.2383 0.5529 3.00 5.00SpreadChoice of Other 61 1.5902 1.1162 1.00 4.00.3419.Early association
Suggested by 55 4.0000 0.0000 4.00 4.00employer
Image of bank 137 3.1752 0.3815 3.00 4.00Higher interest 274 5.5309 0.6175 4.00 6.00rates
Locational 66 4.3182 1.1524 1.00 5.00advantagesNearness of bank 274 7.5164 0.5290 7.00 9.00Safety of bank 274 8.6800 0.6097 7.00 9.00Better services 275 7.7745 4.8859 7.00 8.00Wider branch 42 2.0000 0.0000 2.00 2.00Spread
229
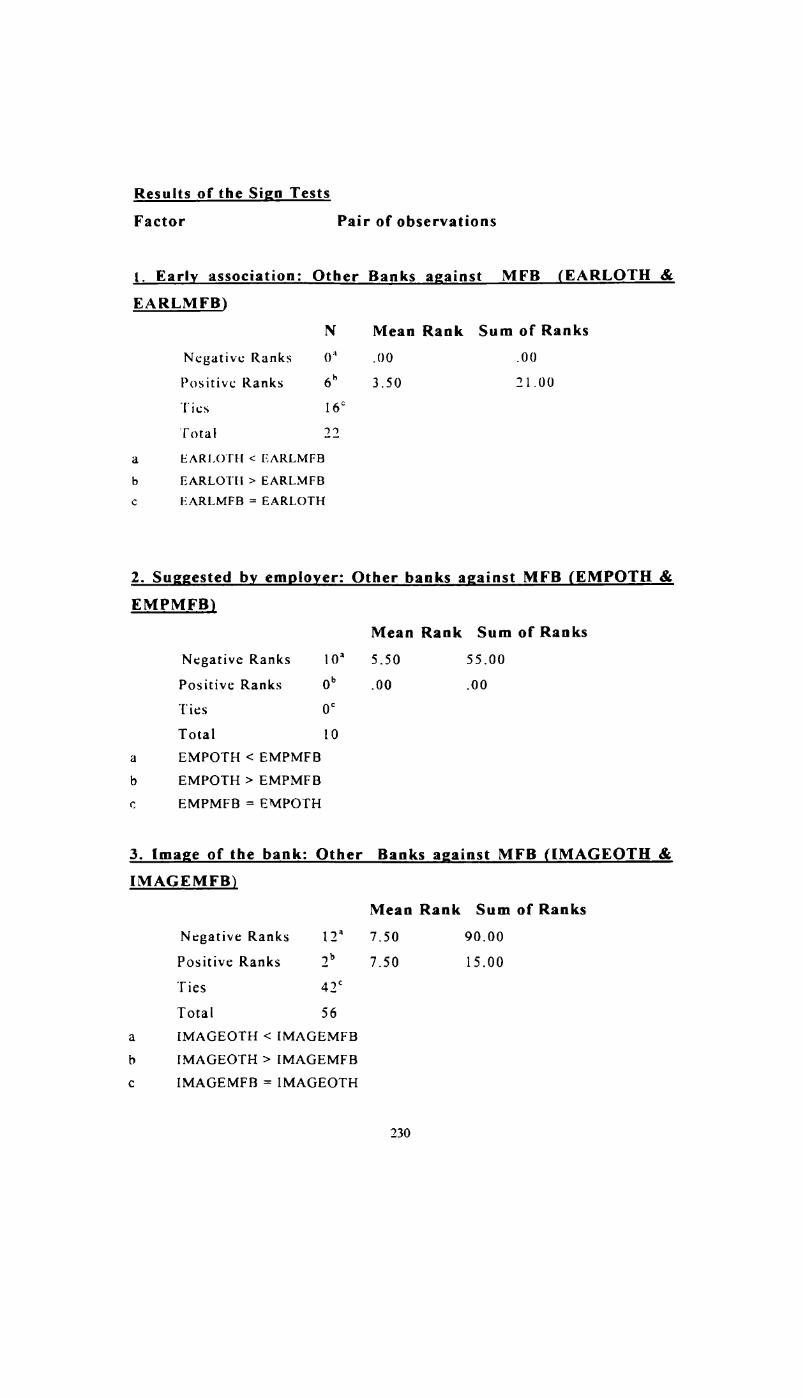
Results of the Sign TestsFactor Pair of observations
l. Early association: Other Banks against MFB (EARLOTH &EARLMFB)
N Mean Rank Sum of RanksNegative Ranks 0" .()0 .00Positive Ranks 6" 3.50 21.00Ties 16°Total 22
a l:'/\Rl.()'I‘H < I-ZARLMFBF.ARLO'l‘ll > EARLMFB
c l-JARLMFB = EARLOTH
2. Suggested by emglogerz Other banks against MFB (EMPOTH &EMPMFB]
Mean Rank Sum of Ranks
Negative Ranks 10“ 5.50 55.00Positive Ranks 0" .00 .00Ties 0“Total 10
a EMPOTH < EMPMFBb EMPOTH > EMPMFBC EMPMFB = EMPOTH
3. Image of the bank: Other Banks against MFB (IMAGEOTH &IMAGEMFB)
Mean Rank Sum of Ranks
Negative Ranks 12‘ 7.50 90.00Positive Ranks 2” 7.50 15.00Ties 42‘Total 56IMAGEOTH < IMAGEMFB
b IMAGEOTH > IMAGEMFBc IMAGEMFB = IMAGEOTH
230

4. Higher interest rates: Other Banks against MFB QINTEROTH &INTERMFB)
Mean Rank Sum of Ranks
Ncgativc Ranks 0" .00 .00Positive Ranks :17” 109.00 23653.00Tics 32"Total 239
:1 lNTF.R()'l‘ll < lNT[-',RMl-‘I1h lN'l‘F.R()'l'll > INTERMI-"Bc lN‘l‘liRMl"B = lN'l'l;'RO'l'll
5. Locational advantages: Others against MFB (LOCAOTH &LOCAMFB}
Mean Rank Sum of Ranks
Negative Ranks 18“ 9.50 l7l.00Positive Ranks 0" 00 .00Tics 17°Total 35LOCAOTH < LOCAMFB
LOCAOTH > LOCAMFB
LOCAMFB = LOCAOTHpa-is
6. Nearness of bank:Other Banks against MFB gNEARNOTH &NEARNMFB)
Mean Rank Sum of Ranks
Negative Ranks 233° ll8.47 27603.00Positive Ranks 2*’ 63.50 127.00Tics 39"Total 274NEARNOTH < NEARNMFB
NEARNOTH > NEARNMFB
c. NEARNMFB = NEARNOTH
231
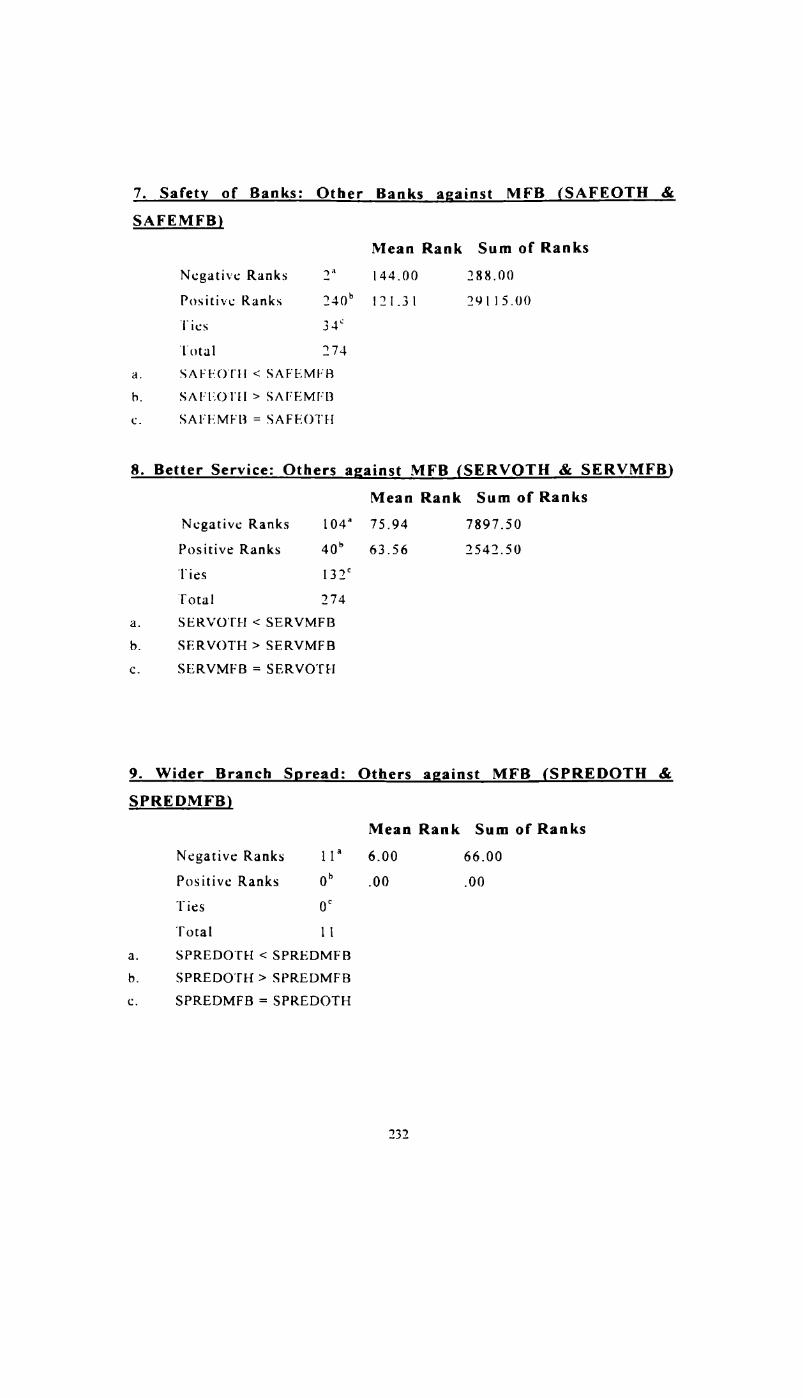
7. Safety of Banks: Other Banks aginst MFB (SAFEOTH &SAFEMFBQ
Mean Rank Sum of Ranks
Negative Ranks 2“ 144.00 288.00Positivu: Ranks 240” 121.31 291 15.110Tics 34‘‘1‘n1-.11 274
a. SAFE-Z()’['H < SAFE-'.Ml"B
h. SA!-‘l-1()'l‘H > SAFEMI-‘B
c. SAH-ZMFB = SAFEOTH
8. Better Service: Others against MFB (SERVOTH & SERVMFB)Mean Rank Sum of Ranks
Negative Ranks 104“ 75.94 7897.50Positive Ranks 40*’ 63.56 2542.50Tics 132‘Total 274
a. SERVOTH < SERVMFBb. SF-.RV()TH > SERVMFBc. SERVMI-‘B = SERVOTH
9. Wider Branch Spread: Others against MFB (SPREDOTH &SPREDMFB)
Mean Rank Sum of Ranks
Negative Ranks 11“ 6.00 66.00Positive Ranks 0" .00 .00Tics 0°Total 11
a. SPREDOTI-I < SPREDMFBb. SPREDOTH > SPREDMFBc. SPREDMFB = SPREDOTH

Table 4.13Weightages Assigned to Reasons for Choice of MFB and Other Banks
wilcoxon's Test Statisticspaired EARLOTll- EMPOTH lMA(il-ZOTH -lN'l'lZROTll- l.()CA()TH- NEARN()'l‘l-[
EARLMFB EMPMFB IMAGEMFB INTERMFB LOCAMFB NEARNMFHreasons _,ValueslZ -2.449’ -3.051“ -2.673‘ -12.964" -3.900‘ -13.604"
0.014 0.002 0.008 0.000 0.000 0.()()0Significance(2tailed)
Contd.
Contn.
paired reasons _, SAFEOTH SERVOTH - SPREDOTH
V I $ SAFEMFB SERVMFB SPREDMFBa ues
Z -13.698’ -5.796” -3.071“Significance(2-tailed) .000 .000 .002it Based on negative ranks. 'y Based on positive ranks.
Table 4.13 shows the Z values obtained from the Matched Pair
Tests. Values of significance suggest that there is difference inthe weightages assigned to the reasons for choice of MFBs and
other banks. The mean values of weightages are also given inTable 4.12. The ranks obtained for the reasons based on the mean
values almost match with the ranks for the reasons observed in
the earlier analysis. The major reasons in both cases, however,get higher scores than the other reasons considered for the study.
The major reasons for choice of banks in either case were,'nearness', ‘safety’, and ‘service’ The rating for the interest aspect
for choice of MFB was very low while it gets a better score in the
case of other banks. Customers go in search of banks, which give
higher interest for deposits or lower rates for loans, which need
not always be their MFBs. The medium rating for the factor in
233
both cases should be also due to parity of rates in almost all thebanks. This has not become a significant differentiating factorwhereas the aspects of ‘safety’ and ‘service’ are important forcustomers. Customers tend to evaluate the image of a bank with
these key factors. Hence. image as a single factor. would not getevaluated. Low rating for image aspect in the above analysis canbe explained this way
The difference in the ranks obtained for the various reasons is
also an implication of customers’ attitude to search for otherbanks offering specialised services. The above two analysesexplain that it is a very common practice among customers todeal with banks in different bank groups. Hence, bankers can take
advantage of target marketing their core services or products. Asingle bank need not mean everything to all customers. A goodexample is the failure of credit card operations by certain banks.
However, the key aspects would continue to be critical inattracting the mass banking customers.
The competitive advantage enjoyed and promoted by the newbanks is their capability to provide better services. This ispossible due to many factors such as operational flexibility, leanstructures, highly motivated staff and a clean slate to begin with
their operations. Respondents from the NPB and FB groups more
frequently cited better service as the reason of choice of theirbank.
An objective of the study is also to find out the difference in the
customer satisfaction levels in different bank groups. One of thehypotheses used in the study intended to find whether there was
234

any dependence between bank groups and level of satisfaction oftheir customers. The method of analysis and the results are givenin the following section.
4.3.3 Customer Satisfaction in Different Bank Groups
The respondents were asked to rate the services of theirfrequented bank in general. A five-point scale with pointsrepresenting ‘very much dissatisfied’, 'dissatisfied', 'so-so’,'satisfied' and ‘very much satisfied’ states of satisfaction wereused to measure the level of satisfaction. Different services of
banks were also listed out for the respondents to rate in the next
stage. The ratings for each bank group were then tabulated toperform the Chi-Square Tests. The contingency table thusobtained were subjected to Chi Test to test the hypothesis thatthe customer satisfaction levels vary according to the bank group.
The results are given in Table 4.14 and 4.15
Simple percentages show that foreign banks and NPBs top in the
ratings though nearly 90% PSB and OPB customers are satisfied
with the banks’ services (see Figure 4.6). PSBs have been ratedthe lowest among the bank groups considered. Both Pearson Chi
Square and Likelihood ratios which were used to test thehypothesis showed that there is dependence between bank groupand customer satisfaction levels. It varied among bank groups.The significance found by both the methods were below 0.05implying dependence between the two variables, viz., bankgroups and customer satisfaction levels.
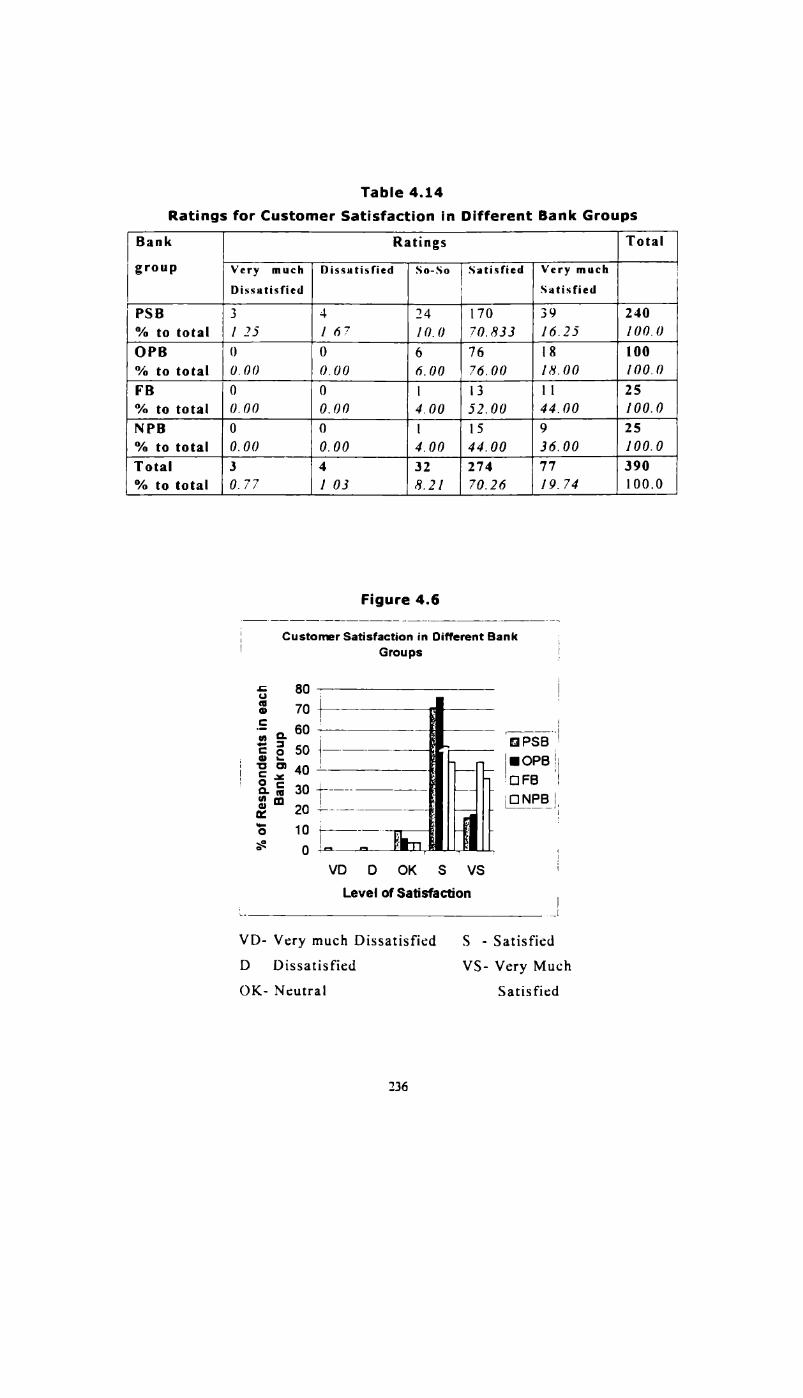
Table 4.14Ratings for Customer Satisfaction in Different Bank Groups
% of Respondents in each
Bank group
‘ Custorrer Satisfaction in Different BankGroups
VDDOKSVSLevel of satisfaction
VD- Very much DissatisfiedD DissatisfiedOK- Neutral
236
S - Satisfied
VS- Very MuchSatisfied
Wank Ratings Totalgroup Very much Dissatisfied So-So Satisfied Very muchDissutisfied SatisfiedPSB 3 4 24 I70 39 240% to total 125 1 6.7 10.0 70.833 16.25 100.0OPB () 0 6 76 I8 100‘'/o to total 0.00 0.00 6.00 76.00 18.00 100.0FB 0 0 l l3 ll 25% to total 0.00 0.00 4.00 52.00 44.00 100.0NPB 0 0 l 15 9 25% to total 0.0() 0.00 4.00 44.00 36.00 100.0Total 3 4 32 274 77 390% to total 0. 77 1 03 8.21 70.26 19.74 100.0
Figure 4.6

Table 4.15Results of Chi-Tests based on Table 4.14
Ratio Value Degrees of Asymp. Sig.l-‘reedom (3-Sidcd)
Pearson Chi-Square 19.393“ 4 0.001Likelihood Ratio 17.821 4 0.001
a. 0 cell has expected count less than 5. The minimum expected count is 5.
Note: First two levels in Table 4.14 were combined to form the level ‘so-so‘ to
remove 0 values in cells. Similarly FB and NPB were also combined toavoid 0 values. for performing Chi — Test.
Drawing comparisons between giant bank groups such as SBI &associates or nationalised banks and FBs or NPBs should be
considered impractical, as there are considerable disparities inthe objectives of PSBs and others. Further, all the bank groups
are not operating on a level playing ground. As mentioned inChapter 2 this has to be viewed critically since customers are notaware about such differences.
Banks are in a transition period whereby banking operations aregetting streamlined to enhance their overall efficiency. Thisessentially, involves raising customer service levels. Customerservice qualities in banking pertains to accessibility, cost,returns, speed, choice, product range, flexibility, operationalconvenience, technology, courtesy, punctuality andaccountability. Customers will not be able to evaluate each ofthis aspect separately as banks involve in multi-service activities
for widely varying segments. Some of the aspects are highlyintangible that only customers with higher expectation levels will
be able to differentiate. Small banks like NPBs will try to attract
these segments with higher expectation on service levels as it
would help them to differentiate themselves from others.However. attaining more competitive efficiency is essential for
PSBs. as they now have to face competition from all the otherbanks and meet the expectation of their customers who now havemore and varied choices. Customer satisfaction levels as acomposite factor of aspects mentioned above is not measured ona regular basis. Such evaluations will help banks to understandthe expectation levels of customers.
In this study, different basic services of banks were consideredfor a comparison similar to the one that was done in the case ofmeasuring overall customer satisfaction levels. The data ispresented in the Tables 4.16 to 4.31. Chi Tests were also donefor each case to examine the dependence and to see whether theoverall customer satisfaction levels and satisfaction with respect
to each factor followed the same pattern in the ratings.
Only two or three states of satisfaction are represented in thedifferent contingency tables. Though a five-point scale was usedto measure the satisfaction, the states such as ‘very muchdissatisfied’ and ‘dissatisfied’ (in certain cases) got either veryfew responses or no responses for almost all services considered.
Hence, in tables 4.16 to 4.31 these categories of responses werecombined without disturbing the ascending pattern of satisfactionlevels recorded in the data.
238
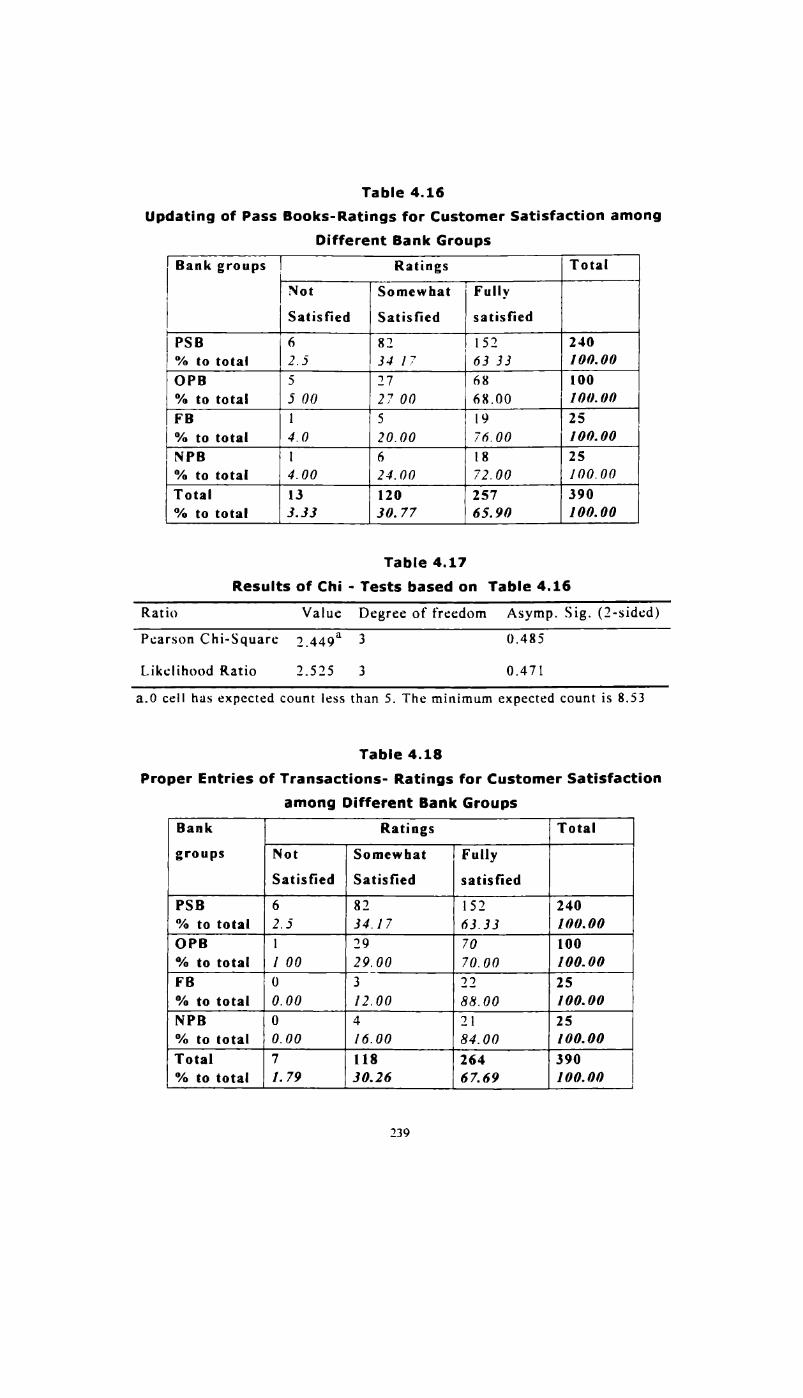
Table 4.16Updating of Pass Books-Ratings for Customer Satisfaction among
Different Bank GroupsBank groups i Ratings Total
Not Somewhat FullySatisfied Satisfied satisfiedPSB 6 82 152 240% to total 2.5 34 1.7 63 33 I00-00OPB 5 27 68 100
% to total 5 0(} 27 00 68.00 100.00FB 1 5 19 25% to total 4.0 20.00 76.00 100.00NPB I 6 18 25% to total 4.00 24.00 72.00 100.00Total 13 120 257 390% to total 3.33 30. 77 65.90 100.00
Table 4.17Results of Chi - Tests based on Table 4.16
Ratio Valuc Degree of freedom Asymp. Sig. (2-sided)Pearson Chi-Square 1449“ 3 0.485Likelihood Ratio 2.525 3 0.471
a.0 cell has expected count less than 5. The minimum expected count is 8.53
Table 4.18Proper Entries of Transactions- Ratings for Customer Satisfaction
among Different Bank GroupsBank Ratings Totalgroups Not Somewhat Fully
Satisfied Satisfied satisfiedPSB 6 82 152 240% to total 2.5 34.17 63.33 100.00OPB 1 29 70 100% to total I 00 29._00 70.00 100.00FB 0 3 22 25% to total 0.00 12.00 88.00 100.00NPB 0 4 21 25% to total 0.00 16.00 84.00 100.00Total 7 118 264 390% to total 1. 79 30.26 67.69 100.00
239

Table 4.19Results of Chi - Test based on Table 4.18
Ratio Value Degree of freedom Asymp. Sig. (2-sided)Pearson Chi-Square 3_775“ 3 0.032Likelihood Ratio 9.775 3 0.021a 0 cell has expected count less than 5. The minimum expected count is 8.08
Table 4.20Cheque Encashment- Ratings for Customer Satisfaction among
Different Bank GroupsBank Groups Ratings Total
Not Somewhat FullySatisfied Satisfied SatisfiedPSB 8 98 134 240% to total 3.33 40.83 55.83 100.00OPB 3 28 69 100‘% to total 3.00 28.00 69.00 100.00FB 0 4 21 25% to total 0.00 12.00 88.00 100.00NPB 0 5 20 25% to total 0.00 20.00 80.00 100.00Total I1 I29 250 390% to total 2.82 33.08 64.10 100.00
Table 4.21Results of Chi - Test based on Table 4.20
Ratio Value Degrees of freedom Asymp. Sig.(2sided)
Pearson Chi-Square 14563 3 .002Likelihood Ratio 15.503 3 .001
a 0 cell has expected count less than 5. The minimum expected count is 9.36
240

Table 4.22Collection of Outstation Cheques- Ratings for Customer Satisfaction
among Different Bank GroupsBank Ratings Totalgroups Not Somewhat Fully
Satisfied Satisfied satisfiedPSB 34 I33 73 240% to total 14.17 55.42 30.42 100.00OPB 6 75 19 I00% to total 6.00 75.00 19 00 100.00FB 0 4 21 25% to total 0.00 16.00 82 ()0 100.00NPB 0 7 18 25% to total 0.00 28.00 72.00 100.00Total 40 219 131 390% to total 10.26 56.15 33.59 100.00
Table 4.23Results of Chi - Test based on Table 4.22
Ratio Value Degree of Freedom Asymp. Sig. (2-sided)Pearson Chi-Square 55640" 3 0.000Likelihood Ratio 54.090 3 0.000
a 0 cell has expected count less than 5. The minimum expected count is 8.4
Table 4.24Issue of Drafts- Ratings for Customer Satisfaction among Different
Bank Groups
Bank Groups Rating TotalNot Somewhat FullySatisfied Satisfied satisfiedPSB 38 128 82 240% to total 15.83 53.33 34.17 100.00OPB 13 64 23 100% to total 13.00 64.00 23.00 100.00FB 0 4 21 25% to total 0.00 16.00 84.00 100.00NPB 0 9 16 25% to total 0.00 36.00 64.00 100.00Total 51 197 142 390% to total 13.08 50.51 36.41 100.00
241

Table 4.25Results of Chi - Test based on Table 4.24
Ratio Value Degrees of Freedom Asymp. Sig. (2Pearson Chi-Square 40.953” 3 .()0()I.ikelihood Ratio 40.745 3 .0()0a. 0 cell has expected count less than 5. 'The minimum expected count is 9.10
A large number of services ranging from the very basic ones such
as ‘updating of pass books‘ or 'encashment of cheques’ to ‘credit
operations’ were included in this analysis. However, data werefound insufficient for a meaningful analysis of all the services.The Chi Tests have been performed for the services such asupdating of pass books, encashment of cheques. proper entries of
transactions, collection of outstation cheques, and issue ofdemand draft. From the above analyses it is evident that except
for the common service like ‘updating of pass books’ thesatisfaction levels depended on bank groups with whichrespondents were dealing. Such ratings for PSBs were lowercompared to other bank groups. The analysis of overallsatisfaction of customers also gave similar results. OPBs alsohave been rated badly for services like ‘issue of demand drafts‘
and ‘collection of out station cheques‘ These two services hadalways been criticised by customers. Though, OPBs are ratedhigher than PSBs in overall customer satisfaction, OPBS get very
low rating on the above services. Various committees havelooked into the aspects of improving customer service in banksand progress was measured periodically. But rising expectations
of customers in certain segments demanded more attention to the
service aspect. During 1992-93, RBI initiated policy-levelmeasures to urge all the commercial banks to identify areas and
242

factors requiring immediate attention, especially thoseresponsible for delays in delivery of various services.Collection of outstation cheques. issue of demand drafts. makingavailable credits on local cheques up to Rs.5000. are a few suchservices which demanded immediate action. Further, banks were
also asked to look into the structural. operational andtechnological aspects that would help improve the overallefficiency levels. The findings of the present study however.suggest that PSBS and OPBs would have to enhance their service
quality levels.
The new private banks have. in fact. identified the ‘delay indelivering services’ as one of the weak areas of other banks. This
is in fact, the most critical aspect of convenience banking.Accordingly, NPBs have designed their delivery to offer fasterand hassle-free services to customers.
Other services. which could not be subjected to Chi-Test,included the following:
0 Cash transfer by telegraphic/electronic means
0 Payment of subscriptions, insurance premiums, etc. throughsavings bank accounts
0 Credit card operations
0 Safe deposit locker services0 Credit/overdraft facilities
As mentioned above large number of 'no' answers in certaincategories of services of bank restricted a detailed analysis. The
data are, however, grouped into tabular form in tables 4.26 to
243

4.31 for a comparison among bank groups. Bank groups 3 and 4have been grouped together to give more meaningful picture ofthe satisfaction levels.
Table 4.26
Cash Transfer by Telegraphic or Electronic Services- Ratings forCustomer Satisfaction in Different Bank GroupsBank Ratings Total
Group No Not Somewhat Fullyanswers Satisfied Satisfied SatisfiedPSB 133 17 57 33 240
% to total 55.42 708 23.75 13.75 I00.00OPB 41 13 29 17 100% to total 41.00 13.00 29.00 17 00 100.00FB & NPB 33 3 4 10 50% to total 66.00 6.00 8.00 20.00 I00.00Total 207 33 90 60 390% to total 53.07 8.46 23.08 15.38 100.00
Table 4.27Results of Chi - Test based on Table 4.26
Ratio Value Degree of freedom Asymp. Sig. (2-sided)Pearson Chi-Square 15_6-71“ 6 .016Likelihood Ratio 17.026 6 .009
a. l cell has expected count less than 5. The minimum expected count is 4.23
The Chi Test show that the satisfaction on cash transfer services
are dependent on bank groups. However, for the analysis of theabove data bank groups FB and NPB (Table 4.26) were combined
to avoid zero values in certain categories. It should be noted that
PSBs and OPBs are still going ahead with computerisation andnetworking processes to speed up their cash transactions. As sucn
the electronic fund transfer facilities are available in PSBs only.
in selected metros of the country. Use of modern technology in
banking is almost a unique selling proposition of upper-end
244

banks and a few PSBs or OPBs in the urban and metro areas. The
computerisation and networking processes are progressing at aslow pace in PSBs. Further, branch computerisation withoutnetworking will not help in fast fund transferring as nonnetworked or computerised bank branches would affect theoverall speed of processing. A critical element in determiningservice quality from a customer's perspective is the speed ofservice delivery. Analysis of the various services also suggestthat except for the core service like ‘updating of pass books’customers experienced varying service quality levels withdifferent bank groups. Dissatisfaction is associated mainly withaspects like speed, procedure and attitude as mentioned in earlier
discussion on the topic. Technology adoption, hence, would be akey aspect that decides customer satisfaction levels in future.But, as noted above, if fund transaction should improve bothbranch automation in the front and back ends and networkingneed to be sped up. It is also evident from the analysis that,services like collection of outstation instruments there is a wide
gap between PSBs & OPBs and others. The inference is thatNPBs and FBs have clearly demarcated their position in suchservices were technological support is essential. The later part of
the analysis of service aspect is expected to elucidate the otheraspects associated with attitude and generally with regard toprocessing of customer request for services. Discussion on those
aspects is done under the heading ‘service quality perceptions‘in this chapter.
For payment of subscriptions, premiums, etc through savingsbank accounts, PSBs and FBs or NPBs scored almost equally.
245

Interestingly. OPBs performed badly compared to others (Table4.28).
Table 4.28Payment through Savings Account- Ratings for Customer
Satisfaction among Different Bank GroupsBank Ratings TotalGroups No Not Somewhat Fully
answers Satisfied Satisfied satisfiedPS3 136 9 63 32 240% to total 56.67 3. 75 26.25 [3.33 100.00OPB 36 4 52 8 100% to total 36.00 4.00 52.00 8.00 100.00FB& NPB 34 0 10 6 50% to total 68.00 0.00 20.00 12.00 100.00Total 206 13 125 46 390% to total 52.82 3.33 32.05 II. 79 I00. 00
Table 4.29Credit Card Operations- Ratings for Customer Satisfaction among
Different Bank GroupsBank Ratings TotalGroups No Not Somewhat Fully
answers Satisfied Satisfied satisfiedPSB 188 5 24 23 240% to total 78.33 2.08 10. 00 9.58 100.00OPB 95 1 3 l 100% to total 95.00 I 00 3.00 1.00 100.00FB& NPB 27 0 3 20 50% to total 54.00 0.00 6.00 40.00 100.00Total 310 6 30 44 390% to total 79.487 1.54 7.69 II.28 100.00
Scores for credit card operations clearly reflect the strength ofFBs and NPBs (Table 4.29). Fourty percent of FB and NPBcustomers reported a satisfaction level of ‘very much satisfied‘
In safe deposit or locker services also FB and NPB groups were

rated higher than the other banks. However in the case of creditfacilities PSBs got better scores.
Table 4.30Safe deposit/Locker services- Ratings for Customer Satisfaction
among Different Bank GroupsBank Y Ratings TotalGroups No Not Somewhat Fully
answers Satisfied Satisfied satisfiedPSB 114 3 68 55 240% to total 47.5 I 25 28.33 22.92 100.00OPB 42 2 49 7 100"6 to total 42.00 2.00 49.00 7.00 100.00FB& NPB 30 0 3 17 50% to total 60.00 0.00 6.00 34.00 100.00Total 186 5 120 79 390% to total 47.69 1.28 30.77 20.26 100.00
Table 4.31Credit/Overdraft FaciIities- Ratings for Customer Satisfaction
among Different Bank GroupsBank Ratings TotalGroups No Not Somewhat Fully
Answers Satisfied Satisfied SatisfiedPSB 178 6 35 21 240% to total 74.17 2 5 14.58 8.75 100.00OPB 87 1 9 3 100% to total 87.00 I 00 9.00 3.00 100.00FB & NPB 44 3 3 0 50% to total 88.00 6.00 6.00 0.00 100.00Total 309 10 47 24 390% to total 79.23 2.56 12.05 6.15 100.00
247
4.3.4 Service Quality Perceptions
So far. for the purpose of the analysis. only specific servicesgenerally offered by banks to household segment wereconsidered. It is also equally important to measure the servicequality dimensions as perceived by the respondents. A uniqueproblem in measuring service quality is that it is difficult forthe customer to evaluate. Service quality perceptions mayalso depend on the perceived expectation levels of customers.Hence it can vary from person to person. Dimensions of servicequality are very complex in banking due to its multi-servicenature. A multitude of aspects such as accessibility, cost, returns,
speed, choice, product range, staff knowledge, flexibility,operational convenience, technology, courtesy, punctuality,accountability etc ma", be applicable on a case to case basis.Several studies have identified possible quality dimensions thatcan be used for evaluating services in banks. However, thepresent study considered key dimensions like speed of servicedelivery, simplicity of procedure, friendliness of staff,reliability of accounting, compliant-free provision of services,and ability to provide financial advice or counseling.Responden-.5 were to rate the above factors on a five-point scalewith ‘very poor‘, ‘poor’, ‘so-so‘, ‘good’ and ‘very good’ states of
satisfaction representing the different point ratings. This scalealso faced the problem of zero values in the lower most points.Hence the rating points had to be combined to form only threestates of satisfaction for cross tabulation in the contingencytables used for Chi-square analysis. For descriptive analysis also,a three-point rating scale was used. The results of the analysisare presented in Tables 4.32 to 4.42.

Table 4.32
Financial Guidance and Assurance— Ratings for Customer
Satisfaction among Different Bank GroupsBank Ratings TotalGroups Poor Ok GoodPSB 62 70 [08 240% to total 25 83 29.17 45.()() /0000OPB 20 25 55 I00% to total 20.()() 25.00 55.00 /0000F8 0 4 21 25% to total 0.00 16.00 84.00 100.00NPB 5 5 I5 25% to total 20.00 20.00 60.00 100.00Total 87 104 199 390% to total 22.31 26.67 51.03 100.00
Table 4.33Results of Chi -Tests based on Table 4.32
Ratio Value Degrees of freedom Asymp. Sig. (2-sided) 2Pearson Chi- 17_103° 6 .009[.ikeliho0d Ratio 21.994 6 .001a 0 cells has expected count less than 5. The minimum expected count is 5.58.
Table 4.34Friendliness of Staff and Counter Service-Ratings for Customer
Satisfaction among Different Bank GroupsBank Ratings TotalGroups Ok GoodPSB 66 174 240% to total 27.5 72.5 100.00OPB 16 84 100% to total 16.00 84.00 100.00FB 5 20 25% to total 20.00 80.00 100.00NPB 4 21 25% to total 16.00 84.00 100.00Total 91 299 390°/o to total 23.33 76.67 100.00
249

Table 4.35Results of Chi-Test based on Table 4.34
Ratio Value Degrees of Freedom Asymp Sig. (2-sided)Pearson Chi-Square 6_‘_>42" 3 100l,ikelihood Ratio 6.494 3 .090
a 0 cell has expected count less than 5 The minimum expected count is 5.83
Table 4.36Complaint-free Processing- Ratings for
Customer Satisfaction among Different Bank GroupsBank Ratings TotalGroups OK GoodPSB 95 145 240% to total 39.58 60.42 100.00OPB 29 71 100% to total 29.00 71.00 100.00FB 3 22 25% to total 12.00 88.00 100.00NPB 6 19 25% to total 24.00 76.00 100.00Total 133 257 390% to total 34.102 65.9 100.00
Table 4.37Results of Chl- Tests based on Table 4.36
Ratio Value Degrees of Freedom Asymp. Sig. (2-sided)Pearson Chi-Square 10.937“ 3 .012Likelihood Ratio 11.939 3 .007a 0 cell has expected count less than 5 The minimum expected count is 8.53
250

Table 4.38Speedy Processing-Ratings for Customer
Satisfaction among Different Bank Groupsank Ratings Total
Groups OK GoodPSB 120 120 240% to total 50.00 50.00 100.00OPB 61 39 100% to total 61 ()0 39.00 100.00F3 l 24 25% to total 4.00 96 100.00NPB 7 I8 25% to total 28.00 72.00 100.00Total 189 201 390% to total 48.46 51.54 100.00
Table 4.39Results of Chi - Tests based on Table 4.38
Ratio Value Degrees of Freedom Asymp. Sig. (2-sided)Pearson Chi—Square 3o_5ooa 3 .000Likelihood Ratio 35.780 3 .000a 0 cell has expected count less than 5. The minimum expected count is 12.12.
Table 4.40Reliability of Accounting- Ratings for
Customer Satisfaction among Different Bank GroupsBank Ratings TotalGroups OK GoodPSB 33 207 240% to total 13.75 86.25 100.00OPB 13 87 100% to total 13.00 87.00 100.00FB 1 24 25% to total 4.00 96.00 100.00NPB 7 18 25% to total 28.00 72.00 100.00Total 54 336 390% to total 13.85 86.15 100.00
251

Table 4.41Results of Chi - Tests based on Table 4.40
Ratio Value Degree of Freedom Asymp. Sig. (2-sided)Pearson Chi-Square 6393" 3 .098Likelihood Ratio 6.172 3 .104:1 2 cells (250%) have expected count less than 5 The minimum expected countis 3.46.
Service quality dimensions such as financial guidance andassurance, complaint free processing, and speed were found to be
dependent on bank groups. The mean values of the factorsindicated that perception of quality of services differ from onebank group to another (Table 4.42). Standard deviation for thevarious dimensions of service quality of FB and NPB were alsolower compared to other bank groups. This shows the consistency
of service quality levels in these banks, though, it can also beattributed to the homogeneity of the segments they cater to.Standard deviations were higher in the case of PSB obviously due
to the high variability of expectations of the heterogeneoussegments they serve.
Another notable observation is that the dimensions, which varied.
were more or less associated with speed and procedure in service
processing. Service quality may be evaluated by customers interms of both tangible variables such as time (consumption and
waiting) and physical environment, and intangible variables such
as staff attitude, attentiveness, knowledge, and professionalism.RBI had, from time to time, intervened in the issue of improving
speed of service processing. The early approach to service quality
measurement, in fact, focused on reducing waiting time and theprocess of complaint handling, which certainly produced good
I») LII IQ

results in the case of a few core services. The present study.however, imply that PSBs and OPBs need further advancement in
this aspect. Speed of service delivery is also related to thecomplexity of procedures.
Table 4.42Descriptive Statistics of Ratings for the Dimensions of Service
Quality among Household SegmentBank Statistic Financial Friendly- Complaint- Speed in ReliabilityGroup Guidance ness Free Processing in
of Staff Process Accounting
PSB Mean 2.1917 2.6250 2.6042 2.5000 2.8625
Std. Dev. 0.8212 0.6604 0.4901 0.5010 0.3451
OPB Mean 2.3500 2.7600 2.7100 2.3900 2.8700
Std. Dev. 0.7961 0.5881 0.4560 0.4902 0.3380
FB Mean 2.8400 2.8000 2.8800 2.9600 2.9600
Std. Dev. 0.3742 0.4082 0.3317 0.2000 0.2000
NPB Mean 2.4000 2.8000 2.7600 ‘2.7200 2.7200
Std. Dev. 0.8165 0.5000 0.4359 0.4583 0.4583
Total Mean 2 2872 2.6821 2.6590 2.5154 2.8615
Std. Dev. 0.8078 0.6222 0.4747 0.5004 0.3458
The aspect of financial guidance was rated low compared to other
aspects for all banks except FBs (see Figure 4.7). In fact, this
253

plays a crucial role in cross-selling of different products acrosscustomer segments. Banks cannot. however, expect customers to
approach them. A more effective method will be developingcustomer databases with details of customer service processing.
products purchased, and customer profile.
Figure 4.7
Mean of Service Quality Dimensions ofl1 BankGroups«n I:34? |i¢2.151 I_‘go.1 E0 on E 5' g‘| --0 W 5 III ;.,c ;_—_ DNPB‘ 85 3 -0.13,’ 1:17: .0 ‘--——l “U -= 0-ou mm to I1 -— ‘O E.::o °‘3 = IE: ,; O ._ :10 cu ,LLCJ 0 O 0- ‘DE 1 I1 LI. l! Dimensions
Computerisation would also facilitate such customer information
processing modules that would help in identifying potentialbuyers of various products and services. This would also enable
customers to get accurate and timely information for theirpurchase decisions.
The observed ratings were correlated with overall customersatisfaction. All the dimensions were positively correlated withcustomer satisfaction. Correlations with all the dimensions
except reliability in accounting showed significance at 1% level
(see Tables. 4.43 and 4.44)
254

Table 4.43Correlations between Overall Satisfaction and Dimensions of
Service Quality
it Correlation is significant at the 0.01 level (l-tailed).
Dimensions Financial Friendliness Complaint- Speed in Reliabilityguidance free processing in
process accountingOverall 0.132“ 0.186" 0.150“ 0.126" 0.069satisfaction
Significance 0.004 0.000 0.001 0.006 0.084
Table 4.44Correlations Between Overall Satisfaction and that for Different
serviceservices Overall pdat- roper Cheque Collectin issue Cash
Satisf— ing of Entries Encash- of of Transfer byaction pass inent Outstatin DD telegraphic/Books instrum- electronicems services
Overall 1.000 0.130” 0.164" 0.078 0.106‘ 0.023 .,]01*Satisfaction ISig. (l- 0.004 0.001 0.061 0.017 0.326 0.022 0_043tailed)
** Correlation is significant at the 0.0] level (l-tailed)."' Correlation is significant at the 0.05 level (l-tailed).
The correlations clearly show that overall customer satisfactionis dependent on how efficiently the various services are
delivered. This, the customers are likely to evaluate in terms ofboth process oriented and behavioral dimensions as seen from the
positive correlations indicated in Table 4.43 and 4.44.

With regard to customer satisfaction of NR1 segment, a detailed
analysis based on different MFB groups could not be done due to
small sample size. Hence the percentages shown in Table 4.45only represent the overall evaluation of the respondentsirrespective of their MFBs.
Table 4.45Customer Satisfaction on Different Services and Dimensions of
Service Quality in NRI Segment(Figures in percentage to total)
SI.No Service/Quality RatingsDimension Poor Ok Good
1 Updating of pass books 4.00 28.00 68.002 Cheque encashment 8.00 20.00 72.003 Issue of demand drafts 12.00 28.00 60.004 Cash transfer by
tclegraphm 16.60 52.00 52.00electronic services
5 Carrying out 4.00 28.00 68.00standing instructions
6 Interaction with persons 12.00 20.00 68.00authorised by the customer
7 Communication with the 8.00 40.00 52.00customer
8 Reliability in accounting 4.00 8.00 88.009 Financial advice and 16.00 44.00 40.00
counseling
10 Friendliness of staff 12.00 68.00 20.0011 Speedy process 20.00 32.00 48.0012 Complaint-free services 16.00 24.00 60.00
256

Customer satisfaction with respect to various services and quality
dimensions among NR1 and household segments showed almost a
similar pattern except for friendliness of staff. Eighty percent ofthe respondents were not satisfied with the attitude of the staff.The early part of the analysis indicated that NR1 segment ismore likely to maintain accounts with several banks and ispossibly in a position to make comparisons of service qualitylevels in different banks. Exposure to different banks will raisetheir expectations levels too. The aspects that need improvement
in this segment are cash transfer mechanisms, financial guidance.
speed of processing, and communication with the customers andattitude of staff.
Table 4.46Customer Satisfaction on Different Services and Dimensions ofService Quality in Traders and Small-Scale Industries Segment
Sl.No. Service Mean StandardDeviation
1 Responsiveness 3.5368 0.83552 Processing of Loans 3.3636 1.07413 Personalised Services 3.2660 0.90614 Financial Guidance 3.2151 1.10195 Updating of Account Details 3.1290 1.27036 Assistance in Cash Management 2.9545 0.99327 Fast Collection of Funds/Transaction 2.9570 1.12218 Flexibility 3.1591 0.99299 Range of Service Offered 3.2889 0 889910 Complaint Free Processing 3.0115 1.083611 Assistance in providing Information 2.9765 0.830612 Reliable accounting process 3.0115 1.2152
257

Table 4.47Ratings for Customer Satisfaction on Different Services and
Quality Dimensions among Traders and Small-ScaleIndustries Segment
(Figures in percentage)
:' Service VD D ox s vs Missing Total0
1 Responsiveness 2.0 2.00 47.0 31.0 13.0 5.00 100.02 Processing of loans 0.0 7.00 25.0 48.0 3.00 17.00 100.03 Personalised services 3.0 6.00 50.0 30.0 5.00 6.00 100.04 Financial guidance 5.0 5.00 44.0 36.0 7.00 3.00 100.05 Updation of accounts 0.0 5.00 45.0 24.0 0.00 26.00 100.0
Assistance in cash6 1.0 10.0 51.0 19.0 2.00 17.00 100.0managementFast collection of7 1.0 11.0 48.0 22.0 4.00 14.00 100.0funds/transaction
8 Flexibility 4.0 1.00 44.0 35.0 0.00 16.00 100.09 Range of services 0.0 3.00 5.0 45.0 34.00 13.00 100.0
Complaint free10 _ 2.0 5.00 49.0 22.0 3.00 19.00 100.0processing
11 Assistance in info 0.0 10.0 59.0 13.0 2.00 16.00 100.0Reliable accounting12 1.00 4.00 41.0 30.0 2.00 22.00 100.0process [
The information in Table 4.47 indicates that this segment hassomewhat a different experience with the services offered bybanks than what the household segment had. The mean valuesrepresent (see Table 4.46) a level of satisfaction below ‘good’(less than 4 in the scale), especially, dissatisfaction is evident in
the aspects such as fast collection of funds or transactions,assistance in cash management and information on services or
products offered. Contrary to the assumption that they face more

difficulty in the processing of loans, the mean value for theaspect showed fairly a better rating compared to other aspect.However, when mean values of the same services are comparedbetween PSB and OPB, OPBs are rated better than PSBs in most
of the aspects (see Table 4.48 and Figure 4.8). But it could not be
proved statistically that the difference was significant, except in
the case of complaint free processing. This aspect gets higherrating for OPB. Another notable finding is that OPBs were ratedlower in satisfaction levels with respect to fastcollection/transaction of funds in both Household and Traders &
Small-Scale Industries segments.
Table 4.48Mean Values of Ratings‘ for Different Services of PSBs and OPBs in
Traders & Small-Scale Industries Segment.
Bank group 1* 2 3 4 5 6 7PSBs Mean 3.5091 3.3519 3.2222 3.2773 3.2132 2.9623 3.0000
Std. dev .3579 1.1341 .9243 1.0171 1.3009 .3540 .9623Private Mean 3.6667 3.5000 3.4000 3.2759 3.3571 2.9615 2.8571Sector Std.dev .6609 .8602 .8944 1.0986 .9114 1.2159 1.4836Banks
*The order ofthe services is the same as in table 4.46
# Rating scale ranges from 1-5Table Contn.
Bank Group 3 9 10 11 12PSBs Mean 3.1373 3.1923 2.8600 2.9200 3.0196
Std. dev 0.9169 1.0297 1.1068 .8533 1.1400Private Mean 3.3704 3.5000 3.4815 3.1538 3.2308
Std. Dev 1.0795 .6383 .9352 .8339 1.1066
259
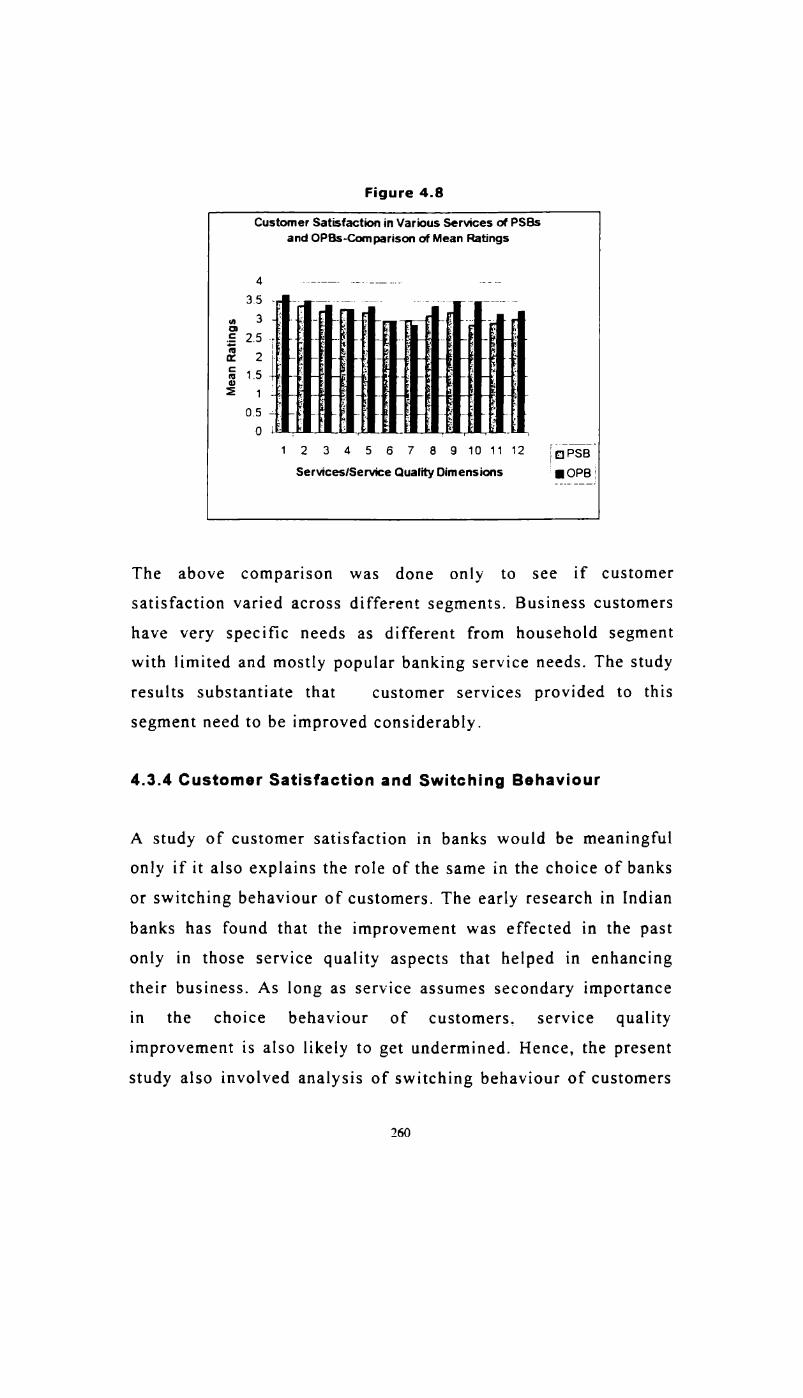
Figure 4.8
Customer Satisfaction in Various Services of PSBsand OPBs-Comparison of Mean Ratings
Mean Ratings
.0 .-‘ N 9-’ U1 —- U1 N U1 0.! U1 1:
O
12 3 4 5 6 7 3 9101112 ;",;;,',§3"Serviceslservice Quality Dimensions ‘ I OPB }
The above comparison was done only to see if customersatisfaction varied across different segments. Business customers
have very specific needs as different from household segmentwith limited and mostly popular banking service needs. The study
results substantiate that customer services provided to thissegment need to be improved considerably.
4.3.4 Customer Satisfaction and Switching Behaviour
A study of customer satisfaction in banks would be meaningfulonly if it also explains the role of the same in the choice of banks
or switching behaviour of customers. The early research in Indian
banks has found that the improvement was effected in the pastonly in those service quality aspects that helped in enhancingtheir business. As long as service assumes secondary importance
in the choice behaviour of customers, service qualityimprovement is also likely to get undermined. Hence, the present
study also involved analysis of switching behaviour of customers
260
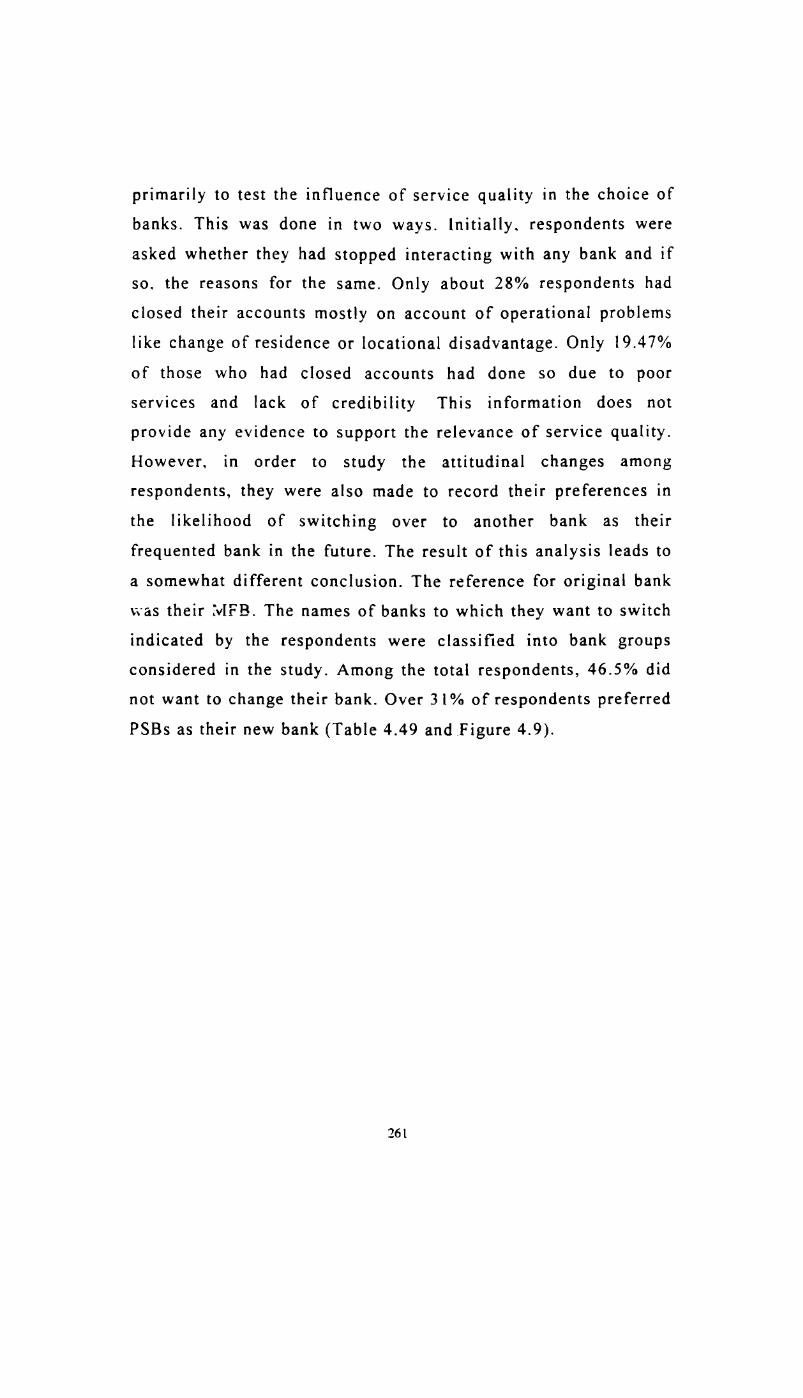
primarily to test the influence of service quality in the choice ofbanks. This was done in two ways. Initially, respondents wereasked whether they had stopped interacting with any bank and ifso. the reasons for the same. Only about 28% respondents hadclosed their accounts mostly on account of operational problemslike change of residence or locational disadvantage. Only l9.47%
of those who had closed accounts had done so due to poorservices and lack of credibility This information does notprovide any evidence to support the relevance of service quality.However, in order to study the attitudinal changes amongrespondents, they were also made to record their preferences in
the likelihood of switching over to another bank as theirfrequented bank in the future. The result of this analysis leads to
a somewhat different conclusion. The reference for original bank
was their Evli-‘B. The names of banks to which they want to switch
indicated by the respondents were classified into bank groupsconsidered in the study. Among the total respondents, 46.5% didnot want to change their bank. Over 31% of respondents preferred
PSBs as their new bank (Table 4.49 and Figure 4.9).
261

Table 4.49Bank Switching Preferences of the Respondents-Distribution based
on Bank GroupsCHANGE TO Total Grand
Bank Don't want PSB OPB FB NPB CB respondents TotalGroup of to change who want toRespondents change(1) (2) (3) (4) (5) (5) (7) (3) (9)PS3 104 82 21 2 6 25 136 240% of”) 60.29 15.41 [47 3.73 18.38 100% of(9) 43.33 34.17 8.5 0.83 2.08 10.00 55.83 100op]; 30 40 16 2 10 70 1000/0 mm) 57.14 22.86 0.00 2.86 14.29 100.00% to (9) 30.00 40.00 16.00 0.00 2.00 10.00 70.00 100F3 24 1 1 25
0.00 100.0 0.00 0.00 0.00 100.00% to (8)
O
% to (9) 96.00 0. 00 4.00 0.00 0.00 0.00 _4.00 100. 00NPB 22 2 l 3 250.00 66.67 33.3 0.00 0.00 100
% to (8)3
% to (9) 88.00 0.00 12.00 0.00 0.00 0.00" 12.00 100.00CB 4 S l 6 10% to (8) 83.33 0.00 0.00 0.00 16.67 100.00o/0 to (9) 40.00 50.00 0.00 0.00 0.00 10.00 60.00 100Total 186 127 40 3 3 36 214 400% t0(3) 59.35 18.69 1.42 3.74 16.82 100.00% to (9) 46.5 31.75 10.00 0.75 2.00 9.00 53.5 100.00
262

Figure 4.9
Percentage to Total of Respondments who--l:‘lI_a_htto Switch to Diffrent Bank Groups
i{N$’cH3ng;.e7§
1 PS8 ':1 ope:1 FB
:. NPBms *
Data in Table 4.49 give interesting findings about the attitude of
bank customers. The bank group likely to be affected the most as
seen from the figures is OPB. Seventy percent of OPBrespondents are likely to switch to Ol.i‘l€.'l‘ banks. However 16%
would again go for another OPB or another branch. Fourtypercent would hop to PSB. The threat of bank switching in PSB is
not as serious as it is for OPB. Among the PSB respondents over
55% want to change, however, 34.17% would choose another PSB
or another branch of their present bank. The high percentage ofpeople who want to switch from one PSB to another is anindication of possible competition within the group. Almost 9%of total respondents think CB5 as a right choice for them. Also10% of both PSB and OPB customers who are likely to change
would choose a CB. Very insignificant percentage of the NPBand FB respondents wants to change their banks. Further,aggressive selling practices of these banks would also attract PSBand OPB customers to them. It is also inferred that, within the
PSBs itself, competition would get intensified as is evident from
the PSB to PSB switching pattern. To some extent, this is also
263

true with OPBs. Banks have to encourage cross—selling of theirproducts among their customers and at the same time continueproviding them increased customer satisfaction. The reasons forswitching behaviour were also studied. Details are given in Table4.50

SN
.323 __u
E co. 2 5. 3:. 3: too: 3m_:.3u:a of uucoz u.._m.::_... ._o.. 2.02:: 2.5 E2: u.cE .:::.. u>.:._ £co_:_o5u._ oecm .383: mi: 3.3. Be 3;: 213 3.2 :6 .23 2.x.Em mm 3 2 v 2 2 __ _a.o._.2.63 cad 2.2 ~93 zed 3.2 2.2 22. .52 2 ..\.o _ N _ _ ~ muQ93: 3.2: 23 22. ~56 zed 36 .23 3 .\..m m 9.23.63 22. «$.32 cod 2:. cod :9: S. e .23 3 .x._ _ m,._
8.2: 3:: MY; Cw. 3:. :6» 52v: 1 m ..:3.:..\..E 5 mm .. mm 2 w F5:93: 3.2 053. 23. VQN 3.3. 3.3 2. w .32 3 ..\..oi 3 on w .. S. x._ o mm;
2.. .8 2.. G. .3 _:a:_m 3 3 :3 .:mcenaom uaochauz ouaE_ __u.:.._m 3_?.ow 53.5 n:..:.o¢ E3...
.,_.:o.—. .550 .3... ..o.._ ..o..._ .3... .5: .o.._ .3... u.__m.::.u
MCOGNOK u—._0._0uu_D Uflfl nucocconmom m0 mom! :0 Uflnflfl :o_u:.__.uu.o-Eouum._ u..__.._3_3m scan
3.4 030...

Figure 4.10
Percentage to Total of Respondents who Want to Switch FromEach Bank Group For 'Returns‘.'Safety‘.'Service‘ and 'Nearness'
120 -——2 100 »———— _ ,4." .——»— W ,,5 ‘-P531: 60 »~ — —— lp 5 IOPB‘ 3 5° ’ ‘J DFB0 40 »»——-~ » "-74-vQ: ' :_ ,UNPBg 20 _.r.;-__ .. __ g ., .... .__g__; '0 =1 , __ _ . ,, ..._VReturns Safety Service Neamss I
Reasons for switching from each bank group
Although. better services is the most frequent reason cited forswitching from one to another bank 'nearness' also gets an equalimportance except in the case of FBs. Other reasons were relativelyless significant (see Figure 4.10). However, OPB customers werefound to be more inclined to banks providing better services. It maybe recalled here that OPBs were rated above PSBS on the aspect ofcustomer satisfaction. It should be noted that OPB respondents havea higher expectation levels about service quality. A contradictingobservation is that majority of those who wanted to change fromOPB had chosen PSBs. A possible inference is that OPBs aretargeting at specific segments, say, business, trade or private sectoremployees to whom they provide better attention. Safety was also amatter of concern while changing banks. This was indicated by18.57% of those who wanted to change from OPB. Obviouslyenough, this was a major reason for their inclination towardsswitching to a PSB.
PSB respondents, however, give more importance to nearness,though service is also an equally important reason for them to
266

change. Table 4.51 illustrates the relation between the bank-ofchoice and reasons or selecting them.
Table 4.51Reasons for Switching to a New Bank-Distribution based on Different
Bank Groups and Reasons for the Choice.Change to For For For For For For For Total#Bank Group Returns Safety Service Branch Image Nearness Other
spread reasonsPEB '1 23 41 4 9 46 16 127‘l. to total 0. 79 18.11 32.28 3.15 7 09 36.22 12.60 100.00OPB 6 18 3 17 4 40°/. to total 0.00 15.00 45. 00 0.00 7.5 42.5 10.00 100.00FB 1 2 1 3% to total 33.33 0. 00 66.67 0. 00 0.00 33.33 0.00 100.00NPB 6 1 1 8'/o to total 0. 00 0.00 75.00 0.00 0. 00 12.5 12.5 100.00CB 3 3 15 1 13 1 36% to total 22.22 8.33 41.67 0.00 2. 78 36.11 2. 78 100.00Total 11 32 82 4 13 78 22 214‘l. to total 5.14 14.95 38.32 18.69 6.07 36.45 10.28 100.00
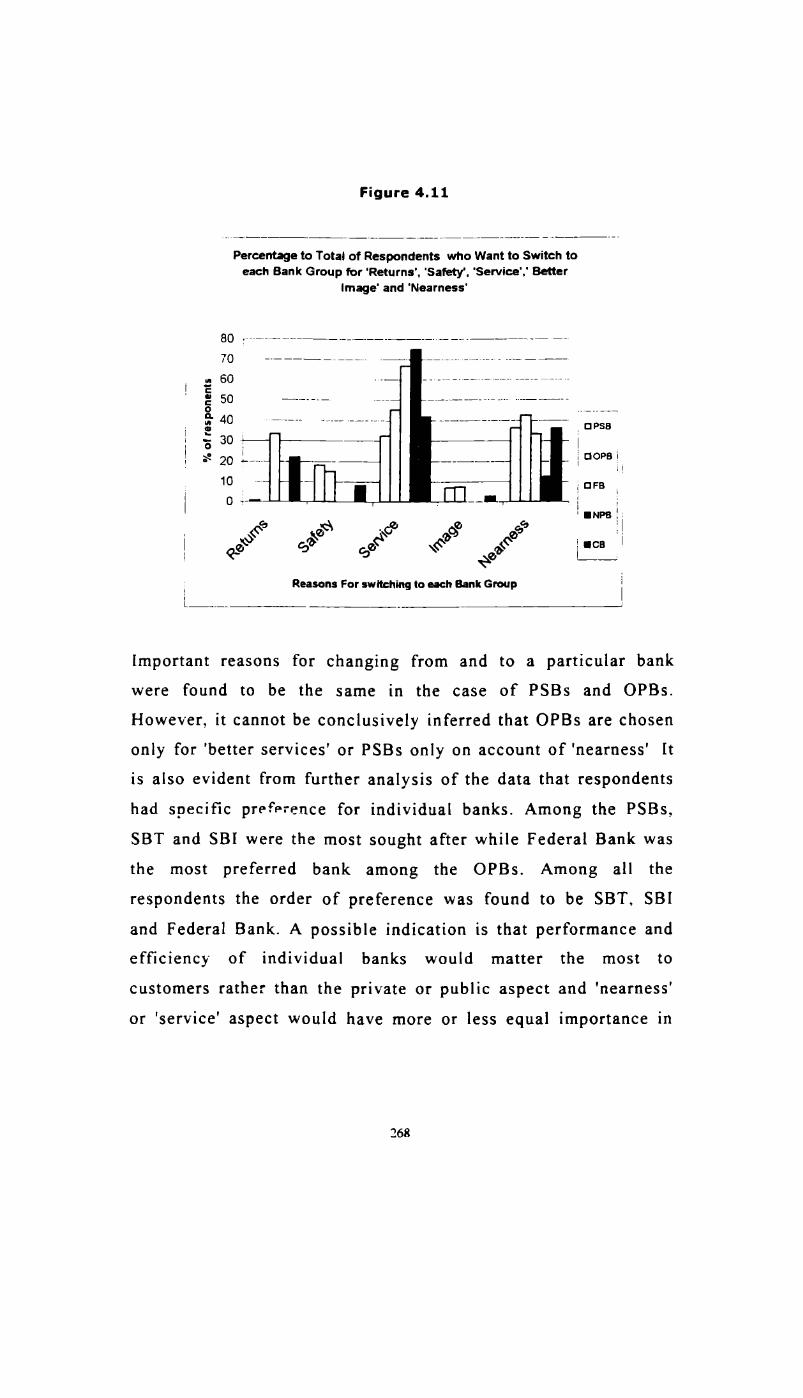
Figure 4.11
Percentage to Total of Respondents who Want to Switch toeach Bank Group for ‘Returns’. ‘Safety’. 'Service',' Better
Image’ and 'Nearness'
'/o of responents
Ao III
Q3; 6° ‘-90Reasons For switching to each Bank Group
Important reasons for changing from and to a particular bankwere found to be the same in the case of PSBs and OPBs.
However, it cannot be conclusively inferred that OPBs are chosen
only for 'better services’ or PSBs only on account of 'nearness' It
is also evident from further analysis of the data that respondentshad specific preference for individual banks. Among the PSBs,
SBT and SBI were the most sought after while Federal Bank was
the most preferred bank among the OPBs. Among all therespondents the order of preference was found to be SBT, SBIand Federal Bank. A possible indication is that performance andefficiency of individual banks would matter the most tocustomers rather than the private or public aspect and 'nearness'or ‘service’ aspect would have more or less equal importance in
268

choosing the bank as long as it enjoys a good image in themarket.
For choosing NPBS. service quality was the most influencingfactor (see Figure 4.11). Though, this part of the analysis couldnot conclusively infer that customers have any different criteria
for selecting their banks in future. it is quite possible that theongoing efforts of automation and networking would transformthe entire banking scene in the days to come. With more andmore banks going for ATMs, homebanking and other electronicservices that can be operated from home, chances are that the'nearness' aspect would get redefined as need for quicker andeasier access to accounts. Presence of electronic services would
then become an important factor. This was further revealed bythe attitude to computerisation in banks (see Table 4.52-4.53, and
Figure 4.12). It is evident that customer need greater speed andconvenience in services. It is obvious that the aspects, whichneeded improvement the most, are reduction in waiting time and
computerisation. This also implies the need for modernisation ofbanks or automation in banks.
Table 4.52Attitude to Computerisation among
Household SegmentOpinion % Saying YesComputerisation is not required 5.00Is very convenient 93.25Does not make any difference 5.50
269

Table 4.53Percentage of Respondents Requiring Improvement in Different
Aspects influencing Service Quality ImprovementSl.No Improvement needed in % Saying
yes
1 Bank premises (Better arrangements and 60.25Convenience)
2 Reduction in waiting time for various services 88.003 Attitude of staff 72.004 Use of computer for faster service delivery 83.255 Customer service in general 76.50
Figure 4.12
Percentage Respondents Requiring lrrprovement in Key ServiceQuality Aspects
"lo Respondents
Similarly, answers to queries on requirement of changes intimings of bank also suggested that more than sixty percentwanted their banks to work beyond 2.00 pm during week days and
almost fourty percent wanted Sunday banking. The abovediscussion on various aspects of service quality improvement

supports largely the argument that the service aspects would getgreater priority in bank selection in future. However. asmentioned earlier the above analysis didnot involve a study ofperceptions of customers about bank choice with more focus on
the degree to which some of the leading factors would influenceit. In order to understand in detail the relative importance offactors. which are likely to influence respondent's choicebehaviour in future, a separate analysis was done, the details ofwhich are given in the following section.
4.3.5 Analysis of Bank-Choice Perceptions
As different from the method used for the above analysis, thestudy of perceptions used statements indicative of certain leading
attitudes to choice of banks. Agreement or disagreement to these
statements was measured using Likert Scales. The actual tablesobtained for each factor are presented here along with thecontingency tables used for performing Chi-tests. The summary
of the results of hypotheses testing is given in Table 4.54.
The ratings for each f3L.l.Ul' were tested for dependence with the
MFB of respondents to prove the hypothesis that the degree ofinfluence of the factors on the choice of banks and their present
choice of MFB were related. In other words the ratings depended
on their choice of present MFB. As seen from Table 4.54, therelation was found to be absent in the case of factors like attitude
to choosing banks with high ‘repute or image’, ‘nearest bank‘ and
'only private bank‘. All other factors showed dependence withrespondents‘ MFBs.

Table- 4. 54Summary of Analysis of Choice Perceptions
SI. Factors Bank groups with Bank groups withNo strong positive Strong negative Dependence
attitude (in the attitude found or notdescending order) (In the (at 5 %
descending order) significance)
1 Repute/Image of Bank FB, PSB, OPB, No Bank groups - NoNPB
2 Returns Offered OPB, PSB, NPB, No Bank groups - YesFB
3 ‘Only-Public-Sector..' NPB FB, OPB, PSB YesBank Factor
4 Nearness FB, NPB No Bank groups No5 ‘Only-Private-Bank..' No Bank groups FB, OPB, PSB, NoFactor NPB6 Electronic Facilities NPB, FBs No Bank groups Yes7 Multiple Bank OPB, PSB, F B, No Bank groups YesPreference NPB8 Customer Service FB, NPB, OPB, No Bank groups Yes
PSB
Most of the respondents were in agreement with the statementthat they would choose a bank of good repute. The variationswere insignificant among the different MFB groups (see figure4.13). Chi-test performed on the Table 4.55 did not support thehypothesis that there is variation for influence of this factoramong the different MFB respondents. However, a single factorneed not indicate the likelihood of choosing a bank in any of the
bank groups under study. OPB group had comparatively strongdesire for better returns followed by PSB group. The least return
motivated group was NPB, though no group was in strong

disagreement with choosing a bank. which gives maximumreturns. Figure 4.14 gives the graphical representation of thisinformation. The dependence of this factor on bank groups wassignificant.
Table 4.55Ratings for Influence of 'Repute /Image‘ in the Choice of a Bank
Distribution based on Respondents’ M FBsBank Ratings TotalGroups Strongly Disagree So-So Agree StronglyDisagree AgreePSB l l 20 SO I I5 44 240% to total 4.58 8.33 20.83 47.92 18.33 100.00OPB 2 1 I 20 60 7 100% to total 2.00 11 00 20.00 60.00 7 00 100.00FB 0 1 5 l4 5 25% to total 0.00 4.00 20.00 56.00 20.00 100.03NPB 1 3 7 7 7 25% to total 4.00 12.00 28.00 28.00 28.00 100.00Total 49 82 196 63 390°/o to total 0.00 12.56 21.03 71.28 16.15 100.00
Figure 4.13
Percentage of Respondents in each Bank Group Rating 5'Repute of Bank‘ as a Reason for Choice
_ 7o .i 60 EII‘E 50 — —0
E 40 s0 I! % so l——-———4 0 e
15 20 L——.%—a— _° 10 ~~— E95;0 4.53-_EL, nope»Strongly Disagree S060 Agree Strongly 3UF3 IDisagree Agree lE_f4fl3_!
Level of Agreernentmisagreement

OPBs are able to give better returns for deposits. This can be the
reason why a significant percent of their customers have aninclination to higher returns in choosing their bank. Similarly.NPB customers are likely to be more concerned aboutconvenience and speed. and would not emphasise on higherreturns for regular dealings.
Table 4.56Contingency Table for Chi- Tests based on Table 4.55
Bank group Ratings Total2.00 3.00 4.00 5.00
PSB 30 51 115 44 240OPB 13 20 60 7 100FB+NPB 5 12 21 12 50Total 48 83 ‘.96 63 i 390
Table 4.57Results of Chi- Tests based on Table 4.56
Ratios Value Degree of SignificanceFreedom
Pearson Chi-Square 111413 6 0.084Likelihood Ratio 12.216 6 0.057a 0 cell has expected count less than 5 The minimum expectedcount is 6.15.
274

Table 4.58Ratings for Influence of Returns Offered in the Choice of a Bank
Distribution Based on Respondents‘ MFBsBank Ratings TotalGroup
Strongly Disagree So—So Agree StronglyDisagree AgreePS8 21 39 29 98 53 240% to total 8. 75 16.25 12.08 40.83 22.08 100.00OPB 4 9 S 53 28 I00% to total 4.00 9.00 5.00 53.00 28.00 100.00FB 0 13 6 4 2 25% to total 0.00 52.00 24.00 16.00 8.00 100.00NPB 3 8 5 5 4 25% to total 12.00 32.00 20.00 20.00 16.00 100.00Total 28 69 45 160 87 390% to total 7.18 17.69 11.54 41.03 22.31 100.00
Figure 4.14______.__._ -..%_-_ __ 1Percentage of Respondents in Each Bank Group Rating ‘Returns’
as a Reason for choice of Bank!60 !§ so 2 —— I8 4o ' 53 Ig_ 30 '“ _3 F‘ japsaiE; uopa° 4:. T lama 1'
Strongly Disagree So-So Agree Strongly ' 0 “P3!Disagree Agree ELevel of AgreerrentIDisagreernent
275

Table.4.59Contingency Table for Chi-Test based on Table 4.58
Bank Group Ratings Total2.00 3 ()0 4.00 5 00
PSB 60 29 98 53 240OPB l4 5 53 38 l0()l"B+Nl’B 24 ll 9 6 50l'otal 98 45 I6() 87 390
Table 4.60Results of Chi- Tests based on Table 4.59
Ratios Value Degrees of SignificanceFreedom
Pearson Chi-Square 37_646a 6 0.000Likelihood Ratio 38.197 6 0.000a 0 cell has expected count less than 5.The minimum expectedcount is 5.77
The analysis of data on influence of the attitude ‘choose-onlypublic-sector-bank on the choice of bank gives interestingresults. Obviously. respondents favouring any bank group did not
have very strong agreement to this attitude, though PSB groupwas fairly positive to ‘choosing-only-a-public-sector-bank‘ when
it comes to choice of a bank. Majority of NPB and OPBrespondents seemed to have disagreement to this view, whichlargely supports their present choice of MFB. Anothercontradicting observation in this analysis is that a goodpercentage of NPB customers strongly supported 'choosing-only
a-PSB' whereas FB customers did not (see Figure 4.15). It is infact, hard to explain this attitude with the information available
from the present survey. However, in the analysis of (see Table
276

4.5) bank combination of respondents it was seen that more FBrespondents had PSBs as their other bank than those who hadOPBs or NPBs as one. It certainly is an indication of thefavourable attitude of FB customers to PSBs. They would have
made the choice either due to the image aspects associated with
dealing with a foreign bank as implied by a higher score forrepute or image among FB respondents. NPB customers on theother hand have more dealings with OPBs than they have withPSBS.
The Chi-test results also indicate dependence between bankchoices and attitude towards choosing only a public sector bank.In general, majority (almost 60%) of the respondents disagreed to
the statement. A strong implication is that customers wouldexercise their choices in future by critically evaluating thedifferent options available.
Table 4.61Ratings for Influence of 'WiII-Choose-Only-Public-Sector-Banks‘
Attitude - Distribution based on Respondents‘ MFBsBank Ratings TotalGroup Strongly Disagree So-So Agree StronglyDisagree AgreePS3 16 106 34 63 18 240% to total 6.67 44.17 14.17 26.25 7.5 100.00OPB 7 70 9 12 2 100% to total 7 00 70.00 9.00 12.00 2.00 100.00FB 1 l8 3 2 1 25 _% to total 4.00 72.00 12.00 8.00 4.()0 100.00NPB 0 3 4 16 2 25% to total 0.00 12.00 12.00 64.00 8.00 100.00Total 224 49 93 24 390% to total 0.00 56.00 12.25 23.25 10.00 100.00

Fig u re 4. 1 5
Percentage of Respondents in Each Bank Group Rating the aspect'WiII-Choose-Only-Publicsector-Bank‘ as a Reason for Choice
so —— —
L2.‘ .5 H ,i:iPsB‘§ IOPB3 7 are"'5' — s “-4 9.199.._ .Strongly Disagree So-So StronglyDisagree Agree
Level of Agreementlbisagreement
Table 4.62Contingency Table for Chi-Test based on Table 4.61
Bank Ratings TotalGroups 2.00 3.00 4 00 5.00PSB 125 34 63 I8 240OPB 77 9 12 2 100FB+NB 22 18 4 50Total 224 49 93 24 390
Table 4.63Results of Chi- Tests based on TabIe4.62
Ratio Value Degrees of SignificanceFreedom
Pearson Chi- 34393“ 6 .000Likelihood Ratio 25.742 6 .000
a 1 cell (8.3%) has expected count less than 5. The minimum expectedcount is 3.08.
278

In the banking industry. the world over, a factor that strongly
influences customers’ choice of bank is the 'nearness‘ aspect. In
the present study FB and NPB groups had comparatively stronger
attitude to 'nearness’ aspect (Table 4.64 and Figure 4.16). All the
bank group customers however showed fairly similar attitude
towards choosing a bank in their neighbourhood (see Figure4.l6). However. no dependence was found between the ratings for
the factor and bank groups (see Table 4.66).
Table 4.64Ratings for Influence of 'Nearness' Aspect in the Choice of Bank
Distribution based on Respondents‘ MFBSBank group Ratings TotalStrongly Disagree So- Agree StronglyDisagree So AgreePSB 16 47 70 78 29 240
% to total 6.67 19.58 29.1.7 32.5 12.08 100OPB 2 19 41 29 9 100% to total 2.00 19.00 41.00 29.00 9.00 100.00FB 0 5 5 ll 4 25% to total 0.00 20.00 20.00 44.00 16.00 100.00NPB 0 1 10 10 4 25% to total 0.00 4.00 40.00 40.00 16.00 100.00Total 18 72 I27 128 45 390% to total 4.62 18.46 32.56 32.82 11.54 100.00

Figure 4.16
Percentage of Respondents Rating 'Nearness' asa Reason for Choice of Bank
50 ___,E 40 A35 30 ~ 63 20 0 7 -F6 UPSB; 0 1.. _ ~ . - , UFB
I Strongly Disagree So-So Agree Strongly ENEE ,Disagree Agree_ __ _ , ___'-‘_"’°' °' “9"°'“°"" °"‘9'°?_"T?'7!',, ____.#_ __,___
Table 4.65Contingency Table for Chi-Test based on Table 4.64
Bank Group Ratings Total2.00 3.00 4.00 5 00
PSB 63 70 78 29 240OPB 2| 41 29 9 100FB+NPB 6 I6 21 7 50Total 90 127 128 45 390
Table 4.66Results of Chi-Tests based on Table 4.65
Ratios Value Degrees of Significance. (2Ficedoui sided)
Pearson Chi-Square 9552" 6 0.145Likelihood Ratio 9.890 6 0.129a 0 cell has expected count less than 5.The minimum expected
count is 5.77
The respondents‘ attitude to 'choosing-only-a-private-bank‘ wasalso tested. No bank-group respondents were very muchparticular about going only for a private bank while over sixtypercent of total respondents rejected the idea (see Table 4.67).
280
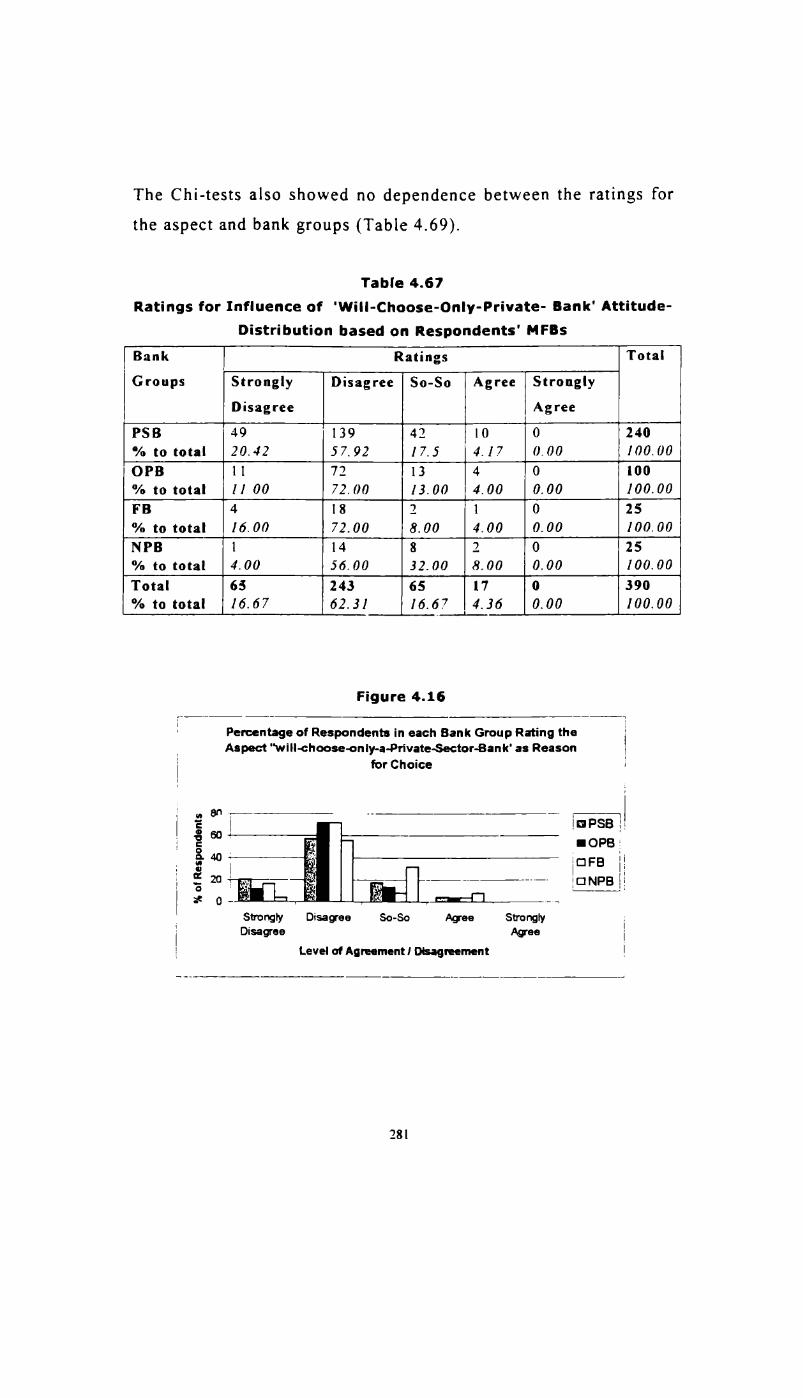
The Chi-tests also showed no dependence between the ratings for
the aspect and bank groups (Table 4.69).
Table 4.67Ratings for Influence of 'wiII-Choose-Only-Private Bank‘ Attitude
Distribution based on Respondents’ MFBsBank Ratings TotalGroups Strongly Disagree So-So Agree StronglyDisagree AgreePS3 49 139 42 10 0 240‘'/o to total 20.42 57. 92 17.5 4.1.7 0. 00 100. 00OPB ll 72 13 4 0 100‘% to total 11 00 72.00 13.00 4.00 0.00 100.00FB 4 18 2 l 0 25% to total 16.00 72.00 8.00 4.00 0.00 100.00NPB l 14 8 2 0 25% to total 4.00 56.00 32.00 8.00 0.00 100.00Total 65 243 65 17 0 390% to total 16.67 62.31 16.6.7 4.36 0.00 100.00
Figure 4.16
Aspect "will-choose-only-a-Privatesector-Bank‘ as ReasonPercentage of Respondents in each Bank Group Rating thefor Choice 1u mE I lapse :«° 60 lg E. “ IOPBm ' H...g 20 i _ |DFB.. 3 — “-. -— IIDNPB .io - ' 4 -;£ 0 _ ~ fifi‘ 2 czfirtl ,
Strongly Disagree So-So Agea Strongly i' Disagree was iLevel of Agreement I Dbagreement !

Table 4.68Contingency Table for Chi- Tests based on Table 4.67
Ratings Total'PSB 49 I39 52 240OPB ll 72 17 100l"B+NPB 5 32 I3 50Total 65 243 82 390
Table 4.69Results of Chi- Tests based on Table 4.68
Ratios Value Degree of Freedom SignificancePearson Chi-Square 8.964 4 0.062Likelihood Ratio 9.276 4 0.055
a 0 cell has expected count less than 5. The minimum expected countis 8.33.
Ironically, it was the NPB or OPB group that strongly opposedthe aspect. It only proves that they are more critical in evaluatingtheir choices than others and would not let them influenced by
general trends. It cannot. however, be inferred that they are notsatisfied with the services of their current banks, as no evidence
to substantiate this was obtained in the earlier analysis done oncustomer satisfaction. A possible reason for choosing NPBs could
be the modern facilities offered by the banks. The degree ofrequirement for such facilities was higher among the NPB and FB
respondents, in that order. OPB respondents were not muchattracted to modern banking facilities whereas PSB customergroup has mixed responses towards this (see Table 4.70 andFigure 4.17). It is certain that there are specific segments whichare attracted by these facilities, though, the earlier findingssuggest that, generally, the respondents are favourably disposed
IJ Z[J

to computerisation and automation in banks. They will be happy
if their present banks would offer such facilities to them. Atpresent the presence of electronic banking facilities need not be aleading attribute of choice of bank for the PSB customers while
NPB customers are very particular about it. This is evident fromthe ratings for this factor. which showed dependence with bankgroups (see Tables 4.70 and 4.72).
Table 4.70Ratings for Influence of ‘Presence of Electronic facilities‘ in the
Choice of Bank- Distribution Based on Respondents‘ MFBsBank Ratings TotalGroups Strongly Disagree So-So Agree StronglyDisagree AgreePSB 18 40 82 74 26 240% to total 7.5 16.67 34.17 30.83 10.83 10.00OPB 6 18 32 37 7 100% to total 6.00 72.00 32.00 37.00 7.00 100.00FB 1 7 2 5 10 25% to total 4.00 28.00 8.00 20.00 40.00 100.00NPB 0 3 8 4 10 25% to total 0.00 12.00 32.00 16.00 40.00 100.00Total 25 68 I24 I20 53 390% to total 6.41 17 44 31.79 30.77 13.59 100.00
Figure 4.17l
Percentage of Respondents" in Each Bank Group Ratlng‘Presence of Electronic Facilities‘ as a Reason for Choice of ]Bank3° E953‘ '
3 70E 50 . IOPBE 50 lni=3 ;403 30 p __ cinpgll3 20 I ~ lat 10- —Strongly Disagree So-So Agree StronglyDisagree Agree
Level of Agreement Disagreement
283

Table 4.71Contingency Table for Chi- Test based on Table 4.70
Bank Groups Ratings Total2 00 3 ()0 -l» ()0 5 ()0PSB 58 82 74 26 240OPB 24 32 37 7 I00
FFl+Nl’B ll 10 9 20 50Total 93 I24 120 53 390
Table 4.72Results of Chi- Tests based on Table 4.71
Ratios Value Degrees of Asymp. Sig.Freedom (2-sided)
Pearson Chi-Square 36.808 6 .000Likelihood Ratio 29.434 6 .000a 0 cells ( 0%) have expected count less than S The minimum expectedcount is 6.79.
Multiple bank preference was very strong among OPB customergroups (see Figure 4.18). This attitude can be related to theirdisagreement to choose-only-private-sector-bank. An inferencethat can be drawn from these findings is that there are specificreasons such as higher deposit rates, personal relationships or thecommunity aspect for the choice of OPBS, in the context ofKerala. The geographical dominance of certain banks like FederalBank, Catholic Syrian Bank or South Indian Bank can also beexplained on the basis of the aforementioned aspects. The PSBcustomers also preferred dependence on multiple banks for theirbanking needs. FB and NPB respondents were less particularabout dealing with many banks at the same time possibly due to alarger range of services and personalised attention offered bythese banks to a smaller clientele (see Table 4.73). Statisticalanalysis of this aspect showed dependence between ratings forthe factor and the bank groups (Table 4.75).
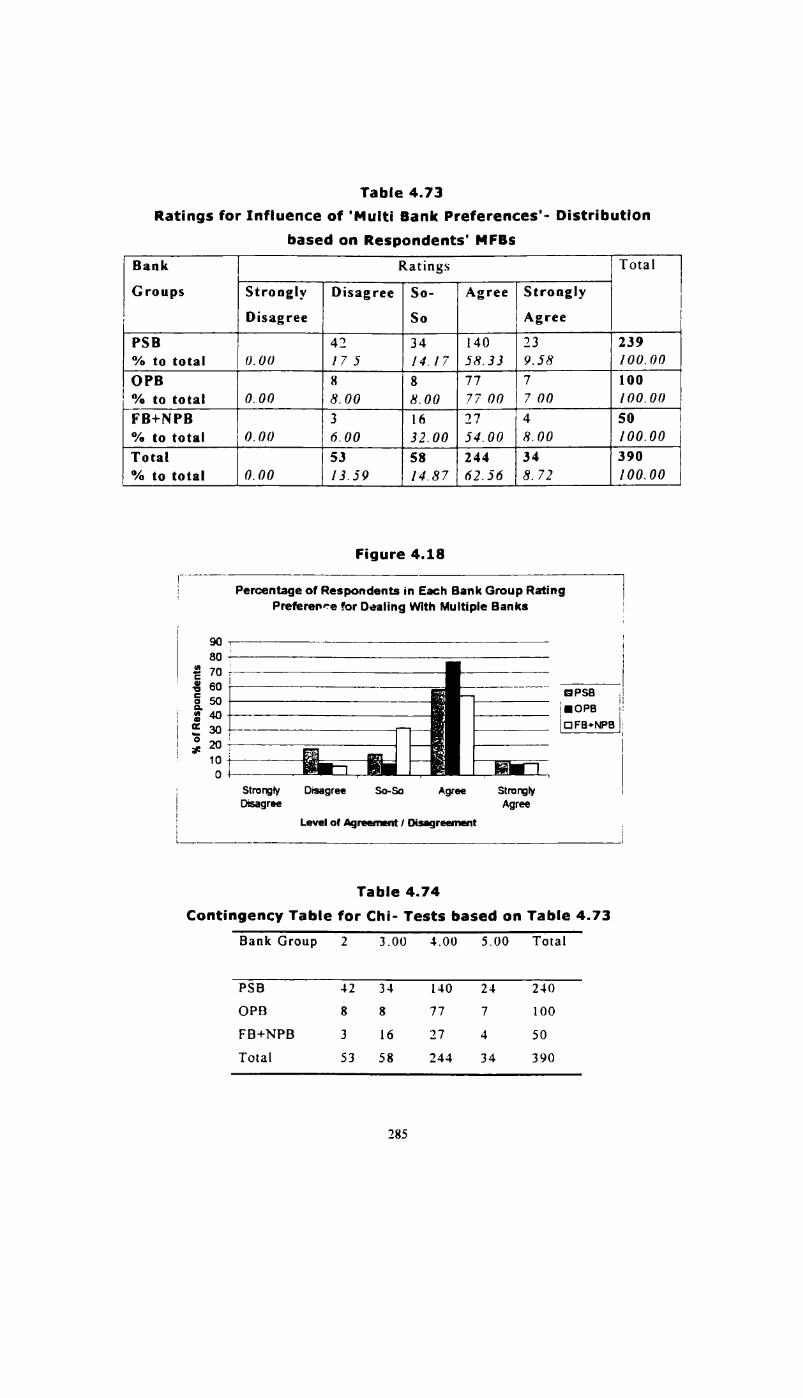
Table 4.73Ratings for Influence of 'MuIti Bank Preferences'- Distribution
based on Respondents‘ MFBsBank Ratings TotalGroups Strongly Disagree So- Agree Strongly
Disagree So AgreePS3 42 34 140 23 239"/o to total ().0() I7 5 14.17 58.33 9.58 100. 00OPB 8 8 77 7 100% to total 0.00 8.00 8.00 77 00 7 00 100.00FB+NPB 3 16 27 4 50% to total 0.00 6.00 32.00 54.00 8.00 100.00Total 53 58 244 34 390% to total 0.00 13.59 14.87 62.56 8. 72 100.00
Figure 4.18
‘K ol Respondents
Percentage of Respondents in Each Bank Group RatingPrefererme for Dealing With Multiple Banks
StrorglyDisagree
Disagree So-So Agree
Level ol Agree:-rant I Disagreement
SlrorglyAgree
Table 4.74Contingency Table for Cl1i- Tests based on Table 4.73
Bank Group 2 3.00 4.00 5.00 Total
PSB 42 34 140 24 240OPB 8 8 77 7 100FB+NPB 3 16 27 4 50Total 53 S8 244 34 390
EIOPB iiEll-‘B+NPB ie

Table 4.75Results of Chi- Tests based on Table 4.74
Ratios Value SignificancePearson Chi-Square 25.364 6 .000Likelihood Ratio 24.166 6 .000a 1 cell (8.3%) has expected count less than 5.
The minimum expected count is 4.37.
The last factor that was considered for the study was the ‘need for
good customer services’ Very evidently all respondents were in
total agreement to choosing a bank with better services. Therewere no responses in the scale points 1 and 2 that represented the
answers ‘disagree’ and strongly disagree’ indicating that all arelikely to be influenced by the service quality levels in banks(Table 4.76 and Figure 4.19).
Table 4.76Perceptions about Influence of ‘Service’ on Choice of Bank
- Distribution based on Ml-'Bs of RespondentsBank Ratings TotalGroups
Strongly Disagree So-So Agree StronglyDisagree AgreePSB 0 ll 29 143 57 240% to total 0.00 4.58 12.08 59.58 23.75 100.00OPB 0 0 10 54 36 100% to total 0.00 0.00 10.00 54.00 36.00 100.00FB 0 0 2 17 6 25% to total 0.00 0.00 8.00 68.00 24.00 100.00NPB 0 0 2 15 8 25% to total 0.00 0.00 8.00 60.00 32.00 100.00Total 0 II 43 229 107 390% to total 0.00 2.82 11.03 58.72 27.44 100.00‘Columns with O values ( 1 and 2) were combined with 3 to form the contingency
286

Table 4.77Contingency Table for Chi- Tests based on Table 4.76
Ratios Value Degree of Freedom SignificancePearson Chi-Square 906-_,“ 6 0.170Likelihood Ratio 11.502 6 0.074a 2 cells (16.7%) have expected count less than 5 The minimum expectedcount is 2.56.
Figure 4.19__ g__ .__7,_.._. ____#___ ____-, T__._-_e_._...———j,
5 Percenatge of Respondents in Each Bank Group RatingServices as a Reason for Choice of a Bank
1
1I___j————— i
I
Strorgly Disagree So-So Agree Strorgly AgreeDisagree
'/oolrespobdenls
o 8 B8 6 8 8 B‘ 8
Level of Agreennntldsagroelrlent l
A significant observation about PSB group is that their customers
had comparatively less dominant attitude towards all factors, apossible indication that the choice of other bank groups are made
by those with stronger attitude to any of these factors (see Table4.78). In fact, banks other than PSBs try to lure PSB customers
into their banks by promising to meet their specific needs.However, the findings suggest that PSBs continue to enjoyloyalty of their customers. Benchmarks for comparison orevaluation of the benefits in switching to other banks are likelyto be what PSBs can offer them. It would also mean that the
attractiveness of the service quality and products of other banks

should far exceed what PSBs can provide to effect the switchingof customers from PSBS.
The values of standard deviation for PSBs were comparatively
high for other groups implying the heterogeneous nature of theircustomers. The factor, which had the least influence on bankchoice. was 'will-choose-only-a-private bank’ (Mean value is2.0872) and the most influential was the 'service' aspect (meanvalue is 4.1077).
238

2:
3.33 xcmn __m mcoEm S32 53 ._o.. 3:32 :mmE u.u.m.:....E 2: E323: 2.8 umumfi 2: E mw:_m> 9.» _3oz
:o_.::>oD
3%. 8;. 32.. SE. o\.~o._ 23.. S2,. :3. 65
to: m8: 333 «Sod Emma fin: M2: 38a 532 .33
:o_::>oQ
N30 3;. $8.. 2:. 33. $3.. $2! 32; .3m
cow: coo: _..a.m ooixm ..o.o8.n cox: cocoa coal :32 FE
:o_.:2.>uD
32. .23. $2.. 2%. 28; fan. 88.. E5. .3m
coo: case cocoa cocoa coo: comma coo: 023.. 532 mm
:o:E>uQ
88 23. S:o._ ES. 23. E2. 322 3%. .3m
coon... _.oo$.m ooze o2:.N oS.~.m comma ooze cofia E32 MEG
co_::>uQ
:3. S3. 28; 3.3.. $3. o_N_._ $2; 3:: .Ew
ommoe 285 Some 9...: comma ems: mi: 83a E3_>_ mm;
uo:o._o._o.L mu_.___uu.._ ._o.oow .339
uu_>..ow xzum o_=e.:uo_..._ ...u.a>_.. ....u__._=
._uE3m=U o_.__._=—./L; ._o 3:93.. .2: mmo:.:.oZ .2: m:..=.uE 8:._..z :..:>__
in: hucouconmum
co wanna. uses: no uu_o._u uc_u:u:=:n Eouuam u:o..ot_n ._o_. mu:_ua¢ uo mu_um_u3m o>_u.:.umoo
05¢ 030.»

4.3.6 Influence of Personal Characteristics on Bank-ChoicePerceptions
The analysis of data on customer perceptions about bank choices
was also related to personal profile of the respondents to examinethe variations. One-way ANOVA tests were performed to studythis. The following sections elaborate on the findings of theANOVA tests.
Table 4.79Age and Factors Influencing Choice of Banks
Factors Groups Sum of Degrees Mean F SignificanceSquares of Square
Freedom
REPUTE Between 22.658 8 2.832 2.168 0.029Groups
Within 497.816 381 1.307Groups
Total 520.474 389RETURNS Between 40.435 8 5.054 2.759 0.006
GroupsWithin 698.040 381 1.832Groups
Total 738.474 389
NEARNESS Between 14.369 8 1.796 1.217 0.288Groups
Within 562.454 381 1.476GroupsTotal 576.823 389
Contd.

C ontn.
FaCl0I'S Groups Sum of Degrees Mean F SignificanceSquares of Square
Freedom
ONLY Be-[ween 9.101 8 1 138 1.560 0.135PRIVATE GroupsSECTOR... Within 277.896 381 0.729
GroupsTotal 286.997 389
PRESENCE Between 20.903 8 2.613 1.709 0.095()F GroupsELECTRONIC Within 582.341 381 1.528
FACILITIES '(T3cli(t)zi11Ps 603.244 389
MU!-T|Pl-E Between 17.826 3 2228 1.676 0.102BANK GroupsPREFERENCE Within 506.433 381 1.329
GroupsTotal 524.259 389
SERVICE Between 14725 8 1.841 1_.882 0.061GroupsWithin 372.618 381 0.978GroupsTotal 387.344 389
Note: Values in shaded cells indicate that the variance among the groupsbased on the corresponding aspect is significant
Data on actual age was classified into different groups as givenin the Table 4.79 for a meaningful analysis. Age of therespondents had only less significance in relation to variationwith respect to different factors of choice of banks except‘returns’ and ‘repute’ of the bank. The mean values indicate that
among 40-45 and 50-60 age groups, attitude to repute was strong
compared to other groups. Similarly the 35-45 age group hadstrong attitude towards getting high returns (See Table 4.80 andFigure 4.20). These two factors, ‘repute’, and ‘returns’ varied

significantly with age groups as seen from the significance values(Table 4.79).
Table 4.80Descriptive Statistics for Various Factors Influencing Choice of
Banks Among Different Age Groups' Factors Age group Number of Mean Standard
respondents DeviationREPUTF. 20-25 19 3.5789 1.2164
25-30 35 3.4571 0.700530-35 67 3.3433 1.273935-40 89 3.3820 1.081940-45 52 3.7115 0.848045-50 63 3.2222 [.325250-60 43 3.9070 1.019260-70 19 3 1579 [.5371
Above 70 3 2.3333 2.5166Total 390 3.4487 1.1567
RETURNS .7 19 3.0526 1.508325-30 35 3.2000 1.367730-35 67 3.3881 1.370235-40 89 3.7303 1.294840-45 52 4.0000 1.047945-50 63 3.2063 1.471950-60 43 3.3023 1.354660-70 19 3.0000 1.6667
Above 70 3 2.3333 1.5275Total 390 3.4487 1.3778
ONLY 20-25 19 2.6842 1.1082PUBLIC 25-30 35 2.3000 0.9641
30-35 67 2 5970 1.206835-40 89 2.5955 1.145340-45 52 2.2692 1.031245-50 63 2 5079 1.306050-60 43 2 8140 1.139360-70 19 2 6316 1.4610
Contd.
292

C ontn.
Factors Age group Number of Mean Standardrespondents Deviation
Above 70 3 2.6667 2.30941'o[a1 390 2.5872 1 1766
NEARNESS 20-25 19 3.1579 1.344325-30 35 3.6000 0.976230-35 67 3.2687 1.225835-40 89 3.1573 1.137240-45 52 2.9038 0.913145-50 63 3.0317 1.436550-60 43 3.1395 1.372960-70 19 3.0526 1.3934
Above 70 3 4.0000 0.0000Total 390 3.1615 1.2177
ONLY 20-25 19 2.5263 0.9643PR1VATE.. 25-30 35 1.9714 0.7065
30-35 67 1.9552 0.860535-40 89 1.9551 0.767440-45 52 1.9038 0.664545-50 63 1.9524 1.006950-60 43 2.1860 0.794560-70 19 1.9474 1.2681
Above 70 3 1.3333 1.1547Total 390 1.9974 0.8589
PRESENCE 20-25 19 3.8421 1.34430|? 25-30 35 3.3714 1.1137ELECTRONIC 30-35 67 3.0299 1.2057FACILITIES 35-40 89 3.0337 1.1226
40-45 52 3.3462 1.100545-50 63 2.9365 1.412850-60 43 3.2326 1.231360-70 19 2.9474 1.4710
Above 70 3 2.3333 2.5166Total 390 3.1410 1.2453
Contd.
293

Contn.
Figure 4.20
‘ Factors Age group Number of Mean Standardrespondents Deviation
MULTIPLE 20-25 19 3.5789 0.69254 BANK 25-30 35 3.4286 1.0034PREFERENCES 30-35 57 3.3881 1.2905
35-40 89 3.5506 [.087240-45 52 3.5385 0.895845-50 63 3.1111 [.369150-60 43 3.6279 1.047160-70 19 3.6842 1.4550
Above 70 3 2.0000 2.0000Total 390 3.4436 1.1609
BETTER 20-25 19 4.3684 0.5973SERVICES 25-30 35 4.1714 0.5681
30-35 67 3.9254 1.158835-40 89 4.0449 0.877940-45 52 4.1923 0.817445-50 63 3.8095 1.242550-60 43 4.1395 0.888660-70 19 4.2105 1.1822
Above 70 3 2.6667 2.3094Total 390 4.0410 0.9979
Mean Ratings for Various Factors of Bank choice amongDifferent Age Groups
Mean Ratings
I
I1 RETURNS1 ONLY PUBLIC
.— — — NEARNESS
1? ONLY PRIVAIE
§- I ELECTRONICFAC1Ll'|1ES..:..:L11PLEBANKS
-‘r-I-In.I.n19nUur.lsERV.cE
25-3030-3535-4040-45 45-50 50-60 60-70 Above
Age Groups
294
70
w ‘.2. .__..

There was significant variation in attitude to ‘returns’, ‘modern
banking facilities’. and ‘multiple banking preferences’ betweenmen and women. Women had relatively less strong attitude to all
these factors (see Figure 4.21). Even though the variance wasstatistically significant. women were more concerned aboutrepute of the bank and had stronger preference for PSBs than men(Table 4.81 and 4.82).
Table 4.81ANOVA- Factors Influencing Choice of Bank among Men and women
Factors Groups Sum of Degrees Mean F Significanceof Square
Squares FreedomREPUTE Between .325 1 0.325 0.228 0.633
Groups
Within 565.985 398 1.422GroupsTotal 566.310 399
RETURNS Between 9.743 1 9.743 5.004 0.026Groups
Within 774.835 398 1.947GroupsTotal 784.577 399
ONLY Between 1.033 1 1.033 0.727 0.394PUBLIC... Groups
Within 565.165 398 1.420Groups
Total 566.198 399
Contd.
295

Contn.
I1-‘actors Groups Sum of Degrees Mean F SignifiSquares of Square cance
Freedom
NEARNESS Between 5.828E-06 1 5.82815-06 0.000 0.998GroupsWithin 610.297 398 1.533Groups
Total 610.298 399ONLY Between .274 1 274 0.363 0.547PRIVATF... Groups
Within 300.703 398 .756Groups
Total 300.977 399PRESENCE OF Between 7.923 1 7.923 5.100 0.024ELECTRONIC GmupsE"C'E'“E5 Within 618.237 393 1.553
Groups
Total 626.160 399MULTIPLE Between 7.520 1 7.520 5.615 0.018BANK GroupsEEEEEEENCE Within 533.040 393 1.339
GroupsTotal 540.560 399
SERVICE Between 2.938E-02 1 2.938E-02 0.029 0.866Groups
Within 408.668 398 1.027Groups
Total 408.698 399
296

Table 4.82Descriptive Statistics for Various Factors Influencing Choice
of Banks among Men and WomenFactors Group Number Mean Std.
Deviation
REPUTE Fcmalc 33 3.4886 1.3390Malt: 312 3.4199 1.143216:31 400 3.4350 1.1914
neruuns Fcmalc 33 3.1136 1.5494M2116 312 3.4904 1.3490Total 400 3.4075 1.4023
ONLY PUBLIC.. Female 33 2.6932 1.3162Male 312 2.5705 1.1544Total 400 2.5975 1.1912
NEARNESS Female 33 3.1477 1.3691_Male 312 3.1474 1.1992Total 400 3.1475 1.2363
ONLY PRIVATE. Female 33 1.9432 0.9632Male 312 2.0064 .3410Total 400 1.9925 .3635
PRESENCE or Female 33 2.3750 1.3026ELECTRONIC Male 312 3.2147 1.2301“C"‘”‘ES Total 400 3.1400 1.2527MULTIPLE Female 88 3.1818 1.1991BANK Male 312 3.5123 1.1453“EFERENCES Total 400 3.4400 1.1640SERVICE Female 33 4.0114 1.0330
Male 312 4.0321 0.9914Total 400 4.0275 1.0121
297
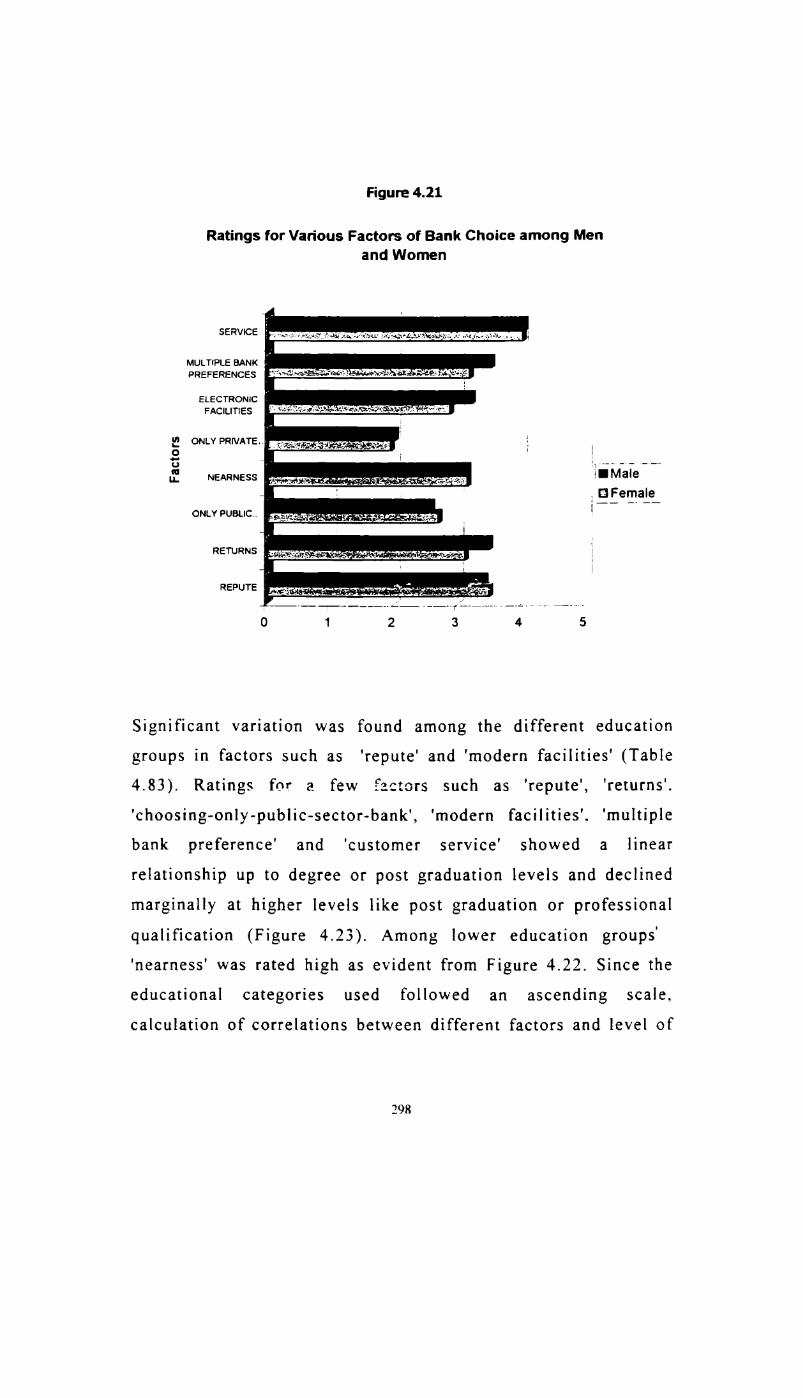
Figure 4.21
Ratings for Various Factors of Bank Choice among Menand Women
SERWCE I -*."»T-:1:FH;:A:§"__:?-lS§',A:..‘-r';K‘<L' ‘I.-r,r,'_;.¢u-1-,~.'»’-:.\z=\.*=>.-.-. ,-.- 11'-4_lI.\.r<.',1Jfd'_I-v_. ,
MULTIPLE BANK .'PREFERENCES
ELECTRONIC 3'FACILITIES
ONLY PRNATE.. _ .__In&O :~ — _ I E3 ' '7“. " _“u_ NEARNESS _ l'M3'eI B Female
ONLY PUBLIC. ‘
REPUTE 3 .
Significant variation was found among the different educationgroups in factors such as ‘repute’ and ‘modern facilities’ (Table4.83). Ratings for a few -.2.ctors such as ‘repute’, 'returns'.'choosing-only-public-sector-bank’, ‘modern facilities’, 'multiple
bank preference’ and ‘customer service’ showed a linearrelationship up to degree or post graduation levels and declined
marginally at higher levels like post graduation or professionalqualification (Figure 4.23). Among lower education groups''nearness' was rated high as evident from Figure 4.22. Since theeducational categories used followed an ascending scale,calculation of correlations between different factors and level of
298

education was possible. Such an exercise revealed that except for
the two factors ‘returns’ and ‘choose-only-private’ all thecorrelations were positive while significant correlation was found
only with 'repute' A possible inference is that higher theeducational levels stronger will be the need for each of thefactors considered. The factors 'returns' and 'choosing-onlyprivate-bank’ attitude were found to be unaffected by theeducational levels.
Table 4.83ANOVA- Factors Influencing Choice of Banks and Education of
RespondentsFactors Group Sum of Degrees Mean F Significance
Squares of SquareFreedom
REPUTE Between 28.986 5 5.797 4.251 0.001Groups
Within 537.324 394 1.364Groups
Total 566.310 399RETURNS Between 14.719 5 2.944 1.507 0.187
Groups
Within 769.859 394 1.954Groups
Total 784.577 399ONLY PUBLIC-- Between 3.961 5 0.792 0.555 0.734
Groups
Within 562.236 394 1.427Groups
Total 566.198 399
C ontd.
299

C ontn.
300
Factors Group Sum of l Degrees Mean F SignificanceSquares of Square
Freedom
NEARNESS Bctwusn 13.253 5 2.651 1.749 0.122Groups
Within 597.044 394 1.515Groups
Total 610.297 399ONLY Betwccn 4.087 5 0.817 1.085 0.368PRIVATE‘... Groups
Within 296.891 394 0.754Groups
Total 300.978 399‘MODERN Between 13.705 5 3.741 2.426 0.035FACILITIES Groups
Within 607.455 394 1.542Groups
Total 626.160 399MULTIPLE Between 9.930 5 1.986 1.475 0.197BANK GroupsPREFERENCE Within 530.630 394 1.347
Groups
Total 540.560 399BETTER Between 8.143 5 1.629 1.602 0.158SERVICE Gmups
Within 400.554 394 1.017Groups
Total 408.698 399
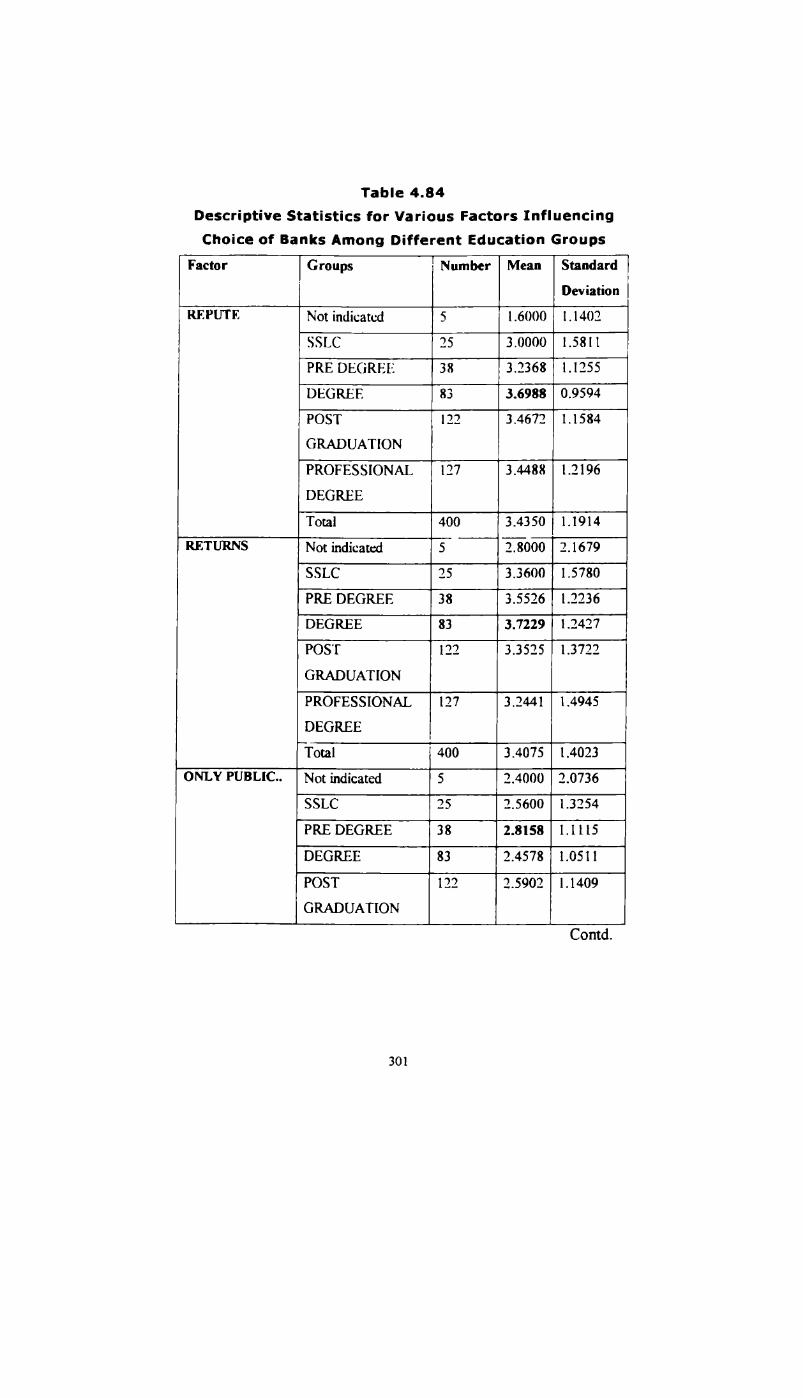
Table 4.84Descriptive Statistics for Various Factors InfluencingChoice of Banks Among Different Education Groups
Factor Groups Number Mean StandardDeviation
REPUTI7 Not indicated 5 1.6000 1 .1402SSLC 25 3.0000 1.5811PRE DEGREE-I 38 3.2368 1.1255DEGREE 83 3.6988 0.9594POST 122 3 .4672 1.1584GRADUATION
PROFESSIONAL 127 3.4438 1.2196DEGREE
Total 400 3.4350 1.1914RETURNS Not indicated 5 2.8000 2.1679
SSLC 25 3.3600 1.5780PRE DEGREE 38 3.5526 1.2236DEGREE 83 3.7229 1.2427POST 122 3.3525 1.3722GRADUATION
PROFESSIONAL 127 3.2441 1.4945DEGREE
_Total 400 3.4075 1.4023ONLY PUBLIC» Not indicated 5 2.4000 2.0736
SSLC 25 2.5600 1.3254PRE DEGREE 33 2.8158 1.1115DEGREE 83 2.4578 1.0511POST 122 2.5902 1.1409GRADUATION
Contd.
301

C ontn.
Factor Groups Number Mean StandardDeviation
PROFr.SSIONAL 127 2.6457 1.2331DI-LGREI-2
Total 400 25975 L1912NEARNESS Not indicated 5 1.8000 1.3038
SSLC 25 3.5200 1.5033PRE DEGREE 33 3.1316 1.2930DEGREE 33 3.0723 1.1019POST 122 3.1393 1.1231GRADUATION
PROFESSIONAL 127 3.1390 1.3253DEGREE
Total 400 3.1475 1.2363ONLY Not indicated 5 2.4000 1.6733PR'VATE-- SSLC 25 1.3300 1.0536
PRE DEGREE 33 1.9737 0.7529DEGREE 33 2.1446 0.7347POST 122 1.9016 0.3471GRADUATION
PROFESSIONAL 127 1.9921 0.9215DEGREE
Total 400 1.9925 0.8685PRESENCE OF Not indicated 5 2.0000 1.5811ELECTRONIC SSLC 25 2.6300 1.5199F"C"""E5 PRE DEGREE 33 3.2632 1.1551
DEGREE 33 3.3355 1.1025POST 122 3.0410 1.2156GRADUATION
PROFESSIONAL 127 3.1732 1.3033DEGREE
Contd.
302
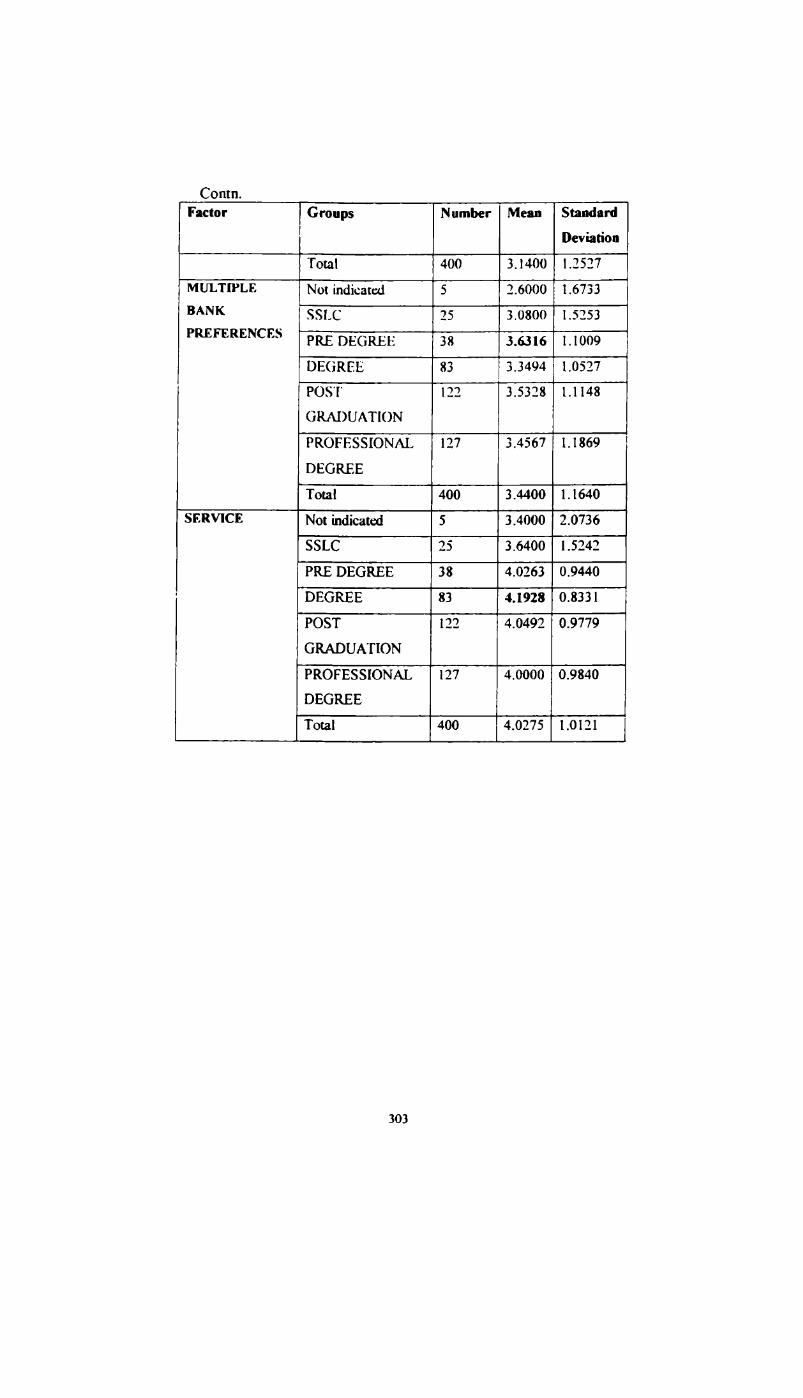
Contn.
Factor Groups Number Mean StandardDeviation
Total 400 3.1400 1.2527MULTIPLE Not indicated 5 2.6000 1.6733BANK ss1.c 25 3.0300 1.5253"REFERENCES PRE DEGREE 33 3.6316 1.1009
DEGREE 33 3.3494 1.0527POST 122 3.5323 1.1143GRADUATION
PROFESSIONAL 127 3.4567 1.1369DEGREE
T6131 400 3.4400 1.1640SERVICE Not indicated 5 3.4000 2.0736
SSLC 25 3.6400 1.5242PRE DEGREE 33 4.0263 0.9440DEGREE 33 4.1923 0.3331POST 122 4.0492 0.9779GRADUATION
PROFESSIONAL 127 4.0000 0.9340DEGREE
Total 400 4.0275 1.0121
303
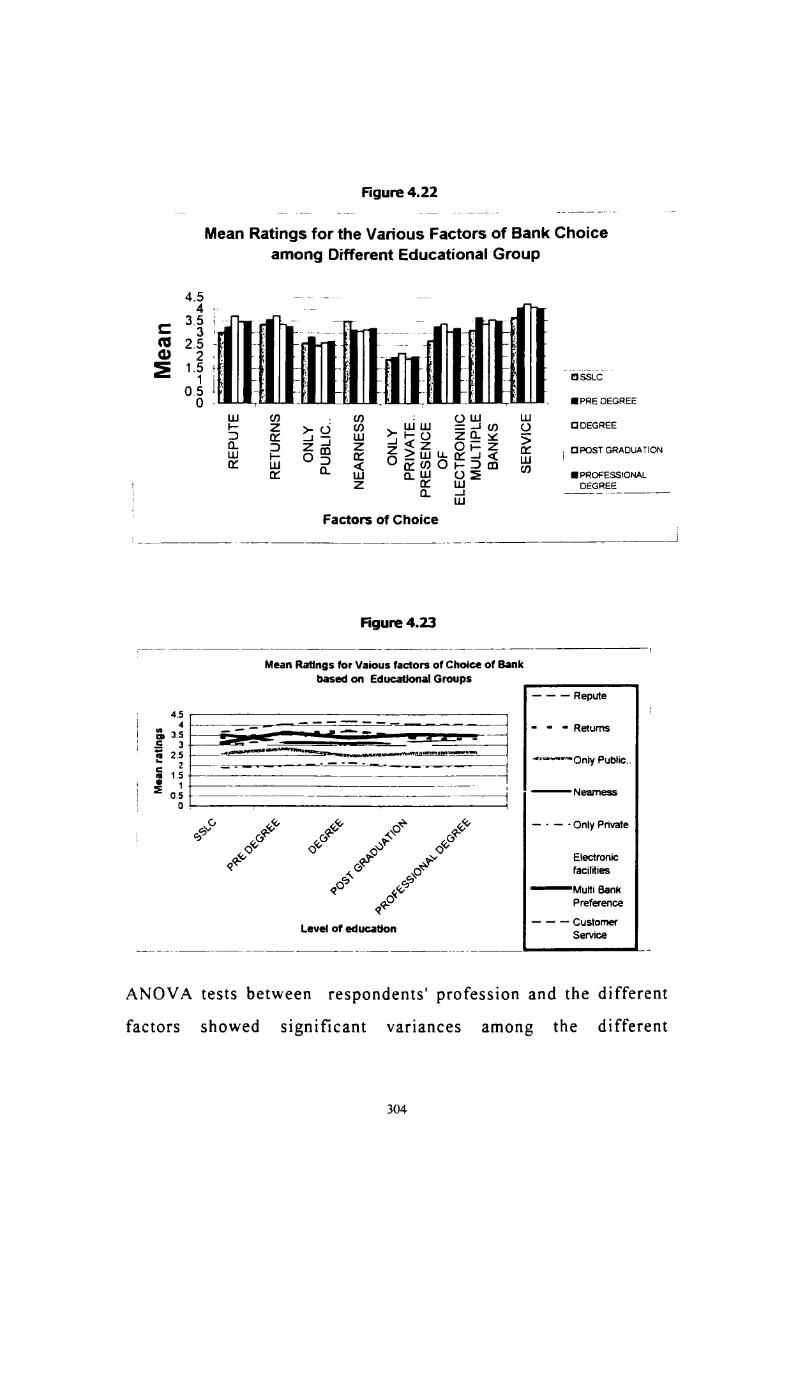
figure 4.22
Mean Ratings for the Various Factors of Bank Choiceamong Different Educational Group
4.5 — — — —32 3'C ’3
(U 2.50 2 v —1 I _ nssLc0.5 » _0 . .- IPRE DEGRE:g $ uJ 2 5 DDEGREEn: E % UJ j I- o z 3.3 Z in Z 2 § 2 O F‘ EIPOST GRADUATIONin O 3 % 0 E % *5 E5 5‘ ‘1:: ‘L u_1 g_ m 0 2 IPROFESSIONAL: 2 E L“, _0E_G3Es_: uJ‘ Factors of Choice
Figure 4.23 *1‘ 1Mean Ratings for Vaious factors of Choice of Bank
based on Educational Groups- - — Repute; 3 - - - Returns
3 .‘—E3 -‘'“'*'''''''Only Public..CC, 0‘[ 5 Neamess
- - - -Only Private1
Electronicfacilities
Multi BankPreference
- — - CustomerLevel of education Service
ANOVA tests between respondents’ profession and the different
factors showed significant variances among the different
304

occupational groups with respect to ‘choose-only-public-sector
bank attitude, ‘customer service’. and 'returns' (see Table 4.85).
Government employees had obvious preferences for public sector
banks and are likely to choose a bank. which is nearer to theirhome. Factors other than 'nearness' were found to have more
influence on private sector employees (Table 4.86 and Figure
4.24). Though government employees showed more preference
for PSBs. the ratings were found to be relatively low for the
factor. However, the variance among the different occupational
groups with regard to ‘choose only public sector bank’ attitude
was significant. Private sector employees had strongerpreference for 'repute', ‘electronic facilities,’ and ‘customer
service’ The business community's inclination to multiple bank
selection was more pronounced than others'
Table 4.85ANOVA-Factors Influencing Choice of Banks and Profession of
RespondentsFactors Groups Sum of Degrees Mean F Significance
Squares of SquareFreedom
REPUTE Between 11.641 4 2.910 2.072 0.084GroupsWithin 554.669 395 1.404GroupsTotal 566.310 399
RETURNS Between 27.285 4 6.821 3.558 0.007GroupsWithin 757.293 395 1.917GroupsTotal 784.578 399
Contd.
305

Comn.
Factors Groups Sum of Degrees Mean F SignificanceSquares of Square
FreedomONLY Between 7.375 4 I .844 1.303 .049PUBLlC.. Groups
Within 558.822 395 1.415Groupslotal 566.197 399
NEARNESS Between 10.711 4 2.678 1.764 0.135GroupsWithin 599.587 395 1.518GrougsTotal 610.298 399
ONLY Between 2.905 4 0.726 0.963 0.428PRIVATE. Groups
Within 298.072 395 0.755GroupsTotal 300.978 399
PRESENCE Between 11.819 4 2.955 1.900 0.110OF GroupsELECTRONIC Within 614.341 395 1.555FACILITIES §>r_oL-ps
Total 626. 160 399MULTIPLE Between 3.091 4 0.773 0.568 0.686BANK GroupsPREFERENCE Within 537.469 395 1.361
GroupsTotal 540.560 399
SERVICE Between 12.303 4 3.076 3.065 0.017GroupsWithin 396.394 395 1.004GroupsTotal 408.698 399
306

Table 4.36Descriptive Statistics for Various Factors Influencing Choice
of Banks among Different Occupational GroupsFactors Groups Number Mean Standard
Deviation
REPUTE Not Indicated 1()BUSINESS 64 3.3906 1.2550GOVERNMENT 1 19 3.3697 1.2134JOB
PRIVATE 130 3.6077 1.0380SECTOR JOB
OTHERS 77 3.3896 1.2371Total 400 3.4350 1.1914
RETURNS Not Indicated [0BUSINESS 64 3.5000 1.3569GOVERNNIENT 1 19 3.3193 1.4840JOB
PRIVATE 130 3.5615 1.2693SECTOR JOB
OTHERS 77 3.4026 1.4073Total 400 3 .4075 1.4023
ONLY Not Indicated 10"UB”C-- BUSINESS 64 2.5625 1.2323
GOVERNIVIENT 1 19 2.7899 1.2681
JOB
PRIVATE 130 2.5462 1.0276SECTOR JOB
OTHERS 77 2.4156 1.1737Total 400 2.5975 1.1912
Contd.
307

Contn.
Factors Groups Number Mean StandardDeviation
NEARNESS Not lndjcatcd 10 2.5000 1.9579BUSINESS 64 3.0313 1.2595GOVERNMENT 1 19 3.3361 1.2774JOB
PR1VA'1‘1-.' 130 3.1615 1.0983Sf-lC'1‘()R JOB
OTI-[ERS 77 3.0130 1.24()7Total 400 3.1475 1.2368
ON LY Not Indicated 10 1.8000 1.3166PRlVATE..
BUSINESS 64 2.0000 .7968GOVERNMENT 1 19 1.8908 .9724JOB
PRIVATE 130 2.0923 .7721SECTOR JOB
OTHERS 77 2.0000 .3429Total 400 1.9925 .8685
ELECTRONIC Not Indicated 10FACILITIES
BUSINESS 64 3.1406 1.3554GOVERNMENT 1 19 2.9496 1.2340JOB
PRIVATE 130 3.3231 1.1628SECTOR JOB
OTHERS 77 3.1948 1.2359Total 400 3.1400 1.2527
MULTIPLE Not Indicated 10 3.2000 1.7512BANK
PRFERENCES
BUSINESS 64 3.5313 1.1948Contd.
308

1
1
Factors
C ontn.
Factors Groups Number Mean ‘ StandardDeviation
GOVERNMENT‘ 119 3.3277 1.2562JOB
PRIVATE 130 3.4923 .9824SEC'I'()R JOB |OTIEERS 77 3.4805 1.1988Total 400 3 .4400 1.1640
CUSTOMER Not Indicated 10 3.3000 1.8886SERVICE BUSINESS 64 3.9531 .9160
GOVERNMENT 119 3.8824 1.1137JOB
PRIVATE 130 4.1692 .7986SECTOR JOB
OTHERS 77 4.1688 1.0438Total 400 4.0275 1.0121
figure 4.24
Mean Ratings for Factors of Choice among Different_ Occupational Groups
MULTIPLE BANKS L
!PRESENCE OF ELECTRONIIC FACILITIES
ONLY PRIVATE.
ONLY PUBLIC
SERVICE
NEARNESS
REPUTE
RETURNS
Q .. 05 1 15Mean Ratings in Each Group 1
35 4
I
I -;'i:To'1'HERs _ “"1E IDPRIVATE SECTOR Josi5 IIGOVERNMENT JOB I
[:1 BUSINESS ITOTOI
u
45
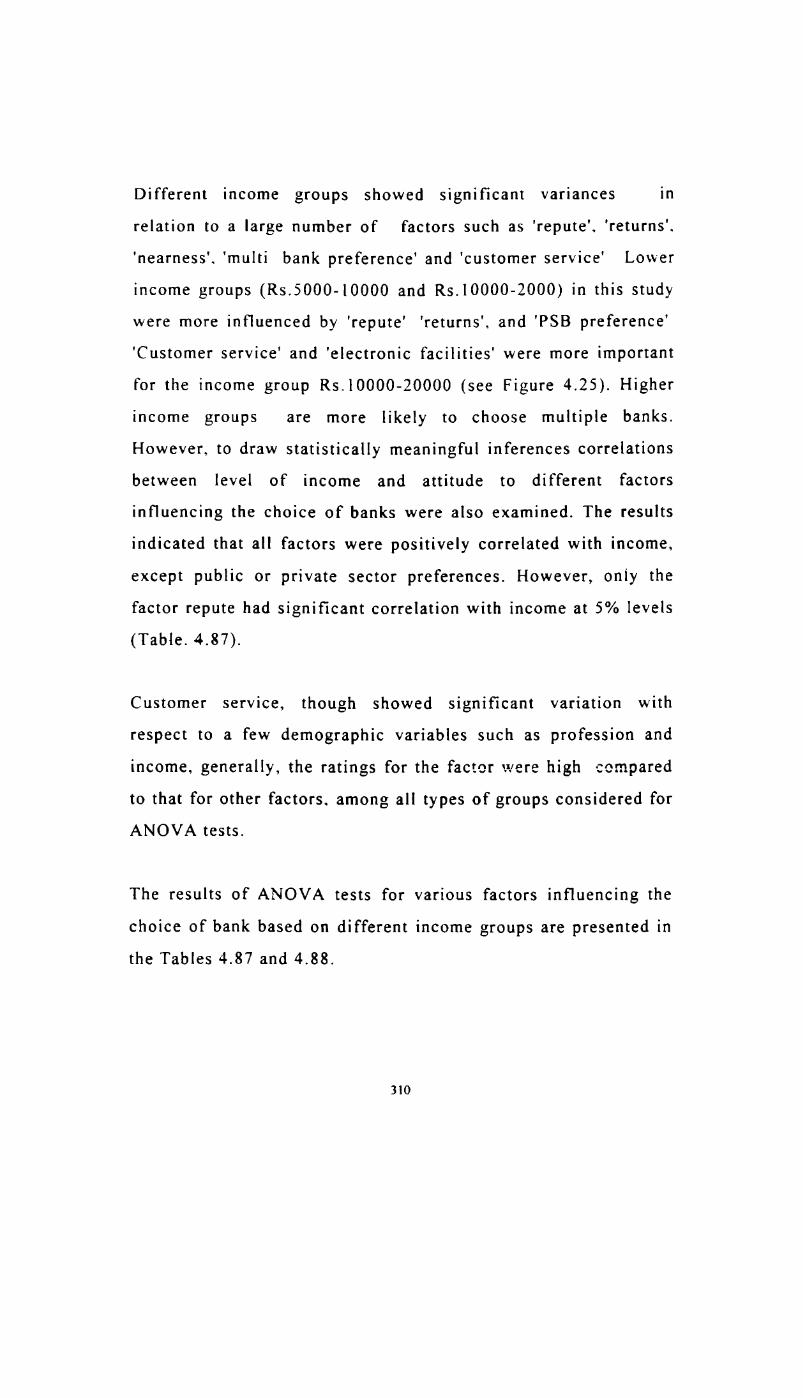
Different income groups showed significant variances inrelation to a large number of factors such as 'repute'. 'returns'.
'nearness'. 'multi bank preference‘ and ‘customer service’ Lower
income groups (Rs.5000-l0000 and Rs.l0000—2000) in this study
were more influenced by ‘repute’ ‘returns’, and 'PSB preference‘
‘Customer service’ and ‘electronic facilities’ were more important
for the income group Rs.lO00O-20000 (see Figure 4.25). Higher
income groups are more likely to choose multiple banks.However, to draw statistically meaningful inferences correlationsbetween level of income and attitude to different factors
influencing the choice of banks were also examined. The results
indicated that all factors were positively correlated with income,
except public or private sector preferences. However, only the
factor repute had significant correlation with income at 5% levels
(Table. 487).
Customer service, though showed significant variation with
respect to a few demographic variables such as profession and
income. generally, the ratings for the factor were high compared
to that for other factors. among all types of groups considered forANOVA tests.
The results of ANOVA tests for various factors influencing the
choice of bank based on different income groups are presented inthe Tables 4.87 and 4.88.
310

Table 4.87ANOVA- Factors Influencing Choice of Banks among
Different Income GroupsFactors Groups Sum of Degrees Mean F Significance
Squares of SquareFreedom
REPUTE Between 14.563 5 2.913 2.21 0.050GroupsWithin 518.013 393 1.318GroupsTotal 560.366 398
RETURNS Between 48.41 1 5 9.682 5.210 0.000GroupsWithin 730.356 393 1.858GroupsTotal 778.767 398
ONLY Between 14.323 5 2.865 2.047 0.071PUBLIC.. Groups
Within 549.902 393 1.399GroupsTotal 564.226 398
NEARNESS Between 20.348 5 4.070 2.727 0.019’GroupsWithin 586.509 393 1.492GroupsTotal 606.857 398
ONLY Between 6.536 5 1.307 1.750 0.122PRIVA'I'E.. Groups
Within 293.454 393 .747GroupsTotal 299.990 398
PRESENCE Between 7.363 5 1.473 .935 0.458OF GroupsELECTRONIC Within 618.777 393 1.574FACILITIES Groups
Total 626. 140 398
MULTIPLE Between 16.327 5 3.265 2.449 I 0.033’BANK GroupsPREFERENCE Within 523.919 393 1.333
GroupsTotal 540.246 398
SERVICE Between 11.248 5 2.250 2 224 0.049GroupsWithin 397.448 393 1.011GroupsTotal 408.697 398
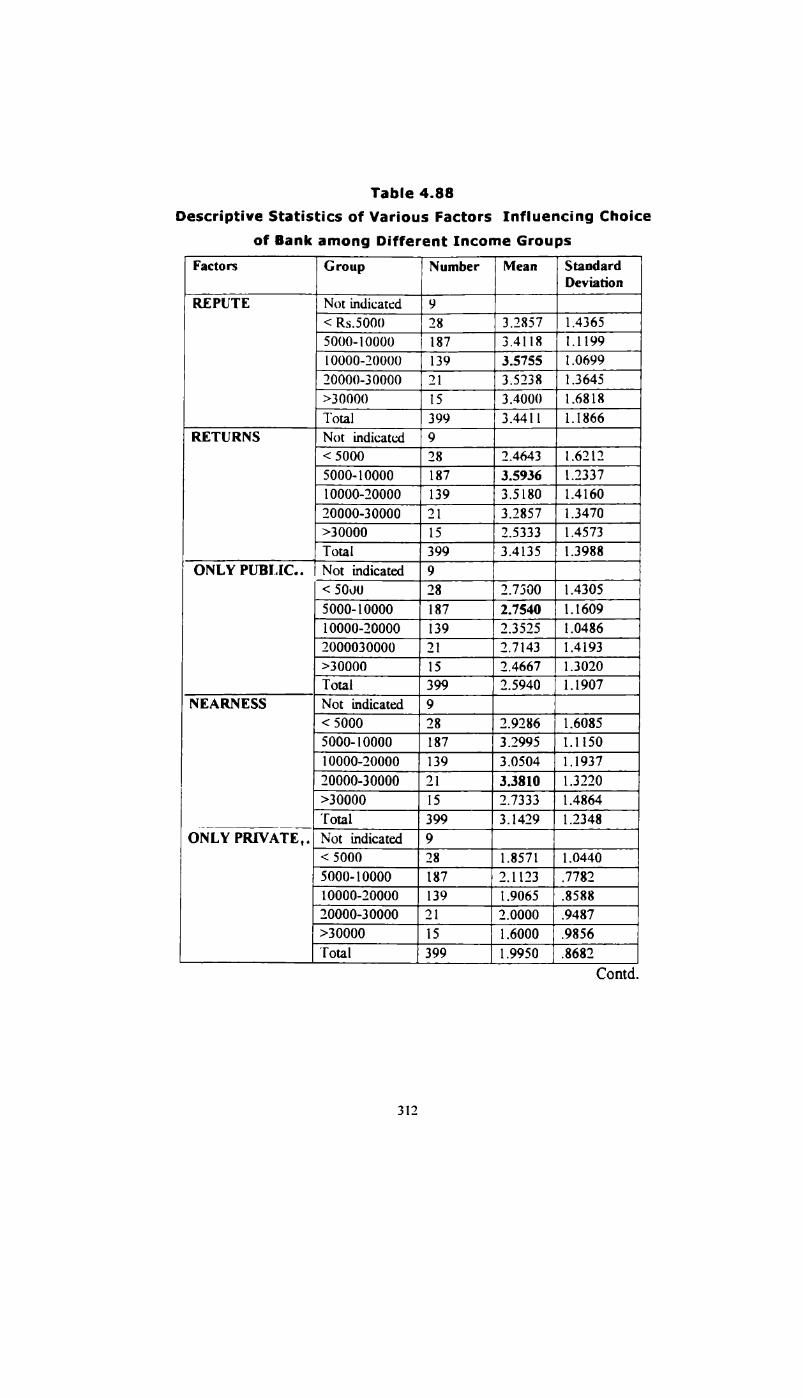
Table 4.88Descriptive Statistics of Various Factors Influencing Choice
of Bank among Different Income GroupsFactors Group Number Mean Standard
Deviation
REPUTE Not indicated 9< Rs.5000 28 3.2857 1.436550()0-10000 187 3.4118 1.119910000-2()000 139 3.5755 1.069920000-30000 21 3.5238 1.3645>3000() 15 3.4000 1.6818Total 399 3.441 1 1.1866
RETURNS Not indicated 9< 5000 28 2.4643 1.62125000-10000 187 3.5936 1.233710000-20000 139 3.5180 1.416020000-30000 21 3.2857 1.3470>30000 15 2.5333 1.4573Total 399 3.4135 1.3988
ONLY PUBl..[C.. Not indicated 9< 5000 28 2.7500 1.43055000-10000 187 2.7540 1.160910000-20000 139 2.3525 1.04862000030000 21 2.7143 1.4193>30000 15 2.4667 1.3020Total 399 2.5940 1.1907
N EARNESS Not indicated 9< 5000 28 2.9286 1.60855000-10000 187 3.2995 1.115010000-20000 139 3.0504 1.193720000-30000 21 3.3810 1.3220>30000 15 2.7333 1.4864
___ Total 399 3.1429 1.2348ONLY PRIVATE,. Not indicated 9
< 5000 28 1.8571 1.04405000-10000 187 2.1123 .778210000-20000 139 1.9065 .858820000-3 0000 21 2.0000 .9487>30000 15 1.6000 .9856Total 399 1.9950 .8682
Contd.
312
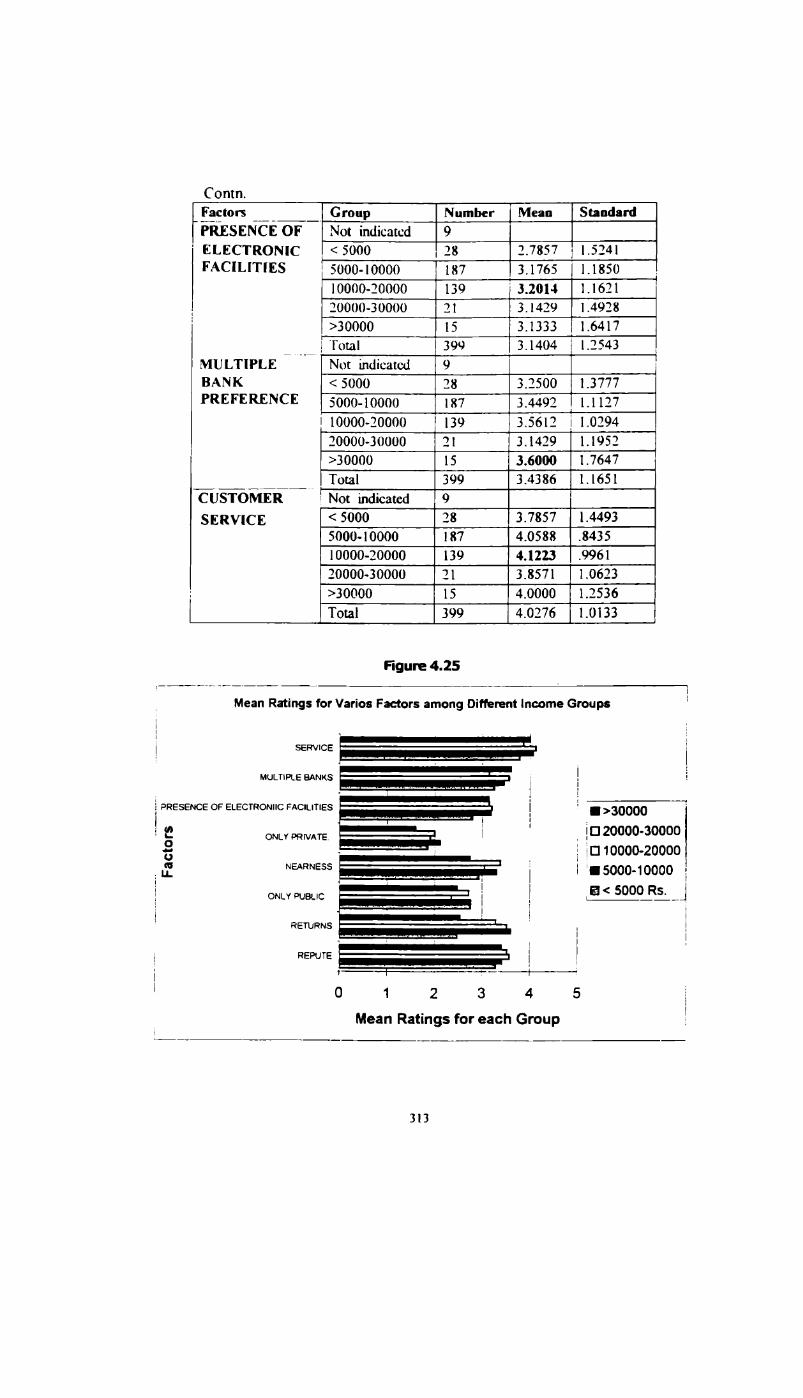
C onm.
nlfactors __ Group Number Mean StandardPRESENCE OF Not indicated 9ELECTRONIC < 5000 23 2.7357 1.5241FACILITIES 5000-10000 1117 3.1765 1.1350
10000-20000 139 ' 3.2014 1.162120000-30000 21 3.1429 1.4923>30000 15 3.1333 1.6417
_” Total 399 3.1404 1.2543MULTIPLE "E Not indicated 9BANK < 5000 23 3.2500 1.3777PREFERENCE 5000-10000 137 3.4492 1.1127
I 10000-20000 139 3.5612 1.029420000-30000 21 3.1429 1.1952>30000 15 3.6000 1.7647
g Total 399 3.4336 1.1651EJSTOMER " . Not indicated 9SERV[CE < 5000 28 3.7857 1.4493
5000-10000 137 4.0533 .343510000-20000 139 4.1223 .996120000-30000 21 3.3571 1.0623>300o0 15 4.0000 1.2536Total 399 4.0276 1.0133
Figure 4.25
Mean Ratings for Varios Factors among Different Income Groups
SERVICEMULTIPLE BANKS ‘ I ‘ i
EPRESENCE or-' ELECTRONIIC FACILITIES *j"j-"' I -X30000 '
1 9 OWPRWE V §1:1200oo-30000-3 . ; 11:110o00-200ooas . »:17 ”E"””E55 - 1 ‘ ‘I5°°°-1°°°°ONLY Puauc 0ji_J----'--"-°-‘--- 1 1RE“"‘”‘°’ - 1 1REPUTE ’1 I0 1 2 3 4 5
Mean Ratings for each Group
3|}

The foregoing analysis indicate that income can be used as a key
differentiating factor for identifying segments based on a largenumber of aforementioned attributes. However, the contribution
of other aspects cannot be ignored in defining groups withsimilar attitudes. Aspects other than the present references likePSB, OPB. NPB or FB might also exist. To derive a clear picture
of possible groupings in terms of attitude sets a cluster analysiswas also done. the details of which are given in appendix-4. This,
however, did not give any worthwhile conclusion. Therefore aMultidimensional Scaling (MDS) was attempted to obtain aperceptual mapping of the relative positioning ofthe factors. Thedetails are presented in the following section.
4.3.7 Multi-Dimensional Scaling of Perceptions aboutFactors Influencing Choice of Bank
The map indicated four different sets of attitudes with similarinfluences on choice of banks by the respondents.
‘Returns’ along with ‘presence of modern facilities‘ and ‘repute’
of bank clustered in one quadrant of the matrix. The attitude of‘choose—only-public—sector—banks‘ and ‘ne-arness‘ formed another
set of similar attitudes, though the factors are not very closelypositioned in the quadrant. ‘Customer service‘ and ‘multiple bank
preference‘ seemed to have similar influences. The one factor,which stood alone, was the attitude of 'choose-only-privatesector- bank‘ It may be recalled that this factor obtained almost
only negative ratings, i.e., a level of agreement ranging from‘disagree’ to ‘strongly disagree‘ among all groupings, based ondifferent demographic variables and MFBs of respondents.
314

Case Processing summary of MDS
lteration history for the 2 dimensional solutions (in squareddistances)
Young's S-stress formula 1 is used
Iteration S-stress Improvement1 0.144942 0.13336 .0ll583 0.13231 .001054 .l3228 .00003Iteration stopped because S-stress improvement is less than.O0l000
Stress and Sgiared correlation (RSQ) in distances
RSQ values are the proportion of variance of the scaled data(disparities) in thee partition (row, matrix, or entire data) whichis accounted for by their corresponding distances.Stress values are l(ruska1's stress formula 1.
For matrix
Stress= .1221 RSQ= .92309
The co-ordinates obtained from MDS are given in Table 4.89
315

Table 4.89Configuration Derived in 2 Dimensions
Stimulus Co ordinates obtained from MDS
Stimulus Number & Name Dimension1 2l Repute 0.7928 0.16522 Returns [.1113 0.908313 Choose-only-public.. -1.8355 —0.413l4 Nearness -0.2353 -0.81945 Choose-only-private.. -2.2007 0.55826 Electronic facilities 0.0520 0.51167 Multiple bank 0.6283 -0.3330
preferences8 Customer service 1.6870 -0.3269
PSBs are seen more or less as neighbourhood banks as is evidentfrom the clustering of the factors 'nearness' and attitude of‘choosing-only-public-sector-banks‘ (see Figure 4.26). Thequadrant in which factors like ‘returns’, ‘modern bankingfacilities’, and ‘repute’ cluster together is likely to represent theNPBs, FBs and OPBs with good image. Another set of stimulithat has more or less the same influence is the combination of
‘multiple bank preferences’ and ‘customer service’ This ispossibly the higher income segment above Rs.30,000 per month
that has stronger need for dealings with many banks and morepersonalised attention (better services). The above inferences,however, do not imply that PSB customers will not havepreference for ‘customer service‘, 'returns', ‘electronic facilities’
316

or ‘dealing with multiple banks’ This figure only indicates thepositioning of the perceptions about the different needs ofcustomers in choosing their bank.
An advantage of using MDS to get the positioning of the factorsis that different banks would be able to examine the perception of
people about them and develop strategies to position their banksaccording to the indications in the graph. The graph clearlydemarcates the boundaries between mass banking and classbanking. Being a private bank need not be a reason for choosinga bank unless they prove their worth in terms of offering returns
or projecting good repute, combined with modern facilities andcustomer services. An interesting inference drawn from thenature of clustering of multiple bank preference and customersatisfaction is that a particular bank cannot satisfy all the needsof a customer in banking industry since the needs vary widelyfrom segment to segment. This also leads us to the conclusionthat each segment should be given what it expects and henceacquiring core competencies is important for those banks catering
to specific target markets.
317

an
.co_m$E__o
_ O _. W. ....
n. 3.
wmmfimmz
fi._>.mm ._oEo_...,.:o . 0
U
muc92m._aux=mn-___:s ...._EB Bfimm o__o=n_ 2:0 mmooco
n 3.
0
E3 3 2.323% E.
N co_mcmE_n_
mm_____om_ Emcee B wocmmmi . m.
D
...._cmn.o_umm2m>_._n_ >_co mmooco
u . o _
mF::mm
0.
Boos 8=m_w_u cmmu__o=m_ :$:_9o3 $o:$o=_u _m_..U_>_U:_
:o:m5m__:oo m_.._:E:m ow>:oo
36 2.6.“.

4.3.8 Segmentation based on Current Bank-choices andPersonal Characteristics
Since the cluster analysis did not give any conclusive results onthe demographic profile of respondents based on theirperceptional similarity in choice of banks, simple descriptiveanalysis was carried out using data on MFB of respondents andthe personal profile. Tables 4.90-4.96 give the results of crosstabulation on the aforementioned variables.
Table 4.90Distribution of MFBs based on Age of RespondentsMFB Age group
20-25 25-30 30-35 35-40 40-45 45-50 50-55 55-60PS3 10 16 38 54 32 39 20 15Index 101.56 81.25 93.56 97.5 96.30 109.27 108.3 135.42OPB 3 7 19 32 17 8 4 1Index 73.13 85.31 112.27 138.67 122.78 53.79 52.00 21.67FB 2 2 7 3 4 3 4Index 195 97.5 165.45 52.00 115.56 80.69 208.00NPB 1 7 2 1 1 8 2 2Index 97.5 341.25 47.27 17.33 28.89 215.17 104.00 173.3
Total 16 32 66 90 54 I 58 i 30 18Contd.
319

Contn.
Ml-‘B Age Group60-65 65-70 Above TotalPS3 6 4 l 240
Index 121 98 72.2 162.5OPB 2 4 100Index 97.5 173.3FB 25NPB l 25Index 173.00Total 8 9 1 390Note: Index Numbers given in the table is calculated using the formula' I = % of an age group in the Ml-'Bs' sample X 100 '
% of the age group in the total sample
Each cell in the tables represent a possible segment. Indexnumbers are calculated for each segment to assess the chances of
the segment choosing a bank belonging to the corresponding bankgroup. Thus, an index above 100 in Table 4.90 indicates thatthere is more likelihood for the particular age group to choose abank among the corresponding MFB group. Higher the valuegreater will be the possibilities. It does not, however, indicate the
potential of the market. A high index number for the age group55-60 in PSB group (Table 4.90) shows that the bank group ismore popular among the older people. So also the case with theyouth (20-25 age group) also PSBs were popular, possibly, due to
influence of parents. OPBs were more influential among 30-45age range (Figure 4.27). FBs did not show any clear pattern,though NPBs were popular with 45 plus and 25-30 age groups.This information is only useful as long as it can be related toother factors. The segment of women is likely to be attracted to
320

PSBs rather than men whereas NPBS, OPBS, or FBS are likely to
get more men customers than women (Table 4.91).
Distribution of MFBs of Respondents based on Age Groups
Figure 4.27
321
3E
‘UC
8IIIIII:'6BAE3Z | I I -n I o i ll‘! o in o 1 an 0 ll’) l o :0 l°.‘;*'.’1°.’;‘.**.*"?i“.’ *9“? 513° 1la“:-:°m:°3°"°»"lI N I 1 1- 1- 1 In to to ,2
Agegroup
Table 4.91Distribution of MFBs among Men and WomenMFB SEX Total
Women Men
PSB 54 185 240Index 111.08 97.29OPB 19 80 100Index 93.80 100.97FB 3 22 25Index 59.24 111 07NPB 3 22 25Index 59.24 111 07Total 79 309 390

Table 4.92Distribution of MFBs among Different Educational GroupsMFB EducationSSLC PRE DEGREE POST PR()FESSl0- Total
DEGREE GRADUATION NAL DEGREEPS8 16 26 47 69 77 240Index 113.04 111 18 95.47 94.22 100.91OPB 7 12 20 40 30 100Index 118.70 123.16 9.75 13109 62 90F8 9 7 9 25Index 175.5 9176 113.22NPB 4 3 18 25Index 78.00 39.33 226.45Total 23 38 80 H9 124 390
Figure 4.28
Distribution of MFBs based on Educational Level of Respondentsl--—___ U PS380 1” "'2' 'i,-« -x~_.____ ii‘ " ,i 70 L/__...-”/__‘\‘ _ IOPBi[ 60 -r“"' e " - ;U FB !
% of Respondents in_ 50 :e/-/ i 2 2each Bank Group 30l ‘L f ResponI 20 V , dents in5 10 T each Bank0 . 2 Group3 Lu ,3 3 (across;9: E 3 E ‘e 2
Educational E4 § § ‘-7Levels E Q
_l
E9%Wu:"0“-‘Lu“-0On::1
POST GRADUATE
Similarly people at lower educational levels are more likely todeal with PSBS (Table 4.92). NPBS are likely to get moreprofessional degree holders, but OPBS are likely to get relatively
less number of them. I-‘Bs are popular with graduates, possibly
322

due to
graduates (see figure 4.28).
the business customers who are more likely to be
Table 4.93Distribution of MFBs among Different Occupational Groups
Occupation Business Govt. I Private Sector Others TotalEmployment employmentPSB 40 87 68 41 240
Index 103.1?’ 120 83 83 08 95.18OPB I5 21 37 24 100Index 92.86 70. 00 108.50 133. 7]FB 6 6 10 3 25Index 148.57 80.0() 117.29 66.86NPB 2 3 l8 2 25Index 49.52 40.00 211 13 44.57Total 63 117 133 70 390
Figure 4.29
Distribution of MFBs based on Different Occupational Groups ;
so 4/”' / Rafi‘ ‘701/’60 _L/so 1/" .
fisolrespondents in 40 /’ I .50, respon _____ieach banltgroup 3oJJi// / cgemsin i IPSB/..— each bank I20 ,. group l CIOPB I10*§’ Npg (across) ' CIFB0 FB EINPB IOccupation
2 C
E g§ 3%3.0
ELU
Private Sector
employment
Others
323

PSBs are preferred more by government employees (Table 4.93and Figure 4.29) Similarly OPBS and NPBs are likely to attractprivate sector employees and FBs the business customers. Atlower income levels (below Rs.5,000 per month) and the highest
(above Rs.30,000 per month) level PSBs were preferred. OPBs
would be more preferred by the income group Rs.5,000-10,000per month while NPBs by higher income groups Rs.20,00030.000/month and interestingly the Rs.5,000-10,000 per monthgroup. FBs had more customers in the income range ofRs.10,000-30.000 per month (see Table 4.94 and Figure 4.30).
324

Table 4.94Distribution of MFBs among Different Income Groups
MFB Income Groups<5,000 5,000- l0,000- 20,000- Above Total
l0,000 20,000 30,000 30,000PSB 20 93 98 12 12 240Index 135.42 83.96 110.59 97 5 139.29OPB 3 65 24 4 l 100Index 48. 75 140.83 65.00 78.00 27 86FB 1 8 13 2 l 25Index 65.00 69.33 140.83 156.00 111 43NPB 14 9 2 25Index 121.33 97.5 156.00Total 24 180 144 20 14 390
FBs and NF'Bs are likely to be chosen by people with their spouse
employed and OPBs were found to be less attractive to suchpeople (Table 4.95). Table 4.96 shows the likelihood of different
communities choosing their bank. The figures indicated thatMuslims have an inclination towards PSBs while Christians are
likely to choose OPBs. Among Hindus NPBS, PSBs and FBsenjoyed more popularity. However, these demographic variables
cannot be singularly considered for segmentation. The collectiveinfluence of the variables on choice of bank will have toconsidered before segmenting any market.
325

Figure 4.30
Distribution of Respondents in Different Income Groups
70 "”"” 1:. »~e-_1:;I: ""‘"“’ apsa60«—*i‘ if nope50 r '5 ‘ DFBscar respondents in 40 '5 I ‘A GNP‘:eachbankgroup 30; ’ ‘~'
20 ~10' I "05 seat
I m Respondents inO A p .8 8 C) ' E 2 Each Income ‘Id 0 O O m Grou 'V 0- o_ o o m P I‘T 8 g_ 8 U) 0 (across)I ' l 1Income Groups 8 Q 0? go o o ..5 o_ o a: ,Q Q > |- o 8 EN <
Table 4.95Distribution of MFBs among Respondents with employed and
unemployed SpousesBank Groups Spouse Spouse Employed Total
Not EmployedPS3 139 I01 240Index 101.75 97.69OPB 61 39 100Index [0716 90.54FB 9 16 25Index 63.24 148.57NPB 13 12 25Index 91.35 111.43Total 222 168 390
326

Table 4.96Distribution of MFBs among Different Community Groups
Bank Group CommunityHindu Christian Muslim TotalPS3 134 96 10 240
Index 111 10 102.63 125OPB 42 55 2 100Index 83.5.7 141 12 60.00FB 20 5 25Index 159.18 5132NPB l5 8 2 25Index 119 39 82.11 60.00Total 196 152 13 390
In summary. NPBs are found popular with private sectoremployees who have professional education and among theincome group of Rs.5000-20,000 per month. Eighty percent ofNPB respondents were using ATM facilities while only 15% ofthe total respondents were using it. OPBs, on other hand, arecatering mostly to non—professional educated people employed in
private sector in the income category of Rs.5000-10,000 permonth. FB's customers were mostly business people with aneducational level of graduation falling into the higher incomegroup. With reference to PSBs or OPBs, it cannot be said thatthey do target marketing to these segments. But NPBS and FBshave been using target marketing since long. The earlier analysis
on perceptions also gives indications on similar lines.
The discussions so far dealt with customer behaviour with respect
to choice of banks. It yielded that customers would chooseaccording to their specific needs like credit, investment, etc. The
present study also intends to examine perceptions of customers
327

about loans and different schemes of investment offered by the
bank. This also involves an assessment of the competition theindustry may face from external sources.
4.3.9 Perceptions about Investment Products
For common man's regular financial transactions or safe keeping
of money there is hardly any other option than banks. A largernumber of institutions like, LIC, UTI, IDBI, ICICI, NBFCS, etc
are competing in an extensive market along with the capitalmarket. Companies in the unorganised sector also are popularamong high risk taking investors. However, banks still dominate
the investment market probably due to its wider reach and theresultant popularity among the masses. In the past, investors,especially the urban segment, have shown trends of swaying tocapital market or other non-bank investments depending on theundulations in the performance of different sectors. The presentstudy takes stock ofthe current investment pattern as well as thepatterns that can be anticipated in future.
Initially, respondents were asked to provide information on thedifferent types of investments they have made in banks (see table
4.97). Withdrawable deposits were the most popular with 30.75%
respondents followed by 25% opting for long-term deposits and
23.5% preferring automatic renewal deposit scheme. It is quitelikely that these figures are understated. It gives only a picture ofthe popularity of different schemes.
Table 4.97 gives the distribution of deposits based on differentbank groups including Co-operative banks. The index numbers
328

given show the relative popularity of deposit schemes ofdifferent bank groups. Though PSBs have more share in the total
figures for each category of investment. OPBs and CBS alsoenjoy almost comparable popularity among the respondents. A
notable finding is that, regarding schemes such as automaticrenewal deposits. recurring deposits and withdrawable deposits.CB5 have an edge over PSBs. This. however, do not mean thatCBS have the major share of the market as index numbers do not
in any way represent the size of market share. It gives only aninsight into the potential areas of business for the respective bank
group. In long-term deposits (more than five years) PSBs have a
clear domination, i.e., a more than the average potential of themarket. The former types of deposits include the elements ofconvenience (withdrawability) and safe keeping whereby returnsneed not be the prime criterion of investors. At the same time, in
long-term deposits, security would matter the most and PSBsbecome the choice of the respondents.
329
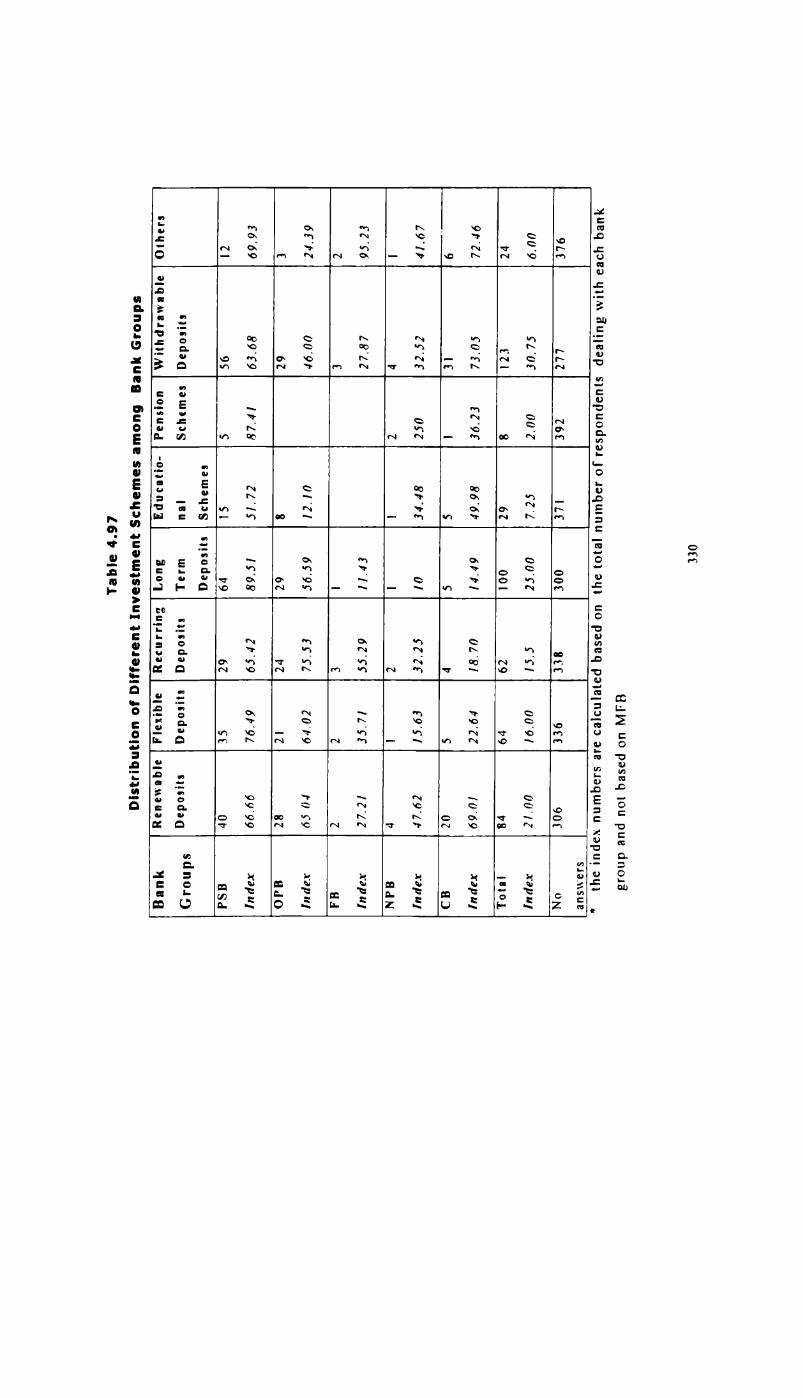
on
mh:2 co woman .o: was 9.2m
xcan _._UNU 2:3 MCZNUU m.:o—:._oamo._ .—O ._UD€_=C .30. On: :0 woman. o3a_=u_uu 0.3 w:5E=: row... 0.: 9
Eutmcae: :~ 2; .3 2: in 02 2: cz2.6 3.3. Sim Rx 3.2 52 E83 Elm H32:3 ...~_ m 3 2: S 3 1. _.:o._.3.3 3.3 2.3. no.2. 3.: 3.3 3.2 3.2. 2.3.5e : _ m m .. m S .5$1» 2.3 3w 3.2. 3 2.2 3.2 2.? ».2::_ .. ~ _ _ N _ .. ?_z2.3 3.2 2.: 2.2 3.3. 2.2 535N m _ m N N m...3!: 383.. 3.2 3:3. 2.: 3.3. 2. 2 2.2::n on n on .4 _~ 3 :.._O2% 3.2 :23‘ N53. 3:3. NT: 3.3 3.8 .«2::~_ 3 m 2 E 2 2. S 3..
.oEu._um 2_2:_oD
:_:::5 3Eu__uw .3. E3... 3_.o._oa_ .:..:_oo :_:;_.o m.._:o._U32:9 o_....>.u.._..:.:>» =o_2_un_ -£..Z=uu u.:.._ .e.=_.E=uo¢ o_.__.$_.._ o_a_...:o=o¢ zcam
2.39.0 scan u:oEa mofiogum u.:uEauu>..: u:o..o.—_:o no =o_u:£.am.o
3... 03m...

The recent reports on study of investment behaviour of people alsosuggest that bank deposits are the favourite investment avenue forpeople. The reasons for this may be the simplicity of procedurewhich even an illiterate can easily follow. easiness in calculation ofreturns, certainty of returns and above all. the accessibility to the
funds (liquidity) at any point of time. The reason why withdrawable
deposits were much in demand shall be understood as the need forreturns coupled with convenience of withdrawability. Deposit based
loans are hence more likely to attract customers. The above analysis
do not deal with the future plans of investors. To examine thelikelihood of banks getting competition from external sources a fewimaginary propositions were used in the questionnaire. for therespondents to answer. The following options were given for therespondents‘ answer.
0 Investing a small amount of the respondents‘ savings in bankfor 1-3 years and for more than 3 years
0 Investing the same in non-bank schemes for 1-3 years andmore than 3 years
0 Investing a substantial amount in banks as well as non-bankschemes (the periods were not specified)
For some of the options, definite answers were not obtained and for
others only few responded. However, the available data were edited
and subjected to an analysis and the results are given in Table 4.98.
331

Table 4.98Choice of Long-Term Investments
__ 2. _._w___S_m—a_l_l"amount Sulbstantialmw
Investment Period Amountopfion 1-3 years More than 3
yearsNon-bank 38 28 18investments% to total 9.50 7 00 4.50Bank 266 220 714investments% to total _ _ _ _66 5 33.00 :3 3
Banks have a predominant influence over the investment decisions
of people. Only 9.5% opted for a non-bank investment. With regard
to long-term investment only 7% wanted to depend on other sources.For small amount-short-term investment for periods ranging for 1-3
years, banks were preferred by 66.5%. Though for longer termsand higher amounts of investments the percentages were not as high
as this, it cannot be interpreted that preference for banks is lesser.Long term investments necessitate greater amount of informationprocessing. For queries on how respondents process the information
given in advertisements and investment guidance, over 59 percentsaid that they try to understand the differences in returns or interest
rates only if they have immediate plans to invest. Most of therespondents (62%) get investment advices by word-of-mouth only,though they also depend on hand outs or brochures.

Specific choices of respondents were also subjected to analysis toexamine the nature of their preference. Table 4.99 gives the details
of their preferences. The ratio of respondents opting for investmentin PSB. OPB and CB is 3.97 1.97 1 whereas the ratio ofrespondents dealing with each bank group is 2.07 1.48 1. Thisimplies that PSBs are likely to have a higher share of 1-3 yearinvestments. Similarly. for more than 3 years. the ratio of shareamong the bank groups is 3.23 1.55 1. This is an indication thatfor longer years PSBs would be a little less attractive, though, theystill would get the maximum share.
Table 4.99Pattern of Preference for Investments in Banks for
Different PeriodsBank groups Small amount
Substantial1-3 years More than3 years AmountPS3 151 123 111
% *0 '0'“! 37 75 30.75 27 759PB 75 59 204 '0 ‘Om’ 18.75 14.75 5.00CB 38 38 33% '0 "”‘” 9.5 9 5 3.25[No answers 2 O 50% to 10101 0.50 0.00 12.50Total 266 220 214
For a substantial investment also the share was 3.36 0.61: 1(among those who responded) implying that PSBs would get morepreference over others and OPBs would get a very low preferencecompared to CB5. But due to a very high rate of non-response itcannot be concluded that OPBs will get few investors in thatcategory since it should also be inferred that fairly a good
333

percentage (26.35%) are undecided on the available options. But the
analysis on the present investments in deposits reveal that PSBshave an edge over the other banks in the case of long-terminvestments.
Need-Based Investments
The above analyses have not yet enquired about the need—basedinvestments of respondents. Another range of questions were askedto study how customers behave when they have specific needs aslisted out in the table 4.100
Table 4. 100Preference of Respondents for Need-Based InvestmentsNeeds Choice
No Bank Savings Specific Non-BankAnswers FD Bank Schemes InvestmentPurchase of 37.25 29 98 84 40
household things 2.25 24.5 21.00 10.00Children's 40.25 38 128 45 28education 9.5 32.00 11 25 7.00Construction of 47.25 41 38 94 38house l0.25 9.5 23.5 9.5Future plans for 47.25 89 58 38 26children 22.25 14.5 9.5 6.5Retirement life 52.5 74 49 28 31
18.5 12.25 7.00 7.75Note: Figures in Italics are percentage to total (400)
334

For ongoing needs like purchase of household goods (durables) orchildren's education. savings bank account was the most preferred,
whereas for future financial needs, fixed deposits or specific bankschemes were preferred. In this analysis also, non- bank schemeswere found to have insignificant influence over the respondents.Reasons for choosing a long-term investment for periods beyond 5
years were hence examined. Respondents were asked to rank a preselected list of the reasons for choosing such long-term investment
options. The ranks assigned by the respondents are given below
Rank Reason1 Higher Annual Interest
Returns or Benefits at the End
SecurityInterim Returns
WithdrawabilityTax savings
\lO\UI-BU-Its) Other Reasons (unspecified)
A close examination of the reasons would reveal that banks are
perceived to provide security, steady interim returns (promptpayment of interest) and easy withdrawability. The highest rankingfactors are, in fact, less attractive with banks. If the inferences from
earlier analyses in this chapter can be relied on, it is to beinterpreted that if non-bank investments can combine theaforementioned attributes of bank deposits, they would be able toreduce the popularity of bank deposits. Earlier analysis alsosuggest that customers are more likely to make long-terminvestments with PSBS, possibly due to the feeling of security
335

offered by such banks. Respondents’ current investment in non-bank
avenues were also examined in this part. They were given a largenumber of investment options
the choices they have already made.
Table 4.101Respondents‘ Investment in Non-Bank Schemes
(Percentages to total)
available in the market to indicate
SI Schemes Number ReasonsNo. Invested Returns Safety Liquidity Tax Other
Quick End benefits benefitsPublic Provident 150 93 12 110 141 Fund 37 5 24.5 3.00 27.5 3.52 LIC/GIC Schemes 301 230 17 159 60
75. 25 57.5 4.25 39.25 15.003 UTI—Various 60 10 29 10 32 4
Schemes 15.00 2.50 7.25 2.5 3.00 1.004 SE.:u'cs&Sto(.iu 71 46 2 24 1 17
17. 75 11.5 0.50 6.00 0.25 4.255 Debentures 16 7 1 2 1 64.00 1. 75 0.25 0.50 0.25 1.56 Mutual Funds 26 5 2 6 10 66.5 1.25 0.5 1.5 2.5 1.6
7 National Savings 90 40 6 53 9Certificate 22.5 10.00 1.50 13.25 2.25
3 Indira Vikas Patra 62 8 35 6 15 415.5 2.00 3. 75 1.5 3. 75 1.00
9 Cooperative Bank 121 69 74 16 4 31Deposits 30.25 17.25 13.5 4.00 1. 00 7. 7510 Deposits in 22 ll 6 3 7F-nancial 5.50 2. 75 1.5 0. 75 1. 75comgames11 Bonds(ICICI....etc) 14 1 2 1 5 6
3.50 0.25 0.50 0.50 1.25 1.512 ChittiesandCuries 162 113 70 33 5 34
40.50 29.5 17.5 9.5 1.25 3.513 Nidhies 4 4 3 1 21. 00 1. 00 0. 75 0.25 0.5
14 Medical Insurance 164 94 134 5 15 2341.00 23.5 33.5 1.25 3.75 5.75
Note: Figures in italics are percentages to total (400)
336

Most popular non-bank schemes were Life Insurance Schemes (LIC
75.25%). Medical Insurance (4l.00%). Chitties and Kuries (40.5%)
and Public Provident Fund (PPF-37.5%) in that order (Table 4.101).
The motive for investing in insurance need not necessarily be'returns' The Table shows that 37.5% had both LIC and Medical
insurance. Deposits in CBS were also included in this table toexamine if scheduled commercial banks will face threat from other
type of banking activities. Higher percentages for governmentrelated schemes also is an indication of the concern about safety in
parking funds in other avenues such as shares, stocks, debenturesor mutual funds. Moreover, the complex processes involved inmaking such investments from the perspective of a common man can
also cause a higher rate of disinterest in such options. Chitties andKuries, unique products of Kerala are still enjoying popularity inthe state as seen from the high percentage of respondents (40.5%)who have invested in them. Besides, there was also regionalvariation in the investment pattern of the respondents. Thedifference was obvious in the case of the district of Thrissur. More
respondents (41.5%) from the district invested in Chitties ascompared to 28.7% and 29.9 % from other two districts. In otherinvestment options Ernakulam district had more share followed by
Thiruvananthapuram and Thrissur. Tables indicating the dependence
between number of respondents investing in each option anddistricts are given in appendix-5.
The most frequent reasons for choice of non-bank investmentsindicated by respondents are either returns or liquidity. Aspects like
tax savings seem to have nominal influence. Both the
337

aforementioned factors are the most comprehensible and convenientto investors. Recent studies also show that investors prefer simple
schemes to financial products that demand investor learning andinformation processing. Hence, the most popular ones are still bankdeposits.
Table 4.102 depict the investment mix of respondents. Thecombinations chosen represent different possible motives ofinvestments such as choosing only purely government-relatedschemes, short-term or long-term preferences, high-risk or low- risk
attitudes, and wide or narrow portfolio options. Obviouslygovernment-related schemes were more popular in combinationstoo. A significant percentage of respondents however, had investedin both long-term deposits such as PPF and quick return basedChitties. Over half of the respondents had invested in both LIC andMedical insurance. A small percent (8.00%) had invested in as many
as eight schemes in the list. Very few opted for both high risk andlow risk combination such as PPF and shares. Though, it waspossible to take more different combinations, the number waslimited to what is shown in the Table 4.102. Among NRIs, attitudeto deal with more risk related investments like shares and mutual
fund was very visible. This may be due to availability of funds forsuch investments. About 50% of the NRI respondents had invested
in shares or mutual funds and as many had also invested in LIC.Indira Vikas Patra and Medical insurance were also popular among
them (36% and 28% respectively)
338

Table 4. 102Pattern of Investment Mix of Respondents
SI.no I Combination Number Percentageto total
l PPF+LlC/GIC+UTl 20 5.002 Any of the above two 152 38.003 CB dcposits+Chitties/Kuries 62 15.54 Pl’F+Chitties/Kuries 63 15.75S PPF+UTI+Shares 14 3.56 LIC/GIC+Medical insurance 150 37.57 All schemes 3 0.758 At least 8 schemes 32 8.009 At least 4 201 $0.25
From the foregoing it is more or less clear that bank deposits arelikely to remain popular among investors. The features they want inany other investment options are the ones they associate veryobviously with bank deposits. With regard to choosing particularbanks for depositing it was seen that for short-term investmentsthey would opt CB5 or OPBs, but for long-term investments, there
was distinct preference for PSBs as found from both the presentpattern as well as the future intentions. The gaining popularity ofCBS is likely to pose a threat to other banks in future. Industrystatistics tell us that bank deposit growth rate is higher than that of
any other financial product in the market. As such, theapprehensions about banks facing severe threat from outside theindustry are rather remote.
339

4.3.10 Perceptions about Credit products
Banking business is basically a balancing act between mobilisation
of funds and deploying of credit. Selling credit products is morechallenging than mobilisation of deposits since there are not manytakers for the credit product and banks cannot lend to anybody who
need it. Further, in lending funds. banks also have to observestrictly the norms set by RBI. though there is considerable amountof freedom allowed in certain areas. Banks are at the receiving end
of many a criticism when it comes to lending of funds towards thevarious needs of their customers. In this context, the present study,
in this part, deals with the perception of customers about availingloans from banks. Though household segment do not constitute amajor market for lending, from the point of view of customersatisfaction how banks are able to lend effectively to all itscustomers assumes importance. The basic aspect that requires anexamination is whether they favourably accept the option ofborrowing from banks or not. This is particularly relevant inrelation to the banking business in Kerala since the banks in thestate have been continuously reporting declining CD ratio. It isknown that some banks are focusing on specific customer segments
for lending their funds. In some parts of the world the householdsector offers immense potential for credit absorption. Theperceptions of two segments, viz., NRIs and Traders and Smallscale Industries are also analysed here.
Reasons for borrowing, chances of borrowing for different needs in
future and perceptions about the different sources of borrowing
340

were studied in this part of the analysis. There is a pre-conceivednotion that people are reluctant to take loans from banks. But theresults show that 32.75% of the respondents had taken loans fromCB5 and 31.75% from other commercial banks. A small percentage
of respondents had also used sources like finance companies or even
private money lenders as is evident from Table 4.103. Out of thosewho had taken loans from banks 35.78 % borrowed for construction
of houses, l8.8l% for buying vehicles, 24.31% for householdpurposes and the rest for business purposes. Over 63% of those who
had borrowed would not mind taking again. Among NRIS alsoalmost the same percentage (54.17%) of respondents have takenloans from banks. Thirty seven percent of the Traders and SmallScale Industries segment had also availed loans from banks.
Table 4. 103Availing of Loans from Non-Scheduled Commercial
Banks
Source of loan Number of people Percentage
Co operative banks 131 32.75
Finance companies 53 1325
Private Money lenders 25 6.25
From the perspective of the present study it is more important toexamine the preferences of customers for different bank groups to
source loans. Table 4.104 provides the required cross tabulation tostudy the weightages given by customers in choosing banks forloans.
341

Table 4.104Availing of Loans from Banks and Reasons- Distribution of
Respondents by Bank Groups‘Bank No. or 1' 2 3 4 5 6 7 s 9Groups Respondents
who havetaken loans
ps3 91 38 29 12 13 26 7 16 E44175 3L87 131911429 2&57 769 1758 !440093 24 7 3 ;2 12 2 2 V29.17 33.33 ‘8.33 50.00 3.33 8.33 1F3 7 2 i 5 i2&57 5 7143 .MB 4 1 i 4 12500 : 10000CB 91 56 2 1 :4 43 2 14 56L54 220 110 1440 4725 22 1533 i549
Town 213 101 42 13 i19 90 11 32 o 19. 146.33 19.27 5.96 13. 72 41.23 5.05 I4.68 0.00r4.13
Note: Figures are not mutually exclusive
Figure in italics are percentages to total (400)" Reasons 1 to 9 represent
1. Lower interest ratesHad an SB a/c or FD in the firrnGood financial advice by the bankersHas borrowed from the bank beforeSpeedy processingSome one recommendedSolter security requirementsAdvertisements
It was the only optionFwsaweww
The reasons for such choices were also examined. The most obvious
reason as given by all is lower rates (46.33%), followed by speedy
342

processing (4l.28%), early association with the bank (l9.27%) andsofter security requirements (l4.68%). However, NRI respondentspredominantly cited the reason ‘it was the only option’ (53.5%)followed by ‘early association with the bank’ (30.77%) and 'lowerinterest rates‘ (23.08%). But the Traders and Small-Scale Industries
segment think that lower interest rate is the most important(62.00%) factor followed by speedy processing (S3.00%) and easierdocumentation (45.00%).
PSBs and CBS shared the same percentage in the total number ofloans taken by the respondents. But it should be noted that CBcustomers were not actually included in the survey and therefore not
represented fully. The split-up of the reasons based on bank groups
revealed that PSBs were approached for loans on account of thelower rates of interest. On the contrary, all the private sector banks
(OPB, FB and NPB) were approached because of their fastprocessing capability on loan applications. For CBS also, this wascited as the second major reason. CB5 are perceived to be strong in
both lower rates of interest and speedy processing. Anothersignificant attribute for taking loan from a particular bank was theearly association of the respondents with the bank. However, CBSwere an exception as only 2.2% of those who had taken loan hadany accounts with the bank. Hence, the overall percentage on this
aspect showed a lower figure. These findings lead to severalinferences about customer behaviour in banking industry. PSBs,O.PBs, NPBs and FBs are able to cross-sell credit products to someof their customers but there is an obvious indication that customers
will go in search of less expensive and easily accessible loansources as was seen from the choice of deposits in the early
343

analysis. This should be one of the key reasons why multipleselection of banks is preferred by a significant percentage ofrespondents. This behaviour is visible in the relationship betweenMFB of respondents and the bank from where loans were availed by
them. Table 4.105 will help in examining the extent to which MFBshave been able to cross sell their credit products. This is alsographically presented in Figure 4.32.
Table 4.105Loan Sources Utilised by Respondents-Distribution based
on their MFBs
Bank groups of Respondents Banks From Where Loans(MFB) Were TakenPSB OPB CB TotalPSB 80 ll 49 H]56.73 7.80 34.75 100.00OPB 10 13 36_ 5916.95 22.03 61.02 100.00CB l 6 714.29 0.00 85.71 100.00Total 91 24 91 20743.96 11.58 43.96 100.00
Note: Figure in italics are percentage of total who have taken loansin each MFB group
344

Figure 4.31
Percentage of Respondents who have Sourced Loans fromPSBs, OPBs and CB5 -Comparison with Their MFBs
EIPSB90 v_ V‘80 , DOPE70 ; EJCB
%of respondents 60 'who have taken 50 7loans from each 40 L.
bank group 30 i’
56 respondentswho have takenloan from each' i ' ‘ bank groupfig e 5‘ CB (=='‘‘')3 O E g OPB3 OPB CBMFBs of respondents '
Among both the PSB and OPB customers, a significant percentagehad resorted to CB5 for credits, though the percentage is very highfor OPBs. It is also possible that OPBs lend selectively to highvalue loan seekers such as business customers who would not be
much concerned about the higher interest rates, but will be moreparticular about fast processing and the availability of high amount
of loans. However, the household segment do not see them asattractive source of income as evidenced from Table 4.105. The
inference is that the strongest attribute of loans is lower interestrates among the household segment. Interestingly, OPBs have been
perceived favourably in terms of processing of loans and attitude of
bank staff in dealing with them (Table 4.106), though it has notinfluenced the actual purchase of the product. At the same timePSBs have been unfavourably perceived also. Even though OPBs are

interested in focusing on specific segments, they can utilise thefavourable perception they enjoy in serving the household segment
and hence more cross-selling effort would help them in gaining theloyalty of their existing customers.
Table 4.106Comparison Between PSBs and Private Sector Banks based on the Key
Attributes for Sourcing Loans.Banks Interest rates Attitude of stafl' Processing
Low High No Bad Good No Slow Fast Noanswers Answers answersPublic 297 63 40 I05 258 37 282 70 48sector Banks
74.25 15.75 10.00 26.25 64.5 9.25 7.05 17.5 12.00Private 54 307 39 15 349 36 119 237 44‘°°'°' "°""‘ 13.5 76.5 9.75 3.75 3. 725 9.00 29.75 59.25 11.00
Note: Figvies in italics are percentage to total (400)
Respondents’ intention to borrow was also examined by givingimaginary queries. This analysis basically tries to understand howattractive bank loans are to the customers in a changed competitive
environment. Relative weightages which the customers will assignto the options of borrowing from different bank groups areexamined with the help of ranks assigned to each choice by therespondents. The query posed to them was:
‘You urgently need some money. You don’t have enough funds with
you now. What would be your choices to source the money ? Mark
in the order of your preference’
The results of the above query are given in Table 4.107
346

Table 4.107Rankings Obtained for Different Loan Sources
Sl Choices Offered Ranks obtained to each optionN0 Rank F rcquency Frequencyof first of secondrank rank
l Loan from a Public sector bank 2 1022 Loan from a Private sector bank 5 31 503 Loan from a C0 operative bank I 1 1 14 Loan from Finance companies 6 165 Borrowing from a friend / relative 3 88 666 Sale of gold / pledging any other assets 4 31
Since the difference between rank assigned for taking loans fromPSBS and CBS were closer and the total frequencies were alsosimilar. The difference was statistically tested for significanceusing Sign test and the following results were obtained
Rank assigned to Private Sector Banks (RPB) against Rankassigned to PSB (RPSB)
943
241bNegative DifferencesPositive Differences
Ties 65 C
Total 400
RPB < RPSB
RPB > RPSB
RPSB = RPB
347

Test Statistics
Z -7.977Asymp. Sig. (2-tailed) 0.000
The difference was significant indicating that rank assigned to PSBis higher than that for Private Sector Banks. Between the pair PSB
and CB was also the difference was significant with CB5 getting
higher rankings.
Rank assigned to CBs(RCB) - Rank assigned to PSB (RPSB)
Negative Differences 189 aPositive Differences 151 bTies 60°Total 400
a RCB < RPSBb RCB > RPSBc RPSB = RCB
Test Statistics
RPB - RPSB
Z -2.007Asymp. Sig. (2-tailed) 0.045
The popularity of CBs as source of loans is visible from the above
analysis also. Similarly the perceptions about Private sector banks
348

and Finance companies were also not very favourable as evidentfrom the lower ranks obtained for them.
The overall inclination to avail loans for the various purpose were
also examined (see Table 4.108). Though the percentage ofrespondents who are very much interested did not indicate a ready
market for such loan schemes, it should be interpreted from thepercentage who have already taken loans and the ones who arefavourably disposed to the idea that there is an increased potential.
However, percentage of favourable responses and unfavourableresponses in all the cases were found to be almost equal orexceeding 50.00%. Here, 'no' answers among the responses shouldalso be interpreted as indifference to taking loans. Among thosewho would like to avail of loans, most of the requirements was forvehicle loans.
Table 4.108Availing of Loans from Banks for Various Purposes- A closer look
Type ofloan Already Not Somewhat Very NoTaken Interested Interested Much Answers
InterestedCar/vehicle 62 155 107 47 29
15.50 38.75 26.75 11 75 7.25House 90 188 49 33 4022.5 47.00 12.25 8.25 10.00Home 45 185 90 22 58
appliances 11.25 46.25 22.5 5.5 14.5Note: Figure in italics are percentage to total (400)
349

Analysis of data on loans taken and the reasons for such decisions
also indicate that customers have a clear perceptional image about
different bank groups and are willing to get involved in a longinformation processing whereby they search for the cheapest andeasiest sources. In their expectations about getting loans frombanks, all the key attributes such as interest rates, less adherence to
security measures, good interaction by the officers, and simpleprocedures figured with almost equal importance. However, fromthe perspective of banks, marketing of loans is a risky affair. Theirprimary concern would be to ensure the repayment ofthe amount by
the customers. It cannot be ignored that different bank groups havedifferent strategies and tactics to do this. Further, different banksand financial institutions have varying recovery powers. CB5, forinstance, have an advantage in this respect. Notwithstanding these
differences, banks can still identify segments which require loans.This could be done by resorting to customer profile data eithermaintained by banks or obtained from other sources. Details ofcustomers’ past records can be maintained by a central database for
avoiding mistakes in lending out to past defaulters. Computerisation
will facilitate such history tracking and cross-referencing across all
branches of a bank or among different banks.
The discussions in the earlier sections of this chapter indicate thatcustomers have more or less clear reasons for deciding on theirinvestments and choice of banks. The perceptions about each bank
group were studied from the point of view of how their customers
consider the services of their banks. It may be worthwhile to know
what the general perception of customers is about the services ofdifferent bank-groups, irrespective of whether they deal with it or
350

not. It would also be possible to examine if the perceptions of allthe customers of each bank and the general perceptions of allrespondents are the same or not. For this purpose an MDS was done
for all the bank groups studied. The following section deals with the
findings of the MDS.
4.3.11 Perceptions about Different Bank Groups
Five factors of tangible nature, viz., returns offered, availability of
all services, wide branch networking, customer service (partiallytangible) and service charges were chosen for a factor analysis and
later to obtain a perceptual map using MDS.
All the respondents were asked to rate the different bank groupswith respect to each of the aforementioned aspects. The number offactors chosen were kept to a minimum so that respondents wouldbe willing to rate all factors.
The results showed that all the factors relating to any bank-groupgot factored along the axes (dimension 1,2,3 and 4) and thedifferent groups got clustered clearly in 4 quadrants (see Tables4.109 to 4.11] and Figure 4.31). In other words, respondents‘overall perception about the bank got reflected in their scores forthe different factors in relation to each bank. It is clearly visiblethat they see the bank groups differently as is also indicated by the
factor loadings in the initial factor analysis of the same factors.The results of factor analysis is given here. The findings of theMDS is given later in this section.
351

Table 4.109
Rotated Component MatrixComponent1 2 3 4
Factors
NPB Customer Service 0.901NPB Service Range 0.895NPB Returns Offered 0.884NPB Branch Network 0.879NPB Service Charges 0.868FB Customer Service 0.909FB Service Range 0.8961-‘B Service Charges 0.867FB Returns Offered 0.859FB Network 0.849OPB Service Range 0.866OPB Customer Service 0.849OPB Service Charges 0.838OPB Returns Offered 0.822OPB Branch Network 0.739PSB Branch Network 0.854PSB Service Range 0.852PSB Customer Service 0.837PSB Returns Offered 0.778PSB Service Charges 0.764
Extraction Method: Principal Component Analysis.Rotation Method: Varirnax with Kaiser Normalisation.
a Rotation converged in 6 iterations.
352
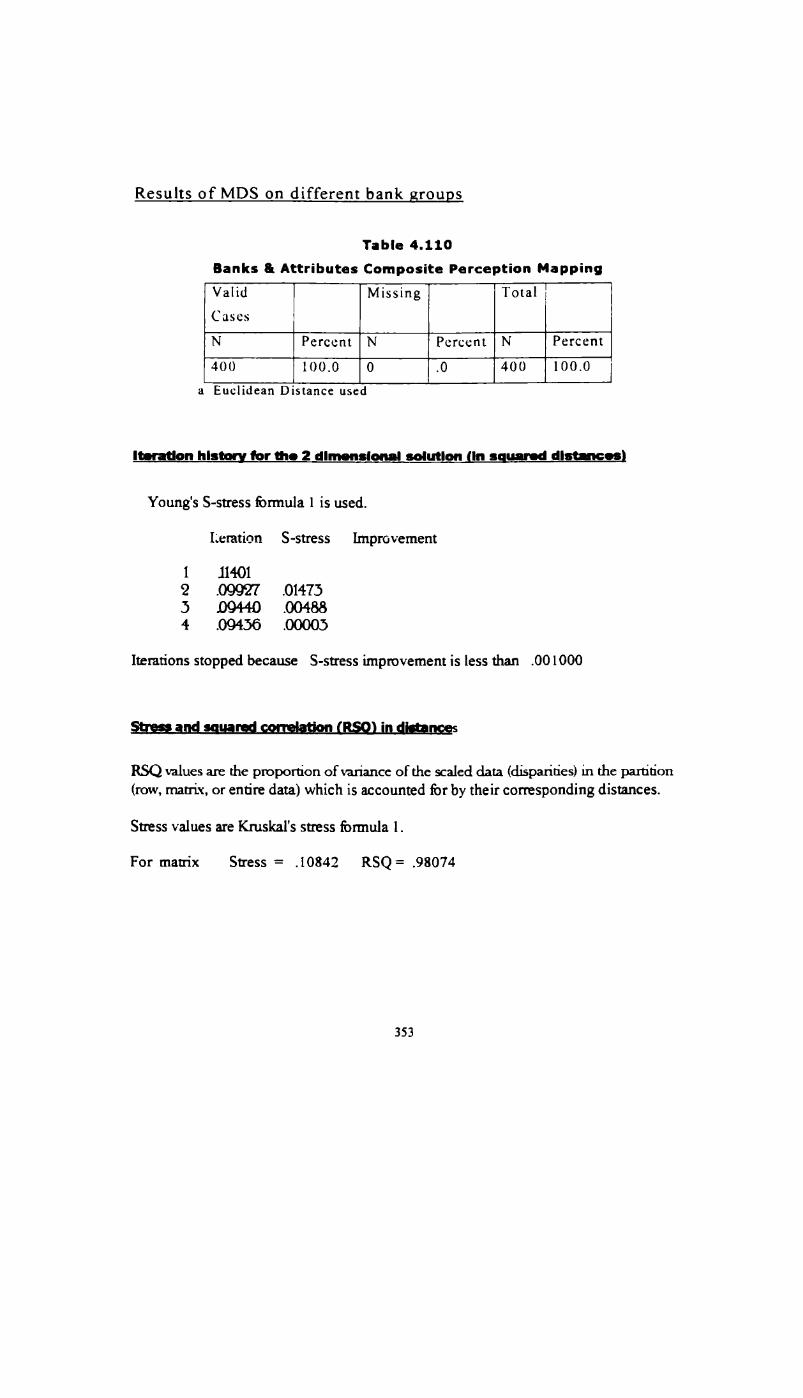
Results of MDS on different bank groups
Table 4.110Banks & Attributes Composite Perception MappingValid Missing Total ICases
N Percent N Percent N Percent400 l()0.0 0 .0 400 100.0
a Euclidean Distance used
Iteration his for the 2 dimensional solution In 3 uand distances
Young's S-stress formula 1 is used.
I‘.eratior1 S-stress Improvement
1 114019 099?? .0147?)3 D9440 004884 .0956 00005
Iterations stopped because S-stress improvement is less than .0O1000
RSQ values are the proportion of variance of the scaled data (disparities) i.n the partition(row, matrix, or entire data) which is accounted for by their corresponding distances.
Stress values are Kr'usl<al's stress formula 1.
For matrix Stress = .10842 RSQ= .98074
353

Table 4.111Configuration Derived in 2 Dirnensions
Stimuluscoordinates
Stimulus Stimulus Name DimensionNumber 1 21 PSB RETURNS OFFERED 0.7145 .52322 PSB SERVICE RANGE 1.0714 *0.42393 PSB BRANCH NETWORK 1.4390 0.96734 PSB CUSTOMER SERVICE 1.0640 0.43565 PSB SERVICE CHARGES 0.3239 90.53456 OPB RETURNS OFFERED 1.5492 -0.4477
*7” OPB SERVICE RANGE 1.6303 -0.35573 OPB BRANCH NETWORK 1.2730 ;.0.63099 OPB SERVICE CHARGES 1.6421 1.0239410 OPB CUSTOMER SERVICE [.6340 .-0.329411 NPB RETURNS OFFERED -1.3069 .0 .390312 NPB SERVICE RANGE .12332 I -0 .594013 NPB BRANCH NETWORK -1.2616 0 .336214 NPB CUSTOMER SERVICE -1.2685 0.624015 NPB SERVICE CHARGES -1.2779 I 0359216 PB RETURNS OFFERED -1.2964 _ -0.604317 FB SERVICE RANGE -1.3018 ‘ -0.602118 FB BRANCH NETWORK -1.2668 -0.662319 FB CUSTOMER SERVICE -1.2954 -0.623120 FB SERVICE CHARGES -1.2373 F -0 .5933
354

A>_ Efvusv
9.0 E; .2: ::..:::.3 mmz .2. :;:.SE 9. .: :::B=S mm; :a_§.e_o
3.65 xcup 0. wfvconmotou 233.. of o.au:u:_ 3:03 u_n_mo_: 3oZ
ow M. or. n. 3 m. c _. W ..
4_ . ; -. 2.
_
D ‘ _,_ M_ fozoc cucms pan 5 2.. 2&5 _
w 0 >. _._ 2...;
,_ Baum mE_...o_ ago __ ( V
1 omo.>.W%_._uoEo_m=u o
‘ III: II ||i :.--I. iflnoo
_
% ., _ §§w§.._
_ on.p§B§.uo£:3 _ - m
M _ mombuasacqxaaa _ __ m
M . >m..mc§%Em_
. __
I .- . - [ L I-iJ Kl. « I o.
_m_uoz 8cBm_o cmmu__u:m_
mB_.5_.E< cam mxcmm “.0 am: _m3amEmn_ - cozmSm_._Eou m:_:E:m nm>_.mo
an; «:3:
Z UO|_SU8l1.|_|fl

In the analyses done in earlier sections also it was seen that thecustomers of different bank groups perceived the level of customer
satisfaction. service quality dimensions, attributes of choice ofbanks. and other products of banks differently This is in support of
the second and third hypotheses considered for the study.Similarly, the customer profile of each bank group also varied. The
MDS also gives indications along the similar lines. But aninteresting observation is that what respondents thought about theoverall image of the bank was more important than the scores theyhad given for individual factors considered. In fact, the overallimage perceptions reflected significantly in the individual factorratings. Maintaining a favourable image, hence, would bebeneficial in generating initial acceptance for banks, especially, forthe new ones. It would help them in attracting potential customers.
4.4 Conclusions
It goes without saying that PSBs have a predominant influence over
the bank customers in general due to their wide reach and longexistence in the industry. Kerala has also several successful private
banks doing business since very long. The recent changes in theindustry has brought about more competitors like the new private
banks. Foreign bank also have been functioning in the state formany years. The analysis basically examined the perception of bank
customers about the different banks and their products and services.
The customer segment chosen for the study was the householdsegment. But other segments like NRIs, and Traders & SSI segments
were also considered for study in relation to a few aspects.Customers‘ perception about choice of banks, reasons for choices of
356

different banks, switching intentions, customer satisfaction, servicequality, factors which would influence choices in future, investmentin non-bank schemes. various bank investments and loan schemes,
etc., were studied. Further, the variations in customer behaviour
were analysed to develop possible segmentation strategies. Standardstatistical packages were used to test the significance ofrelationships between the variables considered in each analysis and.
in turn, to test the hypotheses. Descriptive methods were also usedto draw certain inferences. Initial analysis of bank choice showedthat PSBs have a predominant influence over the present preference
of respondents’ first, second and third choice of banks. OPBs have
also shown almost a similar pattern but to a lesser degree. SimilarlyCB5 are also popular as second or third bank among therespondents, obviously due to advantages enjoyed by them in the
case of certain products. Analysis of reasons of choice explains thatthe strong reasons are the 'nearness' aspect, followed by ‘betterservices’ and ‘safety’ of banks, in that order. ‘Safety’ was the mostimportant reason for the choice of other banks though it need not be
the single most important factor. Those other than PSBs scoredmore on the aspect of 'service' as a reason for choice of bank,whereas ‘safety’ and 'nearness' were more frequently cited forchoosing PSBs as MFBs. These implied that customers wouldexercise their choice of banks according to their specific needs.
It was further examined whether there is difference in theweightages assigned to the reasons for choice of MFBS and otherbanks based on Matched Pair Tests between weightages given fordifferent reasons for choice of MFB and other banks. It was
observed that the ratings for the ‘interest’ aspect for choice of MFB
357

were very low while it got a better score in the case of other banks.
The difference in the weightages obtained (statistically significant)
for the various reasons is also an implication of customers’ attitudeto search for other banks offering specialised services. Analysis ofdata on customer satisfaction showed that FBs and NPBs top in theratings though nearly 90% of the PSB and OPB customers aresatisfied with the banks’ services. But PSBs were rated the lowest
among the bank groups chosen for the study. Since the data obtained
was categorical in nature, Chi-Square tests was made use of toexamine the various factors and their dependence on bank groups,and, in turn, to test the hypotheses. Results indicated that there isdependence between bank groups and customer satisfaction levels or
it varied with respect to bank groups. Small banks like NPBs scoredbetter in customer satisfaction. These banks would try to attract the
segments with higher expectation on service levels, as it wouldhelp them to differentiate themselves from others. However,attaining more competitive efficiency is essential for PSBs as theynow have to face competition,from all the other banks and meet the
expectation of their customers who now have more and variedchoices.
Analysis of the various services offered by banks also suggestedthat, except for the core service like updating of pass books,customers experienced varying service quality levels with differentbank groups. Dissatisfaction is associated mainly with aspects likespeed, procedure and attitude. Technology adoption, hence, wouldbe a key aspect that decides customer satisfaction levels in future.
But for faster transactions, where deficiencies were expressed bythe respondents, branch automation both in the front and back ends
358

and networking need to be sped up. It is also evident from theanalysis that. in the case of services like collection of outstationinstruments, there is a wide gap between PSB and OPB group hers.It is inferred that NPBs and FBs have clearly demarcated theirposition in such services were technological support is essential.Results of tests done on service quality showed that dimensionssuch as financial guidance and assurance, complaint free processing
and speed were dependent on bank groups. The mean values of thefactors also indicated that perception of quality of services differfrom bank group to bank group.
Another notable observation made from the analysis is that thedimensions which varied were more or less associated with speed
and procedure in service processing. The correlations betweenindividual dimensions and overall customer satisfaction indicated
that perceived level of service excellence depends on howefficiently the various services are delivered. Business customers
were found to have needs different from the household segment,which have only limited and popular banking service needs. Thestudy results also showed that customer services offered to thissegment need improvements.
The study of bank switching patterns revealed that the bank grouplikely to be affected the most is OPB. The threat of bank switching
in PSB is not so serious. The high percentage of people who wanted
to switch from one PSB to another PSB indicated a competitionwithin the group. The increasing importance of CBS could be amatter of concern for PSBs and OPBs.
359

For choosing NPB, service quality was found to be the mostinfluencing factor. But it should be anticipated that, with more and
more banks going for ATMS. home-banking, and other electronicservices, chances are that the 'nearness‘ aspect would get redefined
as ‘easier access to accounts‘ through electronic services.
Examination of customers‘ choice perceptions showed that exceptfor factors like 'repute or image‘, 'nearness‘ and 'choose-onlyprivate-bank’ all other factors showed dependence with respondents‘
MFBs. Very evidently all respondents were in total agreement tochoosing a bank with better services.
On linking the aforementioned factors with customer profiles, byusing ANOVA tests, it was found that income can be used as a key
differentiating factor for identifying segments showing similarattitudes to the factors considered. Profession and education also
influenced certain aspects. However, the collective influence ofother elements cannot be ignored in defining groups with similarattitudes. Thus, MDS was used to see the positioning ofthe factorsand similarity of attitudes in choosing banks. The resultantperceptual mapping clearly demarcated the boundaries betweenmass banking and class banking. 'Returns', ‘presence of modernfacilities’, and 'repute’ of bank clustered in one quadrant of thematrix. The attitude of 'choose-only-public-sector-banks’ and‘nearness‘ formed another set of similar attitudes, though thefactors were not very closely positioned in the quadrant. Customerservice and multi-bank preference seemed to have similarinfluences.
360

The descriptive analysis to cluster the segments based on personalprofiles of different bank customers gave the following results.NPBs were found to be popular with private sector employees whohave professional education and fall into an income range ofRs.5000-20,000 per month. OPBs on the other hand are cateringmostly to non—professional educated people employed in private
sector in the income category of Rs.5000-10,000 per month. FB‘scustomers were mostly business people with an educational levelof graduation falling into the higher income group. With referenceto PSBs and OPBs it cannot be said that they do target marketing to
these segments. But NPBs and FBs have been using target marketing
since long.
Information derived from the investments of respondents indicated
that, though PSBs have more share in the total figures for eachcategory of investment, OPBs and CBS also enjoy almostcomparable popularity among the respondents. A notable finding isthat, in the case of schemes such as automatic renewal deposits,recurring deposits, and withdrawable deposits CBS have an edgeover PSBs. In long-term deposits (more than five years) PSBs have
a more than average market potential. The reason why withdrawable
deposits were much in demand shall be understood as the need forreturns coupled with convenience of withdrawability. Deposit based
loans are, hence, more likely to attract customers. Similarlyintentions of future investments explain that PSBS are likely tohave a higher share of 1-3 year investments. OPBs would get verylow preference compared to CBS when it comes to investing largeamounts. A close examination of the reasons for long-terminvestments for more than 5 years anywhere reveals that banks
361

were able to provide security, steady interim returns (promptpayment of interest) and easy withdrawability. Chitties and Kuriesare still popular in the state as seen from the high percentage ofrespondents (40.5%) who have invested in them. Besides. it wasalso found that there is regional variation in the investment patternof the respondents. The difference was obvious in the case of thedistrict of Thrissur.
The various analyses on investment behaviour of respondentsshowed that deposits are likely to remain popular with investors in
future. The features they want in any other non-bank investmentoption are the ones they associate very obviously with bankdeposits. However, CB5 would offer competition to other banks inthe case of deposits as well as loans as evident from therespondents’ preferences for these products. But, the study resultsdid not give any evidence for banks facing serious threat fromoutside the industry.
With regard to purchase of loans, it was found that 32.75% of therespondents had taken loans from CBS and 31.75% from othercommercial banks. A small percentage of respondents had also used
sources like finance companies or even private money lenders. CBShad relatively more share of the loans taken by respondentsfollowed by PSBs. PSBs were depended mostly because ofthe lower
rates of interest offered by them. On the contrary, all the privatesector banks (OPB, FB and NPB) were approached because of their
fast processing capability on loan applications, though only fewpeople approached them for loans. CB5 were also perceived to have
quick processing capabilities in the case of loans. Among both the
362

PSB and OPB customers a significant percentage have sourced CB5
for loans, though the percentage is very high for OPBs. ThoughOPBs have been perceived favourably in terms of processing ofloans and attitude of bank staff, it has not influenced the actualpurchase of the product. A possibility is that they target at highvalue loan segment and are not very aggressive in selling credit tohousehold segment.
Finally, an MDS on certain key tangible variables with whichpeople may compare the different bank groups was performed tounderstand their relative positioning. Respondents‘ overallperception about any bank group got reflected in their scores for thedifferent factors in relation to each bank, clearly indicating thatthey see each of the bank groups differently. In fact the overallimage perceptions reflected significantly in the individual factorratings. This illustrates the importance of maintaining a favourableimage that would be largely beneficial in generating an initialacceptance for the banks, especially for the new ones.
363

CHAPTER 5
CONCLUSIONS AND RECOMMENDATIONS
Banking industry in lndia is undergoing rapid transformationthanks to the changes in the governmental policies and theoverall wave of deregulations. lts reflections have also beenexperienced in the state of Kerala as is visible from theemergence of many new private banks and the current pace oftheir expansion to semi-urban areas in the state. In the earlierdiscussions it was pointed out that there are specific dimensionsto the banking environment in Kerala. Banks in the state haveenjoyed considerable popularity, mainly due to higher literacylevels. highly monetised economy, good network of roads andcommunication system, saving affinity of people and above all,the large inflow of funds from the non-resident Keraliteworkforce. The very same factors have also been responsible for
the predominance of regional and communal banking in theprivate sector. These factors of socio-economic developmentmight also help develop substantial potential for class banking inthe state in future. This research study and therefore, the analyses
done in the previous chapter were done against this backdrop.The results indicate strategy implications for the bankingindustry in Kerala.
In the pre-reforms phase of banking industry customers wouldhave had undifferentiated perception about the different playersin the industry. Perhaps, the only key segmentation dimensionwas geographical which, to some extent, was communal. The
364

freshly induced competition in the industry has, however.necessitated evolving segmentation strategies based on servicequality levels. electronic facilities, degree of conveniencerequired and core competencies in certain areas of products andservices. These strategies are not only used by the new banks butalso by PSBs and OPBs in selected cities.
Competition motivates the players to innovate and improve.enlarge the product mix, offer products at competitive prices andadopt technology solutions in line with the changing demands ofthe customers. The generic nature of the banking services mayhence wane out gradually to evolve distinct segments. But, suchsegmentation practices and building up of distinct images forbanks may require sound backing of market information,particularly information on customer perceptions. The presentstudy provides some insight into this aspect of bank marketing.
The overall objective of the study was to examine the existingperceptions of customers in the household segment with respectto major bank groups. This was done by evaluating theperceptions of respondents about a set of aspects such as bankselection, customer satisfaction, service quality, choice of certainkey products and services and external competition. Conclusionsand recommendations resulting from the examination of theaforementioned aspects in the study are presented underappropriate headings.
5.1 Bank Choice of Customers
Competition can offer customers flexibility of choice from avariety of products. So far, the generic nature of banking services
365

or products had, to some extent, rendered the choice processmeaningless. But in a competitive environment, differentiationmay be effected by creating distinct images, varying servicequality levels, strategic location of offices and achieving corecompetencies in certain segments. This is precisely what therecent reforms in the industry have aimed at. The study evaluated
the choice behaviours of respondents in relation to theirfrequented banks, other banks chosen for specialised services,anticipated switching preferences and attributes influencing suchchoice behaviours.
The initial analysis of current bank selection obviously showed
the predominance of PSBs and their general popularity in theindustry, though it may be largely attributed to their wide spreadof branches. But a large number of customers preferred to choosemany banks at the same time. Examination of these multiplebanks-choice behaviour of the respondents showed that even intheir first, second and third choices of banks, PSBs had themaximum share than other bank groups. OPBS also gave almost a
similar pattern but had a lesser share than PSBs in each case.Obviously, PSBs have more chances of getting included in acustomer's multiple banks-selection than other banks.
Almost 70% of the respondents had a second bank. Study ofmultiple selection of banks hence assume more importance since
customers consider more than one bank for getting specialisedproducts and services that satisfy their various financial needs.The relation between choice of bank for regular dealings andother purposes were also subjected to study. The popularity ofCBS as a second or third choice among major bank group
366

customers, especially, among OPB customers is notable. ThoughCB customers were not deliberately included in the sample, asignificant percentage of PSB (29.72) and OPB (39.02) customers
(interacting regularly with these banks) were dealing with CBS,
possibly for loans. deposits or any specialised service. This is anindication that CBS are able to attract a significant percentage of
other bank customers towards certain specific products orservices. Interestingly. very insignificant percentage of the totalrespondents had chosen CB5 as their MFB. However, sinceaspects of customer satisfaction or service quality levels in CB5
could not be studied as part of this research, the reasons for the
choice of CBS cannot be explained. But, examination ofpreference for loans did indicate that lower interest rates and fast
processing of CB5 had attracted a large number of respondents.Similarly, CB deposits have also attracted almost 30% of thetotal respondents.
Among NRls and Traders and Small Scale Industries segments
also PSBs dominated. Seventy percent of NRI respondents and60% of the Traders and Small-Scale Industries respondents were
dealing with PSBs. Among NRIs a significant percentage hadinteractions with both PSBs and FBs, possibly due to the directremittance facilities offered by FBs in selected places outsideIndia.
The most popular bank combination in multiple bank selections
of the household segment respondents was the PSB-OPBcombination. However, the ratio of OPB customers dealing with
PSBs was higher compared to PSB customers dealing with OPBs.
This indicated that PSBs may be used more as a reference bank
367

from where diversions may be thought of by customers forspecialised services. PSBs, thus. seem to enjoy the image of a‘leader’ in the market. Findings from the study of switchingpattern underscore this conclusion. Majority of PSB customersmay choose yet another PSB in future too. PSBs may strengthen
their ‘convenience’ image by offering a wide line of low valueadded products and services. The present strategy oftargeting athigh volume-low price or low margin-mass markets witheconomies of scale and low service efficiency seems to be goodenough in the immediate future. The extent of threat as visiblefrom the various analyses in the study do not provide strongevidence against such a strategy. Conclusions resulting from thestudy of switching preference gave more information on thenature ofthreat, which is explained later in this chapter.
5.2 Reasons for Choice of Banks
With regard to the analysis of the reasons for choice of MFBsand other banks, 'nearness' was undoubtedly the major reasoncited by the largest number of respondents followed by ‘service’and ‘safety’ for choosing MFBs across all segments considered in
the study. ‘Safety’ was the most important reason for the choiceof other banks though other reasons such as ‘nearness’ ‘service’
or ‘returns’ may also be considered simultaneously, with varying
degrees of importance according to the needs. Further analysis of
choice of specific bank groups as MFBs revealed that those other
than PSBs scored more on the aspect of ‘service’ as a reason forchoice whereas ‘safety’ and ‘nearness’ were more frequentlycited for choosing PSBs. This is yet another finding that supports
the argument that bank groups other than PSBs may have to offer
368

some extra advantage in some respect to attract customers.Therefore, they will have to keep an edge over the PSBs inproviding better services to their customers to keep up withcompetition. Further. clear evidence in support ofthis aspect was
obtained from other areas of the research study also. It wasobserved that the scores for the ‘interest’ aspect for choice ofMFB were very low while it got a better score in the case of other
banks, but not very significant compared to the scores for otherreasons. Hence, it is evident that the reason why a particularbank is selected for regular dealings is associated more with theconvenience factors. Mostly, convenience is offered as a package
of aspects such as branch location, wide range of services andcomparable rates of interests. In an industry where competition
is appearing only gradually any bank would be able to offer what
a customer wo-.I.'d expect in terms of the aforesaid factors unless
the customer is in need of a specialised product. Service aspectmay be the only factor that can create a difference between onebank and another.
With regard to the weightages assigned to the reasons for choiceof MFBs and other banks which was examined using MatchedPair Tests, the differences in the weightages obtained(statistically significant) for the various reasons impliedcustomers’ attitude to search for other banks offering specialised
services. Low weightages obtained for ‘image’ is also noteworthy.
‘Image’ as a single factor need not get evaluated while choosingone's bank, but image may be perceived as a composite factorinvolving a few key reasons. However, this observation need not
lead to the conclusion that image building up will not helpmarketing of a bank's products and services. Messages about
369
image of banks may be translated to involve those key reasons.viz., 'convenience', ‘better service’, ‘safety’ and 'overallefficiency‘ The difference in the ranks obtained for the variousreasons for choice of MFBs and other banks further indicate that
customers might maintain dealings with different bank groups infuture too. This also indicates that there exist ample potential for
different bank groups to target market their core products andservices. Banks can also try to defend and develop the existingtarget segments to strengthen their presence in such targetmarkets. Such core competencies involve operationalflexibilities, motivation of staff, higher levels of service quality
and efficiency, and highly competitive pricing options. TheNPBS-the new entrants in the industry are more likely to target
these segments, which need a higher level of service. PSBs arenow experiencing an increased pace of service quality up-scalingand overall efficiency enhancement, thanks to the imminentthreat of privatisation that will force them to be on their feet likeany other player in the industry. Analysis of customersatisfaction also gave some indications that customer serviceshould improve in PSBS.
5.3 Customer Satisfaction
PSBS were rated lower than other bank groups in overallcustomer satisfaction levels. FBs and NPBs topped in the ratings,
though nearly 90% of PSB and OPB customers are satisfied with
the banks‘ services. However, statistical analysis of the dataindicated that the variations in customer satisfaction were
significant. This supports the hypothesis that level of customersatisfaction vary according to bank groups. Small banks likeNPBs scored better in customer satisfaction. These banks might
370

try to attract the segments with higher expectation on servicelevels as it would help them to differentiate themselves fromothers. Banks. which are of the same stature, as SBI or majornationlised banks, cannot be compared with smaller banks since
there are considerable disparities in the objectives ofthe formerand the latter. Besides, all banks are not functioning on a levelplaying field. However. as mentioned above. attaining morecompetitive efficiency is essential for PSBs since they now. have
to satisfy their customers who have more exposure and accessto competitive products and services offered by other banks.
Analysis ofthe various services offered by banks also suggested
that except for the core service like ‘updating of pass books‘,customers experienced varying service quality with regard tocertain important services with different bank groups. The results
of the statistical tests showed dependence between bank groupsand levels of satisfaction with respect to the different servicesgenerally offered by banks. The ratings for PSBs were lower for
these services too. Interestingly OPBs were rated lower thanPSBs for services like ‘issue of DD’ or ‘collection of outstation
cheques’ NPBs and FBs also obtained lower scores for theseservices than what they got for others. It was evident from theanalysis that services like ‘collection of outstation instruments’
there exists a wide gap between PSBs or OPBs and others.Another service for which level of satisfaction showeddependence with bank groups was ‘cash transfer‘ Dissatisfaction
in these services may be associated mainly with aspects likespeed, procedure, and attitude. A critical element in determining
service quality would be speed of service delivery. Analysis ofvarious services also indicated that speed of processing could be
371
a differentiating element among bank groups. The presentemphasis on computerisation and automation in PSBs and OPBs
is expected to improve, this aspect. But, if fund transactions areto improve branch automation both at the front and back endsand networking should progress almost simultaneously. Noncomputerised banks may considerably drag fund transactions or
any other service, which require inter-bank transactions.Computerisation of branches is only a first level hurdle for PSBs.
To face challenges posed by NPBs, PSBs will have to speed uptheir networking to enable ‘anywhere banking‘ Further, the lag incomputerisation may also involve risks such as difficulty inmanagement of assets and liability. It is obvious that NPBs andFBs have leveraged on services where technological support isessential. In fact, they have been creating the convenience andservice quality image since their inception. For instance, in credit
card services also, they were rated better. This is also one areawhere technology adoption can improve efficiency considerably.Technology adoption, hence, would be a key aspect that decides
customer satisfaction levels in future. Though more services were
included in the questionnaire, a large number of no answers forcertain services restricted a detailed analysis of all the servicesconsidered.
5.4 Service Quality Dimensions
Customer satisfaction may also be evaluated in terms of overall
service quality perceptions. Moreover, the reasons for varyinglevels of satisfaction for different services can also be explained
using these quality dimensions. In banking, measurement ofservice quality is a difficult process due to its complex multi

service nature. However, the study used some key dimensionssuch as financial guidance and assurance, friendliness of staffand counter services. complaint free processing. speedyprocessing, and reliability of accounting, for the purpose ofmeasuring the overall quality perceptions.
Results of statistical tests done on service quality dimensionsshowed that dimensions such as financial guidance and assurance.
complaint free processing, and speed were dependent on bankgroups. This validated the hypothesis that service quality varyamong bank groups. The mean values of the factors alsoindicated that perception of quality of services differ from bankgroup to bank group. Standard deviations for the variousdimensions for FB and NPBs were lower as compared with that of
PSBs. It is an indication of consistency of services in FBs andNPBs but it could also be attributed to the heterogeneous natureof customer segments in PSBs. A notable observation made fromthe analysis was that the dimensions which varied were more or
less associated with speed and procedure in service processing.Service quality gets evaluated by customers in terms oftangibleas well as intangible variables such as consumption time, waiting
time, physical surroundings, staff attitude, attentiveness,knowledge or professionalism. But evaluation of time is easierfor customers than it is for other dimensions. Taking into view
the aspect that speed may also be associated with lengthy orinflexible procedures, developing efficient service processingsystems and procedures deserves almost equal attention asautomation and networking. In other words, systemic changes inachieving improvements in ‘business processes‘ should go hand
in-hand with computerisation.
373
The dimension, viz., financial guidance and assurance, whichmay not be directly related to the actual service delivery, wasrated low compared to other aspects for all bank groups. This, infact, plays an important role in cross selling of different products
to the existing customers. Banks would be able to do thiseffectively by utilising customer databases containing details ofproducts purchased earlier. frequency of purchase and personalprofile. Computerisation in banks would bring in the capability
of real-time data acquiring, quick analysis (processing) andtimely management information reporting. This will go a longway in facilitating strategic marketing planning. However,improvement in work culture cannot be taken for granted in the
light of the above findings since it has been observed in earlierstudies that habitually, customers do not like tocomplair. aboutemployee attitude. In this study also, it was found that customers
do not perceive significant difference in the attitude of staff indifferent bank groups. In fact, it may not get evaluated with the
same importance as speed or convenience is evaluated. Besides,
the correlations obtained between individual service qualitydimensions and overall customer satisfaction clearly indicatedthe influence of staff attitude on overall customer satisfaction.
Perceptions about different service quality dimensions mayhence reflect in the overall customer satisfaction levels. Use of
technology should hence lead to development of efficientsystems of service delivery as well as value addition tocustomers and information systems for management. There have
been several policy initiatives from RBI to correct and improvesome specific service formats such as issue of drafts, chequebooks, balance enquiry, etc. Fast processing and value added
374

services are also provided by PSBs in selected urban centers inorder to reduce delay in services. Customer quality measurement
systems should also be in place to evaluate service quality on aregular basis.
Business customers have specific needs which are somewhatdifferent from household segment with limited and mostlypopular banking service needs. The study results show thatcustomer services offered to this segment need to be improvedconsiderably, especially, with respect to fast collection of funds,
complaint free processing and assistance in providinginformation. In this segment, a comparison was done betweenOPBs and PSBs. OPBs were rated higher in all aspects exceptfast transaction of funds, though variation was significantstatistically in only the case of complaint free processing. OPBswere rated higher in this aspect. OPBs seem to experience somedeficiencies in fast transaction of funds as seen from the results
of both household and business segment, possibly due to weaker
networking than PSBs. Overall ratings for different services,however, point to the need for more attention towards thissegment and possibilities of target marketing.
Findings of the statistical analysis of customer satisfaction onvarious services and service quality dimensions thus supportedthe hypothesis that levels of satisfaction depend on bank groups.
Variations within the groups were not, however, considered forthe study. The recent national banking statistics (March 2000)reveal that the NPBs are slowly eating into the market share ofPSBs, though PSBs have also recorded better profits than lastyear.‘ This is with reference to business in urban centers and
375

more so in relation to the corporate customers who needtechnology oriented services that would be directly linked totheir internal systems. But, it can also transform the demands ofpersonal banking segments since the latest statistics of costs oftransactions indicate that electronic and internet banking canreduce the cost per transaction by almost 50-70% or even less. In
Kerala, electronic banking is only picking up slowly. that too inurban centers only. But the current emphasis on automation isunavoidable in the industry, especially for bigger banks, thanksto a multitude of reasons like, bringing more transparency totransactions, ensuring security and preventing frauds, increasing
the efficiency in management of funds and the need for to matchwith global standards.
5.5 Bank Switching Behaviour
Respondent's bank switching preferences were also subjected toanalysis with a view to examine whether the variations incustomer satisfaction levels provided a sufficient reason for bank
switching behaviour of different bank group customers. Thisanalysis gave some results indicative of future trends. Theanalysis was done with reference to past and future switchingbehaviours of respondents. Past behaviours of bank switchingdid not give any significant reason other than locationaldifficulties. With regard to future preferences in switching, thebank group likely to be affected most was found to be OPB.Fifty four percent of respondents in OPB group would like tochange to other banks and 16% to another OPB. The threat ofbank switching in PSB is not as severe as it is for OPBs.However, the high percentage of people who want to switch from
376

one PSB to another is an indication of competition within thegroup. At the same time, CBs were found to be gaining popularity
among both PSB and OPB customers. Very few customerswanted to hop from NPBs and FBs. ‘Better service’ and 'nearness'
were the most frequently cited reasons for switching from onebank to another. OPB customers were more inclined to banks
providing better services. In their present choice of an OPB,‘service’ was found to be more important than ‘nearness' Itshould also be noted here that OPBs were rated above PSBs in
customer satisfaction. But, interestingly, majority of those whowant to change from OPBs had chosen a PSB. However, among
those who wanted to come to OPBs 45% gave ‘better services‘ asthe reason whereas ‘nearness’ was the most frequent reason for
choosing a PSB. Possibly, OPBs may be providing more attention
to specific segments such as business/trade/private sectoremployees with higher levels of expectation of customersatisfaction. ‘Safety’ was another significant reason for changingover to PSBs. However, OPB customers are likely to change to
banks offering better services. A possible inference from theabove finding is that new private banks who use aggressivepromotional efforts to attract customers can successfully targetmore OPB customers than any other group since they show ahigher inclination to the service aspect. From PSBs also a smallpercentage of customers want to change to NPBs. Further, forchoosing NPBs, service quality was found to be the mostinfluencing factor. Similarly, CBs also have a potential forattracting both PSB and OPB customers. On the whole, it isinferred that each bank may have to strengthen its competitiveedge and pitch in for more market segmentation. Cross selling to
existing customers can effectively check switching of customers.
377

This may require aggressive selling efforts. However, overallefficiency and enhancement of service quality, of which‘nearness‘ is also a component would matter the most in futurebank selections by customers.
Other reasons given by the respondents were not verysignificant except in the case of CBs wherein higher returns had a
significant influence. Important reasons for changing from PSBand OPB remained almost the same though the wieghtages varied
in a close range. But a conclusive remark such as 'PSBs arechosen for nearness' aspect and 'OPBs for service‘ cannot bemade.
It is quite possible that respondents might have preferences forindividual banks. Among the PSBs, SBT and S31 were the mostsought after while Federal Bank was the most preferred amongOPBs implying that performance and efficiency are the criteria ofchoice. ‘Nearness' and ‘better service’ may have more or lessequal importance in choosing the bank as long as the bank enjoysa good image in the market, which is attributable to its overall
efficiency. However, the findings need to be analysed in the light
of the recent changes in the industry too. It is anticipated thatwith more and more banks going for ATMS, home banking andother electronic services that can be operated from home, chances
are that the 'nearness' aspect might get redefined as the need for
quicker and easier access to accounts through electronic services.
Respondents‘ overall attitude towards computerisation andservice quality enhancement was also examined in this context.
Over ninety percent respondents said computerisation is needed
378

and nearly 90% thought that improvement is required to reducethe waiting time. More than 60% wanted extension of banktimings beyond 2 pm on week days and almost 40% wantedSunday banking for a few hours. All the above customeraspirations suggest that in future service aspect would get agreater priority among a significant percentage of bankcustomers.
5.6 Customers‘ Choice Perceptions
A different type of analysis was used to study customerperceptions about some leading attributes of choice of banks infuture. Possible attitudes were indicated using certain definitivestatements, which were to be rated by the respondents. Theattributes that were used included 'repute or image‘, ‘returns’,‘choose-only-PSB', ‘choose-only-private-sector-bank’, 'nearness',
‘presence of modern electronic facilities‘, ‘choose multiple banks‘
and 'customer service’ Dependence between ratings for thesefactors and present choice of MFBs of respondents were studied
to observe possibilities of segmentation based on attitudes. Laterthe data was also linked with the personal profile of therespondents to obtain customer clusters with similarcharacteristics.
Examination of customers‘ choice perceptions showed that except
for factors like 'repute or image’, 'nearness' and ‘choose-onlyprivate bank‘ all other factors had dependence with respondents’
MFBS. This supports the hypothesis that the factors influencingcustomer's choice perceptions are dependent on their presentMFB selections.
379
Very evidently, all respondents were in total agreement tochoosing a bank with better services. OPB customers showedmore inclination towards higher returns. This should be thereason why an OPB is selected as a second bank by a largenumber of respondents. However, no bank group was in strongagreement with choosing a bank based only on higher returns.NPB customers were the least influenced by returns; quite likely
for regular operations they may need quick service.
Analysis of data on the attitude ‘will-choose-only—PSB' revealed
that no bank group respondents had any strong agreement to thisattitude, though PSB group was fairly positive to it. Majority of
OPB customers had disagreement to this attitude, which largelysupports their present choices. Quite surprisingly, 72% of NPBcustomers were in agreement with choosing a PSB though, atpresent, they had more dealings with OPBs than with PSBs. This,
in fact, could not be explained with whatever informationobtained from the study. However, the overall ratings showedthat 60% of the respondents disagreed to the statement implying
that efficiency and performance of individual banks will carrymore weightage in the selection process. Similarly, with regard to
'choosing-only-private-sector-bank‘ attitude respondents were not
in agreement, particularly NPB and FB customers stronglyopposed it. It cannot be inferred that they regret over theircurrent choices since evidence from customer satisfaction and
bank switching analyses give us a totally different pictures. Itmay be that they critically evaluate their choices, especially inrelation to certain specialised services they need from suchbanks. The degree of requirement for modern banking facilities
380

was higher among NPB customers too. OPB customers were not
much attracted by electronic facilities while PSB customersshowed mixed responses. Certain segments exist which needsuch services at present. But as is evident from the findings ofattitude to computerisation, customers would be more interestedin their present banks introducing such facilities.
The aspect of ‘nearness’ had strong influence for all the bankgroups though a significant percentage of the respondents wereneutral to the statement. OPB and PSB customers preferredchoosing multiple banks whereas FB and NPB customers were
less particular about dealing with many banks, may be due to awide range of services offered by their banks. In the case ofcustomer services, all bank customers were in total agreementand statistical analysis did not show dependence between thevariables too. An interesting observation in the whole analysis is
that PSB respondents had comparatively less strong attitudetowards all factors, an indication that people with strong attitudesmay be the ones who choose other banks. PSBS and theirstandards would remain the bench marks for comparison orevaluation for those who may choose to switch banks. Hence itfollows that other banks trying to attract PSB customers willhave to far exceed what PSBs are able to give in terms of service
quality, value addition, product innovation, and overallefficiency.
To arrive at groupings based on attitude sets that may havesimilar influence on choice of banks, a multidimensional scaling
was done. The perceptual map obtained thus gave four groupings
of similar attitudes. ‘Returns’ along with ‘presence of modern
381

facilities‘ and ‘repute of bank‘ clustered in one quadrant of thematrix. The attitude of ‘choose-only-public-sector-banks‘ and'nearness' formed another set of similar attitudes, though thefactors are not very closely positioned in the quadrant. It couldbe inferred that PSBs still enjoy popularity among people whosecriterion of choosing a bank is mainly ‘nearness‘ of the bank.One of the indications of the pattern of clusters is that peopledo not favour choosing only a private bank. Indications are thatprivate sector banks may have to attract customer groups withstrong agreement to certain factors such as need for electronicfacilities, high returns and better image, all to be achieved with
the help of aggressive selling efforts. Therefore, private sectorbanks may have to differentiate themselves from others in themarket. 'Customer service’ and ‘multiple bank preference’ seemedto have similar influences. It is ;-vident that PSBs are seen as
neighbourhood banks. The factors, ‘returns’, ‘modern banking
facilities’, and ‘repute’ are having similar influences over agroup of respondents. They are quite likely to be NPB/FB/OPBcustomers. The segment that had similar influences on multiplebank preferences and customer services may be the one withhigher levels of expectation on customer satisfaction. Anyindividual bank may‘not be in a position to satisfy a variety ofneeds of a customer. This is due to the wide varying nature ofproducts and segments and hence customer would prefer to dealwith many banks to satisfy their needs. It also follows that each
bank group or bank should try to develop core competencies incatering to specific segments. Certainly, the perceptual mapdemarcates the boundaries between ‘mass banking’ and ‘classbanking’ as evidenced by the groupings obtained in the map.

5.7 Customer Segments and their Characteristics
The aforementioned factors influencing the choice of banks were
linked with customer profiles by using ANOVA tests to evolvepossible segmentation dimensions. Age had significant(statistically) influence on attitude towards factors like returns
and repute. Age group 40-45 and 50-60 had strong concern forrepute and 35-45 had very strong concern for returns. It was theyoung people in the age group 20-25 who had strong attitudetowards presence of electronic facilities. The young showedsomewhat a different preference in comparison to others.
Significant variation was found between men and women in theattitude towards ‘returns’, ‘electronic facilities‘, and ‘multiple
banlr preferences‘. Women respondents had not so strongerattitude to all these factors. Women seemed to be concerned more
about ‘repute’ of the bank and had stronger attitude to PSBs.
Similarly, significant variations were found among differenteducation groups in factors such as ‘repute’ and ‘modernfacilities’ The factors, ‘repute’, ‘returns’, 'choosing-only-public
sector-bank', ‘modern facilities‘, ‘multiple bank preferences‘ and
‘customer service‘ showed a linear relationship up to degree orpost-graduation levels and declined marginally at higher levels.From the correlations between different factors and educational
groups it could be inferred that the need for each factor alsoincreased except ‘returns’ and ‘choosing-only-private-bank‘attitude. The indifference to returns may be due to parity ofinterest rates in almost all banks. The inference from thecorrelation suggests that people with higher education may be
383

very critical in the choice of their banks. Among differentoccupational groups the factors. ‘returns’, 'choose-only-publicsector-bank' attitude and ‘customer service’ varied significantly
People employed in the private sector had stronger attitude to a
number of factors except, nearness and 'choosing-only-publicsector-bank’ attitude. Business people's inclination to multiplebank preference was very obvious. Similarly governmentemployees were more likely to be influenced by ‘choose-onlypublic-sector-banks' attitude and 'nearness' factor. Occupationcan be used as a possible dimension for segmentation. Similarly,
income was also found to have significant influence over thefactors considered and can be used as a key differentiating factor
for identifying segments showing similar attitudes.
Lower income groups in the study were more influenced by‘repute, 'returns', and 'preference for PSBs' Customer service and
electronic facilities were more important for the income groupRs.10,000-20,000 per month. Higher income customers weremore inclined to choose multiple banks.
The descriptive analysis to cluster the segments based onpersonal profiles of different bank customers gave the following
results. NPBs were found to be popular with privatesector employees who have professional education and fall within
the income range of Rs.5000-20,000 per month. OPBs, on other
hand, were found to be catering mostly to non-professionaleducated people employed in private sector in the incomecategory of Rs.500C-10,000 per month. FB's customers weremostly business people with an educational level of graduationand falling into the higher income group. PSBs have been
384

following a mass marketing strategy in the household segment tillvery recently. However, of late, many personal banking branches
were started in major centers to attract the class bankingcategories. NPBs and FBs were already using segmentationstrategies. The dimensions that have emerged from the studycould be used to attract specific customer segments both in terms
of product design and marketing communications Similarly,certain attitudinal indifference to factors such as choice of PSB
or OPB among certain segments may also be removed and mademore favourable by suitable marketing communication andoverall efficiency enhancement.
5.8 Choice of Long-term Investments
Segmentation in banking industry is also possible based on theneed for specific products. Further, choice of a particular bankmay be related to the need for a specific product also. Analysis of
the investment pattern of respondents might give moreinformation about such choices. Information derived from the
investments of respondents indicated that, though, PSBs havemore share in the total figures for each category of investment,OPBs and CBS also enjoy almost comparable popularity amongthe respondents. A notable finding is that in the case of theschemes such as automatic renewal deposits, recurring deposits
and withdrawable deposits CB5 have an edge over PSBs. In long
term deposits (more than five years), PSBs have a more-thanaverage market potential. In long-term investments, security may
be a concern and hence PSBs may be chosen. A recent study of
investment behaviour of people suggests that bank deposits are
the favourite investment option of the people. The reason why
385

withdrawable deposits were much in demand shall be understood
as the need for returns coupled with convenience ofwithdrawability. Deposit based loans are hence more likely toattract customers. Similarly intentions of future investmentsexplained that PSBs are likely to have a higher share of 1-3year investments. Though there is a slight possibility of PSBsbecoming less attractive for long-term deposits they still may get
the maximum share. OPBs may get very low preference compared
to CB5 when it comes to investing large amounts. On the whole
banks seemed to have a predominant influence over theinvestment decisions of people. Only less than 10% ofrespondents considered a non-bank investment option. For longer
terms still fewer people opted for a non-bank investments. Suchinvestment decisions may involve a great deal of informationprocessing and customers may need considerable help. Foranother query on how respondents processed information given inadvertisements, about 60% said that they try to understand thedifferences in claims of returns and interest rates only if they had
immediate plans to invest. Over 60% depended on word-of-mouth
communications before they chose any such plans. An inference
for marketing of non-bank schemes is that generating word-ofmouth pubiicity for the financial products may be more effectivein the promotion of such products than advertisements.
A close examination of the reasons for any long-tem investmentfor more than 5 years revealed that banks are able to providesecurity, steady interim returns (prompt payment of interest) and
easy withdrawability. Obviously, the highest ranking factors arein fact, less attractive with banks. If non-bank investments can
combine the leading attributes of bank deposits such as
386

simplicity. security. easy accessibility, easy processing, andliquidity they may also be able to attract common depositors.
Current investments in non-bank schemes showed that most
popular schemes were LIC. Medical insurance. Chitties/Kuries,
and PPF The most frequent reasons indicated by respondents are
either returns or liquidity for such investments. Governmentrelated schemes were more in demand than other products suchas shares. debentures, or mutual funds. But among NRI segment,
more people had invested in such products. There were alsoregional variations observed in the case of certain products,especially, Chitties and Kuries, unique products of the statewhich still enjoy popularity in certain parts of the state as seenfrom the high percentage of respondents in Thrissur District whohave invested in them.
Analysis of aspects like respondents‘ behaviour with respect toinvestment in bank and non-bank schemes, need-basedinvestment planning, and current pattern of investment in nonbank investments, lead to the conclusion that bank deposits arelikely to remain popular with investors. The features they want in
any other investment options are the ones they associate veryobviously with bank deposits. Though CB5 were found to begaining popularity the apprehensions about banks facing severe
threat from outside the industry are out of place.
6.9 Choice-Behaviour for Credit Products
Marketing of loans and attitude to purchase of loans bycustomers assume altogether a different dimension than selling
387
investment products. Further, banks are subjected to a host ofnorms and restrictions in selling credit products. Thoughhousehold segment do not offer much potential for disbursing the
credit, from the perspective of customer satisfaction, how thebanks are able to lend effectively also assumes almost equalimportance. The study on perception about loans did not support
the general view that people are reluctant to take loans frombanks. The results also showed that 32.75% of the respondentshad taken loans from CBS and 31.75% from other commercial
banks. A small percentage of respondents had also used sourceslike finance companies or even private money lenders. The splitup of the reasons for choice of bank for taking loans revealedthat PSBs were depended mostly because of the lower rates ofinterest offered by them. On the contrary all the private sectorbanks (OPB, FB and NPB) were approached be..ause oftheir fast
processing capability on loan applications. For CB5 also, this was
cited as the second frequent reason. Among both the PSB andOPB customers a significant percentage have sourced CBS fordebts. though, the percentage is very high among OPBs.Popularity of CBS for loans was also evident in another analysis,
which used rankings for the different sources ofloans. But it maybe taken into consideration that CBS have some advantage inensuring the repayment of loans and recovery as well.
Interestingly OPBs have been perceived favourably in terms ofprocessing of loans and attitude of bank staff in dealing withthem, though it might not have influenced the actual purchase of
the product. It may be that OPBs lend selectively to high valueloan seekers like business customers who would not be too much
concerned about the higher interest rates, but be more particular
388

about fast processing and the availability of adequate loans. But,
among household segments, lower interest rate seemed to be the
strong reason and hence the determinant dimension of choice.The findings also lead to several inferences about customerbehaviour in the industry All bank groups are able to cross selltheir credit products to some of their customers but there isobvious indication that customers will search for less expensiveand easily available loan sources. Banks can identify segments.
which might require loans by making use of customer profile data
and cross sell their credit products effectively This mightdemand development and maintenance of customer databases.Details of past records of customers’ repayment behaviours maybe stored in central databases to avoid mistakes in lending todefaulters. Computer networking may largely help in sharingsuch information among different banks. The foregoingconclusions made from the different analyses suggest thatcustomers have distinct reasons for choosing different banks fortheir credit needs.
6.10 Overall Perception of Customers about Bank Groups
The general perception of customers about different bank groups
gave important indications for strategic planning of banks. Amulti- dimensional scaling on certain key tangible variables with
which people may compare the different bank groups wasperformed to understand their positioning. Interestingly,respondents’ overall perception about any bank group gotreflected in their scores for the different factors in relation to
each bank group. This clearly indicated that customer perceptions
about different bank groups vary validating the last hypothesis
389

considered in the study. In fact, the overall image perceptionsreflected significantly in the individual factor ratings. This would
mean that people may continue to judge banks with the overallperception of image they have about a bank. Therefore, it isimportant for banks to create and promote favourable image inthe market. which would give each bank a distinctive edge to besuccessful in an emerging competitive environment.
Favourable perceptions about certain key factors like ‘returns’
and ‘customer service’ enjoyed by NPBs and some of the FBs,who are relatively new entrants, may be utilised for effectingsuch differentiation. Further, these bank groups have an image,which is more technology-centric. Building upon this image will
help them consolidate their position as market leaders in hi-techbanking. Another inference obtained from the perceptual mapping
is that more than inter-group competition, intra-groupcompetition is likely to increase in future. However, since themap do not give differences among individual banks, conclusions
about nature of competition need not be very accurate. PSBs and
OPBS can effectively use the strategy of multiple segmentmarketing to ward off the new banks eating into their marketshares.
This study which is based on customer perceptions revealsomewhat distinct identities for each bank-group. It could alsobe inferred that competition between banks within a group ismore likely to be prevalent than between various bank-groups.Hence, marketing strategy in the banking industry couldcapitalise on these identities to sustain the present wave ofcompetition. It can continue to be so till the information and
390

communication technology penetrates into the daily life of thecommon man in Kerala, by which time these identities are likely
to fade away in the context of a possible ‘IT led growth’ of thebanking industry. As this study is being concluded. thebankingindustry is undergoing dynamic changes in organisationalstructures. ownership patterns. operational linkages (say, ATMnetworks among different banks ) and strategic alliances, all ofwhich might reshape the perceptions of customers. For instance,many of the factors such as 'nearness', 'safety' and 'servicequality’ would all get grouped together into a single factor suchas reliability of the automated systems. Any such drastic change
in the banking industry will bring a set of mundane products and
services on a level playing ground irrespective of the bankgroups, while many value added products and services mayemerge as the factors of differentiation.
5.11 Suggested Topics for Future Research
1. A Study ofthe Impact of Electronic Banking on CustomerSatisfaction in Banks in Kerala
2. Critical Evaluation of the Changes in Perceptions ofCustomers about Public Sector Banks in Kerala ALongitudinal Analysis
3. Old and New Private Banks- A Comparative Study oftheirMarketing Practices.
4. Class and Mass Banking Strategies of Banks in Kerala- ADiscriminant Analysis in the Retail Segment of theindustry.
391

5. Risk Perceptions of Customers on Electronic BankingSystems
Reference
1 Economic Times, 'Savvy Pvt Banks Get Past PSU Rivals in
Market Share Race’, September 13, 2000
392

No: Date CategoryQUESTIONNAIRE
Appendix—l
This questionnaire is intended to collect data for the research work being done on the topicof ‘Marketing of Banking Products in Kerala'. The data provided by you will be kept strictly
confidential and will be used only for academic purposes. For the very reason the respondentis not expected to provide his/her name or address.
Indicate your answer by tick mark (~/) near the question numbers or the boxes provided asthe case may be.
l.Do you bank with the following?Banks Yes No
Public sector banks (SBI, SBT, Union Bank, Canara Bank,etc.)
Private sector banks (Federal Bank, South Indian Bank,Catholic Syrian Bank, etc.)
Co-operative Banks
New Private Banks (lnduslnd, Times, Centurion, GlobalTn.‘-st, etc.)
Foreign Banks (ANZ Grindlays, Standard Chartered,BBME, etc.)
2. Which banks do you frequently visit and how ofien?
Name of the bank No ofVisits/Month
av
:59’
3. What type of accounts or dealings do you have with the above banks?
SavingsCurrent
P-PP‘?
Fixed depositsOther deposits
(E.g., Cumulative, Recurring, Flexible, etc.)
393

4. What are the reasons for selecting the banks?
Reasons Most Other BanksFrequentedi Bank
Higher interest ratesMore safety
Better service and friendly staff 5Greater spread of branches
Neamess to your house or work placeBetter image of the bank
Q°5"‘«!'°P-.°.°‘P’ Locational convenience (parkingspace, neamess to shopping centersetc
h. Early association with the bank
i. Suggested by employer for salaryremittance
5. I-low much importance do you give for each of the following reasons in theselection of your regularly used bank and other banks ( answer only if youdea.l with more than one bank)
Mark the importance on a scale of 1 to 9. Mark 1 if it is the least importantreason, 9 if it is the most important and in between values accordingly
Reasons Weightages GivenMost Frequented Other Banks
BanksHigher interest rates
More safety
Better service and friendly staff
Greater spread of branches
Neamess to your house or work placeBetter image of the bank
Q°!"°.‘°.°-."’.°‘P Locational convenience (parking space,neamess to shopping centers ...etc.)
h. Early association with the bank
i. Suggested by employer for salaryremittance
394

6. What special schemes of banks have you purchased?
Name of the scheme Name of Banka. Automatic renewal deposit
scheme
b. Flexible depositsc. Recurring depositsF‘ Long term deposits (more than
5 years)Educational deposit s schemesPension schemes
Withdrawable depositsF-"Q°!"7.‘° Any other schemes
7. How satisfied are you in general about the services of your frequentedbank?
Very much Dissatisfied So-So Satisfied Very muchdissatisfied satisfied8. What are the services you avail fi'om your bank? Are your expectationsregardinLtl1ese services satisfied?
Services Very much Dissati- So- Satisfied Very muchDissatisfied sfied So Satisfied
1.Updation of pass books
2.Proper entries oftransactions
3.Payment of cash againstCheques4.Collection of outstationcheques, bills, salary ÷nds.5.Issue of demanddrafis, Mail transfers
6.Cash transfer bytelegraphic/electronicservices
7.Payments ofsubscriptions, insurancepremiums through youra/c
8.Credit card operations
395

Continued.
Services Very much Dissatisfied So- Satisfied VeryDissatisfied So muchSatisfied
9.Safe deposit lockerservices1 0 . C redit/overdrafifacilities
9. Have you ever closed your a/c in any bank ? Yes No
If yes, the reasons for closing
Name ReasonsOf the Poor Loss of Change of Locational Otherbank service credibility residence/office disadvantage reasons1
2
10.Have you invested in the following ? If yes, motivations for suchinvestments. (If there are multiple reasons tick all those factors which areapplicable)
Schemes
Yes
Reasons
Returns
Quick EndSafety Liqui
dityOtherbenefits
Taxbenefits .
Public ProvidentFundLIC/GICSchemesUTI-variousschemesShares & Stocks
Debentures
Mutual Funds
National SavingsCertificate
P'Q°!"=.°.° Indira VikasPatraCo operativeBank deposits
396
Contd.

Scheme Yes Retums Safety Liquid Tax OtherQuick End ity benefits benefits
j. Deposits inFinancialCompanies
k. Bonds(IClCI....etc)
l. Chitties andKuries
m. Nidhiesn. Medical
Insurance
11. If you have some savings for which you have no immediate requirementswhere would you invest it?
(If your answer is bank, please specify name of the bank)
Option AmountSmall amount according Substantial amount
to you1-3 years More than 3
yearsInvestment option (other
than banks)Bank
12. The reason for selecting any long-term option for more than 5 years (rankaccording to the importance given by you to the reason. Put 1 for the mostimportant reason and 2,3, etc. for lesser important reasons)
Reasons Rank
Retums/benefits at the end
High interest paid annuallyIn between retLu'ns
Security
Tax savingsiinvolvedW99-P9‘?
maturityCredit facility or withdrawability before
g. Others if any
397

l3.What is your agreement or disagreement to the following statements withrespect to choosing your bank?
Mark your response to the scale given below
Sl:rongly Disagree Neutral Agree Stronglydisagree agree(1) (2) (3) (4) Q)a. I will choose a bank for its good reputeb. I will select any bank which will give me maximum interestc. I will choose only the leading public sector bankd. I will choose any scheduled commercial bank near my
oflice/house
e. I will choose the leading private bank onlyf. I prefer bank with modern electronic facilities keeping with my
lifestyle and prestigg. I will maintain a/c s in more than one bank, both public and
privateh. I will choose the bank that gives good customer service
14.How do you rate the service qualities of your frequented bank based on thefollowing factors?
Service Dimensions Very Poor So- Good VeryPoor So Gooda. Financial advice &
coun::eEiz:
b. Friendliness of staff andcounter service
c. Complaint-fi'ee processd. Speedy procedure
e. Reliability of accounting
15. Are you using the following services?Services Yes NoATM
Tele-bankingHome-banking
393

l6.Computersation in banks, in your opinion
Opinion Yes Noa. Is not required, the current sgem is sufficientb. Is very convenientc. Does not make any difference
l7.Have you seen any advertisements of banks? Yes No
If yes , indicate where?News paper Magazine TV
Can you recall anyone? Yes No
18. From where do you get your investment advices?
Friends /relatives/colleaguesFrom bank staff / BrochuresFrom advertisementsFrom investment guidance in newspapers and magazines9-?’ .°‘!”
1’). Are you able to understand the differences in retums /interest rates offeredby different banks clearly ?
I don't try to understandI don’t understandI try to understand if I have immediate plans to invest.I follow the rate changes with lot of interest.P-.°.°‘P
20. Mark your choice of investment for the following needs. If you havealready made investments for these purposes please tick the choice you havemade.
Choice
Need Bank Savings Specific Non -BankFD Bank Scheme of investments
a/c Banka. Purchase of household
goodsChildren's education
Construction of house
Children's marriagePP-P9‘ Retirement life
399

21. I-lavegyou taken loan from places other than commercial banks?Yes No
a. C o operative banksb. Finance CompaniesC. Private Money Lenders
22. Please fill up the columns in the table below if you have taken loans frombanks?
Purpose For Names of bank Will you borrow Reasons forwhich loan again selecting the bankwas (were) (Select one of thetaken Yes No reasons frombelow)
Reasons1. Lower interest rates2. Had an SB a/c or Fixed Deposit in the bank3. Good financial advice by the bankers4. Has borrowed from the bank before5. Speedy processing6. Some one recommended7. Sofier security requirements8. Advertisements9. It was the only option
23. You urgently need some money. You don’: h;-.'.'e enough funds with younow. What would be your choice to source the money? Mark the order ofyour preference. Put '1' for the first preference and subsequent numbersaccordingly
Choices Preference
Loan from a public sector bank
Loan fi-om a private sector bank
Loan from a co operative bank
Loan fi'om Finance companies
Borrowing from a friend/relative5"'.“°P-.°.°'P’ Sale of gold/pledging any other assets

24. How frequently do you avail Overdraft facility?
[Never J Rarely I Sometimes l Frequently J25. Are you interested in taking the following types of loan from the banks?Type of loan Already Not Somewhat Very much
taken interested interested interesteda. Car/vehicleb. House
c. Homeappliances
26. How important are the following aspects in the case of obtaining loansfrom any bank ?
Aspects Mostimportant
Lessimportant
Leastimportant
a. Reasonable interest rates
measuresLess adherence to security
c. Good interaction anddealing by the ofiicialsSimple procedure
27. Compare the Public & Private sector banks based on the following aspectsin the case of getting loans from there
Banks Interest rates Attitude of staff ProcessingLow High Bad Good Slow Fast
Public sector Banks
Private sector banks I
28.Please indicate whether the following payments you would like to makethrough your bank accounts
Payments Yes No
Telephone billsElectricity billsWater billsSchool fees
401

29. How do you generally rate the following aspects of Public, Private,Foreign, and New Private banks?
ReturnsOffered
BanksservicesAvailability ofall Wide branch
networkCustomaservice
Service charga
Low Med Poor OKHigh Good Poor Ok Good Bad Ok Good Reasonnable
Low
PublicSectorBanksPrivateSectorBanks
ForeigiBanks
New PrivateBanks
30. If you are considering changing your frequented bank, which one will youchoose?
Bank ................................................. ..reasons forchanging.
31.Do you think that banking hours need some improvement? Yes No
If ‘yes’ give specific suggestions on improvement required for
a. Banking hours in week days
b. On Sundays
32.Do you think improvement in the following aspects is a must?
Aspect Yes NoBank premises (better arrangements and conveniences)Reduction of waiting time for various servicesAttitude of staff
Use of computer and other equipments to speed upPP-99'?’ Customer services in general
402
High
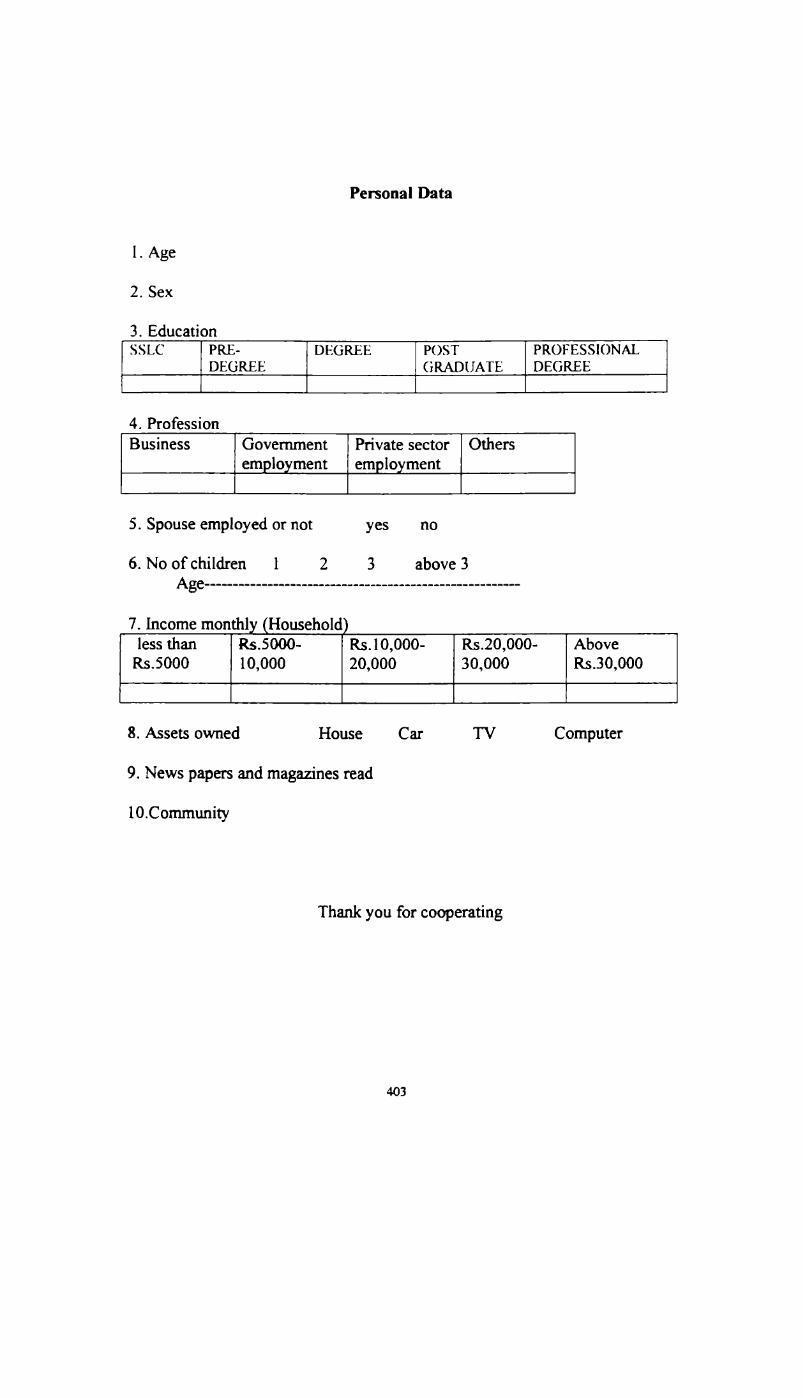
Personal Data
1. Age
2. Sex
3. EducationSSLC PRE- DEGREE POST PROFESSIONAL
DEGREE GRADUATE DEGREE
4. ProfessionBusiness Government Private sector Others
employment engloyment
5. Spouse employed or not yes no
6. No of children 1 2 3 above 3Age
7. Income monthly (Householdless than Rs.5000- Rs. l0,000- Rs.20,000- AboveRs.5000 10,000 20,000 30,000 Rs.30,000
8. Assets owned House Car TV Computer9. News papers and magazines read
10.Community
Thank you for cooperating
403

Appendix-2
No: Date Category
QUESTIONNAIRE
This questionnaire is intended to collect data for the research work being carried out on thetopic of "Marketing of Banking Products in Kerala'. The data provided by you will be kept
strictly confidential and will be used only for this academic purpose. The respondent need notprovide his/her name.
Kindly follow the instructions given along with the questions foranswering them
l.To which of the following category do you belong? (Please tick (‘J ) in theappropriate boxes)
a) Ownershi 3Public Ltd Private Ltd Partnership Proprietary
Self Professionalemployed
b) SizeLarge scale Medium scale Small scale
c) NatureTrading Business - Service Export oriented Others
retail
d)No of years inBusiness
2.Which is the bank you mostly interact with?
a. Name of bank No: of visits /week

3. Reasons for selecting the bank (please tick)
a. Prompt / efficient services
b. Lesser service charges
c. Neamess to your location
d. High image of the banks
e. Wide branch network
f. Specify any other ....... ..
4.What are your major types of interactions with the bank? (Please tick)
a. Current a/c
b. Dgositsc. Loanc. Creditsd. Others (specify)...
5. Which other banks do you associate with for business purposes?
Name of Bank
6. Reasons for choosing the above banks (please tick)
Aspects Name of the banka. Prompt / efficient services
b. Lesser service charges
c. Neamess to your location
d. High image of the banks
e. Wide branch network
f. Specify any other...
405

7. How do you rate the services of your frequented banks with respect to thefollowing?
Services Very much Dissatisfied So- Satisfied Verydissatisfied So muchsatisfied
a. Responsiveness to yourenquiries
b. Fast processing of your loanapplications
c. Personalised services
d. Financial guidance &counseling
e. Updating of account details
f. Assistance in cash management
g. Fast collection / transaction offunds (Outstation cheques)
h. Flexibility in providing services
i. Range of services offered
j. Complaint free procedures
k. Assistance in providinginformation
1. Reliability in accounting
406

8. Have you taken term loans from bank? Or from any other institutions?(Please tick in the appropriate boxes)
Banks Non- Bank Government Co-operative Others.Financial Agencies Banks/Societies specifyCompanies
Normal Schemeschannels like
PMRY...
9. Why did you take loan from the banks mentioned above? Rate according tothe importance you assigned to the reason while making the decision.
Reasons Very muchimportant
Some whatimportant
Notimportant
a. Lower interest rates
b. Good financial advice by thebank
c. Has borrowed before from thebank
d. Spgedy processinge. Someone recommended
f. Less adherence on collateralsecurity
g. Easier Documentation
l0.What are the aspects you look forward to while availing term loans fi'ombanks.
Rate according to the importance you assign to each factor.
Very muchimportant
Somewhat
Notimportant
a. Reasonable interest rates
b. Less adherence to securityc. Good dealings by the officials
d. Speedy procedures & sanction
e. Simple procedure
f. Grace period
g. Repayment period
407

Survey of Banks in KERALA.
Appendix-3
No: Date Category
QUESTIONNAIRE -NR1
This questionnaire is intended to collect data for the research work being done on thetopic of ‘Marketing of Banking Products in Kerala'. The data provided by you will be keptstrictly confidential and will be used only for academic purposes. For the very reason therespondent is not expected to provide his/her name or address
Indicate your answer by tick mark (/) near the question numbers or the boxes provided asthe case may be
1.Do you bank with the following?Banks Yes No
Public Sector Banks (SBI, SBT, Union Bank, Canara Bank,etc.)Old Private Sector Banks (Federal Bank, South Indian Bank,Catholic Syrian Bank", etc.)Co-operative Banks
New Private Banks (Induslnd, Times, Centurion, Global Trust,etc.)
Foreign Banks (ANZ Grindlays, Standard" Chartered, BBME,etc.)
2.Which bank do you generally / mostly interact with?
3.What are the reasons for selecting the bank?
a) Higher interest rates
b) More safety
c) Better service
d) Greater spread of branches
e) Locational factors of exchange houses/correspondent banksabroad
3 Nearness to your home in India
Direct remittance facility from abroad(ID \.I
3'‘\/ Trust you had earlier
408

Continued.
i) Fast remittance facilities
j) Lesser service charges
k) Additional services offered by the bank
l) Suggested by your friends/relatives/other associates
4. How satisfied are you in general with the services of your most fiequented bank?
Very much satisfied Dissatisfied So-So Satisfied Very much satisfied
5.How do you rate the services of your frequented bank on the following factors?
Services Very much Dissatisfied So- Satisfied Verydissatisfied So muchsatisfied
a) Updating of pass books
b) Payment of cash againstchgues
c) Issue of demand drafis
d) Cash transfer bytelegraphic/electronicservices
e) Carrying out of standinginstructions
1) Dealings with persons inKerala authorized byyou
g) Reliable accounting
h) Correspondence withyou
i) F inancial advice andcounseling
j) Friendliness of Stafl‘ andcounter services
k) Speedy and complaintfiee procedures

6.Have you ever closed your a/c in any bank? Yes No IIf yes what were the reasons for doing so?
Name of the Reasonsbank Poor Loss of Change of Locational Other
service credibility residence/office disadvantage reasons
7. Have you invested in the following (please tick)
Investment
a. PPF
b. LIC -various schemes
c. UTl- various schemes
d. Shares and stocks
e. Debentures
f. Mutual funds
g. NSC (National Savings Certificate)
h. IVP (Indira Vikas Patra)
i. Deposits of finance companies
j. Bonds
k. Medical insurance
8.Wha1 are the reasons for selecting a long-terrn investment? Rank in the order ofpriority assigned by you (e.g. 1-first, 2-secn-'Id.etc.)
a) Returns at the end
b) High interest Rates
c) Returns in between
d) Security
e) Withdrawal facility in between (liquidity)
I) Reptriability
g) Others please specify
410

9.How do you lcnow about banks and their schemes?
a) Through opinions of people lcnown to you
b) Through bank stafl‘
c) By investment guidance in media
d) By advertisement
e) By brochures and leaflets distributed at bank counters
0 By brochures mailed to you by banks
g) By looking at web sites of banks
10. Have you ever taken loans fiom a bank?If yes, what were the reasons for availing the loan fi'om the bank?
a) Lower interest rates
b) Hadana/cinthebank
c) Good financial advice
cl) Some one recommended
e) Advertisement
0 Softer security requirements
g) It was the only option
1 1. Will you be interested in taking loans for the following purposes?What are the chances of taking from a bank?
Yes No chance Sometimes Certainly
a) Car/vehicle
b) Purchase offlat/house/construction
c) Education
d) Other personal loans
411

12. Do you think improvement in the following aspects is a must‘?
a) Bank premises Yes Nob) Reduction in waiting time
c) Attitude of staff
d) Computerization
e) Customer service in general
13. Suppose you are considering changing /transferring of your account to anotherbank which one will you choose, reasons
Name of Bank Reason ----------------------- -l4.Are you using the following services in Kerala?
services Yes No'1.ATM
2. Talc-banking
15. Personaldata
1. Age
2. Education
3. Occupation
4. Profession
5. News papers read
a. English
b. Malayalam
Thank you for Cooperating
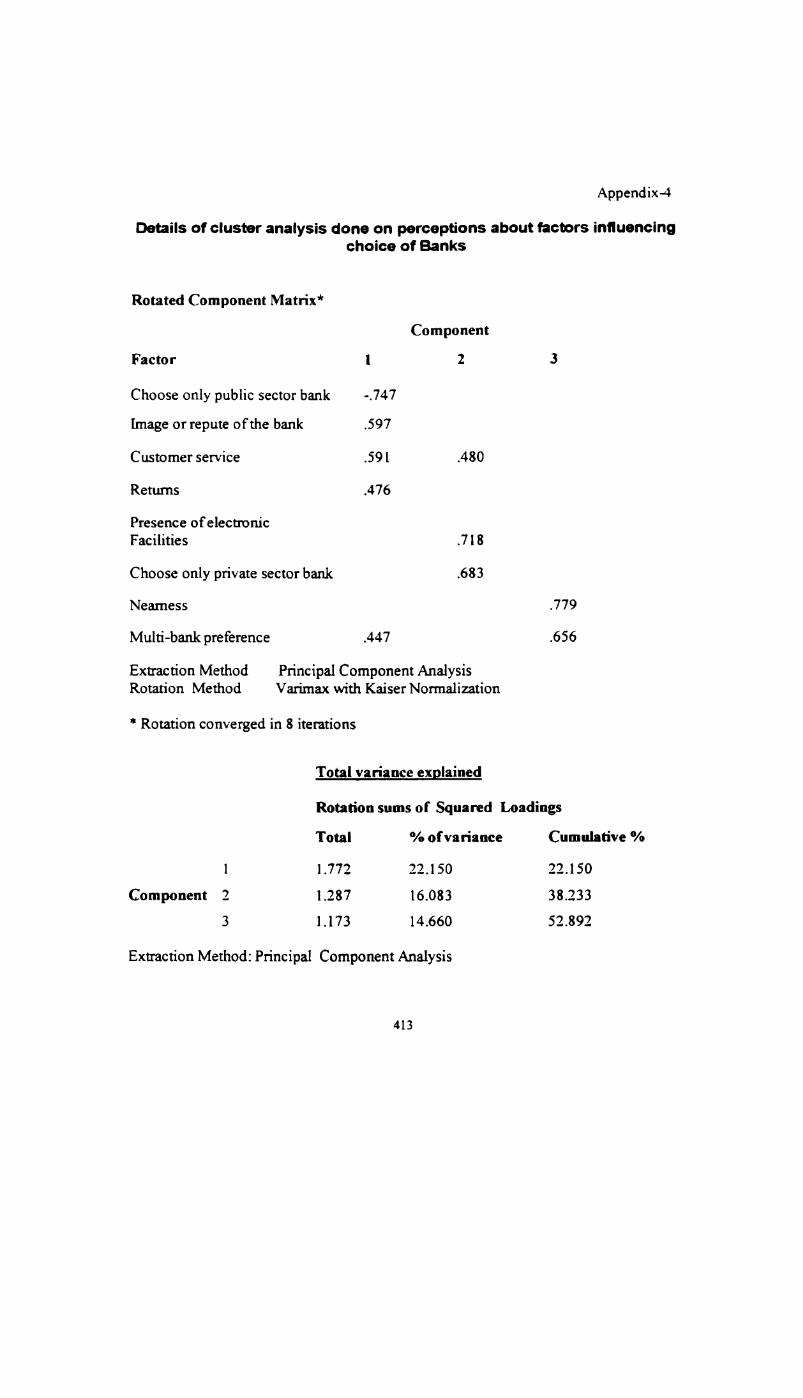
Appendix-4
Details of cluster analysis done on perceptions about factors influencingchoice of Banks
Rotated Component Matrix*
ComponentFactor I 2 3Choose only public sector bank -.747
Image or repute ofthe bank .597
Customer service .591 .480Returns .476Presence of electronicFacilities .7 I 8Choose only private sector bank .683Neamess .779Multi-ba.nk preference .447 .656Extraction Method Principal Component AnalysisRotation Method Varimax with Kaiser Normalization
"' Rotation converged in 3 iteiations
Total variance explained
Rotation sums of Squared Loadings
Total % of va riance Cumulative %1 1.772 22.150 22.150
Component 2 1.287 16.033 38.2333 1.173 14.660 52.892
Extraction Method: Principal Component Analysis
413

Rotated Component Matrix*
ComponentFactor I 2Choose only public sector bank -.786
Customer service .721Image or repute ofthe bank .521
Retums .428Neamess .690Choose only private sector bank .613
Multi-bank preference .456Presence of electronicFacilities .415Extraction Method: Principal Component AnalysisRotation Method: Varimax with Kaiser Normalization
"‘ Rotation converged in 3 iterations
Total Variance Explained
Rotation Sums of Squared Loadings
Total % of Variance cumulative %
1 1.865 23.307 23.3072 1.265 15.814 39.121
Extraction method: Principal Component Analysis
414

Final Cluster Centers
ClusterI 2 3 4REGRFactor score 1 for .26750 .8l688 -.9324] -1.23631AnalysisI
REGRFactor score 2 for .834S3 -.42690 -1.30749 .65923Analysis2
Number of cases in each Cluster
1 10.00150.0062.0078.00-5~'~9JI\)u—
Valid 4oo.ooMissing 00.00
415

Cluster Diagram
C|L&I'NI.n'tudCa
4
1
2
1-Id.
_ ma»fiS_o__ 23“ 5:2 comm
REGRla:uscwo Zlua-dysis I
-:_l. I
45
416

Appendix-5
Regional Variation in Popularity of Chitties and Kuries
Cross tabulation - District by number of respondents invested in Chitties / KuriesCol pct RowNo Yes Blank TotalDistrict
I (Thrissur) 44 5 5 1 10018.6 34.0 100.0 25.0
2 (Emakulam) 59 41 10024. 9 25. 3 25. 0
3 (Thiruvanantha- 1 34 66 200Puram) 56. 5 40. 7 50. 0
Column 237 162 1 400Total 59. 3 40.5 .3 I00. 0
Results of Chi-Tests based on the above data
Chi-Square Value DF Significance
Pearson 16.92890 4 .O0200Likelihood Ratio 16.66806 4 .0024
Minimum Expected Frequency- .250Cells with Expected Frequency < 5 - 3 OF 9 (33.3%)Number of missing observations: 0
417
BIBLIOGRAPHY
Books
1. Bowen. D.E., R. B. Chase, and T.G. Cummings (eds).
Service Management Effectiveness, JosseyBass;SaFransisco, 1990.
2. Chacko K.C., History of the Federal Bank Ltd, Alwaye, The
Federal Bank Ltd, Alwaye, 1979.
3. Channon, Derek F., Bank Strategic Management and
Marketing, John Wiley and Sons, UK, 1986.
4. Donnelly, J. and W.George (eds), Marketing 0fServices,
Chicago: American Marketing Association, 1981.
5. Heskett, James L., W Earl Sasser, Jr., and Christopher
W .L Hart, Service Breakthroughs: Changing the Rules ofthe Game, Free Press, New York, 1990.
6. Jadhav , Narendra (ed), Challenges to Indian
Banking.'C0mpetiti0n, Globalisation and Financial
Markets, MacMillan, New Delhi, 1996.
7. Kotler, Philip,Marketing Management, Eaglewood Cliffs,N.J: Prentice Hall, 1980.
418

8. Maiden, Arthur, Marketing Financial Services, MacmillanPress, London. 1996.
9. McCarthy, E.Jerome and William D Perreault, Jr..
Essentials of Marketing, Irwin McGraw-Hilll, New York.1997
I0. Morris. M.David and B. McA|pin Michalle, Measuring
condition of India ’s poor, The Physical quality of lifeIndex, Promilla and co Publishers, New Delhi 1982.
11. Porter, M. E., Competitive advantage: Creating and
Sustaining Superior Performance, Free Press, New York,1985.
12. ________ __, Techniques for Analysing Industries,
Competitors and Competitive Strategy, Free Press, NewYork, 1980.
13. Prakash, B.A. (ed), Kerala ‘s Economy-Performance,
problems, prospects, Sage Publications India pvt. Ltd, NewDelhi, 1994.
14. Quinn, J.B., Intelligent Enterprises, Free Press, NewYork,1992.
15. Reiden Bach, R. Eric, and Robert E Pitts, Bank Marketing:
a guide to Strategic Planning, Prentice Hall, EaglewoodCliffs, N.J, 1986.
16. Seth, Rajeev V.K., Marketing of Banking Services , Macmillan India,
New Delhi, 1997.
419

17 Thompson, Thomas W Leonard L. Berry and, Philip H.
Davidson, Banking Tomorrow: Managing Markets Through
Planning, Van Nostrend Reinhold Company, New York,1987
Journals
l. Berry, L.L., ‘Marketing-The time is now‘, Savings and Loan
News(USA), April 1969.
2. Berry, Leonard L., and A. Parasuraman, ‘Listening to the
Customer-The Concept Of Service Quality Information
System’, Sloan Management Review, Spring 1997.
3. Chakrabarty, K.C., ‘Customer Service in Banks, The
Challenges Ahead‘, [BA Bulletin, Special Issue, 1997.
4. Chazeh, K.,and Decker,W. H., 'How Customers Choose
Banks‘, Jounal of Retail Banking, Vol. 14 (winter), 19921993.
5. Chcbct, J. C., and P.Filiatrault, ‘The Impact of Waiting in
Line on Customer’, lnternatinal Journal of Bank
Marketing,Vol.l 1, No.2, 1993.
6. Crystal, Mary, ‘That was Then, This is Tomorrow’, Bank
Marketing, Washington, December 1997/January 1998.
. Das, Pradeep K., 'Competitive Advantage of Bank Groups
in India- A Matrix Analysis’, [BA Bulletin, January 1997.
xi
420

8. Donthu, Naveen and Boonghe ,Yoo, 'Culturl Influences on
Service Quality Expectations‘, Journal of Service Research.Vol.2. 1998.
9. Fry, J.N., 'Customer’s Loyalty to Banks- A Longitudinal
Study’, Journal ofBusiness, September 1973.
l0.Gopal, K.S., Competition in the Banking Industry’, IBABulletin, New Delhi, January 1997
I l.Heskett J.L., T.O Jones, G.W Loveman, W.E Sasser, jr
and LA Schlesinger, Putting the Service profit Chain toWork’, Harward Business Review, March—April, 1994.
12.Javalgi, Rajashekar G. and Paul Dion, Life Cycle
Segmentation Approach to Marketing Financial Productsand Services’, The Services Industries Journal, Vol.19,Issue 13, London, July 1999.
13. Joy, A., C.Kim, and lVLLorohe, ‘ Ethnicity as a Factor
Influencing the Use of Financial Services’, International
journal ofBanlc Marketing, Vol. 9, No. 4, 1991.
14.Krishnaswamy, O.R., and C. Sreenivas,'Deposit
Mobilisation in Banks-A survey’, Yojana, Vol.XXVI,No.19, October 16-31,1980.
l5.Lenora, M.C., ‘Segmentory Credit Card Holders by
Behaviour’, Journal ofRetail Banking, Vol.13, No.1, spring1991.
421

16.Lepak. Greg M., ' Bayesian approach for analysing the
services of banking institutions‘, The Journal of Consumer
Affairs: Vol 32., No.1, Summer 1998
17.Levitt, Theodore, ‘Marketing Mypoia', Harward Business
Review. July-August, 1960.
l3.Lewis, B. R.. Service quality: Recent Developments in
Financial Services, International Journal ofBank
Marketing, V01.11, No.6, 1993.
19.Martineau, H, ‘Social Classes and Spending Behaviour’,
Journal ofMarketing, Vol.22, October 1958.
20.Mattila, Anna S., ‘The role of culture in the Service
Evaluation Process’, Journal of Service Research, Vol. 1,No 3, pp. 50-61, 1999.
2l.Morgan R.M and S.D Hunt, The Commitment-Trust
Theory of Relationship Marketing’, Journal ofMarketing,Vol.58, 1994.
22.Nagadevara, \/.,and S. Jagadeesh, ‘Total Branch
Automation Customer Perceptions’, IBA Bulletin, Specialissue, March 1997.
23. Nicholls, J. A. F., S. Roslow, J. Tsolikis, ‘Time is Central‘,
International Journal ofBank Marketing, Vol.11, No.5,1993.

24.Noel McGinnis, ‘Networking: A Way to Manage Our
Changing World’, The Futurist , June 1984.
25.Parasuraman, A., Valerie A. Zeithmal and Leonard L Berry.
‘A Conceptional Quality and its Implications for Future
Research’, Journal of Marketing, Vol. 49, Fall 1985.
26. _________ __, ‘Expectations as a Comparison Standard in
Measuring Service Quality: An Assessment of a
Reassessment’, Journal of Marketing, Vol.58, 1994.
27.________, 'SERVQUAL: A Multiple-Items Scale ForMeasuring Consumer Perceptions Of Service Quality‘,
Journal ofkcrailing, ‘«’oi.64 (Spring 1988).
28.Ramesha, K., 'Banking Expectations and Bank Selection‘,IBA Bulletin, Vol.21, No. 9, 1999.
29.Roy, Ghosh D., ‘Customer Knowledge Management: Branch
Level Significance’, Vinimaya, Vol. II, No. 1,1999.
30.Rust, R.T. and A.J.Zahorik, ‘ Customer Satisfaction,
Customer Retention and Market Share’, Journal of
Retailing, Vol.69, 1993.
31.Rust R.T., A.J.Zahorik, and T.L Keiningham, Return on
Quality: Measuring the Financial Impact of your
Company’s Quest for Quality’, Probus, Chicago,I1linious,1994.
423
32.Valverde. Nelson, ‘Developing Profitable Strategies That
Don't Box You in‘, Bank Marketing, June 1983.
33.Vojta. George J., ‘New Competition and its Implication
for Banking’, The Magazine ofBank Administration, Vol. 9.No. 7, I983.
34.Winsted, Catherine Frazier, ‘The Service Experience in
Two Cultures: A Behavioural Perspective',Journa1 of
Retailing, Vol.73, No.3, 1997.
Report’:
1. Canara Bank Report ofthe Committee on CD ratio inKerala, Bombay, July 1994.
2. CMIE, Basic Statistics relating to states oflndia,September, 1994.
3. Department of Statistical Analyses and Computer Services,
RBI, Statistical Tables related to Banks in India (variousyears), Bombay
4. Indian Banks Association, Survey On Public Sector Banks
Customer Service: 1996-1997, New Delhi, 1997.
5. Kerala Statistical Institute, Socio-economic changes in
424

Kerala- A study based on selected localities, Trivandrum.October 1992.
6. Nair. Rajagopalan. Rural Bank Marketing in Kerala.
Doctoral Thesis. Department of Commerce. University ofKerala. 1994.
7 Narasimham Committee (2). Recommendations on Systemsand Methods in Banks, 1998.
8. National Institute of Bank Management ( under the aegis of
Indian Banks Association), All India Savings and DepositsTrends and Patterns, Pune, 1986.
9. RBI Report on Trends and Progress in Banking in India(various years). Mumbai.
10. ______ __, Basic Statistical Return 1997 March, Bombay,1997
ll.State Level Bankers Committee. Banking Statistics of
Kerala (various issues), Trivandrum.
12.State Planning Board, Economic Review (various years),
Government of Kerala, Trivandrum.
13. _____ __, Report on the Survey ofHousehold’s Savings
and Investment, Trivandrum, 1981.
l4.The Financial Express, The FE-BRIS Survey 1998,November 1998.
425

Web Sites
http://www.bmanet.org
http://www.clientsatisfaction.com
http://www.umi.com/proquest/
http://www.findarticles.com
News Pa pe rs
Business DeepikaBusiiness India
Business Line
Business TodayDhanam
Economic Times
Malayala Manorama
The Financial ExpressThe Hindu
The Indian Express
426