Embed Size (px)
Citation preview

2019 UPS Annual Report
55 Glenlake Parkway, NE Atlanta, GA 30328-3474
www.ups.com
© 2020 United Parcel Service of America, Inc. UPS, the UPS brandmark and the color brown are trademarks of United Parcel Service of America, Inc. All rights reserved.
2019 Annual Report
Accelerating Forward >>>CUSTOMER FIRST. PEOPLE LED. INNOVATION DRIVEN.

ANNUAL MEETING Our annual meeting of shareowners will be held at 8 a.m. on May 14, 2020, at the Hotel DuPont, 11th and Market Street, Wilmington, DE. Shareowners of record as of March 16, 2020, are entitled to vote at the meeting.
INVE STOR REL ATIONS You can contact our Investor Relations Department at:
>>> UPS 55 Glenlake Parkway, NE Atlanta, GA 30328-3474 800.877.1503 or 404.828.6059 investors.ups.com
E XCHANGE LISTING Our Class B common stock is listed on the New York Stock Exchange under the symbol “UPS”.
TR ANSFER AGENT AND REGISTR AR Computershare Send notices of address changes or questions regarding account status, stock transfer, lost certificates, or dividend payments to:
>>> Regular Mail UPS c/o Computershare PO Box 505002 Louisville, KY 40233-5002
or:
>>> Expedited Delivery UPS c/o Computershare 462 South 4th Street, Suite 1600 Louisville, KY 40202
FORM 10 - K Our Annual Report on Form 10-K for the year ended December 31, 2019 forms part of the UPS 2019 Annual Report. If you would like an additional copy of our Form 10-K, you can access it through the Investor Relations website at www.investors.ups.com or at the Securities and Exchange Commission website, sec.gov. The Form 10-K also is available free of charge by calling, contacting via the website, or writing to the Investor Relations Department.
UPS SHAREOWNER SERVICE S Convenient access 24 hours a day, seven days a week.
>>> Class A Common Shareowners www.computershare.com/ups 888.663.8325
>>> Class B Common Shareowners www.computershare.com/ups 800.758.4674
Calls from outside the United States: 201.680.6612 TDD for hearing impaired: 800.231.5469 TDD for non-U.S. shareowners: 201.680.6610
DIREC T STOCK PURCHA SE PL AN To make an initial purchase of UPS Class B Common Stock online, visit www.computershare.com/Investor and go to “Invest Now”. Follow the instructions provided to search for Investment Plans and access the Enrollment Wizard.
Current Class B shareowners can enroll in the plan online by accessing their accounts through www.computershare.com/ups or by calling 800.758.4674.
DIVIDEND REINVE STMENT PL AN To reinvest dividends in additional UPS shares:
>>> Class A and B Shareowners www.computershare.com/ups
ONLINE ACCE SS TO SHAREOWNER ACCOUNT MATERIAL S Enroll in E-Communications, a self-service program that provides electronic notification and secure access to shareowner communications. To enroll, access your account at www.computershare.com/ups. After accessing your account, click the “What would you like to do” dropdown menu in the upper left of the page. Under “Holdings” click “Manage My Stock,” select “My Profile,” click “Update” under “E-Communications” and follow the enrollment instructions.
UPS WEBSITE S Investor Relations . . . . . . . . . . . . . . . investors.ups.com
UPS Corporate . . . . . . . . . . . . . . . . . . . ups.com
Sustainability/ Corporate Responsibility . . . . . . . sustainability.ups.com
Services and Solutions . . . . . . . . . . ups.com/businesssolutions
INVESTOR INFORMATION
FINANCIAL HIGHLIGHTS (in millions except per-share amounts)
2019 2018 2017Revenue $74,094 $71,861 $66,585 Operating expenses 66,296 64,837 59,056Net income 4,440 4,791 4,905Adjusted net income* 6,543 6,301 5,254Diluted earnings per share 5.11 5.51 5.61 Adjusted diluted earnings per share* 7.53 7.24 6.00
Dividends declared per share 3.84 3.64 3.32
Assets 57,857 50,016 45,574Long-term debt 21,818 19,931 20,278Shareowners’ equity 3,283 3,037 1,024Capital expenditures1 6,380 6,283 5,227Cash and marketable securities 5,741 5,035 4,069
KEY METRICS2019 2018 2017
Return on Assets (GAAP) 8.2% 10.0% 11.4%Return on Assets (Adjusted)* 12.3% 13.3% 12.1%
Dividend Yield 3.3% 3.7% 2.6%
FREE CASH FLOW(millions of dollars)
2019 2018 2017Net cash from operations $8,639 $12,711 $1,479 Capital expenditures1 (6,380) (6,283) (5,227)Proceeds from disposals of PP&E 65 37 24
Net change in finance receivables 13 4 5
Other investing activities (75) 1 1 Free cash flow2 2,262 6,470 (3,718)Discretionary pension contributions 2,000 - 7,291
Adjusted free cash flow excluding discretionary pension contributions
4,262 6,470 3,573
*See reconciliation of Non-GAAP financial measures on page A1.1 Adjusted capital expenditures including principal repayments of finance lease obligations were $6.520 and $6.623 billion in 2019 and 2018, respectively.
2 Adjusted free cash flow including principal repayments of finance lease obligations was $4.122 and $6.130 billion in 2019 and 2018, respectively.
YEAR FOUNDED: 1907
2285 DAILY FLIGHT SEGMENTS
WORLDWIDE OPERATING FACILITIES: MORE THAN 2,500
ALTERNATIVE FUEL VEHICLES: MORE THAN 10,000
OVER 40,000 UPS ACCESS POINT LOCATIONS
2019 DELIVERY VOLUME: 5.5 BILLION PACKAGES AND DOCUMENTS
MORE THAN 125,000 VEHICLES IN DELIVERY FLEET
UPS MY CHOICE® MEMBERS: 67 MILLION
ONLINE TRACKING: 295 MILLION PER DAY
11.5 MILLION CUSTOMERS
EMPLOYEES: 495,000

Dear Fellow Shareowner, 2019 was a year of momentum for UPS. We reached several important turning points in our transformation as we accelerate forward and progress to become the fastest, most technology-enabled company in our industry. Our global integrated network provided UPS and our customers great flexibility to respond to the fast pace of change in the market. Our
innovative services and solutions helped our customers compete and grow, especially the small and medium-sized businesses (SMBs) we serve. And our people led us forward, delivering great service and fostering a culture of continuous transformation.
2019 also marked a significant milestone in UPS history. We celebrated the 20th anniversary of our initial public offering, the largest U.S. IPO on the New York Stock Exchange in the 20th century. Even 20 years ago, UPS recognized the need to transform to facilitate growth. The IPO strengthened our ability to grow, invest and make strategic acquisitions in markets around the world. It also laid the groundwork for the integrated Smart Global Logistics Network we operate today.
Our integrated network continues to expand and strengthen, and is powered by next-generation technology that is also enabling our enterprise-wide transformation. Technology is improving efficiency, creating additional flexibility, and increasing speed and scalability. It is the backbone of our industry-leading, data-driven solutions like UPS My Choice for Business and our Digital Access Program. It is the force that is enabling us to meet the growing demand of global B2B and B2C e-commerce. And it is the connective tissue that integrates UPS physical assets with our increasingly digital world.
Such innovations make it easier for customers to connect with UPS, access our services and enjoy more control over their inbound and outbound shipments. Our network is more responsive to the changing pickup and delivery conditions, thanks to our expanded use of route optimization and navigation software. Importantly, these actions and investments enable us to operate more sustainably. When coupled with our alternative fuel and alternative fleet solutions, we are reducing our environmental impact, the benefits of which will create long-term value for all stakeholders. We are investing to increase efficiency and to create new capabilities that will generate high-quality volume growth. We launched more new solutions in 2019 than at any other time in recent history. The impacts of our transformation are becoming more visible in our operating performance, even as we invest in new capabilities. We achieved this success due to the creativity and commitment of our 495,000 UPSers around the world.

79.2% 20.8%
62.7% 19.2%
18.1%
U.S. Domestic Package
International Package
Supply Chain & Freight InternationalU.S.
2015 : 59.2
2019 : 74.1
2016 : 61.62017 : 66.62018 : 71.9
2015 : 26.8
2019 : 9.1
2016 : 25.52017 : 16.1
2018 : 8.9
2015 : 2.7
2019 : 1.0
2016 : 2.72017 : 1.82018 : 1.0
2015 :
2019 :
2016 :
2017 :
2018 :
4.84.93.45.14.95.34.86.34.46.5
Adjusted*
2015 :
2019 :
2016 :
2017 :
2018 :
5.345.433.865.745.616.005.517.245.117.53
Adjusted*
2015 :
2019 :
2016 :
2017 :
2018 :
12.2%12.2%12.5%12.5%11.3%11.3%
9.8%10.3%10.5%11.0%
Adjusted*
2015 :
2019 :
2016 :
2017 :
2018 :
2.929.0%3.12 6.8%3.326.4%3.649.6%3.845.5%
YOY % Growth Rate
REVENUE (in billions of dollars) NET INCOME (in billions of dollars)
79.2% 20.8%
62.7% 19.2%
18.1%
U.S. Domestic Package
International Package
Supply Chain & Freight InternationalU.S.
2015 : 59.2
2019 : 74.1
2016 : 61.62017 : 66.62018 : 71.9
2015 : 26.8
2019 : 9.1
2016 : 25.52017 : 16.1
2018 : 8.9
2015 : 2.7
2019 : 1.0
2016 : 2.72017 : 1.82018 : 1.0
2015 :
2019 :
2016 :
2017 :
2018 :
4.84.93.45.14.95.34.86.34.46.5
Adjusted*
2015 :
2019 :
2016 :
2017 :
2018 :
5.345.433.865.745.616.005.517.245.117.53
Adjusted*
2015 :
2019 :
2016 :
2017 :
2018 :
12.2%12.2%12.5%12.5%11.3%11.3%
9.8%10.3%10.5%11.0%
Adjusted*
2015 :
2019 :
2016 :
2017 :
2018 :
2.929.0%3.12 6.8%3.326.4%3.649.6%3.845.5%
YOY % Growth Rate
Accelerating DELIVERIES
Speed of delivery is becoming increasingly important to consumers and is a critical competitive differentiator for many of our customers, both large and small. In 2019, we took advantage of the structural shift to faster next-day delivery, leveraging the strength of our expanding automated network to successfully absorb a 22% surge in next-day air volume, while strengthening our position as the e-commerce shipper of choice. The rapid movement toward next-day and seven-day delivery in the U.S. provides tremendous near-term growth opportunities and we are taking aggressive steps forward to continue speeding up our network to help all customers adapt, especially SMBs. For example, we are improving time-in-transit for 80% of our customers, doubling the amount of volume we handle on Saturdays and launching Sunday delivery. These actions are enabling UPS to take advantage of today’s opportunities, while continuing to diversify our growing customer base and generate long-term profitable growth. In 2019, we forged new paths to accelerate deliveries, creating innovative solutions for our customers. We achieved a milestone in commercial drone aviation when the Federal Aviation Administration (FAA) certified UPS with the first full Part 135 Standard to operate a drone airline at WakeMed, moving lab samples across its vast hospital campus. Working in partnership with the FAA on approvals, we tested similar services at other hospitals and medical campuses, proving drone solutions can accelerate deliveries and provide shortened time-in-transit, helping healthcare professionals better serve their patients. We are continuing to work with the FAA to expand our drone capabilities, as well as create new, breakthrough solutions to serve the evolving needs of our customers.
79.2% 20.8%
62.7% 19.2%
18.1%
U.S. Domestic Package
International Package
Supply Chain & Freight InternationalU.S.
2015 : 59.2
2019 : 74.1
2016 : 61.62017 : 66.62018 : 71.9
2015 : 26.8
2019 : 9.1
2016 : 25.52017 : 16.1
2018 : 8.9
2015 : 2.7
2019 : 1.0
2016 : 2.72017 : 1.82018 : 1.0
2015 :
2019 :
2016 :
2017 :
2018 :
4.84.93.45.14.95.34.86.34.46.5
Adjusted*
2015 :
2019 :
2016 :
2017 :
2018 :
5.345.433.865.745.616.005.517.245.117.53
Adjusted*
2015 :
2019 :
2016 :
2017 :
2018 :
12.2%12.2%12.5%12.5%11.3%11.3%
9.8%10.3%10.5%11.0%
Adjusted*
2015 :
2019 :
2016 :
2017 :
2018 :
2.929.0%3.12 6.8%3.326.4%3.649.6%3.845.5%
YOY % Growth Rate
REVENUE BY SEGMENT
REVENUE BY GEOGR APHY
CUSTOMER FIRST. PEOPLE LED. INNOVATION DRIVEN.
*See reconciliation of Non-GAAP financial measures on page A1.

Accelerating EFFICIENCIESWe made great strides expanding capacity and automating our Smart Global Logistics Network. Across the U.S., increased automation and improved efficiency drove unit costs down in 2019, helping fuel positive operating leverage and profit growth in the year. Adjusted operating margins expanded 50 basis points*†, an indication that our strategy and investments are improving the fundamentals of the business. As we move through our transformation and open more automated facilities, we remain confident that we will achieve our goal of a 30% to 35% increase in efficiency. The investments we are making are creating a more nimble, more competitive UPS, to better serve customers today and well into the future.
Here are some highlights for the year:
>>> We added 11 high-capacity aircraft to our global fleet, the largest annual addition to date, in our multi-year fleet expansion program.
>>> We opened 20 new or retrofitted automated facilities, adding nearly five million square feet and about 400,000 pieces per hour of automated sort capacity. Combined with 2018, we have opened a total of 41 facilities with 10 million square feet and approximately 800,000 pieces per hour of additional sort capacity.
>>> We pulled forward efforts to accelerate the U.S. ground network, widening the reach of our next-day ground capabilities and speeding up transit times in key lanes.
>>> In Europe, we opened a highly-automated superhub in Eindhoven, the Netherlands, a strategic location to connect Western European businesses to our Smart Global Logistics Network and facilitate market access around the world.
>>> In Asia, time-in-transit improvements and the expansion of our Shenzhen, China air hub are enabling UPS to take advantage of regional growth.
>>> We made wide-spread technology investments to expand our use of cloud infrastructure, improve cash flow management, and enhance procurement practices — all of which contributed to positive operating leverage.
>>> We advanced the development of ORION 3.0, our proprietary route optimization and navigation technology that dynamically adjusts and recalculates driver routes based on the remaining packages and pickup requests on the route, together with changing traffic conditions and other factors. Deployment in 2020 is on schedule.
The investments we are making are strengthening our core business. Our integrated network is running exceptionally well, generating new levels of efficiency and flexibility. We continually adjust our network to align capacity with changes in market demand around the world, which results in a lower cost structure and positive operating leverage.
*See reconciliation of Non-GAAP financial measures on page A1.†One basis point equals one-hundreth of a percentage point.

Accelerating GROWTH
In addition to creating greater efficiency and agility in the network, our transformation program is funding reinvestment in new state-of-the-art, customer-focused services and solutions. Our program is enabling UPS to pursue the best market opportunities for diversified revenue growth and long-term financial returns. These growth opportunities constitute our four Strategic Growth Initiatives:
>>> Small and Medium-sized Businesses (SMBs)
— We increased the number and variety of retail partners in our UPS Access Point network significantly in 2019, expanding the network to approximately 21,000 locations in the U.S. and 40,000 globally. Ninety percent of U.S. consumers will find a UPS Access Point location within five miles of their home, offering a new level of package pickup and drop-off convenience.
— We launched UPS My Choice for Business, giving small businesses unprecedented visibility and control over their inbound and outbound shipments.
>>> B2B and B2C e-Commerce
— We introduced the UPS Digital Access Program creating preferred relationships and embedding UPS technology directly into leading marketplaces and digital platforms such as Stamps.com, which many SMBs already use. Retail is becoming increasingly integrated across all digital channels as SMBs leverage tools to access larger pools of potential customers than they could have reached on their own. UPS’s footprint touches all aspects of the e-commerce ecosystem, from demand generation and shipping to visibility and returns.
— UPS now enables customers to tender shipments later for next-day ground delivery to 98% of the U.S. population. UPS Extended Hours Pickup for next-day ground delivery solidifies our market leading position in both next-day air and ground coverage.
— We expanded Saturday pickups and deliveries to help our customers deliver to consumers faster. And, in 2020 we expect to double the amount of Saturday volume we handled in 2019, and will continue to phase in Sunday delivery.
>>> International Growth Markets
— B2B and B2C businesses that export to key e-commerce destinations around the world now have a more affordable way to ship with UPS Worldwide Economy. This deferred service provides economical and efficient international options for small businesses shipping lightweight and less-expensive products.
— Customers are now able to reach more destinations with the expansion of our Express services. Postal codes across 40 countries in Europe, Asia, Latin America, Africa and the Middle East were added, significantly expanding the footprint of our time- and day-definite guaranteed international services.
>>> Healthcare and Life Sciences
— Healthcare and life sciences customers often need a higher level of visibility and security for their most-critical shipments. To meet those needs, we created UPS Premier (next-generation, on-package sensor technology) which enables advanced package tracking and contingency actions for critical shipments.
— Additionally, we connected all of our global healthcare and life sciences businesses under a single, dedicated UPS Healthcare unit. Wes Wheeler, a healthcare professional with deep experience, leads the unit which supports operations and includes a combined workforce of more than 5,000 employees from Marken, Polar Speed, and all 114 UPS healthcare facilities.
CUSTOMER FIRST. PEOPLE LED. INNOVATION DRIVEN.

We are moving quickly and intelligently to provide our customers new levels of speed, visibility, control and market access while creating new revenue streams for UPS. And our solutions are taking hold: in 2019, we grew consolidated volume 5.8%, while expanding our operating margins in all three segments. We outpaced the market in U.S. air growth with double-digit volume increases in Next Day Air and our deferred services. Looking forward, we see many opportunities to accelerate high-quality, high-margin volume growth.
79.2% 20.8%
62.7% 19.2%
18.1%
U.S. Domestic Package
International Package
Supply Chain & Freight InternationalU.S.
2015 : 59.2
2019 : 74.1
2016 : 61.62017 : 66.62018 : 71.9
2015 : 26.8
2019 : 9.1
2016 : 25.52017 : 16.1
2018 : 8.9
2015 : 2.7
2019 : 1.0
2016 : 2.72017 : 1.82018 : 1.0
2015 :
2019 :
2016 :
2017 :
2018 :
4.84.93.45.14.95.34.86.34.46.5
Adjusted*
2015 :
2019 :
2016 :
2017 :
2018 :
5.345.433.865.745.616.005.517.245.117.53
Adjusted*
2015 :
2019 :
2016 :
2017 :
2018 :
12.2%12.2%12.5%12.5%11.3%11.3%
9.8%10.3%10.5%11.0%
Adjusted*
2015 :
2019 :
2016 :
2017 :
2018 :
2.929.0%3.12 6.8%3.326.4%3.649.6%3.845.5%
YOY % Growth Rate
DIVIDENDS DECLARED (dollars per share)
79.2% 20.8%
62.7% 19.2%
18.1%
U.S. Domestic Package
International Package
Supply Chain & Freight InternationalU.S.
2015 : 59.2
2019 : 74.1
2016 : 61.62017 : 66.62018 : 71.9
2015 : 26.8
2019 : 9.1
2016 : 25.52017 : 16.1
2018 : 8.9
2015 : 2.7
2019 : 1.0
2016 : 2.72017 : 1.82018 : 1.0
2015 :
2019 :
2016 :
2017 :
2018 :
4.84.93.45.14.95.34.86.34.46.5
Adjusted*
2015 :
2019 :
2016 :
2017 :
2018 :
5.345.433.865.745.616.005.517.245.117.53
Adjusted*
2015 :
2019 :
2016 :
2017 :
2018 :
12.2%12.2%12.5%12.5%11.3%11.3%
9.8%10.3%10.5%11.0%
Adjusted*
2015 :
2019 :
2016 :
2017 :
2018 :
2.929.0%3.12 6.8%3.326.4%3.649.6%3.845.5%
YOY % Growth Rate
DILUTED EARNINGS PER SHARE (in dollars)79.2% 20.8%
62.7% 19.2%
18.1%
U.S. Domestic Package
International Package
Supply Chain & Freight InternationalU.S.
2015 : 59.2
2019 : 74.1
2016 : 61.62017 : 66.62018 : 71.9
2015 : 26.8
2019 : 9.1
2016 : 25.52017 : 16.1
2018 : 8.9
2015 : 2.7
2019 : 1.0
2016 : 2.72017 : 1.82018 : 1.0
2015 :
2019 :
2016 :
2017 :
2018 :
4.84.93.45.14.95.34.86.34.46.5
Adjusted*
2015 :
2019 :
2016 :
2017 :
2018 :
5.345.433.865.745.616.005.517.245.117.53
Adjusted*
2015 :
2019 :
2016 :
2017 :
2018 :
12.2%12.2%12.5%12.5%11.3%11.3%
9.8%10.3%10.5%11.0%
Adjusted*
2015 :
2019 :
2016 :
2017 :
2018 :
2.929.0%3.12 6.8%3.326.4%3.649.6%3.845.5%
YOY % Growth Rate
OPERATING MARGIN (percent)
79.2% 20.8%
62.7% 19.2%
18.1%
U.S. Domestic Package
International Package
Supply Chain & Freight InternationalU.S.
2015 : 59.2
2019 : 74.1
2016 : 61.62017 : 66.62018 : 71.9
2015 : 26.8
2019 : 9.1
2016 : 25.52017 : 16.1
2018 : 8.9
2015 : 2.7
2019 : 1.0
2016 : 2.72017 : 1.82018 : 1.0
2015 :
2019 :
2016 :
2017 :
2018 :
4.84.93.45.14.95.34.86.34.46.5
Adjusted*
2015 :
2019 :
2016 :
2017 :
2018 :
5.345.433.865.745.616.005.517.245.117.53
Adjusted*
2015 :
2019 :
2016 :
2017 :
2018 :
12.2%12.2%12.5%12.5%11.3%11.3%
9.8%10.3%10.5%11.0%
Adjusted*
2015 :
2019 :
2016 :
2017 :
2018 :
2.929.0%3.12 6.8%3.326.4%3.649.6%3.845.5%
YOY % Growth Rate
SHARE REPURCHASE EXPENDITURES (in billions of dollars)
*See reconciliation of Non-GAAP financial measures on page A1.

Accelerating EXECUTIONOur financial results demonstrate that our investments and strong execution are having an impact on the fundamentals of the business. Both top- and bottom-line results improved in 2019 due to increased demand for our services and new cost efficiencies in our network. For the company, consolidated revenue grew 3.1% to $74 billion and adjusted operating profit grew 10.4% to $8.2 billion*. Globally, we delivered more than 5.5 billion packages, a nearly 6% increase over 2018, driven by B2B and B2C volume growth in the U.S., which helped offset softness in global trade, particularly during the second half of the year. In U.S. Domestic, revenue grew 6.7% to $46.5 billion with volume growth across all products. Adjusted operating profit grew 12.7% to $4.4 billion* and we generated a margin of 9.4%*, or 50 basis points higher than in 2018.
The International segment reported $14.2 billion in revenue, a decrease of 1.5% due to the dynamic macro environment. Adjusted operating profit rose 6.7% to $2.8 billion* and margins expanded, primarily driven by strong execution, cost management and innovative services with a focus on SMB market opportunities.
The Supply Chain and Freight segment delivered another year of strong results, with an 11.2%* increase in adjusted operating profit and healthy margin expansion. The diversity of our portfolio, coupled with our continued focus on SMBs, helped offset softer business conditions in certain business units. Once again, UPS generated excellent cash flow — enabling us to invest in our network while rewarding shareowners. We invested $6.5 billion* in adjusted capital expenditures and returned $4.3 billion to shareowners, with $1 billion of share buybacks and $3.3 billion in dividends, a per-share increase of 5.5% over the prior year.
Executing our strategies for the long-term benefits all stakeholders — our shareowners, customers, employees, suppliers, and the communities we serve. Operating more sustainably is a core principle of our strategy and business operations. We pursue efficiency at every turn and deploy advanced technology to optimize resources and reduce our environmental impact. We are proud to have been named to the Dow Jones Sustainability World Index for the seventh consecutive year and the Dow Jones Sustainability North America Index for the 15th straight year. Plus, Corporate Responsibility Magazine named UPS to its “100 Best Corporate Citizens” annual listing for the 10th straight year.
*See reconciliation of Non-GAAP financial measures on page A1.
CUSTOMER FIRST. PEOPLE LED. INNOVATION DRIVEN.

Accelerating FORWARD
We are making significant progress in our transformation. Through the investments we are making today, our network — powered by next-generation advanced technologies — will become even more efficient and flexible. And as we look ahead, we will continue to introduce innovative solutions to help all of our customers grow. We are accelerating our strategies to take advantage of the tremendous growth prospects in the market today. Our actions will open new opportunities for our people and create additional value for our customers and shareowners in the near-term and well into the coming decade.
David AbneyUPS Chairman and Chief Executive Officer

DAVID P. ABNEYUPS Chairman and Chief Executive Officer
K ATE GUTMANNChief Sales and Solutions Officer
CHARLENE THOMA SChief Human Resources Officer
NORMAN M. BROTHERS, JR.Senior Vice President, General Counsel and Corporate Secretary
BRIAN NEWMANChief Financial Officer
NANDO CE SARONEPresident, UPS International
JUAN PEREZChief Information and Engineering Officer
PHILIPPE GILBERTPresident, Supply Chain Solutions
GEORGE WILLISPresident, U.S. Operations
KEVIN WARRENChief Marketing Officer
SCOT T PRICEChief Strategy and Transformation Officer
UPS BOARD OF DIRECTORS
MANAGEMENT COMMITTEE
DAVID P. ABNEYChairman and Chief Executive Officer, United Parcel Service, Inc.Director since 2014
RODNEY C . ADKINSFormer Senior Vice President, International Business MachinesDirector since 2013
MICHAEL J. BURNSFormer Chairman, President and Chief Executive Officer, Dana CorporationDirector since 2005
WILLIAM R. JOHNSONFormer Chairman, President and Chief Executive Officer, H.J. Heinz CompanyDirector since 2009
ANN M. LIVERMOREFormer Executive Vice President, Hewlett- Packard CompanyDirector since 1997
RUDY H.P. MARKHAMFormer Financial Director, UnileverDirector since 2007
FR ANCK J. MOISONFormer Vice Chairman, Colgate-Palmolive CompanyDirector since 2017
CL ARK T. R ANDT, JR. Former U.S. Ambassador to the People’s Republic of ChinaDirector since 2010
CHRISTIANA SMITH SHIFormer President, Direct-to-Consumer, Nike, Inc.Director since 2018
JOHN T. STANKEYPresident and Chief Operating Officer, AT&T Inc. and CEO, Warner Media LLCDirector since 2014
C AROL B. TOMÉFormer Chief Financial Officer and Executive Vice President — Corporate Services, The Home Depot, Inc.Director since 2003
KEVIN WARSHFormer Member of the Board of Governors of the Federal Reserve System, Distinguished Visiting Fellow, Hoover Institution, Stanford UniversityDirector since 2012

UNITED STATESSECURITIES AND EXCHANGE COMMISSION
Washington, D.C. 20549
Form 10-K (Mark One)
ANNUAL REPORT PURSUANT TO SECTION 13 OR 15(d) OF THE SECURITIES EXCHANGE ACT OF 1934
For the fiscal year ended December 31, 2019 or
TRANSITION REPORT PURSUANT TO SECTION 13 OR 15(d) OF THE SECURITIES EXCHANGE ACT OF 1934
For the transition period from toCommission file number 001-15451
____________________________________
United Parcel Service, Inc. (Exact name of registrant as specified in its charter)
Delaware 58-2480149
(State or Other Jurisdiction ofIncorporation or Organization)
(I.R.S. EmployerIdentification No.)
55 Glenlake Parkway, N.E. Atlanta, Georgia 30328 (Address of Principal Executive Offices) (Zip Code)
(404) 828-6000 (Registrant’s telephone number, including area code)
_______________________________ Securities registered pursuant to Section 12(b) of the Act:
Title of Each Class Trading Symbol Name of Each Exchange on Which Registered
Class B common stock, par value $.01 per share UPS New York Stock Exchange
Floating-Rate Senior Notes due 2020 UPS20A New York Stock Exchange
1.625% Senior Notes due 2025 UPS25 New York Stock Exchange
1% Senior Notes due 2028 UPS28 New York Stock Exchange
0.375% Senior Notes due 2023 UPS23A New York Stock Exchange
1.500% Senior Notes due 2032 UPS32 New York Stock Exchange
_________________________________Securities registered pursuant to Section 12(g) of the Act:
Class A common stock, par value $.01 per share(Title of Class)
Indicate by check mark if the registrant is a well-known seasoned issuer, as defined in Rule 405 of the Securities Act. Yes No Indicate by check mark if the registrant is not required to file reports pursuant to Section 13 or Section 15(d) of the Exchange Act. Yes No Indicate by check mark whether the registrant: (1) has filed all reports required to be filed by Section 13 or 15(d) of the Securities Exchange Act of 1934 during the preceding 12 months
(or for such shorter period that the registrant was required to file such reports), and (2) has been subject to such filing requirements for the past 90 days. Yes No Indicate by check mark whether the registrant has submitted electronically every Interactive Data File required to be submitted pursuant to Rule 405 of Regulation S-T (Section 232.405
of this chapter) during the preceding 12 months (or for such shorter period that the registrant was required to submit such files). Yes No Indicate by check mark whether the registrant is a large accelerated filer, an accelerated filer, a non-accelerated filer, a smaller reporting company, or an emerging growth company. See
definitions of “ large accelerated filer”, “accelerated filer”, “smaller reporting company,” and "emerging growth company" in Rule 12b-2 of the Exchange Act.
Large accelerated filer Accelerated filer Non-accelerated filer Smaller reporting company Emerging growth company
If an emerging growth company, indicate by check mark if the registrant has elected not to use the extended transition period for complying with any new or revised financial accounting standards provided pursuant to Section 13(a) of the Exchange Act.
Indicate by check mark whether the registrant is a shell company (as defined in Rule 12b-2 of the Exchange Act). Yes No The aggregate market value of the class B common stock held by non-affiliates of the registrant was $72,097,367,231 as of June 30, 2019. The registrant’s class A common stock is not
listed on a national securities exchange or traded in an organized over-the-counter market, but each share of the registrant’s class A common stock is convertible into one share of the registrant’s class B common stock.
As of February 6, 2020, there were 156,399,660 outstanding shares of class A common stock and 702,088,016 outstanding shares of class B common stock.DOCUMENTS INCORPORATED BY REFERENCE
Portions of the registrant’s definitive proxy statement for its annual meeting of shareowners scheduled for May 14, 2020 are incorporated by reference into Part III of this report.
4545_Fin_C3.pdf 1 March 5, 2020

UNITED PARCEL SERVICE, INC.ANNUAL REPORT ON FORM 10-K
TABLE OF CONTENTS
PART IItem 1. Business
OverviewStrategyProducts and Services; Reporting SegmentsPeopleCustomersCompetitionCompetitive StrengthsGovernment RegulationWhere You Can Find More Information
Item 1A. Risk FactorsItem 1B. Unresolved Staff CommentsItem 2. Properties
Operating FacilitiesFleet
Item 3. Legal ProceedingsItem 4. Mine Safety Disclosures
PART IIItem 5. Market for Registrant’s Common Equity, Related Stockholder Matters and Issuer Purchases of Equity Securities
Shareowner Return Performance GraphItem 6. Selected Financial DataItem 7. Management’s Discussion and Analysis of Financial Condition and Results of Operations
OverviewSupplemental Information - Items Affecting ComparabilityU.S. Domestic Package OperationsInternational Package OperationsSupply Chain & Freight OperationsConsolidated Operating ExpensesOther Income and (Expense)Income Tax ExpenseLiquidity and Capital ResourcesCollective Bargaining AgreementsNew Accounting PronouncementsRate AdjustmentsCritical Accounting Policies and Estimates
Item 7A. Quantitative and Qualitative Disclosures about Market RiskItem 8. Financial Statements and Supplementary DataItem 9. Changes in and Disagreements with Accountants on Accounting and Financial DisclosureItem 9A. Controls and ProceduresItem 9B. Other Information
PART IIIItem 10. Directors, Executive Officers and Corporate GovernanceItem 11. Executive CompensationItem 12. Security Ownership of Certain Beneficial Owners and Management and Related Stockholder MattersItem 13. Certain Relationships and Related Transactions, and Director IndependenceItem 14. Principal Accountant Fees and Services
PART IVItem 15. Exhibits and Financial Statement SchedulesItem 16. Form 10-K Summary
1112666678
10171717181818
19202122222327303335373839444444455052
129129130
131132132132132
133133
4545_Fin_C2.pdf 2 March 4, 2020

1
PART I
Cautionary Statement About Forward-Looking Statements
This report, our Annual Report to Shareowners and our other filings with the Securities and Exchange Commission (“SEC”) contain “forward-looking statements” within the meaning of the Private Securities Litigation Reform Act of 1995. Statements other than those of current or historical fact, and all statements accompanied by terms such as “believe,” “project,” “expect,” “estimate,” “assume,” “intend,” “anticipate,” “target,” “plan” and variations thereof and similar terms, are intended to be forward-looking statements. Forward-looking statements are made subject to the safe harbor protections of the federal securities laws pursuant to Section 27A of the Securities Act of 1933 and Section 21E of the Securities Exchange Act of 1934.
From time to time, we also include written or oral forward-looking statements in other publicly disclosed materials. Such statements relate to our intent, belief and current expectations about our strategic direction, prospects and future results, and give our current expectations or forecasts of future events; they do not relate strictly to historical or current facts. Management believes that these forward-looking statements are reasonable as and when made. However, caution should be taken not to place undue reliance on any such forward-looking statements because such statements speak only as of the date when made.
Forward-looking statements are subject to certain risks and uncertainties that could cause actual results to differ materially from our historical experience and our present expectations or anticipated results. These risks and uncertainties are described in Part I, “Item 1A. Risk Factors” and may also be described from time to time in our future reports filed with the SEC. You should consider the limitations on, and risks associated with, forward-looking statements and not unduly rely on the accuracy of predictions contained in such forward-looking statements. We do not undertake any obligation to update forward-looking statements to reflect events, circumstances, changes in expectations or the occurrence of unanticipated events after the date of those statements.
Item 1. Business
Overview
United Parcel Service, Inc. (“UPS”) was founded in 1907 as a private messenger and delivery service in Seattle, Washington. Today, we are the world’s largest package delivery company, a leader in the U.S. less-than-truckload industry and a premier provider of global supply chain management solutions. The global market for these services includes transportation, distribution, contract logistics, ground freight, ocean freight, air freight, customs brokerage, insurance and financing.
We operate one of the largest airlines in the world, as well as the world’s largest fleet of alternative-powered vehicles. We deliver packages each business day for 1.6 million shipping customers to 9.9 million delivery customers in over 220 countries and territories. In 2019, we delivered an average of 21.9 million pieces per day, or a total of 5.5 billion packages. Total revenue in 2019 was $74.094 billion.
We have three reporting segments: U.S. Domestic Package and International Package, which together we refer to as our global small package operations, and Supply Chain & Freight, all of which are described below.
Strategy
Our strategy is to provide advanced logistics solutions made possible by a broad portfolio of differentiated services and capabilities integrated into our customers’ businesses. This strategy, supported by our efficient global multimodal network, enables us to deliver value to, and build lasting relationships with, our customers.
Customers are able to leverage our broad portfolio of logistics capabilities comprised of: our extensive presence in North America, Europe, Middle East, Africa, Asia Pacific and Latin America; our reliability; and our industry-leading technologies and solutions.
4545_Fin_C2.pdf 3 March 4, 2020

2
We offer a full range of industry-leading products, services and capabilities across a growing geographical and industry footprint. Achieving our objectives has required new methods and innovative approaches to develop and implement logistics services that address customer needs for speed to market, visibility, reliability and greater control. Recent examples include:
• the acquisition or creation of platform-based offerings such as UPS e-fulfillment and Ware2Go;• specialized healthcare solutions such as UPS Premier, which offers prioritized handling and visibility for critical
healthcare shipments;• a full range of global customs brokerage and shipment insurance services; and• offerings such as UPS My Choice for business that give small- and medium-sized businesses ("SMBs") greater
control, visibility and data access to improve their customer service.
We monitor global trade, economic, geopolitical, regulatory and environmental factors, as well as other factors impacting the business environment. We quickly implement measures to convert risk to opportunity and help our customers adjust their supply chains to a fast-moving world. We have a long history of joint ventures and partnerships that provide operational flexibility and the ability to acquire new capabilities as we build scale, and we also forge new marketplace alliances to stay at the cutting edge of business. For example, our Digital Access Program makes it easier for SMBs to use our services by embedding our shipping solutions directly into leading e-commerce platforms.
We are a disciplined and focused business that purposefully reinvests capital to achieve both long-term strategic benefits and favorable returns. In September 2018, we communicated our commitment to continuous transformation and to invest to modernize our business and operations through state-of-the art technology. We see transformation as an ongoing commitment to enhance quality and efficiency as we deliver innovative capabilities and services. Our strategic investments are primarily focused in areas we believe will drive growth and lasting profit potential:
• services and solutions for SMBs;• international growth markets;• global Business to Consumer (“B2C”) and Business to Business (“B2B”) e-commerce;• healthcare and life-sciences logistics; and• operational improvements to drive greater productivity and the use of automation to enhance the efficiency of our
network.
In recent periods, we have added approximately ten million square feet of highly automated capacity in more than forty new and remodeled facilities globally. We have also continued to implement numerous new technologies to help control the network and ensure resources are in the right place at the right time.
Products and Services; Reporting Segments
Global Small Package
Our global small package operations provide time-definite delivery services for express letters, documents, small packages and palletized freight via air and ground services. These services are supported by numerous shipping, visibility and billing technologies.
All types of service (air, ground, domestic, international, commercial and residential) are managed through a single, global integrated pickup and delivery network. We combine all packages within our network, unless dictated by specific service commitments. This enables one UPS driver to pick up customers’ shipments for any services at a scheduled time each day. Our integrated network uniquely provides operational and capital efficiencies that have less of an impact on the environment than single service network designs.
4545_Fin_C2.pdf 4 March 4, 2020

3
We handle packages up to 108 inches in length that weigh up to 150 pounds and are up to 165 inches in combined length and girth, as well as palletized shipments weighing more than 150 pounds. We offer same-day pickup of air and ground packages seven days a week. Our global network offers approximately 150,000 entry points where customers can tender a package to us at a location or time convenient to them. This integrated network includes UPS drivers who can accept packages, UPS drop boxes, UPS Access Point locations, The UPS Store locations, authorized shipping outlets and commercial counters, alliance locations and customer centers attached to UPS facilities. The UPS Access Point network, which includes local small businesses, national retailers and self-serve lockers, allows consumers to ship or redirect packages to an alternate delivery location or drop off pre-labeled packages, including returns. We have expanded the UPS Access Point network to total approximately 21,000 locations within the U.S. and 40,000 globally.
We have developed a robust portfolio of returns services in more than 145 countries resulting from the continued growth of online and mobile shopping that has increased our customers’ need for efficient and reliable returns. This portfolio provides a range of cost-effective label options and a broad network of consumer drop points, as well as a selection of returns technologies that promote efficiency and a friction-free consumer experience. These options include solutions such as UPS Returns, as well as more-specialized services such as UPS Returns Exchange. Our technologies, such as UPS Returns Manager promote systems integration, customer ease of use and visibility of inbound merchandise, which help reduce costs and improve efficiency in our customers' reverse logistics processes.
Our global air operations are centered at our Worldport hub in Louisville, Kentucky. Our U.S. regional air hubs in Dallas, Texas; Ontario, California; Philadelphia, Pennsylvania and Rockford, Illinois support Worldport. Our European air hub is located in Cologne, Germany, and we maintain Asia Pacific air hubs in Shanghai, China; Shenzhen, China and Hong Kong. Our regional air hub in Canada is located in Hamilton, Ontario and our regional air hub for Latin America and the Caribbean is in Miami, Florida. This network design creates cost-effective package processing in our most technology-enabled facilities, which allows us to use fewer, larger and more fuel-efficient aircraft.
U.S. Domestic Package Reporting Segment
We are a leader in time-definite, guaranteed small package delivery services in the United States. We offer a full spectrum of U.S. domestic guaranteed air and ground package transportation services, and our U.S. ground fleet serves all business and residential zip codes in the contiguous United States.
• UPS's Air portfolio offers options enabling customers to specify a time-of-day guarantee for their delivery (e.g. by8:00 A.M., 10:30 A.M., noon, end of day, etc.), while selecting from same day, next day, two day and three daydelivery alternatives.
• Customers can also leverage our extensive ground network to ship using our day-definite guaranteed Ground service.We deliver more ground packages in the U.S. than any other carrier, with average daily package volume of 15 million,most within one to three business days.
• We offer UPS SurePost, an economy residential ground service for customers with non-urgent, lightweight residentialshipments. UPS SurePost is a residential ground service that combines the consistency and reliability of the UPSground network with final delivery often provided by the U.S. Postal Service.
International Package Reporting Segment
Our International Package reporting segment consists of our small package operations in Europe, Asia Pacific, Canada, Latin America and the Indian sub-continent, Middle East and Africa ("ISMEA"). We offer a wide selection of guaranteed day- and time-definite international shipping services. We offer more guaranteed time-definite express options (Express Plus, Express and Express Saver) than any other carrier.
In recent years we have continued the expansion of our Express time-definite portfolio, with certain products now reaching as many as 220 countries and territories. For international package shipments that do not require Express services, UPS Worldwide Expedited offers a reliable, deferred, guaranteed day-definite service option. The service is now available from more than 80 origin countries to more than 220 countries and territories. For cross-border ground package delivery, we offer UPS Standard delivery services within Europe, between the U.S. and Canada and between the U.S. and Mexico.
By expanding our time-definite services, we are better able to offer customers the services they need in the places they do business. For businesses with time-sensitive shipments, these upgrades can help replenish inventories quicker, improve time to market and meet urgent delivery requirements.
Europe, our largest region outside of the U.S., accounts for approximately half of our international small package segment revenue and is one of the primary drivers of our growth. We continue to make major European infrastructure investments, including new hubs in London, Paris and Eindhoven, the Netherlands.
4545_Fin_C2.pdf 5 March 4, 2020
4
Asia Pacific also remains a strategic market due to growth rates in intra-Asia trade. To capitalize on these opportunities, we have continued to bring faster time-in-transit to customers focused on intra-Asia trade and reduced transit times from Asia to the U.S. and Europe. Through added flight frequencies, we now provide our customers the ability to ship next day to more places in the U.S. and Europe - guaranteed - than any other express carrier. We serve more than 40 Asia Pacific countries and territories through more than two dozen alliances with local delivery companies that supplement our owned operations. For example, our joint venture with SF Express combines SF’s extensive Chinese network with UPS’s delivery capabilities in the U.S. and Europe, increasing our market presence and providing Chinese enterprises with greater global access. In addition, improvements to time-in-transit for UPS Express Saver and UPS Worldwide Expedited services to Shanghai have resulted in faster delivery by a full day to 185 postal codes for packages coming from Europe.
International high-growth markets remain one of our strategic imperatives. Our direct flight from the U.S. to Dubai has improved time-in-transit to key destinations in ISMEA for shippers throughout the U.S., Canada and the Americas. Markets like India also provide opportunities for growth. In support of this, we acquired full ownership of our express services unit in 2018. The unit helps Indian businesses, large and small, connect with global markets via the UPS network. This follows the opening of two integrated logistics facilities in Hyderabad and Ahmedabad from where customers are provided a 48-hour delivery timeline to markets in the U.S. and Europe. In addition to these upgrades, we have added Saturday delivery to seven countries in ISMEA and expanded Express Services to India, the Middle East and other international high-growth markets ahead of Expo 2020 in Dubai, offering greater flexibility and competitiveness.
Supply Chain & Freight
Supply Chain & Freight consists of our forwarding, truckload brokerage, logistics, UPS Freight, UPS Capital and other businesses. Supply chain complexity creates demand for a global service offering that incorporates transportation, distribution and international trade and brokerage services, with complementary financial and information services. Outsourcing non-core logistics activity is a strategy more companies are pursuing. With increased competition and growth opportunities in new markets, businesses require flexible and responsive supply chains to support their strategies. We meet this demand by offering a broad array of supply chain services in more than 200 countries and territories.
Forwarding
We are one of the largest U.S. domestic air freight carriers and among the top international air freight forwarders globally. We offer a portfolio of guaranteed and non-guaranteed global air freight services. Additionally, as one of the world’s leading non-vessel operating common carriers, we provide ocean freight full-container load, less-than-container load and multimodal transportation services between most major ports around the world.
Truckload Brokerage
Our acquisition of Coyote Logistics, LLC, a U.S.-based third party logistics provider, in 2015 has resulted in synergies in the areas of purchased transportation, backhaul utilization, technology systems and industry best practices. Coyote's access to our fleet, combined with its broad carrier network, has created a customized capacity solution for all markets, customers and situations. In addition, Coyote provides access to UPS services (such as air freight, customs brokerage and global freight forwarding) for its customer base.
Our acquisition of Freightex, a U.K.- based freight brokerage firm, in 2017 added a full scale truckload brokerage and transportation management solution to our European portfolio, creating a single-source solution for shippers throughout Europe with freight ranging from parcel to full truckload. In 2018, Freightex was rebranded as Coyote Logistics to further leverage the centralized technology and business models with the market knowledge, talent and established customer and carrier bases already in Europe. Coyote Logistics's European division complements our North American truckload brokerage business, as many international shippers know and trust the Coyote truckload product.
Logistics
We provide value-added fulfillment and transportation management services to customers through our global network of owned and leased distribution centers and field stocking locations. We leverage a global network of more than 1,000 facilities in more than 100 countries to ensure products and parts are in the right place at the right time.
4545_Fin_C2.pdf 6 March 4, 2020

5
Our distribution centers are strategically located near UPS air and ground transportation hubs for rapid delivery to consumer and business markets. In 2019, we expanded our network to support new business growth by adding 2 million square feet of distribution capacity. We also continued to expand our cloud-based transportation and warehouse management platforms, driving higher operational efficiency and improved customer service. The result has been better visibility, more rapid onboarding of customers and improved flexibility and response times.
With the strategic focus of serving the unique, priority-handling needs of healthcare and life sciences customers, U.S. healthcare warehouse and distribution space will total approximately 5 million square feet in 2020. Key features in the new facilities include climate controls and validated coolers and freezers for customer products requiring strict temperature-controlled environments.
In 2019, we expanded our e-commerce solutions for SMBs worldwide, offering streamlined fulfillment and shipping services to consumers in the U.S. and Canada. We launched the UPS eFulfillment program to help sellers quickly and easily manage multiple marketplaces. The program, which is compatible with over 20 e-commerce marketplaces, includes a technology platform and physical fulfillment services, such as storage, order processing, packaging and shipping.
UPS Post Sales, our service parts logistics solution, relies on a global network of over 950 central and field stocking sites to provide same and next-day spare parts delivery, enabling customers to get critical equipment back up and running. This solution focuses on customers within the high tech, industrial manufacturing, automotive, healthcare and aerospace sectors. More specific to the healthcare industry, UPS has an implantable medical device solution leveraging 36 field stocking sites, which helps ensure surgical kits and devices arrive safely and on time at hospital and surgery centers. Implantable medical device firms benefit from outsourcing and optimizing their supply chain with UPS, which drives down costs and increases control and service levels.
Also in 2019, UPS announced an expansion of foreign trade zone (“FTZ”) management services in the U.S.. Since our acquisition of Zone Solutions in 2017, we have developed a comprehensive FTZ solution that helps clients manage the end-to-end process, from dealing with customers to inventory control. The integration of FTZ services with our logistics network means UPS can designate any of our 42 U.S. distribution centers as a FTZ, allowing customers to take advantage of the program’s benefits. The strategic utilization of the FTZ program provides opportunities for duty elimination and duty deferral.
UPS Freight
UPS Freight offers regional, inter-regional and long-haul less-than-truckload ("LTL") services in all 50 states, Canada, Puerto Rico, Guam, the U.S. Virgin Islands and Mexico. UPS Freight provides reliable LTL service backed by a day-definite, on-time guarantee at no additional cost. UPS Freight also provides dedicated contract carriage truckload services. User friendly shipping, visibility and billing technology offerings, including UPS WorldShip, Quantum View and UPS Billing Center, allow freight customers to create electronic bills of lading, monitor shipment progress and reconcile shipping charges.
Customs Brokerage
We are among the world’s largest customs brokers by both the number of shipments processed annually and by the number of dedicated brokerage employees worldwide. In addition to customs clearance services, we provide product classification, trade management, duty drawback and consulting services through STTAS, a UPS company.
UPS Capital
UPS Capital provides financial, insurance and payment services to support all aspects of the order-to-cash cycle and help protect companies from risk in their supply chains. Services are available in 22 countries and territories. UPS Capital also offers insured transportation of high value goods including loose gemstones, finished jewelry and wristwatches.
4545_Fin_C2.pdf 7 March 4, 2020

6
People
The strength of UPS is our people, working together with a common purpose. We have more than 495,000 employees (excluding temporary seasonal employees), of which 413,000 are in the U.S. and 82,000 are located internationally. Our global workforce includes approximately 87,000 management employees (40% of whom are part-time) and 408,000 hourly employees (49% of whom are part-time).
For information regarding employees employed under collective bargaining agreements, see note 6 to the audited, consolidated financial statements.
Customers
As described below, we believe that our focus on building and maintaining long-term customer relationships is a competitive strength of UPS. We serve 1.6 million shipping customers and more than 9.9 million delivery customers daily. For the year ended December 31, 2019, one customer, Amazon.com, Inc. and its affiliates, represented approximately 11.6% of our consolidated revenues, substantially all of which was within our U.S. Domestic Package segment. For additional information on our customers, see “Risk Factors - Changes in our relationships with any of our significant customers, including the loss or reduction in business from one or more of them, could have a material adverse effect on us” and note 13 to the audited, consolidated financial statements.
Competition
We offer a broad array of services in the package and freight delivery industry and compete with many local, regional, national and international logistics providers. We believe our strategy, network and competitive strengths position us well to compete in the marketplace. For additional information on our competitive environment, see "Risk Factors - Our industry is rapidly evolving. We expect to continue to face significant competition, which could adversely affect us".
Competitive Strengths
Our competitive strengths include:
Efficient Multimodal Network. We believe that our integrated global air and ground network is the most extensive in the industry. We provide all types of package services (air, ground, domestic, international, commercial and residential) through a single pickup and delivery network. We also have extensive air freight, ocean freight, ground freight and logistics networks that provide additional capabilities in the global transportation and logistics market. Our sophisticated engineering systems allow us to optimize our network efficiency and asset utilization.
Global Presence. We serve more than 220 countries and territories. We have a significant presence in all of the world’s major economies.
Cutting-Edge Technology. Technology powers virtually every service we offer and every operation we perform. We are a global leader in developing technology that helps our customers enhance their shipping and logistics business processes to lower costs, improve service and increase efficiency. We offer a variety of online service options that enable our customers to integrate UPS functionality into their own businesses to send, manage and track their shipments conveniently, and also to provide their customers with better information services. We provide the infrastructure for an internet presence that extends to tens of thousands of customers who have integrated UPS tools directly into their own websites.
Broad Portfolio of Services. Our portfolio of services helps customers choose the delivery option that is most appropriate for their requirements. Increasingly, our customers benefit from business solutions that integrate many UPS services beyond package delivery. For example, our supply chain services – such as freight forwarding, truckload brokerage, customs brokerage, order fulfillment and returns management – help improve the efficiency of the entire supply chain management process.
Customer Relationships. We focus on building and maintaining long-term customer relationships. We serve 1.6 million shipping customers daily and deliver packages to more than 9.9 million delivery customers daily. Cross selling small package and supply chain services across our customer base is an important growth mechanism for UPS.
Brand Equity. We have built a leading and trusted brand that stands for quality, reliability and service innovation. The distinctive appearance of our vehicles and the professional courtesy of our drivers are major contributors to our brand equity.
4545_Fin_C2.pdf 8 March 4, 2020
7
Distinctive Culture. We believe that the dedication of our employees comes in large part from our distinctive “employee-owner” concept. Our employee stock ownership tradition dates back to 1927, when our founders, who believed that employee stock ownership was a vital foundation for successful business, created our first stock ownership program.
Financial Strength. Our financial strength allows us to achieve global scale; to invest in employee development, technology, transportation equipment and facilities; to pursue strategic opportunities that facilitate our growth; to service our obligations and to return value to our shareowners.
Government Regulation
We are subject to numerous laws and regulations in the countries in which we operate. Key laws and regulations are summarized below.
Air Operations
The U.S. Department of Transportation (“DOT”), the Federal Aviation Administration (“FAA”) and the U.S. Department of Homeland Security, through the Transportation Security Administration (“TSA”), have regulatory authority over our air transportation services. The Federal Aviation Act of 1958, as amended, is the statutory basis for DOT and FAA authority and the Aviation and Transportation Security Act of 2001, as amended, is the basis for TSA aviation security authority.
The DOT’s authority primarily relates to economic aspects of air transportation, such as operations, authority, insurance requirements, pricing, non-competitive practices, interlocking relations and cooperative agreements. The DOT also regulates, subject to the authority of the President of the United States, international routes, fares, rates and practices and is authorized to investigate and take action against discriminatory treatment of U.S. air carriers abroad. International operating rights for U.S. airlines are usually subject to bilateral agreements between the U.S. and foreign governments or, in the absence of such agreements, by principles of reciprocity. We are also subject to current and potential aviation regulations imposed by governments in other countries in which we operate, including registration and license requirements and security regulations. We have international route operating rights granted by the DOT and we may apply for additional authorities when those operating rights are available and are required for the efficient operation of our international network. The efficiency and flexibility of our international air transportation network is dependent on DOT and foreign government regulations and operating restrictions.
The FAA’s authority primarily relates to safety aspects of air transportation, including certification, aircraft operating procedures, transportation of hazardous materials, record keeping standards and maintenance activities and personnel. In 1988, the FAA granted us an operating certificate, which remains in effect so long as we meet the safety and operational requirements of the applicable FAA regulations. In addition, we are subject to non-U.S. government regulation of aviation rights involving non-U.S. jurisdictions and non-U.S. customs regulation.
UPS's aircraft maintenance programs and procedures, including aircraft inspection and repair at periodic intervals, are approved for all aircraft under FAA regulations. The future cost of repairs pursuant to these programs may fluctuate according to aircraft condition, age and the enactment of additional FAA regulatory requirements.
The TSA regulates various security aspects of air cargo transportation in a manner consistent with the TSA mission statement to “protect the Nation’s transportation systems to ensure freedom of movement for people and commerce.” Our airport and off-airport locations, as well as our personnel, facilities and procedures involved in air cargo transportation must comply with TSA regulations.
UPS Airlines, along with a number of other U.S. domestic airlines, participates in the Civil Reserve Air Fleet (“CRAF”) program. Our participation in the CRAF program allows the U.S. Department of Defense (“DOD”) to requisition specified UPS Airlines aircraft for military use during a national defense emergency. The DOD is required to compensate us for the use of aircraft under the CRAF program. In addition, participation in CRAF entitles us to bid for other U.S. Government opportunities including small package and air freight.
Ground Operations
Our ground transportation of packages in the U.S. is subject to regulation by the DOT and its agency, the Federal Motor Carrier Safety Administration (the “FMCSA”). Ground transportation also falls under state jurisdiction with respect to the regulation of operations, safety and insurance. Our ground transportation of hazardous materials in the U.S. is subject to regulation by the DOT's Pipeline and Hazardous Materials Safety Administration. We also must comply with safety and fitness regulations promulgated by the FMCSA, including those relating to drug and alcohol testing and hours of service for drivers. We are subject to similar regulation in many non-U.S. jurisdictions.
4545_Fin_C2.pdf 9 March 4, 2020

8
The Postal Reorganization Act of 1970 created the U.S. Postal Service as an independent establishment of the executive branch of the federal government, and created the Postal Rate Commission, an independent agency, to recommend postal rates. The Postal Accountability and Enhancement Act of 2006 amended the 1970 Act to give the re-named Postal Regulatory Commission revised oversight authority over many aspects of the Postal Service, including postal rates, product offerings and service standards. We sometimes participate in proceedings before the Postal Regulatory Commission in an attempt to secure fair postal rates for competitive services.
Our ground operations are also subject to compliance with various cargo-security and transportation regulations issued by the U.S. Department of Homeland Security, including regulation by the TSA.
Customs
We are subject to the customs laws regarding the import and export of shipments in the countries in which we operate, including those related to the filing of documents on behalf of client importers and exporters. Our activities in the U.S., including customs brokerage and freight forwarding, are subject to regulation by the Bureau of Customs and Border Protection, the TSA, the U.S. Federal Maritime Commission and the DOT. Our international operations are subject to similar regulatory structures in their respective jurisdictions.
Environmental
We are subject to federal, state and local environmental laws and regulations across all of our business units. These laws and regulations cover a variety of processes, including, but not limited to: properly storing, handling and disposing of waste materials; appropriately managing waste water and stormwater; monitoring and maintaining the integrity of underground storage tanks; complying with laws regarding clean air, including those governing emissions; protecting against and appropriately responding to spills and releases and communicating the presence of reportable quantities of hazardous materials to local responders. We have established site- and activity-specific environmental compliance and pollution prevention programs to address our environmental responsibilities and remain compliant. In addition, we have created numerous programs which seek to minimize waste and prevent pollution within our operations.
Pursuant to the Federal Aviation Act, the FAA, with the assistance of the Environmental Protection Agency is authorized to establish standards governing aircraft noise. Our aircraft fleet is in compliance with current noise standards of the federal aviation regulations. Our international operations are also subject to noise regulations in certain countries in which we operate.
Communications and Data Protection
Because of our extensive use of radio and other communication facilities in our aircraft and ground transportation operations, we are subject to the Federal Communications Act of 1934, as amended. In addition, the Federal Communications Commission regulates and licenses our activities pertaining to satellite communications. There has recently been increased regulatory and enforcement focus on data protection in the U.S. (at both the state and federal level) and in other countries. For example, the European Union (“E.U.”) General Data Protection Regulation (“GDPR”), which became effective in May 2018, greatly increases the jurisdictional reach of E.U. law and increases the requirements related to personal data, including individual notice and opt-out preferences and public disclosure of significant data breaches. Additionally, violations of the GDPR can result in significant fines. Other governments have enacted or are enacting similar data protection laws, and are considering data localization laws that would govern the use of data outside of their respective jurisdictions.
Where You Can Find More Information
We maintain a website at www.ups.com. Our annual report on Form 10-K, quarterly reports on Form 10-Q, current reports on Form 8-K and any amendments to those reports filed with or furnished to the SEC pursuant to Section 13(a) of the Securities Exchange Act of 1934 are made available free of charge through our investor relations website at www.investors.ups.com under the heading "Financials - SEC Filings" as soon as reasonably practical after we electronically file or furnish the reports to the SEC. We have a written Code of Business Conduct that applies to all of our directors, officers and employees, including our principal executive and financial officers. It is available under the heading "ESG"- Governance Documents" on our investor relations website. In the event that we make changes in, or provide waivers from, the provisions of the Code of Business Conduct that the SEC requires us to disclose, we intend to disclose these events within four business days following the date of the amendment or waiver in that section of our investor relations website.
4545_Fin_C2.pdf 10 March 4, 2020

9
Our Corporate Governance Guidelines and the Charters for our Audit Committee, Compensation Committee, Executive Committee, Risk Committee and Nominating and Corporate Governance Committee are also available under the heading "ESG- Governance Documents" on our investor relations website.
Our sustainability report, which describes our activities that support our commitment to acting responsibly and contributing to society, is available at www.sustainability.ups.com.
We provide the addresses to our internet sites solely for information. We do not intend for any addresses to be active links or to otherwise incorporate the contents of any website into this or any other report we file with the SEC.
4545_Fin_C2.pdf 11 March 4, 2020

10
Item 1A. Risk Factors
Our business, financial condition and results are subject to numerous risks and uncertainties. In connection with any investment decision, you should carefully consider the following significant factors, which could materially affect us, including impacting our business, financial condition, results of operations, stock price or credit rating, as well as our reputation. You should read these risk factors in conjunction with “Management’s Discussion and Analysis of Financial Condition and Results of Operations” in Item 7 and our Consolidated Financial Statements and related notes in Item 8. These risks are not the only ones we face. We could also be affected by other events, factors or uncertainties that are unknown to us, or that we do not currently consider to be significant risks.
Changes in general economic conditions, in the U.S. and internationally, may adversely affect us.
We conduct operations in over 220 countries and territories. Our operations are subject to cyclicality affecting national and international economies in general, as well as the local economic environments in which we operate. The factors that result in general economic changes are beyond our control, and it may be difficult for us to adjust our business model to mitigate the impact of these factors. In particular, our business is affected by levels of industrial production, consumer spending and retail activity and we could be materially affected by adverse developments in these aspects of the economy. In addition, there remains substantial economic uncertainty arising from the United Kingdom’s decision to leave the European Union. The U.K. and the E.U. continue to negotiate the future relationship between themselves, which could take several years to finalize. The outcome of these negotiations could result in, among other things, transportation delays, fewer goods being transported globally, additional volatility in currency exchange rates and further regulations relating to, among other things, trade, aviation and the transport of goods. Any of the foregoing could materially adversely affect us.
Our industry is rapidly evolving. We expect to continue to face significant competition, which could adversely affect us.
Our industry is rapidly evolving, including demand for faster deliveries and increased visibility into shipments. We expect continued significant competition on a local, regional, national and international basis. Our competitors include the postal services of the U.S. and other nations, various motor carriers, express companies, freight forwarders, air couriers, large transportation and e-commerce companies that are making significant investments in their capabilities, and start ups and other companies that combine technologies with crowdsourcing to focus on local market needs, some of whom may currently be our customers. Competition may also come from other sources in the future, including as new technologies are developed. Competitors have cost and organizational structures that differ from ours and from time to time may offer services or pricing terms that we may not be willing or able to offer. Additionally, to remain competitive, from time to time we may have to raise prices and our customers may not be willing to accept these higher prices. If we are unable to timely and appropriately respond to competitive pressures, we could be adversely affected.
Continued transportation industry consolidation may further increase competition. As a result of consolidation, competitors may increase their market share, improve their financial capacity and strengthen their competitive positions. Business combinations could also result in competitors providing a wider variety of services and products at competitive prices, which could adversely affect us.
Changes in our relationships with any of our significant customers, including the loss or reduction in business from one or more of them, could have a material adverse effect on us.
For the year ended December 31, 2019, one customer, Amazon.com and its affiliates, accounted for 11.6% of our consolidated revenues. Some of our other significant customers can account for a relatively significant portion of our revenues in a particular quarter or year. These customers can impact our revenues based on factors such as: customer product launches; e-commerce or other industry trends, such as the seasonality associated with the fourth quarter holiday season; businesscombinations and the overall growth of a customer's underlying business; as well as any disruptions to their businesses. Thesecustomers could choose to divert all or a portion of their business with us to one of our competitors, demand pricingconcessions for our services, require us to provide enhanced services that increase our costs, or develop their own shipping anddistribution capabilities. In addition, certain of our significant customer contracts include termination rights of either party uponthe occurrence of certain events or without cause upon advance notice to the other party. If all or a portion of our businessrelationships with one or more significant customers were to terminate or be canceled it could materially adversely affect us.
4545_Fin_C2.pdf 12 March 4, 2020

11
Our business is subject to complex and stringent laws, regulations and policies which could increase our operating costs.
We are subject to complex and stringent aviation, transportation, environmental, security, labor, employment, safety, privacy and data protection and other governmental laws, regulations and policies, both in the U.S. and in other countries in which we operate. In addition, we are impacted by laws, regulations and policies that affect global trade, including tariff and trade policies, export requirements, taxes, monetary policies and other restrictions and charges. Recently, trade discussions between the U.S. and various of its trading partners have been fluid, and existing and future trade agreements are and are expected to continue to be subject to a number of uncertainties, including the imposition of new tariffs or adjustments and changes to the products covered by existing tariffs. The impact of new laws, regulations and policies or decisions or interpretations by authorities applying those laws and regulations, cannot be predicted. Compliance with any new laws or regulations may increase our operating costs or require significant capital expenditures. Any failure to comply with applicable laws, regulations or policies in the U.S. or in any of the other countries in which we operate could result in substantial fines or possible revocation of our authority to conduct our operations, which could adversely affect us.
Increased security requirements impose substantial costs on us and we could be the target of an attack or have a security breach, which could materially adversely affect us.
As a result of concerns about global terrorism and homeland security, governments around the world have adopted or may adopt stricter security requirements that will result in increased operating costs for businesses in the transportation industry. These requirements may change periodically as a result of regulatory and legislative requirements and in response to evolving threats. We cannot determine the effect that any new requirements will have on our cost structure or our operating results, and new rules or other future security requirements may increase our costs of operations and reduce operating efficiencies. Regardless of our compliance with security requirements or the steps we take to secure our facilities or fleet, we could also be the target of an attack or security breaches could occur, which could materially adversely affect us.
Increasingly stringent regulations related to climate change could materially increase our operating costs.
Regulation of greenhouse gas ("GHG") emissions exposes our transportation and logistics businesses to potentially significant new taxes, fees and other costs. Compliance with such regulation, and any increased or additional regulation, or the associated costs is further complicated by the fact that various countries and regions are following different approaches to the regulation of climate change.
For example, in 2009 the European Commission approved the extension to the airline industry of the European Union Emissions Trading Scheme (“ETS”) for GHG emissions. Under this decision, all of our flights operating within the European Union are covered by the ETS requirements, and we are required annually to purchase emission allowances in an amount exceeding the number of free allowances allocated to us under the ETS. Similarly, in 2016, the International Civil Aviation Organization (“ICAO”) passed a resolution adopting the Carbon Offsetting and Reduction Scheme for International Aviation (“CORSIA”), which is a global, market-based emissions offset program to encourage carbon-neutral growth beyond 2020. A pilot phase is scheduled to begin in 2021 in which countries may voluntarily participate, and full mandatory participation is scheduled to begin in 2027. ICAO continues to develop details regarding implementation, but compliance with CORSIA will increase our operating costs.
In the U.S., Congress in the past several years has considered various bills that would regulate GHG emissions, but these bills so far have not received sufficient Congressional support for enactment. Nevertheless, some form of federal climate change legislation is possible in the future. Even in the absence of such legislation, the Environmental Protection Agency (“EPA”), spurred by judicial interpretation of the Clean Air Act, could determine to regulate GHG emissions, especially aircraft or diesel engine emissions, and this could impose substantial costs on us.
In November 2019, the U.S. began the process to withdraw from the Paris climate accord, an agreement among 196 countries to reduce GHG emissions. The effect of that withdrawal on future U.S. policy regarding GHG emissions, on CORSIA and on other GHG regulation is uncertain. Nevertheless, the extent to which other countries implement that agreement could have an adverse direct or indirect effect on us.
We may face additional regulations regarding GHG emissions internationally and in the United States. Potential costs to us of increased regulation regarding GHG emissions, especially aircraft or diesel engine emissions, include an increase in the cost of the fuel and other energy we purchase and capital costs associated with updating or replacing our aircraft or vehicles prematurely. We cannot predict the impact any future regulation would have on our cost structure or our operating results. It is possible that such regulation could significantly increase our operating costs and that we may not be willing or able to pass such costs along to our customers. Moreover, even without such regulation, increased awareness and any adverse publicity in the global marketplace about the GHGs emitted by companies in the airline and transportation industries could harm our reputation and reduce customer demand for our services, especially our air services.
4545_Fin_C2.pdf 13 March 4, 2020

12
Strikes, work stoppages and slowdowns by our employees could adversely affect us.
Many of our U.S. employees are employed under a national master agreement and various supplemental agreements with local unions affiliated with the Teamsters. Our airline pilots, airline mechanics, ground mechanics and certain other employees are employed under other collective bargaining agreements. In addition, some of our international employees are employed under collective bargaining or similar agreements. Strikes, work stoppages or slowdowns by our employees could adversely affect our ability to meet our customers' needs. As a result, customers may reduce their business or stop doing business with us if they believe that such actions or threatened actions may adversely affect our ability to provide services. We may face a permanent loss of customers if we are unable to provide uninterrupted service, and this could materially adversely affect us. The terms of future collective bargaining agreements also may affect our competitive position and results of operations.
We are exposed to the effects of changing fuel and energy prices, including gasoline, diesel and jet fuel, and interruptions in supplies of these commodities.
Changing fuel and energy costs have a significant impact on our operations. We require significant quantities of fuel for our aircraft and delivery vehicles and are exposed to the risks associated with variations in the market price for petroleum products, including gasoline, diesel and jet fuel. We mitigate our exposure to changing fuel prices through our indexed fuel surcharges and through hedging transactions from time to time. If we are unable to maintain or increase our fuel surcharges, higher fuel costs could adversely impact our operating results. Even if we are able to offset changes in fuel costs with surcharges, high fuel surcharges may result in a mix shift from our higher-yielding air products to lower-yielding ground products or an overall reduction in volume. There can also be no assurance that hedging transactions will be effective to protect us from changes in fuel prices. Moreover, we could experience a disruption in energy supplies as a result of war, actions by producers or other factors beyond our control, which could have a material adverse effect on us.
Changes in exchange rates or interest rates may have a material adverse effect on us.
We conduct business across the globe with a significant portion of our revenue derived from operations outside the United States. Our operations in international markets are affected by changes in the exchange rates for local currencies, and in particular the Euro, British Pound Sterling, Canadian Dollar, Chinese Renminbi and Hong Kong Dollar.
We are exposed to changes in interest rates, primarily on our short-term debt and that portion of our long-term debt that carries floating interest rates. The impact of a 100-basis-point change in interest rates affecting our debt is discussed in the “Quantitative and Qualitative Disclosures about Market Risk” section of this report. Additionally, changes in interest rates impact the valuation of our pension and postretirement benefit obligations and the related benefit cost recognized in the income statement. The impact of changes in interest rates on our pension and postretirement benefit obligations and costs is discussed further in the "Critical Accounting Policies and Estimates" section of this report.
We monitor and manage our exposures to changes in currency exchange rates and interest rates, and use derivative instruments to mitigate the impact of changes in these rates on our financial position and results of operations; however, changes in exchange rates and interest rates cannot always be predicted or hedged and may have a material adverse effect on us.
The proposed phase out of the London Interbank Offer Rate ("LIBOR") could have an adverse effect on us.
Certain of our debt and other financial instruments have interest rates tied to LIBOR. The head of the United Kingdom Financial Conduct Authority has announced the desire to phase out the use of LIBOR by the end of 2021. There is currently no definitive information regarding the future utilization of LIBOR or any particular replacement rate. As such, the potential effect of any such event on our cost of capital cannot be determined. In addition, any further changes or reforms to the determination or supervision of LIBOR may result in a sudden or prolonged increase or decrease in reported LIBOR, which could have an adverse impact on extensions of credit held by us and could have a material adverse effect on us.
4545_Fin_C2.pdf 14 March 4, 2020

13
Failure to maintain our brand image and corporate reputation could adversely impact us.
Our success depends in part on our ability to maintain the image of the UPS brand and our reputation for providing excellent service to our customers. Service quality issues, actual or perceived, even when false or unfounded, could tarnish the image of our brand and may cause customers to use other companies. Also, adverse publicity surrounding labor relations, environmental concerns, security matters, political activities and similar matters, or attempts to connect our company to such issues, either in the United States or other countries in which we operate, could negatively affect our overall reputation and use of our services by customers. Social media accelerates and amplifies the scope of negative publicity, and makes responding to negative claims more difficult. Damage to our reputation and loss of brand equity could reduce demand for our services and thus have a material adverse effect on us, and could require additional resources to rebuild our reputation and restore the value of our brand.
A significant data breach or IT system disruption could materially adversely affect us, including requiring us to increase spending on data and system security.
We rely heavily on information technology networks and systems, including the Internet and a number of internally-developed systems and applications, to manage or support a wide variety of important business processes and activities throughout our operations. For example, we rely on information technology to receive package level information in advance of physical receipt of packages, to track items that move through our delivery systems, to efficiently plan deliveries, to execute billing processes, and to track and report financial and operational data. Our franchised center locations and businesses we have acquired also are reliant on the use of information technology systems to manage their business processes and activities.
In addition, the provision of service to our customers and the operation of our networks and systems involve the collection, storage and transmission of significant amounts of proprietary information and sensitive or confidential data, including personal information of customers, employees and others. To conduct our operations, we regularly move data across national borders, and consequently we are subject to a variety of continuously evolving and developing laws and regulations in the United States and abroad regarding privacy, data protection and data security. The scope of the laws that may be applicable to us is often uncertain and may be conflicting, particularly with respect to foreign laws. For example, the European Union’s General Data Protection Regulation (“GDPR”), which greatly increases the jurisdictional reach of European Union law and adds a broad array of requirements for handling personal data, including the public disclosure of significant data breaches, became effective in May 2018. Other countries have enacted or are enacting data localization laws that require data to stay within their borders. All of these evolving compliance and operational requirements impose significant costs that are likely to increase over time.
Our information technology systems (as well as those of our franchisees and acquired businesses) are susceptible to damage, disruptions or shutdowns due to programming errors, defects or other vulnerabilities, power outages, hardware failures, computer viruses, cyber-attacks, ransomware attacks, malware attacks, theft, misconduct by employees or other insiders, telecommunications failures, misuse, human errors or other catastrophic events. Hackers, foreign governments, cyber-terrorists and cyber-criminals, acting individually or in coordinated groups, may launch distributed denial of service attacks or other coordinated attacks that may cause service outages, gain inappropriate or block legitimate access to systems or information, or result in other interruptions in our business. In addition, the foregoing breaches in security could expose us, our customers and franchisees, or the individuals affected, to a risk of loss, disclosure or misuse of proprietary information and sensitive or confidential data, including personal information of customers, employees and others. The techniques used to obtain unauthorized access, disable or degrade service or sabotage systems change frequently, may be difficult to detect and often are not recognized until launched against a target. As a result, we may be unable to anticipate these techniques or to implement adequate measures to prevent any of the events described above.
We also depend on and interact with the information technology networks and systems of third-parties for many aspects of our business operations, including our customers, and franchisees and service providers such as cloud service providers and third-party delivery services. These third parties may have access to information we maintain about our company, operations, customers, employees and vendors, or operating systems that are critical to or can significantly impact our business operations. Like us, these third parties are subject to risks imposed by data breaches and IT systems disruptions like those described above, and other events or actions that could damage, disrupt or close down their networks or systems. Security processes, protocols and standards that we have implemented and contractual provisions requiring security measures that we may have sought to impose on such third-parties may not be sufficient or effective at preventing such events. These events could result in unauthorized access to, or disruptions or denials of access to, misuse or disclosure of, information or systems that are important to our business, including proprietary information, sensitive or confidential data, and other information about our operations, customers, employees and suppliers, including personal information.
4545_Fin_C2.pdf 15 March 4, 2020

14
Any of these events that impact our information technology networks or systems, or those of acquired businesses, franchisees, customers, service providers or other third-parties, could result in disruptions in our operations, the loss of existing or potential customers, damage to our brand and reputation, regulatory scrutiny, and litigation and potential liability for us. Among other consequences, our customers’ confidence in our ability to protect data and systems and to provide services consistent with their expectations could be impacted, further disrupting our operations. Similarly, an actual or alleged failure to comply with applicable U.S. or foreign data protection regulations or other data protection standards may expose us to litigation, fines, sanctions or other penalties.
We have invested and continue to invest in technology security initiatives, information technology risk management and disaster recovery plans. The cost and operational consequences of implementing, maintaining and enhancing further data or system protection measures could increase significantly to overcome increasingly intense, complex and sophisticated global cyber threats. Despite our best efforts, we are not fully insulated from data breaches and system disruptions. Although to date we are unaware of a data breach or system disruption, including a cyber-attack, that has been material to us, we cannot provide any assurances that such events and impacts will not be material in the future, and our efforts to deter, identify, mitigate and/or eliminate future breaches may require significant additional effort and expense and may not be successful.
Severe weather or other natural or manmade disasters could adversely affect us.
Severe weather conditions and other natural or manmade disasters, including storms, floods, fires, earthquakes, epidemics, pandemics, conflicts, unrest, or terrorist attacks, may disrupt our business and result in decreased revenues. Customers may reduce shipments, or our costs to operate our business may increase, either of which could have a material adverse effect on us. Any such event affecting one of our major facilities could result in a significant interruption in or disruption of our business.
We make significant capital investments in our business of which a significant portion is tied to projected volume levels.
We require significant capital investments in our business consisting of aircraft, vehicles, technology, facilities and sorting and other types of equipment. These investments support both our existing business and anticipated growth. Forecasting projected volume involves many factors which are subject to uncertainty, such as general economic trends, changes in governmental regulation and competition. If we do not accurately forecast our future capital investment needs, we could have excess capacity or insufficient capacity, either of which would negatively affect our revenues and profitability. In addition to forecasting our capital investment requirements, we adjust other elements of our operations and cost structure in response to adverse economic conditions; however, these adjustments may not be sufficient to allow us to maintain our operating margins.
Economic, political, social developments and other risks associated with international operations could adversely affect us.
We have significant international operations. As a result, we are continually exposed to changing economic, political and social developments that are beyond our control. Emerging markets are typically more volatile than those in the developed world, and any broad-based downturn in these markets could reduce our revenues and adversely affect our business, financial position and results of operations. We are subject to many laws governing our international operations, including those that prohibit improper payments to government officials and commercial customers, and restrict where we can do business, our shipments to certain countries and the information that we can provide to non-U.S. governments. Our failure to manage and anticipate these and other risks associated with our international operations could materially adversely affect us.
We are subject to changes in markets and our business plans that have resulted, and may in the future result, in substantial write-downs of the carrying value of our assets, thereby reducing our net income.
Our regular review of the carrying value of our assets has resulted, from time to time, in significant impairments, and we may in the future be required to recognize additional impairment charges. Changes in business strategy, government regulations, or economic or market conditions have resulted and may result in further substantial impairments of our intangible, fixed or other assets at any time in the future. In addition, we have been and may be required in the future to recognize increased depreciation and amortization charges if we determine that the useful lives of our fixed assets or intangible assets are shorter than we originally estimated. Such changes have in the past, and may in the future, reduce our net income.
4545_Fin_C2.pdf 16 March 4, 2020

15
Employee health and retiree health and pension benefit costs represent a significant expense to us; further cost increases could materially and adversely affect us.
Our expenses relating to employee health and retiree health and pension benefits are significant. In recent years, we have experienced significant increases in some of these costs, largely as a result of economic factors beyond our control, including, in particular, ongoing increases in healthcare costs well in excess of the rate of inflation and historically low discount rates that we use to value our benefit plan obligations. Continually increasing healthcare costs, volatility in investment returns and discount rates, as well as changes in laws, regulations and assumptions used to calculate retiree health and pension benefit expenses, may adversely affect our business, financial position, results of operations or require significant contributions to our benefit plans. Our national master agreement with the Teamsters includes provisions that are designed to mitigate certain of these healthcare expenses, but there can be no assurance that our efforts will be successful or that the failure or success of these efforts will not materially adversely affect us.
We participate in a number of trustee-managed multiemployer pension and health and welfare plans for employees covered under collective bargaining agreements. As part of the overall collective bargaining process for wage and benefit levels, we have agreed to contribute certain amounts to the multiemployer benefit plans during the contract period. The multiemployer benefit plans set benefit levels and are responsible for benefit delivery to participants. Future contribution amounts to multiemployer benefit plans will be determined only through collective bargaining, and we have no additional legal or constructive obligation to increase contributions beyond the agreed-upon amounts. However, in future collective bargaining negotiations, we could agree to make significantly higher future contributions to improve the funded status of one or more of these plans. The funded status of these multiemployer plans is impacted by various factors, including investment performance, healthcare inflation, changes in demographics and changes in participant benefit levels. At this time, we are unable to determine the amount of additional future contributions, if any, or whether any material adverse effect on us could result from our participation in these plans.
In addition to our on-going multiemployer pension plan obligations, we may have significant additional exposure with respect to benefits earned in the Central States Pension Fund (the "CSPF"). For additional information on our potential additional liabilities related to the CSPF, see note 5 to the audited, consolidated financial statements.
We may have additional tax liabilities.
We are subject to income taxes in the U.S. and many foreign jurisdictions. Significant judgment is required in determining our worldwide provision for income taxes. In the course of our business, there are many transactions and calculations where the ultimate tax determination is uncertain. For example, compliance with the 2017 United States Tax Cuts and Jobs Act (the “Tax Act”) may require the collection of information not regularly produced within our company and the exercise of significant judgment in accounting for its provisions. Many aspects of the Tax Act remain unclear and may not be clarified for some time. In addition, many state jurisdictions continue to issue guidance on the state treatment of certain aspects of the Tax Act. As regulations and guidance evolve with respect to the Tax Act, our results may differ from previous estimates and may materially affect our tax rates and our financial position.
We are regularly under audit by tax authorities in different jurisdictions. Economic and political pressures to increase tax revenue in various jurisdictions may make resolving tax disputes more difficult. Although we believe our tax estimates are reasonable, the final determination of tax audits and any related litigation in the jurisdictions where we are subject to taxation could be materially different from our historical income tax provisions and accruals. In addition, changes in U.S. federal and state or international tax laws applicable to corporate multinationals, other fundamental law changes currently being considered by many countries, and changes in taxing jurisdictions’ administrative interpretations, decisions, policies and positions may materially adversely impact our tax expense and cash flows.
We may be subject to various claims and lawsuits that could result in significant expenditures.
The nature of our business exposes us to the potential for various claims and litigation related to labor and employment, personal injury, property damage, business practices, environmental liability and other matters. Any material litigation or a catastrophic accident or series of accidents could result in significant expenditures and have a material adverse effect on us.
Our inability to effectively integrate acquired operations and realize the anticipated benefits of acquisitions, joint ventures or strategic alliances could adversely affect us.
As part of our business strategy, we may acquire businesses and form joint ventures or strategic alliances. Whether we realize the anticipated benefits from these transactions depends, in part, upon the successful integration between the businesses involved, the performance of the underlying operations, capabilities or technologies and the management of the acquired operations. Accordingly, our financial results could be materially adversely affected by our failure to effectively integrate the acquired operations, unanticipated performance issues or transaction-related charges.
4545_Fin_C2.pdf 17 March 4, 2020

16
Insurance and claims expenses could have a material adverse effect on us.
We have a combination of both self-insurance and high-deductible insurance programs for the risks arising out of the services we provide and the nature of our global operations, including claims exposure resulting from cargo loss, personal injury, property damage, aircraft and related liabilities, business interruption and workers' compensation. Workers' compensation, automobile and general liabilities are determined using actuarial estimates of the aggregate liability for claims incurred and an estimate of incurred but not reported claims, on an undiscounted basis. Our accruals for insurance reserves reflect certain actuarial assumptions and management judgments, which are subject to a high degree of variability. If the number or severity of claims for which we are retaining risk increases, our financial condition and results of operations could be adversely affected. If we lose our ability to self-insure these risks, our insurance costs could materially increase and we may find it difficult to obtain adequate levels of insurance coverage.
4545_Fin_C2.pdf 18 March 4, 2020

17
Item 1B. Unresolved Staff Comments
None.
Item 2. Properties
Operating Facilities
We own our headquarters, which is located in Atlanta, Georgia and consists of approximately 745,000 square feet of space in an office campus, and our UPS Supply Chain Solutions group’s headquarters, which is located in Alpharetta, Georgia and consists of approximately 310,000 square feet of office space. Our information technology headquarters is located in Parsippany, New Jersey, consisting of about 200,000 square feet of owned office space.
Our primary information technology operations are consolidated in a 444,000 square foot owned facility in New Jersey. We also own a 175,000 square foot facility in Georgia, which serves as a backup to the main information technology operations facility in New Jersey.
We own or lease over 1,000 package operating facilities in the U.S., with approximately 80 million square feet of floor space. These facilities have vehicles and drivers stationed for the pick-up and delivery of packages, and capacity to sort and transfer packages. Our larger facilities also service our vehicles and equipment, and employ specialized mechanical installations for the sorting and handling of packages. We own or lease approximately 800 facilities that support our international package operations, with approximately 24 million square feet of space.
Our aircraft are operated in a hub and spoke pattern in the U.S., with our principal air hub, Worldport, located in Louisville, Kentucky. The Worldport facility consists of over 5 million square feet and includes high-speed conveyor and computer control systems. For additional information on our air hubs, see “Item 1 - Business - Products and Services; Reporting Segments - Global Small Package”.
Our major air hub in Europe is located in Cologne, Germany, and we operate three air hubs in Asia in Shanghai, China; Shenzhen, China; and Hong Kong.
We own or lease more than 500 facilities, with approximately 38 million square feet of floor space that support our freight forwarding and logistics operations. We own and operate a logistics campus consisting of approximately 4 million square feet in Louisville, Kentucky.
We own or lease approximately 200 UPS Freight service centers with approximately 6 million square feet of floor space. The main offices of UPS Freight in Richmond, Virginia, consist of approximately 217,000 square feet of office space.
4545_Fin_C2.pdf 19 March 4, 2020

18
Fleet
Aircraft
The following table shows information about our aircraft fleet as of December 31, 2019:
Description Owned & Finance LeasesOperating Leases &
Chartered From Others On Order Under Option
Boeing 757-200 75 — — —
Boeing 767-200 — —
Boeing 767-300 64 2 8 —
Boeing 767-300BCF 3 — 1 —
Boeing 767-300BDSF 2 2
Airbus A300-600 52 — — —
Boeing MD-11 37 — 5 —
Boeing 747-400F 11 — — —
Boeing 747-400BCF 2 — — —
Boeing 747-8F 15 — 13 —
Other — 309 —
Total 261 311 29 —
Vehicles
We operate a global ground fleet of approximately 125,000 package cars, vans, tractors and motorcycles. Our ground support fleet consists of 36,000 pieces of equipment designed specifically to support our aircraft fleet, ranging from non-powered container dollies and racks to powered aircraft main deck loaders and cargo tractors. We also have 52,000 containers used to transport cargo in our aircraft.
Item 3. Legal Proceedings
See note 5 to the audited, consolidated financial statements for a discussion of pension related matters and note 9 to the audited, consolidated financial statements for a discussion of judicial proceedings and other matters arising from the conduct of our business activities.
Item 4. Mine Safety Disclosures
Not applicable.
Information about our Executive Officers
The information under the heading "Information about our Executive Officers" in Item 10 hereof is incorporated by reference into this Part 1.
4545_Fin_C2.pdf 20 March 4, 2020

19
PART II
Item 5. Market for Registrant’s Common Equity, Related Stockholder Matters and Issuer Purchases of Equity Securities
Our class A common stock is not listed on a national securities exchange or traded in an organized over-the-counter market, but each share of our class A common stock is convertible into one share of our class B common stock. Our class B common stock is listed on the New York Stock Exchange under the symbol “UPS”.
As of February 7, 2020, there were 155,914 and 19,196 shareowners of record of class A and class B common stock, respectively.
Our practice has been to pay dividends on a quarterly basis. The declaration of dividends is subject to the discretion of the Board of Directors and will depend on various factors, including our net income, financial condition, cash requirements, future prospects and other relevant factors.
On February 13, 2020, our Board declared a dividend of $1.01 per share, which is payable on March 10, 2020 to shareowners of record on February 25, 2020. This represents a 5.2% increase from the previous $0.96 per share quarterly dividend paid in December 2019.
A summary of repurchases of our class A and class B common stock during the fourth quarter of 2019 is as follows (in millions, except per share amounts):
Total Numberof Shares
Purchased(1)
Total Numberof Shares Purchasedas Part of Publicly
Announced Program
AveragePrice PaidPer Share
Approximate DollarValue of Shares that
May Yet be PurchasedUnder the Program(as of month-end)
October 1—October 31 0.8 0.8 $ 115.96 $ 2,495
November 1—November 30 0.6 0.6 121.81 2,416
December 1—December 31 0.7 0.7 117.99 2,334
Total October 1—December 31 2.1 2.1 $ 118.59(1) Includes shares repurchased through our publicly announced share repurchase program and shares tendered to pay the exercise price and
tax withholding on employee stock awards.
In May 2016, the Board of Directors approved a share repurchase authorization of $8.0 billion for shares of class A and class B common stock. We anticipate repurchasing approximately $1.0 billion of shares in 2020. For additional information on our share repurchase activities, see note 11 to the audited, consolidated financial statements included in this report.
4545_Fin_C2.pdf 21 March 4, 2020

20
Shareowner Return Performance Graph
The following performance graph and related information shall not be deemed “soliciting material” or to be “filed” with the SEC, nor shall such information be incorporated by reference into any future filing under the Securities Act of 1933 or Securities Exchange Act of 1934, each as amended, except to the extent that the Company specifically incorporates such information by reference into such filing.
The following graph shows a five-year comparison of cumulative total shareowners’ returns for our class B common stock, the Standard & Poor’s 500 Index and the Dow Jones Transportation Average. The comparison of the total cumulative return on investment, which is the change in the stock price plus reinvested dividends for each of the quarterly periods, assumes that $100 was invested on December 31, 2014 in the Standard & Poor’s 500 Index, the Dow Jones Transportation Average and our class B common stock.
12/31/2014 12/31/2015 12/31/2016 12/31/2017 12/31/2018 12/31/2019
United Parcel Service, Inc. $ 100.00 $ 93.50 $ 114.74 $ 122.93 $ 103.90 $ 130.39
Standard & Poor’s 500 Index $ 100.00 $ 101.37 $ 113.49 $ 138.26 $ 132.19 $ 175.30
Dow Jones Transportation Average $ 100.00 $ 83.24 $ 101.44 $ 120.73 $ 105.85 $ 128.76
For information regarding our equity compensation plans, see Item 12 of this report.
4545_Fin_C2.pdf 22 March 4, 2020

21
Item 6. Selected Financial Data
The following table sets forth selected financial data for each of the five years in the period ended December 31, 2019 (in millions, except per share amounts). This financial data should be read together with our consolidated financial statements and related notes, Management’s Discussion and Analysis of Financial Condition and Results of Operations, including the Supplemental Information - Items Affecting Comparability section, and other financial data appearing elsewhere in this report.
Years Ended December 31,
2019 2018 2017 2016 2015
Selected Income Statement Data
Revenue:
U.S. Domestic Package $ 46,493 $ 43,593 $ 40,761 $ 38,284 $ 36,744
International Package 14,220 14,442 13,342 12,346 12,142
Supply Chain & Freight 13,381 13,826 12,482 10,980 10,300
Total Revenue 74,094 71,861 66,585 61,610 59,186
Operating Expenses:
Compensation and benefits 38,908 37,235 34,577 32,534 31,448
Other 27,388 27,602 24,479 21,388 20,495
Total Operating Expenses 66,296 64,837 59,056 53,922 51,943
Operating Profit:
U.S. Domestic Package 4,164 3,643 4,303 4,628 4,427
International Package 2,657 2,529 2,429 2,417 2,123
Supply Chain and Freight 977 852 797 643 693
Total Operating Profit 7,798 7,024 7,529 7,688 7,243
Other Income and (Expense):
Investment income (expense) and other (1,493) (400) 61 (2,186) 435
Interest expense (653) (605) (453) (381) (341)
Income Before Income Taxes 5,652 6,019 7,137 5,121 7,337
Income Tax Expense 1,212 1,228 2,232 1,699 2,497
Net Income $ 4,440 $ 4,791 $ 4,905 $ 3,422 $ 4,840
Per Share Amounts:
Basic Earnings Per Share $ 5.14 $ 5.53 $ 5.63 $ 3.88 $ 5.37
Diluted Earnings Per Share $ 5.11 $ 5.51 $ 5.61 $ 3.86 $ 5.34
Dividends Declared Per Share $ 3.84 $ 3.64 $ 3.32 $ 3.12 $ 2.92
Weighted Average Shares Outstanding:
Basic 864 866 871 883 901
Diluted 869 870 875 887 906
As of December 31,
2019 2018 2017 2016 2015
Selected Balance Sheet Data:
Cash and marketable securities $ 5,741 $ 5,035 $ 4,069 $ 4,567 $ 4,726
Total assets 57,857 50,016 45,574 40,545 38,497
Long-term debt 21,818 19,931 20,278 12,394 11,316
Shareowners’ equity 3,283 3,037 1,024 430 2,501This table reflects the impact of the adoption of new accounting standards in 2018 and 2019. Refer to note 1 to the audited, consolidated financial statements.
4545_Fin_C2.pdf 23 March 4, 2020

22
Item 7. Management’s Discussion and Analysis of Financial Condition and Results of Operations
Overview
Highlights of our annual results follow:
Year Ended December 31, $ Change % Change
2019 2018 2019/2018 2019/2018
Revenue (in millions) $ 74,094 $ 71,861 $ 2,233 3.1 %
Operating Expenses (in millions) 66,296 64,837 1,459 2.3 %
Operating Profit (in millions) $ 7,798 $ 7,024 $ 774 11.0 %
Operating Margin 10.5% 9.8%
Net Income (in millions) $ 4,440 $ 4,791 $ (351) (7.3)%
Basic Earnings Per Share $ 5.14 $ 5.53 $ (0.39) (7.1)%
Diluted Earnings Per Share $ 5.11 $ 5.51 $ (0.40) (7.3)%
Average Daily Package Volume (in thousands) 21,880 20,677 5.8 %
Average Revenue Per Piece $ 10.87 $ 10.98 $ (0.11) (1.0)%
• Consolidated revenue increased 3.1%.
• Average daily package volume increased 5.8% primarily driven by our U.S. Domestic Package segment, whichexperienced growth from SMBs as well as several large customers, led by our largest customer, Amazon.
• Average revenue per piece is dependent upon base rates, customer and product mix, average billable weight per piece,fuel surcharge rates and currency. Average revenue per piece decreased as a result of changes in customer and productmix, and lower average billable weight per piece in our U.S. Domestic Package segment. Currency movementsnegatively impacted revenue per piece in our International Package segment.
• Operating profit and operating margin increased with growth and margin expansion in all segments.
• We reported net income of $4.440 billion and diluted earnings per share of $5.11. Adjusted diluted earnings per sharewas $7.53 after adjusting for the after-tax impacts of the following:
transformation strategy costs of $196 million;
legal contingencies and expenses of $91 million; and
pension mark-to-market losses recognized outside of a 10% corridor of $1.816 billion.
2018 compared to 2017
See Item 7. Management's Discussion and Analysis of Financial Condition and Results of Operations of the Company's Annual Report on Form 10-K for the year ended December 31, 2018 filed with the Securities and Exchange Commission on February 21, 2019.
4545_Fin_C3.pdf 24 March 5, 2020

UNITED PARCEL SERVICE, INC. AND SUBSIDIARIES
MANAGEMENT'S DISCUSSION AND ANALYSIS OF FINANCIAL CONDITION ANDRESULTS OF OPERATIONS
23
Supplemental Information - Items Affecting Comparability
We supplement the reporting of our financial information determined under generally accepted accounting principles in the United States ("GAAP") with certain non-GAAP financial measures including, as applicable, "adjusted" compensation and benefits, operating expenses, operating profit, operating margin, other income and (expense), income before income taxes, income tax expense, effective tax rate, net income and earnings per share. Adjusted financial measures may exclude the impact of period over period exchange rate changes and hedging activities, amounts related to mark-to-market gains or losses, recognition of contingencies and transformation strategy costs, as described below. We believe that these adjusted financial measures provide meaningful information to assist investors and analysts in understanding our financial results and assessing our prospects for future performance. We believe these adjusted financial measures are important indicators of our recurring results of operations because they exclude items that may not be indicative of, or are unrelated to, our underlying operating results, and provide a useful baseline for analyzing trends in our underlying businesses. Additionally, these adjusted financial measures are used internally by management for the determination of incentive compensation awards, business unit operating performance analysis and business unit resource allocation.
Non-GAAP financial measures should be considered in addition to, and not as an alternative for, our reported results prepared in accordance with GAAP. Our non-GAAP financial information does not represent a comprehensive basis of accounting. Therefore, our non-GAAP financial information may not be comparable to similarly titled measures reported by other companies.
The year over year comparisons of our financial results are affected by the following items (in millions):
Year Ended December 31,
Non-GAAP Adjustments 2019 2018
Operating Expenses:
Transformation Strategy Costs $ 255 $ 360
Legal Contingencies and Expenses 97 —
Total Adjustments to Operating Expenses $ 352 $ 360
Other Income and (Expense):
Defined Benefit Plans Mark-to-Market Charges $ 2,387 $ 1,627
Total Adjustments to Other Income and (Expense) $ 2,387 $ 1,627
Total Adjustments to Income Before Income Taxes $ 2,739 $ 1,987
Income Tax Benefit from the Mark-to-Market Charges $ (571) $ (390)
Income Tax Benefit from Transformation Strategy Costs (59) (87)
Income Tax Benefit from Legal Contingencies and Expenses (6) —
Total Adjustments to Income Tax Expense $ (636) $ (477)
Total Adjustments to Net Income $ 2,103 $ 1,510
These items have been excluded from comparisons of "adjusted" Compensation and benefits, Operating Expenses, Operating Profit, Operating Margin, Other Income and (Expense), Income Tax Expense and effective tax rate in the discussion that follows. The income tax benefit from transformation strategy costs, legal contingencies and expenses and the mark-to-market charges are calculated by multiplying the statutory tax rates applicable in each tax jurisdiction, including the U.S. federal jurisdiction and various U.S. state and non-U.S. jurisdictions, by the tax deductible adjustments. The blended average of the effective tax rates in 2019 and 2018 were 23.2% and 24.0%, respectively.
4545_Fin_C2.pdf 25 March 4, 2020

UNITED PARCEL SERVICE, INC. AND SUBSIDIARIES
MANAGEMENT'S DISCUSSION AND ANALYSIS OF FINANCIAL CONDITION ANDRESULTS OF OPERATIONS
24
Impact of Changes in Foreign Currency Exchange Rates and Hedging Activities
We supplement the reporting of our revenue, revenue per piece and operating profit with non-GAAP measures that exclude the period over period impact of foreign currency exchange rate changes and hedging activities.
Currency-neutral revenue, revenue per piece and operating profit are calculated by dividing current period reported U.S. dollar revenue, revenue per piece and operating profit by the current period average exchange rates to derive current period local currency revenue, revenue per piece and operating profit. The derived amounts are then multiplied by the average foreign exchange rates used to translate the comparable results for each month in the prior year period (including the period over period impact of foreign currency hedging activities). The difference between the current period reported U.S. dollar revenue, revenue per piece and operating profit and the derived current period U.S. dollar revenue, revenue per piece and operating profit is the period over period impact of currency fluctuations.
Transformation Strategy Costs
We supplement the presentation of our operating profit, operating margin, income before income taxes, net income and earnings per share with similar non-GAAP measures that exclude the impact of costs related to restructuring programs, including transformation strategy costs. For information regarding transformation strategy costs, see note 17 to the audited, consolidated financial statements.
Costs Related to Legal Contingencies and Expenses
We supplement the presentation of our operating profit, operating margin, income before income taxes, net income and earnings per share with similar non-GAAP measures that exclude the impact of costs related to certain of our legal contingencies and expenses. For information regarding legal contingencies and expenses, see note 9 to the audited, consolidated financial statements.
Defined Benefit Plans Mark-to-Market Charges
We recognize changes in the fair value of plan assets and net actuarial gains and losses in excess of a 10% corridor for our pension and postretirement defined benefit plans immediately as part of net periodic benefit cost other than service cost. We supplement the presentation of our income before income taxes, net income and earnings per share with "adjusted" measures that exclude the impact of the portion of net periodic benefit cost other than service cost represented by the gains and losses recognized in excess of the 10% corridor and the related income tax effects. We believe excluding these mark-to-market impacts from our adjusted results provides important supplemental information to remove the volatility caused by short-term changes in market interest rates, equity prices and similar factors.
This adjusted net periodic benefit cost ($754 million in 2019 and $615 million in 2018) utilizes the expected return on plan assets (7.68% in 2019 and 2018) and the discount rate used to determine net periodic benefit cost (4.45% in 2019 and 3.81% in 2018). The unadjusted net periodic benefit cost reflects the actual return on plan assets (17.57% in 2019 and -2.38% in 2018) and the discount rate used to measure the projected benefit obligation at the December 31 measurement date (3.55% in 2019 and 4.45% in 2018).
We recognized pre-tax mark-to-market losses outside of a 10% corridor related to the remeasurement of our pension and postretirement defined benefit plans' assets and liabilities in "Other Income and (Expense)" of $2.387 and $1.627 billion for 2019 and 2018, respectively. In October 2019, we refined the bond matching approach used to determine the discount rate for our U.S. pension and postretirement plans by implementing advances in technology and modeling techniques. This refinement decreased the projected benefit obligation on our consolidated balance sheet by approximately $900 million as of December 31, 2019, decreased the pre-tax mark-to-market charge by approximately $810 million and increased net income by $616 million, or $0.71 per share on a basic and diluted basis. This change did not have an impact on adjusted net income or adjusted earnings per share.
4545_Fin_C2.pdf 26 March 4, 2020

UNITED PARCEL SERVICE, INC. AND SUBSIDIARIES
MANAGEMENT'S DISCUSSION AND ANALYSIS OF FINANCIAL CONDITION ANDRESULTS OF OPERATIONS
25
The table below indicates the amounts associated with each component of the pre-tax mark-to-market losses, as well as the weighted-average actuarial assumptions used to determine our net periodic benefit cost, for each year:
Year Ended December 31,
Components of mark-to-market gain (loss) (in millions): 2019 2018
Discount rates $ (5,670) $ 845
Return on assets 3,850 (1,057)
Demographic and other assumption changes (24) (22)
Coordinating benefits attributable to the Central States Pension Fund (543) (1,393)
Total mark-to-market gain (loss) $ (2,387) $ (1,627)
Year Ended December 31,
Weighted-average actuarial assumptions used to determine net periodic benefit cost: 2019 2018
Expected rate of return on plan assets 7.68% 7.68 %
Actual rate of return on plan assets 17.57% (2.38)%
Discount rate used for net periodic benefit cost 4.45% 3.81 %
Discount rate at measurement date 3.55% 4.45 %
The pre-tax mark-to-market losses for the years ended December 31, 2019 and 2018, respectively, were comprised of the following components:
2019 - $2.387 billion pre-tax mark-to-market loss:
• Return on Assets ($3.850 billion pre-tax gain): In 2019, the actual rate of return on plan assets was higher than ourexpected rate of return, primarily due to strong global equity and U.S. bond markets.
• Coordinating benefits attributable to the Central States Pension Fund ($543 million pre-tax loss): This representsour current best estimate of the additional potential coordinating benefits that may be required to be paid related tothe Central States Pension Fund.
• Discount Rates ($5.670 billion pre-tax loss): The weighted-average discount rate for our pension andpostretirement medical plans decreased from 4.45% at December 31, 2018 to 3.55% at December 31, 2019,primarily due to both a decline in U.S. treasury yields and a decrease in credit spreads on AA-rated corporatebonds in 2019.
• Demographic and Other Assumption Changes ($24 million pre-tax loss): This represents the difference betweenactual and estimated participant data and demographic factors, including items such as healthcare cost trends,compensation rate increases and rates of termination, retirement and mortality.
2018 - $1.627 billion pre-tax mark-to-market loss:
• Return on Assets ($1.057 billion pre-tax loss): In 2018, the actual rate of return on plan assets was lower than ourexpected rate of return, primarily due to weak global equity markets.
• Coordinating benefits attributable to the Central States Pension Fund ($1.393 billion pre-tax loss): Thisrepresented our then-current best estimate of potential coordinating benefits that may be required to be paidrelated to the Central States Pension Fund.
• Discount Rates ($845 million pre-tax gain): The weighted-average discount rate for our pension andpostretirement medical plans increased from 3.81% at December 31, 2017 to 4.45% at December 31, 2018,primarily due to both an increase in U.S. treasury yields and an increase in credit spreads on AA-rated corporatebonds in 2018.
• Demographic and Other Assumption Changes ($22 million pre-tax loss): This represents the difference betweenactual and estimated participant data and demographic factors, including items such as healthcare cost trends,compensation rate increases and rates of termination, retirement and mortality.
4545_Fin_C2.pdf 27 March 4, 2020

UNITED PARCEL SERVICE, INC. AND SUBSIDIARIES
MANAGEMENT'S DISCUSSION AND ANALYSIS OF FINANCIAL CONDITION ANDRESULTS OF OPERATIONS
26
Expense Allocations
Certain operating expenses are allocated between our reporting segments using activity-based costing methods. These activity-based costing methods require us to make estimates that impact the amount of each expense category that is attributed to each segment. Changes in these estimates will directly impact the amount of expense allocated to each segment, and therefore the operating profit of each reporting segment. Our allocation methodologies are refined periodically, as necessary, to reflect changes in our businesses. There were no significant changes in our expense allocation methodologies during 2019, 2018 or 2017.
4545_Fin_C2.pdf 28 March 4, 2020

UNITED PARCEL SERVICE, INC. AND SUBSIDIARIES
MANAGEMENT'S DISCUSSION AND ANALYSIS OF FINANCIAL CONDITION ANDRESULTS OF OPERATIONS
27
U.S. Domestic Package Operations
Year Ended December 31, $ Change % Change
2019 2018 2019/2018 2019/2018
Average Daily Package Volume (in thousands):
Next Day Air 1,889 1,542 22.5 %
Deferred 1,622 1,432 13.3 %
Ground 15,176 14,498 4.7 %
Total Average Daily Package Volume 18,687 17,472 7.0 %
Average Revenue Per Piece:
Next Day Air $ 17.74 $ 19.53 $ (1.79) (9.2)%
Deferred 12.62 13.12 (0.50) (3.8)%
Ground 8.55 8.51 0.04 0.5 %
Total Average Revenue Per Piece $ 9.83 $ 9.86 $ (0.03) (0.3)%
Operating Days in Period 253 253
Revenue (in millions):
Next Day Air $ 8,479 $ 7,618 $ 861 11.3 %
Deferred 5,180 4,752 428 9.0 %
Ground 32,834 31,223 1,611 5.2 %
Total Revenue $ 46,493 $ 43,593 $ 2,900 6.7 %
Operating Expenses (in millions):
Operating Expenses $ 42,329 $ 39,950 $ 2,379 6.0 %
Transformation Strategy Costs (108) (235) 127 (54.0)%
Legal Contingencies and Expenses (97) — (97) N/M
Adjusted Operating Expenses $ 42,124 $ 39,715 $ 2,409 6.1 %
Operating Profit (in millions) and Operating Margin:
Operating Profit $ 4,164 $ 3,643 $ 521 14.3 %
Adjusted Operating Profit $ 4,369 $ 3,878 $ 491 12.7 %
Operating Margin 9.0% 8.4%
Adjusted Operating Margin 9.4% 8.9%
Revenue
The change in overall revenue was due to the following factors for the year ended December 31, 2019 versus 2018:
VolumeRates /
Product MixFuel
SurchargeTotal Revenue
Change
Revenue Change Drivers:
2019/2018 7.0% (0.6)% 0.3% 6.7%
4545_Fin_C2.pdf 29 March 4, 2020

UNITED PARCEL SERVICE, INC. AND SUBSIDIARIES
MANAGEMENT'S DISCUSSION AND ANALYSIS OF FINANCIAL CONDITION ANDRESULTS OF OPERATIONS
28
Volume
2019 compared to 2018
Our overall volume increased across all products, led by strong growth in our Next Day Air and Deferred driven by the structural shift to faster delivery in retail and e-commerce, and from additional customer volume. We experienced growth from a number of large customers and SMBs, with volume growth led by our largest customer, Amazon. This growth was enabled by our on-going investment in automated facilities and other transformation initiatives.
Business-to-consumer shipments, which represented approximately 54% of the total U.S. Domestic Package average daily volume, grew 11.3% for the year driven by the growth in e-commerce and retail. Volume grew across all products, with particularly strong growth in our Air products. Business-to-business shipments increased 2.2% for the year with volume increases in both air and ground services.
Within our Air products, overall average daily volume increased in both Next Day Air and Deferred. Strong air volume growth continued primarily in residential Next Day Air and Second Day package products, as consumers and businesses continue to demand faster delivery options, which we expect will persist. This growth was slightly offset by declines in Next Day Air letter and Second Day letter volume due to shifts in customer preferences.
We experienced year over year growth in both residential and commercial ground products. Growth in residential ground volume was driven by changes in customer mix resulting from the continued growth in e-commerce, while growth in commercial ground products was primarily driven by an increase in retail return services.
Rates and Product Mix
2019 compared to 2018
Overall revenue per piece decreased due to customer and product mix and fuel surcharge rates, partially offset by changes in base rates.
Revenue per piece for ground and air products was positively impacted by a base rate increase on December 26, 2018. UPS Ground and UPS Air services rates increased an average net 4.9%.
Revenue per piece for our Next Day Air and Deferred products decreased primarily due to a shift in customer and product mix and a decrease in average billable weight per piece, which was partially offset by the increase in base rates.
Revenue per piece for our ground products increased primarily due to base rate increases and customer and product mix, partially offset by a decrease in average billable weight per piece.
Fuel Surcharges
We apply a fuel surcharge on our domestic air and ground services. The air fuel surcharge is based on the U.S. Department of Energy’s (“DOE”) Gulf Coast spot price for a gallon of kerosene-type jet fuel, while the ground fuel surcharge is based on the DOE’s On-Highway Diesel Fuel Price. Based on published rates, the average fuel surcharge rates for domestic air and ground products were as follows:
Year Ended December 31, % Point Change
2019 2018 2019/2018
Next Day Air / Deferred 7.3% 7.7% (0.4)%
Ground 7.2% 7.0% 0.2 %
Effective April 2, 2018, we created separate fuel surcharges for Domestic Air shipments and International Air export shipments. These surcharges are based on the U.S. Gulf Coast Jet Fuel price and are adjusted weekly. In June and October 2018, ground fuel surcharge rates were raised for all thresholds, and in October and December 2018, Domestic Air fuel surcharge rates were increased for all thresholds. Ground surcharges continue to be based on the national U.S. Average On-Highway Diesel Fuel price and adjusted weekly.
While fluctuations in fuel surcharges can be significant from period to period, fuel surcharges represent one of the many individual components of our pricing structure that impact our overall revenue and yield. Additional components include the mix of products sold, the base price and any additional charges or discounts on these services.
4545_Fin_C2.pdf 30 March 4, 2020

UNITED PARCEL SERVICE, INC. AND SUBSIDIARIES
MANAGEMENT'S DISCUSSION AND ANALYSIS OF FINANCIAL CONDITION ANDRESULTS OF OPERATIONS
29
Revenue per piece for ground products was positively impacted by fuel surcharge rate increases during 2018, while fuel surcharge rates for air products decreased slightly for the year.
Total domestic fuel surcharge revenue increased by $140 million for the year as a result of increases in package volume and shifts in product mix, partially offset by lower fuel surcharge rates on our Air products.
Operating Expenses
2019 compared to 2018
Operating expenses, and operating expenses excluding the impact of transformation strategy costs and legal contingencies and expenses, increased largely due to pickup and delivery costs (up $1.385 billion), costs of operating our domestic integrated air and ground network (up $631 million), costs of package sorting (up $301 million) and other indirect operating costs (up $92 million).
In order to manage costs, we continually adjust our air and ground network to better match higher volume levels. In addition, we continue to deploy and utilize technology to increase package sorting and delivery productivity by reducing manual touchpoints. The growth in pickup and delivery and network operational costs was impacted by several factors:
• Higher employee compensation and benefit costs largely resulting from:
volume growth, which resulted in an increase in average daily union labor hours of 4.7%;
union pay rate and benefit increases; and
growth in the overall size of the workforce due to facility expansions.
We incurred higher employee benefit expenses due to additional headcount, contractual contribution rate increases to union multiemployer plans and changes in benefit eligibility for certain union employees. These increases were slightly offset by lower pension expense for our company-sponsored plans due to higher discount rates used to measure the projected benefit obligations which reduced service costs, and lower premiums due to improved funded status.
• We incurred slightly lower fuel expense for the year, driven by declines in fuel prices and higher alternative fuel taxcredits in 2019 due to the passage of additional legislation. These reductions were partially offset by increased networkvolume, which resulted in higher fuel usage. Aircraft block hours increased 10.3%, daily package delivery stopsincreased 10.9% and daily delivery miles increased 7.9%.
• Lower costs for outside contract carriers were the result of retaining additional volume within our network.
Total cost per piece, which includes transformation strategy costs and legal contingencies and expenses, decreased 0.9%for the year. Excluding the year over year impact of transformation strategy costs and legal contingencies and expenses, adjusted cost per piece decreased 0.8% for the year. Year over year cost per piece decreased due to the incremental impact of our new automated facilities and other transformation initiatives.
Operating Profit and Margin
2019 compared to 2018
Operating profit increased $521 million with operating margins increasing 60 basis points to 9.0%. Excluding the year over year impact of transformation strategy costs and legal contingencies and expenses, adjusted operating profit increased $491 million with operating margins increasing 50 basis points to 9.4%. Operating profit increased as a result of the items described above.
4545_Fin_C3.pdf 31 March 5, 2020

UNITED PARCEL SERVICE, INC. AND SUBSIDIARIES
MANAGEMENT'S DISCUSSION AND ANALYSIS OF FINANCIAL CONDITION ANDRESULTS OF OPERATIONS
30
International Package Operations
Year Ended December 31, $ Change % Change
2019 2018 2019/2018 2019/2018
Average Daily Package Volume (in thousands):
Domestic 1,721 1,723 (0.1)%
Export 1,472 1,482 (0.7)%
Total Average Daily Package Volume 3,193 3,205 (0.4)%
Average Revenue Per Piece:
Domestic $ 6.51 $ 6.59 $ (0.08) (1.2)%
Export 29.10 29.27 (0.17) (0.6)%
Total Average Revenue Per Piece $ 16.93 $ 17.08 $ (0.15) (0.9)%
Operating Days in Period 253 253
Revenue (in millions):
Domestic $ 2,836 $ 2,874 $ (38) (1.3)%
Export 10,837 10,973 (136) (1.2)%
Cargo & Other 547 595 (48) (8.1)%
Total Revenue $ 14,220 $ 14,442 $ (222) (1.5)%
Operating Expenses (in millions):
Operating Expenses $ 11,563 $ 11,913 $ (350) (2.9)%
Transformation Strategy Costs (122) (76) (46) 60.5 %
Adjusted Operating Expenses $ 11,441 $ 11,837 $ (396) (3.3)%
Operating Profit (in millions) and Operating Margin:
Operating Profit $ 2,657 $ 2,529 $ 128 5.1 %
Adjusted Operating Profit $ 2,779 $ 2,605 $ 174 6.7 %
Operating Margin 18.7% 17.5%
Adjusted Operating Margin 19.5% 18.0%
Currency Translation Benefit / (Cost)—(in millions)*:
Revenue $ (232)
Operating Expenses 302
Operating Profit $ 70
* Net of currency hedging; amount represents the change compared to the prior year.
Revenue
The change in overall revenue was due to the following factors for the year ended December 31, 2019 versus 2018:
VolumeRates /
Product MixFuel
Surcharge CurrencyTotal Revenue
ChangeRevenue Change Drivers:
2019/2018 (0.4)% 0.4% 0.1% (1.6)% (1.5)%
4545_Fin_C2.pdf 32 March 4, 2020

UNITED PARCEL SERVICE, INC. AND SUBSIDIARIES
MANAGEMENT'S DISCUSSION AND ANALYSIS OF FINANCIAL CONDITION ANDRESULTS OF OPERATIONS
31
Volume
2019 compared to 2018
Our overall average daily volume decreased slightly due to weak demand from several sectors including high tech, manufacturing, professional services, automotive and government, partially offset by higher demand in healthcare, retail and other sectors.
Export volume decreased slightly in 2019. European export volume declined across all trade lanes, while Intra-European volume grew slightly. Total U.S. export volume decreased, with declines in the Europe and Asia trade lanes partially offset by growth in the U.S. to Americas and U.S. to ISMEA trade lanes. Asia exports grew in all major trade lanes, with the exception of the United States. Export volume for the year was strongest in our non-premium Transborder Standard product, offset by declines in our premium Worldwide and Transborder Express services.
Domestic volume also decreased slightly for the year as growth in several domestic markets was more than offset by challenging economic conditions, particularly in the United Kingdom and other European countries. Additionally, a postal strike in Canada in 2018 drove additional domestic volume which did not repeat in 2019.
Rates and Product Mix
2019 compared to 2018
On December 26, 2018, we implemented an average 4.9% net increase in base and accessorial rates for international shipments originating in the United States. Rate changes for shipments originating outside the U.S. are made throughout the year and vary by geographic market. On August 26, 2019, we implemented a 1.0% increase in International Air-Import fuel surcharge.
Total average revenue per piece decreased in 2019 due entirely to a 170 basis point decrease from currency. Excluding the impact of currency, revenue per piece increased 0.8% due to increases in base rates, partially offset by declines in fuel surcharge indices.
Domestic revenue per piece decreased 120 basis points, driven entirely by a 390 basis point decrease from currency. Excluding the impact of currency, revenue per piece increased 2.7% due to base rate increases.
Export revenue per piece decreased 60 basis points, also driven entirely by a 110 basis point decrease from currency. Excluding the impact of currency, revenue per piece increased 0.5% as the trend toward our lower priced non-premium services was more than offset by base rate increases.
Fuel Surcharges
We apply fuel surcharges on our international air and ground services. The fuel surcharge for international air products originating inside or outside the United States is largely indexed to the DOE's Gulf Coast spot price for a gallon of kerosene-type jet fuel. Fuel surcharges for ground products originating outside the United States are indexed to fuel prices in the region or country where the shipments originate.
While fluctuations in fuel surcharges can be significant from period to period, fuel surcharges represent one of the many individual components of our pricing structure that impact our overall revenue and yield. Additional components include the mix of products sold, the base price and any additional charges or discounts on these services.
Total international fuel surcharge revenue decreased by $33 million in 2019, primarily due to decreases in fuel surcharge indices and decreases in volume.
Operating Expenses
2019 compared to 2018
Operating expenses, and operating expenses excluding the year over year impact of transformation strategy costs, decreased for 2019. These decreases are the results of effective management of network capacity and cost in response to lower volumes within our air, ground and local pickup and delivery networks, combined with lower fuel prices and currency exchange rate movements.
4545_Fin_C2.pdf 33 March 4, 2020

UNITED PARCEL SERVICE, INC. AND SUBSIDIARIES
MANAGEMENT'S DISCUSSION AND ANALYSIS OF FINANCIAL CONDITION ANDRESULTS OF OPERATIONS
32
In addition to variability in usage and market prices, the manner in which we purchase fuel also influences the net impact of fuel on our results. The majority of our contracts for fuel purchases utilize index-based pricing formulas plus or minus a fixed locational/supplier differential. While many of the indices are aligned, each index may fluctuate at a different pace, driving variability in the prices paid for fuel. Because of this, our operating results may be affected should the market price of fuel suddenly change by a significant amount or change by amounts that do not result in an adjustment in our fuel surcharges, which can affect our earnings either positively or negatively in the short-term.
The cost of operating our integrated international air and ground network decreased $130 million for 2019. The decrease in network costs was primarily driven by a 2.1% decrease in aircraft block hours, due in large part to our ability to adjust our global air network to match capacity with demand, and lower package volume for the year, together with lower fuel prices. Pickup and delivery costs decreased $105 million in 2019. The remaining decrease in operating expenses was driven by a $40 million gain from the sale of surplus property in Canada, as well as decreases in the costs of package sorting and other indirect operating costs.
Operating Profit and Margin
2019 compared to 2018
Operating profit increased $128 million for the year, with operating margin increasing 120 basis points to 18.7%. Excluding the year over year impact of transformation strategy costs, adjusted operating profit increased, with adjusted operating margin up 150 basis points to 19.5%. Operating profit increased as a result of the items described above.
4545_Fin_C2.pdf 34 March 4, 2020

UNITED PARCEL SERVICE, INC. AND SUBSIDIARIES
MANAGEMENT'S DISCUSSION AND ANALYSIS OF FINANCIAL CONDITION ANDRESULTS OF OPERATIONS
33
Supply Chain & Freight Operations
Year Ended December 31, $ Change % Change
2019 2018 2019/2018 2019/2018Freight LTL Statistics:
Revenue (in millions) $ 2,679 $ 2,706 $ (27) (1.0)%Revenue Per Hundredweight $ 26.54 $ 25.52 $ 1.02 4.0 %Shipments (in thousands) 9,281 9,720 (4.5)%Shipments Per Day (in thousands) 36.7 38.4 (4.5)%Gross Weight Hauled (in millions of lbs) 10,096 10,605 (4.8)%Weight Per Shipment (in lbs) 1,088 1,091 (0.3)%Operating Days in Period 253 253
Revenue (in millions):Forwarding $ 5,867 $ 6,580 $ (713) (10.8)%Logistics 3,435 3,234 201 6.2 %Freight 3,265 3,218 47 1.5 %Other 814 794 20 2.5 %
Total Revenue $ 13,381 $ 13,826 $ (445) (3.2)%Operating Expenses (in millions):
Operating Expenses $ 12,404 $ 12,974 $ (570) (4.4)%Transformation Strategy Costs (25) (49) 24 (49.0)%
Adjusted Operating Expenses $ 12,379 $ 12,925 $ (546) (4.2)%Operating Profit (in millions) and Operating Margins:
Operating Profit $ 977 $ 852 $ 125 14.7 %Adjusted Operating Profit $ 1,002 $ 901 $ 101 11.2 %Operating Margin 7.3% 6.2%Adjusted Operating Margin 7.5% 6.5%
Currency Translation Benefit / (Cost)—(in millions)*:Revenue $ (75)Operating Expenses 67Operating Profit $ (8)
* Amount represents the change compared to the prior year.
Year Ended December 31, $ Change % Change
2019 2018 2019/2018 2019/2018Transformation Strategy Costs (in millions):
Forwarding $ 12 $ 16 $ (4) (25.0)%Logistics 13 22 (9) (40.9)%Freight — 6 (6) (100.0)%Other — 5 (5) (100.0)%
Total Transformation Strategy Costs $ 25 $ 49 $ (24) (49.0)%
4545_Fin_C2.pdf 35 March 4, 2020

UNITED PARCEL SERVICE, INC. AND SUBSIDIARIES
MANAGEMENT'S DISCUSSION AND ANALYSIS OF FINANCIAL CONDITION ANDRESULTS OF OPERATIONS
34
Revenue
2019 compared to 2018
Total revenue for the Supply Chain & Freight segment decreased $445 million in 2019 compared with 2018.
Forwarding revenue decreased primarily due to an overall decline in market demand that was impacted by global trade uncertainties. This led to lower volume and declines in market rates in our international air and ocean freight forwarding businesses. In addition, excess capacity in the truckload brokerage market depressed rates, contributing to the year over year decrease in revenue. These decreases were partially offset by yield management initiatives in our air and ocean freight businesses.
Logistics revenue increased as we experienced growth in the healthcare, mail services, retail and manufacturing sectors.
Overall UPS Freight revenue increased, as declines in LTL tonnage and shipment volume which were largely attributable to market demand and the residual impacts of the fourth quarter 2018 network disruption were more than offset by yield management initiatives and volume growth in our Ground Freight Pricing product.
Operating Expenses
2019 compared to 2018
Total operating expenses for the Supply Chain & Freight segment, and operating expenses excluding the year over year impact of transformation strategy costs, decreased in 2019 compared with 2018.
Forwarding operating expenses decreased $685 million largely due to reductions in purchased transportation. Purchased transportation expense decreased $655 million primarily due to lower tonnage and declines in market rates in our international air and ocean freight forwarding businesses as well as a decrease in volume and market rates in truckload brokerage. Cost management initiatives in our freight forwarding businesses also contributed to the reduction in operating expenses.
Logistics operating expenses increased $172 million, primarily due to increases in purchased transportation driven by increased volume and rates, particularly in our mail services business. Additionally, business investments in healthcare quality assurance and technology increased costs.
UPS Freight operating expenses decreased $54 million. Decreases in costs associated with operating our linehaul network ($49 million) and decreases in pickup and delivery costs ($40 million) were driven by lower expenses from outside transportation carriers as a result of a decline in tonnage, lower fuel surcharges and the residual impacts of the fourth quarter 2018 network disruption. These decreases were offset by increases in transportation expense for our Ground Freight Pricing product due to higher volume. Cost management initiatives and production improvements largely contributed to the overall reduction in operating expenses.
Operating Profit and Margin
2019 compared to 2018
Total operating profit for the Supply Chain & Freight segment increased $125 million in 2019 compared with 2018. Excluding the year over year impact of transformation strategy costs, adjusted operating profit increased $101 million. Operating margin increased 110 basis points to 7.3%, while the adjusted operating margin increased 100 basis points to 7.5%. Operating profit and margin were impacted by the items described above.
4545_Fin_C2.pdf 36 March 4, 2020

UNITED PARCEL SERVICE, INC. AND SUBSIDIARIES
MANAGEMENT'S DISCUSSION AND ANALYSIS OF FINANCIAL CONDITION ANDRESULTS OF OPERATIONS
35
Consolidated Operating Expenses
Year Ended December 31, $ Change % Change
2019 2018 2019/2018 2019/2018
Operating Expenses (in millions):
Compensation and Benefits: $ 38,908 $ 37,235 $ 1,673 4.5 %
Transformation Strategy Costs (166) (262) 96 (36.6)%
Adjusted Compensation and Benefits 38,742 36,973 1,769 4.8 %
Repairs and Maintenance 1,838 1,732 106 6.1 %
Depreciation and Amortization 2,360 2,207 153 6.9 %
Purchased Transportation 12,590 13,409 (819) (6.1)%
Fuel 3,289 3,427 (138) (4.0)%
Other Occupancy 1,392 1,362 30 2.2 %
Other Expenses 5,919 5,465 454 8.3 %
Total Other Expenses 27,388 27,602 (214) (0.8)%
Other Transformation Strategy Costs (89) (98) 9 (9.2)%
Legal Contingencies and Expenses (97) — (97) N/M
Adjusted Total Other Expenses $ 27,202 $ 27,504 $ (302) (1.1)%
Total Operating Expenses $ 66,296 $ 64,837 $ 1,459 2.3 %
Adjusted Total Operating Expenses $ 65,944 $ 64,477 $ 1,467 2.3 %
Currency Translation Cost / (Benefit)* $ (369)
Year Ended December 31, $ Change % Change
2019 2018 2019/2018 2019/2018Adjustments to Operating Expenses (in millions):
Transformation Strategy Costs:Compensation $ 21 $ — $ 21 N/MBenefits 145 262 (117) (44.7)%Depreciation and Amortization 3 12 (9) (75.0)%Other Occupancy 8 — 8 N/MOther Expenses 78 86 (8) (9.3)%
Total Transformation Strategy Costs $ 255 $ 360 $ (105) (29.2)%Legal Contingencies and Expenses:
Other Expenses $ 97 $ — $ 97 N/MTotal Adjustments to Operating Expenses $ 352 $ 360 $ (8) (2.2)%
Compensation and Benefits
2019 compared to 2018
Total compensation and benefits, and total compensation and benefits excluding the year over year impact of transformation strategy costs, increased for 2019.
Total compensation costs increased $1.028 billion or 4.6%. Excluding the year over year impact of transformation strategy costs, adjusted compensation increased $1.007 billion largely due to higher U.S. Domestic direct labor costs. These costs increased as a result of additional headcount, driven by U.S. Domestic average daily volume growth that resulted in an increase in average daily union hours of 4.7%. Contractual union wage increases also contributed to the increase in compensation for hourly employees.
4545_Fin_C2.pdf 37 March 4, 2020

UNITED PARCEL SERVICE, INC. AND SUBSIDIARIES
MANAGEMENT'S DISCUSSION AND ANALYSIS OF FINANCIAL CONDITION ANDRESULTS OF OPERATIONS
36
Benefits costs increased $645 million. Excluding the year over year impact of transformation strategy costs, adjusted benefits costs increased $762 million due to the following:
• Health and welfare costs increased $570 million, driven by higher contributions to multiemployer plans due tocontractual rate increases, an overall increase in the size of the workforce and changes in eligibility for certain unionemployees.
• Pension and retirement benefits increased $18 million. The impacts of contractually-mandated contribution increasesto multiemployer plans, as well as an increase in the size of the overall workforce, were substantially offset by lowerservice cost for company-sponsored plans as a result of higher discount rates.
• Vacation, excused absence, payroll taxes and other expenses increased $211 million, primarily driven by salaryincreases and growth in the overall size of the workforce.
• Workers' compensation expense decreased $37 million as we experienced more favorable actuarial adjustments. Weevaluate the total range of actuarial outcomes when estimating losses that will ultimately occur. See note 1 to theaudited, consolidated financial statements for a further description of this policy.
Repairs and Maintenance
2019 compared to 2018
The increase in repairs and maintenance expense was driven by maintenance of our aircraft, routine repairs to buildings and facilities and maintenance of our other transportation equipment, due to additional investments we have made in recent periods.
Depreciation and Amortization
2019 compared to 2018
We evaluate the useful lives of all our property, plant and equipment based on our usage, maintenance and replacement policies, and taking into account physical and economic factors that may affect the useful lives of the assets. See note 1 to the audited, consolidated financial statements for a further description of the policy.
For 2019, depreciation expense increased $365 million, and net income decreased by $287 million, or $0.33 per share on a basic and diluted basis, as a result of investments in property, plant and equipment, net of disposals and assets becoming fully depreciated. Depreciation expense decreased $212 million, and net income increased $167 million, or $0.19 per share on a basic and diluted basis, as a result of lengthening our estimated useful lives for various asset categories in the latter half of 2018. The combined effect of the foregoing was a net increase in depreciation expense of $153 million and a decrease in net income of $120 million, or $0.14 per share on a basic and diluted basis, for the year.
Purchased Transportation
2019 compared to 2018
The decrease in purchased transportation expense charged to us by third-party air, rail, ocean and truck carriers was primarily driven by the following factors:
• Expense in our Freight Forwarding and Logistics business decreased $530 million due to decreases in both marketrates and volume in our air and ocean freight forwarding businesses. Our truckload brokerage business alsoexperienced declines in rates, primarily driven by market overcapacity. These decreases were partially offset byincreases due to volume growth and rate increases in our mail services business.
• U.S. Domestic Package expense decreased $186 million primarily due to lower overall usage of third-partytransportation carriers.
• International Package expense decreased $100 million primarily due to favorable currency exchange rate movements.
• Other purchased transportation expense decreased $3 million due to changes in the number of leased and charteredaircraft and lower fuel surcharges passed on to us by outside carriers.
4545_Fin_C2.pdf 38 March 4, 2020

UNITED PARCEL SERVICE, INC. AND SUBSIDIARIES
MANAGEMENT'S DISCUSSION AND ANALYSIS OF FINANCIAL CONDITION ANDRESULTS OF OPERATIONS
37
Fuel
2019 compared to 2018
The decrease in fuel expense was driven by lower jet fuel, diesel and gasoline prices as well as higher alternative fuel tax credits as a result of legislation passed in 2019. These decreases were partially offset by higher consumption due to additional aircraft block hours and vehicle miles driven by higher U.S. Domestic package volume.
Other Occupancy
2019 compared to 2018
The increase in other occupancy expense and other occupancy expense excluding the year over year impact of transformation strategy costs was primarily driven by additional operating facilities coming into service.
Other Expenses
2019 compared to 2018
Other expenses, and other expenses excluding the year over year impact of transformation strategy costs and legal contingencies and expenses, increased for 2019. The increase was attributable to various items, including adjustments to reserves for self-insured automobile liability claims, bad debt expense, technology equipment and software licenses, professional service fees and advertising. These increases were partially offset by a $40 million gain on the sale of surplus property in Canada and lower travel and entertainment expenses.
Other Income and (Expense)
The following table sets forth investment income (expense) and other and interest expense for the years ended December 31, 2019 and 2018 (in millions):
Year Ended December 31, $ Change % Change
2019 2018 2019/2018 2019/2018Investment Income (Expense) and Other $ (1,493) $ (400) $ (1,093) 273.3 %
Defined Benefit Plans Mark-to-Market Charges 2,387 1,627 760 46.7 %Adjusted Investment Income (Expense) and Other $ 894 $ 1,227 $ (333) (27.1)%
Interest Expense (653) (605) (48) 7.9 %Total Other Income and (Expense) $ (2,146) $ (1,005) $ (1,141) 113.5 %
Adjusted Other Income and (Expense) $ 241 $ 622 $ (381) (61.3)%
Investment Income (Expense) and Other
2019 compared to 2018
Investment income (expense) and other for the period increased $1.093 billion, which included a $760 million increase in mark-to-market pension charges. Excluding the impact of the defined benefit plan mark-to-market charges, adjusted investment income (expense) and other for the period, which includes expected investment returns on pension assets, net of interest cost on projected benefit obligations, prior service cost and investment income, decreased $333 million. Expected returns on plan assets decreased as a result of the lower asset base driven by negative asset returns in 2018, partially offset by the effects of higher discretionary contributions in 2019. Pension interest cost increased with higher year-end discount rates, ongoing plan growth and an increase in the projected benefit obligation as a result of the 2018 year-end measurement of our plans. Investment income increased as a result of higher yields on invested assets, higher overall investment balances and foreign currency exchange rate movements.
4545_Fin_C2.pdf 39 March 4, 2020

UNITED PARCEL SERVICE, INC. AND SUBSIDIARIES
MANAGEMENT'S DISCUSSION AND ANALYSIS OF FINANCIAL CONDITION ANDRESULTS OF OPERATIONS
38
Interest Expense
2019 compared to 2018
Interest expense increased primarily due to higher average outstanding debt balances and higher effective interest rates, combined with lower capitalized interest for 2019.
Income Tax Expense
The following table sets forth income tax expense and our effective tax rate for the years ended December 31, 2019 and 2018 (in millions):
Year Ended December 31, $ Change % Change
2019 2018 2019/2018 2019/2018
Income Tax Expense: $ 1,212 $ 1,228 $ (16) (1.3)%
Income Tax Impact of:
Defined Benefit Plans Mark-to-Market Charges 571 390 181 46.4 %
Transformation Strategy Costs 59 87 (28) (32.2)%
Legal Contingencies and Expenses 6 — 6 N/M
Adjusted Income Tax Expense $ 1,848 $ 1,705 $ 143 8.4 %
Effective Tax Rate 21.4% 20.4%
Adjusted Effective Tax Rate 22.0% 21.3%
For additional information on income tax expense and our effective tax rate, see note 14 to the audited, consolidated financial statements.
4545_Fin_C2.pdf 40 March 4, 2020

UNITED PARCEL SERVICE, INC. AND SUBSIDIARIES
MANAGEMENT'S DISCUSSION AND ANALYSIS OF FINANCIAL CONDITION ANDRESULTS OF OPERATIONS
39
Liquidity and Capital Resources
As of December 31, 2019, we had $5.741 billion in cash, cash equivalents and marketable securities. We believe that our current cash position, access to commercial paper programs and debt capital markets and cash flow generated from operations should be adequate not only for operating requirements, but also to enable us to complete our capital expenditure programs, transformation strategy and to fund dividend payments, share repurchases, pension contributions and long-term debt payments through the next several years. We regularly evaluate opportunities to optimize our capital structure, including through issuances of debt or equity to refinance existing debt and to fund ongoing cash needs.
Cash Flows From Operating Activities
The following is a summary of the significant sources (uses) of cash from operating activities (in millions):
2019 2018
Net Income $ 4,440 $ 4,791
Non-cash operating activities(1) 6,405 6,048
Pension and postretirement benefit plan contributions (company-sponsored plans) (2,362) (186)
Hedge margin receivables and payables 171 482
Income tax receivables and payables 599 469
Changes in working capital and other non-current assets and liabilities (634) 1,091
Other operating activities 20 16
Net cash from operating activities $ 8,639 $ 12,711(1) Represents depreciation and amortization, gains and losses on derivative transactions and foreign exchange, deferred income taxes, provisions foruncollectible accounts receivable, amortization on operating lease assets, pension and postretirement benefit expense, stock compensation expense and other non-cash items.
Cash from operating activities remained strong throughout 2018 and 2019. Most of the variability in operating cash flows during this period related to funding company-sponsored pension and postretirement benefit plans (and related cash tax deductions). Except for discretionary or accelerated fundings of our plans, contributions to our company-sponsored pension plans have largely varied in accordance with minimum funding requirements. We made discretionary contributions to our three primary, company-sponsored U.S. pension plans totaling $2.0 billion in 2019. No discretionary contributions were made in 2018. The remaining contributions in 2018 and 2019 were to our international pension plans and U.S. postretirement medical benefit plans.
Operating cash flows were impacted by changes in our working capital management whereby certain payments from the fourth quarter of 2018 shifted into the first quarter of 2019. In addition, accelerated growth in the business lifted overall working capital demand. The net hedge margin collateral received from our derivative counterparties was $171 and $482 million during 2019 and 2018, respectively, due to the change in net fair value of the derivative contracts used in our currency and interest rate hedging programs. Cash payments for income taxes were $514 million and $2 million for 2019 and 2018, respectively, primarily due to timing of deductions related to pension contributions.
As of December 31, 2019, our total worldwide holdings of cash, cash equivalents and marketable securities were $5.741 billion, of which approximately $2.564 billion was held by foreign subsidiaries. The amount of cash, cash equivalents and marketable securities held by our U.S. and foreign subsidiaries fluctuates throughout the year due to a variety of factors, including the timing of cash receipts and disbursements in the normal course of business. Cash provided by operating activities in the U.S. continues to be our primary source of funds to finance domestic operating needs, capital expenditures, share repurchases, pension contributions and dividend payments to shareowners. All cash, cash equivalents and marketable securities held by foreign subsidiaries are generally available for distribution to the U.S. without any U.S. federal income taxes. Any such distributions may be subject to foreign withholding and U.S. state taxes. When amounts earned by foreign subsidiaries are expected to be indefinitely reinvested, no accrual for taxes is provided.
4545_Fin_C2.pdf 41 March 4, 2020

UNITED PARCEL SERVICE, INC. AND SUBSIDIARIES
MANAGEMENT'S DISCUSSION AND ANALYSIS OF FINANCIAL CONDITION ANDRESULTS OF OPERATIONS
40
Cash Flows From Investing Activities
Our primary sources (uses) of cash for investing activities were as follows (amounts in millions):
2019 2018
Net cash used in investing activities $ (6,061) $ (6,330)
Capital Expenditures:
Buildings, facilities and plant equipment $ (2,729) $ (3,147)
Aircraft and parts (1,890) (1,496)
Vehicles (987) (931)
Information technology (774) (709)
Total Capital Expenditures(1): $ (6,380) $ (6,283)
Capital Expenditures as a % of revenue 8.6% 8.7%
Other Investing Activities:
Proceeds from disposals of property, plant and equipment $ 65 $ 37
Net change in finance receivables $ 13 $ 4
Net (purchases), sales and maturities of marketable securities $ 322 $ (87)
Cash paid for business acquisitions, net of cash and cash equivalents acquired $ (6) $ (2)
Other investing activities $ (75) $ 1(1) In addition to capital expenditures of $6.380 and $6.283 billion in 2019 and 2018, respectively, there were capital expenditures relating to the principalrepayments of finance lease obligations of $140 and $340 million. These are included in cash flows from financing activities.
We have commitments for the purchase of aircraft, vehicles, equipment and real estate to provide for the replacement of existing capacity and anticipated future growth. We generally fund our capital expenditures with cash from operations. Future capital spending for anticipated growth and replacement assets will depend on a variety of factors, including economic and industry conditions. In 2017 we began a multi-year investment program in our smart global logistics network which impacts all asset categories, with the largest investments in buildings, facilities and plant equipment. This investment program will continue in 2020, and we anticipate that our capital expenditures will be approximately $6.5 to $7.0 billion.
Capital expenditures on buildings, facilities and plant equipment decreased in 2019 compared to 2018 in our U.S. and international package businesses, as we completed several facility automation and capacity expansion projects in 2018. Capital spending on aircraft increased in 2019 compared 2018 due to a net increase in contract deposits on open aircraft orders and final payments associated with the delivery of aircraft. Capital spending on information technology increased in 2019 compared to 2018 due to continuing development of technology enabled solutions and capitalized software projects. Capital spending on vehicles increased in 2019 relative to 2018, largely due to the timing of vehicle replacements and expansion of the overall fleet to support volume growth.
Proceeds from the disposal of property, plant and equipment were largely attributable to the sale of an international property in 2019 and disposal of equipment in 2018. The net change in finance receivables was due to reductions in our finance portfolios in 2019 compared with 2018. Purchases and sales of marketable securities are largely determined by liquidity needs and the periodic rebalancing of investment types, and will fluctuate from period to period.
Cash paid for business acquisitions in 2019 and 2018 related to our acquisition of area franchise rights for The UPS Store, as well as other, small acquisitions in our International Small Package and Logistics business units in 2019. Other investing activities are impacted by changes in our non-current investments and various other items.
4545_Fin_C2.pdf 42 March 4, 2020

UNITED PARCEL SERVICE, INC. AND SUBSIDIARIES
MANAGEMENT'S DISCUSSION AND ANALYSIS OF FINANCIAL CONDITION ANDRESULTS OF OPERATIONS
41
Cash Flows From Financing Activities
Our primary sources (uses) of cash for financing activities were as follows (amounts in millions, except per share data):
2019 2018
Net cash used in financing activities $ (1,727) $ (5,692)
Share Repurchases:
Cash expended for shares repurchased $ (1,004) $ (1,011)
Number of shares repurchased (9.1) (8.9)
Shares outstanding at period end 857 858
Percent increase (decrease) in shares outstanding (0.1)% (0.1)%
Dividends:
Dividends declared per share $ 3.84 $ 3.64
Cash expended for dividend payments $ (3,194) $ (3,011)
Borrowings:
Net borrowings (repayments) of debt principal $ 2,419 $ (1,622)
Other Financing Activities:
Cash received for common stock issuances $ 218 $ 240
Other financing activities $ (166) $ (288)
Capitalization:
Total debt outstanding at year end $ 25,238 $ 22,736
Total shareowners’ equity at year end 3,283 3,037
Total capitalization $ 28,521 $ 25,773
For the years ended December 31, 2019 and 2018, we repurchased a total of 9.1 and 8.9 million shares of class A and class B common stock for $1.005 and $1.000 billion, respectively ($1.004 and $1.011 billion in repurchases for 2019 and 2018, respectively, are reported on the cash flow statement due to the timing of settlements). For additional information on our share repurchase activities, see note 11 to the audited, consolidated financial statements.
For the years ended December 31, 2019 and 2018, dividends reported within shareowners' equity include $147 and $178 million, respectively, of non-cash dividends that were settled in shares of class A common stock.
The declaration of dividends is subject to the discretion of the Board of Directors and depends on various factors, including our net income, financial condition, cash requirements, future prospects and other relevant factors. We expect to continue the practice of paying regular cash dividends. In February 2020, we increased our quarterly dividend payment from $0.96 to $1.01 per share, a 5.2% increase.
4545_Fin_C2.pdf 43 March 4, 2020

UNITED PARCEL SERVICE, INC. AND SUBSIDIARIES
MANAGEMENT'S DISCUSSION AND ANALYSIS OF FINANCIAL CONDITION ANDRESULTS OF OPERATIONS
42
Issuances of debt in 2019 consisted of fixed-rate senior notes totaling $3.0 billion and commercial paper. In 2018, issuances of debt consisted primarily of commercial paper. The following is a summary of debt issuances in 2019 (in millions):
Principal Amount in USD
2019
Fixed-rate senior notes:
2.200% senior notes $ 400
2.500% senior notes 400
3.400% senior notes (multiple issuances) 1,450
4.250% senior notes 750
Total $ 3,000
Repayments of debt in 2019 and 2018 consisted primarily of our $1.0 billion 5.125% fixed-rate senior notes that matured in April 2019 and our $750 million 5.50% fixed-rate senior notes that matured in January 2018. The remaining repayments of debt during the period included paydowns of commercial paper and scheduled principal payments on our finance lease obligations. We consider the overall fixed and floating interest rate mix of our portfolio and the related overall cost of borrowing when planning for future issuances and non-scheduled repayments of debt.
The amount of commercial paper outstanding fluctuates throughout the year based on daily liquidity needs. The following is a summary of our commercial paper program (in millions):
Functional currencyoutstanding balance
at year endOutstanding balance
at year end ($)Average balance
outstandingAverage balanceoutstanding ($)
Average interestrate
2019
USD $ 2,172 $ 2,172 $ 1,665 $ 1,665 2.24 %
EUR € 949 $ 1,062 € 903 $ 1,011 (0.39)%
Total $ 3,234
Functional currencyoutstanding balance
at year endOutstanding balance
at year end ($)Average balance
outstandingAverage balanceoutstanding ($)
Average interestrate
2018
USD $ 1,968 $ 1,968 $ 2,137 $ 2,137 1.81 %
EUR € 606 $ 694 € 360 $ 425 (0.38)%
Total $ 2,662
The variation in cash received from common stock issuances was primarily due to the amount of stock option exercises by employees in 2018 and 2019.
Other financing activities includes cash used to repurchase shares from employees sold to satisfy tax withholding obligations on vested stock awards of $180 and $259 million in 2019 and 2018, respectively. Net cash inflows from premium payments and settlements of capped call options for the purchase of UPS class B shares were $21 and $34 million in 2019 and 2018, respectively.
Sources of Credit
See note 8 to the audited, consolidated financial statements for a discussion of our available credit and debt covenants.
4545_Fin_C2.pdf 44 March 4, 2020

UNITED PARCEL SERVICE, INC. AND SUBSIDIARIES
MANAGEMENT'S DISCUSSION AND ANALYSIS OF FINANCIAL CONDITION ANDRESULTS OF OPERATIONS
43
Guarantees and Other Off-Balance Sheet Arrangements
Except as disclosed in note 8 to the audited, consolidated financial statements, we do not have guarantees or other off-balance sheet financing arrangements, including variable interest entities, which we believe could have a material impact on financial condition or liquidity.
Contractual Commitments
We have contractual obligations and commitments in the form of finance leases, operating leases, debt obligations, purchase commitments and certain other liabilities. We intend to satisfy these obligations primarily through the use of cash flow from operations. The following table summarizes the expected cash outflow to satisfy our contractual obligations and commitments as of December 31, 2019 (in millions):
Commitment Type 2020 2021 2022 2023 2024 After 2024 Total
Finance Leases $ 199 44 39 37 35 259 $ 613
Operating Leases 619 536 451 360 256 1,267 3,489
Debt Principal 4,232 2,551 2,001 2,284 1,474 12,349 24,891
Debt Interest 749 661 601 521 481 6,522 9,535
Purchase Commitments (1) 3,569 1,982 966 323 261 201 7,302
Tax Act Repatriation Liability — — — 13 49 61 123
Pension Funding 1,180 — — — — — 1,180
Total $ 10,548 $ 5,774 $ 4,058 $ 3,538 $ 2,556 $ 20,659 $ 47,133(1) Purchase commitments includes amounts due under aircraft leases that we entered into in 2019 and our January 29, 2020 announcedcommitment to purchase 10,000 electric vehicles.
Our finance lease obligations relate primarily to leases on aircraft and real estate. Finance leases and operating leases are discussed further in note 10 to the audited, consolidated financial statements. Purchase commitments, as well as our debt principal obligations, are discussed further in note 8 to the audited, consolidated financial statements. The amount of interest on our debt was calculated as the contractual interest payments due on our fixed-rate debt and variable rate debt based on interest rates as of December 31, 2019. The calculations of debt interest take into account the effect of interest rate swap agreements. For debt denominated in a foreign currency, the U.S. Dollar equivalent principal amount of the debt at the end of the year was used as the basis to calculate future interest payments.
Purchase commitments represent contractual agreements to purchase assets, goods or services that are legally binding, including contracts for aircraft, construction of new or expanded facilities and orders for technology equipment and vehicles. As of December 31, 2019, we had firm commitments to lease three used and purchase eight new Boeing 767-300 aircraft, to be delivered between 2020 and 2021 and to purchase 13 new Boeing 747-8F aircraft to be delivered between 2020 and 2022. We also had a firm commitment to purchase five Boeing MD-11 aircraft to be delivered between 2020 and 2021. We paid the full purchase price for these MD-11 aircraft in December 2019; therefore these amounts are not included in the table above.
On December 22, 2017, the United States enacted into law the Tax Act requiring a one-time transition tax on certain unrepatriated earnings of foreign subsidiaries. Companies may elect to pay the tax over eight years based on an installment schedule outlined in the Tax Act but are required under current Internal Revenue Service guidance to offset certain overpayments of tax against the liability. We made this election and have reflected our remaining transition tax due by year as a contractual obligation.
There are no anticipated required minimum cash contributions to our qualified U.S. pension plans (these plans are discussed further in note 5 to the audited, consolidated financial statements). The amount of any minimum funding requirement, as applicable, for these plans could change significantly in future periods depending on many factors, including future plan asset returns, discount rates, other actuarial assumptions and changes to pension plan funding regulations. A decline in discount rates or a sustained significant decline in equity or bond returns could result in our domestic pension plans being subject to significantly higher minimum funding requirements. Actual contributions made in future years could materially differ and consequently required minimum contributions beyond 2020 cannot be reasonably estimated.
4545_Fin_C2.pdf 45 March 4, 2020

UNITED PARCEL SERVICE, INC. AND SUBSIDIARIES
MANAGEMENT'S DISCUSSION AND ANALYSIS OF FINANCIAL CONDITION ANDRESULTS OF OPERATIONS
44
As discussed in note 6 to the audited, consolidated financial statements, we are not currently subject to any minimum contributions or surcharges with respect to the multiemployer pension and health and welfare plans in which we participate. Contribution rates to these multiemployer pension and health and welfare plans are established through the collective bargaining process. As we are not subject to any minimum contribution levels, we have not included any amounts in the contractual commitments table with respect to these multiemployer plans.
The table above does not include approximately $228 million of liabilities for uncertain tax positions because we are uncertain if or when such amounts will ultimately be settled in cash. Uncertain tax positions are further discussed in note 14 to the audited, consolidated financial statements.
As of December 31, 2019, we had outstanding letters of credit totaling approximately $1.267 billion issued in connection with our self-insurance reserves and other routine business requirements. We also issue surety bonds as an alternative to letters of credit in certain instances, and as of December 31, 2019, we had $1.327 billion of surety bonds written. As of December 31, 2019, we had unfunded loan commitments totaling $131 million associated with UPS Capital.
We believe that funds from operations and borrowing programs will provide adequate sources of liquidity and capital resources to meet our expected long-term needs for the operation of our business, including anticipated capital expenditures, transformation strategy and pension contributions for the foreseeable future.
Contingencies
See note 5 to the audited, consolidated financial statements for a discussion of pension related matters and note 9 for a discussion of judicial proceedings and other matters arising from the conduct of our business activities.
Collective Bargaining Agreements
Status of Collective Bargaining Agreements
See note 6 to the audited, consolidated financial statements for a discussion of the status of collective bargaining agreements.
Multiemployer Benefit Plans
We contribute to a number of multiemployer pension and health and welfare plans under the terms of collective bargaining agreements that cover our union represented employees. Our current collective bargaining agreements set forth the annual contribution increases allotted to the plans that we participate in, and we are in compliance with these contribution rates. These limitations will remain in effect throughout the terms of the existing collective bargaining agreements.
New Accounting Pronouncements
Recently Adopted Accounting Standards
See note 1 to the audited, consolidated financial statements for a discussion of recently adopted accounting standards.
Accounting Standards Issued But Not Yet Effective
See note 1 to the audited, consolidated financial statements for a discussion of accounting standards issued, but not yet effective.
Rate Adjustments
Effective December 29, 2019, the rates and accessorial charges for UPS Ground, UPS Air and International services increased by an average net 4.9%. UPS Air Freight rates within and between the U.S., Canada and Puerto Rico increased an average net 4.2%. Density-based UPS Freight non-contractual LTL rates using Tariff 580 increased an average net 3.9%.
These rate changes are customary and occur on an annual basis. Rate changes for shipments originating outside the U.S. are made throughout the year and vary by geographic market.
4545_Fin_C2.pdf 46 March 4, 2020

UNITED PARCEL SERVICE, INC. AND SUBSIDIARIES
MANAGEMENT'S DISCUSSION AND ANALYSIS OF FINANCIAL CONDITION ANDRESULTS OF OPERATIONS
45
Critical Accounting Policies and Estimates
This discussion and analysis of our financial condition and results of operations are based on our consolidated financial statements, which are prepared in accordance with GAAP. As indicated in note 1 to the audited, consolidated financial statements, the amounts of assets, liabilities, revenue and expenses reported in our financial statements are affected by estimates and judgments that are necessary to comply with GAAP. We base our estimates on prior experience and assumptions and third-party input that we consider reasonable to our circumstances. Actual results could differ materially from our estimates, which would affect the related amounts reported in our consolidated financial statements. While estimates and judgments are applied in arriving at many reported amounts, we believe that the following critical accounting policies involve a higher degree of judgment and complexity.
Contingencies
As discussed in note 9 to the audited, consolidated financial statements, we are involved in various legal proceedings and subject to various contingencies. The events that may impact our contingent liabilities are often unique and generally are not predictable. At the time a contingency is identified, we consider all relevant facts as part of our evaluation. We record a liability for a loss when the loss is probable of occurring and reasonably estimable. Events may arise that were not anticipated and the outcome of a contingency may result in a loss to us that differs from our previously estimated liability. This difference could be material. Income taxes and self-insurance are discussed below. Except as disclosed in note 9 to the audited, consolidated financial statements, other contingent losses that were probable and estimable were not material to our financial position or results of operations as of, or for the year ended, December 31, 2019. In addition, we have certain contingent liabilities that have not been recognized as of, or for the year ended, December 31, 2019, because a loss was not reasonably estimable.
Goodwill and Intangible Impairment
We test goodwill for impairment in each of our reporting units on an annual basis. Our U.S. Domestic Package segment is a reporting unit. In our International Package reporting segment, we have the following reporting units: Europe, Asia, Americas and ISMEA. In our Supply Chain & Freight segment we have the following reporting units: Forwarding, Logistics, UPS Mail Innovations, UPS Freight, The UPS Store, UPS Capital, Marken and Coyote Logistics. Our annual goodwill impairment testing date is July 1st for each reporting unit owned at the testing date. In assessing goodwill for impairment, we initially evaluate qualitative factors to determine if it is more likely than not that the fair value of a reporting unit is less than its carrying amount. If the qualitative assessment is not conclusive and it is necessary to calculate the fair value of a reporting unit, then we utilize a two-step process to test goodwill for impairment. First, a comparison of the fair value of the applicable reporting unit with the aggregate carrying value, including goodwill, is performed. If the carrying amount of a reporting unit exceeds the reporting unit’s fair value, we perform the second step of the goodwill impairment test to determine the amount of impairment loss. The second step includes comparing the implied fair value of the affected reporting unit’s goodwill with the carrying value of that goodwill.
We primarily determine the fair value of our reporting units using a discounted cash flow (“DCF”) model and supplement this with observable valuation multiples for comparable companies, as appropriate. The completion of the DCF model requires that we make a number of significant assumptions to produce an estimate of future cash flows. These assumptions include projections of future revenue, costs, capital expenditures and working capital changes, as well as assumptions about the estimated cost of capital and other relevant variables. The projections that we use in our DCF model are updated annually and will change over time based on the historical performance and changing business conditions for each of our reporting units. The determination of whether goodwill is impaired involves a significant level of judgment in these assumptions, and changes in our business strategy, government regulations, or economic or market conditions could significantly impact these judgments. We routinely monitor market conditions and other factors to determine if interim impairment tests are necessary. If impairment indicators are present in future periods, the resulting impairment charges could have a material impact on our results of operations.
None of the reporting units incurred any goodwill impairment charges in 2019 or 2018. Changes in our forecasts could cause carrying values of our reporting units to exceed their fair values in future periods, potentially resulting in a goodwill impairment charge. During the year, management monitored the actual performance of the business relative to the fair value assumptions used during our annual goodwill impairment test. For the periods presented, no triggering events were identified that required an interim impairment test. Based on most recent tests, the fair value of all our reporting units exceed their carrying value.
4545_Fin_C2.pdf 47 March 4, 2020

UNITED PARCEL SERVICE, INC. AND SUBSIDIARIES
MANAGEMENT'S DISCUSSION AND ANALYSIS OF FINANCIAL CONDITION ANDRESULTS OF OPERATIONS
46
A trade name with a carrying value of $200 million and licenses with a carrying value of $4 million as of December 31, 2019 are considered to be indefinite-lived intangibles, and therefore are not amortized. Impairment tests for indefinite-lived intangibles are performed on an annual basis. We determined that the income approach, specifically the relief from royalty method, is the most appropriate valuation method for the trade name. The estimated fair value of the trade name is compared to the carrying value of the asset. If the carrying value of the trade name exceeds its estimated fair value, an impairment charge is recognized for the amount by which the carrying amount of the asset exceeds its fair value. This valuation approach requires that we make a number of assumptions to estimate fair value. These assumptions include projections of future revenues, market royalty rates, tax rates, discount rates and other relevant variables. The projections we use in the model are updated annually and will change over time based on the historical performance and changing business conditions.
All of our remaining recorded intangible assets are deemed to be finite-lived intangibles, and are amortized over their estimated useful lives. Impairment tests for these intangible assets are only performed when a triggering event occurs that indicates that the carrying value of the intangible may not be recoverable based on the undiscounted future cash flows of the intangible. If the carrying amount of the intangible is determined not to be recoverable, a write-down to fair value is recorded. Fair values are determined based on a DCF model. If impairment indicators are present in future periods, the resulting impairment charges could have a material impact on our results of operations. Impairments of finite-lived intangible assets were $2 and $12 million in 2019 and 2018, respectively. There were no impairments of indefinite-lived intangible assets in 2019 or 2018.
Self-Insurance Accruals
We self-insure costs associated with workers’ compensation claims, automobile liability, health and welfare and general business liabilities, up to certain limits. Insurance reserves are established for estimates of the loss that we will ultimately incur on reported claims, as well as loss estimates for claims that have been incurred but not yet reported. Recorded balances are based on third-party actuarial estimates, which incorporate historical loss experience and judgments about the present and expected cost per claim. Trends in actual experience are a significant factor in the determination of our reserves.
Workers’ compensation, automobile liability and general liability insurance claims may take several years to completely settle. Consequently, actuarial estimates are required to project the ultimate cost that will be incurred to fully resolve a claim. A number of factors can affect the actual cost of a claim, including the length of time the claim remains open, trends in healthcare costs, the results of any related litigation and with respect to workers’ compensation claims and changes in legislation. Furthermore, claims may emerge in a future year for events that occurred in a prior year at a rate that differs from actuarial projections. All of these factors can result in revisions to actuarial projections and produce a material difference between estimated and actual operating results. Based on our historical experience, during 2019 we changed our self-insurance reserves from the central estimate to the low end of the actuarial range of losses. We believe our estimated reserves for such claims are adequate; actual experience in claim frequency and/or severity could materially differ from our estimates and affect our results of operations. For additional information on our self-insurance reserves, refer to note 1 of the audited, consolidated financial statements.
We sponsor a number of health and welfare insurance plans for our employees. Liabilities and expenses related to these plans are based on estimates of, among other things, the number of employees and eligible dependents covered under the plans, anticipated medical usage by participants and overall trends in medical costs and inflation. We believe our estimates are reasonable/appropriate. Actual experience may differ from these estimates and, therefore, produce a material difference between estimated and actual operating results.
Pension and Postretirement Medical Benefits
Our pension and other postretirement benefit costs are calculated using various actuarial assumptions and methodologies. These assumptions include discount rates, healthcare cost trend rates, inflation, compensation increase rates, expected returns on plan assets, mortality rates and other factors. The assumptions utilized in recording the obligations under our plans represent our best estimates, and we believe that they are reasonable, based on information as to historical experience and performance as well as other factors that might cause future expectations to differ from past trends.
4545_Fin_C2.pdf 48 March 4, 2020

UNITED PARCEL SERVICE, INC. AND SUBSIDIARIES
MANAGEMENT'S DISCUSSION AND ANALYSIS OF FINANCIAL CONDITION ANDRESULTS OF OPERATIONS
47
Differences in actual experience or changes in assumptions may affect our pension and other postretirement obligations and future expenses. The primary factors contributing to actuarial gains and losses each year are (1) changes in the discount rate used to value pension and postretirement benefit obligations as of the measurement date, (2) differences between the expected and the actual return on plan assets, (3) changes in demographic assumptions including mortality, (4) participant experience different from demographic assumptions and (5) changes in coordinating benefits with plans not sponsored by UPS. In October 2019, we refined the bond matching approach used to determine the discount rate for our U.S. pension and postretirement plans by implementing advances in technology and modeling techniques. This refinement decreased the projected benefit obligation on our consolidated balance sheet by approximately $900 million as of December 31, 2019, decreased the pre-tax mark-to-market charge by approximately $810 million and increased net income by $616 million, or $0.71 per share on a basic and diluted basis.
We recognize changes in the fair value of plan assets and net actuarial gains or losses in excess of a corridor (defined as 10% of the greater of the fair value of plan assets or the plans' projected benefit obligations) in pension expense annually at December 31st each year. The remaining components of pension expense (herein referred to as "ongoing net periodic benefit cost"), primarily service and interest costs and the expected return on plan assets, are reported on a quarterly basis.
The following sensitivity analysis shows the impact of a 25 basis point change in the assumed discount rate and return on assets for our pension and postretirement benefit plans, and the resulting increase/(decrease) on our obligations and expense as of, and for the year ended, December 31, 2019 (in millions).
Pension Plans25 Basis Point
Increase25 Basis Point
DecreaseDiscount Rate:
Effect on ongoing net periodic benefit cost $ (37) $ 38
Effect on net periodic benefit cost for amounts recognized outside the 10% corridor (1,390) 2,043
Effect on projected benefit obligation (2,156) 2,294
Return on Assets:
Effect on ongoing net periodic benefit cost(1) (100) 100
Effect on net periodic benefit cost for amounts recognized outside the 10% corridor(2) (100) 100
Postretirement Medical Plans
Discount Rate:
Effect on ongoing net periodic benefit cost 3 (3)
Effect on net periodic benefit cost for amounts recognized outside the 10% corridor (37) 48
Effect on accumulated postretirement benefit obligation (55) 65
Healthcare Cost Trend Rate:
Effect on ongoing net periodic benefit cost 1 (1)
Effect on net periodic benefit cost for amounts recognized outside the 10% corridor 4 (5)
Effect on accumulated postretirement benefit obligation 14 (16)(1) Amount calculated based on 25 basis point increase / decrease in the expected return on assets.(2) Amount calculated based on 25 basis point increase / decrease in the actual return on assets.
Refer to note 5 to the audited, consolidated financial statements for information on our potential liability for coordinating benefits related to the Central States Pension Fund.
4545_Fin_C2.pdf 49 March 4, 2020

UNITED PARCEL SERVICE, INC. AND SUBSIDIARIES
MANAGEMENT'S DISCUSSION AND ANALYSIS OF FINANCIAL CONDITION ANDRESULTS OF OPERATIONS
48
Depreciation, Residual Value and Impairment of Fixed Assets
As of December 31, 2019, we had $30.482 billion of net fixed assets, the most significant category of which is aircraft. In accounting for fixed assets, we make estimates of the expected useful lives, the expected residual values and the potential for impairment based on the fair values of the assets and the cash flows which they generate.
In estimating the lives and expected residual values of aircraft, we rely upon actual experience with the same or similar aircraft types. Revisions to these estimates could be caused by changes to our maintenance programs, changes in the utilization of the aircraft, governmental regulations on aging aircraft and changing market prices of new and used aircraft of the same or similar types. We periodically evaluate these estimates and assumptions, and adjust them as necessary. Adjustments are accounted for on a prospective basis through depreciation expense. In 2019, we revised our estimates of the useful lives and residual values for certain airframes, engines and related rotable parts. This change increased the useful lives of certain fleet types and reduced the useful lives and residual values of the majority of our used aircraft. The net impact to 2019 depreciation expense was not material. In estimating cash flows, we project future volume levels for our different air products in all geographic regions in which we do business. Adverse changes in these volume forecasts, or a shortfall of our actual volume compared with our projections, could result in our current aircraft capacity exceeding current or projected demand. This situation could lead to an excess of a particular aircraft, resulting in an aircraft impairment charge or a reduction of the expected life of an aircraft (thus resulting in increased depreciation expense).
We evaluate the useful lives of our property, plant and equipment based on our usage, maintenance and replacement policies, and taking into account physical and economic factors that may affect the useful lives of the assets. As part of our ongoing investment in transformation in 2018, we revised our estimates of useful lives for building improvements, vehicles and plant equipment based on our current assessment of these factors. In general, these changes in estimate had the effect of lengthening the useful lives of vehicles, building improvements and plant equipment, and were applied prospectively beginning in 2018 through depreciation expense. See "Consolidated Operating Expenses" of this "Management's Discussion and Analysis of Financial Condition and Results of Operations" for the discussion of the impacts to "Depreciation and Amortization." See note 1 to the audited, consolidated financial statements for a discussion of our accounting policies and note 4 for a discussion of the change in estimated useful lives.
We review long-lived assets for impairment when circumstances indicate the carrying amount of an asset may not be recoverable based on the undiscounted future cash flows of the asset. If the carrying amount of the asset is determined not to be recoverable, a write-down to fair value is recorded. Fair values are determined based on quoted market values, discounted cash flows or external appraisals, as appropriate. We review long-lived assets for impairment at the individual asset or the asset group level for which the lowest level of independent cash flows can be identified. The circumstances that would indicate potential impairment may include, but are not limited to, a significant change in the extent to which an asset is utilized and operating or cash flow losses associated with the use of the asset.
There were no impairment charges on our property, plant and equipment during 2019 or 2018.
Fair Value Measurements
In the normal course of business, we hold and issue financial instruments that contain elements of market risk, including derivatives, marketable securities, finance receivables, pension assets, other investments and debt. Certain of these financial instruments are required to be recorded at fair value, principally derivatives, marketable securities, pension assets and certain other investments. Fair values are based on listed market prices, when such prices are available. To the extent that listed market prices are not available, fair value is determined based on other relevant factors, including dealer price quotations. If listed market prices or other relevant factors are not available, inputs are developed from unobservable data reflecting our own assumptions and include situations where there is little or no market activity for the asset or liability. Certain financial instruments, including over-the-counter derivative instruments, are valued using pricing models that consider, among other factors, contractual and market prices, correlations, time value, credit spreads and yield curve volatility factors. Changes in the fixed income, foreign exchange and commodity markets will impact our estimates of fair value in the future, potentially affecting our results of operations. A quantitative sensitivity analysis of our exposure to changes in commodity prices, foreign currency exchange rates and interest rates is presented in the “Quantitative and Qualitative Disclosures about Market Risk” section of this report.
4545_Fin_C2.pdf 50 March 4, 2020

UNITED PARCEL SERVICE, INC. AND SUBSIDIARIES
MANAGEMENT'S DISCUSSION AND ANALYSIS OF FINANCIAL CONDITION ANDRESULTS OF OPERATIONS
49
Certain non-financial assets and liabilities are measured at fair value on a nonrecurring basis, including property, plant, and equipment, goodwill and intangible assets. These assets are not measured at fair value on a recurring basis; however, they are subject to fair value adjustments in certain circumstances, such as when there is evidence of an impairment.
For acquisitions, we allocate the fair value of purchase consideration to the tangible assets acquired, liabilities assumed and intangible assets acquired based on their estimated fair values. The excess of the fair value of purchase consideration over the fair values of these identifiable assets and liabilities is recorded as goodwill. Such valuations require management to make significant estimates and assumptions, especially with respect to intangible assets. Significant estimates in valuing certain intangible assets include, but are not limited to, future expected cash flows from acquired customers, technology and trade names from a market participant perspective, useful lives and discount rates. Management’s estimates of fair value are based upon assumptions believed to be reasonable, but which are inherently uncertain and unpredictable. As a result, actual results may differ from estimates. During the measurement period, which is one year from the acquisition date, we may record adjustments to the assets acquired and liabilities assumed, with the corresponding offset to goodwill. Upon the conclusion of the measurement period, any subsequent adjustments are recorded to earnings.
Income Taxes
We make certain estimates and judgments in determining income tax expense for financial statement purposes. These estimates and judgments occur in the calculation of income by legal entity and jurisdiction, tax credits, benefits and deductions, and in the calculation of deferred tax assets and liabilities, which arise from differences in the timing of recognition of revenue and expense for tax and financial statement purposes, as well as tax, interest and penalties related to uncertain tax positions. Significant changes to these estimates may result in an increase or decrease to our tax provision in a subsequent period.
We assess the likelihood that we will be able to recover our deferred tax assets. If recovery is not likely, we must increase our provision for taxes by recording a valuation allowance against the deferred tax assets that we estimate will not ultimately be recoverable. We believe that we will ultimately recover a substantial majority of the deferred tax assets recorded on our consolidated balance sheets. However, should there be a change in our ability to recover our deferred tax assets, our tax provision would increase in the period in which we determined that the recovery was not likely.
The calculation of our tax liabilities involves dealing with uncertainties in the application of complex tax regulations. We recognize liabilities for uncertain tax positions based on a two-step process. The first step is to evaluate the tax position for recognition by determining if the weight of available evidence indicates that it is more likely than not that the position will be sustained on audit, including resolution of related appeals or litigation processes, if any. Once it is determined that the position meets the recognition threshold, the second step requires us to estimate and measure the largest amount of tax benefit that is more likely than not to be realized upon ultimate settlement. The difference between the amount of recognizable tax benefit and the total amount of tax benefit from positions filed or to be filed with the tax authorities is recorded as a liability for uncertain tax benefits. It is inherently difficult and subjective to estimate such amounts, as we have to determine the probability of various possible outcomes. We reevaluate uncertain tax positions on a quarterly basis. This evaluation is based on factors including, but not limited to, changes in facts or circumstances, changes in tax law, effectively settled issues under audit and new audit activity. Such a change in recognition or measurement could result in the recognition of a tax benefit or an additional charge to the tax provision.
See note 14 to the audited consolidated financial statements for a discussion of impacts of the Tax Act.
4545_Fin_C2.pdf 51 March 4, 2020

UNITED PARCEL SERVICE, INC. AND SUBSIDIARIES
MANAGEMENT'S DISCUSSION AND ANALYSIS OF FINANCIAL CONDITION ANDRESULTS OF OPERATIONS
50
Item 7A. Quantitative and Qualitative Disclosures about Market Risk
We are exposed to market risk from changes in certain commodity prices, foreign currency exchange rates, interest rates and equity prices. All of these market risks arise in the normal course of business, as we do not engage in speculative trading activities. In order to manage the risk arising from these exposures, we utilize a variety of commodity, foreign exchange and interest rate forward contracts, options and swaps. A discussion of our accounting policies for derivative instruments and further disclosures are provided in note 1 to the audited, consolidated financial statements.
Commodity Price Risk
We are exposed to changes in the prices of refined fuels, principally jet-A, diesel and unleaded gasoline, as well as changes in the price of natural gas and other alternative fuels. Currently, the fuel surcharges that we apply to our domestic and international package and LTL services are the primary means of reducing the risk of adverse fuel price changes. In order to mitigate the impact of fuel surcharges imposed on us by outside carriers, we regularly adjust the rates we charge for our freight brokerage, inter-modal and truckload services. The majority of our contracts for fuel purchases utilize index-based pricing formulas plus or minus a fixed locational/supplier differential. While many of the indices are aligned, each index may fluctuate at a different pace, driving variability in the prices paid for fuel. Because of this, our operating results may be affected should the market price of fuel suddenly change by a significant amount or change by amounts that do not result in an adjustment in our fuel surcharges, which can significantly affect our earnings either positively or negatively in the short-term. Additionally, we periodically use a combination of option, forward and futures contracts to provide partial protection from changing fuel and energy prices. As of December 31, 2019 and 2018, however, we had no commodity contracts outstanding.
Foreign Currency Exchange Risk
We have foreign currency risks related to our revenue, operating expenses and financing transactions in currencies other than the local currencies in which we operate. We are exposed to currency risk from the potential changes in functional currency values of our foreign currency-denominated assets, liabilities and cash flows. Our most significant foreign currency exposures relate to the Euro, British Pound Sterling, Canadian Dollar, Chinese Renminbi and Hong Kong Dollar. We use forwards as well as a combination of purchased and written options to hedge forecasted cash flow currency exposures. These derivative instruments generally cover forecasted foreign currency exposures for periods of 12 to 48 months. We also utilize forward contracts to hedge portions of our anticipated cash settlements of intercompany transactions and interest payments on certain debt subject to foreign currency remeasurement.
Interest Rate Risk
We have issued debt instruments, including debt associated with finance leases, that accrue expense at fixed and floating rates of interest. We use a combination of interest rate swaps as part of our program to manage the fixed and floating interest rate mix of our total debt portfolio and related overall cost of borrowing. The notional amount, interest payment and maturity dates of the swaps match the terms of the associated debt. We also utilize forward starting swaps and similar instruments to lock in all or a portion of the borrowing cost of anticipated debt issuances. Our floating-rate debt and interest rate swaps subject us to risk resulting from changes in short-term (primarily LIBOR) interest rates. For a discussion of the risks associated with the anticipated cessation of LIBOR, see Item 1A. Risk Factors - "The proposed phase out of the London Interbank Offer Rate ("LIBOR") could have an adverse effect on us".
We also are subject to interest rate risk with respect to our pension and postretirement benefit obligations, as changes in interest rates will effectively increase or decrease our liabilities associated with these benefit plans, which also results in changes to the amount of pension and postretirement benefit expense recognized in future periods.
We have investments in debt securities, as well as cash-equivalent instruments, some of which accrue income at variable rates of interest. Additionally, we hold a portfolio of finance receivables that accrue income at fixed and floating rates of interest.
4545_Fin_C2.pdf 52 March 4, 2020

UNITED PARCEL SERVICE, INC. AND SUBSIDIARIES
MANAGEMENT'S DISCUSSION AND ANALYSIS OF FINANCIAL CONDITION ANDRESULTS OF OPERATIONS
51
Sensitivity Analysis
The following analysis provides quantitative information regarding our exposure to foreign currency exchange risk, interest rate risk and equity price risk embedded in our existing financial instruments. We utilize valuation models to evaluate the sensitivity of the fair value of financial instruments with exposure to market risk that assume instantaneous, parallel shifts in exchange rates, interest rate yield curves and commodity and equity prices. For options and instruments with non-linear returns, models appropriate to the instrument are utilized to determine the impact of market shifts.
There are certain limitations inherent in the sensitivity analyses presented, primarily due to the assumption that exchange rates change in a parallel fashion and that interest rates change instantaneously. In addition, the analyses are unable to reflect the complex market reactions that normally would arise from the market shifts modeled. While this is our best estimate of the impact of the specified interest rate scenarios, these estimates should not be viewed as forecasts. We adjust the fixed and floating interest rate mix of our interest rate sensitive assets and liabilities in response to changes in market conditions. Additionally, changes in the fair value of foreign currency derivatives and commodity derivatives are offset by changes in the cash flows of the underlying hedged foreign currency and commodity transactions.
Shock-Test Result As of December 31,
(in millions) 2019 2018
Change in Fair Value:
Currency Derivatives(1) $ (786) $ (743)
Change in Annual Interest Expense:
Variable Rate Debt(2) $ 64 $ 58
Interest Rate Derivatives(2) $ 37 $ 47
Change in Annual Interest Income:
Marketable Securities(3) $ — $ 1
(1) The potential change in fair value from a hypothetical 10% weakening of the U.S. Dollar against local currency exchange rates across allmaturities.
(2) The potential change in annual interest expense resulting from a hypothetical 100 basis point increase in short-term interest rates, appliedto our variable rate debt and swap instruments (excluding hedges of anticipated debt issuances).
(3) The potential change in interest income resulting from a hypothetical 100 basis point increase in short-term interest rates, applied to ourvariable rate investment holdings.
The sensitivity of our pension and postretirement benefit obligations to changes in interest rates is quantified in “Critical Accounting Policies and Estimates”. The sensitivity in the fair value and interest income of our finance receivables due to changes in interest rates was not material as of December 31, 2019 and 2018.
4545_Fin_C2.pdf 53 March 4, 2020

52
Item 8. Financial Statements and Supplementary Data
Table of Contents
Report of Independent Registered Public Accounting FirmConsolidated Balance SheetsStatements of Consolidated IncomeStatements of Consolidated Comprehensive Income (Loss)Statements of Consolidated Cash FlowsNotes to Consolidated Financial Statements
Note 1—Summary of Accounting PoliciesNote 2—Revenue RecognitionNote 3—Investments and Restricted CashNote 4—Property, Plant and EquipmentNote 5—Company Sponsored Employee Benefit PlansNote 6—Multiemployer Employee Benefit PlansNote 7—Goodwill and Intangible AssetsNote 8—Debt and Financing ArrangementsNote 9—Legal Proceedings and ContingenciesNote 10—LeasesNote 11—Shareowners’ EquityNote 12—Stock-Based CompensationNote 13—Segment and Geographic InformationNote 14—Income TaxesNote 15—Earnings Per ShareNote 16—Derivative Instruments and Risk ManagementNote 17—Transformation Strategy CostsNote 18—Quarterly Information (Unaudited)
535758585960606871757688919399
101105109113116121122127127
4545_Fin_C2.pdf 54 March 4, 2020

53
Report of Independent Registered Public Accounting Firm
To the Shareowners and Board of Directors ofUnited Parcel Service, Inc.Atlanta, Georgia
Opinion on the Financial Statements
We have audited the accompanying consolidated balance sheets of United Parcel Service, Inc. and subsidiaries (the "Company") as of December 31, 2019 and 2018, the related consolidated statements of income, comprehensive income, and cash flows, for each of the three years in the period ended December 31, 2019, and the related notes (collectively referred to as the "financial statements"). In our opinion, the financial statements present fairly, in all material respects, the financial position of the Company as of December 31, 2019 and 2018, and the results of its operations and its cash flows for each of the three years in the period ended December 31, 2019, in conformity with accounting principles generally accepted in the United States of America.
We have also audited, in accordance with the standards of the Public Company Accounting Oversight Board (United States) (PCAOB), the Company's internal control over financial reporting as of December 31, 2019, based on criteria established in Internal Control - Integrated Framework (2013) issued by the Committee of Sponsoring Organizations of the Treadway Commission and our report dated February 20, 2020, expressed an unqualified opinion on the Company's internal control over financial reporting.
Change in Accounting Principle
As discussed in Note 1 to the financial statements, the Company has changed its method of accounting for leases due to the adoption of Financial Accounting Standards Board Accounting Standards Update 2016-02, Leases (Topic 842). This change has been applied on a modified retrospective basis effective on January 1, 2019.
Basis for Opinion
These financial statements are the responsibility of the Company's management. Our responsibility is to express an opinion on the Company's financial statements based on our audits. We are a public accounting firm registered with the PCAOB and are required to be independent with respect to the Company in accordance with the U.S. federal securities laws and the applicable rules and regulations of the Securities and Exchange Commission and the PCAOB.
We conducted our audits in accordance with the standards of the PCAOB. Those standards require that we plan and perform the audit to obtain reasonable assurance about whether the financial statements are free of material misstatement, whether due to error or fraud. Our audits included performing procedures to assess the risks of material misstatement of the financial statements, whether due to error or fraud, and performing procedures that respond to those risks. Such procedures included examining, on a test basis, evidence regarding the amounts and disclosures in the financial statements. Our audits also included evaluating the accounting principles used and significant estimates made by management, as well as evaluating the overall presentation of the financial statements. We believe that our audits provide a reasonable basis for our opinion.
Critical Audit Matters
The critical audit matters communicated below are matters arising from the current-period audit of the financial statements that were communicated or required to be communicated to the audit committee and that (1) relate to accounts or disclosures that are material to the financial statements and (2) involved our especially challenging, subjective, or complex judgments. The communication of critical audit matters does not alter in any way our opinion on the financial statements, taken as a whole, and we are not, by communicating the critical audit matters below, providing separate opinions on the critical audit matters or on the accounts or disclosures to which they relate.
4545_Fin_C2.pdf 55 March 4, 2020

54
Central States Pension Fund coordinating benefit obligation assumptions - Refer to Note 5, Company-Sponsored Employee Benefit Plans (Actuarial Assumptions - Central States Pension Fund), to the financial statements
Critical Audit Matter Description
The Company was a contributing employer to the Central States Pension Fund (“CSPF”) until 2007 when it withdrew and fully funded its allocable share of unvested benefits. The Company agreed to provide coordinating benefits in the UPS/IBT Full Time Employee Pension Plan (“UPS/IBT Plan”) to CSPF participants whose last employer was the Company and who had not retired as of January 1, 2008 (the “UPS Transfer Group”) if the CSPF were to lawfully reduce benefits consistent with the terms of its withdrawal agreement with the Company. The CSPF has asserted that, absent legislative reform, it will become insolvent in 2025. If the CSPF were to become insolvent consistent with that assertion, the Company may be required to provide coordinating benefits through the UPS/IBT Plan to the UPS Transfer Group.
Under accounting standards generally accepted in the United States of America (“GAAP”), the Company is required to determine its best estimate of the eventual outcome of this matter and is prohibited from anticipating potential changes in law in making that best estimate. The Company considered potential outcomes based on the existing legislative framework, including the eventual insolvency of the CSPF or an approved application to reduce benefits under the U.S. Multiemployer Pension Reform Act (“MPRA”). As the Company cannot consider a legislative solution when making its best estimate of its projected benefit obligation, the Company believes the trustees of the CSPF (the “Trustees”) would be more likely to pursue an application to reduce benefits under the MPRA than they would be to allow the insolvency of the CSPF.
Based upon this possible outcome, the Company developed assumptions related to 1) the order in which benefits would be reduced to groups of participants under MPRA, 2) whether CSPF can reduce benefits to the UPS Transfer Group under MPRA without the Company’s consent, 3) the timing and effective date of a MPRA application, and 4) the actuarial assumptions associated with the timing of future CSPF cash flows. Based on the Company’s deterministic cash flow projection, management recorded a projected benefit obligation of $2.6 billion for the CSPF coordinating benefits at December 31, 2019. Given that the passage of time or changes in actuarial assumptions could reduce or eliminate the effectiveness of a MPRA application in the future, it is reasonably possible that, at the next measurement date, the projected benefit obligation could increase by approximately $2.2 billion, resulting in a total obligation for the CSPF coordinating benefits of $4.8 billion. The Company also developed disclosures of the risks and uncertainties associated with this matter.
The assumptions require significant management judgment and the following audit considerations:
1. Auditing management’s conclusion that the CSPF benefits to the UPS Transfer Group cannot be reduced without firstexhausting benefit reductions to the other CSPF participants is challenging because there appears to be multiple legalinterpretations of the benefit reduction provisions of MPRA and those provisions have not yet been litigated.
2. Auditing management’s conclusion that the CSPF could not reduce benefits to the UPS Transfer Group without theCompany’s consent requires judgment because the agreement between CSPF and the Company requiring such consentwas made before the passage of MPRA and has not yet been litigated.
3. Auditing management’s assumptions related to the timing and effective date of a MPRA application is subjective.4. Auditing the actuarial assumptions used to estimate the timing and present value of future CSPF cash flows is
challenging because the underlying data is limited to information made publicly available by the CSPF.5. Auditing the sufficiency of the Company’s disclosure of this matter in the footnotes to the financial statements is
challenging due to the number of uncertainties associated with the potential obligation.
How the Critical Audit Matter Was Addressed in the Audit
Our audit procedures to address the Company’s assumptions used to measure its potential obligation to pay for CSPF coordinating benefits to the UPS Transfer Group (the “Coordinating Benefits”) included the following, among others:
• We tested the effectiveness of controls over Coordinating Benefits assumptions, including those over the determinationof the accounting model, the key legal positions relevant to determining its Coordinating Benefits obligation, the otheractuarial assumptions used to project the potential Coordinating Benefits obligation; and the related financial statementdisclosures.
4545_Fin_C2.pdf 56 March 4, 2020

55
• With the assistance of professionals in our firm having expertise in pension accounting, we evaluated the Company’sconclusions regarding the accounting model applied to the Coordinating Benefits obligation through consideration ofpossible alternatives under GAAP.
• We evaluated the Company’s assumptions used in determining the most likely outcome of the CSPF matter under theexisting legislative framework. In order to evaluate the Company’s expectation that the Trustees would pursue anotherbenefit suspension in order to avoid insolvency, we obtained evidence regarding the fiduciary responsibilities of theTrustees to govern the CSPF in a manner that continues to provide benefits to participants and their beneficiaries.
• We evaluated the Company’s conclusion that 1) the CSPF could not reduce benefits to the UPS Transfer Group underMPRA without first exhausting benefit reductions to the other CSPF participants and 2) the CSPF could not reducebenefits without obtaining the Company’s consent based on the terms of an agreement between the CSPF and theCompany. Specifically, we examined letters from internal and external counsel describing both counsel’s conclusionthat those positions are more likely than not to be sustained if they were to be litigated. With the assistance ofprofessionals in our firm having expertise in legal matters, we also evaluated whether the legal arguments supportingthis assertion had substantive legal basis.
• With the assistance of our actuarial specialists, we tested the underlying data and actuarial model used by managementto estimate the potential obligation to provide Coordinating Benefits, including consideration of (1) the expectedtiming of CSPF benefit reductions; (2) the discount rate; (3) the projected contributions and benefit payments; and (4)the expected return on CSPF assets. Further, because the data used by management is limited to publicly availableCSPF information, we considered whether other available sources of data may yield a more precise estimate.
• We compared the Company’s footnote disclosure relating to this matter to the information communicated betweenmanagement and the Company’s audit committee to evaluate whether significant uncertainties had been omitted fromthe disclosure.
Valuation of U.S. hedge fund, risk parity, private debt, private equity and real estate investments - Refer to Note 5, Company-Sponsored Employee Benefit Plans (Fair Value Measurements), to the financial statements
Critical Audit Matter Description
The Company’s U.S. pension and postretirement medical benefit plans (the “U.S. Plans”) held hedge fund, risk parity, private debt, private equity and real estate investments valued at $7.6 billion as of December 31, 2019.
The Company determines the reported values of the U.S. Plans’ investments in hedge, risk parity, private debt, private equity and real estate funds primarily based on the estimated net asset value (“NAV”) of the fund. In order to estimate NAV, the Company evaluates audited and unaudited financial reports from fund managers, and makes adjustments, as appropriate, for investment activity between the date of the financial reports and December 31st. These investments are not actively traded, and their values can only be estimated using these subjective assumptions.
Auditing the estimated NAV of these hedge fund, risk parity, private debt, private equity and real estate instruments requires a high degree of auditor judgment and subjectivity to evaluate the completeness, reliability and relevance of the inputs used by management.
How the Critical Audit Matter Was Addressed in the Audit
Our audit procedures related to the inputs used by management to estimate the NAV of the U.S. Plans’ hedge fund, risk parity, private debt, private equity and real estate investments included the following, among others:
• We tested the effectiveness of controls, including those related to the reliability of values reported by fund managers,the relevance of asset class benchmark returns, and the completeness and accuracy of unobservable inputs related tothe underlying assets of the funds.
4545_Fin_C2.pdf 57 March 4, 2020

56
• For certain investments, we confirmed directly with the respective fund manager its preliminary estimate of the fund’sNAV as of December 31, 2019.
• We evaluated the Company’s ability to accurately estimate NAV for these funds by comparing each fund’s recordedvaluation as of its most recent fiscal year end to the audited fund financial statements (which are received in arrears ofthe Company’s reporting timetable).
Revenue - Refer to Note 2, Revenue Recognition, to the financial statements
Critical Audit Matter Description
Approximately 80 percent of the Company’s revenues are from its global small package operations that provide time-definite delivery services for express letters, documents, small packages and palletized freight via air and ground services. The Company’s global small package revenues are comprised of a significant volume of low-dollar transactions sourced from systems that were primarily developed by the Company. The processing of transactions, including the recording of them, is highly automated and based on contractual terms with the Company’s customers.
Auditing global small package revenue required a significant extent of effort and the involvement of professionals with expertise in information technology (“IT”) necessary for us to identify, test, and evaluate the Company’s systems, software applications, and automated controls.
How the Critical Audit Matter Was Addressed in the Audit
Our audit procedures related to the Company’s systems to process global small package revenue transactions included the following, among others:
• With the assistance of our IT specialists, we:
• Identified the significant systems used to process global small package revenue transactions and tested theeffectiveness of the general IT controls over each of these systems, including testing of user access controls, changemanagement controls, and IT operations controls.
• Tested the effectiveness of system interface controls and automated controls within the global small package revenuestream, as well as the controls designed to ensure the accuracy and completeness of revenue. We tested theeffectiveness of controls over the relevant global small package revenue business processes, including those in place toreconcile the various systems to the Company’s general ledger.
• We performed analytical procedures to evaluate the Company’s recorded revenue and evaluate trends.
• For a sample of customers, we read the Company’s contract with the customer and evaluated the Company’s pattern ofrevenue recognition for the customer. In addition, we evaluated the accuracy of the Company’s recorded global smallpackage revenue for a sample of customer invoices.
/s/ Deloitte & Touche LLP
Atlanta, GeorgiaFebruary 20, 2020
We have served as the Company's auditor since 1969.
4545_Fin_C2.pdf 58 March 4, 2020

57
UNITED PARCEL SERVICE, INC. AND SUBSIDIARIES
CONSOLIDATED BALANCE SHEETS(In millions)
December 31,2019 2018
ASSETSCurrent Assets:
Cash and cash equivalents $ 5,238 $ 4,225Marketable securities 503 810Accounts receivable, net 9,552 8,958Current income taxes receivable 382 940Other current assets 1,428 1,277
Total Current Assets 17,103 16,210Property, Plant and Equipment, Net 30,482 26,576Operating Lease Right-Of-Use Assets 2,856 —Goodwill 3,813 3,811Intangible Assets, Net 2,167 2,075Investments and Restricted Cash 24 170Deferred Income Tax Assets 330 141Other Non-Current Assets 1,082 1,033Total Assets $ 57,857 $ 50,016
LIABILITIES AND SHAREOWNERS’ EQUITYCurrent Liabilities:
Current maturities of long-term debt and commercial paper $ 3,420 $ 2,805Current maturities of operating leases 538 —Accounts payable 5,555 5,188Accrued wages and withholdings 2,552 3,047Self-insurance reserves 914 810Accrued group welfare and retirement plan contributions 793 715Other current liabilities 1,641 1,522
Total Current Liabilities 15,413 14,087Long-Term Debt and Finance Leases 21,818 19,931Non-Current Operating Leases 2,391 —Pension and Postretirement Benefit Obligations 10,601 8,347Deferred Income Tax Liabilities 1,632 1,619Self-Insurance Reserves 1,282 1,571Other Non-Current Liabilities 1,437 1,424Shareowners’ Equity:
Class A common stock (156 and 163 shares issued in 2019 and 2018) 2 2Class B common stock (701 and 696 shares issued in 2019 and 2018) 7 7Additional paid-in capital 150 —Retained earnings 9,105 8,006Accumulated other comprehensive loss (5,997) (4,994)Deferred compensation obligations 26 32Less: Treasury stock (0.4 shares in 2019 and 0.6 shares in 2018) (26) (32)
Total Equity for Controlling Interests 3,267 3,021Noncontrolling Interests 16 16
Total Shareowners’ Equity 3,283 3,037Total Liabilities and Shareowners’ Equity $ 57,857 $ 50,016
See notes to audited, consolidated financial statements.
4545_Fin_C2.pdf 59 March 4, 2020

58
UNITED PARCEL SERVICE, INC. AND SUBSIDIARIESSTATEMENTS OF CONSOLIDATED INCOME
(In millions, except per share amounts)
Years Ended December 31,2019 2018 2017
Revenue $ 74,094 $ 71,861 $ 66,585Operating Expenses:
Compensation and benefits 38,908 37,235 34,577Repairs and maintenance 1,838 1,732 1,601Depreciation and amortization 2,360 2,207 2,282Purchased transportation 12,590 13,409 11,696Fuel 3,289 3,427 2,690Other occupancy 1,392 1,362 1,155Other expenses 5,919 5,465 5,055
Total Operating Expenses 66,296 64,837 59,056Operating Profit 7,798 7,024 7,529Other Income and (Expense):
Investment income (expense) and other (1,493) (400) 61Interest expense (653) (605) (453)
Total Other Income and (Expense) (2,146) (1,005) (392)Income Before Income Taxes 5,652 6,019 7,137Income Tax Expense 1,212 1,228 2,232Net Income $ 4,440 $ 4,791 $ 4,905Basic Earnings Per Share $ 5.14 $ 5.53 $ 5.63Diluted Earnings Per Share $ 5.11 $ 5.51 $ 5.61
STATEMENTS OF CONSOLIDATED COMPREHENSIVE INCOME (LOSS)(In millions)
Years Ended December 31,2019 2018 2017
Net Income $ 4,440 $ 4,791 $ 4,905Change in foreign currency translation adjustment, net of tax 48 (149) 86Change in unrealized gain (loss) on marketable securities, net of tax 6 — (1)Change in unrealized gain (loss) on cash flow hedges, net of tax 72 485 (321)Change in unrecognized pension and postretirement benefit costs, net of tax (1,129) 272 (148)Comprehensive Income (Loss) $ 3,437 $ 5,399 $ 4,521
See notes to audited, consolidated financial statements.
4545_Fin_C2.pdf 60 March 4, 2020

59
UNITED PARCEL SERVICE, INC. AND SUBSIDIARIESSTATEMENTS OF CONSOLIDATED CASH FLOWS
(In millions)
Years Ended December 31,2019 2018 2017
Cash Flows From Operating Activities:Net income $ 4,440 $ 4,791 $ 4,905
Adjustments to reconcile net income to net cash from operating activities:Depreciation and amortization 2,360 2,207 2,282Pension and postretirement benefit expense 3,141 2,242 1,643Pension and postretirement benefit contributions (2,362) (186) (7,794)Self-insurance reserves (185) (86) —Deferred tax (benefit) expense 100 758 1,224Stock compensation expense 915 634 584Other (gains) losses 74 293 37Changes in assets and liabilities, net of effects of business acquisitions:
Accounts receivable (717) (421) (1,022)Other assets 698 754 (984)Accounts payable 419 1,034 599Accrued wages and withholdings (446) 505 200Other liabilities 182 170 (243)
Other operating activities 20 16 48Net cash from operating activities 8,639 12,711 1,479
Cash Flows From Investing Activities:Capital expenditures (6,380) (6,283) (5,227)Proceeds from disposals of property, plant and equipment 65 37 24Purchases of marketable securities (561) (973) (1,630)Sales and maturities of marketable securities 883 886 1,990Net change in finance receivables 13 4 5Cash paid for business acquisitions, net of cash and cash equivalents acquired (6) (2) (134)Other investing activities (75) 1 1
Net cash (used in) investing activities (6,061) (6,330) (4,971)Cash Flows From Financing Activities:
Net change in short-term debt 310 63 (250)Proceeds from long-term borrowings 5,205 1,202 12,016Repayments of long-term borrowings (3,096) (2,887) (3,939)Purchases of common stock (1,004) (1,011) (1,813)Issuances of common stock 218 240 247Dividends (3,194) (3,011) (2,771)Other financing activities (166) (288) (203)
Net cash (used in)/from financing activities (1,727) (5,692) 3,287Effect Of Exchange Rate Changes On Cash, Cash Equivalents and Restricted Cash 20 (91) 53Net Increase (Decrease) In Cash, Cash Equivalents and Restricted Cash 871 598 (152)Cash, Cash Equivalents and Restricted Cash:
Beginning of period 4,367 3,769 3,921End of period $ 5,238 $ 4,367 $ 3,769
Cash Paid During The Period For:Interest (net of amount capitalized) $ 628 $ 595 $ 428Income taxes (net of refunds and overpayments) $ 514 $ 2 $ 1,559
See notes to audited, consolidated financial statements.
4545_Fin_C2.pdf 61 March 4, 2020

60
UNITED PARCEL SERVICE, INC. AND SUBSIDIARIESNOTES TO CONSOLIDATED FINANCIAL STATEMENTS
NOTE 1. SUMMARY OF ACCOUNTING POLICIES
Basis of Financial Statements and Business Activities
The accompanying consolidated financial statements have been prepared in accordance with accounting principles generally accepted in the United States (“GAAP”), and include the accounts of United Parcel Service, Inc., and all of its consolidated subsidiaries (collectively “UPS” or the “Company”). All intercompany balances and transactions have been eliminated.
We provide transportation services, primarily domestic and international letter and package delivery. Through our Supply Chain & Freight subsidiaries, we are also a global provider of specialized transportation, logistics and financial services.
Use of Estimates
The preparation of our consolidated financial statements requires the use of estimates and assumptions that affect the reported amounts of assets and liabilities, the reported amounts of revenues and expenses and the disclosure of contingencies. Estimates have been prepared on the basis of the most current and best information, and actual results could differ materially from those estimates.
Revenue Recognition
U.S. Domestic and International Package Operations—Revenue is recognized over time as we perform the services in the contract.
Forwarding —Freight forwarding revenue and the expense related to the transportation of freight are recognized over time as we perform the services. Truckload brokerage revenue and related transportation costs are recognized over time as we perform the services. Customs brokerage revenue is recognized upon completing documents necessary for customs entry purposes.
Logistics —In our Logistics business we have a right to consideration from customers in an amount that corresponds directly with the value to the customers of our performance completed to date, and as such we recognize revenue in the amount to which we have a right to invoice the customer.
UPS Freight—Revenue is recognized over time as we perform the services in the contract.
Financial Services—Income on loans and direct finance leases is recognized on the effective interest method. Accrual of interest income is suspended at the earlier of the time at which collection of an account becomes doubtful or the account becomes 90 days delinquent. Income on operating leases is recognized on the straight-line method over the terms of the underlying leases.
Principal vs. Agent Considerations—We utilize independent contractors and third-party carriers in the performance of some transportation services. GAAP requires us to evaluate whether our businesses themselves promise to transfer services to the customer (as the principal) or to arrange for services to be provided by another party (as the agent) using a control model. Based on our evaluation of the control model, we determined that all of our major businesses act as the principal rather than the agent within their revenue arrangements. Revenue and the associated purchased transportation costs are reported on a gross basis within our statements of consolidated income.
Refer to note 2 for further discussion of our revenue recognition policies.
Cash and Cash Equivalents
Cash and cash equivalents consist of highly liquid investments that are readily convertible into cash. We consider securities with maturities of three months or less, when purchased, to be cash equivalents. The carrying amount of these securities approximates fair value because of the short-term maturity of these instruments.
4545_Fin_C2.pdf 62 March 4, 2020

UNITED PARCEL SERVICE, INC. AND SUBSIDIARIESNOTES TO CONSOLIDATED FINANCIAL STATEMENTS
61
Investments
Debt securities are either classified as trading or available-for-sale securities and are carried at fair value. Unrealized gains and losses on trading securities are reported as investment income (expense) and other on the statements of consolidated income. Unrealized gains and losses on available-for-sale securities are reported as accumulated other comprehensive income (“AOCI”), a separate component of shareowners’ equity. The amortized cost of debt securities is adjusted for amortization of premiums and accretion of discounts to maturity. Such amortization and accretion is included in investment income (expense) and other, along with interest and dividends. The cost of securities sold is based on the specific identification method; realized gains and losses resulting from such sales are included in investment income (expense) and other.
We periodically review our available-for-sale investments for indications of other-than-temporary impairment considering many factors, including the extent and duration to which a security’s fair value has been less than its cost, overall economic and market conditions and the financial condition and specific prospects for the issuer. Impairment of available-for-sale securities results in a charge to income when a market decline below cost is other-than-temporary.
Inventories
Fuel and other materials and supplies inventories are recognized as inventory when purchased, and then charged to expense when used in our operations. Jet fuel, diesel and unleaded gasoline inventories are valued at the lower of average cost or net realizable value. Total inventories were $511 and $421 million as of December 31, 2019 and 2018, respectively, and are included in “Other current assets” on the consolidated balance sheets.
Property, Plant and Equipment
Property, plant and equipment are carried at cost. We evaluate the useful lives of our property, plant and equipment based on our usage, maintenance and replacement policies, and taking into account physical and economic factors that may affect the useful lives of the assets. As part of our ongoing investment in transformation in 2018, we revised our estimates of useful lives for building improvements, vehicles and plant equipment based on our current assessment of these factors. In 2019, we revised our estimates of useful lives and residual values for certain airframes, engines and related rotable parts. The changes in estimate had the effect of lengthening the useful lives of building improvements, vehicles, plant equipment and certain aircraft, and reduced the useful lives and residual values of the majority of our used aircraft.
Depreciation and amortization are provided by the straight-line method over the estimated useful lives of the assets, which are as follows:
• Aircraft: 12 to 40 years
• Buildings: 20 to 40 years
• Leasehold Improvements: lesser of asset useful life or lease term
• Plant Equipment: 3 to 20 years
• Technology Equipment: 3 to 5 years
• Vehicles: 6 to 15 years
For substantially all of our aircraft, the costs of major airframe and engine overhauls, as well as routine maintenance and repairs, are charged to expense as incurred.
Interest incurred during the construction period of certain property, plant and equipment is capitalized until the underlying assets are placed in service, at which time amortization of the capitalized interest begins, straight-line, over the estimated useful lives of the related assets. Capitalized interest was $91 and $97 million in 2019 and 2018, respectively.
We review long-lived assets for impairment when circumstances indicate the carrying amount of an asset may not be recoverable based on its undiscounted future cash flows. If the carrying amount of the asset is determined not to be recoverable, a write-down to fair value is recorded. Fair values are determined based on quoted market values, discounted cash flows or external appraisals, as appropriate. We review long-lived assets for impairment at the individual asset or the asset group level for which the lowest level of independent cash flows can be identified.
Leased Assets
For a discussion of our accounting policies related to leased assets, refer to note 10.
4545_Fin_C2.pdf 63 March 4, 2020

UNITED PARCEL SERVICE, INC. AND SUBSIDIARIESNOTES TO CONSOLIDATED FINANCIAL STATEMENTS
62
Goodwill and Intangible Assets
Costs of purchased businesses in excess of net identifiable assets acquired (goodwill), and indefinite-lived intangible assets are tested for impairment at least annually, unless changes in circumstances indicate an impairment may have occurred sooner. We are required to test goodwill on a reporting unit basis. A reporting unit is the operating segment unless, for businesses within that operating segment, discrete financial information is prepared and regularly reviewed by management, in which case such a component business is the reporting unit.
In assessing goodwill for impairment, we initially evaluate qualitative factors to determine if it is more likely than not that the fair value of a reporting unit is less than its carrying amount. We consider several factors, including macroeconomic conditions, industry and market conditions, overall financial performance of the reporting unit, changes in management, strategy or customers and relevant reporting unit-specific events such as a change in the carrying amount of net assets, a more likely than not expectation of selling or disposing of all, or a portion of, a reporting unit, and the testing for recoverability of a significant asset group within a reporting unit. If this qualitative assessment results in a conclusion that it is more likely than not that the fair value of a reporting unit exceeds the carrying value, then no further testing is performed for that reporting unit.
If the qualitative assessment is not conclusive and it is necessary to calculate the fair value of a reporting unit, then we utilize a two-step process to test goodwill for impairment. First, a comparison of the fair value of the applicable reporting unit with the aggregate carrying value, including goodwill, is performed. If the carrying amount of a reporting unit exceeds its calculated fair value, then the second step is performed, and an impairment charge is recognized for the amount, if any, by which the carrying amount of goodwill exceeds its implied fair value. We primarily determine the fair value of our reporting units using a discounted cash flow model and supplement this with observable valuation multiples for comparable companies, as appropriate.
A trade name with a carrying value of $200 million and licenses with a carrying value of $4 million as of December 31, 2019 are considered to be indefinite-lived intangibles, and therefore are not amortized. Indefinite-lived intangible assets are reviewed for impairment at least annually. We determined that the income approach, specifically the relief from royalty method, is the most appropriate valuation method to estimate the fair value of the trade name. The estimated fair value of the trade name is compared to the carrying value of the asset. If the carrying value of the trade name exceeds its estimated fair value, an impairment charge is recognized for the amount by which the carrying amount of the asset exceeds its fair value.
Finite-lived intangible assets, including trademarks, licenses, patents, customer lists, non-compete agreements and franchise rights are amortized on a straight-line basis over the estimated useful lives of the assets, which range from 2 to 22 years. Capitalized software is generally amortized over 7 years.
Self-Insurance Accruals
We self-insure costs associated with workers’ compensation claims, automobile liability, health and welfare and general business liabilities, up to certain limits. Insurance reserves are established for estimates of the loss that we will ultimately incur on reported claims, as well as estimates of claims that have been incurred but not yet reported. The expected ultimate cost for claims incurred is estimated based upon historical loss experience and judgments about the present and expected levels of cost per claim. Trends in actual experience are a significant factor in the determination of our reserves.
Workers’ compensation, automobile liability and general liability insurance claims may take several years to completely settle. Consequently, actuarial estimates are required to project the ultimate cost that will be incurred to fully resolve a claim. A number of factors can affect the actual cost of a claim, including the length of time the claim remains open, trends in healthcare costs, the results of any related litigation and with respect to workers’ compensation claims, changes in legislation. Furthermore, claims may emerge in a future year for events that occurred in a prior year at a rate that differs from actuarial projections. All of these factors can result in revisions to actuarial projections and produce a material difference between estimated and actual operating results. Based on our historical experience, during 2019 we changed our self-insurance reserves from the central estimate to the low end of the actuarial range of losses. The principal result of this change was a decrease in expense of $94 million and an increase in net income of $72 million, or $0.08 per share on a basic and diluted basis. We believe our estimated reserves for such claims are adequate, but actual experience in claim frequency and/or severity could materially differ from our estimates and affect our results of operations.
We sponsor a number of health and welfare insurance plans for our employees. These liabilities and related expenses are based on estimates of the number of employees and eligible dependents covered under the plans, anticipated medical usage by participants and overall trends in medical costs and inflation.
4545_Fin_C2.pdf 64 March 4, 2020

UNITED PARCEL SERVICE, INC. AND SUBSIDIARIESNOTES TO CONSOLIDATED FINANCIAL STATEMENTS
63
Pension and Postretirement Benefits
We incur certain employment-related expenses associated with pension and postretirement medical benefits. These pension and postretirement medical benefit costs for company-sponsored benefit plans are calculated using various actuarial assumptions and methodologies, including discount rates, expected returns on plan assets, healthcare cost trend rates, inflation, compensation increase rates, mortality rates and coordination of benefits with plans not sponsored by UPS. Actuarial assumptions are reviewed on an annual basis, unless circumstances require an interim remeasurement of any of our plans.
We recognize changes in the fair value of plan assets and net actuarial gains or losses in excess of a corridor (defined as 10% of the greater of the fair value of plan assets or the plan's projected benefit obligation) in net periodic benefit cost other than service cost annually at December 31st each year. The remaining components of pension expense, primarily service and interest costs and the expected return on plan assets, are recorded on a quarterly basis.
For eligible employees hired after July 1, 2016, UPS contributes annually to a defined contribution plan. We recognize expense for the required contribution quarterly, and we recognize a liability for any contributions due and unpaid (included in “Other current liabilities”).
During June 2017, we amended the UPS Retirement Plan and Excess Coordinating Plan to cease accrual of additional benefits for future service for non-union participants effective January 1, 2023. We remeasured plan assets and pension benefit obligations for the affected pension plans as of June 30, 2017 to recognize the impact of this change.
We participate in a number of trustee-managed multiemployer pension and health and welfare plans for employees covered under collective bargaining agreements. Our contributions to these plans are determined in accordance with the respective collective bargaining agreements. We recognize expense for the contractually required contribution for each period, and we recognize a liability for any contributions due and unpaid within “Other current liabilities”.
Income Taxes
Income taxes are accounted for on an asset and liability approach that requires the recognition of deferred tax assets and liabilities for the expected future tax consequences of events that have been recognized in our consolidated financial statements or tax returns. In estimating future tax consequences, we generally consider all expected future events other than proposed changes in the tax law or rates. Valuation allowances are provided if it is more likely than not that a deferred tax asset will not be realized.
We recognize liabilities for uncertain tax positions based on a two-step process. The first step is to evaluate the tax position for recognition by determining if the weight of available evidence indicates that it is more likely than not that the position will be sustained on audit, including resolution of related appeals or litigation processes, if any. Once it is determined that the position meets the recognition threshold, the second step requires us to estimate and measure the largest amount of tax benefit that is more likely than not to be realized upon ultimate settlement. The difference between the amount of recognizable tax benefit and the total amount of tax benefit from positions filed or to be filed with the tax authorities is recorded as a liability for uncertain tax benefits. It is inherently difficult and subjective to estimate such amounts, as we have to determine the probability of various possible outcomes. We reevaluate uncertain tax positions on a quarterly basis. This evaluation is based on factors including, but not limited to, changes in facts or circumstances, changes in tax law, effectively settled issues under audit and new audit activity. Such a change in recognition or measurement could result in the recognition of a tax benefit or an additional charge to the tax provision.
In January 2018, the Financial Accounting Standards Board ("FASB") released guidance on the accounting for tax on the Global Intangible Low-Taxed Income ("GILTI") provisions of the Tax Cuts and Jobs Act (the "Tax Act"). The GILTI provisions impose U.S. tax on certain foreign income in excess of a deemed return on tangible assets of foreign corporations. The guidance indicates that either accounting for deferred taxes related to GILTI inclusions or treating any taxes on GILTI inclusions as period costs are both acceptable methods subject to an accounting policy election. We elect to treat any potential GILTI inclusions as period costs.
Foreign Currency Translation and Remeasurement
We translate the results of operations of our foreign subsidiaries using average exchange rates during each period, whereas balance sheet accounts are translated using exchange rates at the end of each period. Balance sheet currency translation adjustments are recorded in AOCI. Pre-tax foreign currency transaction gains (losses) from remeasurement, net of hedging, included in investment income (expense) and other were $(6), $(19) and $3 million in 2019, 2018 and 2017, respectively.
4545_Fin_C2.pdf 65 March 4, 2020

UNITED PARCEL SERVICE, INC. AND SUBSIDIARIESNOTES TO CONSOLIDATED FINANCIAL STATEMENTS
64
Stock-Based Compensation
All share-based awards to employees are measured based on their fair values and expensed over the period during which an employee is required to provide service in exchange for the award (the vesting period), less estimated forfeitures. We have issued employee share-based awards under the UPS Incentive Compensation Plan that are subject to specific vesting conditions, including service conditions, where the awards cliff vest or vest ratably over a one, three, or five year period (the "nominal vesting period”) or at the date the employee retires (as defined by the plan), if earlier. Compensation cost is generally recognized immediately for awards granted to retirement-eligible employees, or over the period from the grant date to the date retirement eligibility is achieved, if that is expected to occur during the nominal vesting period. We estimate forfeiture rates based on historical rates of forfeitures for awards with similar characteristics, historical rates of employee turnover and the nature and terms of the vesting conditions of the awards. We reevaluate our forfeiture rates on an annual basis.
Fair Value Measurements
Our financial assets and liabilities measured at fair value on a recurring basis have been categorized based upon a fair value hierarchy. Level 1 inputs utilize quoted prices in active markets for identical assets or liabilities. Level 2 inputs are based on other observable market data, such as quoted prices for similar assets and liabilities, and inputs other than quoted prices that are observable, such as interest rates and yield curves. Level 3 inputs are developed from unobservable data reflecting our own assumptions, and include situations where there is little or no market activity for the asset or liability.
Certain non-financial assets and liabilities are measured at fair value on a nonrecurring basis, including property, plant, and equipment, goodwill and intangible assets. These assets are subject to fair value adjustments in certain circumstances, such as when there is evidence of an impairment. A general description of the valuation methodologies used for assets and liabilities measured at fair value, including the general classification of such assets and liabilities pursuant to the valuation hierarchy, is included in each footnote with fair value measurements present.
For acquisitions, we allocate the fair value of purchase consideration to the tangible assets acquired, liabilities assumed and intangible assets acquired based on their estimated fair values. The excess of the fair value of purchase consideration over the fair values of these identifiable assets and liabilities is recorded as goodwill. Such valuations require management to make significant estimates and assumptions, especially with respect to intangible assets, including but are not limited to, future expected cash flows from acquired customers, acquired technology and trade names from a market participant perspective, useful lives and discount rates. Management’s estimates of fair value are based upon assumptions believed to be reasonable, but which are inherently uncertain and unpredictable and, as a result, actual results may differ from estimates. During the measurement period, which is one year from the acquisition date, we may record adjustments to the assets acquired and liabilities assumed, with the corresponding offset to goodwill. Upon the conclusion of the measurement period, any subsequent adjustments are recorded to earnings.
Derivative Instruments
We recognize all derivative instruments as assets or liabilities in the consolidated balance sheets at fair value. The accounting for changes in the fair value of a derivative instrument depends on whether it has been designated and qualifies as part of a hedging relationship and, further, on the type of hedging relationship. For those derivative instruments that are designated and qualify as hedging instruments, a company must designate the derivative, based upon the exposure being hedged, as a cash flow hedge, a fair value hedge or a hedge of a net investment in a foreign operation.
A cash flow hedge refers to hedging the exposure to variability in expected future cash flows that is attributable to a particular risk. For derivative instruments that are designated and qualify as cash flow hedges, the gain or loss on the derivative instrument is reported as a component of AOCI, and reclassified into earnings in the same period during which the hedged transaction affects earnings.
A fair value hedge refers to hedging the exposure to changes in the fair value of an existing asset or liability in the consolidated balance sheets that is attributable to a particular risk. For derivative instruments that are designated and qualify as fair value hedges, the gain or loss on the derivative instrument is recognized in the statements of consolidated income during the current period, as well as the offsetting gain or loss on the hedged item.
A net investment hedge refers to the use of cross currency swaps, forward contracts or foreign currency denominated debt to hedge portions of net investments in foreign operations. For hedges that meet the hedge accounting requirements, the net gains or losses attributable to changes in spot exchange rates are recorded in the foreign currency translation adjustment within AOCI, and are recorded in the income statement when the hedged item affects earnings.
4545_Fin_C2.pdf 66 March 4, 2020

UNITED PARCEL SERVICE, INC. AND SUBSIDIARIESNOTES TO CONSOLIDATED FINANCIAL STATEMENTS
65
Adoption of New Accounting Standards
In May 2014, the FASB issued an accounting standards update ("ASU") that changes the revenue recognition for companies that enter into contracts with customers to transfer goods or services ("Revenue from Contracts with Customers"). The standard is a comprehensive new revenue recognition model that requires revenue to be recognized in a manner depicting the transfer of goods or services to a customer at an amount that reflects the consideration expected to be received in exchange for those goods or services. The FASB also issued a number of updates to this standard. Effective January 1, 2018, we adopted the requirements of this ASU using the full retrospective method. See note 2 for disclosures required by this ASU.
In January 2016, the FASB issued an ASU which addresses certain aspects of the recognition, measurement, presentation and disclosure of financial instruments. We adopted this standard on January 1, 2018. The adoption of this ASU did not have a material impact on our consolidated financial position, results of operations or cash flows.
In February 2016, the FASB issued ASU 2016-02, Leases (Topic 842), which requires lessees to recognize a right-of-use asset and lease liability on their balance sheet for all leases with terms beyond twelve months. The new standard also requires enhanced disclosures that provide more transparency and information to financial statement users about lease portfolios. Effective January 1, 2019, we adopted the requirements of this ASU using the modified retrospective approach. We elected the transition package of practical expedients permitted within the standard. As a result, we did not reassess initial direct costs, lease classification, or whether our contracts contain or are leases. We also made an accounting policy election to not recognize right-of-use assets and liabilities for leases with an original lease term of twelve months or less, unless the leases include options to renew or purchase the underlying asset that are reasonably certain to be exercised.
The adoption on January 1, 2019 resulted in the recognition of right-of-use assets for operating leases of approximately $2.65 billion and operating lease liabilities of approximately $2.70 billion. The consolidated financial statements for the year ended December 31, 2019 are presented under the new standard, while comparative periods presented have not been adjusted and continue to be reported in accordance with the previous standard. See note 10 for additional disclosures required by this ASU.
In August 2016, the FASB issued an ASU that addressed the classification and presentation of specific cash flow matters. The guidance also clarified how the predominance principle should be applied when cash receipts and cash payments have aspects of more than one class of cash flows. The guidance was applied retrospectively. We adopted this standard on January 1, 2018. This standard did not have a material impact on our statements of consolidated cash flows.
In November 2016, the FASB issued an ASU intended to reduce diversity in practice by adding or clarifying guidance on classification and presentation of changes in restricted cash on the statement of cash flows ("Restricted Cash"). Effective January 1, 2018, we adopted the requirements of this ASU retrospectively. As a result of this update, restricted cash is included within cash and cash equivalents on our statements of consolidated cash flows.
In March 2017, the FASB issued an ASU to improve the presentation of net periodic pension cost and net periodic postretirement benefit cost ("Improving the Presentation of Net Periodic Pension Cost and Net Periodic Postretirement Benefit Cost"). The update requires employers to report the current service cost component in the same line item as other compensation costs arising from services rendered by employees during the period. The other components of net periodic benefit cost are required to be presented separately from service cost and outside of income from operations. Effective January 1, 2018, we adopted the requirements of this ASU retrospectively, as required. As a result of this update, the net amount of interest cost, prior service cost and expected return on plan assets is now presented as other income.
In March 2017, the FASB issued an ASU requiring the premium on callable debt securities to be amortized to the earliest call date. We adopted this standard on January 1, 2019. It did not have a material impact on our consolidated financial position, results of operations or cash flows.
In May 2017, the FASB issued an ASU to provide clarity and reduce complexity on when to apply modification accounting to existing share-based payment awards. We adopted this standard on January 1, 2018. This ASU did not have a material impact on our consolidated financial position, results of operations or cash flows.
In August 2017, the FASB issued an ASU to enhance recognition of the economic results of hedging activities in the financial statements. In addition, the update made certain targeted improvements to simplify the application of hedge accounting guidance and increase transparency regarding the scope and results of hedging activities. We adopted this standard on January 1, 2019. It did not have a material impact on our consolidated financial position, results of operations or cash flows but did require additional disclosures. See note 16 for disclosures required by this ASU.
In February 2018, the FASB issued an ASU that allows a reclassification from AOCI to retained earnings for stranded tax effects resulting from the Tax Act. Effective January 1, 2018, we early adopted this ASU and elected to reclassify the income tax effects of the Tax Act from AOCI to retained earnings. This resulted in a $735 million increase to retained earnings and a $735 million decrease to AOCI. Our current accounting policy for releasing income tax effects from other comprehensive income is based on a portfolio approach.
4545_Fin_C2.pdf 67 March 4, 2020

UNITED PARCEL SERVICE, INC. AND SUBSIDIARIESNOTES TO CONSOLIDATED FINANCIAL STATEMENTS
66
In August 2018, the FASB issued an ASU that modifies the disclosure requirements for employers that sponsor defined benefit pension and postretirement plans. The update eliminates the disclosures for amounts in AOCI expected to be recognized as components of net periodic cost over the next fiscal year and the effects of a one percentage point change in the assumed healthcare cost trend rate. The update adds disclosure requirements to include the weighted-average interest crediting rates for cash balance plans and a narrative description of the significant gains and losses related to changes in the benefit obligation for the period. We early adopted this standard for the year ended December 31, 2018 with retrospective application. The adoption of this ASU did not have a material impact on our consolidated financial position, results of operations or cash flows.
We have recast our consolidated financial statements from amounts previously reported due to the adoption of new revenue recognition, pension and restricted cash standards. The unaudited consolidated statements of operations, which reflect the adoption of the new ASUs, are as follows (in millions):
Twelve months ended December 31, 2017As Previously
ReportedAdjustments
(a)Adjustments
(b)Adjustments
(c) As Recast
Revenue $ 65,872 $ 713 $ — $ — $ 66,585
Operating Expenses:
Compensation and benefits 34,588 — (11) — 34,577
Repairs and maintenance 1,600 1 — — 1,601
Depreciation and amortization 2,282 — — — 2,282
Purchased transportation 10,989 707 — — 11,696
Fuel 2,690 — — — 2,690
Other occupancy 1,155 — — — 1,155
Other expenses 5,039 16 — — 5,055
Total Operating Expenses 58,343 724 (11) — 59,056
Operating Profit 7,529 (11) 11 — 7,529
Other Income and (Expense):
Investment income (expense) and other 72 — (11) — 61
Interest expense (453) — — — (453)
Total Other Income and (Expense) (381) — (11) — (392)
Income Before Income Taxes 7,148 (11) — — 7,137
Income Tax Expense (Benefit) 2,238 (6) — — 2,232
Net Income $ 4,910 $ (5) $ — $ — $ 4,905
Basic Earnings Per Share $ 5.64 $ (0.01) $ — $ — $ 5.63
Diluted Earnings Per Share $ 5.61 $ — $ — $ — $ 5.61(a) Recast to reflect the adoption of Revenue from Contracts with Customers.
(b) Recast to reflect the adoption of Improving the Presentation of Net Periodic Pension Cost and Net Periodic Postretirement Benefit Cost.
(c) Recast to reflect the adoption of Restricted Cash.
4545_Fin_C2.pdf 68 March 4, 2020

UNITED PARCEL SERVICE, INC. AND SUBSIDIARIESNOTES TO CONSOLIDATED FINANCIAL STATEMENTS
67
The unaudited impacted consolidated statement of cash flows line items, which reflect the adoption of the new ASUs, are as follows (in millions):
Twelve Months Ended December 31, 2017As Previously
ReportedAdjustments
(a)Adjustments
(b)Adjustments
(c) As Recast
Net Income $ 4,910 $ (5) $ — $ — $ 4,905
Adjustments to reconcile net income tonet cash from operating activities:
Deferred tax (benefit) expense 1,230 (6) — — 1,224
Other assets (982) (2) — — (984)
Accounts payable 592 7 — — 599
Accrued wages and withholdings 193 7 — — 200
Other liabilities (241) (2) — — (243)
Other operating activities 47 1 48
Cash flows from operating activities 1,479 — — — 1,479
Purchase of marketable securities (1,634) — — 4 (1,630)
Net cash used in investing activities (4,975) — — 4 (4,971)
Net decrease in cash, cash equivalentsand restricted cash (156) — — 4 (152)
Cash, cash equivalents and restrictedcash at the beginning of period 3,476 — — 445 3,921
Cash, cash equivalents and restrictedcash at the end of period $ 3,320 $ — $ — $ 449 $ 3,769
(a) Recast to reflect the adoption of Revenue from Contracts with Customers.
(b) Recast to reflect the adoption of Improving the Presentation of Net Periodic Pension Cost and Net Periodic Postretirement Benefit Cost.
(c) Recast to reflect the adoption of Restricted Cash.
Other accounting pronouncements adopted during the periods covered by the consolidated financial statements did not have a material impact on our consolidated financial position, results of operations or cash flows.
Accounting Standards Issued But Not Yet Effective
In June 2016, the FASB issued an ASU introducing an expected credit loss methodology for the measurement of financial assets not accounted for at fair value. The methodology replaces the probable, incurred loss model for those assets. The standard will be effective for us in the first quarter of 2020. We are substantially complete with our evaluation of the adoption on our consolidated financial statements and internal controls over financial reporting. This adoption will not have a material impact on our consolidated financial position, results of operations or cash flows. We will update our process for calculating our allowance for doubtful accounts to include reasonable and supportable forecasts that could affect expected collectability.
In January 2017, the FASB issued an ASU to simplify the accounting for goodwill impairment. The update removes Step 2 of the goodwill impairment test, which requires a hypothetical purchase price allocation. Under this ASU, goodwill impairment will be the amount by which a reporting unit’s carrying value exceeds its fair value, not to exceed the carrying amount of goodwill. The standard will be effective for us in the first quarter of 2020. We do not expect this ASU to have a material impact on our consolidated financial position, results of operations or cash flows.
In December 2019, the FASB issued an ASU to simplify the accounting for income taxes. The update removes certain exceptions to the general income tax principles. The standard will be effective for us in the first quarter of 2021. We are evaluating the impact of its adoption on our consolidated financial statements and internal control over financial reporting environment, but do not expect this ASU to have a material impact on our consolidated financial position, results of operations or cash flows.
Other accounting pronouncements issued, but not effective until after December 31, 2019, are not expected to have a material impact on our consolidated financial position, results of operations or cash flows.
4545_Fin_C2.pdf 69 March 4, 2020

UNITED PARCEL SERVICE, INC. AND SUBSIDIARIESNOTES TO CONSOLIDATED FINANCIAL STATEMENTS
68
NOTE 2. REVENUE RECOGNITION
Revenue Recognition
Substantially all of our revenues are from contracts associated with the pick-up, transportation and delivery of packages and freight (“transportation services”), whether carried out or arranged by UPS, either domestically or internationally, which generally occurs over a short period of time. Additionally, we provide value-added logistics services to customers, both domestically and internationally, through our global network of company-owned and leased distribution centers and field stocking locations.
Disaggregation of Revenue
Year Ended December 31,
2019 2018 2017
Revenue:
Next Day Air $ 8,479 $ 7,618 $ 7,088
Deferred 5,180 4,752 4,422
Ground 32,834 31,223 29,251
U.S. Domestic Package $ 46,493 $ 43,593 $ 40,761
Domestic $ 2,836 $ 2,874 $ 2,646
Export 10,837 10,973 10,170
Cargo & Other 547 595 526
International Package $ 14,220 $ 14,442 $ 13,342
Forwarding $ 5,867 $ 6,580 $ 5,674
Logistics 3,435 3,234 3,017
Freight 3,265 3,218 3,000
Other 814 794 791
Supply Chain & Freight $ 13,381 $ 13,826 $ 12,482
Consolidated revenue $ 74,094 $ 71,861 $ 66,585
We account for a contract when both parties have approved the contract and are committed to perform their obligations, the rights of the parties are identified, payment terms are identified, the contract has commercial substance and collectability of consideration is probable.
Performance Obligations
A performance obligation is a promise in a contract to transfer a distinct good or service to the customer, and is the basis of revenue recognition in accordance with GAAP. To determine the proper revenue recognition method for contracts, we evaluate whether two or more contracts should be combined and accounted for as a single contract, and whether the combined or single contract should be accounted for as more than one performance obligation. This evaluation requires judgment, and the decision to combine a group of contracts or to separate the combined or single contract into multiple performance obligations could change the amount of revenue and profit recorded in a given period. Within most of our contracts, the customer contracts with us to provide distinct services, such as transportation services. The vast majority of our contracts with customers for transportation services include only one performance obligation; the transportation services themselves. However, if a contract is separated into more than one performance obligation, we allocate the total transaction price to each performance obligation based on the estimated relative standalone selling prices of the promised goods or services underlying each performance obligation. We frequently sell standard transportation services with observable standalone sales prices. In these instances, the observable standalone sales are used to determine the standalone selling price.
4545_Fin_C2.pdf 70 March 4, 2020
UNITED PARCEL SERVICE, INC. AND SUBSIDIARIESNOTES TO CONSOLIDATED FINANCIAL STATEMENTS
69
In certain business units, such as Logistics, we sell customized, customer-specific solutions in which we provide a significant service of integrating a complex set of tasks and components into a single capability (even if that single capability results in the delivery of multiple units). Hence, the entire contract is accounted for as one performance obligation. In these cases we typically use the expected cost plus a margin approach to estimate the standalone selling price of each performance obligation.
Satisfaction of Performance Obligations
We generally recognize revenue over time as we perform the services in the contract because of the continuous transfer of control to the customer. Our customers receive the benefit of our services as the goods are transported from one location to another. Further, if we were unable to complete delivery to the final location, another entity would not need to reperform the transportation service already performed.
As control transfers over time, revenue is recognized based on the extent of progress towards completion of the performance obligation. The selection of the method to measure progress towards completion requires judgment and is based on the nature of the products or services to be provided. We use the cost-to-cost measure of progress for our package delivery contracts because it best depicts the transfer of control to the customer which occurs as we incur costs on our contracts. Under the cost-to-cost measure of progress, the extent of progress towards completion is measured based on the ratio of costs incurred to date to the total estimated costs at completion of the performance obligation. Revenues, including ancillary or accessorial fees and reductions for estimated customer incentives, are recorded proportionally as costs are incurred. Costs to fulfill include labor and other direct costs and an allocation of indirect costs. For our freight and freight forwarding contracts, an output method of progress based on time-in-transit is utilized as the timing of costs incurred does not best depict the transfer of control to the customer. In our Logistics business we have a right to consideration from customers in an amount that corresponds directly with the value to the customers of our performance completed to date, and as such we recognize revenue in the amount to which we have a right to invoice the customer.
Variable Consideration
It is common for our contracts to contain customer incentives, guaranteed service refunds or other provisions that can either increase or decrease the transaction price. These variable amounts are generally dependent upon achievement of certain incentive tiers or performance metrics. We estimate variable consideration at the most likely amount to which we expect to be entitled. We include estimated amounts of revenue, which may be reduced by incentives or other contract provisions, in the transaction price to the extent it is probable that a significant reversal of cumulative revenue recognized will not occur when the uncertainty associated with the variable consideration is resolved. Our estimates of variable consideration and determination of whether to include estimated amounts in the transaction price are based on an assessment of anticipated customer spending and all information (historical, current and forecasted) that is reasonably available to us.
Contract Modifications
Contracts are often modified to account for changes in the rates we charge our customers or to add additional distinct services. We consider contract modifications to exist when the modification either creates new, or changes the existing, enforceable rights and obligations. Contract modifications that add additional distinct goods or services are treated as separate contracts. Contract modifications that do not add distinct goods or services typically change the price of existing services. These contract modifications are accounted for prospectively as the remaining performance obligations are distinct.
Payment Terms
Under the typical payment terms of our customer contracts, the customer pays at periodic intervals (i.e. every 14 days, 30 days, 45 days, etc.) for shipments included on invoices received. Invoices are generated each week on the week-ending day, which is Saturday for the majority of our U.S. Domestic Package business, but could be another day depending on the business unit or the specific agreement with the customer. It is not customary business practice to extend payment terms past 90 days, and as such, we do not have a practice of including a significant financing component within our contracts with customers.
4545_Fin_C2.pdf 71 March 4, 2020

UNITED PARCEL SERVICE, INC. AND SUBSIDIARIESNOTES TO CONSOLIDATED FINANCIAL STATEMENTS
70
Principal vs. Agent Considerations
In our transportation businesses, we utilize independent contractors and third-party carriers in the performance of some transportation services. GAAP requires us to evaluate, using a control model, whether our businesses themselves promise to transfer services to the customer (as the principal) or to arrange for services to be provided by another party (as the agent). Based on our evaluation of the control model, we determined that all of our major businesses act as the principal rather than the agent within their revenue arrangements. Revenue and the associated purchased transportation costs are both reported on a gross basis within our statements of consolidated income.
Accounts Receivable, Net
Accounts receivable, net, include amounts billed and currently due from customers. The amounts due are stated at their net estimated realizable value. Losses on accounts receivable are recognized when they are incurred, which requires us to make our best estimate of the probable losses inherent in our customer receivables at each balance sheet date. These estimates require consideration of historical loss experience, adjusted for current conditions, trends in customer payment frequency, and judgments about the probable effects of relevant observable data, including present economic conditions and the financial health of specific customers and market sectors. Our risk management process includes standards and policies for reviewing major account exposures and concentrations of risk.
Our total allowance for doubtful accounts as of December 31, 2019 and 2018 was $93 and $94 million, respectively. Our total provision for doubtful accounts charged to expense before recoveries during the years ended December 31, 2019 and 2018 was $194 and $118 million, respectively.
Contract Assets and Liabilities
Contract assets include billed and unbilled amounts resulting from in-transit packages, as we have an unconditional right to payment only once all performance obligations have been completed (i.e. packages have been delivered), and our right to payment is not solely based on the passage of time. Amounts may not exceed their net realizable value. Contract assets are generally classified as current and the full balance is converted each quarter based on the short-term nature of the transactions.
Contract liabilities consist of advance payments and billings in excess of revenue as well as deferred revenue. Advance payments and billings in excess of revenue represent payments received from our customers that will be earned over the contract term. Deferred revenue represents the amount of consideration due from customers related to in-transit shipments that has not yet been recognized as revenue based on our selected measure of progress. We classify advance payments and billings in excess of revenue as either current or long-term, depending on the period over which the advance payment will be earned. We classify deferred revenue as current based on the timing of when we expect to recognize revenue, which typically occurs within a short window after period-end. The full balance of deferred revenue is converted each quarter based on the short-term nature of the transactions. Our contract assets and liabilities are reported in a net position on a contract-by-contract basis at the end of each reporting period. In order to determine revenue recognized in the period from contract liabilities, we first allocate revenue to the individual contract liability balance outstanding at the beginning of the period until the revenue exceeds that deferred revenue balance.
Contract assets related to in-transit packages were $272 and $234 million at December 31, 2019 and 2018, respectively, net of deferred revenue related to in-transit packages of $264 and $236 million at December 31, 2019 and 2018, respectively. Contract assets are included within "Other current assets" in the consolidated balance sheets. Short-term contract liabilities related to advanced payments from customers were $7 and $5 million at December 31, 2019 and 2018, respectively. Short-term contract liabilities are included within "Other current liabilities" in the consolidated balance sheets. Long-term contract liabilities related to advanced payments from customers were $26 million at December 31, 2019 and December 31, 2018. Long-term contract liabilities are included within "Other Non-Current Liabilities" in the consolidated balance sheets.
4545_Fin_C2.pdf 72 March 4, 2020

UNITED PARCEL SERVICE, INC. AND SUBSIDIARIESNOTES TO CONSOLIDATED FINANCIAL STATEMENTS
71
NOTE 3. INVESTMENTS AND RESTRICTED CASH
The following is a summary of marketable securities classified as trading and available-for-sale at December 31, 2019 and 2018 (in millions):
CostUnrealized
GainsUnrealized
LossesEstimatedFair Value
2019
Current trading marketable securities:
Corporate debt securities $ 112 $ — $ — $ 112
Equity securities 2 — — 2
Total trading marketable securities 114 — — 114
Current available-for-sale securities:
U.S. government and agency debt securities 191 2 — 193
Mortgage and asset-backed debt securities 46 1 — 47
Corporate debt securities 130 3 — 133
Non-U.S. government debt securities 16 — — 16
Total available-for-sale marketable securities 383 6 — 389
Total current marketable securities $ 497 $ 6 $ — $ 503
CostUnrealized
GainsUnrealized
LossesEstimatedFair Value
2018
Current trading marketable securities:
Corporate debt securities $ 137 $ — $ — $ 137
Equity securities 2 — — 2
Total trading marketable securities 139 — — 139
Current available-for-sale securities:
U.S. government and agency debt securities 297 1 (1) 297
Mortgage and asset-backed debt securities 82 — (1) 81
Corporate debt securities 275 — (2) 273
Non-U.S. government debt securities 20 — — 20
Total available-for-sale marketable securities 674 1 (4) 671
Total current marketable securities $ 813 $ 1 $ (4) $ 810
Total current marketable securities that were pledged as collateral for our self-insurance requirements had an estimated fair value of $389 and $587 million at December 31, 2019 and 2018, respectively.
The gross realized gains on sales of available-for-sale securities totaled $8 million in 2019. There were no gross realized gains on sales of available-for-sale securities in 2018 or 2017. The gross realized losses on sales of available-for-sale securities totaled $2, $4 and $2 million in 2019, 2018 and 2017, respectively.
There were no material impairment losses recognized on marketable securities during 2019, 2018 or 2017.
4545_Fin_C2.pdf 73 March 4, 2020

UNITED PARCEL SERVICE, INC. AND SUBSIDIARIESNOTES TO CONSOLIDATED FINANCIAL STATEMENTS
72
Investment Other-Than-Temporary Impairments
We have concluded that no material other-than-temporary impairment losses existed as of December 31, 2019. In making this determination, we considered the financial condition and prospects of each issuer, the magnitude of the losses compared with the investments’ cost, the probability that we will be unable to collect all amounts due according to the contractual terms of the security, the credit rating of the security and our ability and intent to hold these investments until the anticipated recovery in market value occurs.
Unrealized LossesThe following table presents the age of gross unrealized losses and fair value by investment category for all securities in a
loss position as of December 31, 2019 (in millions):
Less Than 12 Months 12 Months or More Total
Fair ValueUnrealized
Losses Fair ValueUnrealized
Losses Fair ValueUnrealized
Losses
U.S. government and agency debt securities $ 42 $ — $ — $ — $ 42 $ —
Mortgage and asset-backed debt securities 3 — 5 — 8 —
Corporate debt securities 6 — 2 — 8 —
Non-U.S. government debt securities 9 — 2 — 11 —
Total marketable securities $ 60 $ — $ 9 $ — $ 69 $ —
The unrealized losses for the corporate debt securities, mortgage and asset-backed debt securities, and U.S. government and agency debt securities are primarily due to changes in market interest rates. We have both the intent and ability to hold these securities for a time necessary to recover the cost basis.
Maturity Information
The amortized cost and estimated fair value of marketable securities at December 31, 2019, by contractual maturity, are shown below (in millions). Actual maturities may differ from contractual maturities because the issuers of the securities may have the right to prepay obligations with or without prepayment penalties.
CostEstimatedFair Value
Due in one year or less $ 118 $ 118
Due after one year through three years 328 332
Due after three years through five years 6 6
Due after five years 43 45
495 501
Equity securities 2 2
$ 497 $ 503
Non-Current Investments and Restricted Cash
Non-current investments and restricted cash are primarily associated with our self-insurance obligations. We entered into an escrow agreement with an insurance carrier to guarantee these obligations. This agreement requires us to provide collateral to the insurance carrier, which is invested in various marketable securities and cash equivalents. Collateral provided is reflected in "Cash, Cash Equivalents and Restricted Cash" in the statements of consolidated cash flows. In 2019 we liquidated our investment balance associated with this agreement and pledged the required collateral with a surety bond. At December 31, 2019 and 2018, we had $0 and $142 million, respectively, in restricted cash. For additional information on surety bonds written at December 31, 2019, see note 8.
4545_Fin_C2.pdf 74 March 4, 2020

UNITED PARCEL SERVICE, INC. AND SUBSIDIARIESNOTES TO CONSOLIDATED FINANCIAL STATEMENTS
73
We held a $21 and $19 million investment in a variable life insurance policy to fund benefits for the UPS Excess Coordinating Benefit Plan at December 31, 2019 and 2018, respectively. The quarterly change in investment fair value is recognized in "Investment income (expense) and other" in the statements of consolidated income. Additionally, we held escrowed cash related to the acquisition and disposition of certain assets of $3 and $9 million at December 31, 2019 and 2018, respectively. These amounts are classified as “Investments and Restricted Cash” in the consolidated balance sheets.
A reconciliation of cash and cash equivalents and restricted cash from the consolidated balance sheets to the statements of consolidated cash flows is shown below (in millions):
December 31, 2019 December 31, 2018 December 31, 2017
Cash and cash equivalents $ 5,238 $ 4,225 $ 3,320
Restricted cash $ — $ 142 $ 449
Total cash, cash equivalents and restricted cash $ 5,238 $ 4,367 $ 3,769
Fair Value Measurements
Marketable securities valued utilizing Level 1 inputs include active exchange-traded equity securities and equity index funds, and most U.S. government debt securities, as these securities all have quoted prices in active markets. Marketable securities valued utilizing Level 2 inputs include asset-backed securities, corporate bonds and municipal bonds. These securities are valued using market corroborated pricing, matrix pricing or other models that utilize observable inputs such as yield curves.
We maintain holdings in certain investment partnerships that are measured at fair value utilizing Level 3 inputs (classified as “Other non-current investments” in the tables below, and as “Other Non-Current Assets” in the consolidated balance sheets). These partnership holdings do not have quoted prices, nor can they be valued using inputs based on observable market data. These investments are valued internally using a discounted cash flow model with two significant inputs: (1) the after-tax cash flow projections for each partnership, and (2) a risk-adjusted discount rate consistent with the duration of the expected cash flows for each partnership. The weighted-average discount rates used to value these investments were 7.40% and 8.16% as of December 31, 2019 and 2018, respectively. These inputs, and the resulting fair values, are updated on a quarterly basis.
4545_Fin_C2.pdf 75 March 4, 2020

UNITED PARCEL SERVICE, INC. AND SUBSIDIARIESNOTES TO CONSOLIDATED FINANCIAL STATEMENTS
74
The following table presents information about our investments measured at fair value on a recurring basis as of December 31, 2019 and 2018, and indicates the fair value hierarchy of the valuation techniques utilized to determine such fair value (in millions):
Quoted Prices inActive Markets
for IdenticalAssets
(Level 1)
Significant Other
ObservableInputs
(Level 2)
SignificantUnobservable
Inputs(Level 3) Total
2019
Marketable Securities:
U.S. government and agency debt securities $ 193 $ — $ — $ 193
Mortgage and asset-backed debt securities — 47 — 47
Corporate debt securities — 245 — 245
Equity securities — 2 — 2
Non-U.S. government debt securities — 16 — 16
Total marketable securities 193 310 — 503
Other non-current investments 21 — 1 22
Total $ 214 $ 310 $ 1 $ 525
Quoted Prices inActive Markets
for IdenticalAssets
(Level 1)
Significant Other
Observable Inputs
(Level 2)
SignificantUnobservable
Inputs(Level 3) Total
2018
Marketable Securities:
U.S. government and agency debt securities $ 297 $ — $ — $ 297
Mortgage and asset-backed debt securities — 81 — 81
Corporate debt securities — 410 — 410
Equity securities — 2 — 2
Non-U.S. government debt securities — 20 — 20
Total marketable securities 297 513 — 810
Other non-current investments 19 — 2 21
Total $ 316 $ 513 $ 2 $ 831
There were no transfers of investments between Level 1 and Level 2 during the years ended December 31, 2019 or 2018.
4545_Fin_C2.pdf 76 March 4, 2020

UNITED PARCEL SERVICE, INC. AND SUBSIDIARIESNOTES TO CONSOLIDATED FINANCIAL STATEMENTS
75
NOTE 4. PROPERTY, PLANT AND EQUIPMENT
Property, plant and equipment, including both owned assets as well as assets subject to finance leases, consists of the following as of December 31, 2019 and 2018 (in millions):
2019 2018
Vehicles $ 10,613 $ 9,820
Aircraft 19,045 17,499
Land 2,087 2,000
Buildings 5,046 4,808
Building and leasehold improvements 4,898 4,323
Plant equipment 13,849 11,833
Technology equipment 2,206 2,093
Construction-in-progress 1,983 2,112
59,727 54,488
Less: Accumulated depreciation and amortization (29,245) (27,912)
$ 30,482 $ 26,576
As part of our ongoing investment in transformation, in 2018 we made prospective revisions to our estimates of useful lives for building improvements, vehicles and plant equipment which in general had the effect of lengthening the useful lives of these categories.
For 2019, depreciation expense increased $365 million, and net income decreased by $287 million, or $0.33 per share on a basic and diluted basis, as a result of investments in property, plant and equipment, net of disposals and assets becoming fully depreciated. Depreciation expense decreased $212 million, and net income increased $167 million, or $0.19 per share on a basic and diluted basis, as a result of lengthening our estimated useful lives for various asset categories in the latter half of 2018. The combined effect of the foregoing was a net increase in depreciation expense of $153 million and a decrease in net income of $120 million, or $0.14 per share on a basic and diluted basis, for 2019.
For 2018, this resulted in a decrease in depreciation expense and an increase in operating income of $286 million and an increase to net income of $228 million or $0.26 per share on a basic and diluted basis. Separately, capital investments in additional property, plant and equipment, net of disposals and fully-depreciated assets, resulted in an increase in depreciation expense of $257 million and a decrease to net income of $205 million or $0.24 per share on a basic and diluted basis in 2018. Combining both impacts resulted in a net decrease of $29 million to depreciation expense, and an increase to net income of $23 million or $0.03 per share on both a basic and diluted basis in 2018.
We monitor our aircraft fleet utilization in light of current and projected volume levels, aircraft fuel prices and other factors. Additionally, we monitor our other property, plant and equipment categories for any indicators that the carrying value of the assets may not be recoverable. No impairment charges on property, plant and equipment were recorded in 2019 or 2018.
4545_Fin_C2.pdf 77 March 4, 2020
UNITED PARCEL SERVICE, INC. AND SUBSIDIARIESNOTES TO CONSOLIDATED FINANCIAL STATEMENTS
76
NOTE 5. COMPANY SPONSORED EMPLOYEE BENEFIT PLANS
We sponsor various retirement and pension plans, including defined benefit and defined contribution plans which cover our employees worldwide.
U.S. Pension Benefits
In the U.S. we maintain the following single-employer defined benefit pension plans: the UPS Retirement Plan, the UPS Pension Plan, the UPS/IBT Full-Time Employee Pension Plan and the UPS Excess Coordinating Benefit Plan, a non-qualified plan.
The UPS Retirement Plan is noncontributory and includes substantially all eligible employees of participating domestic subsidiaries hired prior to July 1, 2016 who are not members of a collective bargaining unit, as well as certain employees covered by a collective bargaining agreement. This plan generally provides for retirement benefits based on average compensation earned by employees prior to retirement. Benefits payable under this plan are subject to maximum compensation limits and the annual benefit limits for a tax-qualified defined benefit plan as prescribed by the Internal Revenue Service (“IRS”).
The UPS Pension Plan is noncontributory and includes certain eligible employees of participating domestic subsidiaries and members of collective bargaining units that elect to participate in the plan. This plan generally provides for retirement benefits based on service credits earned by employees prior to retirement.
The UPS/IBT Full Time Employee Pension Plan is noncontributory and includes employees that were previously members of the Central States Pension Fund ("CSPF"), a multiemployer pension plan, in addition to other eligible employees who are covered under certain collective bargaining agreements. This plan generally provides for retirement benefits based on service credits earned by employees prior to retirement.
The UPS Excess Coordinating Benefit Plan is a non-qualified plan that provides benefits to certain participants in the UPS Retirement Plan, hired prior to July 1, 2016, for amounts that exceed the benefit limits described above.
In the year ended December 31, 2017, we amended the UPS Retirement Plan and the UPS Excess Coordinating Benefit Plan to cease accruals of additional benefits for future service and compensation for non-union participants effective January 1, 2023. We remeasured plan assets and pension benefit obligations for the affected pension plans as of June 30, 2017, resulting in a net actuarial gain of $569 million. This reflected a curtailment gain of $1.525 billion resulting from the benefit plan changes that was partially offset by net actuarial losses of $956 million, driven by a reduction of approximately 32 basis points in the discount rate compared to December 31, 2016, offset by actual asset returns approximately 275 basis points above our expected return as of the remeasurement date. The net curtailment gain reduced the actuarial loss recorded in AOCI in the equity section of the consolidated balance sheets. As actuarial losses were within the corridor (defined as 10% of the greater of the fair value of plan assets and the plan's projected benefit obligation), there was no impact to the statement of consolidated income as a result of this remeasurement.
During the fourth quarter of 2019, certain former U.S. employees were offered the option to receive a one-time payment of their vested pension benefit. Approximately 18,800 former employees accepted this option, accelerating $820 million in benefit payments during 2019 while reducing the number of participants who are due future payments from U.S. pension plans. As the cost of these settlements did not exceed the plans' service cost and interest cost for the year, the impact of the settlement was not recognized in earnings.
International Pension Benefits
We also sponsor various defined benefit plans covering certain of our international employees. The majority of our international obligations are for defined benefit plans in Canada and the United Kingdom. In addition, many of our international employees are covered by government-sponsored retirement and pension plans. We are not directly responsible for providing benefits to participants of government-sponsored plans.
4545_Fin_C2.pdf 78 March 4, 2020

UNITED PARCEL SERVICE, INC. AND SUBSIDIARIESNOTES TO CONSOLIDATED FINANCIAL STATEMENTS
77
U.S. Postretirement Medical Benefits
We also sponsor postretirement medical plans in the U.S. that provide healthcare benefits to our non-union retirees, as well as select union retirees who meet certain eligibility requirements and who are not otherwise covered by multiemployer plans. Generally, this includes employees with at least 10 years of service who have reached age 55 and employees who are eligible for postretirement medical benefits from a Company-sponsored plan pursuant to collective bargaining agreements. We have the right to modify or terminate certain of these plans. These benefits have been provided to certain retirees on a noncontributory basis; however, in many cases, retirees are required to contribute all or a portion of the total cost of the coverage.
Defined Contribution Plans
We also sponsor a defined contribution plan for employees not covered under collective bargaining agreements, and several smaller defined contribution plans for certain employees covered under collective bargaining agreements. The Company matches, in shares of UPS common stock or cash, a portion of the participating employees’ contributions. Matching contributions charged to expense were $130, $127 and $119 million for 2019, 2018 and 2017, respectively.
In addition to current benefits under the UPS 401(k) Savings Plan, non-union employees hired after July 1, 2016, receive a retirement contribution. UPS contributes 3% to 8% of eligible pay to the UPS 401(k) Savings Plan based on years of vesting service and business unit. Contributions under this plan are subject to maximum compensation and contribution limits for a tax-qualified defined contribution plan as prescribed by the IRS. Contributions charged to expense were $67, $28 and $23 million for 2019, 2018 and 2017 respectively.
Effective June 23, 2017, the Company amended the UPS 401(k) Savings Plan so that non-union employees who currently participate in the UPS Retirement Plan will, in addition to current benefits under the UPS 401(k) Savings Plan, earn a retirement contribution beginning January 1, 2023. UPS will contribute 5% to 8% of eligible compensation to the UPS 401(k) Savings Plan based on years of vesting service. The amendment also provides for transition contributions for certain participants. There was no impact to the statement of consolidated income for 2019, 2018 and 2017 as a result of this change.
The UPS Restoration Savings Plan is a non-qualified plan that provides benefits to certain participants in the UPS 401(k) Savings Plan for amounts that exceed the benefit limits described above.
Contributions are also made to defined contribution money purchase plans under certain collective bargaining agreements. Amounts charged to expense were $97, $92 and $91 million for 2019, 2018 and 2017, respectively.
Net Periodic Benefit Cost
Information about net periodic benefit cost for the company-sponsored pension and postretirement defined benefit plans is as follows (in millions):
U.S. Pension BenefitsU.S. Postretirement
Medical BenefitsInternational
Pension Benefits2019 2018 2017 2019 2018 2017 2019 2018 2017
Net Periodic Benefit Cost:
Service cost $ 1,439 $ 1,661 $ 1,543 $ 23 $ 29 $ 29 $ 57 $ 62 $ 60
Interest cost 2,067 1,799 1,813 108 104 112 47 45 40
Expected return on assets (3,130) (3,201) (2,883) (8) (8) (7) (76) (77) (66)
Amortization of prior service cost 218 193 192 7 7 7 2 1 1
Actuarial (gain) loss 2,296 1,603 729 37 — 53 54 24 18
Curtailment and settlement loss — — — — — — — — 2
Net periodic benefit cost $ 2,890 $ 2,055 $ 1,394 $ 167 $ 132 $ 194 $ 84 $ 55 $ 55
4545_Fin_C2.pdf 79 March 4, 2020

UNITED PARCEL SERVICE, INC. AND SUBSIDIARIESNOTES TO CONSOLIDATED FINANCIAL STATEMENTS
78
Actuarial Assumptions
The table below provides the weighted-average actuarial assumptions used to determine the net periodic benefit cost.
U.S. Pension BenefitsU.S. Postretirement
Medical BenefitsInternational
Pension Benefits2019 2018 2017 2019 2018 2017 2019 2018 2017
Discount rate 4.50% 3.84% 4.41% 4.51% 3.82% 4.23% 2.94% 2.78% 2.75%
Rate of compensation increase 4.25% 4.25% 4.27% N/A N/A N/A 3.24% 3.22% 3.17%
Expected return on assets 7.75% 7.75% 8.75% 7.20% 7.20% 8.75% 5.69% 5.76% 5.65%
Cash balance interest credit rate 2.98% 2.50% 2.91% N/A N/A N/A 3.17% 3.07% 2.65%
The table below provides the weighted-average actuarial assumptions used to determine the benefit obligations of our plans.
U.S. Pension BenefitsU.S. Postretirement
Medical BenefitsInternational
Pension Benefits2019 2018 2019 2018 2019 2018
Discount rate 3.60% 4.50% 3.59% 4.51% 2.21% 2.94%
Rate of compensation increase 4.22% 4.25% N/A N/A 3.00% 3.24%
Cash balance interest credit rate 2.50% 2.98% N/A N/A 2.59% 3.17%
A discount rate is used to determine the present value of our future benefit obligations. To determine the discount rate for our U.S. pension and postretirement benefit plans, we use a bond matching approach to select specific bonds that would satisfy our projected benefit payments. We believe the bond matching approach reflects the process we would employ to settle our pension and postretirement benefit obligations. In October 2019, we refined our bond matching approach by implementing advances in technology and modeling techniques. This refinement decreased the projected benefit obligation on our consolidated balance sheet for our U.S. pension and postretirement plans by approximately $900 million as of December 31, 2019. Additionally, we estimate that this refinement in method decreased our pre-tax mark-to-market charge by approximately $810 million and increased net income by $616 million, or $0.71 per share on a basic and diluted basis. For our international plans, the discount rate is determined by matching the expected cash flows of a sample plan of similar duration to a yield curve based on long-term, high quality fixed income debt instruments available as of the measurement date. These assumptions are updated each measurement date, which is typically annually.
As of December 31, 2019, the impact of each basis point change in the discount rate on the projected benefit obligation of our pension and postretirement medical benefit plans is as follows (in millions):
Increase (Decrease) in the Projected Benefit Obligation
Pension Benefits Postretirement Medical Benefits
One basis point increase in discount rate $ (86) $ (2)
One basis point decrease in discount rate 92 3
The Society of Actuaries ("SOA") published mortality tables and improvement scales are used in developing the best estimate of mortality for U.S. plans. In October 2019, the SOA published updated mortality tables and an updated improvement scale, both of which reduced expected mortality improvements from previously published tables and improvement scale. Based on our perspective of future longevity, we updated the mortality assumptions to incorporate these updated tables and improvement scale for purposes of measuring pension and other postretirement benefit obligations.
Assumptions for the expected return on plan assets are used to determine a component of net periodic benefit cost for the year. The assumption for our U.S. plans is developed using a long-term projection of returns for each asset class. Our asset allocation targets are reviewed and, if necessary, updated taking into consideration plan changes, funded status and actual performance. The expected return for each asset class is a function of passive, long-term capital market assumptions and excess returns generated from active management. The capital market assumptions used are provided by independent investment advisors, while excess return assumptions are supported by historical performance, fund mandates and investment expectations.
4545_Fin_C2.pdf 80 March 4, 2020

UNITED PARCEL SERVICE, INC. AND SUBSIDIARIESNOTES TO CONSOLIDATED FINANCIAL STATEMENTS
79
For plans outside the U.S., consideration is given to local market expectations of long-term returns. Strategic asset allocations are determined by plan, based on the nature of liabilities and considering the demographic composition of the plan participants.
Actuarial Assumptions - Central States Pension Fund
UPS was a contributing employer to the CSPF until 2007 when we withdrew from the CSPF and fully funded our allocable share of unfunded vested benefits by paying a $6.1 billion withdrawal liability. Under a collective bargaining agreement with the International Brotherhood of Teamsters (“IBT”), UPS agreed to provide coordinating benefits in the UPS/IBT Full Time Employee Pension Plan (“UPS/IBT Plan”) for UPS participants whose last employer was UPS and who had not retired as of January 1, 2008 (“the UPS Transfer Group”) in the event that benefits are lawfully reduced by the CSPF in the future consistent with the terms of our withdrawal agreement with the CSPF. Under our withdrawal agreement with the CSPF, benefits to the UPS Transfer Group cannot be reduced without our consent and can only be reduced in accordance with applicable law.
In December 2014, Congress passed the Multiemployer Pension Reform Act (“MPRA”). This change in law for the first time permitted multiemployer pension plans to reduce benefit payments to retirees, subject to specific guidelines in the statute and government approval. In September 2015, the CSPF submitted a proposed pension benefit reduction plan to the U.S. Department of the Treasury (“Treasury”). In May 2016, Treasury rejected the proposed plan submitted by the CSPF. In the first quarter of 2018, Congress established a Joint Select Committee to develop a recommendation to improve the solvency of multiemployer plans and the Pension Benefit Guaranty Corporation (“PBGC”) before a November 30, 2018 deadline. While the Committee’s efforts failed to meet its deadline, the Committee made significant progress towards finding solutions that will address the long term solvency of multiemployer pension plans. In the third quarter of 2019, the U.S. House of Representatives passed the Rehabilitation for Multiemployer Pensions Act of 2019 to provide assistance to critical and declining multiemployer pension plans. This bill is now with the U.S. Senate for consideration. UPS will continue to work with all stakeholders, including legislators and regulators, to implement an acceptable solution.
The CSPF has said that it believes a legislative solution to its funded status is necessary or that it will become insolvent in 2025, and we expect that the CSPF will continue to explore options to avoid insolvency. Numerous factors could affect the CSPF’s funded status and UPS’s potential obligation to pay coordinating benefits under the UPS/IBT Plan. Any obligation to pay coordinating benefits will be subject to a number of significant uncertainties, including whether the CSPF submits a revised MPRA filing and the terms thereof, or whether it otherwise seeks federal government assistance, as well as the terms of any applicable legislation, the extent to which benefits are paid by the PBGC and our ability to successfully defend legal positions we may take in the future under the MPRA, including the suspension ordering provisions, our withdrawal agreement and other applicable law.
We account for the potential obligation to pay coordinating benefits to the UPS Transfer Group under Accounting Standards Codification Topic 715- Compensation- Retirement Benefits (“ASC 715”), which requires us to provide a best estimate of various actuarial assumptions, including the eventual outcome of this matter, in measuring our pension benefit obligation at the December 31st measurement date. While we currently believe the most likely outcome to this matter and the broader systemic problems facing multiemployer pension plans is intervention by the federal government, ASC 715 does not permit anticipation of changes in law in making a best estimate of pension liabilities.
As such, our best estimate of the next most likely outcome at the December 31, 2019 measurement date is that the CSPF will submit and implement another benefit reduction plan under the MPRA during 2020. We believe any MPRA filing would be designed to forestall insolvency by reducing benefits to participants other than the UPS Transfer Group to the maximum extent permitted, and then reducing benefits to the UPS Transfer Group by a lesser amount.
We evaluated this outcome using a deterministic cash flow projection, reflecting updated estimated CSPF cash flows and investment earnings, the lack of legislative action and the absence of a MPRA filing by the CSPF in 2019. As a result, at the December 31, 2019 measurement date, the best estimate of our projected benefit obligation for coordinating benefits that may be required to be directly provided by the UPS/IBT Plan to the UPS Transfer Group is $2.6 billion.
4545_Fin_C2.pdf 81 March 4, 2020

UNITED PARCEL SERVICE, INC. AND SUBSIDIARIESNOTES TO CONSOLIDATED FINANCIAL STATEMENTS
80
The future value of this estimate will be influenced by the terms and timing of any MPRA filing, changes in our discount rate, rate of return on assets and other actuarial assumptions, presumed solvency of the PBGC, as well as potential solutions resulting from federal government intervention. Any such event may result in a decrease or an increase in the best estimate of our projected benefit obligation. If the uncertainties are not resolved, it is reasonably possible that our projected benefit obligation could increase by approximately $2.2 billion, resulting in a total obligation for coordinating benefits of approximately $4.8 billion. If a future change in law occurs, it may be a significant event requiring an interim remeasurement of the UPS/IBT Plan at the date the law is enacted. We will continue to assess the impact of these uncertainties on our projected benefit obligation in accordance with ASC 715.
Other Actuarial Assumptions
Healthcare cost trends are used to project future postretirement medical benefits payable from our plans. For 2019 U.S. plan obligations, future postretirement medical benefit costs were forecasted assuming an initial annual rate of increase of 6.5%, decreasing to 4.5% by the year 2024 and with consistent annual increases at that ultimate level thereafter.
Funded Status
The following table discloses the funded status of our plans and the amounts recognized in our consolidated balance sheets as of December 31st (in millions):
U.S. Pension BenefitsU.S. Postretirement
Medical BenefitsInternational
Pension Benefits2019 2018 2019 2018 2019 2018
Funded Status:
Fair value of plan assets $ 46,172 $ 39,554 $ 37 $ 26 $ 1,558 $ 1,284
Benefit obligation (54,039) (45,333) (2,616) (2,510) (1,906) (1,552)
Funded status recognized at December 31 $ (7,867) $ (5,779) $ (2,579) $ (2,484) $ (348) $ (268)
Funded Status Recognized in our Balance Sheet:
Other non-current assets $ — $ — $ — $ — $ 34 $ 35
Other current liabilities (22) (20) (200) (195) (5) (4)
Pension and postretirement benefit obligations (7,845) (5,759) (2,379) (2,289) (377) (299)
Net liability at December 31 $ (7,867) $ (5,779) $ (2,579) $ (2,484) $ (348) $ (268)
Amounts Recognized in AOCI:
Unrecognized net prior service cost $ (800) $ (1,018) $ (16) $ (21) $ (12) $ (14)
Unrecognized net actuarial gain (loss) (5,404) (3,967) (240) (32) (162) (100)
Gross unrecognized cost at December 31 (6,204) (4,985) (256) (53) (174) (114)
Deferred tax assets (liabilities) at December 31 1,497 1,205 62 13 40 28
Net unrecognized cost at December 31 $ (4,707) $ (3,780) $ (194) $ (40) $ (134) $ (86)
The accumulated benefit obligation for our pension plans as of the measurement dates in 2019 and 2018 was $57.553 and $45.704 billion, respectively.
Benefit payments under the pension plans include $27 and $23 million paid from employer assets in 2019 and 2018, respectively. Benefit payments (net of participant contributions) under the postretirement medical benefit plans include $82 and $87 million paid from employer assets in 2019 and 2018, respectively. Such benefit payments from employer assets are also categorized as employer contributions.
4545_Fin_C2.pdf 82 March 4, 2020

UNITED PARCEL SERVICE, INC. AND SUBSIDIARIESNOTES TO CONSOLIDATED FINANCIAL STATEMENTS
81
At December 31, 2019 and 2018, the projected benefit obligation, the accumulated benefit obligation and the fair value of plan assets for pension plans with benefit obligations in excess of plan assets were as follows (in millions):
Projected Benefit Obligation Exceeds the Fair Value of Plan Assets
Accumulated Benefit Obligation Exceeds the Fair Value of Plan Assets
2019 2018 2019 2018
U.S. Pension Benefits:
Projected benefit obligation $ 54,039 $ 45,333 $ 54,039 $ 45,333
Accumulated benefit obligation 53,194 44,284 53,194 44,284
Fair value of plan assets 46,172 39,554 46,172 39,554
International Pension Benefits:
Projected benefit obligation $ 1,319 $ 630 $ 1,319 $ 630
Accumulated benefit obligation 1,210 539 1,210 539
Fair value of plan assets 948 339 948 339
The accumulated postretirement benefit obligation presented in the funded status table exceeds plan assets for all U.S. postretirement medical benefit plans.
4545_Fin_C2.pdf 83 March 4, 2020

UNITED PARCEL SERVICE, INC. AND SUBSIDIARIESNOTES TO CONSOLIDATED FINANCIAL STATEMENTS
82
Benefit Obligations and Fair Value of Plan Assets
The following tables provide a reconciliation of the changes in the plans’ benefit obligations and fair value of plan assets as of the respective measurement dates in each year (in millions).
U.S. Pension BenefitsU.S. Postretirement
Medical BenefitsInternational
Pension Benefits2019 2018 2019 2018 2019 2018
Benefit Obligations:
Projected benefit obligation at beginning of year $ 45,333 $ 45,847 $ 2,510 $ 2,792 $ 1,552 $ 1,651
Service cost 1,439 1,661 23 29 57 62
Interest cost 2,067 1,799 108 104 47 45
Gross benefits paid (2,394) (1,390) (288) (263) (40) (33)
Plan participants’ contributions — — 30 26 3 3
Plan amendments — 331 — — 1 13
Actuarial (gain)/loss 7,594 (2,915) 233 (178) 213 (81)
Foreign currency exchange rate changes — — — 47 (110)
Curtailments and settlements — — — (2) (1)
Other — — — 28 3
Projected benefit obligation at end of year $ 54,039 $ 45,333 $ 2,616 $ 2,510 $ 1,906 $ 1,552
U.S. Pension BenefitsU.S. Postretirement
Medical BenefitsInternational
Pension Benefits2019 2018 2019 2018 2019 2018
Fair Value of Plan Assets:
Fair value of plan assets at beginning of year $ 39,554 $ 41,932 $ 26 $ 183 $ 1,284 $ 1,333
Actual return on plan assets 6,991 (1,007) (5) (7) 171 (6)
Employer contributions 2,021 19 274 87 67 80
Plan participants’ contributions — — 30 26 3 3
Gross benefits paid (2,394) (1,390) (288) (263) (40) (33)
Foreign currency exchange rate changes — — — — 49 (92)
Curtailments and settlements — — — — (2) (1)
Other — — — — 26 —
Fair value of plan assets at end of year $ 46,172 $ 39,554 $ 37 $ 26 $ 1,558 $ 1,284
2019 - $8.040 billion pre-tax actuarial loss related to benefit obligation:
• Discount Rates ($7.477 billion pre-tax loss): The weighted-average discount rate for our pension and postretirementmedical plans decreased from 4.45% at December 31, 2018 to 3.55% at December 31, 2019, primarily due to both adecline in U.S. treasury yields and a decrease in credit spreads on AA-rated corporate bonds in 2019. This waspartially offset by a refinement to our bond matching approach from advances in technology and modeling techniques.
• Coordinating benefits attributable to the Central States Pension Fund ($603 million pre-tax loss): This represents ourcurrent best estimate of the additional potential coordinating benefits that may be required to be paid related to theCentral States Pension Fund before taking into account the impact of the change in discount rates.
• Demographic and Assumption Changes ($40 million pre-tax gain): This represents the difference between actual andestimated participant data and demographic factors, including items such as healthcare cost trends, compensationchanges, rates of termination, retirement, mortality and other changes.
4545_Fin_C2.pdf 84 March 4, 2020
UNITED PARCEL SERVICE, INC. AND SUBSIDIARIESNOTES TO CONSOLIDATED FINANCIAL STATEMENTS
83
2018 - $3.174 billion pre-tax actuarial gain related to benefit obligation:
• Discount Rates ($4.829 billion pre-tax gain): The weighted-average discount rate for our pension and postretirementmedical plans increased from 3.81% at December 31, 2017 to 4.45% at December 31, 2018, primarily due to both anincrease in U.S. treasury yields and an increase in credit spreads on AA-rated corporate bonds in 2018.
• Coordinating benefits attributable to the Central States Pension Fund ($1.550 billion pre-tax loss): This represents ourcurrent best estimate of potential coordinating benefits that may be required to be paid related to the Central StatesPension Fund.
• Demographic and Assumption Changes ($105 million pre-tax loss): This represents the difference between actual andestimated participant data and demographic factors, including items such as healthcare cost trends, compensation rateincreases and rates of termination, retirement and mortality.
Pension and Postretirement Plan Assets
Under the governance of plan trustees, the Investment Committee establishes investment guidelines and strategies and regularly monitors the performance of investments and investment managers. The investment guidelines address items such as establishing appropriate governance provisions; defining investment objectives; determining strategic asset allocation; monitoring and reporting the investments on a regular basis; appointing/dismissing investment managers, custodians, consultants and advisors; risk management; determining/defining the mandates for investment managers; rebalancing of assets and determining investment restrictions/prohibited investments.
Pension assets are invested in accordance with applicable laws and regulations. The primary long-term investment objectives for pension assets are to: (1) provide for a reasonable amount of long-term growth of capital given prudent levels of risk exposure while minimizing permanent loss of capital; (2) generate investment results that meet or exceed the long-term rate of return assumption for the plans and (3) match the duration of the liabilities and assets of the plans to reduce the need for large employer contributions in the future. In furtherance of these objectives, investment managers are engaged to actively manage assets within the guidelines and strategies set forth by the Investment Committee. Active managers are monitored regularly and their performance is compared to applicable benchmarks.
Fair Value Measurements
Pension assets valued utilizing Level 1 inputs include equity investments, corporate debt instruments and U.S. government securities. Fair values were determined by closing prices for those securities traded on national stock exchanges, while securities traded in the over-the-counter market and listed securities for which no sale was reported on the valuation date are valued at the mean between the last reported bid and asked prices.
Level 2 assets include certain bonds that are valued based on yields currently available on comparable securities of other issues with similar credit ratings; mortgage-backed securities that are valued based on cash flow and yield models using acceptable modeling and pricing conventions; and certain investments that are pooled with other investments in a commingled fund. We value our investments in commingled funds by taking the percentage ownership of the underlying assets, each of which has a readily determinable fair value.
Fair value estimates for certain investments are based on unobservable inputs that are not corroborated by observable market data and are thus classified as Level 3.
4545_Fin_C2.pdf 85 March 4, 2020

UNITED PARCEL SERVICE, INC. AND SUBSIDIARIESNOTES TO CONSOLIDATED FINANCIAL STATEMENTS
84
Investments that do not have a readily determinable fair value, and which provide a net asset value ("NAV") or its equivalent developed consistent with FASB measurement principles, are valued using NAV as a practical expedient. These investments are not classified in Levels 1, 2, or 3 of the fair value hierarchy but instead included within the subtotals by asset category. Such investments include hedge funds, risk parity funds, real estate investments, private debt and private equity funds. Investments in hedge funds and risk parity funds are valued using the reported NAV as of December 31st. Real estate investments, private debt and private equity funds are valued at NAV per the most recent partnership audited financial reports, and adjusted, as appropriate, for investment activity between the date of the financial reports and December 31st. Due to the inherent limitations in obtaining a readily determinable fair value measurement for alternative investments, the fair values reported may differ from the values that would have been used had readily available market information for the alternative investments existed. These investments are described further below:
• Hedge Funds: Plan assets are invested in hedge funds that pursue multiple strategies to diversify risk and reducevolatility. Most of these hedge funds allow redemptions either quarterly or semi-annually after a two to three monthnotice period, while others allow for redemption after only a brief notification period with no restriction on redemptionfrequency. No unfunded commitments existed with respect to hedge funds as of December 31, 2019.
• Risk Parity Funds: Plan assets are invested in risk parity strategies in order to provide diversification and balance risk/return objectives. These strategies reflect a multi-asset class balanced risk approach generally consisting of equity,interest rates, credit and commodities. These funds allow for monthly redemptions with only a brief notificationperiod. No unfunded commitments existed with respect to risk parity funds as of December 31, 2019.
• Real Estate, Private Debt and Private Equity Funds: Plan assets are invested in limited partnership interests in variousprivate equity, private debt and real estate funds. Limited provision exists for the redemption of these interests by thelimited partners that invest in these funds until the end of the term of the partnerships, typically ranging between 10and 15 years from the date of inception. An active secondary market exists for similar partnership interests, althoughno particular value (discount or premium) can be guaranteed. At December 31, 2019, unfunded commitments to suchlimited partnerships totaling approximately $2.241 billion are expected to be contributed over the remaininginvestment period, typically ranging between three and six years.
4545_Fin_C2.pdf 86 March 4, 2020

UNITED PARCEL SERVICE, INC. AND SUBSIDIARIESNOTES TO CONSOLIDATED FINANCIAL STATEMENTS
85
The fair values of U.S. and international pension and postretirement benefit plan assets by asset category as of December 31, 2019 are presented below (in millions), as well as the percentage that each category comprises of our total plan assets and the respective target allocations.
TotalAssets(1) Level 1 Level 2 Level 3
Percentage ofPlan Assets
TargetAllocation
Asset Category (U.S. Plans):Cash and cash equivalents $ 964 $ 818 $ 146 $ — 2.1% 1-5Equity Securities:
U.S. Large Cap 6,607 2,889 3,718 —U.S. Small Cap 505 376 129 —Emerging Markets 2,039 1,523 516 —Global Equity 2,892 2,553 339 —International Equity 4,591 2,499 2,092 —
Total Equity Securities 16,634 9,840 6,794 — 36.0 25-55Fixed Income Securities:
U.S. Government Securities 14,077 12,980 1,097 —Corporate Bonds 5,051 — 5,051 —Global Bonds 50 — 50 —Municipal Bonds 24 — 24 —
Total Fixed Income Securities 19,202 12,980 6,222 — 41.5 35-55Other Investments:
Hedge Funds 3,273 — 1,380 — 7.1 5-15Private Equity 3,030 — — — 6.6 1-10Private Debt 772 — — — 1.7 1-10Real Estate 1,940 149 74 — 4.2 1-10Structured Products(2) 153 — 153 — 0.3 1-5Risk Parity Funds 241 — — — 0.5 1-10
Total U.S. Plan Assets $ 46,209 $ 23,787 $ 14,769 $ — 100.0%Asset Category (International Plans):Cash and cash equivalents $ 72 $ 32 $ 40 — 4.6 1-10Equity Securities:
Local Markets Equity 209 — 209 —U.S. Equity 47 — 47 —Emerging Markets 33 33 — —International / Global Equity 441 179 262 —
Total Equity Securities 730 212 518 — 46.8 30-60Fixed Income Securities:
Local Government Bonds 94 — 94 —Corporate Bonds 177 20 157 —Global Bonds 110 110 — —
Total Fixed Income Securities 381 130 251 — 24.5 25-45Other Investments:
Real Estate 128 — 80 — 8.2 5-10Other 247 — 218 12 15.9 1-20
Total International Plan Assets $ 1,558 $ 374 $ 1,107 $ 12 100.0%Total Plan Assets $ 47,767 $ 24,161 $ 15,876 $ 12
(1) Certain investments that are measured at fair value using the NAV per share (or its equivalent) practical expedient have not been classifiedin the fair value hierarchy but are included in the category totals.
(2) Represents mortgage and asset-backed securities.
4545_Fin_C2.pdf 87 March 4, 2020

UNITED PARCEL SERVICE, INC. AND SUBSIDIARIESNOTES TO CONSOLIDATED FINANCIAL STATEMENTS
86
The fair values of U.S. and international pension and postretirement benefit plan assets by asset category as of December 31, 2018 are presented below (in millions), as well as the percentage that each category comprises of our total plan assets and the respective target allocations.
TotalAssets(1) Level 1 Level 2 Level 3
Percentage ofPlan Assets
TargetAllocation
Asset Category (U.S. Plans):Cash and cash equivalents $ 157 $ 108 $ 49 $ — 0.4% 1-5Equity Securities:
U.S. Large Cap 5,276 2,155 3,121 —U.S. Small Cap 542 386 156 —Emerging Markets 1,859 1,436 423 —Global Equity 2,320 2,056 264 —International Equity 3,670 2,189 1,481 —
Total Equity Securities 13,667 8,222 5,445 — 34.5 25-55Fixed Income Securities:
U.S. Government Securities 12,295 11,922 373 —Corporate Bonds 4,303 — 4,301 2Global Bonds 55 — 55 —Municipal Bonds 16 — 16 —
Total Fixed Income Securities 16,669 11,922 4,745 2 42.1 35-55Other Investments:
Hedge Funds 3,154 — 1,185 — 8.0 5-15Private Equity 2,763 — — — 7.0 1-10Private Debt 836 — 178 — 2.1 1-10Real Estate 1,989 152 53 — 5.0 1-10Structured Products(2) 138 — 138 — 0.4 1-5Risk Parity Funds 207 — — — 0.5 1-10
Total U.S. Plan Assets $ 39,580 $ 20,404 $ 11,793 $ 2 100.0%Asset Category (International Plans):Cash and cash equivalents $ 45 $ 4 $ 41 — 3.5 1-10Equity Securities:
Local Markets Equity 171 — 171 —U.S. Equity 34 — 34 —Emerging Markets 33 33 — —International / Global Equity 348 150 198 —
Total Equity Securities 586 183 403 — 45.6 30-60Fixed Income Securities:
Local Government Bonds 102 24 78 —Corporate Bonds 195 54 141 —Global Bonds 27 27 — —
Total Fixed Income Securities 324 105 219 — 25.2 25-45Other Investments:
Real Estate 121 — 76 — 9.4 5-10Other 208 — 191 4 16.3 1-20
Total International Plan Assets $ 1,284 $ 292 $ 930 $ 4 100.0%Total Plan Assets $ 40,864 $ 20,696 $ 12,723 $ 6
(1) Certain investments that are measured at fair value using the NAV per share (or its equivalent) practical expedient have not been classifiedin the fair value hierarchy but are included in the category totals.
(2) Represents mortgage and asset-backed securities.
4545_Fin_C2.pdf 88 March 4, 2020

UNITED PARCEL SERVICE, INC. AND SUBSIDIARIESNOTES TO CONSOLIDATED FINANCIAL STATEMENTS
87
The following table presents the changes in the Level 3 instruments measured on a recurring basis for the years ended December 31, 2019 and 2018 (in millions).
Corporate Bonds Other Total
Balance on January 1, 2018 $ 8 $ — $ 8
Actual Return on Assets:
Assets Held at End of Year — — —
Assets Sold During the Year (7) — (7)
Purchases 11 9 20
Sales (10) (5) (15)
Transfers Into (Out of) Level 3 — — —
Balance on December 31, 2018 $ 2 $ 4 $ 6
Actual Return on Assets:
Assets Held at End of Year — 1 1
Assets Sold During the Year (4) — (4)
Purchases 4 7 11
Sales (2) (2)
Transfers Into (Out of) Level 3 — — —
Balance on December 31, 2019 $ — $ 12 $ 12
There were no shares of UPS class A or B common stock directly held in plan assets as of December 31, 2019 or December 31, 2018.
Expected Cash Flows
Information about expected cash flows for the pension and postretirement benefit plans is as follows (in millions):
U.S.Pension Benefits
U.S. PostretirementMedical Benefits
International Pension Benefits
Expected Employer Contributions:2020 to plan trusts $ 1,000 $ 186 $ 622020 to plan participants 21 11 5
2020 $ 1,645 $ 241 $ 322021 1,802 225 362022 1,942 215 412023 2,085 206 462024 2,230 196 522025 - 2029 13,293 857 353
Our funding policy for U.S. plans is to contribute amounts annually that are at least equal to the amounts required by applicable laws and regulations, or to directly fund payments to plan participants, as applicable. International plans will be funded in accordance with local regulations. Additional discretionary contributions may be made when deemed appropriate to meet the long-term obligations of the plans. Expected benefit payments for pensions will be primarily paid from plan trusts. Expected benefit payments for postretirement medical benefits will be paid from plan trusts and corporate assets.
4545_Fin_C2.pdf 89 March 4, 2020
UNITED PARCEL SERVICE, INC. AND SUBSIDIARIESNOTES TO CONSOLIDATED FINANCIAL STATEMENTS
88
NOTE 6. MULTIEMPLOYER EMPLOYEE BENEFIT PLANS
We contribute to a number of multiemployer defined benefit plans under the terms of collective bargaining agreements that cover our union-represented employees. These plans generally provide for retirement, death and/or termination benefits for eligible employees within the applicable collective bargaining units, based on specific eligibility/participation requirements, vesting periods and benefit formulas. The risks of participating in these multiemployer plans are different from single-employer plans in the following aspects:
• Assets contributed to a multiemployer plan by one employer may be used to provide benefits to employees of otherparticipating employers.
• If we negotiate to cease participating in a multiemployer plan, we may be required to pay that plan an amount based on ourallocable share of its underfunded status, referred to as a "withdrawal liability". However, cessation of participation in amultiemployer plan and subsequent payment of any withdrawal liability is subject to the collective bargaining process.
• If any of the multiemployer pension plans in which we participate enter critical status, and our contributions are not sufficientto satisfy any rehabilitation plan funding schedule, we could be required under the Pension Protection Act of 2006 to makeadditional surcharge contributions to the multiemployer pension plan in the amount of five to ten percent of the existingcontributions required by our labor agreement. Such surcharges would cease upon the ratification of a new collectivebargaining agreement, and could not recur unless a plan re-entered critical status at a later date.
The discussion that follows sets forth the financial impact on our results of operations and cash flows for the years ended December 31, 2019, 2018 and 2017, from our participation in multiemployer benefit plans. As part of the overall collective bargaining process for wage and benefit levels, we have agreed to contribute certain amounts to the multiemployer benefit plans during the contract period. The multiemployer benefit plans set benefit levels and are responsible for benefit delivery to participants. Future contribution amounts to multiemployer benefit plans are determined only through collective bargaining, and we have no additional legal or constructive obligation to increase contributions beyond the agreed-upon amounts (except potential surcharges under the Pension Protection Act of 2006 as described above).
The number of employees covered by our multiemployer pension plans has remained consistent over the past three years, and there have been no significant changes that affect the comparability of 2019, 2018 and 2017 contributions. We recognize expense for the contractually-required contribution for each period, and we recognize a liability for any contributions due and unpaid at the end of a reporting period.
Status of Collective Bargaining Agreements
As of December 31, 2019, we had approximately 290,000 employees employed under a national master agreement and various supplemental agreements with local unions affiliated with the Teamsters. The current National Master Agreement ("NMA") was ratified on April 28, 2019, and runs through July 31, 2023. Most of the economic provisions of the NMA are retroactive to August 1, 2018, which is the effective date of the NMA. The UPS Freight business unit national master agreement was ratified on November 11, 2018.
We have approximately 2,900 pilots who are employed under a collective bargaining agreement with the Independent Pilots Association ("IPA"), which becomes amendable on September 1, 2021. On February 10, 2020, the Company and the IPA reached a tentative agreement on a two-year contract extension. Upon ratification, the extension will go into effect on September 1, 2021 and become amendable September 1, 2023.
We have approximately 1,500 airline mechanics who are covered by a collective bargaining agreement with Teamsters Local 2727 which becomes amendable November 1, 2023. In addition, approximately 3,300 of our auto and maintenance mechanics who are not employed under agreements with the Teamsters are employed under collective bargaining agreements with the International Association of Machinists and Aerospace Workers ("IAM"). On May 2, 2019, the IAM ratified a new collective bargaining agreement which runs through July 31, 2024.
4545_Fin_C2.pdf 90 March 4, 2020

UNITED PARCEL SERVICE, INC. AND SUBSIDIARIESNOTES TO CONSOLIDATED FINANCIAL STATEMENTS
89
Multiemployer Pension Plans
The following table outlines our participation in multiemployer pension plans for the periods ended December 31, 2019, 2018 and 2017, and sets forth our calendar year contributions and accruals for each plan. The “EIN/Pension Plan Number” column provides the Employer Identification Number (“EIN”) and the three-digit plan number. The most recent Pension Protection Act zone status available in 2019 and 2018 relates to the plans’ two most recent fiscal year ends. The zone status is based on information that we received from the plans’ administrators and is certified by each plan’s actuary. Plans certified in the red zone are generally less than 65% funded; plans certified in the orange zone are both less than 80% funded and have an accumulated funding deficiency, or are expected to have a deficiency in any of the next six plan years; plans certified in the yellow zone are less than 80% funded; and plans certified in the green zone are at least 80% funded. The “FIP/RP Status Pending/Implemented” column indicates whether a financial improvement plan (“FIP”) for yellow/orange zone plans, or a rehabilitation plan (“RP”) for red zone plans, is either pending or has been implemented. As of December 31, 2019, all plans that have either a FIP or RP requirement have had the respective plan implemented.
Our collectively-bargained contributions satisfy the requirements of all implemented FIPs and RPs and do not currently require the payment of any surcharges. In addition, minimum contributions outside of the agreed upon contractual rates are not required. For the plans detailed in the following table, the expiration date of the associated collective bargaining agreements is July 31, 2023, with the exception of the Automotive Industries Pension Plan, the Automotive Machinists Pension Trust and the IAM National Pension Fund / National Pension Plan, which have a July 31, 2024 expiration date. For all plans detailed in the following table, we provided more than 5% of the total plan contributions from all employers for 2019, 2018 and 2017 (as disclosed in the annual filing with the Department of Labor for each respective plan).
Certain plans have been aggregated in the “all other multiemployer pension plans” line in the following table, as the contributions to each of these individual plans are not material.
EIN / PensionPlan
PensionProtection Act
Zone StatusFIP / RP Status
Pending /
(in millions)UPS Contributions and
Accruals SurchargePension Fund Number 2019 2018 Implemented 2019 2018 2017 ImposedCentral Pennsylvania Teamsters Defined Benefit Plan 23-6262789-001 Green Green No 48 44 40 NoEmployer-Teamsters Local Nos. 175 & 505 PensionTrust Fund 55-6021850-001 Red Red Yes/Implemented 14 13 12 NoHagerstown Motor Carriers and Teamsters Pension Fund 52-6045424-001 Red Red Yes/Implemented 10 9 8 NoI.A.M. National Pension Fund / National Pension Plan 51-6031295-002 Green Green No 41 38 35 NoInternational Brotherhood of Teamsters Union LocalNo. 710 Pension Fund 36-2377656-001 Green Green No 142 129 118 NoLocal 705, International Brotherhood of TeamstersPension Plan 36-6492502-001 Yellow Yellow Yes/Implemented 113 104 93 NoLocal 804 I.B.T. & Local 447 I.A.M.—UPSMultiemployer Retirement Plan 51-6117726-001 Yellow Yellow Yes/Implemented 112 116 110 NoMilwaukee Drivers Pension Trust Fund 39-6045229-001 Green Green No 48 42 38 NoNew England Teamsters & Trucking Industry PensionFund 04-6372430-001 Red Red Yes/Implemented 120 121 114 NoNew York State Teamsters Conference Pension andRetirement Fund 16-6063585-074 Red Red Yes/Implemented 119 108 100 NoTeamster Pension Fund of Philadelphia and Vicinity 23-1511735-001 Yellow Yellow Yes/Implemented 74 66 60 NoTeamsters Joint Council No. 83 of Virginia Pension Fund 54-6097996-001 Green Green No 75 69 64 NoTeamsters Local 639—Employers Pension Trust 53-0237142-001 Green Green No 68 61 55 NoTeamsters Negotiated Pension Plan 43-6196083-001 Green Green No 37 34 32 NoTruck Drivers and Helpers Local Union No. 355Retirement Pension Plan 52-6043608-001 Green Green No 24 22 20 NoUnited Parcel Service, Inc.—Local 177, I.B.T.Multiemployer Retirement Plan 13-1426500-419 Red Red Yes/Implemented 100 95 88 NoWestern Conference of Teamsters Pension Plan 91-6145047-001 Green Green No 939 868 772 NoWestern Pennsylvania Teamsters and Employers PensionFund 25-6029946-001 Red Red Yes/Implemented 34 31 30 NoAll Other Multiemployer Pension Plans 102 72 81
Total Contributions $2,220 $2,042 $1,870
4545_Fin_C2.pdf 91 March 4, 2020

UNITED PARCEL SERVICE, INC. AND SUBSIDIARIESNOTES TO CONSOLIDATED FINANCIAL STATEMENTS
90
Agreement with the New England Teamsters and Trucking Industry Pension Fund
In 2012, we reached an agreement with the New England Teamsters and Trucking Industry Pension Fund ("NETTI Fund"), a multiemployer pension plan in which UPS is a participant, to restructure the pension liabilities for approximately 10,200 UPS employees represented by the Teamsters. As of December 31, 2019 and 2018, we had $845 and $852 million, respectively, recognized in "Other Non-Current Liabilities" as well as $7 million as of December 31, 2019 and 2018 recorded in "Other current liabilities" on our consolidated balance sheets representing the remaining balance of the NETTI Fund withdrawal liability. This liability is payable in equal monthly installments over a remaining term of approximately 43 years. Based on the borrowing rates currently available to the Company for long-term financing of a similar maturity, the fair value of the NETTI Fund withdrawal liability as of December 31, 2019 and 2018 was $929 and $832 million, respectively. We utilized Level 2 inputs in the fair value hierarchy of valuation techniques to determine the fair value of this liability.
Multiemployer Health and Welfare Plans
We also contribute to a number of multiemployer health and welfare plans covering both active and retired employees. Healthcare benefits are provided to participants who meet certain eligibility requirements as covered under the applicable collective bargaining unit. The following table sets forth our calendar year plan contributions and accruals. Certain plans have been aggregated in the “all other multiemployer health and welfare plans” line, as the contributions to each of these individual plans are not material.
(in millions)UPS Contributions and Accruals
Health and Welfare Fund 2019 2018 2017
Bay Area Delivery Drivers 37 40 37
Central Pennsylvania Teamsters Health & Pension Fund 31 29 27
Central States, South East & South West Areas Health and Welfare Fund 2,899 2,530 2,366
Delta Health Systems—East Bay Drayage Drivers 30 30 29
Joint Council #83 Health & Welfare Fund 45 40 37
Local 804 Welfare Trust Fund 101 90 84
Milwaukee Drivers Pension Trust Fund—Milwaukee Drivers Health and Welfare Trust Fund 48 43 38
New York State Teamsters Health & Hospital Fund 71 62 59
Northern California General Teamsters (DELTA) 157 153 132
Northern New England Benefit Trust 59 54 50
Oregon / Teamster Employers Trust 51 43 38
Teamsters 170 Health & Welfare Fund 19 18 17
Teamsters Benefit Trust 47 48 46
Teamsters Local 251 Health & Insurance Plan 18 17 15
Teamsters Local 638 Health Fund 53 48 43
Teamsters Local 639—Employers Health & Pension Trust Funds 32 29 27
Teamsters Local 671 Health Services & Insurance Plan 20 19 17
Teamsters Union 25 Health Services & Insurance Plan 59 56 52
Teamsters Western Region & Local 177 Health Care Plan 769 656 605
Truck Drivers and Helpers Local 355 Baltimore Area Health & Welfare Fund 19 18 16
Utah-Idaho Teamsters Security Fund 37 32 29
Washington Teamsters Welfare Trust 67 57 52
All Other Multiemployer Health and Welfare Plans 141 156 156
Total Contributions $ 4,810 $ 4,268 $ 3,972
4545_Fin_C2.pdf 92 March 4, 2020

UNITED PARCEL SERVICE, INC. AND SUBSIDIARIESNOTES TO CONSOLIDATED FINANCIAL STATEMENTS
91
NOTE 7. GOODWILL AND INTANGIBLE ASSETS
The following table indicates the allocation of goodwill by segment (in millions):
U.S. DomesticPackage
InternationalPackage
Supply Chain &Freight Consolidated
Balance on January 1, 2018 $ 715 $ 435 $ 2,722 $ 3,872
Acquired — — — —
Currency / Other — (18) (43) (61)
Balance on December 31, 2018 $ 715 $ 417 $ 2,679 $ 3,811
Acquired — 2 3 5
Currency / Other — (3) — (3)
Balance on December 31, 2019 $ 715 $ 416 $ 2,682 $ 3,813
2019 Goodwill Activity
The goodwill acquired in the International Package segment is related to our January 2019 acquisition of Transmodal Services Private Limited in India. The goodwill acquired in the Supply Chain & Freight segment is primarily due to July 2019 acquisitions by Marken in Europe.
The remaining change in goodwill for the International Package segment was due to immaterial purchase accounting adjustments and the impact of changes in the value of the U.S. Dollar on the translation of non-U.S. Dollar goodwill balances.
2018 Goodwill Activity
The change in goodwill for both the Supply Chain & Freight and the International Package segments was due to immaterial purchase accounting adjustments and the impact of changes in the value of the U.S. Dollar on the translation of non-U.S. Dollar goodwill balances.
Goodwill Impairment
We completed our annual goodwill impairment evaluation, as of July 1st, on a reporting unit basis. For the periods presented, no triggering events were identified that required an interim impairment test.
U.S. Domestic Package is our largest reporting segment and reporting unit. In our International Package reporting segment, we have the following reporting units: Europe, Asia, Americas and ISMEA. In our Supply Chain & Freight segment we have the following reporting units: Forwarding, Logistics, UPS Mail Innovations, UPS Freight, The UPS Store, UPS Capital, Marken and Coyote.
In assessing our goodwill for impairment, we initially evaluate qualitative factors to determine if it is more likely than not that the fair value of a reporting unit is less than its carrying amount. If the qualitative assessment is not conclusive and it is necessary to calculate the fair value of a reporting unit, then we utilize a two-step process to test goodwill for impairment. First, a comparison of the fair value of the applicable reporting unit with the aggregate carrying value, including goodwill, is performed. We primarily determine the fair value of our reporting units using a discounted cash flow model, and supplement this with observable valuation multiples for comparable companies, as applicable. If the carrying amount of a reporting unit exceeds the reporting unit’s fair value, we perform the second step of the goodwill impairment test to determine the amount of impairment loss. The second step includes comparing the implied fair value of the affected reporting unit’s goodwill with the carrying value of that goodwill.
In 2019, we utilized a qualitative assessment to determine that it was more likely than not that the reporting unit fair value exceeded the carrying value for U.S. Domestic Package, Forwarding, Logistics, Coyote, UPS Mail Innovations and The UPS Store. For the remaining reporting units owned at the annual goodwill impairment testing date, we utilized the two-step process to test goodwill for impairment. We did not have any goodwill impairment charges in 2019, 2018 or 2017. Cumulatively, our Supply Chain & Freight segment has recorded $622 million of goodwill impairment charges, while our International and U.S. Domestic Package segments have not recorded any goodwill impairment charges.
4545_Fin_C2.pdf 93 March 4, 2020

UNITED PARCEL SERVICE, INC. AND SUBSIDIARIESNOTES TO CONSOLIDATED FINANCIAL STATEMENTS
92
Intangible Assets
The following is a summary of intangible assets at December 31, 2019 and 2018 (in millions):
Gross CarryingAmount
AccumulatedAmortization
Net CarryingValue
Weighted-AverageAmortization
Period(in years)
December 31, 2019
Capitalized software $ 4,125 $ (2,704) $ 1,421 6.9
Licenses 117 (64) 53 3.9
Franchise rights 146 (109) 37 20.0
Customer relationships 730 (282) 448 10.6
Trade name 200 — 200 N/A
Trademarks, patents and other 29 (21) 8 7.7
Total Intangible Assets $ 5,347 $ (3,180) $ 2,167 7.7
December 31, 2018
Capitalized software $ 3,693 $ (2,478) $ 1,215
Licenses 117 (36) 81
Franchise rights 145 (105) 40
Customer relationships 736 (217) 519
Trade name 200 — 200
Trademarks, patents and other 52 (31) 20
Total Intangible Assets $ 4,943 $ (2,867) $ 2,075
A trade name and licenses with carrying values of $200 and $4 million, respectively, as of December 31, 2019 are deemed to be indefinite-lived intangible assets, and therefore are not amortized. Impairment tests for indefinite-lived intangible assets are performed on an annual basis. All of our other recorded intangible assets are deemed to be finite-lived intangibles, and are thus amortized over their estimated useful lives. Impairment tests for these intangible assets are only performed when a triggering event occurs that may indicate that the carrying value of the intangible may not be recoverable. Impairments of finite-lived intangible assets were $2 and $12 million in 2019 and 2018, respectively.
Amortization of intangible assets was $377, $339 and $287 million during 2019, 2018 and 2017, respectively. Expected amortization of finite-lived intangible assets recorded as of December 31, 2019 for the next five years is as follows (in millions): 2020—$481; 2021—$403; 2022—$332; 2023—$276; 2024—$220. Amortization expense in future periods will be affected by business acquisitions, software development, licensing agreements, franchise rights purchased and other factors.
4545_Fin_C2.pdf 94 March 4, 2020

UNITED PARCEL SERVICE, INC. AND SUBSIDIARIESNOTES TO CONSOLIDATED FINANCIAL STATEMENTS
93
NOTE 8. DEBT AND FINANCING ARRANGEMENTS
The carrying value of our outstanding debt obligations, as of December 31, 2019 and 2018 consists of the following (in millions):
Principal Carrying ValueAmount Maturity 2019 2018
Commercial paper $ 3,243 2020 $ 3,234 $ 2,662Fixed-rate senior notes:
5.125% senior notes 1,000 2019 — 9983.125% senior notes 1,500 2021 1,524 1,4922.050% senior notes 700 2021 699 6982.450% senior notes 1,000 2022 1,003 1,0232.350% senior notes 600 2022 598 5972.500% senior notes 1,000 2023 995 9942.800% senior notes 500 2024 497 4962.200% senior notes 400 2024 398 —2.400% senior notes 500 2026 498 4983.050% senior notes 1,000 2027 992 9913.400% senior notes 750 2029 745 —2.500% senior notes 400 2029 397 —6.200% senior notes 1,500 2038 1,483 1,4824.875% senior notes 500 2040 490 4903.625% senior notes 375 2042 368 3683.400% senior notes 500 2046 491 4913.750% senior notes 1,150 2047 1,136 1,1364.250% senior notes 750 2049 742 —3.400% senior notes 700 2049 688 —
Floating-rate senior notes: Floating-rate senior notes 350 2021 349 349 Floating-rate senior notes 400 2022 399 399 Floating-rate senior notes 500 2023 499 499
Floating-rate senior notes 1,041 2049-2067 1,028 1,0298.375% Debentures:
8.375% debentures 424 2020 426 4198.375% debentures 276 2030 281 274
Pound Sterling Notes: 5.500% notes 87 2031 86 84 5.125% notes 597 2050 566 546Euro Senior Notes:
0.375% senior notes 783 2023 779 7971.625% senior notes 783 2025 779 7981.000% senior notes 560 2028 556 5701.500% senior notes 560 2032 556 569Floating-rate senior notes 560 2020 559 572
Canadian senior notes: 2.125% senior notes 573 2024 571 548Finance lease obligations 498 2020 – 2210 498 534Facility notes and bonds 320 2029 – 2045 320 320Other debt 8 2020 – 2025 8 13Total debt $ 26,388 25,238 22,736Less: current maturities (3,420) (2,805)Long-term debt $ 21,818 $ 19,931
4545_Fin_C2.pdf 95 March 4, 2020

UNITED PARCEL SERVICE, INC. AND SUBSIDIARIESNOTES TO CONSOLIDATED FINANCIAL STATEMENTS
94
Commercial Paper
We are authorized to borrow up to $10.0 billion under a U.S. commercial paper program and €5.0 billion (in a variety of currencies) under a European commercial paper program. We had the following amounts outstanding under these programs as of December 31, 2019: $2.172 billion with an average interest rate of 1.90% and €949 million ($1.062 billion) with an average interest rate of -0.44%. As of December 31, 2019, we have classified the entire commercial paper balance as a current liability on our consolidated balance sheets. The amount of commercial paper outstanding under these programs in 2020 is expected to fluctuate.
Debt Classification
We have classified both our 8.375% debentures due April 2020 with a principal balance of $424 million, and our €500 million ($560 million) floating-rate senior notes due July 2020, as long-term debt based on our intent and ability to refinance the debt as of December 31, 2019. We have classified certain floating-rate senior notes that are putable by the note holders as long-term debt due to our intent and ability to refinance the debt if the put option is exercised by the note holders.
Debt Issuances
On March 15, 2019 we issued two series of notes, both in the principal amounts of $750 million. These fixed-rate notes bear interest at 3.40% and 4.25% and will mature on March 15, 2029 and March 15, 2049, respectively. Interest on the fixed-rate senior notes is payable semi-annually, beginning September 2019. The 3.40% fixed-rate senior notes are callable at our option at a redemption price equal to the greater of 100% of the principal amount, or the sum of the present values of remaining scheduled payments of principal and interest due from the redemption date until three months prior to maturity, discounted to the redemption date on a semi-annual basis at the discount rate of the Treasury Rate plus 15 basis points, plus accrued and unpaid interest. The 4.25% fixed-rate senior notes are callable at our option at a redemption price equal to the greater of 100% of the principal amount, or the sum of the present values of remaining scheduled payments of principal and interest due from the redemption date until six months prior to maturity discounted to the redemption date on a semi-annual basis at the discount rate of the Treasury Rate plus 20 basis points, plus accrued and unpaid interest.
On August 16, 2019 we issued three series of notes, two with principal amounts of $400 million and one in the principal amount of $700 million. These notes bear interest at 2.20%, 2.50% and 3.40%, respectively, and will mature on September 1, 2024, September 1, 2029 and September 1, 2049, respectively. Interest on the notes is payable semi-annually, beginning March 2020. The 2.20% senior notes are callable at our option at a redemption price equal to the greater of 100% of the principal amount, or the sum of the present values of scheduled payments of principal and interest due from the redemption date until one month prior to maturity, discounted to the redemption date on a semi-annual basis at the discount rate of the Treasury Rate plus 10 basis points, plus accrued and unpaid interest. The 2.50% senior notes are callable at our option at a redemption price equal to the greater of 100% of the principal amount, or the sum of the present values of scheduled payments of principal and interest due from the redemption date until three months prior to maturity discounted to the redemption date on a semi-annual basis at the discount rate of the Treasury Rate plus 15 basis points, plus accrued and unpaid interest. The 3.40% senior notes are callable at our option at a redemption price equal to the greater of 100% of the principal amount, or the sum of the present values of scheduled payments of principal and interest due from the redemption date until six months prior to maturity, discounted to the redemption date on a semi-annual basis at the discount rate of the Treasury Rate plus 20 basis points, plus accrued and unpaid interest.
4545_Fin_C2.pdf 96 March 4, 2020

UNITED PARCEL SERVICE, INC. AND SUBSIDIARIESNOTES TO CONSOLIDATED FINANCIAL STATEMENTS
95
Fixed-Rate Senior Notes
All of our fixed-rate notes pay interest semi-annually, and allow for redemption by UPS at any time by paying the greater of the principal amount or a “make-whole” amount, plus accrued interest. We subsequently entered into interest rate swaps on several of these notes, which effectively converted the fixed interest rates on the notes to variable LIBOR-based interest rates. The average interest rate payable on the notes where fixed interest rates were swapped to variable-based interest rates, including the impact of the interest rate swaps, for 2019 and 2018 were as follows:
Principal Average Effective Interest RateValue Maturity 2019 2018
5.50% senior notes $ 750 2018 —% 3.63%5.125% senior notes 1,000 2019 4.48% 3.99%3.125% senior notes 1,500 2021 2.59% 2.32%2.45% senior notes 1,000 2022 3.03% 2.77%
On April 1, 2019, our $1.00 billion 5.125% senior notes matured and were repaid in full.
8.375% Debentures
The 8.375% debentures consist of two separate tranches, as follows:
• $276 million of the debentures have a maturity of April 1, 2030. These debentures have an 8.375% interest rate untilApril 1, 2020, and, thereafter, the interest rate will be 7.62% for the final 10 years. These debentures are redeemable inwhole or in part at our option at any time. The redemption price is equal to the greater of 100% of the principal amountand accrued interest, or the sum of the present values of the remaining scheduled payments of principal and interestthereon discounted to the date of redemption (at a benchmark treasury yield plus five basis points) plus accruedinterest.
• $424 million of the debentures have a maturity of April 1, 2020. These debentures are not subject to redemption priorto maturity.
Interest is payable semi-annually in April and October for both tranches and neither tranche is subject to sinking fund requirements. We subsequently entered into interest rate swaps on the 2020 debentures, which effectively converted the fixed interest rates on the debentures to variable LIBOR-based interest rates. The average interest rate payable on the 2020 debentures, including the impact of the interest rate swaps, for 2019 and 2018 was 7.20% and 6.93%, respectively.
Floating-Rate Senior Notes
The floating-rate senior notes, with principal amounts totaling $1.041 billion, bear interest at either one or three-month LIBOR, less a spread ranging from 30 to 45 basis points. The average interest rate for 2019 and 2018 was 2.05% and 1.76%, respectively. These notes are callable at various times after 30 years at a stated percentage of par value, and putable by the note holders at various times after one year at a stated percentage of par value. The notes have maturities ranging from 2049 through 2067. We classified the floating-rate senior notes that are putable by the note holder as long-term liabilities, due to our intent and ability to refinance the debt if the put option is exercised by the note holder.
The remaining three floating-rate senior notes in the principal amounts of $350, $400, and $500 million, bear interest at three-month LIBOR, plus a spread ranging from 15 to 45 basis points. The average interest rate for 2019 and 2018 was 2.82% and 2.50%, respectively. These notes are not callable. The notes have maturities ranging from 2021 through 2023.
Finance Lease Obligations
We have certain property, plant and equipment subject to finance leases. For additional information on finance lease obligations, see note 10.
4545_Fin_C2.pdf 97 March 4, 2020

UNITED PARCEL SERVICE, INC. AND SUBSIDIARIESNOTES TO CONSOLIDATED FINANCIAL STATEMENTS
96
Facility Notes and Bonds
We have entered into agreements with certain municipalities or related entities to finance the construction of, or improvements to, facilities that support our operations in the United States. These facilities are located around airport properties in Louisville, Kentucky; Dallas, Texas; and Philadelphia, Pennsylvania. Under these arrangements, we enter into a lease or loan agreement that covers the debt service obligations on the bonds issued by these entities, as follows:
• Bonds with a principal balance of $149 million issued by the Louisville Regional Airport Authority associated with ourWorldport facility in Louisville, Kentucky. The bonds, which are due in January 2029, bear interest at a variable rate,and the average interest rates for 2019 and 2018 were 1.49% and 1.43%, respectively.
• Bonds with a principal balance of $42 million and due in November 2036 issued by the Louisville Regional AirportAuthority associated with our air freight facility in Louisville, Kentucky. The bonds bear interest at a variable rate, andthe average interest rates for 2019 and 2018 were 1.49% and 1.39%, respectively.
• Bonds with a principal balance of $29 million issued by the Dallas / Fort Worth International Airport FacilityImprovement Corporation associated with our Dallas, Texas airport facilities. The bonds are due in May 2032 and bearinterest at a variable rate, however the variable cash flows on the obligation have been swapped to a fixed 5.11%.
• Bonds with a principal balance of $100 million issued by the Delaware County, Pennsylvania Industrial DevelopmentAuthority associated with our Philadelphia, Pennsylvania airport facilities. These bonds, which are due September2045, bear interest at a variable rate. The average interest rate for 2019 and 2018 was 1.48% and 1.35%, respectively.
Pound Sterling Notes
The Pound Sterling notes consist of two separate tranches, as follows:
• Notes with a principal amount of £66 million accrue interest at a 5.50% fixed rate, and are due in February 2031.These notes are not callable.
• Notes with a principal amount of £455 million accrue interest at a 5.125% fixed rate, and are due in February 2050.These notes are callable at our option at a redemption price equal to the greater of 100% of the principal amount andaccrued interest, or the sum of the present values of the remaining scheduled payments of principal and interestthereon discounted to the date of redemption at a benchmark U.K. government bond yield plus 15 basis points, plusaccrued interest.
Canadian Dollar Senior Notes
The Canadian Dollar notes consist of a single series a follows:
• Notes in the principal amount of C$750 million, which bear interest at a 2.125% fixed interest rate and mature in May2024. Interest on the notes is payable semi-annually. The notes are callable at our option, in whole or in part at theGovernment of Canada yield plus 21.5 basis points, and on or after the par call date, at par value.
Euro Senior Notes
The Euro notes consist of four separate issuances, as follows:
• Notes in the principal amount of €500 million accrue interest at a 1% fixed rate and are due in November 2028.Interest is payable annually on the notes. These notes are callable at our option at a redemption price equal to thegreater of 100% of the principal amount, or the sum of the present values of the remaining scheduled payments ofprincipal and interest thereon discounted to the date of redemption at a benchmark comparable German governmentbond yield plus 15 basis points, plus accrued interest.
• Notes with a principal amount of €500 million accrue interest at a variable rate equal to three-month EURIBOR plus43 basis points and are due in July 2020. Interest is payable quarterly on the notes. These notes are not callable. Thenotes bear interest at a variable rate, and the average interest rates for 2019 and 2018 were 0.08% and 0.11%,respectively.
4545_Fin_C2.pdf 98 March 4, 2020

UNITED PARCEL SERVICE, INC. AND SUBSIDIARIESNOTES TO CONSOLIDATED FINANCIAL STATEMENTS
97
• Notes with a principal amount of €700 million accrue interest at a 1.625% fixed rate and are due in November 2025.Interest is payable annually on the notes. These notes are callable at our option at a redemption price equal to thegreater of 100% of the principal amount, or the sum of the present values of the remaining scheduled payments ofprincipal and interest thereon discounted to the date of redemption at a benchmark German government bond yieldplus 20 basis points, plus accrued interest.
• Notes with principal amounts of €700 million and €500 million accrue interest at 0.375% and 1.500% fixed rates,respectively, and are due in November 2023 and November 2032, respectively. Interest on these notes is payableannually. The notes are callable at our option at a redemption price equal to the greater of 100% of the principalamount, or the sum of the present values of the remaining scheduled payments of principal and interest thereondiscounted to the date of redemption at a benchmark comparable government bond yield plus 10 and 20 basis points,respectively, plus accrued interest.
Contractual Commitments
The following table sets forth the aggregate annual principal payments due under our long-term debt and the aggregate amounts expected to be spent for purchase commitments (in millions).
Year Debt PrincipalPurchase
Commitments(1)
2020 $ 4,232 3,569
2021 2,551 1,982
2022 2,001 966
2023 2,284 323
2024 1,474 261
After 2024 12,349 201
Total $ 24,891 $ 7,302(1) Purchase commitments includes amounts due under aircraft leases that we entered into in 2019 and our January 29, 2020 announcedcommitment to purchase 10,000 electric vehicles.
As of December 31, 2019, we had outstanding letters of credit totaling approximately $1.267 billion issued in connection with our self-insurance reserves and other routine business requirements. We also issue surety bonds as an alternative to letters of credit in certain instances, and as of December 31, 2019, we had $1.327 billion of surety bonds written.
Sources of Credit
We maintain two credit agreements with a consortium of banks. One of these agreements provides revolving credit facilities of $2.0 billion, and expires on December 8, 2020. Generally, amounts outstanding under this facility bear interest at a periodic fixed rate equal to LIBOR for the applicable interest period and currency denomination, plus an applicable margin. Alternatively, a fluctuating rate of interest equal to the highest of (1) the rate of interest last quoted by The Wall Street Journal as the prime rate in the United States; (2) the Federal Funds effective rate plus 0.50%; and (3) LIBOR for a one month interest period plus 1.00%, plus an applicable margin, may be used at our discretion. In each case, the applicable margin for advances bearing interest based on LIBOR is a percentage determined by quotations from Markit Group Ltd. for our 1-year credit default swap spread, subject to a minimum rate of 0.25% and a maximum rate of 1.00%. The applicable margin for advances bearing interest based on the prime rate is 1.00% below the applicable margin for LIBOR advances (but not lower than 0.00%). We are also able to request advances under this facility based on competitive bids for the applicable interest rate. There were no amounts outstanding under this facility as of December 31, 2019.
4545_Fin_C2.pdf 99 March 4, 2020

UNITED PARCEL SERVICE, INC. AND SUBSIDIARIESNOTES TO CONSOLIDATED FINANCIAL STATEMENTS
98
The second agreement provides revolving credit facilities of $2.5 billion, and expires on December 11, 2023. Generally, amounts outstanding under this facility bear interest at a periodic fixed rate equal to LIBOR for the applicable interest period and currency denomination, plus an applicable margin. Alternatively, a fluctuating rate of interest equal to the highest of (1) the rate of interest last quoted by The Wall Street Journal as the prime rate in the United States; (2) the Federal Funds effective rate plus 0.50%; and (3) LIBOR for a one month interest period plus 1.00%, plus an applicable margin, may be used at our discretion. In each case, the applicable margin for advances bearing interest based on LIBOR is a percentage determined by quotations from Markit Group Ltd. for our 1-year credit default swap spread, interpolated for a period from the date of determination of such credit default swap spread in connection with a new interest period until the latest maturity date of this facility then in effect (but not less than a period of one year). The minimum applicable margin rate is 0.10% and the maximum applicable margin rate is 0.75% per annum. The applicable margin for advances bearing interest based on the prime rate is 1.00% below the applicable margin for LIBOR advances (but not less than 0.00%). We are also able to request advances under this facility based on competitive bids. There were no amounts outstanding under this facility as of December 31, 2019.
Debt Covenants
Our existing debt instruments and credit facilities subject us to certain financial covenants. As of December 31, 2019 and for all prior periods presented, we have satisfied these financial covenants. These covenants limit the amount of secured indebtedness that we may incur, and limit the amount of attributable debt in sale-leaseback transactions, to 10% of net tangible assets. As of December 31, 2019, 10% of net tangible assets is equivalent to $3.646 billion; however, we have no covered sale-leaseback transactions or secured indebtedness outstanding. We do not expect these covenants to have a material impact on our financial condition or liquidity.
Fair Value of Debt
Based on the borrowing rates currently available to the Company for long-term debt with similar terms and maturities, the fair value of long-term debt, including current maturities, is approximately $26.949 and $23.293 billion as of December 31, 2019 and 2018, respectively. We utilized Level 2 inputs in the fair value hierarchy of valuation techniques to determine the fair value of all of our debt instruments.
4545_Fin_C2.pdf 100 March 4, 2020

UNITED PARCEL SERVICE, INC. AND SUBSIDIARIESNOTES TO CONSOLIDATED FINANCIAL STATEMENTS
99
NOTE 9. LEGAL PROCEEDINGS AND CONTINGENCIES
We are involved in a number of judicial proceedings and other matters arising from the conduct of our business.
Although there can be no assurance as to the ultimate outcome, we have generally denied, or believe we have a meritorious defense and will deny, liability in all pending matters, including (except as otherwise noted herein) the matters described below, and we intend to vigorously defend each matter. We accrue amounts associated with legal proceedings when and to the extent a loss becomes probable and can be reasonably estimated. The actual costs of resolving legal proceedings may be substantially higher or lower than the amounts accrued on those claims.
For matters as to which we are not able to estimate a possible loss or range of losses, we are not able to determine whether any such loss will have a material adverse effect on our business, financial condition, results of operations or liquidity. For matters in this category, we have indicated in the descriptions that follow the reasons that we are unable to estimate the possible loss or range of losses.
Judicial Proceedings
In February 2015, the State and City of New York filed suit against UPS in the U.S. District Court for the Southern District of New York, arising from alleged shipments of cigarettes to New York State and City residents. The complaint asserted claims under various federal and state laws. The complaint also included a claim that UPS violated the Assurance of Discontinuance it entered into with the New York Attorney General in 2005 concerning cigarette deliveries. On March 24, 2017, the District Court issued an opinion and order finding liability against UPS on each of the plaintiffs’ causes of action. On May 25, 2017, the District Court issued a corrected opinion and order on liability and an order awarding the plaintiffs damages of $9 million and penalties of $238 million. Following an appeal, on November 7, 2019, the U.S. Court of Appeals for the Second Circuit issued an order awarding the plaintiffs damages of $19 million and penalties of $79 million. An accrual of $100 million with respect to this matter is included on our consolidated balance sheets at December 31, 2019. We estimate that the amount of losses could be up to $247 million, plus interest; however, the amount of penalties ultimately payable, if any, is subject to a variety of complex factors and potential outcomes that could be determined in future legal proceedings, which would include a petition for a writ of certiorari with the U.S. Supreme Court.
We are a defendant in a number of lawsuits filed in state and federal courts containing various class action allegations under state wage-and-hour laws. At this time, we do not believe that any loss associated with any matter would have a material adverse effect on our financial condition, results of operations or liquidity. One of these matters, Hughes v. UPS Supply Chain Solutions, Inc. and United Parcel Service, Inc. had previously been certified as a class action in Kentucky state court. In the second quarter of 2019, the court granted our motion for judgment on the pleadings related to the wage-and-hour claims. The plaintiffs have appealed this decision.
Other Matters
In October 2015, the Department of Justice ("DOJ") informed us of an industry-wide inquiry into the transportation of mail under the United States Postal Service ("USPS") International Commercial Air contracts. In October 2017, we received a Civil Investigative Demand seeking certain information relating to our contracts. The DOJ has indicated it is investigating potential violations of the False Claims Act or other statutes. We are cooperating with the DOJ. We are unable to predict what action, if any, might be taken in the future by any government authorities as a result of their investigation. Accordingly, at this time, we are not able to estimate a possible loss or range of losses that may result from this matter or to determine whether such loss, if any, would have a material adverse effect on our financial condition, results of operations or liquidity.
In August 2016, Spain’s National Markets and Competition Commission (“CNMC”) announced an investigation into 10 companies in the commercial delivery and parcel industry, including UPS, related to alleged nonaggression agreements to allocate customers. In May 2017, UPS received a Statement of Objections issued by the CNMC. In July 2017, UPS received a Proposed Decision from the CNMC. On March 8, 2018, the CNMC adopted a final decision, finding an infringement and imposing a fine on UPS of €19 million. UPS appealed the decision and in September 2018, obtained a suspension of the implementation of the decision (including payment of the fine). The appeal is pending. There are multiple factors that prevent us from being able to estimate a possible loss or range of losses that may result from this matter or to determine whether such loss, if any, would have a material adverse effect on our financial condition, results of operations or liquidity including: (1) we are vigorously defending ourselves and believe that we have a number of meritorious legal defenses; and (2) there are unresolved questions of law and fact that could be important to the ultimate resolution of this matter.
4545_Fin_C2.pdf 101 March 4, 2020

UNITED PARCEL SERVICE, INC. AND SUBSIDIARIESNOTES TO CONSOLIDATED FINANCIAL STATEMENTS
100
In February 2018, the Turkish Competition Authority ("Authority") opened an investigation into nine companies in the small package industry, including UPS, related to alleged customer allocations in violation of Turkish competition law. In April 2018, the Authority consolidated this investigation with two other investigations involving similar allegations. The consolidated investigation involves over 30 companies. In January 2020, the Authority held a hearing and announced a summary decision, finding an infringement and imposing an immaterial fine on UPS. We do not believe that any loss associated with this matter will have a material adverse effect on our financial condition, results of operations or liquidity.
We are a party in various other matters that arose in the normal course of business. We do not believe that the eventual resolution of these other matters (either individually or in the aggregate), including any reasonably possible losses in excess of current accruals, will have a material adverse effect on our financial condition, results of operations or liquidity.
4545_Fin_C2.pdf 102 March 4, 2020

UNITED PARCEL SERVICE, INC. AND SUBSIDIARIESNOTES TO CONSOLIDATED FINANCIAL STATEMENTS
101
NOTE 10. LEASES
We adopted ASU 2016-02, Leases (Topic 842), on January 1, 2019. The standard requires lessees to recognize a right-of-use ("ROU") asset and lease liability for all leases. Some of our leases contain both lease and non-lease components, which we have elected to treat as a single lease component. We have also elected not to recognize leases that have an original lease term, including reasonably certain renewal or purchase options, of twelve months or less in our consolidated balance sheets for all classes of underlying assets. Lease costs for short-term leases are recognized on a straight-line basis over the lease term. We elected the package of transition practical expedients for existing contracts, which allowed us to carry forward our historical assessments of whether contracts are, or contain, leases, lease classification and determination of initial direct costs.
We lease property and equipment under finance and operating leases. We have finance and operating leases for package centers, airport facilities, warehouses, corporate office space, aircraft, aircraft engines, information technology equipment (primarily mainframes, servers and copiers), vehicles and various other equipment used in operating our business. Certain leases for real estate and aircraft contain options to purchase, extend or terminate the lease. Determining the lease term and amount of lease payments to include in the calculation of the ROU asset and lease liability for leases containing options requires the use of judgment to determine whether the exercise of an option is reasonably certain, and if the optional period and payments should be included in the calculation of the associated ROU asset and liability. In making this determination, we consider all relevant economic factors that would compel us to exercise or not exercise an option.
When our leases contain future payments that are dependent on an index or rate, such as the consumer price index, we initially measure the lease liability and ROU asset using the index or rate at the commencement date. In subsequent periods, lease payments dependent on an index or rate are not remeasured. Rather, changes to payments due to a change in an index or rate are recognized in our statements of consolidated income in the period of the change.
When available, we use the rate implicit in the lease to discount lease payments; however, the rate implicit in the lease is not readily determinable for substantially all of our leases. For these leases, we use an estimate of our incremental borrowing rate to discount lease payments based on information available at lease commencement. The incremental borrowing rate is derived using multiple inputs including our credit rating, the impact of full collateralization, lease term and denominated currency. The remaining lease terms vary from 1 month to 190 years.
Aircraft
In addition to the aircraft that we own, we have leases for 342 aircraft. Of these leased aircraft, 31 are classified as finance leases, 14 are classified as operating leases and the remaining 297 are classified as short-term leases. A majority of the obligations associated with the aircraft classified as finance leases have been legally defeased. Most of our long-term aircraft operating leases are operated by a third party to handle package and cargo volume in geographic regions where, due to government regulations, we are restricted from operating an airline.
In order to meet customers' needs, we charter aircraft to handle package and cargo volume on certain international trade lanes and domestic routes. Due to the nature of these agreements, primarily being that either party can cancel the agreement with short notice, we have classified these as short-term leases. Additionally, all of the lease payments associated with these charter agreements are variable in nature based on the number of hours flown.
Real Estate
We have operating and finance leases for package centers, airport facilities, warehouses, corporate office space and expansion facilities utilized during peak shipping periods. Many of our leases contain charges for common area maintenance or other miscellaneous expenses that are updated based on landlord estimates. Due to this variability, the cash flows associated with these charges are not included in the minimum lease payments used in determining the ROU asset and associated lease liability.
Some of our real estate leases contain options to renew or extend the lease or terminate the lease before the expiration date. These options are factored into the determination of the lease term and lease payments when their exercise is considered to be reasonably certain.
We also enter into real estate leases that contain lease incentives, such as tenant improvement allowances or move-in allowances, that are received or receivable at lease commencement. These incentives reduce lease payments for classification purposes and reduce the initial ROU asset. When lease incentives are receivable at lease commencement, they also reduce the initial lease liability.
4545_Fin_C2.pdf 103 March 4, 2020

UNITED PARCEL SERVICE, INC. AND SUBSIDIARIESNOTES TO CONSOLIDATED FINANCIAL STATEMENTS
102
From time to time, we enter into leases with the intention of purchasing the property, either through purchase options with a fixed price or a purchase agreement negotiated contemporaneously with the lease agreement. We classify these leases as finance leases and include the purchase date and purchase price in the lease term and lease payments, respectively, when the option to exercise or purchase is reasonably certain.
Transportation and other equipment
We enter into both long-term and short-term leases for transportation equipment to supplement our capacity or meet contractual demands. Some of these assets are leased on a month-to-month basis and the leases can be terminated without penalty. The lease term for these types of leases is determined by the length of the underlying customer contract or based on the judgment of the business unit. We also enter into multi-year leases for trailers to increase capacity during periods of high demand, which are typically only used for 90-120 days during the year. These leases are treated as short-term as the cumulative right-of-use is less than 12 months over the term of the contract.
The remainder of our leases are primarily related to equipment used in our air operations, vehicles required to meet capacity needs during periods of higher demand for our shipping services, technology equipment and office equipment used in our facilities.
Some of our transportation and technology equipment leases require us to make additional lease payments based on the underlying usage of the assets. Due to the variable nature of these costs, these are expensed as incurred and are not included in the ROU asset and lease liability.
The components of lease expense for the year ended December 31, 2019 are as follows (in millions):
Year Ended December 31,
2019
Operating lease costs $ 643
Finance lease costs:
Amortization of assets $ 73
Interest on lease liabilities 19
Total finance lease costs 92
Variable lease costs 206
Short-term lease costs 1,122
Total lease costs $ 2,063
4545_Fin_C2.pdf 104 March 4, 2020
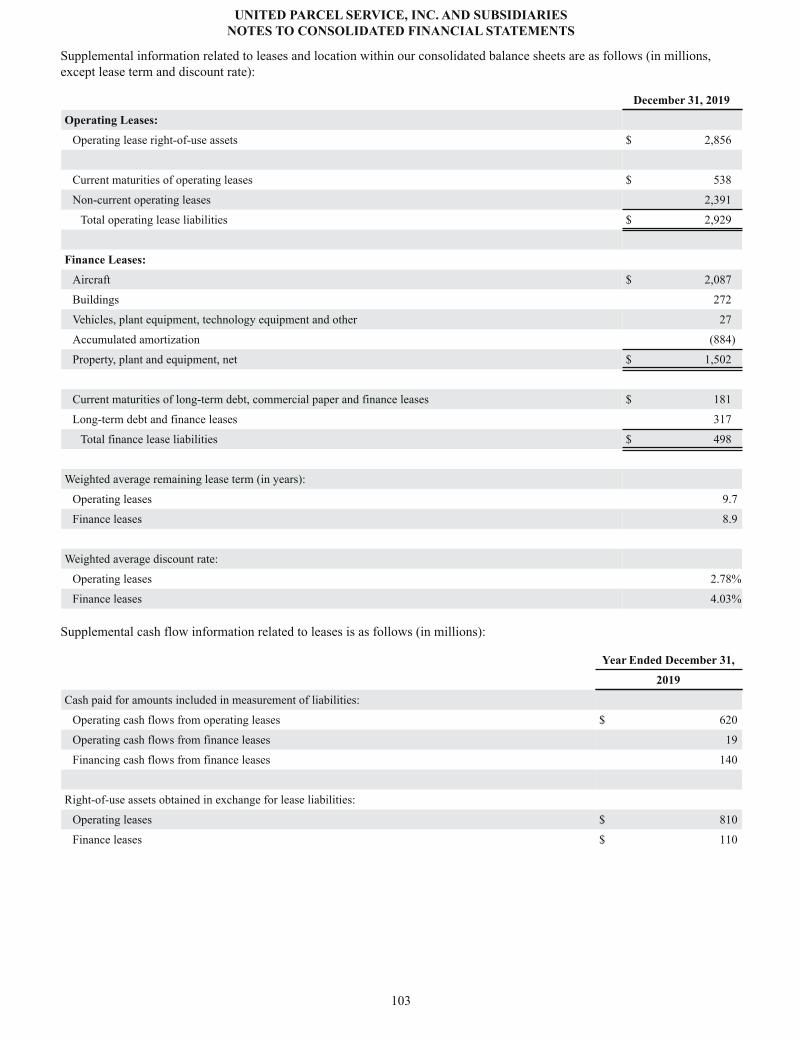
UNITED PARCEL SERVICE, INC. AND SUBSIDIARIESNOTES TO CONSOLIDATED FINANCIAL STATEMENTS
103
Supplemental information related to leases and location within our consolidated balance sheets are as follows (in millions, except lease term and discount rate):
December 31, 2019
Operating Leases:
Operating lease right-of-use assets $ 2,856
Current maturities of operating leases $ 538
Non-current operating leases 2,391
Total operating lease liabilities $ 2,929
Finance Leases:
Aircraft $ 2,087
Buildings 272
Vehicles, plant equipment, technology equipment and other 27
Accumulated amortization (884)
Property, plant and equipment, net $ 1,502
Current maturities of long-term debt, commercial paper and finance leases $ 181
Long-term debt and finance leases 317
Total finance lease liabilities $ 498
Weighted average remaining lease term (in years):
Operating leases 9.7
Finance leases 8.9
Weighted average discount rate:
Operating leases 2.78%
Finance leases 4.03%
Supplemental cash flow information related to leases is as follows (in millions):
Year Ended December 31,
2019
Cash paid for amounts included in measurement of liabilities:
Operating cash flows from operating leases $ 620
Operating cash flows from finance leases 19
Financing cash flows from finance leases 140
Right-of-use assets obtained in exchange for lease liabilities:
Operating leases $ 810
Finance leases $ 110
4545_Fin_C2.pdf 105 March 4, 2020

UNITED PARCEL SERVICE, INC. AND SUBSIDIARIESNOTES TO CONSOLIDATED FINANCIAL STATEMENTS
104
Maturities of lease liabilities as of December 31, 2019 are as follows (in millions):
Finance Leases Operating Leases
2020 $ 199 $ 619
2021 44 536
2022 39 451
2023 37 360
2024 35 256
Thereafter 259 1,267
Total lease payments 613 3,489
Less: Imputed interest (115) (560)
Total lease obligations 498 2,929
Less: Current obligations (181) (538)
Long-term lease obligations $ 317 $ 2,391
As of December 31, 2019, we have additional leases which have not commenced. These leases will commence when we are granted access to the property, such as when leasehold improvements are completed by the lessor or a certificate of occupancy is obtained. These leases will commence in 2020.
Disclosures related to periods prior to adoption of the new lease standard
Rent expense related to our operating leases was $959 and $804 million for 2018 and 2017, respectively. The following table sets forth the aggregate minimum lease payments under capital and operating leases as of December 31, 2018 (in millions):
Capital Leases Operating Leases
2019 $ 158 $ 578
2020 95 477
2021 42 399
2022 39 325
2023 36 262
After 2023 293 926
Total lease payments 663 2,967
Less: Imputed interest (129)
Total lease obligations 534
Less: Current obligations (140)
Long-term lease obligations $ 394
4545_Fin_C2.pdf 106 March 4, 2020

UNITED PARCEL SERVICE, INC. AND SUBSIDIARIESNOTES TO CONSOLIDATED FINANCIAL STATEMENTS
105
NOTE 11. SHAREOWNERS' EQUITY
Capital Stock, Additional Paid-In Capital and Retained Earnings
We maintain two classes of common stock, which are distinguished from each other by their respective voting rights. Class A shares of UPS are entitled to 10 votes per share, whereas class B shares are entitled to one vote per share. Class A shares are primarily held by UPS employees and retirees, as well as trusts and descendants of the Company’s founders, and these shares are fully convertible into class B shares at any time. Class B shares are publicly traded on the New York Stock Exchange ("NYSE") under the symbol “UPS”. Class A and B shares both have a $0.01 par value, and as of December 31, 2019, there were 4.6 billion class A shares and 5.6 billion class B shares authorized to be issued. Additionally, there are 200 million preferred shares authorized to be issued, with a par value of $0.01 per share. As of December 31, 2019, no preferred shares had been issued.
The following is a rollforward of our common stock, additional paid-in capital, retained earnings and non-controlling interests accounts for the year ended December 31, 2019, 2018 and 2017 (in millions, except per share amounts):
Year Ended December 31: 2019 2018 2017
Shares Dollars Shares Dollars Shares Dollars
Class A Common Stock:
Balance at beginning of year 163 $ 2 173 $ 2 180 $ 2
Common stock purchases (3) — (3) — (4) —
Stock award plans 5 — 3 — 4 —
Common stock issuances 3 — 4 — 3 —
Conversions of class A to class B common stock (12) — (14) — (10) —
Class A shares issued at end of year 156 $ 2 163 $ 2 173 $ 2
Class B Common Stock:
Balance at beginning of year 696 $ 7 687 $ 7 689 $ 7
Common stock purchases (7) — (5) — (12) —
Conversions of class A to class B common stock 12 — 14 — 10 —
Class B shares issued at end of year 701 $ 7 696 $ 7 687 $ 7
Additional Paid-In Capital:
Balance at beginning of year $ — $ — $ —
Stock award plans 778 419 396
Common stock purchases (1,005) (859) (813)
Common stock issuances 356 406 363
Option premiums received (paid) 21 34 54
Balance at end of year $ 150 $ — $ —
Retained Earnings:
Balance at beginning of year $ 8,006 $ 5,852 $ 4,880
Net income attributable to controlling interests 4,440 4,791 4,905
Dividends ($3.84, $3.64, and $3.32 per share) (1) (3,341) (3,189) (2,928)
Common stock purchases — (141) (1,003)Reclassification from AOCI pursuant to the earlyadoption of ASU 2018-02 — 735 —
Other — (42) (2)
Balance at end of year $ 9,105 $ 8,006 $ 5,852
Non-Controlling Interests
Balance at beginning of year $ 16 $ 30 $ 24
Change in non-controlling interests — (14) 6
Balance at end of year $ 16 $ 16 $ 30(1) The dividend per share amount is the same for both class A and class B common stock. Dividends include $147, $178 and $157 million for2019, 2018 and 2017, respectively, that were settled in shares of class A common stock.
4545_Fin_C2.pdf 107 March 4, 2020

UNITED PARCEL SERVICE, INC. AND SUBSIDIARIESNOTES TO CONSOLIDATED FINANCIAL STATEMENTS
106
In May 2016, the Board of Directors approved a share repurchase authorization of $8.0 billion for shares of class A and class B common stock, which has no expiration date. As of December 31, 2019, we had 2.334 billion of this share repurchase authorization available.
Share repurchases may be in the form of accelerated share repurchase programs, open market purchases or other such methods as we deem appropriate. The timing of share repurchases will depend upon market conditions. Unless terminated earlier by the Board, the program will expire when we have purchased all shares authorized for repurchase under the program.
For the years ended December 31, 2019, 2018 and 2017, we repurchased a total of 9.1, 8.9 and 16.1 million shares of class A and class B common stock for $1.005, $1.000 and $1.816 billion, respectively ($1.004, $1.011 and $1.813 billion in repurchases for 2019, 2018 and 2017, respectively, are reported on the cash flow statement due to the timing of settlements).
From time to time, we enter into share repurchase programs with large financial institutions to assist in our buyback of company stock. These programs may allow us to repurchase our shares at a price below the weighted average UPS share price for a given period. We did not enter into any such program during the years ended December 31, 2019, 2018 or 2017.
In order to lower the average cost of acquiring shares in our ongoing share repurchase program, we periodically enter into structured repurchase agreements involving the use of capped call options for the purchase of UPS class B shares. We pay a fixed sum of cash upon execution of each agreement in exchange for the right to receive either a pre-determined amount of cash or stock. Upon expiration of each agreement, if the closing market price of our common stock is above the pre-determined price, we will have our initial investment returned with a premium in either cash or shares (at our election). If the closing market price of our common stock is at or below the pre-determined price, we will receive the number of shares specified in the agreement. We received net premiums of $21, $34 and $54 million during the years ended December 31, 2019, 2018 and 2017, respectively, related to entering into and settling capped call options for the purchase of class B shares. As of December 31, 2019, we had no capped call options outstanding.
4545_Fin_C2.pdf 108 March 4, 2020

UNITED PARCEL SERVICE, INC. AND SUBSIDIARIESNOTES TO CONSOLIDATED FINANCIAL STATEMENTS
107
Accumulated Other Comprehensive Income (Loss)
We recognize activity in AOCI for unrealized holding gains and losses on available-for-sale securities, foreign currency translation adjustments, unrealized gains and losses from derivatives that qualify as hedges of cash flows and unrecognized pension and postretirement benefit costs. Additionally, effective January 1, 2018, we adopted an ASU that allows a reclassification from AOCI to retained earnings for stranded tax effects resulting from the Tax Act (see note 1 for further information). The activity in AOCI for the years ended December 31, 2019, 2018 and 2017 is as follows (in millions):
Year Ended December 31: 2019 2018 2017
Foreign Currency Translation Gain (Loss), Net of Tax:
Balance at beginning of year $ (1,126) $ (930) $ (1,016)
Translation adjustment (net of tax effect of $10, $37 and $(161)) 48 (149) 86
Reclassification to retained earnings pursuant to the early adoption of ASU 2018-02 — (47) —
Balance at end of year $ (1,078) $ (1,126) $ (930)
Unrealized Gain (Loss) on Marketable Securities, Net of Tax:
Balance at beginning of year $ (2) $ (2) $ (1)
Current period changes in fair value (net of tax effect of $4, $(1) and $(1)) 11 (3) (2)
Reclassification to earnings (net of tax effect of $(1), $1 and $1) (5) 3 1
Balance at end of year $ 4 $ (2) $ (2)
Unrealized Gain (Loss) on Cash Flow Hedges, Net of Tax:
Balance at beginning of year $ 40 $ (366) $ (45)
Current period changes in fair value (net of tax effect of $61, $135 and $(190)) 195 429 (316)
Reclassification to retained earnings pursuant to the early adoption of ASU 2018-02 — (79) —
Reclassification to earnings (net of tax effect of $(39), $18 and $(3)) (123) 56 (5)
Balance at end of year $ 112 $ 40 $ (366)
Unrecognized Pension and Postretirement Benefit Costs, Net of Tax:
Balance at beginning of year $ (3,906) $ (3,569) $ (3,421)
Reclassification to earnings (net of tax effect of $626, $439 and $269) 1,988 1,389 731
Reclassification to retained earnings pursuant to the early adoption of ASU 2018-02 — (609) —Net actuarial gain (loss) and prior service cost resulting from remeasurements of plan assets andliabilities (net of tax effect of $(979), $(355) and $(180)) (3,117) (1,117) (879)
Balance at end of year $ (5,035) $ (3,906) $ (3,569)
Accumulated other comprehensive income (loss) at end of year $ (5,997) $ (4,994) $ (4,867)
4545_Fin_C2.pdf 109 March 4, 2020

UNITED PARCEL SERVICE, INC. AND SUBSIDIARIESNOTES TO CONSOLIDATED FINANCIAL STATEMENTS
108
Detail of the gains (losses) reclassified from AOCI to the statements of consolidated income for the years ended December 31, 2019, 2018 and 2017 is as follows (in millions):
Year Ended December 31: Amount Reclassified from AOCIAffected Line Item in the Income
Statement2019 2018 2017
Unrealized Gain (Loss) on Marketable Securities:
Realized gain (loss) on sale of securities 6 (4) (2) Investment income (expense) and other
Income tax (expense) benefit (1) 1 1 Income tax expense
Impact on net income 5 (3) (1) Net income
Unrealized Gain (Loss) on Cash Flow Hedges:
Interest rate contracts (15) (24) (27) Interest expense
Foreign exchange contracts 177 (50) 35 Revenue
Income tax (expense) benefit (39) 18 (3) Income tax expense
Impact on net income 123 (56) 5 Net income
Unrecognized Pension and Postretirement Benefit Costs:
Prior service costs (227) (201) (200) Investment income (expense) and other
Remeasurement of benefit obligation (2,387) (1,627) (800) Investment income (expense) and other
Income tax (expense) benefit 626 439 269 Income tax expense
Impact on net income (1,988) (1,389) (731) Net income
Total amount reclassified for the year $ (1,860) $ (1,448) $ (727) Net income
Deferred Compensation Obligations and Treasury Stock
We maintain a deferred compensation plan whereby certain employees were previously able to elect to defer the gains on stock option exercises by deferring the shares received upon exercise into a rabbi trust. The shares held in this trust are classified as treasury stock, and the liability to participating employees is classified as “Deferred compensation obligations” in the shareowners’ equity section of the consolidated balance sheets. The number of shares needed to settle the liability for deferred compensation obligations is included in the denominator in both the basic and diluted earnings per share calculations. Employees are generally no longer able to defer the gains from stock options exercised subsequent to December 31, 2004.
Activity in the deferred compensation program for the years ended December 31, 2019, 2018 and 2017 is as follows (in millions):
Year Ended December 31: 2019 2018 2017
Shares Dollars Shares Dollars Shares Dollars
Deferred Compensation Obligations:
Balance at beginning of year $ 32 $ 37 $ 45
Reinvested dividends 2 2 2
Benefit payments (8) (7) (10)
Balance at end of year $ 26 $ 32 $ 37
Treasury Stock:
Balance at beginning of year (1) $ (32) (1) $ (37) (1) $ (45)
Reinvested dividends — (2) — (2) — (2)
Benefit payments 1 8 — 7 — 10
Balance at end of year — $ (26) (1) $ (32) (1) $ (37)
4545_Fin_C2.pdf 110 March 4, 2020

UNITED PARCEL SERVICE, INC. AND SUBSIDIARIESNOTES TO CONSOLIDATED FINANCIAL STATEMENTS
109
NOTE 12. STOCK - BASED COMPENSATION
The UPS Incentive Compensation Plan permits the grant of non-qualified and incentive stock options, stock appreciation rights, restricted stock and stock units, and restricted performance shares and units to eligible employees. On May 14, 2018 our shareholders approved our 2018 Omnibus Incentive Compensation Plan under which we are authorized to issue an additional 26 million shares. Each share issued in the form of restricted stock units and restricted performance units (collectively referred to as "Restricted Units"), stock options and other permitted awards reduces the share reserve by one share. We had 13 million shares available to be issued under the Incentive Compensation Plan as of December 31, 2019.
The primary compensation programs offered under the UPS Incentive Compensation Plan include the UPS Management Incentive Award program, the Coyote Restricted Stock Award, the UPS Long-Term Incentive Performance Award program and the UPS Stock Option program. These awards are discussed in the following paragraphs. The total expense recognized in our income statement under all stock compensation award programs was $915, $634 and $584 million during 2019, 2018 and 2017, respectively. The associated income tax benefit recognized in our statements of consolidated income was $216, $186 and $227 million during 2019, 2018 and 2017, respectively. The cash income tax benefit received from the exercise of stock options and the lapsing of Restricted Units was $148, $175 and $276 million during 2019, 2018 and 2017, respectively.
Management Incentive Award Program ("MIP")
Non-executive management earning the right to receive MIP awards is determined annually by the Salary Committee, which is comprised of executive officers of UPS. Awards granted to executive officers are determined annually by the Compensation Committee of the UPS Board of Directors. Our MIP provides, with certain exceptions, that one-half to two-thirds of the annual award will be made in Restricted Units, depending upon the level of management involved. The remaining one-third to one-half of the award is electable in the form of cash or unrestricted shares of class A common stock, and is fully vested at the time of grant.
Upon vesting, Restricted Units result in the issuance of the equivalent number of UPS class A common shares after required tax withholdings. Except in the case of death, Restricted Units granted under the MIP prior to 2019 vest over a five-year period with approximately 20% of the award vesting at each anniversary date of the grant. The grant value, less estimated forfeitures, is expensed on a straight-line basis over the requisite service period, except in the case of death, disability or retirement, in which case immediate expensing occurs. These historical awards will continue to vest through 2023.
Beginning with the MIP award in the first quarter of 2019, Restricted Units vest one year following the grant date, except in the case of death, disability or retirement, in which case immediate vesting occurs. The grant value, less estimated forfeitures, is expensed on a straight-line basis over the requisite service period, except in the case of death, disability or retirement, in which case immediate expensing occurs. All Restricted Units granted are subject to early cancellation or vesting under certain conditions. Dividends earned on Restricted Units are reinvested in additional Restricted Units at each dividend payable date until they have fully vested.
Coyote Restricted Stock Award
In August 2015 we acquired Coyote, a U.S.-based truckload brokerage company. During the third quarter of 2015, we granted Restricted Units to eligible Coyote management employees. The vesting of Restricted Units granted under this award varied between one and four years with an equal number of restricted units vesting at each anniversary date, except in the case of death or disability, in which case immediate vesting occurred. The entire grant was expensed on a straight-line basis over the requisite service period, except in the case of death or disability, in which case immediate expensing occurred. All Restricted Units granted under this award had vested as of December 31, 2019.
4545_Fin_C2.pdf 111 March 4, 2020

UNITED PARCEL SERVICE, INC. AND SUBSIDIARIESNOTES TO CONSOLIDATED FINANCIAL STATEMENTS
110
As of December 31, 2019, we had the following outstanding Restricted Units, including reinvested dividends, granted under the MIP:
Shares(in thousands)
Weighted-AverageGrant DateFair Value
Weighted-Average Remaining
Contractual Term(in years)
Aggregate IntrinsicValue
(in millions)
Nonvested at January 1, 2019 10,139 $ 104.47
Vested (5,100) 102.54
Granted 5,516 108.78
Reinvested Dividends 410 N/A
Forfeited / Expired (226) 107.22
Nonvested at December 31, 2019 10,739 $ 106.94 0.71 $ 1,257
Restricted Units Expected to Vest 12,690 $ 106.59 0.74 $ 1,485
The fair value of each Restricted Unit is the NYSE closing price of class B common stock on the date of grant. The weighted-average grant date fair value of Restricted Units granted during 2019, 2018 and 2017 was $108.78, $110.95 and $105.62, respectively. The total fair value of Restricted Units vested was $457, $596 and $534 million in 2019, 2018 and 2017, respectively. As of December 31, 2019, there was $341 million of total unrecognized compensation cost related to nonvested Restricted Units. That cost is expected to be recognized over a weighted-average period of two years and one month.
Long-Term Incentive Performance ("LTIP") Program
We award Restricted Units in conjunction with our LTIP program to certain eligible employees. Performance targets are equally-weighted among consolidated operating return on invested capital, growth in currency-constant consolidated revenue and total shareowner return relative to a peer group of companies ("RTSR"). The Restricted Units granted under this award vest at the end of a three-year period, except in the case of death, disability or retirement, in which case immediate vesting occurs on a prorated basis. The number of Restricted Units earned will be based on the percentage achievement of the performance targets set forth on the grant date. The range of percentage achievement can vary from 0% to 200% of the target award.
For the two-thirds of the award related to consolidated operating return on invested capital and growth in currency-constant consolidated revenue, we recognize the grant date fair value of these units, less estimated forfeitures, as compensation expense ratably over the vesting period, based on the number of awards expected to be earned. The remaining one-third of the award related to RTSR is valued using a Monte Carlo model. This portion of the award, less estimated forfeitures, is recognized as compensation expense ratably over the vesting period.
The weighted-average assumptions used by year, and the calculated weighted-average fair values of the RTSR portion of the grants, are as follows:
2019 2018 2017
Risk-free interest rate 2.23% 2.61% 1.46%
Expected volatility 19.64% 16.51% 16.59%
Weighted-average fair value of units granted $ 123.44 $ 137.57 $ 119.29
Share payout 115.04% 123.47% 113.55%
There is no expected dividend yield as units earn dividend equivalents.
4545_Fin_C2.pdf 112 March 4, 2020

UNITED PARCEL SERVICE, INC. AND SUBSIDIARIESNOTES TO CONSOLIDATED FINANCIAL STATEMENTS
111
As of December 31, 2019, we had the following Restricted Units outstanding, including reinvested dividends, that were granted under our LTIP program:
Shares(in thousands)
Weighted-AverageGrant DateFair Value
Weighted-AverageRemaining
Contractual Term(in years)
Aggregate IntrinsicValue
(in millions)
Nonvested at January 1, 2019 1,701 $ 108.63
Vested (898) 106.12
Granted 974 107.30
Reinvested Dividends 83 N/A
Forfeited / Expired (169) 108.60
Nonvested at December 31, 2019 1,691 $ 109.18 1.54 $ 198
Restricted Units Expected to Vest 1,677 $ 109.16 1.55 $ 196
The fair value of each Restricted Unit is the NYSE closing price of class B common stock on the date of grant. The weighted-average grant date fair value of Restricted Units granted during 2019, 2018 and 2017 was $107.30, $111.42 and $105.65, respectively. The total fair value of Restricted Units vested was $71, $97 and $71 million in 2019, 2018 and 2017, respectively. As of December 31, 2019, there was $103 million of total unrecognized compensation cost related to nonvested Restricted Units. That cost is expected to be recognized over a weighted-average period of one year and eight months.
Non-qualified Stock Options
We maintain stock option plans, under which options are granted to purchase shares of UPS class A common stock. Stock options granted in connection with the UPS Incentive Compensation Plan must have an exercise price at least equal to the NYSE closing price of UPS class B common stock on the date the option is granted.
Executive officers and certain senior managers receive a non-qualified stock option grant annually, in which the value granted is determined as a percentage of salary. Options granted generally vest over a five-year period with approximately 20% of the award vesting at each anniversary date of the grant. All options granted are subject to earlier cancellation or vesting under certain conditions. The options granted will expire ten years after the date of the grant. Option holders may exercise their options via the payment of cash or class A common stock and new class A shares are issued upon exercise.
The following is an analysis of options to purchase shares of class A common stock issued and outstanding:
Shares(in thousands)
Weighted-AverageExercise
Price
Weighted-AverageRemaining
Contractual Term(in years)
Aggregate IntrinsicValue
(in millions)
Outstanding at January 1, 2019 1,384 $ 95.36
Exercised (147) 69.33
Granted 261 111.68
Forfeited / Expired — —
Outstanding at December 31, 2019 1,498 $ 100.74 6.37 $ 24
Options Vested and Expected to Vest 1,498 $ 100.74 6.37 $ 24
Exercisable at December 31, 2019 915 $ 96.12 5.25 $ 19
The fair value of each option grant is estimated using the Black-Scholes option pricing model. The weighted-average assumptions used, by year, and the calculated weighted-average fair values of options, are as follows:
2019 2018 2017Expected dividend yield 2.94% 2.93% 2.89%Risk-free interest rate 2.60% 2.84% 2.15%Expected life in years 7.5 7.5 7.5Expected volatility 17.79% 16.72% 17.81%Weighted-average fair value of options granted $ 16.34 $ 15.23 $ 14.70
4545_Fin_C2.pdf 113 March 4, 2020

UNITED PARCEL SERVICE, INC. AND SUBSIDIARIESNOTES TO CONSOLIDATED FINANCIAL STATEMENTS
112
Expected volatilities are based on the historical returns on our stock and the implied volatility of our publicly-traded options. The expected dividend yield is based on the recent historical dividend yields for our stock, taking into account changes in dividend policy. The risk-free interest rate is based on the term structure of interest rates at the time of the option grant. The expected life represents an estimate of the period of time options are expected to remain outstanding, and we have relied upon a combination of the observed exercise behavior of our prior grants with similar characteristics, the vesting schedule of the grants and an index of peer companies with similar grant characteristics in estimating this variable.
We received cash of $7, $12 and $41 million during 2019, 2018 and 2017, respectively, from option holders resulting from the exercise of stock options. The total intrinsic value of options exercised during 2019, 2018 and 2017 was $5, $6 and $22 million, respectively. As of December 31, 2019, there was $2 million of total unrecognized compensation cost related to nonvested options. That cost is expected to be recognized over a weighted-average period of three years and five months.
The following table summarizes information about stock options outstanding and exercisable at December 31, 2019:
Options Outstanding Options Exercisable
Exercise Price RangeShares
(in thousands)
Weighted-AverageRemaining
Contractual Term(in years)
Weighted-AverageExercise
PriceShares
(in thousands)
Weighted-AverageExercise
Price
$65.01 - $80.00 157 1.52 $ 74.06 157 $ 74.06
$80.01 - $95.00 100 3.17 82.89 100 82.89
$95.01 - $110.00 985 6.75 103.93 635 103.09
$110.01 - $125.00 256 9.13 111.80 23 111.80
1,498 6.37 $ 100.74 915 $ 96.12
Discounted Employee Stock Purchase Plan
We maintain an employee stock purchase plan for all eligible employees. Under this plan, shares of UPS class A common stock may be purchased at quarterly intervals at 95% of the NYSE closing price of UPS class B common stock on the last day of each quarterly period. Employees purchased 1, 0.9 and 0.9 million shares at average prices of $102.11, $105.53 and $108.98 per share, during 2019, 2018 and 2017, respectively. This plan is not considered to be compensatory, and therefore no compensation cost is measured for the employees’ purchase rights.
4545_Fin_C2.pdf 114 March 4, 2020

UNITED PARCEL SERVICE, INC. AND SUBSIDIARIESNOTES TO CONSOLIDATED FINANCIAL STATEMENTS
113
NOTE 13. SEGMENT AND GEOGRAPHIC INFORMATION
We report our operations in three segments: U.S. Domestic Package operations, International Package operations and Supply Chain & Freight operations. Package operations represent our most significant business and are broken down into regional operations around the world. Regional operations managers are responsible for both domestic and export products within their geographic area.
U.S. Domestic Package
Domestic Package operations include the time-definite delivery of letters, documents and packages throughout the United States.
International Package
International Package operations include delivery to more than 220 countries and territories worldwide, including shipments wholly outside the United States, as well as shipments with either origin or destination outside the United States. Our International Package reporting segment includes the operations of our Europe, Asia, Americas and ISMEA operating segments.
Supply Chain & Freight
Supply Chain & Freight includes our Forwarding, Logistics, Coyote, Marken, UPS Mail Innovations, UPS Freight and other aggregated business units. Our Forwarding, Logistics and UPS Mail Innovations units provide services in more than 200 countries and territories worldwide and include international air and ocean freight forwarding, customs brokerage, distribution and post-sales services, mail and consulting services. UPS Freight offers a variety of less-than-truckload and truckload services to customers in North America. Coyote offers truckload brokerage services primarily in the United States. Marken is a global provider of supply chain solutions to the healthcare and life sciences industry. Other aggregated business units within this segment include The UPS Store and UPS Capital.
In evaluating financial performance, we focus on operating profit as a segment’s measure of profit or loss. Operating profit is before investment income (expense) and other, interest expense and income taxes. The accounting policies of the segments are the same as those described in the "Supplemental Information - Items Affecting Comparability" section of Management's Discussion and Analysis, with certain expenses allocated between the segments using activity-based costing methods. As we operate an integrated, global multimodal network, we evaluate many of our capital expenditure decisions at a network level. Accordingly, expenditures on property, plant and equipment by segment are not presented. Unallocated assets are comprised primarily of cash, marketable securities and certain investment partnerships. In 2018, we changed the segment allocation methodology for certain shared assets. All prior periods have been recast to reflect this change in methodology.
4545_Fin_C2.pdf 115 March 4, 2020
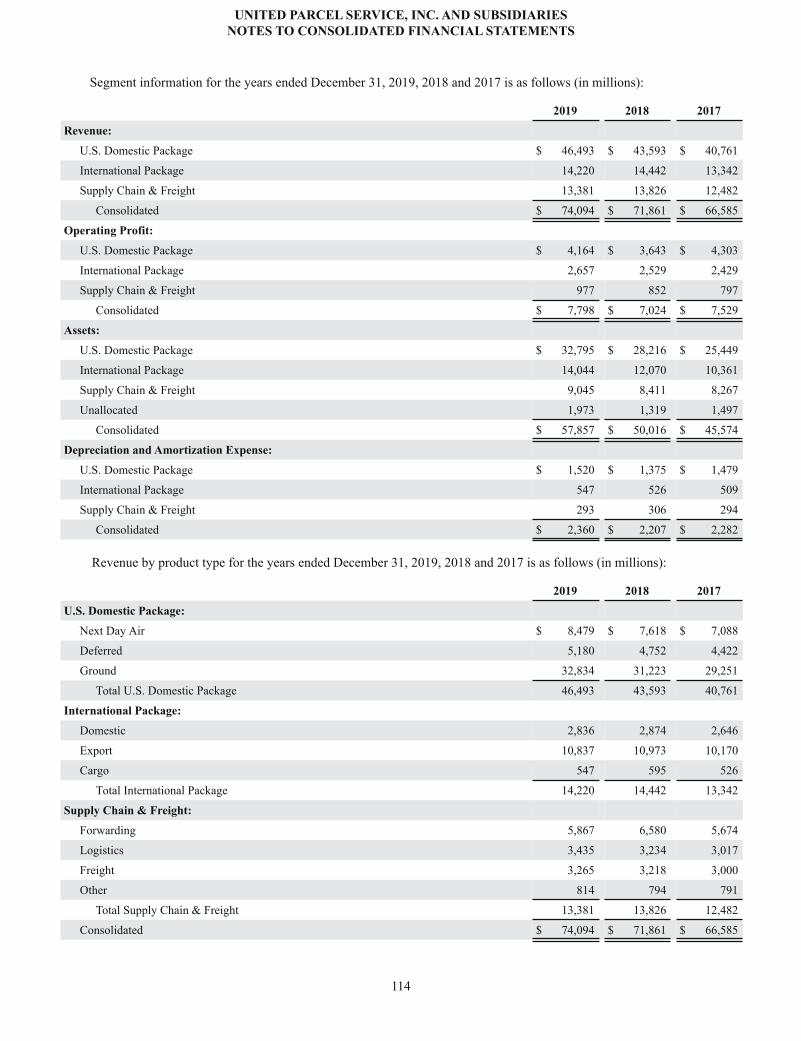
UNITED PARCEL SERVICE, INC. AND SUBSIDIARIESNOTES TO CONSOLIDATED FINANCIAL STATEMENTS
114
Segment information for the years ended December 31, 2019, 2018 and 2017 is as follows (in millions):
2019 2018 2017
Revenue:
U.S. Domestic Package $ 46,493 $ 43,593 $ 40,761
International Package 14,220 14,442 13,342
Supply Chain & Freight 13,381 13,826 12,482
Consolidated $ 74,094 $ 71,861 $ 66,585
Operating Profit:
U.S. Domestic Package $ 4,164 $ 3,643 $ 4,303
International Package 2,657 2,529 2,429
Supply Chain & Freight 977 852 797
Consolidated $ 7,798 $ 7,024 $ 7,529
Assets:
U.S. Domestic Package $ 32,795 $ 28,216 $ 25,449
International Package 14,044 12,070 10,361
Supply Chain & Freight 9,045 8,411 8,267
Unallocated 1,973 1,319 1,497
Consolidated $ 57,857 $ 50,016 $ 45,574
Depreciation and Amortization Expense:
U.S. Domestic Package $ 1,520 $ 1,375 $ 1,479
International Package 547 526 509
Supply Chain & Freight 293 306 294
Consolidated $ 2,360 $ 2,207 $ 2,282
Revenue by product type for the years ended December 31, 2019, 2018 and 2017 is as follows (in millions):
2019 2018 2017
U.S. Domestic Package:
Next Day Air $ 8,479 $ 7,618 $ 7,088
Deferred 5,180 4,752 4,422
Ground 32,834 31,223 29,251
Total U.S. Domestic Package 46,493 43,593 40,761
International Package:
Domestic 2,836 2,874 2,646
Export 10,837 10,973 10,170
Cargo 547 595 526
Total International Package 14,220 14,442 13,342
Supply Chain & Freight:
Forwarding 5,867 6,580 5,674
Logistics 3,435 3,234 3,017
Freight 3,265 3,218 3,000
Other 814 794 791
Total Supply Chain & Freight 13,381 13,826 12,482
Consolidated $ 74,094 $ 71,861 $ 66,585
4545_Fin_C2.pdf 116 March 4, 2020

UNITED PARCEL SERVICE, INC. AND SUBSIDIARIESNOTES TO CONSOLIDATED FINANCIAL STATEMENTS
115
Geographic information for the years ended December 31, 2019, 2018 and 2017 is as follows (in millions):
2019 2018 2017
United States:
Revenue $ 58,699 $ 56,115 $ 52,080
Long-lived assets $ 27,976 $ 24,918 $ 21,141
International:
Revenue $ 15,395 $ 15,746 $ 14,505
Long-lived assets $ 9,567 $ 8,577 $ 7,966
Consolidated:
Revenue $ 74,094 $ 71,861 $ 66,585
Long-lived assets $ 37,543 $ 33,495 $ 29,107
Long-lived assets include property, plant and equipment, pension and postretirement benefit assets, long-term investments, goodwill and intangible assets.
No countries outside of the United States provided 10% or more of consolidated revenue for the years ended December 31, 2019, 2018 or 2017. For the year ended December 31, 2019, Amazon.com, Inc. and its affiliates ("Amazon") represented 11.6% of our consolidated revenues. Substantially all of this revenue was attributed to our U.S. Domestic Package segment. As of December 31, 2019, Amazon accounted for approximately 16.9% of accounts receivable, net, included within the consolidated balance sheets. No single customer represented 10% or more of our consolidated revenues for the years ended December 31, 2018 or 2017.
4545_Fin_C2.pdf 117 March 4, 2020

UNITED PARCEL SERVICE, INC. AND SUBSIDIARIESNOTES TO CONSOLIDATED FINANCIAL STATEMENTS
116
NOTE 14. INCOME TAXES
The income tax expense (benefit) for the years ended December 31, 2019, 2018 and 2017 consists of the following (in millions):
2019 2018 2017Current:
U.S. Federal $ 570 $ 89 $ 671U.S. State and Local 183 7 49Non-U.S. 359 374 288
Total Current 1,112 470 1,008Deferred:
U.S. Federal 255 668 1,115U.S. State and Local (93) 75 118Non-U.S. (62) 15 (9)
Total Deferred 100 758 1,224Total Income Tax Expense $ 1,212 $ 1,228 $ 2,232
Income before income taxes includes the following components (in millions):
2019 2018 2017
United States $ 3,972 $ 4,307 $ 5,987
Non-U.S. 1,680 1,712 1,150
Total Income Before Income Taxes: $ 5,652 $ 6,019 $ 7,137
A reconciliation of the statutory federal income tax rate to the effective income tax rate for the years ended December 31, 2019, 2018 and 2017 consists of the following:
2019 2018 2017
Statutory U.S. federal income tax rate 21.0% 21.0% 35.0%
U.S. state and local income taxes (net of federal benefit) 1.4 1.4 1.5
Non-U.S. tax rate differential 0.3 0.2 (2.0)
U.S. federal tax credits (1.4) (1.1) (1.8)
Income tax benefit from the Tax Cuts and Jobs Act and other non-U.S. tax law changes — — (3.6)
Defined benefit plans mark-to-market charge tax rate differential (1) — — 1.5
Non-U.S. valuation allowance release (1.2) — —
Other 1.3 (1.1) 0.7
Effective income tax rate 21.4% 20.4% 31.3%
(1) Impact of applying Tax Act corporate rate enacted of 21% versus 35%
Our effective tax rate is affected by recurring factors, such as statutory tax rates in the jurisdictions in which we operate and the relative amounts of taxable income we earn in those jurisdictions. It is also affected by discrete items that may occur in any given year, but may not be consistent from year to year.
Our effective tax rate was 21.4% in 2019, compared with 20.4% in 2018 and 31.3% in 2017, primarily due to the effects of the aforementioned recurring factors and the following discrete tax items.
4545_Fin_C2.pdf 118 March 4, 2020

UNITED PARCEL SERVICE, INC. AND SUBSIDIARIESNOTES TO CONSOLIDATED FINANCIAL STATEMENTS
117
Tax Cuts and Jobs Act
On December 22, 2017, the United States enacted into law the Tax Act. The Tax Act made broad and complex changes to the U.S. tax code, including a permanent corporate rate reduction to 21% and a transition to a territorial international system effective in 2018. The Tax Act includes provisions that affected 2017, including: (1) requiring a one-time transition tax on certain unrepatriated earnings of foreign subsidiaries (“Transition Tax”) that is payable over eight years; (2) requiring a remeasurement of all U.S. deferred tax assets and liabilities to the newly enacted corporate tax rate of 21% and (3) providing for additional first-year depreciation that allows full expensing of qualified property placed into service after September 27, 2017.
In late December 2017, the SEC staff issued Staff Accounting Bulletin ("SAB") 118, which provided guidance on accounting for the tax effects of the Tax Act. SAB 118 provided a measurement period up to one year from the Tax Act enactment date for companies to complete the related accounting under GAAP. We recorded a $272 million provisional benefit inclusive of our Transition Tax liability, the change in our indefinite reinvestment assertion for certain foreign subsidiaries and the remeasurement of our U.S. net deferred tax liabilities for the year ended December 31, 2017. During the fourth quarter of 2018, we completed our accounting for the Tax Act based on the current regulatory guidance available at the end of the SAB 118 measurement period and recorded no material net adjustments to our provisional estimate.
The Tax Act also enacted provisions that took effect in 2018 including but not limited to: (1) a provision that imposes U.S. tax on certain foreign subsidiary income known as GILTI, (2) a new deduction for Foreign-Derived Intangible Income ("FDII"), (3) additional limitations on tax deductions for expenses such as interest and executive compensation and (4) a new minimum tax based on certain payments from a U.S. company to foreign related parties known as the Base Erosion and Anti-Abuse Tax ("BEAT").
We included the impact of each of the newly effective Tax Act provisions in our computation of the 2018 and 2019 income tax expense. Throughout 2018 and 2019, the U.S. Department of the Treasury and IRS issued regulatory guidance clarifying certain provisions of the Tax Act, and we anticipate additional regulatory guidance and technical clarifications during future years. When additional guidance is issued, we will recognize the related tax impact in the quarter of enactment.
2019 Discrete Items
In the fourth quarter of 2019, we recognized an income tax benefit of $571 million related to pre-tax mark-to-market losses of $2.387 billion on our pension and postretirement defined benefit plans. This income tax benefit was generated at a higher average tax rate than the 2019 U.S. federal statutory tax rate because it included the effect of U.S. state and local and foreign taxes.
We recorded pre-tax transformation strategy costs of $255 million during the year ended December 31, 2019. As a result, we recorded an additional income tax benefit of $59 million. This income tax benefit was generated at a higher average tax rate than the 2019 U.S. federal statutory tax rate due to the effect of U.S. state and local and foreign taxes.
As discussed in note 9, $97 million of legal contingencies and expenses were accrued during 2019 in respect of certain legal proceedings for which we recorded an additional income tax benefit of $6 million. This income tax benefit was generated at a lower average tax rate than the U.S. federal statutory tax rate due to the portion of the accrual related to penalties, which are not deductible for tax purposes.
As of December 31, 2018, we maintained a valuation allowance against certain deferred tax assets, primarily related to foreign net operating loss carryforwards. As of each reporting date, we consider new evidence, both positive and negative, that could affect the future realization of deferred tax assets. During 2019, we determined that there is sufficient positive evidence to conclude that it is more likely than not that the deferred tax assets related to certain foreign net operating loss carryforwards will be realized. This conclusion is primarily related to achieving cumulative three-year income and anticipated future earnings within the relevant jurisdiction. Accordingly, we reversed the related valuation allowance and recognized a discrete tax benefit of approximately $68 million.
Other factors that impacted our 2019 effective tax rate include favorable tax provisions enacted in the Taxpayer Certainty and Disaster Tax Relief Act of 2019.
4545_Fin_C2.pdf 119 March 4, 2020

UNITED PARCEL SERVICE, INC. AND SUBSIDIARIESNOTES TO CONSOLIDATED FINANCIAL STATEMENTS
118
2018 Discrete Items
The decrease in our effective tax rate from 2017 to 2018 was primarily due to the impact of the Tax Act which reduced the U.S. federal corporate income tax rate from 35% to 21% effective January 1, 2018.
In the fourth quarter of 2018, we recognized an income tax benefit of $390 million related to pre-tax mark-to-market losses of $1.627 billion on our pension and postretirement defined benefit plans. This income tax benefit was generated at a higher average tax rate than the 2018 U.S. federal statutory tax rate because it included the effect of U.S. state and local and foreign taxes.
We recorded pre-tax transformation strategy costs of $360 million during the year ended December 31, 2018. As a result, we recorded an additional income tax benefit of $87 million. This income tax benefit was generated at a higher average tax rate than the 2018 U.S. federal statutory tax rate due to the effect of U.S. state and local and foreign taxes.
The recognition of excess tax benefits and deficiencies related to share-based compensation in income tax expense resulted in a net tax benefit of $38 million and reduced our effective tax rate by 0.6% during the year ended December 31, 2018.
Other factors that impacted our 2018 effective tax rate include favorable resolutions of uncertain tax positions, favorable U.S. state and local tax law changes, favorable tax provisions enacted in the Bipartisan Budget Act of 2018 and discrete tax credits associated with the filing of our 2017 U.S. federal income tax return.
2017 Discrete Items
In addition to the impact of the Tax Act described above, the following discrete items were recorded during the year ended December 31, 2017.
In the fourth quarter of 2017, we recognized an income tax benefit of $193 million related to pre-tax mark-to-market losses of $800 million on our pension and postretirement defined benefit plans. This income tax benefit was generated at a lower average tax rate than the 2017 U.S. federal statutory tax rate due to future tax rate changes enacted by the Tax Act and differences between U.S. and foreign statutory rates, which was partially offset by the effect of U.S. state and local taxes.
In the fourth quarter of 2017, tax law changes were enacted in certain non-U.S. jurisdictions in which we operate. As a result, we recorded a decrease to our foreign net deferred tax assets of $14 million with a corresponding net increase to deferred tax expense of $14 million.
In the first quarter of 2017, we adopted a new accounting standard that requires the recognition of excess tax benefits related to share-based compensation in income tax expense, which resulted in tax benefits for the year ended December 31, 2017 of $71 million and reduced our effective tax rate by 1.0%.
Other Items
Beginning in 2012, we were granted a tax incentive for certain of our non-U.S. operations, which is effective through December 31, 2021. The tax incentive is conditional upon our meeting specific employment and investment thresholds. The impact of this tax incentive decreased non-U.S. tax expense by $27 million, $27 million and $24 million (increased diluted earnings per share by $0.03, $0.03 and $0.03) for 2019, 2018 and 2017, respectively.
4545_Fin_C2.pdf 120 March 4, 2020

UNITED PARCEL SERVICE, INC. AND SUBSIDIARIESNOTES TO CONSOLIDATED FINANCIAL STATEMENTS
119
Deferred income tax assets and liabilities are comprised of the following at December 31, 2019 and 2018 (in millions):
2019 2018
Fixed assets and capitalized software $ (4,720) $ (4,010)
Operating lease right-of-use assets (685) —
Other (538) (493)
Deferred tax liabilities (5,943) (4,503)
Pension and postretirement benefits 2,522 1,743
Loss and credit carryforwards 328 298
Insurance reserves 413 437
Stock compensation 249 189
Accrued employee compensation 287 274
Operating lease liabilities 691 —
Other 205 196
Deferred tax assets 4,695 3,137
Deferred tax assets valuation allowance (54) (112)
Deferred tax asset (net of valuation allowance) 4,641 3,025
Net deferred tax asset (liability) $ (1,302) $ (1,478)
Amounts recognized in the consolidated balance sheets:
Deferred tax assets $ 330 $ 141
Deferred tax liabilities (1,632) (1,619)
Net deferred tax asset (liability) $ (1,302) $ (1,478)
The valuation allowance changed by $(58), $(14) and $(33) million during the years ended December 31, 2019, 2018 and 2017, respectively.
We have a U.S. federal capital loss carryforward of $21 million as of December 31, 2019, $20 million of which expires on December 31, 2021, and the remainder of which expires on December 31, 2022. In addition, we have U.S. federal tax credit carryforwards of $3 million, which can be carried forward for periods ranging from ten years to twenty years.
Further, we have U.S. state and local operating loss and credit carryforwards as follows (in millions):
2019 2018
U.S. state and local operating loss carryforwards $ 1,374 $ 1,014
U.S. state and local credit carryforwards $ 110 $ 80
The U.S. state and local operating loss carryforwards and credits can be carried forward for periods ranging from one year to indefinitely. We also have non-U.S. loss carryforwards of $670 million as of December 31, 2019, the majority of which may be carried forward indefinitely. As indicated in the table above, we have established a valuation allowance for certain U.S. federal, state and non-U.S. carryforwards due to the uncertainty resulting from a lack of previous taxable income within the applicable tax jurisdictions and other limitations.
4545_Fin_C2.pdf 121 March 4, 2020

UNITED PARCEL SERVICE, INC. AND SUBSIDIARIESNOTES TO CONSOLIDATED FINANCIAL STATEMENTS
120
Undistributed earnings and profits ("E&P") of our foreign subsidiaries amounted to $6.060 billion at December 31, 2019. As a result of the Tax Act, during the year ended December 31, 2017, we changed our indefinite reinvestment assertion with respect to the earnings of certain foreign subsidiaries. For all other foreign subsidiaries, we continue to assert that these earnings are indefinitely reinvested. $1.597 billion of the undistributed E&P of our foreign subsidiaries is considered to be indefinitely reinvested and, accordingly, no deferred income taxes have been provided thereon. Upon distribution of those earnings in the form of dividends or otherwise, we would be subject to U.S. state and local taxes and withholding taxes payable in various jurisdictions. Determination of the amount of unrecognized deferred income tax liability is not practicable because of the complexities associated with its hypothetical calculation.
The following table summarizes the activity related to our uncertain tax positions (in millions):
Tax Interest PenaltiesBalance at January 1, 2017 $ 144 $ 50 $ 6Additions for tax positions of the current year 16 — —Additions for tax positions of prior years 33 14 3Reductions for tax positions of prior years for:
Changes based on facts and circumstances (24) (18) —Settlements during the period (6) (3) —Lapses of applicable statute of limitations (3) — —
Balance at December 31, 2017 160 43 9Additions for tax positions of the current year 47 — 1Additions for tax positions of prior years 7 10 —Reductions for tax positions of prior years for:
Changes based on facts and circumstances (43) (8) (5)Settlements during the period (1) (1) —Lapses of applicable statute of limitations (3) — —
Balance at December 31, 2018 167 44 5Additions for tax positions of the current year 6 — —Additions for tax positions of prior years 51 13 —Reductions for tax positions of prior years for:
Changes based on facts and circumstances (45) (4) (1)Settlements during the period (3) (1) —Lapses of applicable statute of limitations (4) — —
Balance at December 31, 2019 $ 172 $ 52 $ 4
The total amount of gross uncertain tax positions as of December 31, 2019, 2018 and 2017 that, if recognized, would affect the effective tax rate was $171, $165 and $159 million, respectively. Our continuing policy is to recognize interest and penalties associated with income tax matters as a component of income tax expense.
We file income tax returns in the U.S. federal jurisdiction, most U.S. state and local jurisdictions, and many non-U.S. jurisdictions. We have substantially resolved all U.S. federal income tax matters for tax years prior to 2015.
A number of years may elapse before an uncertain tax position is audited and ultimately settled. It is difficult to predict the ultimate outcome or the timing of resolution for uncertain tax positions. It is reasonably possible that the liability for uncertain tax positions could significantly increase or decrease within the next twelve months. Items that may cause changes to uncertain tax positions include the timing of interest deductions and the allocation of income and expense between tax jurisdictions. These changes could result from the settlement of ongoing litigation, the completion of ongoing examinations, the expiration of the statute of limitations, additional regulatory guidance on the Tax Act or other unforeseen circumstances. At this time, an estimate of the range of the reasonably possible change cannot be made.
4545_Fin_C2.pdf 122 March 4, 2020

UNITED PARCEL SERVICE, INC. AND SUBSIDIARIESNOTES TO CONSOLIDATED FINANCIAL STATEMENTS
121
NOTE 15. EARNINGS PER SHARE
The earnings per share amounts are the same for class A and class B common shares as the holders of each class are legally entitled to equal per share distributions whether through dividends or in liquidation.
The following table sets forth the computation of basic and diluted earnings per share (in millions, except per share amounts):
2019 2018 2017
Numerator:
Net income attributable to common shareowners $ 4,440 $ 4,791 $ 4,905
Denominator:
Weighted-average shares 859 860 865
Deferred compensation obligations — 1 1
Vested portion of restricted shares 5 5 5
Denominator for basic earnings per share 864 866 871
Effect of Dilutive Securities:
Restricted performance units 5 4 3
Stock options — — 1
Denominator for diluted earnings per share 869 870 875
Basic Earnings Per Share $ 5.14 $ 5.53 $ 5.63
Diluted Earnings Per Share $ 5.11 $ 5.51 $ 5.61
Diluted earnings per share for the years ended December 31, 2019, 2018 and 2017 exclude the effect of 0.5, 0.2 and 0.1 million shares, respectively, of common stock that may be issued upon the exercise of employee stock options because such effect would be antidilutive.
4545_Fin_C2.pdf 123 March 4, 2020

UNITED PARCEL SERVICE, INC. AND SUBSIDIARIESNOTES TO CONSOLIDATED FINANCIAL STATEMENTS
122
NOTE 16. DERIVATIVE INSTRUMENTS AND RISK MANAGEMENT
Risk Management Policies
Changes in fuel prices, interest rates and foreign currency exchange rates impact our results of operations. These exposures are actively monitored by management. To manage the impact of these exposures, we enter into a variety of derivative financial instruments. Our objective is to manage, where it is deemed appropriate to do so, fluctuations in earnings and cash flows associated with changes in foreign currency rates, commodity prices and interest rates. It is our policy and practice to use derivative financial instruments only to the extent necessary to manage exposures. As we use price sensitive instruments to hedge a certain portion of our existing and anticipated transactions, we expect that any loss in value from those instruments generally would be offset by increases in the value of those hedged transactions. We do not hold or issue derivative financial instruments for trading or speculative purposes.
Credit Risk Management
The forward contracts, swaps and options discussed below contain an element of risk that the counterparties may be unable to meet the terms of the agreements; however, we seek to minimize such risk exposures for these instruments by limiting the counterparties to banks and financial institutions that meet established credit guidelines and by monitoring counterparties to prevent concentrations of credit risk with any single counterparty.
We have agreements with all of our active counterparties (covering the majority of our derivative positions) containing early termination rights and/or zero threshold bilateral collateral provisions whereby cash is required based on the net fair value of derivatives associated with those counterparties.
At December 31, 2019 and 2018, we held cash collateral of $495 and $325 million, respectively, under these agreements; this collateral is included in "Cash and cash equivalents" on the consolidated balance sheets and its use by UPS is not restricted. At December 31, 2019 and 2018 respectively, no additional collateral was required to be posted with our counterparties.
Events such as a counterparty credit rating downgrade (depending on the ultimate rating level) could also allow us to take additional protective measures such as the early termination of trades. Alternatively, we could be required to provide additional collateral or terminate transactions with certain counterparties in the event of a downgrade of our credit rating. The amount of collateral required would be determined by the net fair value of the associated derivatives with each counterparty. We have not historically incurred, and do not expect to incur in the future, any losses as a result of counterparty default.
At December 31, 2019, there were no instruments in a net liability position that were not covered by the zero threshold bilateral collateral provisions.
Types of Hedges
Commodity Risk Management
Currently, the fuel surcharges that we apply to our domestic and international package and less-than-truckload services are the primary means of reducing the risk of adverse fuel price changes on our business. In order to mitigate the impact of fuel surcharges imposed on us by outside carriers, we regularly adjust the rates we charge for our freight brokerage, inter-modal and truckload services. We periodically enter into derivative contracts on energy commodity products to manage the price risk associated with forecasted transactions involving refined fuels, principally jet-A, diesel and unleaded gasoline. The objective of the hedges is to reduce the variability of cash flows, due to changing fuel prices, associated with the forecasted transactions involving those products. We normally designate and account for these contracts as cash flow hedges of the underlying forecasted transactions involving these fuel products and, therefore, the resulting gains and losses from these hedges are recognized as a component of fuel expense or revenue when the underlying transactions occur.
Foreign Currency Risk Management
To protect against the reduction in value of forecasted foreign currency cash flows from our international package business, we maintain a foreign currency cash flow hedging program. Our most significant foreign currency exposures relate to the Euro, British Pound Sterling, Canadian Dollar, Chinese Renminbi and Hong Kong Dollar. We hedge portions of our forecasted revenue denominated in foreign currencies with option and forward contracts. We normally designate and account for these contracts as cash flow hedges of anticipated foreign currency denominated revenue and, therefore, the resulting gains and losses from these hedges are recognized as a component of international package revenue when the underlying sales transactions occur.
4545_Fin_C2.pdf 124 March 4, 2020
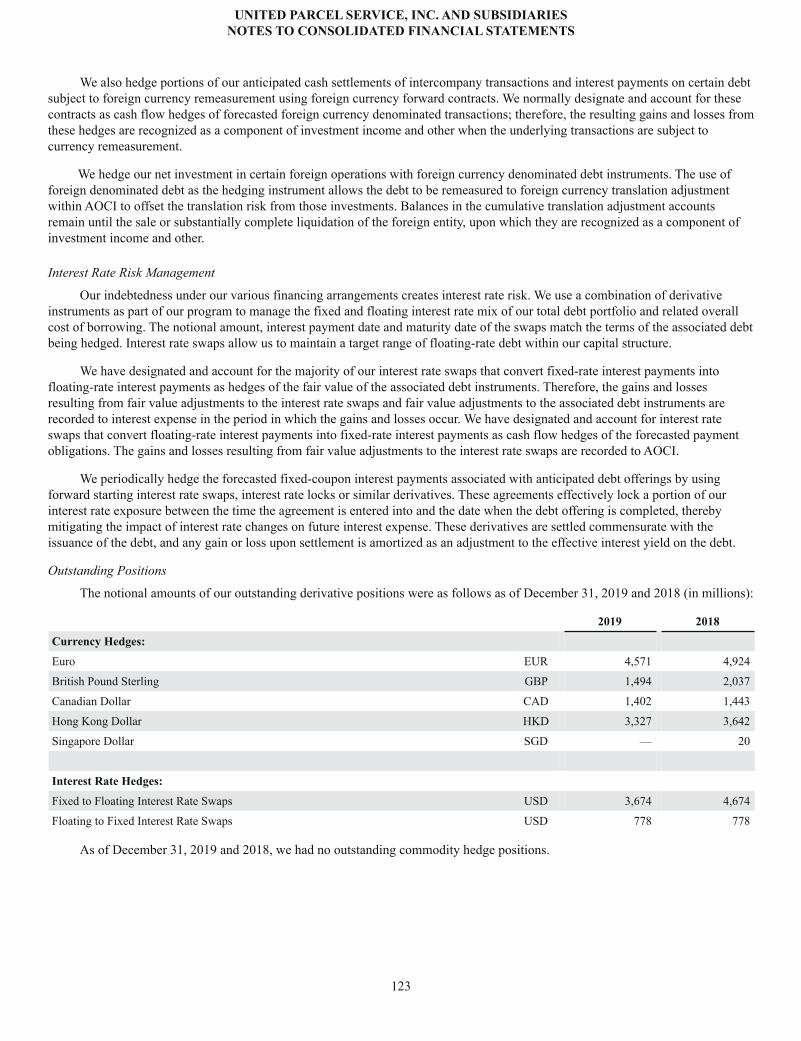
UNITED PARCEL SERVICE, INC. AND SUBSIDIARIESNOTES TO CONSOLIDATED FINANCIAL STATEMENTS
123
We also hedge portions of our anticipated cash settlements of intercompany transactions and interest payments on certain debt subject to foreign currency remeasurement using foreign currency forward contracts. We normally designate and account for these contracts as cash flow hedges of forecasted foreign currency denominated transactions; therefore, the resulting gains and losses from these hedges are recognized as a component of investment income and other when the underlying transactions are subject to currency remeasurement.
We hedge our net investment in certain foreign operations with foreign currency denominated debt instruments. The use of foreign denominated debt as the hedging instrument allows the debt to be remeasured to foreign currency translation adjustment within AOCI to offset the translation risk from those investments. Balances in the cumulative translation adjustment accounts remain until the sale or substantially complete liquidation of the foreign entity, upon which they are recognized as a component of investment income and other.
Interest Rate Risk Management
Our indebtedness under our various financing arrangements creates interest rate risk. We use a combination of derivative instruments as part of our program to manage the fixed and floating interest rate mix of our total debt portfolio and related overall cost of borrowing. The notional amount, interest payment date and maturity date of the swaps match the terms of the associated debt being hedged. Interest rate swaps allow us to maintain a target range of floating-rate debt within our capital structure.
We have designated and account for the majority of our interest rate swaps that convert fixed-rate interest payments into floating-rate interest payments as hedges of the fair value of the associated debt instruments. Therefore, the gains and losses resulting from fair value adjustments to the interest rate swaps and fair value adjustments to the associated debt instruments are recorded to interest expense in the period in which the gains and losses occur. We have designated and account for interest rate swaps that convert floating-rate interest payments into fixed-rate interest payments as cash flow hedges of the forecasted payment obligations. The gains and losses resulting from fair value adjustments to the interest rate swaps are recorded to AOCI.
We periodically hedge the forecasted fixed-coupon interest payments associated with anticipated debt offerings by using forward starting interest rate swaps, interest rate locks or similar derivatives. These agreements effectively lock a portion of our interest rate exposure between the time the agreement is entered into and the date when the debt offering is completed, thereby mitigating the impact of interest rate changes on future interest expense. These derivatives are settled commensurate with the issuance of the debt, and any gain or loss upon settlement is amortized as an adjustment to the effective interest yield on the debt.
Outstanding Positions
The notional amounts of our outstanding derivative positions were as follows as of December 31, 2019 and 2018 (in millions):
2019 2018
Currency Hedges:
Euro EUR 4,571 4,924
British Pound Sterling GBP 1,494 2,037
Canadian Dollar CAD 1,402 1,443
Hong Kong Dollar HKD 3,327 3,642
Singapore Dollar SGD — 20
Interest Rate Hedges:
Fixed to Floating Interest Rate Swaps USD 3,674 4,674
Floating to Fixed Interest Rate Swaps USD 778 778
As of December 31, 2019 and 2018, we had no outstanding commodity hedge positions.
4545_Fin_C2.pdf 125 March 4, 2020

UNITED PARCEL SERVICE, INC. AND SUBSIDIARIESNOTES TO CONSOLIDATED FINANCIAL STATEMENTS
124
Balance Sheet Recognition
The following table indicates the location in the consolidated balance sheets where our derivative assets and liabilities have been recognized, the fair value hierarchy level applicable to each derivative type and the related fair values of those derivatives (in millions).
We have master netting arrangements with substantially all of our counterparties giving us the right of offset for our derivative positions. However, we have not elected to offset the fair value positions of our derivative contracts recorded in the consolidated balance sheets. The columns labeled "Net Amounts if Right of Offset had been Applied" indicate the potential net fair value positions by type of contract and location in the consolidated balance sheets had we elected to apply the right of offset.
Gross Amounts Presented inConsolidated Balance Sheets
Net Amounts if Right ofOffset had been Applied
Asset DerivativesBalance Sheet
LocationFair Value
Hierarchy Level 2019 2018 2019 2018Derivatives designated ashedges:Foreign exchange contracts Other current assets Level 2 $ 138 $ 90 $ 131 $ 83
Interest rate contracts Other current assets Level 2 2 1 2 1
Foreign exchange contracts Other non-current assets Level 2 252 230 236 215
Interest rate contracts Other non-current assets Level 2 21 14 20 6Derivatives not designatedas hedges:Foreign exchange contracts Other current assets Level 2 7 7 7 5
Foreign exchange contracts Other non-current assets Level 2 — 1 — 1
Interest rate contracts Other non-current assets Level 2 12 18 11 18
Total Asset Derivatives $ 432 $ 361 $ 407 $ 329
Gross Amounts Presented inConsolidated Balance Sheets
Net Amounts if Right ofOffset had been Applied
Liability DerivativesBalance Sheet
LocationFair Value
Hierarchy Level 2019 2018 2019 2018Derivatives designated ashedges:Foreign exchange contracts Other current liabilities Level 2 $ 7 $ 7 $ — $ —
Foreign exchange contractsOther non-current
liabilities Level 2 16 15 — —
Interest rate contractsOther non-current
liabilities Level 2 11 41 10 33Derivatives not designatedas hedges:Foreign exchange contracts Other current liabilities Level 2 — 3 — 1
Foreign exchange contractsOther non-current
liabilities Level 2 — 1 — 1
Interest rate contractsOther non-current
liabilities Level 2 3 — 2 —Total LiabilityDerivatives $ 37 $ 67 $ 12 $ 35
Our foreign exchange, interest rate and investment market price derivatives are largely comprised of over-the-counter derivatives, which are primarily valued using pricing models that rely on market observable inputs such as yield curves, currency exchange rates and investment forward prices; therefore, these derivatives are classified as Level 2. At December 31, 2019 and 2018 we did not have any derivatives that were classified as Level 1 (valued using quoted prices in active markets for identical assets) or Level 3 (valued using significant unobservable inputs).
4545_Fin_C2.pdf 126 March 4, 2020

UNITED PARCEL SERVICE, INC. AND SUBSIDIARIESNOTES TO CONSOLIDATED FINANCIAL STATEMENTS
125
Balance Sheet Location of Hedged Item in Fair Value Hedges
The following table indicates the amounts that were recorded in the consolidated balance sheets related to cumulative basis adjustments for fair value hedges as of December 31, 2019 and December 31, 2018 (in millions).
Carrying Amountof HedgedLiabilities
CumulativeAmount of Fair
Value HedgeAdjustments
Carrying Amountof HedgedLiabilities
CumulativeAmount of Fair
Value HedgeAdjustments
Line Item in the Consolidated Balance Sheets in Which the Hedged Item is Included December 31, 2019 December 31, 2019 December 31, 2018 December 31, 2018
Long-Term Debt and Finance Leases 3,234 40 4,207 16
The cumulative amount of fair value hedging losses remaining for any hedged assets and liabilities for which hedge accounting has been discontinued as of December 31, 2019 is $17 million. These amounts will be recognized over the next 11 years.
Income Statement and AOCI Recognition
The following table indicates the amount of gains and losses that have been recognized in the income statement for the fair value and cash flow hedges, as well as the associated gain or (loss) for the underlying hedged item for fair value hedges for the years ended December 31, 2019 and 2018 (in millions):
Year Ended December 31, Year Ended December 31,
2019 2018Location and Amount of Gain (Loss) Recognized inIncome on Fair Value and Cash Flow HedgingRelationships Revenue
InterestExpense
InvestmentIncome
and Other RevenueInterestExpense
InvestmentIncome
and OtherGain or (loss) on fair value hedging relationships:
Interest Contracts:
Hedged items $ — $ (38) $ — $ — $ 57 $ —
Derivatives designated as hedging instruments — 38 — — (57) —
Gains or (loss) on cash flow hedging relationships:
Interest Contracts:Amount of gain or (loss) reclassified fromaccumulated other comprehensive income — (15) — — (24) —
Foreign Exchange Contracts:Amount of gain or (loss) reclassified fromaccumulated other comprehensive income 177 — — (50) — —
Total amounts of income and expense line itemspresented in the statement of income in which theeffects of fair value or cash flow hedges are recorded $ 177 $ (15) $ — $ (50) $ (24) $ —
4545_Fin_C2.pdf 127 March 4, 2020

UNITED PARCEL SERVICE, INC. AND SUBSIDIARIESNOTES TO CONSOLIDATED FINANCIAL STATEMENTS
126
The following table indicates the amount of gains and (losses) that have been recognized in AOCI for the years ended December 31, 2019 and 2018 for those derivatives designated as cash flow hedges (in millions):
Derivative Instruments in Cash Flow Hedging Relationships
Amount of Gain (Loss) Recognized in AOCI on Derivatives
2019 2018
Interest rate contracts $ 6 $ 1
Foreign exchange contracts 250 563
Total $ 256 $ 564
As of December 31, 2019, there were $162 million of pre-tax gains related to cash flow hedges that are currently deferred in AOCI that are expected to be reclassified to income over the 12 month period ended December 31, 2020. The actual amounts that will be reclassified to income over the next 12 months will vary from this amount as a result of changes in market conditions. The maximum term over which we are hedging exposures to the variability of cash flows is approximately 13 years.
The following table indicates the amount of gains and losses that have been recognized in AOCI within foreign currency translation adjustment for the years ended December 31, 2019 and 2018 for those instruments designated as net investment hedges (in millions):
Non-derivative Instruments in Net Investment Hedging Relationships
Amount of Gain (Loss) Recognized in AOCI on Debt
2019 2018
Foreign denominated debt $ 75 $ 211
Total $ 75 $ 211
Additionally, we maintain interest rate swaps, foreign exchange forwards and investment market price forward contracts that are not designated as hedges. The interest rate swap contracts are intended to provide an economic hedge of portions of our outstanding debt. The foreign exchange forward contracts are intended to provide an economic offset to foreign currency remeasurement and settlement risk for certain assets and liabilities on our consolidated balance sheets. The investment market price forward contracts are intended to provide an economic offset to fair value fluctuations of certain investments in marketable securities.
We also periodically terminate interest rate swaps and foreign exchange options by entering into offsetting swap and foreign currency positions with different counterparties. As part of this process, we de-designate our original swap and foreign exchange contracts. These transactions provide an economic offset that effectively eliminates the effects of changes in market valuation.
The following is a summary of the amounts recorded in the statements of consolidated income related to fair value changes and settlements of these interest rate swaps, foreign currency forward and investment market price forward contracts not designated as hedges for the years ended December 31, 2019 and 2018 (in millions):
Derivative Instruments Not Designated inHedging Relationships
Location of Gain(Loss) Recognized
in Income
Amount of Gain (Loss) Recognized in Income
2019 2018
Interest rate contracts Interest expense $ (9) $ (9)
Foreign exchange contracts Investment income and other (1) (102)
Investment market price contracts Investment income and other — 16
Total $ (10) $ (95)
4545_Fin_C2.pdf 128 March 4, 2020

UNITED PARCEL SERVICE, INC. AND SUBSIDIARIESNOTES TO CONSOLIDATED FINANCIAL STATEMENTS
127
NOTE 17. TRANSFORMATION STRATEGY COSTS
In the first quarter of 2018, we launched the first phase of a multi-year, enterprise-wide transformation strategy impacting our organization. Over the next several years additional phases will be implemented. The program includes investments, as well as changes in processes and technology, that impact global direct and indirect operating costs.
The table below presents the transformation strategy costs for the years ended December 31, 2019 and 2018 (in millions):
Year Ended December 31,
Transformation Strategy Costs 2019 2018
Compensation and benefits $ 166 $ 262
Total other expenses 89 98
Total Transformation Strategy Costs $ 255 $ 360
Income Tax Benefit from Transformation Strategy Costs (59) (87)
After Tax Transformation Strategy Costs $ 196 $ 273
The income tax effects of transformation strategy costs are calculated by multiplying the amount of the adjustments by the statutory tax rates applicable in each tax jurisdiction.
NOTE 18. QUARTERLY INFORMATION (UNAUDITED)
Our revenue, segment operating profit, other income and (expense), net income, basic and diluted earnings per share on a quarterly basis are presented below (in millions, except per share amounts):
First Quarter Second Quarter Third Quarter Fourth Quarter
2019 2018 2019 2018 2019 2018 2019 2018
Revenue:
U.S. Domestic Package $10,480 $10,227 $11,150 $10,354 $11,455 $10,437 $13,408 $12,575
International Package 3,459 3,533 3,505 3,602 3,494 3,478 3,762 3,829
Supply Chain & Freight 3,221 3,353 3,393 3,500 3,369 3,529 3,398 3,444
Total revenue 17,160 17,113 18,048 17,456 18,318 17,444 20,568 19,848
Operating Profit:
U.S. Domestic Package 666 756 1,208 939 1,216 949 1,074 999
International Package 528 594 663 618 667 536 799 781
Supply Chain & Freight 200 170 272 216 245 242 260 224
Total operating profit 1,394 1,520 2,143 1,773 2,128 1,727 2,133 2,004
Total Other Income and (Expense) $ 46 $ 141 $ 61 $ 153 $ 78 $ 162 $ (2,331) $ (1,461)
Net Income $ 1,111 $ 1,345 $ 1,685 $ 1,485 $ 1,750 $ 1,508 $ (106) $ 453
Net Income Per Share:
Basic $ 1.28 $ 1.55 $ 1.95 $ 1.71 $ 2.03 $ 1.74 $ (0.12) $ 0.52
Diluted $ 1.28 $ 1.55 $ 1.94 $ 1.71 $ 2.01 $ 1.73 $ (0.12) $ 0.52
4545_Fin_C2.pdf 129 March 4, 2020

UNITED PARCEL SERVICE, INC. AND SUBSIDIARIESNOTES TO CONSOLIDATED FINANCIAL STATEMENTS
128
Our quarterly results were impacted by transformation strategy costs, legal contingencies and expenses and defined benefit plan mark-to-market charges. The table below presents the impact on operating profit and other income and (expense) for each period.
(in millions, except per share amounts) First Quarter Second Quarter Third Quarter Fourth Quarter
2019 2018 2019 2018 2019 2018 2019 2018
Impact to Operating Profit
Transformation Strategy - Employee Benefits $ 106 $ — $ 2 $ 192 $ 41 $ 70 $ 17 $ —
Transformation Strategy - Other Costs 17 — 19 71 22 27 31 —
Legal Contingencies and Expenses — — — — — — 97 —
Allocation of Matters Impacting Operating Profitto Segments
U.S. Domestic Package $ 28 — 18 196 26 39 133 —
International Package 84 — 2 36 26 40 10 —
Supply Chain & Freight 11 — 1 31 11 18 2 —
Impact to Other Income and (Expense)
Defined Benefit Plan Mark-to-Market Charges $ — $ — $ — $ — $ — $ — $ 2,387 $ 1,627
4545_Fin_C2.pdf 130 March 4, 2020

129
Item 9. Changes in and Disagreements with Accountants on Accounting and Financial Disclosure
None.
Item 9A. Controls and Procedures
Evaluation of Disclosure Controls and Procedures:
As of the end of the period covered by this report, management, including our Chief Executive Officer and Chief Financial Officer, evaluated the effectiveness of the design and operation of our disclosure controls and procedures. Based upon, and as of the date of, the evaluation, our Chief Executive Officer and Chief Financial Officer concluded that the disclosure controls and procedures were effective to ensure that information required to be disclosed in the reports we file and submit under the Exchange Act is recorded, processed, summarized and reported as and when required and is accumulated and communicated to our management, including the Chief Executive Officer and Chief Financial Officer, as appropriate to allow timely decisions regarding required disclosure.
Changes in Internal Control:
There were no changes in the Company’s internal control over financial reporting during the quarter ended December 31, 2019 that have materially affected, or are reasonably likely to materially affect, the Company’s internal control over financial reporting.
Management’s Report on Internal Control Over Financial Reporting:
UPS management is responsible for establishing and maintaining adequate internal control over financial reporting for United Parcel Service, Inc. and its subsidiaries (the “Company”). Based on the criteria for effective internal control over financial reporting established in Internal Control-Integrated Framework (2013) issued by the Committee of Sponsoring Organizations of the Treadway Commission, management has assessed the Company’s internal control over financial reporting as effective as of December 31, 2019. The independent registered public accounting firm of Deloitte & Touche LLP, as auditors of the consolidated balance sheets of United Parcel Service, Inc. and its subsidiaries as of December 31, 2019 and the related statements of consolidated income, consolidated comprehensive income and consolidated cash flows for the year ended December 31, 2019, has issued an attestation report on the Company’s internal control over financial reporting, which is included herein.
4545_Fin_C2.pdf 131 March 4, 2020

130
Report of Independent Registered Public Accounting Firm
To the Shareowners and Board of Directors of United Parcel Service, Inc.Atlanta, Georgia
Opinion on Internal Control over Financial Reporting
We have audited the internal control over financial reporting of United Parcel Service, Inc. and subsidiaries (the "Company") as of December 31, 2019, based on criteria established in Internal Control-Integrated Framework (2013) issued by the Committee of Sponsoring Organizations of the Treadway Commission (“COSO”). In our opinion, the Company maintained, in all material respects, effective internal control over financial reporting as of December 31, 2019, based on criteria established in Internal Control - Integrated Framework (2013) issued by COSO.
We have also audited, in accordance with the standards of the Public Company Accounting Oversight Board (United States) (“PCAOB”), the consolidated financial statements as of and for the year ended December 31, 2019, of the Company and our report dated February 20, 2020, expressed an unqualified opinion on those financial statements and included an explanatory paragraph regarding the Company’s adoption of a new accounting standard.
Basis for Opinion
The Company’s management is responsible for maintaining effective internal control over financial reporting and for its assessment of the effectiveness of internal control over financial reporting, included in the accompanying Management’s Report on Internal Control over Financial Reporting. Our responsibility is to express an opinion on the Company’s internal control over financial reporting based on our audit. We are a public accounting firm registered with the PCAOB and are required to be independent with respect to the Company in accordance with the U.S. federal securities laws and the applicable rules and regulations of the Securities and Exchange Commission and the PCAOB.
We conducted our audit in accordance with the standards of the PCAOB. Those standards require that we plan and perform the audit to obtain reasonable assurance about whether effective internal control over financial reporting was maintained in all material respects. Our audit included obtaining an understanding of internal control over financial reporting, assessing the risk that a material weakness exists, testing and evaluating the design and operating effectiveness of internal control based on the assessed risk, and performing such other procedures as we considered necessary in the circumstances. We believe that our audit provides a reasonable basis for our opinion.
Definition and Limitations of Internal Control over Financial Reporting
A company’s internal control over financial reporting is a process designed to provide reasonable assurance regarding the reliability of financial reporting and the preparation of financial statements for external purposes in accordance with generally accepted accounting principles. A company’s internal control over financial reporting includes those policies and procedures that (1) pertain to the maintenance of records that, in reasonable detail, accurately and fairly reflect the transactions and dispositions of the assets of the company; (2) provide reasonable assurance that transactions are recorded as necessary to permit preparation of financial statements in accordance with generally accepted accounting principles, and that receipts and expenditures of the company are being made only in accordance with authorizations of management and directors of the company; and (3) provide reasonable assurance regarding prevention or timely detection of unauthorized acquisition, use, or disposition of the company’s assets that could have a material effect on the financial statements.
Because of its inherent limitations, internal control over financial reporting may not prevent or detect misstatements. Also, projections of any evaluation of effectiveness to future periods are subject to the risk that controls may become inadequate because of changes in conditions, or that the degree of compliance with the policies or procedures may deteriorate.
/s/ Deloitte & Touche LLP
Atlanta, GeorgiaFebruary 20, 2020
4545_Fin_C2.pdf 132 March 4, 2020

131
Item 9B. Other Information
None.
PART III
Item 10. Directors, Executive Officers and Corporate Governance Information about our Executive Officers
Name and Office AgePrincipal Occupation and Employment For the LastFive Years
David P. AbneyChairman and Chief Executive Officer
64 Chief Executive Officer (2014 - present), Chairman (2016- present) Senior Vice President and Chief OperatingOfficer (2007 - 2014).
Norman M. Brothers, Jr.Senior Vice President, General Counsel andCorporate Secretary
52 Senior Vice President, General Counsel and CorporateSecretary (2016 - present), Corporate Legal DepartmentManager (2014 - 2016), Vice President, Corporate Legal(2004 - 2014).
Nando CesaroneSenior Vice President and President, UPS International
48 President, UPS International (2018 - present), EuropeRegion Manager (2016 - 2018), Asia Pacific RegionManager (2013 - 2016).
Philippe GilbertSenior Vice President and President, UPS Supply Chain Solutions
55 President, UPS Supply Chain Solutions (2019 - present),Regional CEO, Americas, DB Schenker Logistics (2015 -2018), Regional CEO, West Europe, DB SchenkerLogistics (2013 - 2015).
Kate M. GutmannSenior Vice President, Chief Sales and Solutions Officer
51 Chief Sales and Solutions Officer; Senior Vice PresidentThe UPS Store and UPS Capital (2017 - present), SeniorVice President, Worldwide Sales and Solutions (2014 -2017), President, Worldwide Sales (2011 - 2014).
Brian NewmanSenior Vice President, Chief Financial Officer and Treasurer
51 Chief Financial Officer and Treasurer (2019 - present),Executive Vice President, Finance and Operations, LatinAmerica, PepsiCo, Inc. (2017 - 2019), Executive VicePresident, Global Operations, PepsiCo, Inc. (2015 - 2017),Global Head of e-Commerce, PepsiCo, Inc. (2014 - 2015).
Juan R. PerezSenior Vice President, Chief Information Officer
53 Chief Information Officer and Engineering Officer (2017- present), Chief Information Officer (2016 - 2017), VicePresident, Information Services (2011 - 2016).
Scott A. PriceSenior Vice President, Chief Transformation Officer
57 Chief Strategy Transformation Officer (2017 - present),Executive Vice President of Global Leverage - WalmartInternational, Walmart Stores, Inc. (2017), ChiefAdministrative Officer and Executive Vice President -Walmart International, Walmart Stores Inc. (2016 - 2017),Chief Executive Officer and President of Walmart AsiaPte. Ltd. (2014 - 2016).
Charlene ThomasSenior Vice President, Chief Human Resources Officer
52 Chief Human Resources Officer (2019 - present),President, Human Capital Transformation (2019), WestRegion Manager (2018 - 2019), North Atlantic DistrictManager (2018), Mid-South District Manager(2016-2018), West-OPS Package Operations Manager(2016), U.S. Operations Training Staff Manager(2015-2016).
Kevin WarrenSenior Vice President, Chief Marketing Officer
57 Chief Marketing Officer (2018 - present), Executive VicePresident and Chief Commercial Officer, Xerox Corp.(2017 - 2018), President, Commercial Business Group,Xerox Corp. (2016 - 2017), President, Industrial, Retailand Hospitality Business Group, Xerox Corp. (2015 -2016), President of Strategic Growth Initiatives, XeroxCorp. (2014 - 2015).
George WillisSenior Vice President and President, United States Operations
55 President, U.S. Operations (2018 - present), President,West Region (2015 - 2018), U.K., Ireland, and NordicsDistrict Manager (2013 - 2015).
4545_Fin_C2.pdf 133 March 4, 2020

132
Information about our directors is presented under the caption “Our Board of Directors" in our definitive proxy statement for the Annual Meeting of Shareowners to be held on May 14, 2020 (the “Proxy Statement”) and is incorporated herein by reference.
Information about our Audit Committee is presented under the caption “Our Board of Directors - Committees of the Board of Directors” and "Audit Committee Matters" in our Proxy Statement and is incorporated herein by reference.
Information about our Code of Business Conduct is presented under the caption “Where You Can Find More Information” in Part I, Item 1 of this report.
Item 11. Executive Compensation
Information about our board and executive compensation is presented under the captions “Our Board of Directors - Director Compensation" and "Executive Compensation" in our Proxy Statement and is incorporated herein by reference.
Item 12. Security Ownership of Certain Beneficial Owners and Management and Related Stockholder Matters
Information about security ownership is presented under the caption “Ownership of Our Securities - Securities Ownership of Certain Beneficial Owners and Management” in our Proxy Statement and is incorporated herein by reference.
Information about our equity compensation plans is presented under the caption “Executive Compensation - Equity Compensation Plans” in our Proxy Statement and is incorporated herein by reference.
Item 13. Certain Relationships and Related Transactions, and Director Independence
Information about transactions with related persons is presented under the caption “Corporate Governance - Conflicts of Interest and Related Person Transactions” in our Proxy Statement and is incorporated herein by reference.
Information about director independence is presented under the caption “Corporate Governance - Director Independence” in our Proxy Statement and is incorporated herein by reference.
Item 14. Principal Accountant Fees and Services
Information about aggregate fees billed to us by our principal accountant is presented under the caption “Audit Committee Matters - Principal Accounting Firm Fees” in our Proxy Statement and is incorporated herein by reference.
4545_Fin_C2.pdf 134 March 4, 2020

133
PART IV
Item 15. Exhibits and Financial Statement Schedules
(a) Documents filed as a part of this report:
1. Financial Statements.
See Item 8 for the financial statements filed with this report.
2. Financial Statement Schedules.
None.
3. Exhibits.
See the Exhibit Index below for a list of the exhibits incorporated by reference into or filed with this report.
(b) Exhibits Required To Be Filed
See Item 15(a)1 above
(c) Financial Statement Schedules Required To Be Filed
See Item 15(a) 2 above
Item 16. Form 10-K Summary
None.
4545_Fin_C2.pdf 135 March 4, 2020

134
EXHIBIT INDEX
ExhibitNo. Description
3.1 — Restated Certificate of Incorporation of United Parcel Service, Inc. (incorporated by reference to Exhibit 3.3 to Form 8-K filed on May 12, 2010).
3.2 — Amended and Restated Bylaws of United Parcel Service, Inc. as of November 17, 2017 (incorporated by reference to Exhibit 3.1 to Form 8-K, filed on November 17, 2017).
4.1 — Indenture relating to 8 3/8% Debentures due April 1, 2020 (incorporated by reference to Exhibit 4(c) to Registration Statement No. 33-32481, filed on December 7, 1989) .(1)
4.2 — Indenture dated as of December 18, 1997 (incorporated by reference to Exhibit T-3C to Form T-3 (No. 022-22295), filed on December 18, 1997)
4.3 — Indenture dated as of January 26, 1999 (incorporated by reference to Exhibit 4.1 to Pre-Effective Amendment No. 1 to Form S-3 (No. 333-08369), filed on January 26, 1999)
4.4 — Form of First Supplemental Indenture to Indenture dated as of January 26, 1999 (incorporated by reference to Exhibit 4.2 to Post-Effective Amendment No. 1 to Form S-3 (No. 333-08369-01), filed on March 15, 2000).
4.5 — Second Supplemental Indenture dated as of September 21, 2001 to Indenture dated as of January 26, 1999 (incorporated by reference to Exhibit 4 to Form 10-Q for the quarter ended September 30, 2001).
4.6 — Indenture dated as of August 26, 2003 (incorporated by reference to Exhibit 4.1 to Form S-3 (No. 333-108272), filed on August 27, 2003).
4.7 — First Supplemental Indenture dated as of November 15, 2013 to Indenture dated as of August 26, 2003 (incorporated by reference to Exhibit 4.2 to Form S-3ASR (No. 333-192369), filed on November 15, 2013).
4.8 — Second Supplemental Indenture dated as of May 18, 2017 (incorporated by reference to Exhibit 4.1 to Form 8-K, filed on May 18, 2017).
4.9 — Form of 6.20% Senior Notes due January 15, 2038 (incorporated by reference to Exhibit 4.3 to Form 8-K, filed on January 15, 2008).
4.10 — Form of 3.125% Senior Notes due January 15, 2021 (incorporated by reference to Exhibit 4.1 to Form 8-K, filed on November 12, 2010).
4.11 — Form of 4.875% Senior Notes due November 15, 2040 (incorporated by reference to Exhibit 4.2 to Form 8-K, filed on November 12, 2010).
4.12 — Form of 2.450% Senior Notes due October 1, 2022 (incorporated by reference to Exhibit 4.2 to Form 8-K, filed on September 27, 2012).
4.13 — Form of 3.625% Senior Notes due October 1, 2042 (incorporated by reference to Exhibit 4.3 to Form 8-K, filed on September 27, 2012).
4.14 — Form of Floating Rate Senior Notes due December 15, 2064 (incorporated by reference to Exhibit 4.1 to Form 8-K, filed on December 15, 2014).
4.15 — Form of Floating Rate Senior Notes due September 15, 2065 (incorporated by reference to Exhibit 4.1 to Form 8-K, filed on September 17, 2015).
4.16 — Form of Floating Rate Senior Notes due July 15, 2020 (incorporated by reference to Exhibit 4.1 to Form 8-K, filed on November 20, 2015).
4.17 — Form of 1.625% Senior Notes due November 15, 2025 (incorporated by reference to Exhibit 4.2 to Form 8-K, filedon November 20, 2015).
4.18 — Form of Floating Rate Senior Notes due March 15, 2066 (incorporated by reference to Exhibit 4.1 to Form 8-K, filed on April 1, 2016).
4.19 — Form of 2.40% Senior Notes Due November 2026 (incorporated by reference to Exhibit 4.2 to Form 8-K, filed on October 25, 2016).
4.20 — Form of 3.40% Senior Notes Due November 2046 (incorporated by reference to Exhibit 4.3 to Form 8-K, filed on October 25, 2016).
..
(1).
(1).
4545_Fin_C3.pdf 136 March 5, 2020

135
4.21 — Form of 1.00% Senior Notes Due November 2028 (incorporated by reference to Exhibit 4.1 to Form 8-K, filed on October 25, 2016).
4.22 — Form of Floating Rate Senior Notes due March 15, 2067 (incorporated by reference to Exhibit 4.1 to Form 8-K, filed on March 31, 2017).
4.23 — Form of Floating Rate Senior Notes due May 16, 2022 (incorporated by reference to Exhibit 4.1 to Form 8-K, filed on May 16, 2017).
4.24 — Form of 2.350% Senior Notes due May 16, 2022 (incorporated by reference to Exhibit 4.2 to Form 8-K, filed on May 16, 2017).
4.25 — Form of 2.125% Senior Notes due May 21, 2024 (incorporated by reference to Exhibit 4.2 to Form 8-K, filed on May 18, 2017).
4.26 — Form of 0.375% Senior Notes due November 15, 2023 (incorporated by reference to Exhibit 4.1 to Form 8-K, filed on November 13, 2017).
4.27 — Form of 1.500% Senior Notes due November 15, 2032 (incorporated by reference to Exhibit 4.2 to Form 8-K, filed on November 13, 2017).
4.28 — Form of Floating Rate Senior Notes due April 1, 2021 (incorporated by reference to Exhibit 4.1 to Form 8-K, filed on November 14, 2017).
4.29 — Form of Floating Rate Senior Notes due April 1, 2023 (incorporated by reference to Exhibit 4.2 to Form 8-K, filed on November 14, 2017).
4.30 — Form of 2.050% Senior Notes due April 1, 2021 (incorporated by reference to Exhibit 4.3 to Form 8-K, filed on November 14, 2017).
4.31 — Form of 2.500% Senior Notes due April 1, 2023 (incorporated by reference to Exhibit 4.4 to Form 8-K, filed on November 14, 2017).
4.32 — Form of 2.800% Senior Notes due November 15, 2024 (incorporated by reference to Exhibit 4.5 to Form 8-K, filed on November 14, 2017).
4.33 — Form of 3.050% Senior Notes due November 15, 2027 (incorporated by reference to Exhibit 4.6 to Form 8-K, filed on November 14, 2017).
4.34 — Form of 3.750% Senior Notes due November 15, 2047 (incorporated by reference to Exhibit 4.7 to Form 8-K, filed on November 14, 2017).
4.35 — Form of Floating Rate Senior Notes due November 15, 2067 (incorporated by reference to Exhibit 4.8 to Form 8-K, filed on November 14, 2017).
4.36 — Form of 3.400% Senior Notes due March 15, 2029 (incorporated by reference to Exhibit 4.1 to Form 8-K, filed on March 15, 2019).
4.37 — Form of 4.250% Senior Notes due March 15, 2049 (incorporated by reference to Exhibit 4.2 to Form 8-K, filed on March 15, 2019).
4.38 — Form of 2.200% Senior Notes due September 1, 2024 (incorporated by reference to Exhibit 4.1 to Form 8-K filed on August 16, 2019).
4.39 — Form of 2.500% Senior Notes due September 1, 2029 (incorporated by reference to Exhibit 4.2 to Form 8-K filed on August 16, 2019).
4.40 — Form of 3.400% Senior Notes due September 1, 2049 (incorporated by reference to Exhibit 4.3 to Form 8-K filed on August 16, 2019).
4.41 — Description of Securities.
10.1 — UPS Retirement Plan Amendment and Restatement Effective January 1, 2014 (incorporated by reference to Exhibit 10.1 to Form 10-K for the year ended December 31, 2014).*
10.1(a) — Amendment No. 1 to UPS Retirement Plan, as Amended and Restated, effective as of June 30, 2016 (incorporated by reference to Exhibit 10.1 to Form 10-Q for the quarter ended June 30, 2016).*
4545_Fin_C2.pdf 137 March 4, 2020

136
10.1(b) — Amendment Four to the Amended and Restated UPS Retirement Plan effective June 23, 2017 (incorporated by reference to Exhibit 10.2 to Form 8-K, filed on June 27, 2017).*
10.2 — UPS 401(k) Savings Plan, Amendment and Restatement effective as of January 1, 2017 (incorporated by reference to Exhibit 10.1 to Form 8-K, filed on June 27, 2017).*
10.3 — UPS Restoration Savings Plan effective January 1, 2017 (incorporated by reference to Exhibit 10.3 to Form 8-K, filed on June 27, 2017).*
10.4 — Amendment One to the Amended and Restated UPS Excess Coordinating Benefit Plan effective June 23, 2017 (incorporated by reference to Exhibit 10.4 to Form 8-K, filed on June 27, 2017).*
10.4(a) — UPS Excess Coordinating Benefit Plan, as Amended and Restated, effective as of January 1, 2012 (incorporated by reference to Exhibit 10.5 to Form 10-K for the year ended December 31, 2012).*
10.5 — United Parcel Service, Inc. 2012 Omnibus Incentive Compensation Plan (incorporated by reference to Annex A to the Definitive Proxy Statement, filed on March 12, 2012).*
10.5(a) — Form of Long-Term Incentive Performance Award Agreement (incorporated by reference to Exhibit 10.3 to the Quarterly Report on Form 10-Q for the quarter ended March 31, 2011).*
10.5(b) — Form of Non-Employee Director Restricted Stock Unit Award Agreement (incorporated by reference to Exhibit 10.1 to the Quarterly Report on Form 10-Q for the quarter ended June 30, 2019).*
10.5(c) — UPS Management Incentive Program Terms and Conditions effective as of January 1, 2011 (incorporated by reference to Exhibit 10.10(3) to the Form 10-K) for the year ended December 31, 2010).*
10.5(d) — UPS Stock Option Program Terms and Conditions effective as of January 1, 2012 (incorporated by reference to Exhibit 10.7(4) to the Form 10-K for the year ended December 31, 2011).*
10.5(e) — UPS Long-Term Incentive Performance Program Terms and Conditions effective as of January 1, 2012 (incorporated by reference to Exhibit 10.7(5) to the Form 10-K for the year ended December 31, 2011).*
10.6 — Form of UPS Deferred Compensation Plan as Amended and Restated effective January 1, 2012 (incorporated by reference to Exhibit 10.6 to Form 10-K for the year ended December 31, 2018).*
10.6(a) — Amendment No. 1 to Amended and Restated UPS Deferred Compensation Plan (incorporated by reference to Exhibit 10.7(1) to the Form 10-K for the year ended December 31, 2012).*
10.7 — 2015 Omnibus Incentive Compensation Plan (incorporated by reference to Annex A to the Definitive Proxy Statement filed on March 24, 2015).*
10.8 — 2018 Omnibus Incentive Compensation Plan (incorporated by reference to Annex A to the Definitive Proxy Statement filed on March 16, 2018).*
10.8(a) — UPS Management Incentive Program Amended and Restated Terms and Conditions effective November 8, 2018 (incorporated by reference to Exhibit 10.8(a) to Form 10-K for the year ended December 31, 2018).*
10.8(b) — UPS Stock Option Program Amended and Restated Terms and Conditions effective November 8, 2018 (incorporated by reference to Exhibit 10.8(b) to Form 10-K for the year ended December 31, 2018).*
10.8(c) — UPS Long-Term Incentive Performance Program Amended and Restated Terms and Conditions effective as of November 8, 2018 (incorporated by reference to Exhibit 10.8(c) to Form 10-K for the year ended December 31, 2018).*
10.9 — Employment offer letter agreement between the Company and Scott Price, dated November 28, 2017 (incorporated by reference to Exhibit 10.9 to Form 10-K for the year ended December 31, 2018).*
10.10 — Form of Protective Covenant Agreement between the Company and Scott Price (incorporated by reference to Exhibit 10.10 to Form 10-K for the year ended December 31, 2018).*
10.11 — Employment offer letter agreement between the Company and Kevin Warren, dated May 5, 2018 (incorporated by reference to Exhibit 10.11 to Form 10-K for the year ended December 31, 2018).*
10.12 — Form of Protective Covenant Agreement between the Company and Kevin Warren (incorporated by reference to Exhibit 10.12 to Form 10-K for the year ended December 31, 2018).*
10.13 — Employment offer letter agreement between the Company and Brian Newman, dated August 7, 2019 (incorporated by reference to Exhibit 10.1 to Form 8-K filed on August 13, 2019).*
4545_Fin_C2.pdf 138 March 4, 2020

137
10.14 — Protective Covenant Agreement between the Company and Brian Newman, dated August 7, 2019 (incorporated by reference to Exhibit 10.2 to Form 8-K filed on August 13, 2019).*
10.15 — Transition Agreement between the Company and James J. Barber, dated October 21, 2019 (incorporated by reference to Exhibit 10.1 to Form 8-K, filed on October 22, 2019).*
10.16 — UPS Long-Term Incentive Performance Program Amended and Restated Terms and Conditions effective as of February 13, 2020*.
21 — Subsidiaries.
23 — Consent of Deloitte & Touche LLP.
31.1 — Certificate of the Principal Executive Officer Pursuant to Rule 13a-14(a), as adopted pursuant to Section 302 of the Sarbanes-Oxley Act of 2002.
31.2 — Certificate of the Principal Financial Officer Pursuant to Rule 13a-14(a), as adopted pursuant to Section 302 of the Sarbanes-Oxley Act of 2002.
32.1 — Certification of the Principal Executive Officer Pursuant to 18 U.S.C. Section 1350, as Adopted Pursuant to Section 906 of the Sarbanes-Oxley Act of 2002.
32.2 — Certification of the Principal Financial Officer Pursuant to 18 U.S.C. Section 1350, as Adopted Pursuant to Section 906 of the Sarbanes-Oxley Act of 2002.
101 — The following financial information from the Annual Report on Form 10-K for the year ended December 31, 2019,formatted in Inline XBRL (Extensible Business Reporting Language): (i) the Consolidated Balance Sheets, (ii) theConsolidated Statements of Income, (iii) the Consolidated Statements of Comprehensive Income (Loss), (iv) theConsolidated Statements of Cash Flows and (v) the Notes to the Consolidated Financial Statements.
104 — Cover Page Interactive Data File - The cover page from this Annual Report on Form 10-K for the year endedDecember 31, 2019 is formatted in iXBRL (included as Exhibit 101).
__________________________
(1) Filed in paper format.* Management contract or compensatory plan or arrangement.
4545_Fin_C2.pdf 139 March 4, 2020

138
SIGNATURES
Pursuant to the requirements of Section 13 or 15(d) of the Securities Exchange Act of 1934, United Parcel Service, Inc. has duly caused this report to be signed on its behalf by the undersigned, thereunto duly authorized.
UNITED PARCEL SERVICE, INC.(REGISTRANT)
By: /S/ DAVID P. ABNEY David P. Abney
Chairman and Chief Executive Officer(Principal Executive Officer)
Date: February 20, 2020
Pursuant to the requirements of the Securities Exchange Act of 1934, this report has been signed below by the following persons on behalf of the Registrant and in the capacities and on the dates indicated.
Signature Title Date
/S/ DAVID P. ABNEY Chairman, Chief Executive Officer and Director February 20, 2020David P. Abney (Principal Executive Officer)
/S/ BRIAN NEWMAN Senior Vice President, Chief Financial Officer and Treasurer February 20, 2020Brian Newman (Principal Financial and Accounting Officer)
/S/ RODNEY C. ADKINS Director February 20, 2020Rodney C. Adkins
/S/ MICHAEL J. BURNS Director February 20, 2020Michael J. Burns
/S/ WILLIAM R. JOHNSON Director February 20, 2020William R. Johnson
/S/ ANN M. LIVERMORE Director February 20, 2020Ann M. Livermore
/S/ RUDY H.P. MARKHAM Director February 20, 2020Rudy H. P. Markham
/S/ FRANCK J. MOISON Director February 20, 2020Franck J. Moison
/S/ CLARK T. RANDT, JR. Director February 20, 2020Clark T. Randt, Jr.
/S/ CHRISTIANA SMITH SHI Director February 20, 2020Christiana Smith Shi
/S/ JOHN T. STANKEY Director February 20, 2020John T. Stankey
/S/ CAROL B. TOMÉ Director February 20, 2020Carol B. Tomé
/S/ KEVIN M. WARSH Director February 20, 2020Kevin M. Warsh
4545_Fin_C2.pdf 140 March 4, 2020

Reconciliation of Non-GAAP Financial Measures (amounts in millions, except per share amounts)
A1
2019 2018 2017 2016 2015 2019 2018 2017 2016 2015Reported / GAAP 4,440$ 4,791$ 4,905$ 3,422$ 4,840$ 5.11$ 5.51$ 5.61$ 3.86$ 5.34$
Transformation Strategy 255 360 - - - 0.29 0.41 - - - Legal Contingencies and Expenses 97 - - - - 0.11 - - - - Defined Benefit Plans Mark-to-Market Charge 2,387 1,627 800 2,651 118 2.75 1.87 0.90 2.98 0.13 Income Tax Expense (Benefit) from the Items Above (636) (477) (193) (978) (39) (0.73) (0.55) (0.22) (1.10) (0.04) Income Tax Benefit from the Tax Cuts and Jobs Act and other non-U.S. tax law change - - (258) - - - - (0.29) - -
Adjusted 6,543$ 6,301$ 5,254$ 5,095$ 4,919$ 7.53$ 7.24$ 6.00$ 5.74$ 5.43$
2019 2018 2017 2016 2015 2019 2018 2017 2016 2015Reported / GAAP 7,798$ 7,024$ 7,529$ 7,688$ 7,243$ 10.5% 9.8% 11.3% 12.5% 12.2%
Transformation strategy 255 360 - - - 0.4% 0.5% - - - Legal Contingencies and Expenses 97 - - - - 0.1% - - - -
Adjusted 8,150$ 7,384$ 7,529$ 7,688$ 7,243$ 11.0% 10.3% 11.3% 12.5% 12.2%
U.S. Domestic Package International Package Supply Chain & Freight2019 2018 2019 2018 2019 2018 2019 2018 2019 2018 2019 2018
Reported / GAAP 4,164$ 3,643$ 2,657$ 2,529$ 977$ 852$ 9.0% 8.4% 18.7% 17.5% 7.3% 6.2%Transformation strategy 108 235 122 76 25 49 0.2% 0.5% 0.8% 0.5% 0.2% 0.4%Legal Contingencies and Expenses 97 - - - - - 0.2% - - - - -
Adjusted 4,369$ 3,878$ 2,779$ 2,605$ 1,002$ 901$ 9.4% 8.9% 19.5% 18.0% 7.5% 6.5%Currency Adjustment - - (70) 10 8 5
Adjusted Currency Neutral 4,369$ 3,878$ 2,709$ 2,615$ 1,010$ 906$
U.S. Domestic Package International Package Supply Chain & Freight2019 2018 2019 2018 2019 2018
Reported / GAAP 46,493$ 43,593$ 14,220$ 14,442$ 13,381$ 13,826$ 14,452$ 14,442$ 0.1%Currency Adjustment - - 232 (147) 75 (39) 13,456$ 13,826$ -2.7%
Currency Neutral 46,493$ 43,593$ 14,452$ 14,295$ 13,456$ 13,787$
2019 2018 2017 2019 2018 2017Beginning Balance (Reported / GAAP) 50,016$ 45,574$ 40,545$ 3,037$ 1,024$ 430$ Beginning Balance (Adjusted) 49,539$ 45,123$ 41,523$ 6,943$ 4,593$ 3,851$ Ending Balance (Reported / GAAP) 57,857$ 50,016$ 45,574$ 3,283$ 3,037$ 1,024$
Unrecognized Pension and Postretirement Benefit Costs (Net of Tax) - - - 5,035 3,906 3,569 Long-Term U.S. Deferred Tax Assets (636) (477) (451) - - -
Adjusted Ending Balance 57,221$ 49,539$ 45,123$ 8,318$ 6,943$ 4,593$ Average Reported Balance ((Reported Beginning + Reported Ending) / 2) 53,937$ 47,795$ 43,060$ Average Adjusted Balance ((Adjusted Beginning + Adjusted Ending) / 2) 53,380$ 47,331$ 43,323$ Return on Reported Balance (Reported Net Income / Average Reported Balance) 8.2% 10.0% 11.4%Return on Adjusted Balance (Adjusted Net Income / Average Adjusted Balance) 12.3% 13.3% 12.1%
2019 2018Reported / GAAP 6,380$ 6,283$
Principal Repayments of Finance Lease Obligations 140 340 Adjusted 6,520$ 6,623$
Net Income Diluted Earnings Per Share
Operating Profit Operating Margin
Operating Profit Operating Margin
Supply Chain & Freight
2019Currency Neutral
2018As Reported % Change
U.S. Domestic Package International Package Supply Chain & Freight
Revenue Currency Neutral Revenue
International Package
investors and analysts in understanding our financial results and assessing our prospects for future performance. We believe these adjusted financial measures are important indicators of our recurring results of operations because they exclude items that may not be indicative of, or are unrelated to, our underlying operating results, and provide a useful baseline for analyzing trends in our underlying businesses.
Return on Assets Adjusted Shareowners' Equity
Adjusted Capital Expenditures
Note: The adjustments denoted in the tables above are further described in our annual reports on Form 10-K for the years ended December 31, 2019, 2018, 2017, 2016, and 2015, as well as in the historical financial schedules on our investor relations website.
Note: We supplement the reporting of our financial information determined under Generally Accepted Accounting Principles ("GAAP") with certain non-GAAP financial measures, including revenue, operating profit, operating margin, net income, earnings per share, and return on assets adjusted for the non-comparable items listed in the tables above. Adjusted financial measures may also exclude the impact of period over period exchange rate changes and hedging activities. We believe these adjusted measures provide meaningful information to assist
4545_FM3_C1.pdf 1 March 5, 2020

(This page intentionally left blank)
4545_FM3.pdf 2 March 4, 2020

ANNUAL MEETING Our annual meeting of shareowners will be held at 8 a.m. on May 14, 2020, at the Hotel DuPont, 11th and Market Street, Wilmington, DE. Shareowners of record as of March 16, 2020, are entitled to vote at the meeting.
INVE STOR REL ATIONS You can contact our Investor Relations Department at:
>>> UPS 55 Glenlake Parkway, NE Atlanta, GA 30328-3474 800.877.1503 or 404.828.6059 investors.ups.com
E XCHANGE LISTING Our Class B common stock is listed on the New York Stock Exchange under the symbol “UPS”.
TR ANSFER AGENT AND REGISTR AR Computershare Send notices of address changes or questions regarding account status, stock transfer, lost certificates, or dividend payments to:
>>> Regular Mail UPS c/o Computershare PO Box 505002 Louisville, KY 40233-5002
or:
>>> Expedited Delivery UPS c/o Computershare 462 South 4th Street, Suite 1600 Louisville, KY 40202
FORM 10 - K Our Annual Report on Form 10-K for the year ended December 31, 2019 forms part of the UPS 2019 Annual Report. If you would like an additional copy of our Form 10-K, you can access it through the Investor Relations website at www.investors.ups.com or at the Securities and Exchange Commission website, sec.gov. The Form 10-K also is available free of charge by calling, contacting via the website, or writing to the Investor Relations Department.
UPS SHAREOWNER SERVICE S Convenient access 24 hours a day, seven days a week.
>>> Class A Common Shareowners www.computershare.com/ups 888.663.8325
>>> Class B Common Shareowners www.computershare.com/ups 800.758.4674
Calls from outside the United States: 201.680.6612 TDD for hearing impaired: 800.231.5469 TDD for non-U.S. shareowners: 201.680.6610
DIREC T STOCK PURCHA SE PL AN To make an initial purchase of UPS Class B Common Stock online, visit www.computershare.com/Investor and go to “Invest Now”. Follow the instructions provided to search for Investment Plans and access the Enrollment Wizard.
Current Class B shareowners can enroll in the plan online by accessing their accounts through www.computershare.com/ups or by calling 800.758.4674.
DIVIDEND REINVE STMENT PL AN To reinvest dividends in additional UPS shares:
>>> Class A and B Shareowners www.computershare.com/ups
ONLINE ACCE SS TO SHAREOWNER ACCOUNT MATERIAL S Enroll in E-Communications, a self-service program that provides electronic notification and secure access to shareowner communications. To enroll, access your account at www.computershare.com/ups. After accessing your account, click the “What would you like to do” dropdown menu in the upper left of the page. Under “Holdings” click “Manage My Stock,” select “My Profile,” click “Update” under “E-Communications” and follow the enrollment instructions.
UPS WEBSITE S Investor Relations . . . . . . . . . . . . . . . investors.ups.com
UPS Corporate . . . . . . . . . . . . . . . . . . . ups.com
Sustainability/ Corporate Responsibility . . . . . . . sustainability.ups.com
Services and Solutions . . . . . . . . . . ups.com/businesssolutions
INVESTOR INFORMATION
FINANCIAL HIGHLIGHTS (in millions except per-share amounts)
2019 2018 2017Revenue $74,094 $71,861 $66,585 Operating expenses 66,296 64,837 59,056Net income 4,440 4,791 4,905Adjusted net income* 6,543 6,301 5,254Diluted earnings per share 5.11 5.51 5.61 Adjusted diluted earnings per share* 7.53 7.24 6.00
Dividends declared per share 3.84 3.64 3.32
Assets 57,857 50,016 45,574Long-term debt 21,818 19,931 20,278Shareowners’ equity 3,283 3,037 1,024Capital expenditures1 6,380 6,283 5,227Cash and marketable securities 5,741 5,035 4,069
KEY METRICS2019 2018 2017
Return on Assets (GAAP) 8.2% 10.0% 11.4%Return on Assets (Adjusted)* 12.3% 13.3% 12.1%
Dividend Yield 3.3% 3.7% 2.6%
FREE CASH FLOW(millions of dollars)
2019 2018 2017Net cash from operations $8,639 $12,711 $1,479 Capital expenditures1 (6,380) (6,283) (5,227)Proceeds from disposals of PP&E 65 37 24
Net change in finance receivables 13 4 5
Other investing activities (75) 1 1 Free cash flow2 2,262 6,470 (3,718)Discretionary pension contributions 2,000 - 7,291
Adjusted free cash flow excluding discretionary pension contributions
4,262 6,470 3,573
*See reconciliation of Non-GAAP financial measures on page A1.1 Adjusted capital expenditures including principal repayments of finance lease obligations were $6.520 and $6.623 billion in 2019 and 2018, respectively.
2 Adjusted free cash flow including principal repayments of finance lease obligations was $4.122 and $6.130 billion in 2019 and 2018, respectively.
YEAR FOUNDED: 1907
2285 DAILY FLIGHT SEGMENTS
WORLDWIDE OPERATING FACILITIES: MORE THAN 2,500
ALTERNATIVE FUEL VEHICLES: MORE THAN 10,000
OVER 40,000 UPS ACCESS POINT LOCATIONS
2019 DELIVERY VOLUME: 5.5 BILLION PACKAGES AND DOCUMENTS
MORE THAN 125,000 VEHICLES IN DELIVERY FLEET
UPS MY CHOICE® MEMBERS: 67 MILLION
ONLINE TRACKING: 295 MILLION PER DAY
11.5 MILLION CUSTOMERS
EMPLOYEES: 495,000

2019 UPS Annual Report
55 Glenlake Parkway, NE Atlanta, GA 30328-3474
www.ups.com
© 2020 United Parcel Service of America, Inc. UPS, the UPS brandmark and the color brown are trademarks of United Parcel Service of America, Inc. All rights reserved.
2019 Annual Report
Accelerating Forward >>>CUSTOMER FIRST. PEOPLE LED. INNOVATION DRIVEN.