Embed Size (px)
Citation preview
Zyman Institute of Brand Science
ZIBS Technical Report
CUSTOMER EQUITY: AN INTEGRAL PART OF FINANCIAL REPORTING?
Thorsten Wiesel, Bernd Skiera, Julian Villanueva
“Brand-Driven Business Performance”
Technical Report Series The Zyman Institute of Brand Science (ZIBS) is an innovation research group based at Emory University's Goizueta Business School. ZIBS fosters rich collaborations between business managers and leading scholars worldwide. The institute supports advanced research in brand management with the ultimate goal of developing positively useful knowledge that drives superior business performance. Relevancy in research is core to ZIBS. Research topics are elected by a steering committee consisting of executive managers and leading scholars. ZIBS supports research in next practices (vs. best practices) with resources and funding. ZIBS insures the application of this research through knowledge sharing activities like executive briefings, consultative interventions, roundtables, and conferences. Stay Informed. Visit zibs.com to signup for our mailing list. Report Access Corporate Membership: ZIBS member companies receive all ZIBS reports free of charge. To learn more about corporate membership visit zibs.com. Purchasing Single Reports: ZIBS makes some reports available for individual purchase. To purchase these reports please visit zibs.com Report Archive: ZIBS reports for all years are accessible on zibs.com for member firms. Member Services Change of Address: Send both old and new address to [email protected]. For Academics Classroom Use: Upon written request working papers may be copied for one-time classroom use free of charge. Contact [email protected] to obtain permission. Special Memberships: ZIBS can arrange special memberships for Academic Members and Market Research Members. Please visit Working Paper Submissions: Faculty researchers in branding are encouraged to submit working papers to ZIBS, regardless of where the research funding originated. The research must represent an advancement over existing literature and not be widely disseminated elsewhere. Funding is available to interpret the working papers into a format that best conveys managerial insights. Research Proposals: ZIBS supports researchers worldwide with research resources (funding, data, analysis, etc). We encourage researchers to submit proposals for consideration. Visit zibs.com/research for more information and to download the research proposal template. Working Paper Status Articles that appear in ZIBS Technical Research Reports have not undergone a formal academic peer review. They are released as working papers, which means they are a document released for discussion and represent cutting edge knowledge but are not considered an authoritative text until they pass peer review. Intellectual Property ZIBS Research Reports are not to be reproduced or published, in any form or any means, electronic or mechanical, without written permission. The views expressed are those of the authors. ZIBS Research Reports 2006 © Emory University. All rights reserved.
CUSTOMER EQUITY: AN INTEGRAL PART OF FINANCIAL REPORTING?
Thorsten Wiesel Bernd Skiera
Julian Villanueva
March 2006
Preliminary Version (Please do not cite or distribute without permission of authors)
Thorsten Wiesel, Bernd Skiera, School of Business and Economics, Johann Wolfgang Goethe-University Frankfurt/Main, Mertonstr. 17, 60054 Frankfurt/Main, Germany, Phone: +49-69-427-22377, E-Mail: [email protected], [email protected]án Villanueva, IESE Business School, Avda. Pearson 21, 08034 Barcelona, Spain, Phone: +34-93-2534200, E-Mail: [email protected]
Abstract
The objective of financial reporting is to provide information to help current and potential
investors, creditors and other users in assessing the amounts, timing, and uncertainty of
prospective cash receipts. But financial statements are not, on their own, sufficient to meet the
objectives of financial reporting and additional information has to be provided to external
addresses of financial reports. For firms which aim to increase the value of the customer base
(Customer Equity), such additional information could be about the value of their customer
base and its changes over time. Consequently, a performance measurement approach, which is
in line with the criteria of financial reporting and focuses on the value of the customer base, is
needed. This paper proposes such a performance measurement approach. Furthermore, we
demonstrate the applicability of this approach by applying it to the customer base of
Netflix.com. This approach provides relevant performance metrics for monitoring customer
management activities (on a strategic level), reduces information asymmetries, assists
communicating customer value orientation, and enables external addressees to monitor firm
performance.
Keywords:
customer equity; decomposition; performance measurement approach
Table of Content
1 Introduction ......................................................................................................................... 1
2 Critical Criteria for Financial Reporting.......................................................................... 4
3 Model .................................................................................................................................... 7 3.1 General Formulation.......................................................................................................... 7 3.2 Specific Model Formulation ............................................................................................ 15
4 Illustrative Application ..................................................................................................... 17 4.1 Data.................................................................................................................................. 17 4.2 Customer Equity Statement ............................................................................................. 19 4.3 Customer Equity Flow Statement .................................................................................... 20 4.4 Additional Long-Term Customer Performance Measures............................................... 21
5 Conclusions, Limitations, and Future Research............................................................. 23
6 Figures and Tables ............................................................................................................ 26
7 References .......................................................................................................................... 38
1 Introduction The objective of financial reporting is to provide information to help current and potential
investors, creditors and other users in assessing the amounts, timing, and uncertainty of
prospective cash receipts (Financial Accounting Standards Board 1978; International
Accounting Standards Board 2004). The IASB Framework for the Preparation and Presentation
of Financial Statements acknowledges that financial statements are not, on their own, sufficient
to meet the objective of financial reporting (International Accounting Standards Board 2004).
To bridge the gap between what financial statements are able to achieve and the objective of
financial reporting, additional information such as explaining the main trends and factors
underlying the development, performance and position of the entity’s business is needed
(International Accounting Standards Board 2005).
The Management Discussion and Analysis required in the United States (Securities and
Exchange Commision 2003) and the recent discussion about Management Commentary
(International Accounting Standards Board 2005) aim to bridge this gap. They ask for
information which supplements and complements information in the firm’s financial statement,
has an orientation to the future, provides an analysis through the eye of management, and
should be understandable, relevant, reliable, and comparable (International Accounting
Standards Board 2005). Examples are information about the nature of the business, key
resources, risks and relationships, and performance measures and indicators. For instance,
Netflix.com provides information about customer churn, subscribers acquisition cost, and gross
margin in their quarterly statements. These key business metrics are periodically reviewed by
management to evaluate the effectiveness of their operational strategies (Netflix 2005).
For many firms, customers are the primary asset (e.g., Hogan et al. 2002, Gupta and
Lehmann 2003, Rust et al. 2004a). Customer management has emerged as the practice which
aims to implement and to profit from a customer orientation philosophy. In recent years, the
marketing literature has developed and discussed the concept of customer lifetime value, which
1
is the present value of all future cash flows generated from a customer (e.g., Berger and Nasr
1998, Dwyer 1997, Jain and Singh 2002, Gupta and Lehmann 2003, Lewis 2005) and
Customer Equity, which is the sum of customer lifetime value across customers (e.g., Blattberg
and Deighton 1996; Gupta et al. 2004; Rust et al. 2004b; Wiesel and Skiera 2005). Customer
management deals with the acquisition and retention of customers with the aim to increase the
customer lifetime value and Customer Equity (e.g., Reinartz and Kumar 2000, Reinartz and
Kumar 2003, Venkatesan and Kumar 2004, Reinartz et al. 2005, Payne and Frow 2005, Ryals
2005). Consequently, if a firm aims to manage the firm’s customer assets and to increase the
value of the customer base (Customer Equity), information about those activities should be part
of the supplement and complement information of a firm’s financial reporting.
Hence, a performance measurement approach, which is in line with criteria of financial
reporting and focuses on the value of the customer base instead of only short-term metrics, is
needed. On a strategic level, this approach should provide internal addresses with relevant
long-term performance metrics about the health of the firm’s customer relationships.
Furthermore, this information should be handed over to external addressees to reduce
information asymmetries, communicate customer value orientation, and assist to meet the
objective of financial reporting. If information is important to management in managing the
business, it is also important to investors in assessing performance and future prospects
(PricewaterhouseCoopers 2005).
A possible approach requires (i) to monitor the Customer Equity over time (Customer
Equity Statement) and (ii) to decompose changes in Customer Equity over time (Customer
Equity Flow Statement). Decomposing the changes in Customer Equity into the effects of the
variation in customer metrics (such as number of customers, customer lifetime, customer cash
flow, and acquisition as well as retention expenditures) allows managers and investors to get
information about how much and due to which sources the value of the customer base has
changed. This, in conjunction with additional long-term customer performance measures, could
2
help to derive more detailed implications regarding the firm’s customer management activities
than just monitoring the Customer Equity over time. For instance, if a decrease in Customer
Equity is due to a decrease in customer lifetime, managers should focus on retention activities.
In contrast, if the decrease is a result of a change in customer cash flow, managers should focus
on cross-selling, up-selling, or pricing.
Hence, the objectives of this paper are (i) to deduct a catalogue of criteria relevant for
financial reporting, (ii) to propose a performance measurement approach which is in line with
the financial reporting criteria and focuses on the value of a firm’s customer base (Customer
Equity), (iii) to decompose changes in Customer Equity over time into the effects of the
variation in customer metrics, (iv) to develop additional long-term customer performance
measures which assist to derive implications regarding the firm’s customer management
activities, (v) to illustrate that it is more appropriate to look at the effects of changes of the
long-term value of the customer base as well as those additional long-term customer
performance measures than looking at short-term customer metrics, and (v) to demonstrate the
applicability and usefulness of the approach by applying it to public available data of
Netflix.com. This approach provides relevant performance metrics for monitoring customer
management activities (on a strategic level), reduces information asymmetries, assists
communicating customer value orientation, and enables external addressees to monitor firm
performance.
We contribute to the existing research by deducing a catalogue of criteria relevant for
financial reporting. Furthermore, we develop a general and specific model that meets these
criteria and could be used as a performance measurement approach for internal as well as
external purposes. The main purpose of this approach is to visualize managers (i) the
development of their customer base value, (ii) the existence of possible negative evolutions,
and (iii) the sources of changes in Customer Equity. As such, it illustrates to the management
that a decrease in Customer Equity over time could be, for example, due to a decrease in
3
customer retention. Nevertheless, it does not provide the reasoning of the decrease in customer
retention, which might be due to, for example, a decrease in customer satisfaction or superior
offers from competitors. Identifying the reasons of change in customer metrics has to be done
on a more operational level (e.g., which products to sell to which customers) and is not in the
scope of this strategic approach.
The remainder of this paper is organized as follows: The following section deduces a
catalogue of criteria relevant for financial reporting. After that we describe our model. Thereby,
we present a general as well as specific formulation. Subsequently, we apply our proposed
approach to illustrate its usefulness. The paper concludes with implications, limitations, and
discussion of further research.
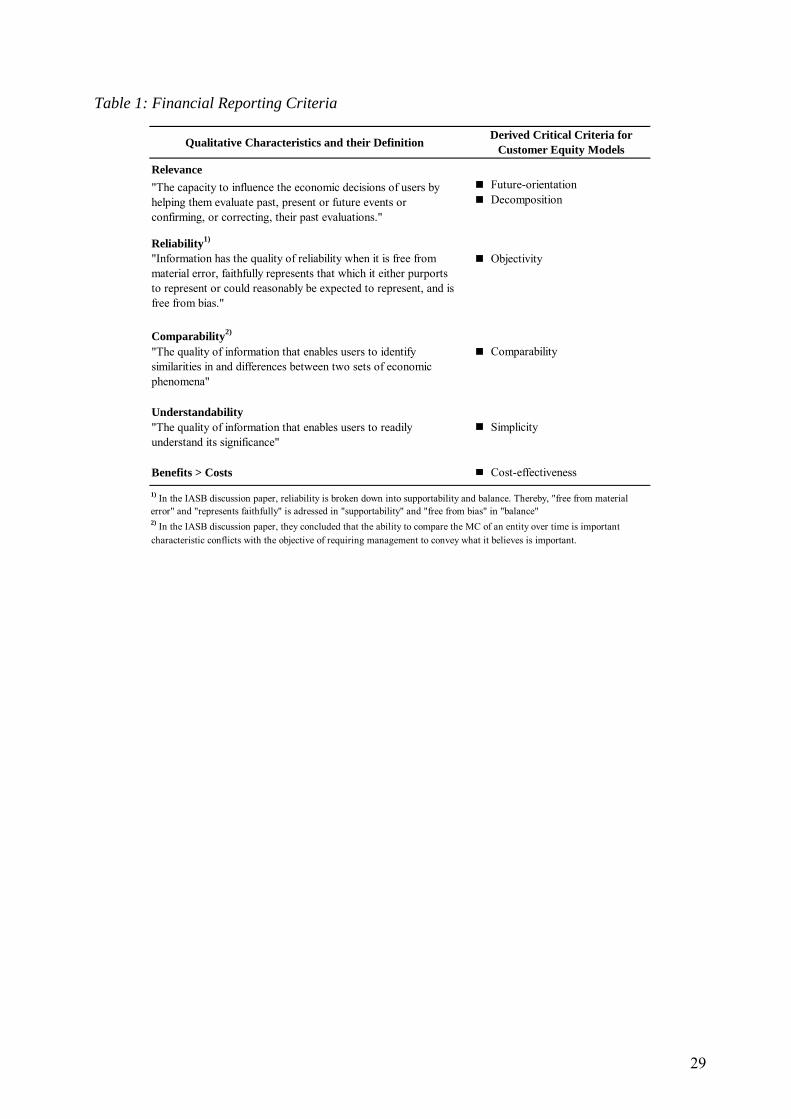
2 Critical Criteria for Financial Reporting The FASB presents qualitative characteristics of financial reporting in its Statements of
Financial Accounting Concepts No. 2 (Financial Accounting Standards Board 1980). These
characteristics are consistent with the IASB Framework for the Preparation and Presentation of
Financial Statements (International Accounting Standards Board 2004) and the criteria
described in the Management Commentary discussion paper (International Accounting
Standards Board 2005). These characteristics appear in the first column of Table 1.
-----------------------------
----- Insert Table 1-----
-----------------------------
Information is considered relevant if it makes a difference in the decision making of the
recipients of financial reports (e.g., managers, analysts, investors, and regulators) by helping
them to form predictions or verify prior expectations. Nagar and Rajan 2005 show empirically
that a set of customer relationship measures improve the explanatory power for next year’s
earnings by 10% to 15% and Fornell et al. 2006 show that investments based on customer
satisfaction produce sizable excess returns with lower systematic risk. According to these
4
studies as well as Gupta et al. 2004 and Wiesel and Skiera 2005, financial analysts have yet to
give more than scant attention to off-balance-sheet assets, even though these assets may be key
determinants of a firm’s market value. If a firm were to include information about the health of
its customer relationships, investors would have a better understanding of the link between the
firm’s assets and its capacity to generate shareholder wealth. The IASB discussion paper
explicitly mentions customer-focused measures as key measures and indicators that, for
instance, retail banks should use to assess operating performance and, hence, should report to
external addresses (International Accounting Standards Board 2005, p. 44). A measure of the
health of the firm’s customer relationships should take future cash flows into account. In this
context, the FASB recently emphasized the importance of discounted cash flow techniques for
accounting measures (Financial Accounting Standards Board 2000). Hence, customer lifetime
value and Customer Equity are ideal measures because of their future orientation. As we
mentioned before, decomposing the changes in Customer Equity explains the derivation of
Customer Equity with respect to customer metrics (e.g., customer retention or customer cash
flow) through several effects, which isolate the effect of one metric from the effects of other
metrics. Such analyses can provide valuable feedback information about what went wrong in
the past and can be improved in the future. For example, in a mature market, a firm acquires
many new customers with positive customer cash flows. Customer Equity from acquisition
increases due the increase in number of customers. Nevertheless, a detailed analysis might
demonstrate that the average customer cash flow decreases over time because the firm acquires
less valuable customers and, hence, weakens their customer portfolio structure.
Reliability means that measures should be free from material error, faithfully represents
that which it either purports to represent or could reasonably be expected to represent, and is
free from bias. The Management Commentary discussion paper addresses “free from material
error” and “represents faithfully” under the criteria supportability. Thereby, measures are
supportable if it faithfully represents, for example, the source of information, inherent
5
uncertainty, and material assumptions, to allow addressees to assess the reliability of the
measures presented for themselves. A prerequisite is the objectivity in data collection and
processing so that different people computing the measure would obtain the same value. “Free
from bias” is addressed in the criteria balance. It means that measures should be dealing even-
handedly with good and bad aspects of the performance and prospects of the entity. As a result
of the preceding discussion, we emphasize three critical criteria for a performance
measurement approach with focuses on Customer Equity to establish relevance and reliability:
future-orientation, decomposition, and objectivity.
Comparability is a further important quality of financial reporting information.
Comparability implies that the measure is consistently applicable across industries and time so
that managers and investors can truly compare the results for different firms over several years.
The Management Commentary discussion paper refers only to comparable over time because
comparability between entities conflicts with the objective of requiring management to convey
what it believes is important. Nevertheless, a performance measurement approach focussing on
Customer Equity could also be applied and compared between entities if it is standardized and
does not depend on specific types of data. Because this also refers to the criteria of simplicity
(see understandability), we underline comparability over time and entities.
Furthermore, the measures should be readily understandable by users and cost-effective.
Many measures suggested in the academic literature require a knowledge most addresses do
not have. Simple models rely only on a few inputs that reduce in addition the number of
potential error sources. Cost-effectiveness is easier to achieve if secondary information can be
used that are ideally collected within the firm anyway. Any necessary primary data collection
should be reduced to a minimum. Critical criteria that derive from the aforementioned issues
are comparability, simplicity, and cost-effectiveness.
A review of accounting journals reveals that there is research which advocates
nonfinancial measures of company performance, such as customer satisfaction and loyalty, as
6
useful indicators of aspects of firm performance (e.g., Said et al. 2003, Smith and Wright
2004). Nevertheless, there is no research which suggests a performance measurement approach
which is in line with the criteria in Table 1 and focuses on the value of the customer base.
Subsequently, we propose such a general approach as well as one possible way to specify the
general approach. Possibly, existing Customer Equity models (such as the one by Gupta et al.
2004 and Rust et al. 2004b) could be further extended to be consistent with financial reporting
criteria which, nevertheless, is not in there focus.
3 Model 3.1 General Formulation
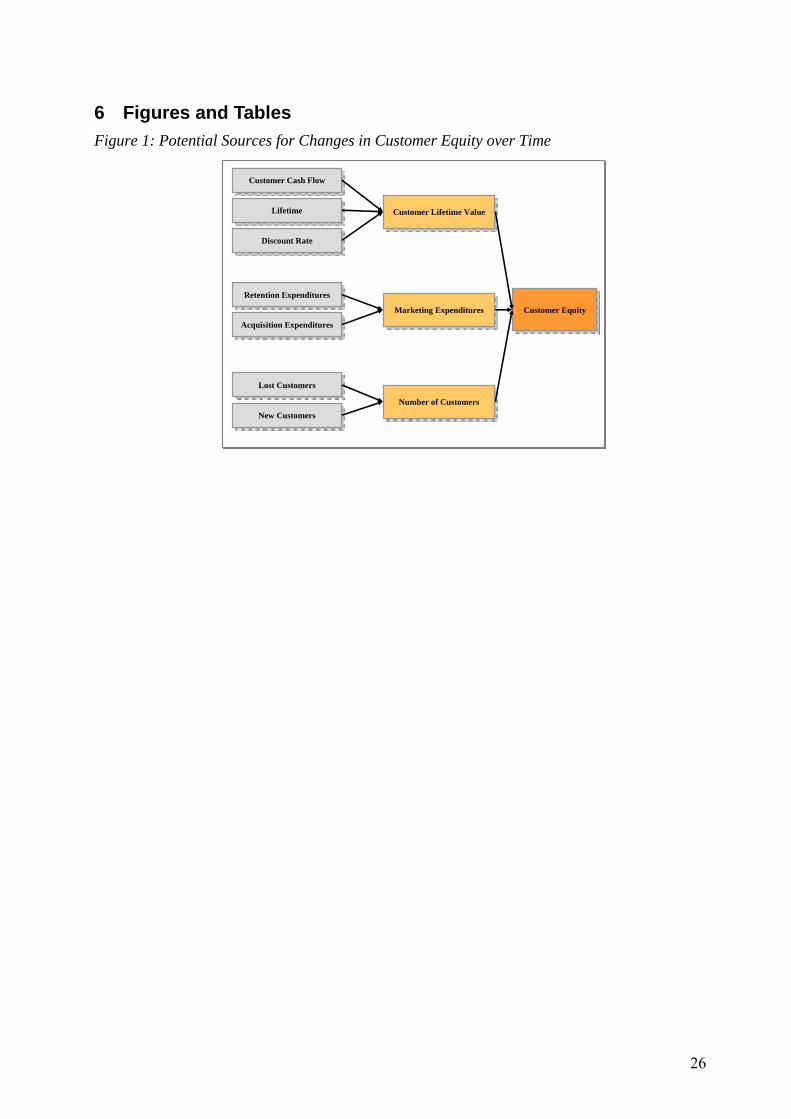
Figure 1 shows the potential sources for changes in Customer Equity over time:
-----------------------------
----- Insert Figure 1-----
-----------------------------
For the purpose of this paper, we define Customer Equity as the sum of the discounted
customer lifetime values of all firm’s current customers in period t (Blattberg and Deighton
1996). Customer lifetime values are determined by the cash flows generated by the customers
(customer cash flow) over her entire relationship with the company (lifetime) discounted by an
appropriate discount rate. To retain or acquire customers, a firm has to invest money (retention
and acquisition expenditures). Summing up the customer lifetime values over the number of
current customers leads to the Customer Equity in period t.
7
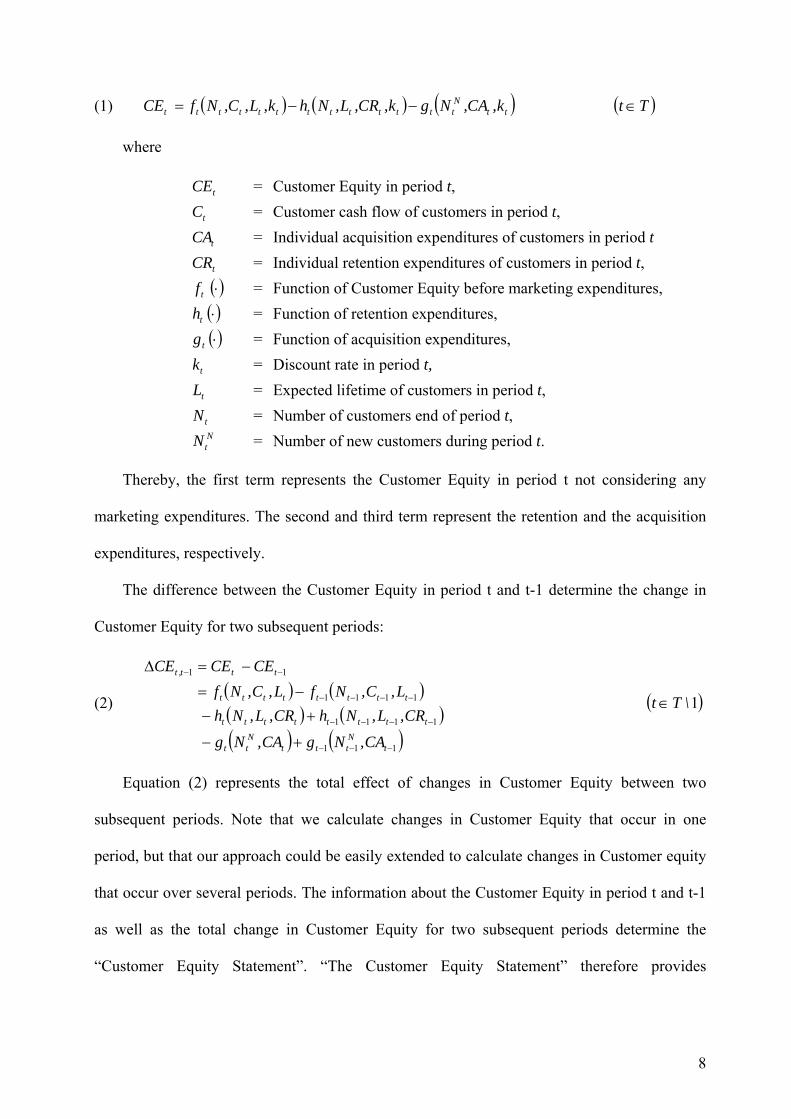
(1) ( ) ( ) ( )ttNttttttttttttt k,CA,Ngk,CR,L,Nhk,L,C,NfCE −−= ( )Tt∈
where
= Customer Equity in period t, tCE = Customer cash flow of customers in period t, tC = Individual acquisition expenditures of customers in period t tCA = Individual retention expenditures of customers in period t, tCR = Function of Customer Equity before marketing expenditures, ( )⋅tf = Function of retention expenditures, ( )⋅th = Function of acquisition expenditures, ( )⋅tg = Discount rate in period t, tk = Expected lifetime of customers in period t, tL = Number of customers end of period t, tN = Number of new customers during period t. N
tN
Thereby, the first term represents the Customer Equity in period t not considering any
marketing expenditures. The second and third term represent the retention and the acquisition
expenditures, respectively.
The difference between the Customer Equity in period t and t-1 determine the change in
Customer Equity for two subsequent periods:
(2) ( ) (( ) (( ) ( )111
1111
1111
11
−−−
−−−−
−−−−
−−
+−
+−−=
−=Δ
tNttt
Ntt
tttttttt
tttttttt
ttt,t
CA,NgCA,Ng
CR,L,NhCR,L,NhL,C,NfL,C,Nf
CECECE)
) ( )1\Tt∈
Equation (2) represents the total effect of changes in Customer Equity between two
subsequent periods. Note that we calculate changes in Customer Equity that occur in one
period, but that our approach could be easily extended to calculate changes in Customer equity
that occur over several periods. The information about the Customer Equity in period t and t-1
as well as the total change in Customer Equity for two subsequent periods determine the
“Customer Equity Statement”. “The Customer Equity Statement” therefore provides
8
information on the development of the customer base and, hence, about how much the value of
the customer base has changed.
Yet, no insights can be gained regarding the sources why the Customer Equity changes
over time. Therefore, the “Customer Equity Flow Statement” decomposes the changes in
Customer Equity over time into direct and interaction effects. Direct effects occur because of
individual variation of one metric while other metrics do not change (e.g., increase in Customer
Equity only due to higher retention rates). In comparison, interaction effects occur because of
simultaneous variations of two or more metrics (e.g., increase in Customer Equity due to
simultaneous increase of customer retention and customer cash flow). The interaction effects
can be determined by subtracting the direct effect from the total effect.
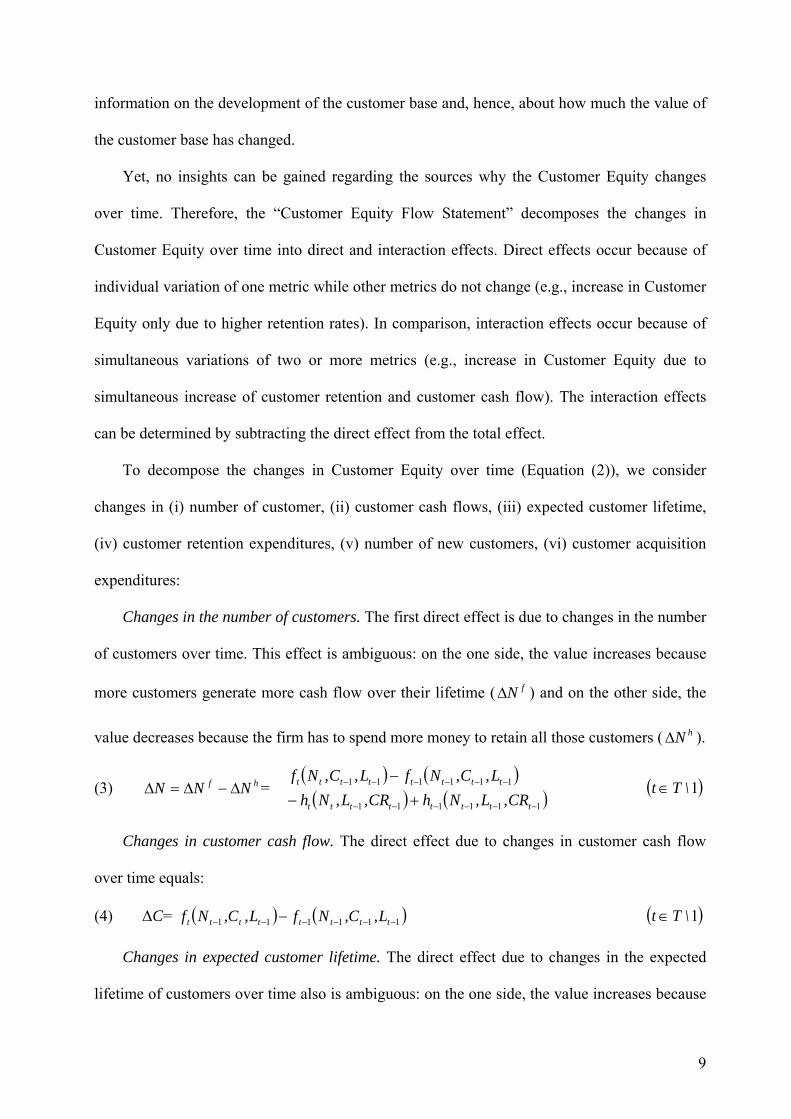
To decompose the changes in Customer Equity over time (Equation (2)), we consider
changes in (i) number of customer, (ii) customer cash flows, (iii) expected customer lifetime,
(iv) customer retention expenditures, (v) number of new customers, (vi) customer acquisition
expenditures:
Changes in the number of customers. The first direct effect is due to changes in the number
of customers over time. This effect is ambiguous: on the one side, the value increases because
more customers generate more cash flow over their lifetime ( ) and on the other side, the
value decreases because the firm has to spend more money to retain all those customers ( ).
fNΔ
hNΔ
(3) = hf NNN Δ−Δ=Δ( ) ( )( ) ( 111111
111111
−−−−−−
−−−−−−
+− )−
tttttttt
tttttttt
CR,L,NhCR,L,NhL,C,NfL,C,Nf
( )1\Tt∈
Changes in customer cash flow. The direct effect due to changes in customer cash flow
over time equals:
(4) ΔC= ( ) ( 111111 −−−−−− − tttttttt L,C,NfL,C,Nf ) ( )1\Tt∈
Changes in expected customer lifetime. The direct effect due to changes in the expected
lifetime of customers over time also is ambiguous: on the one side, the value increases because
9
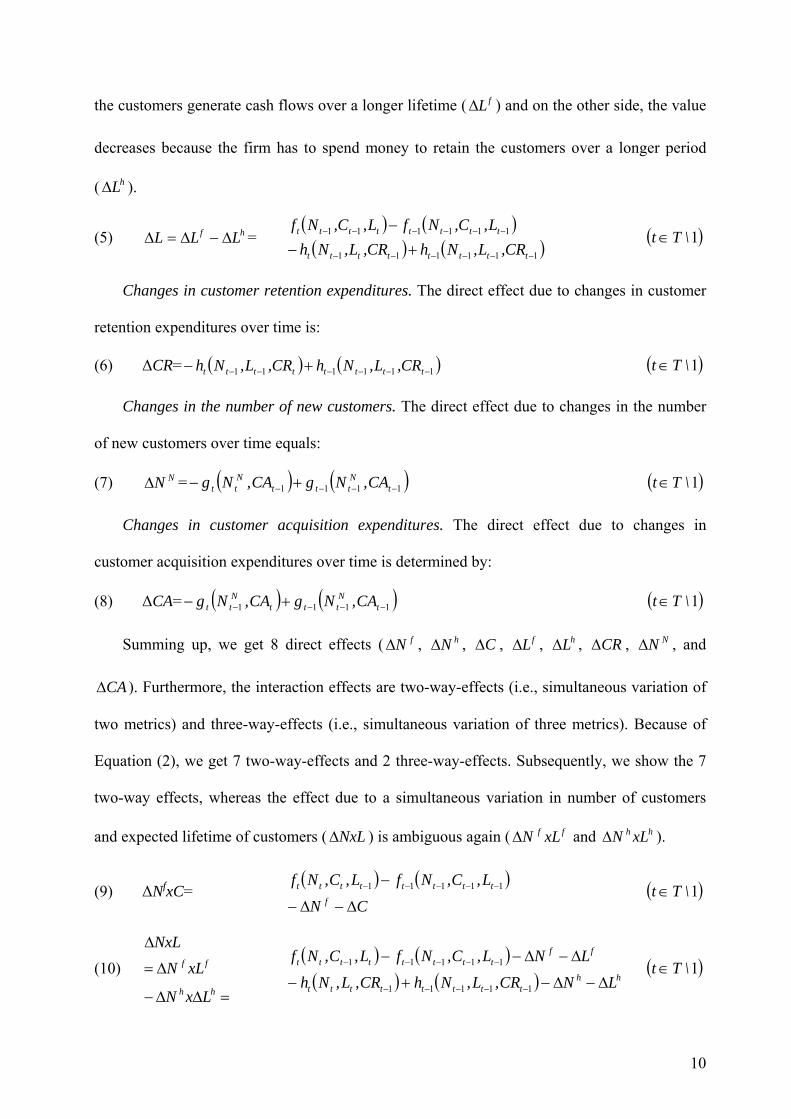
the customers generate cash flows over a longer lifetime ( ) and on the other side, the value
decreases because the firm has to spend money to retain the customers over a longer period
( ).
fLΔ
hLΔ
(5) = hf LLL Δ−Δ=Δ( ) ( )( ) ( 111111
111111
−−−−−−
−−−−−−
+− )−
tttttttt
tttttttt
CR,L,NhCR,L,NhL,C,NfL,C,Nf
( )1\Tt∈
Changes in customer retention expenditures. The direct effect due to changes in customer
retention expenditures over time is:
(6) ΔCR= ( ) ( )111111 −−−−−− +− tttttttt CR,L,NhCR,L,Nh ( )1\Tt∈
Changes in the number of new customers. The direct effect due to changes in the number
of new customers over time equals:
(7) =NNΔ ( ) ( )1111 −−−− +− tNttt
Ntt CA,NgCA,Ng ( )1\Tt∈
Changes in customer acquisition expenditures. The direct effect due to changes in
customer acquisition expenditures over time is determined by:
(8) ΔCA= ( ) ( )1111 −−−− +− tNttt
Ntt CA,NgCA,Ng ( )1\Tt∈
Summing up, we get 8 direct effects ( , , fNΔ hNΔ CΔ , , , , , and
). Furthermore, the interaction effects are two-way-effects (i.e., simultaneous variation of
two metrics) and three-way-effects (i.e., simultaneous variation of three metrics). Because of
Equation
fLΔ hLΔ CRΔ NNΔ
CAΔ
(2), we get 7 two-way-effects and 2 three-way-effects. Subsequently, we show the 7
two-way effects, whereas the effect due to a simultaneous variation in number of customers
and expected lifetime of customers ( NxLΔ ) is ambiguous again ( and ). ff xLNΔ hh xLNΔ
(9) ΔNfxC= ( ) ( )
CN
L,C,NfL,C,Nff
tttttttt
Δ−Δ−
− −−−−− 11111 ( )1\Tt∈
(10)
=ΔΔ−
Δ=
Δ
hh
ff
LxN
xLNNxL
( ) ( )( ) ( ) hh
tttttttt
fftttttttt
LNCR,L,NhCR,L,Nh
LNL,C,NfL,C,Nf
Δ−Δ−+−
Δ−Δ−−
−−−−−
−−−−−
11111
11111 ( )1\Tt∈
10
(11) ΔNhxCR= ( ) ( )
CRN
CR,L,NhCR,L,Nhh
tttttttt
Δ−Δ−
+− −−−−− 11111 ( )1\Tt∈
(12) ΔCxLf= ( ) ( )
f
tttttttt
LC
L,C,NfL,C,Nf
Δ−Δ−
− −−−−− 11111 ( )1\Tt∈
(13) ΔLhxCR= ( ) ( )
CRL
CR,L,NhCR,L,Nhh
tttttttt
Δ−Δ−
+− −−−−− 11111 ( )1\Tt∈
(14) ΔNNxCA= ( ) ( ) CANCA,NgCA,Ng Nt
Nttt
Ntt Δ−Δ−+− −−− 111 ( )1\Tt∈
Additionally, there are 2 three-way-effects:
(15) ΔNfxCxLf= ( ) ( )
CxLxLNNxCLCN
L,C,NfL,C,Nfffff
tttttttt
Δ−Δ−Δ−Δ−Δ−Δ−
− −−−− 1111 ( )1\Tt∈
(16) ΔNhxLhxCR= ( ) ( )
LxCRNxCRxLNCRLN
CR,L,NhCR,L,Nhhhhh
tttttttt
Δ−Δ−Δ−Δ−Δ−Δ−
+− −−−− 1111 ( )1\Tt∈
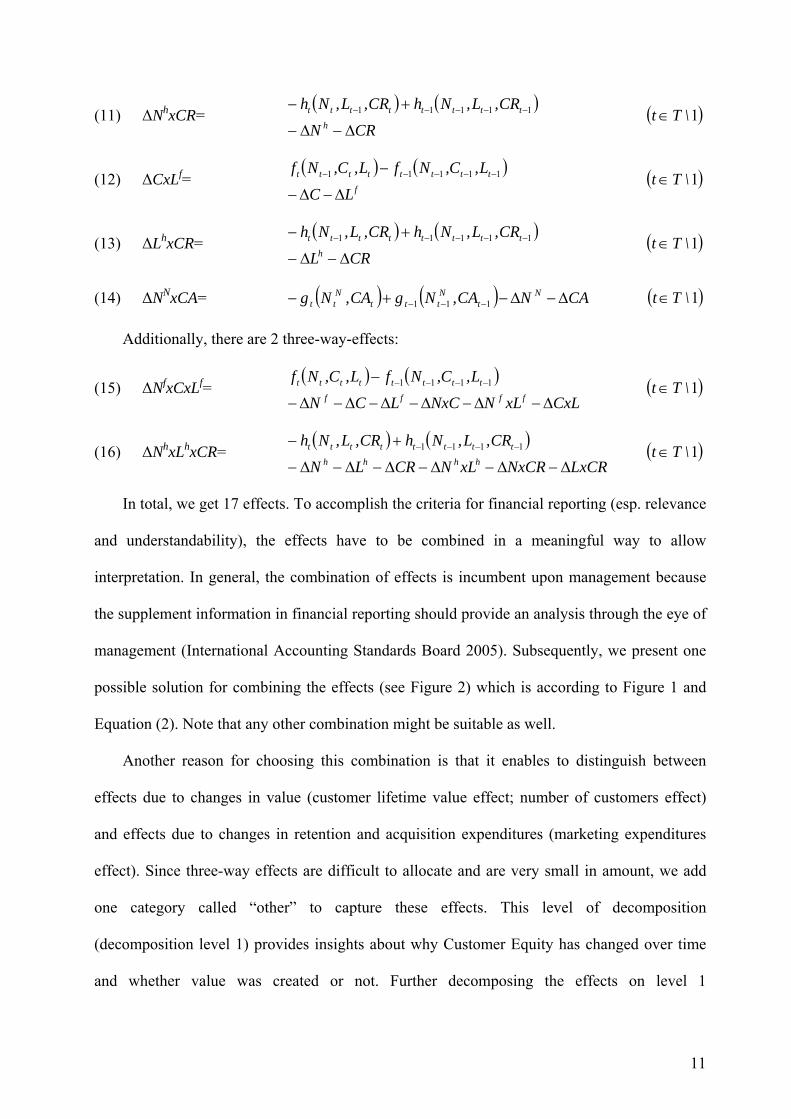
In total, we get 17 effects. To accomplish the criteria for financial reporting (esp. relevance
and understandability), the effects have to be combined in a meaningful way to allow
interpretation. In general, the combination of effects is incumbent upon management because
the supplement information in financial reporting should provide an analysis through the eye of
management (International Accounting Standards Board 2005). Subsequently, we present one
possible solution for combining the effects (see Figure 2) which is according to Figure 1 and
Equation (2). Note that any other combination might be suitable as well.
Another reason for choosing this combination is that it enables to distinguish between
effects due to changes in value (customer lifetime value effect; number of customers effect)
and effects due to changes in retention and acquisition expenditures (marketing expenditures
effect). Since three-way effects are difficult to allocate and are very small in amount, we add
one category called “other” to capture these effects. This level of decomposition
(decomposition level 1) provides insights about why Customer Equity has changed over time
and whether value was created or not. Further decomposing the effects on level 1
11
(decomposition level 2) provides detailed insights about the value creation through acquisition
as well as retention activities.
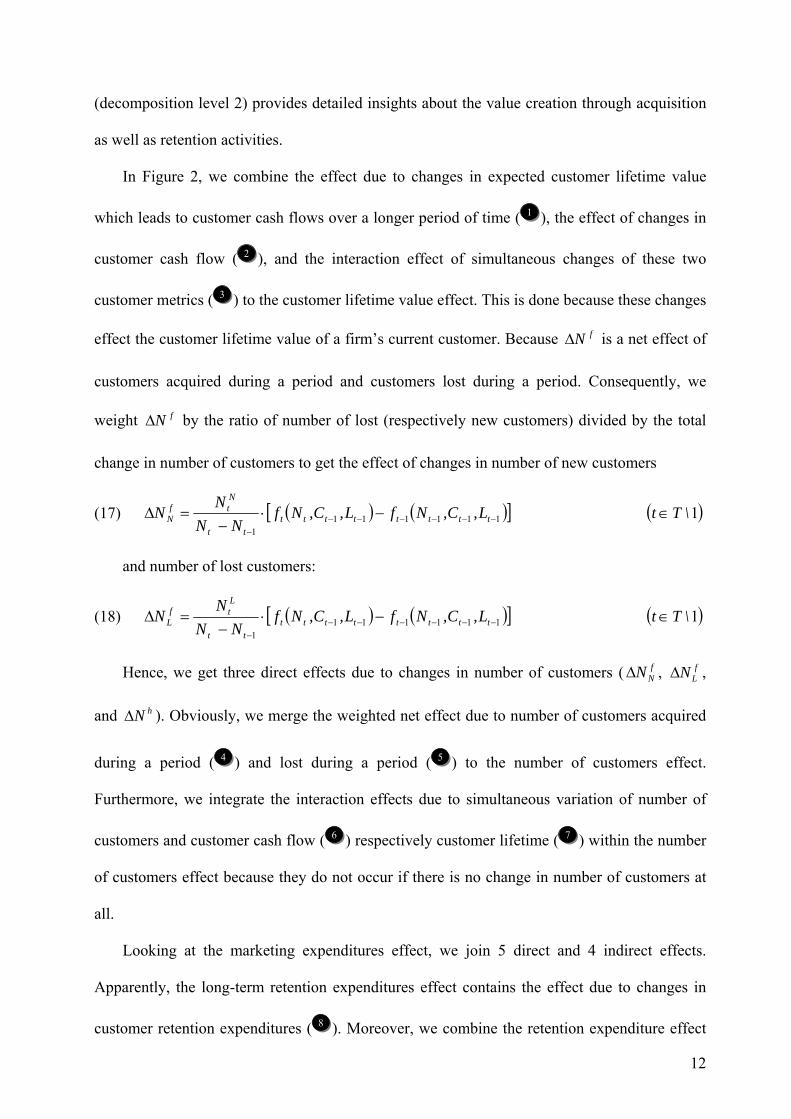
In Figure 2, we combine the effect due to changes in expected customer lifetime value
which leads to customer cash flows over a longer period of time ( 11 ), the effect of changes in
customer cash flow ( 22 ), and the interaction effect of simultaneous changes of these two
customer metrics ( 33 ) to the customer lifetime value effect. This is done because these changes
effect the customer lifetime value of a firm’s current customer. Because is a net effect of
customers acquired during a period and customers lost during a period. Consequently, we
weight by the ratio of number of lost (respectively new customers) divided by the total
change in number of customers to get the effect of changes in number of new customers
fNΔ
fNΔ
(17) ( ) ([ ]1111111
−−−−−−−
−⋅−
=Δ tttttttttt
Ntf
N L,C,NfL,C,NfNN
NN ) ( )1\Tt∈
and number of lost customers:
(18) ( ) ([ ]1111111
−−−−−−−
−⋅−
=Δ tttttttttt
Ltf
L L,C,NfL,C,NfNN
NN ) ( )1\Tt∈
Hence, we get three direct effects due to changes in number of customers ( , ,
and ). Obviously, we merge the weighted net effect due to number of customers acquired
during a period (
fNNΔ f
LNΔ
hNΔ
44 ) and lost during a period ( 55 ) to the number of customers effect.
Furthermore, we integrate the interaction effects due to simultaneous variation of number of
customers and customer cash flow ( 66 ) respectively customer lifetime ( 77 ) within the number
of customers effect because they do not occur if there is no change in number of customers at
all.
Looking at the marketing expenditures effect, we join 5 direct and 4 indirect effects.
Apparently, the long-term retention expenditures effect contains the effect due to changes in
customer retention expenditures ( 88 ). Moreover, we combine the retention expenditure effect
12

due to changes in number of customers ( 99 ) as well as changes in customer lifetime ( 1111 ). The
latter two effects are included here because they influence the total retention expenditures.
Consequently, all associated interaction effects ( 1010 , 1212 , 1313 ) are included there as well. The
short-term acquisition expenditures effect consists of the effect due to changes in customer
acquisition expenditures ( 1414 ), the acquisition expenditure effect due to the number of new
customers ( 1515 ) and the associated interaction effect ( 1616 ). Again the acquisition expenditure
effect due to the number of new customers is included here because they influence the total
acquisition expenditures. Finally, as stated before, the 2 three-way ( 1717 , 1818 ) are combined as
other.
-----------------------------
----- Insert Figure 2-----
-----------------------------
Furthermore, we introduce 5 additional long-term customer performance measures which
assist to derive more detailed implications regarding the firm’s customer management activities
(see Table 2):
New Customer Value Creation. This measure is the long-term value of new customers
subtracted by the long-term investments to acquire and retain new customers. Hence, this
measure shows whether or not long-term value is created through the new acquired customers.
Return on New Customer Acquisition. This measure is similar to the one before since it is
the ration of the long-term value of new customers and the long-term investments to acquire
and retain new customers minus 1. Consequently, this measure shows the return on investment
of new customer acquisition.
Incremental Acquisition Expenditures Effectiveness. This measure is the ratio of the long-
time value of new customers acquired in period t and long-time value of new customers
acquired in period t-1 divided by the ratio of short-term investments to acquire new customers
13

in period t and short-term investments to acquire new customers in period t-1. This measure
demonstrates the effectiveness of incremental investments in customer acquisition activities
compared to previous periods. Hence, it enables to evaluate whether the firm was more
effective with its incremental customer acquisition investments in terms of acquiring new
customers. The range for this measure is [0,∞] and the higher the measure the more effective
the firm has been.
Incremental Customer Lifetime Value Creation (per customer). This measure is the long-
term effect of changes in customer lifetime value (customer lifetime value effect in Figure 2)
minus incremental long-term investments to retain one customer. Thus, it shows whether or not
long-term customer lifetime value per customer was created through incremental customer
retention activities compared to previous periods.
Incremental Retention Expenditures Effectiveness. This measure is the ratio of the long-
time effect of changes in customer lifetime value in period t and the long-time effect of changes
in customer lifetime value in period t-1 divided by the ratio of incremental long-term
investments to retain customers in period t and incremental long-term investments to retain
customers in period t-1. Consequently, this measure shows the effectiveness of incremental
investments in customer retention activities. Again, the range for this measure is [0,∞] and the
higher the measure the more effective the firm has been.
-----------------------------
----- Insert Table 2-----
-----------------------------
Netflix.com mentions in their financial reports that they review acquisition expenditures to
evaluate how effective their marketing programs are in acquiring new subscribers on an
economical basis. In our point of view, this economical basis reflects only a short-term
perspective and underestimates the impact of their marketing programs. Long-term statements
14
can be derived if using those customer performance measures in conjunction with the
“Customer Equity Statement” and “Customer Equity Flow Statement”.
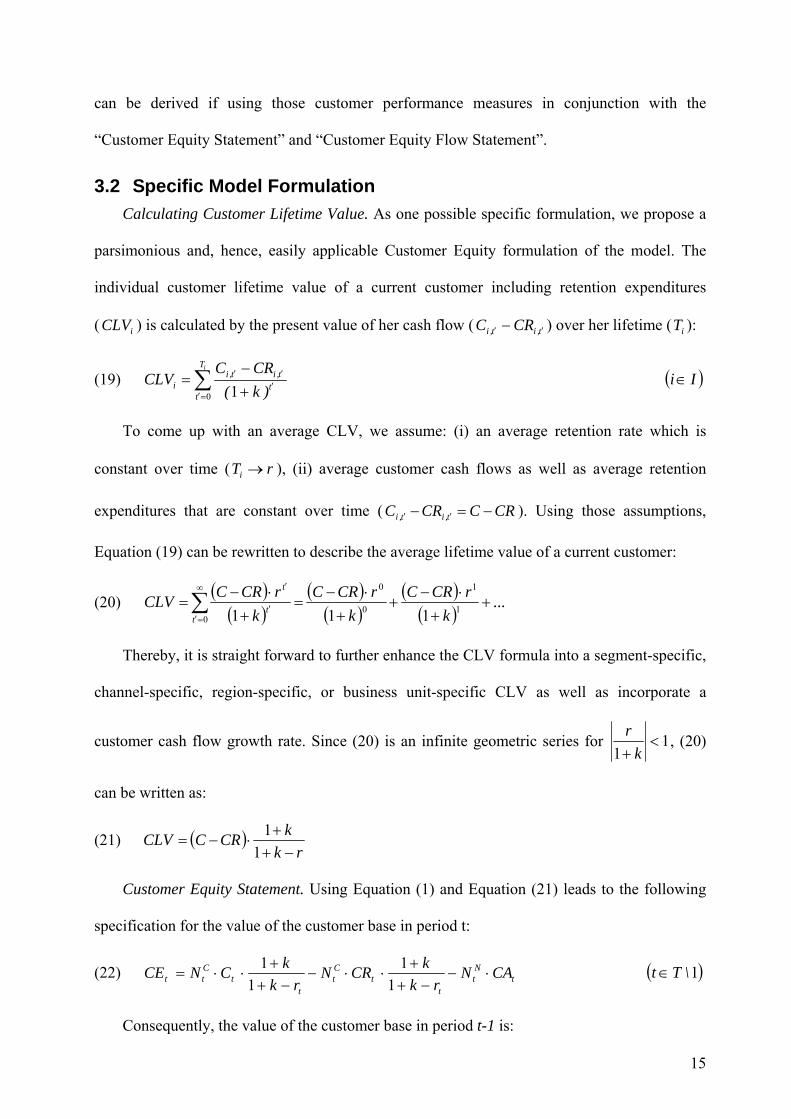
3.2 Specific Model Formulation Calculating Customer Lifetime Value. As one possible specific formulation, we propose a
parsimonious and, hence, easily applicable Customer Equity formulation of the model. The
individual customer lifetime value of a current customer including retention expenditures
( ) is calculated by the present value of her cash flow (iCLV t,it,i CRC ′′ − ) over her lifetime ( ): iT
(19) ∑=′
′′′
+−
=iT
tt
t,it,ii )k(
CRCCLV
0 1 ( )Ii∈
To come up with an average CLV, we assume: (i) an average retention rate which is
constant over time ( ), (ii) average customer cash flows as well as average retention
expenditures that are constant over time (
rTi →
CRCCRC t,it,i −=− ′′ ). Using those assumptions,
Equation (19) can be rewritten to describe the average lifetime value of a current customer:
(20) ( )( )
( )( )
( )( )
...k
rCRCk
rCRCk
rCRCCLVt
t
t
++
⋅−+
+⋅−
=+
⋅−=∑
∞
=′′
′
1
1
0
0
0 111
Thereby, it is straight forward to further enhance the CLV formula into a segment-specific,
channel-specific, region-specific, or business unit-specific CLV as well as incorporate a
customer cash flow growth rate. Since (20) is an infinite geometric series for 11
<+ kr , (20)
can be written as:
(21) ( )rk
kCRCCLV−+
+⋅−=1
1
Customer Equity Statement. Using Equation (1) and Equation (21) leads to the following
specification for the value of the customer base in period t:
(22) tNt
tt
Ct
tt
Ctt CAN
rkkCRN
rkkCNCE ⋅−
−++
⋅⋅−−+
+⋅⋅=
11
11 ( )1\Tt∈
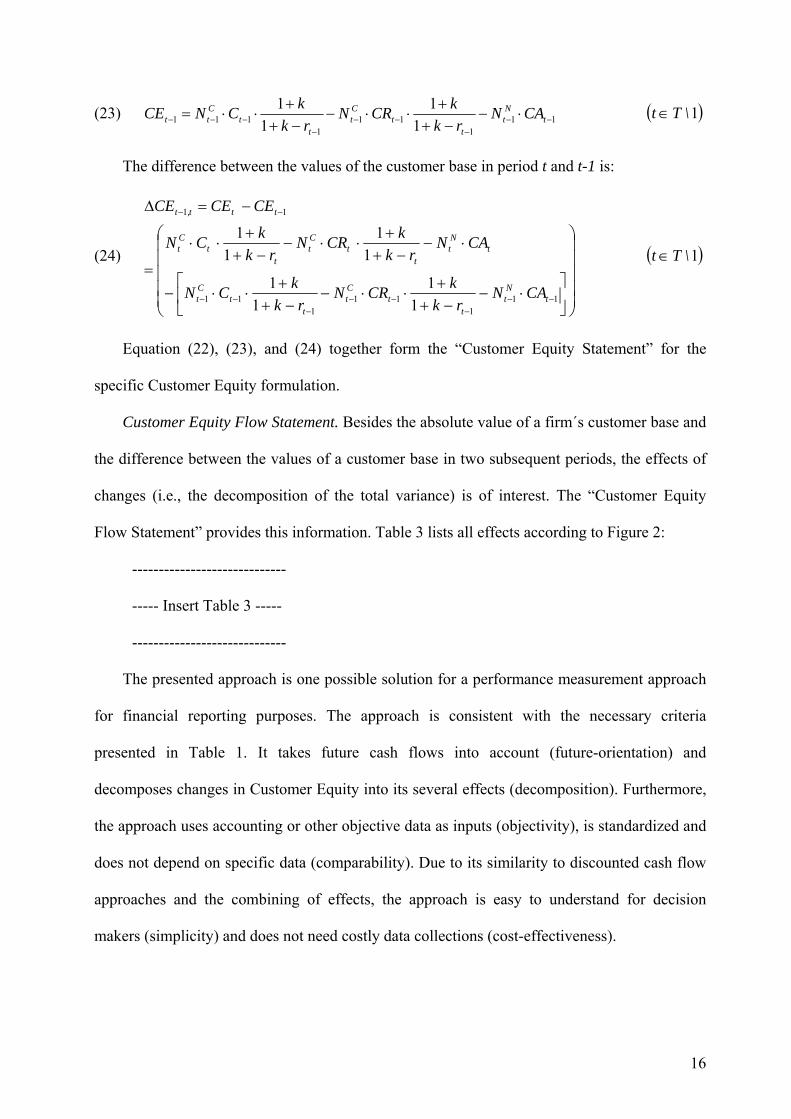
Consequently, the value of the customer base in period t-1 is:
15
(23) 111
111
111 11
11
−−−
−−−
−−− ⋅−−++
⋅⋅−−++
⋅⋅= tNt
tt
Ct
tt
Ctt CAN
rkkCRN
rkkCNCE ( )1\Tt∈
The difference between the values of the customer base in period t and t-1 is:
(24)
⎟⎟⎟⎟⎟
⎠
⎞
⎜⎜⎜⎜⎜
⎝
⎛
⎥⎦
⎤⎢⎣
⎡⋅−
−++
⋅⋅−−++
⋅⋅−
⋅−−+
+⋅⋅−
−++
⋅⋅
=
−=Δ
−−−
−−−
−−
−−
111
111
11
11
11
11
11
11
tNt
tt
Ct
tt
Ct
tNt
tt
Ct
tt
Ct
ttt,t
CANrk
kCRNrk
kCN
CANrk
kCRNrk
kCN
CECECE
( )1\Tt∈
Equation (22), (23), and (24) together form the “Customer Equity Statement” for the
specific Customer Equity formulation.
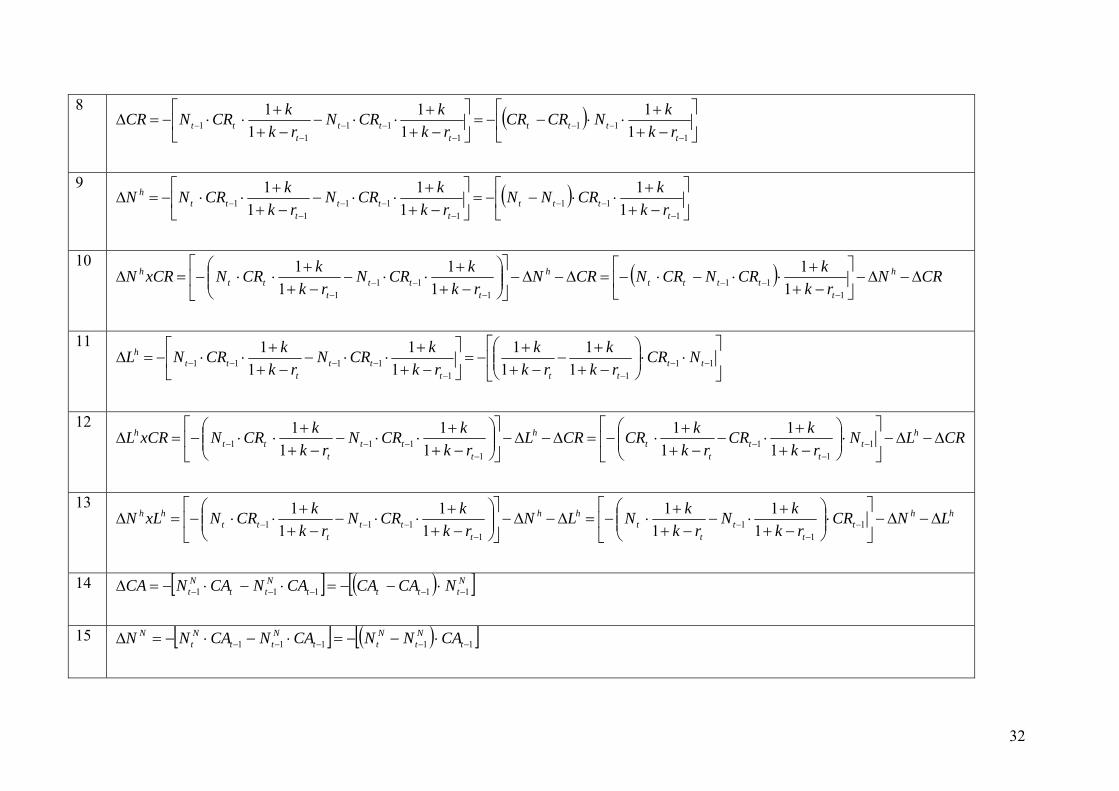
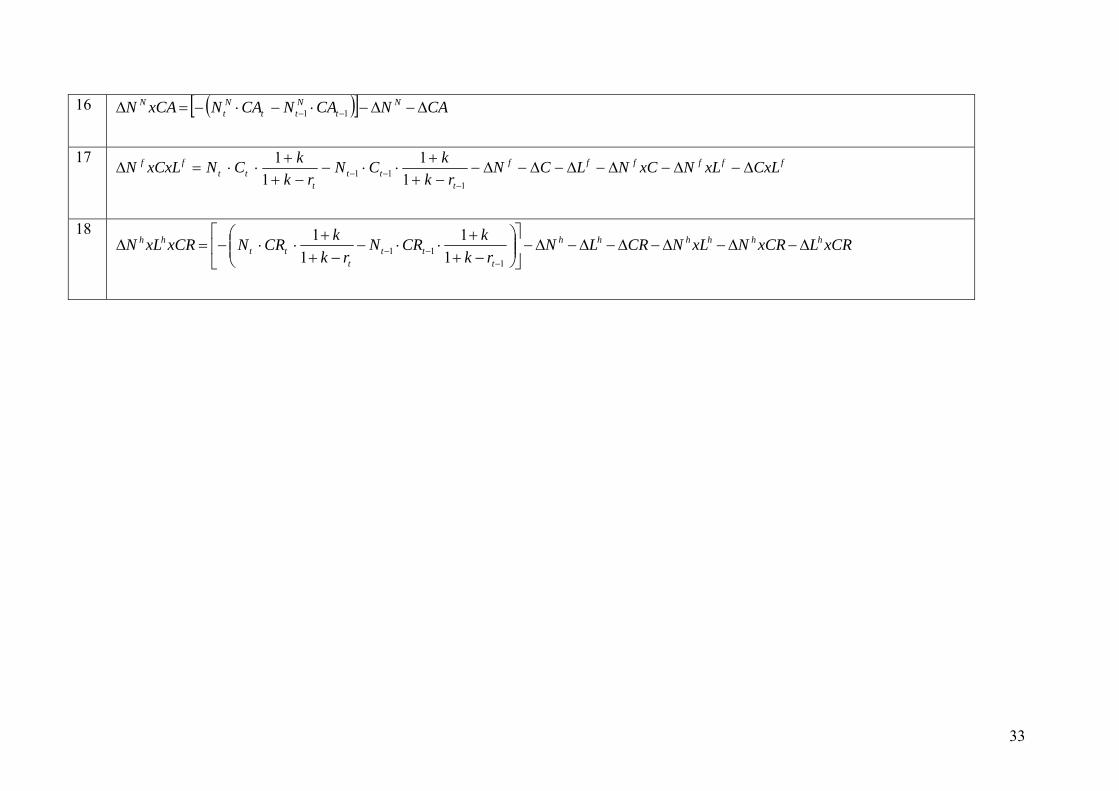
Customer Equity Flow Statement. Besides the absolute value of a firm´s customer base and
the difference between the values of a customer base in two subsequent periods, the effects of
changes (i.e., the decomposition of the total variance) is of interest. The “Customer Equity
Flow Statement” provides this information. Table 3 lists all effects according to Figure 2:
-----------------------------
----- Insert Table 3 -----
-----------------------------
The presented approach is one possible solution for a performance measurement approach
for financial reporting purposes. The approach is consistent with the necessary criteria
presented in Table 1. It takes future cash flows into account (future-orientation) and
decomposes changes in Customer Equity into its several effects (decomposition). Furthermore,
the approach uses accounting or other objective data as inputs (objectivity), is standardized and
does not depend on specific data (comparability). Due to its similarity to discounted cash flow
approaches and the combining of effects, the approach is easy to understand for decision
makers (simplicity) and does not need costly data collections (cost-effectiveness).
16
4 Illustrative Application 4.1 Data
Since Netflix.com already provides information about customer churn, subscribers’
acquisition cost, and gross margin as well as reviews these metrics to evaluate the effectiveness
of their operational strategies, we apply our approach to Netflix.com. In doing so, our aim is (i)
to illustrate that it is more appropriate to look at the effects of changes of the long-term value of
the customer base as well as those additional long-term customer performance measures than
looking at short-term customer metrics, and (ii) to demonstrate the applicability and usefulness
of the approach.
We use quarterly publicly available data from annual reports, 10-K and 10-Q statements,
and other company reports for the period from September 2001 to September 2005. The data
for each quarter include number of subscribers (free, paid, and total), subscription revenue,
subscription cost of revenue, operating expenses, monthly churn rate, subscribers’ acquisition
cost, and marketing expenditures. Using these data, we calculate the quarterly subscription cash
flow per customer by subtracting the quarterly subscription cost of revenue and quarterly
operating expenses without marketing from the quarterly subscription revenue and divide it by
the quarterly number of paid subscribers. Because Netflix.com reports a monthly churn rate, we
determine the quarterly retention rate by cubing the term (1- reporting monthly churn rate).
Furthermore, we calculate the quarterly number of lost customers by multiplying the previous
period´s number of paid customers with the quarterly churn rate and determine the number of
new customers by adding the quarterly number of lost customers to the difference in quarterly
number of paid subscribers of two subsequent quarters. Moreover, we use the reported
quarterly subscribers acquisition cost as quarterly acquisition expenditures. No information is
given about the discount rate and the retention expenditures. Hence, we choose the annual
discount rate to be 10% (quarterly discount rate amounts to 2.41%) and neglect retention
expenditures although this reduces the interpretation of our results. For illustration reasons,
17
Table 4 lists only the resulting customer metrics for the second and third quarter of 2005.
Furthermore, it lists the customer metrics for the third quarter of 2004 because in financial
reports, operating results are often compared to the preceding quarter of the current year as well
as the same quarter in the previous year.
-----------------------------
----- Insert Table 4-----
-----------------------------
In their 10-Q statement, Netflix.com mentions that management (i) reviews churn rate to
evaluate whether they are retaining their existing subscribers in accordance with their business
plans, (ii) reviews acquisition expenditures to evaluate how effective their marketing programs
are in acquiring new subscribers on an economical basis, and (iii) believes that it is useful to
monitor these metrics together and not individually as they do not make business decision
based upon any single metric. Looking at the customer metrics in Table 4 shows that
Netflix.com was able to increase their customer base by approximately 60% between the third
quarter in 2004 and 2005 and by about 10% between the two subsequent quarters in 2005.
Similarly, Netflix.com increased their quarterly number of new customers by approximately
61% (14%) between the third quarter in 2004 and the third quarter in 2005 (second quarter
2005 and third quarter 2005). The quarterly number of lost customers increased by
approximately 20% between the two third quarters and decreased by around 1% between the
two quarters of 2005. Customer cash flow has decreased by approximately 41% over the year
but increased by about 12% between Q2 and Q3 2005. Acquisition expenditures have
developed pretty nicely with a decrease of approximately 4% during the year and 7% between
the quarters. The retention rate increase during the year by about 4% and between the second
and third quarters by 1%.
Nevertheless, monitoring these customer metrics does not allow any statement about the
long-term contribution of Netflix.com´s activity. Although Netflix.com mentions that they
18
review acquisition expenditures to evaluate how effective their marketing programs are in
acquiring new subscribers on an economical basis, this economical basis reflects only a short-
term perspective and underestimates the impact of their marketing programs. Long-term
statements can be derived when using the customer metrics to calculate customer lifetime
values (using Equation (21)), Customer Equity (using Equation (22)) and the additional long-
term customer performance measures.
4.2 Customer Equity Statement Table 5 shows the Customer Equity Statement. Netflix.com´s Customer Equity increased
about 36% from $ 208.42 million in September 2004 to $ 238.68 million in September 2005,
whereas the Customer Equity in the second quarter of 2005 is almost 16% lower than the
Customer Equity in September 2004. Customer Equity increased approximately 15% in Q3
2005. Looking at the changes of Customer Equity over a quarter reveal that the long-term value
of Netflix.com´s customer base increased in all quarters in Table 5. Note that Table 5 shows the
change in Customer Equity in the stated quarters.
-----------------------------
----- Insert Table 5-----
-----------------------------
Figure 3 illustrates that changes in Customer Equity over time have been relatively volatile
since second quarter of 2004 compared to the preceding quarters, whereas we cannot observe
any trend.
-----------------------------
----- Insert Figure 3-----
-----------------------------
Hence, the Customer Equity Statement shows that the long-term value of Netflix.com´s
customer base increased over time. Merely looking at the quarterly customer metrics does not
enable to conduct statements concerning the long-term contribution of Netflix.com´s customer
19
base. The Customer Equity Statement, which monitors the Customer Equity over time,
provides management and investors with information about the development of the long-term
value of the customer base. Nevertheless, it does not provide information about the sources of
changes in Customer Equity over time which enhances the analysis. This is offered by the
Customer Equity Flow Statement which is subject of the next section.
4.3 Customer Equity Flow Statement Table 6 shows Netflix.com´s Customer Equity Flow Statement. The effects are combined
according to Figure 2. As mentioned before, there is no retention expenditure effect because of
lack of data. Again, the Customer Equity Flow Statement in Table 6 enables management and
investors to compare the operating results to the preceding quarter of the current year as well as
the same quarter in the previous year.
Netflix.com´s third quarter Customer Equity in 2005 increased close to $ 63.30 million
compared to an increase in Customer Equity about $ 48.45 million in the second quarter of
2005. This increase was mainly due to a positive customer lifetime value effect ($ 41.30
million) which amounted to 65% of the total decrease of Customer Equity and was higher than
in the second quarter ($ 28.40 million). Further decomposing this effect illustrates that there
was a positive change in customer lifetime ($ 14.69 million) as well as customer cash flow ($
24.78 million). Again, both effects were higher than the previous quarter in that year. Not
considering the C/L interaction effect (i.e., simultaneous variation of customer cash flow and
retention rate) would lead to an underestimation of the customer lifetime effect in the second
and third quarter of 2005.
The number of customer effect was positive ($ 23.99 million) mainly because of a positive
new customer effect ($ 44.48 million). But they also decreased its value of the customer base
by losing customers ($ -24.47 million). The new customer effect shows an increased
development compared to the second quarter, whereas the lost customer effect increases as well
due to a higher customer base. Netflix.com decreased their acquisition expenditures per
20
customer in Q3 2005 compared to Q2 2005 which led to a positive acquisition expenditures
effect ($ 0.95 million) and acquired more new customers compared to the second quarter of
2004 which led to a negative expenditures effect due to the number of new customers ($ -3.27
million). Hence, Netflix.com was able to decrease the acquisition expenditures effect in two
subsequent periods but acquired in the second quarter of 2005 fewer customers than in the first
quarter of 2005 (0.76 million new customers in Q1 2005 versus 0.61 million new customers in
Q2 2005).
Compared to the third quarter in 2004, Netflix.com was not able to increase its customer
cash flow that much but increased the customer lifetime this quarter. Nevertheless, the
customer lifetime value effect was approximately half of that in Q3 2004. Furthermore, the
increase in the lost customer effect was higher than in the third quarter 2004 although it was
about the same in the second quarter of 2005. Contrarily, Netflix.com was able to further
increase its new customer effect compared to the third quarter of 2004.
-----------------------------
----- Insert Table 6-----
-----------------------------
Figure 3 illustrates the development of the several effects over time. One can see that there
is a positive (negative) trend in the new (lost) customer effect over time. The other effects have
been relatively volatile since second quarter 2004 compared to the preceding quarters, whereas
the marketing expenditures effects has been quit volatile over the whole 15 quarters.
Nevertheless, we cannot observe any seasonal effects.
4.4 Additional Long-Term Customer Performance Measures Finally, Table 7 illustrates the values of our additional long-term customer performance
measures explained in Table 2. The reason for those additional measures is that they enhance
the analysis for managers and investors. They are much more appropriate to evaluate how
effective Netflix.com´s marketing programs were in acquiring new subscribers on an
21
economical basis than looking at the acquisition expenditures as it is done by the management
so far. Thereby, we are only able to present 4 out of 5 measures because of the lack of data
concerning the retention expenditures. As a result of the same reason, the incremental customer
lifetime value creation equals the customer lifetime value effect in Table 6.
In all quarters, Netflix.com was able to create long-term value though new customer
acquisition. In the third quarter of 2005, the long-term investments to acquire and retain new
customers amount to $ 24.91 million, compared to $ 22.73 million in the second quarter of
2005 and $ 16.51 million in the third quarter of 2004. Subtracting these amounts from the long-
term value of new customers (new customer effect in Table 6), leads to value creation though
new customer acquisition of $ 19.57 million in the third quarter of 2005, $ 10.15 million in the
second quarter of 2005, and $ 10.61 million in the third quarter of 2004.
Apparently, the return on new customer acquisition is positive and yields 79% in the third
quarter of 2005, 45% in the second quarter of 2005, and 64% in the third quarter of 2004. The
incremental acquisition expenditures effectiveness is 1.23 in the third quarter of 2005, 0.63 in
the second quarter of 2005, and 0.82 in the third quarter of 2004. This measure demonstrates
the effectiveness of incremental investments in customer acquisition activities compared to
previous periods. Hence, it enables to evaluate whether the firm was more effective with its
incremental customer acquisition investments in terms of acquiring new customers. The range
for this measure is [0,∞] and the higher the measure the more effective the firm has been. As a
result, Netflix.com was more effective in acquiring new customers in the third quarter of 2005
compared to the second quarter in 2005 and the third quarter in 2004. This is because in the
third quarter of 2005, Netflix.com was able to gain approximately 35% more value from new
customer acquisition compared to the preceding quarter, whereas the expenditures increased
only by about 10%. Comparably, although Netflix.com decreased its acquisition expenditures
by around 21% in the second quarter of 2004, it also decreased the value of new customers by
approximately 50%. In the third quarter of 2004, Netflix.com also decreased its value of new
22

customers compared to the preceding quarter by about 18% but was able to maintain the
acquisition expenditures on the same level.
-----------------------------
----- Insert Table 7-----
-----------------------------
Summing up, Netflix.com is on a good track. In all quarters we looked at, Netflix.com was
able to increase its customer cash flow compared to the previous quarter. This could be, for
example, because of higher usage of its service, more profitable customers, and/or more
effective handling or economies of scale and, hence, lower operating expenses. Furthermore, in
2 out of 3 quarters, Netflix.com increased customer retention which could be, for example,
because of higher customer satisfaction or inferior offers from competitors. This had also an
effect of the decrease in the lost customer effect over time although Netflix.com had a higher
customer base. Hence, Netflix.com was able to better retain their customers which led to higher
value of their customer base. The net effect of the changes in number of customers increased in
the four quarters and Netflix.com was able to create long-term value through their marketing
activities in all quarters.
5 Conclusions, Limitations, and Future Research This paper proposes a performance measurement approach which is in line with the
financial reporting criteria and focuses on the value of a firm’s customer base (Customer
Equity). The approach provides relevant performance metrics for monitoring customer
management activities (on a strategic level), reduces information asymmetries, assists
communicating value and customer-orientation, and enables external addressees to monitor
firm performance. In particular, our approach enables to monitor the Customer Equity over
time (Customer Equity Statement), decompose changes in Customer Equity over time
(Customer Equity Flow Statement), and enables to derive more detailed implications regarding
the firm’s customer management activities. The main purpose of the Customer Equity
23
Statement and Customer Equity Flow Statement is to visualize the development of the
customer base value, the existence of possible negative evolutions, and the sources of changes
in Customer Equity. As such, it illustrates the management that a decrease in Customer Equity
over time could be, for example, due to a decrease in customer retention. Nevertheless, it does
not provide the reasoning of the decrease in customer retention, which might be due to, for
example, a decrease in customer satisfaction or superior offers from competitors. Identifying
the reasons of change in customer metrics has to be done on a more operational level (e.g.,
which products to sell to which customers) and is not in the scope of this strategic approach.
We demonstrate the applicability of the approach by applying it to the customer base of
Netflix.com and visualize the insight one can get out of such an analysis.
Our approach is subject to limitations, which suggest opportunities for further research.
First, although our analysis offers generalizability over a large number of firms, we study only
one single firm. Further research might examine the customer base of multiple firms and/or
different industries. Second, our approach is also able to incorporate customer retention
expenditures to measure the value creation. Because no retention expenditure information was
given, further research could include retention expenditure data from, for example, firms or
external sources. Third, the specific formulation of our model is one possible solution.
Thereby, we assume constant retention rates, customer cash flow, and retention as well as
acquisition expenditures. Further research could come up with a more sophisticated customer
lifetime value und Customer Equity formulation which would, for example, incorporate
varying retention rates or customer cash flow over time. All the foregoing research
opportunities have implication for data collection and, more important, on simplicity. Yet,
when relaxing the assumptions of the specific model, the criteria for financial reporting have to
be kept in mind. Finally, firms might fear revealing information about their customer base to
external addresses such as competitors. Although this fear is valid on an individual customer
basis, competitors do not get much insight if firms report the value of its customer base by
24
segment or on firm level. Nevertheless, recent research has shown that information about
customer relationships could improve decision making. This state of affairs is unlikely to
change unless shareholders, corporate boards, and investors put more pressure on companies to
provide this information.
Summing up, due to new accounting regulations, the value of intangibles assets such as
brands and customers is required to be stated within financial reports. These developments
increase the demand for suitable approaches to value intangible assets. Our performance
measurement approach provides a starting point for considering the value of the customer base
in a firm’s financial report. We emphasize that the approach should supplement and
complement current information in financial statements as it is asked for by SEC and IASB.
Marketing literature has developed and discussed the concept of Customer and Brand Equity in
depth. Hence, marketing academics should take a leading role in transferring that knowledge to
other areas such as accounting or finance.
25
6 Figures and Tables Figure 1: Potential Sources for Changes in Customer Equity over Time
Customer Cash FlowCustomer Cash Flow
Customer Lifetime ValueCustomer Lifetime Value
Customer EquityCustomer Equity
Number of CustomersNumber of Customers
LifetimeLifetime
Discount RateDiscount Rate
Retention ExpendituresRetention Expenditures
Marketing ExpendituresMarketing Expenditures
Acquisition ExpendituresAcquisition Expenditures
Lost CustomersLost Customers
New CustomersNew Customers
26
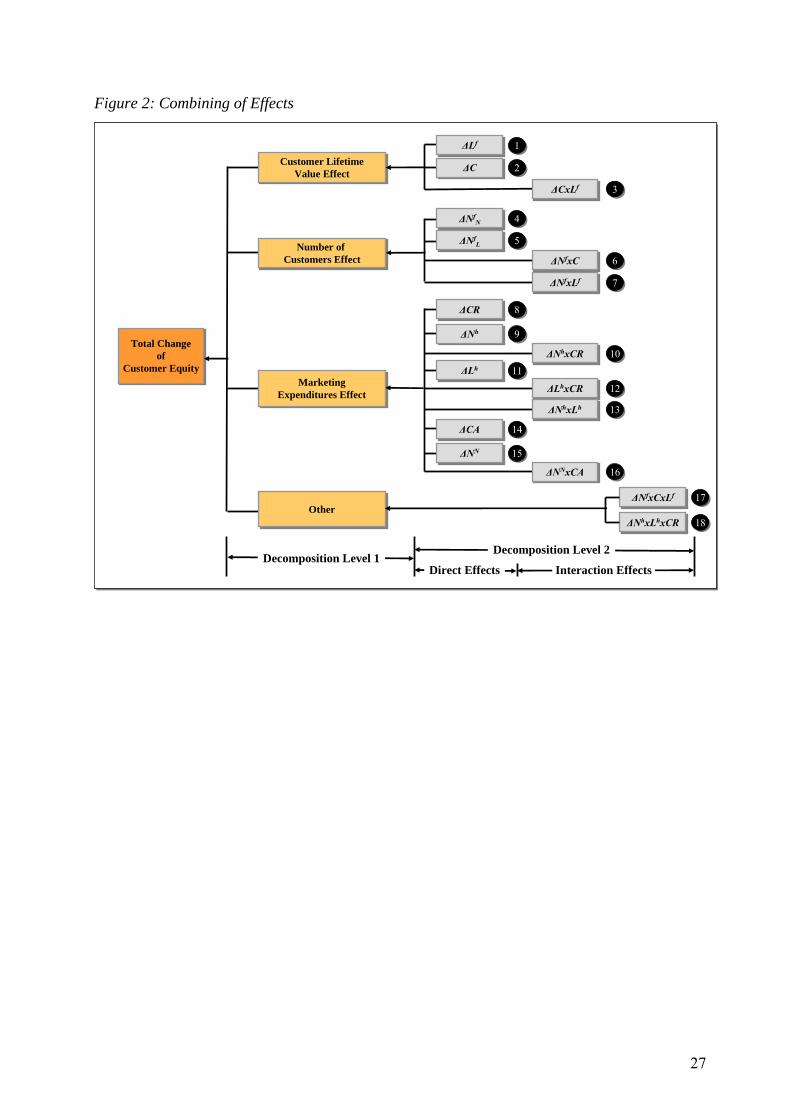
Figure 2: Combining of Effects
Total Changeof
Customer Equity
Total Changeof
Customer Equity
ΔNfxCxLfΔNfxCxLf
ΔNhxLhxCRΔNhxLhxCR
Customer LifetimeValue Effect
Customer LifetimeValue Effect
Number of Customers Effect
Number of Customers Effect
MarketingExpenditures Effect
MarketingExpenditures Effect
OtherOther
ΔLfΔLf
ΔCΔC
ΔNfNΔNf
N
ΔNfLΔNfL
ΔCRΔCR
ΔNhΔNh
ΔLhΔLh
ΔCAΔCA
ΔNNΔNN
ΔNNxCAΔNNxCA
ΔNhxCRΔNhxCR
ΔLhxCRΔLhxCR
ΔNhxLhΔNhxLh
ΔNfxCΔNfxC
ΔNfxLfΔNfxLf
ΔCxLfΔCxLf
Decomposition Level 1Decomposition Level 2
Direct Effects Interaction Effects
1818
1717
1616
1313
1212
1010
77
66
33
1515
1414
1111
99
88
55
44
22
11
27
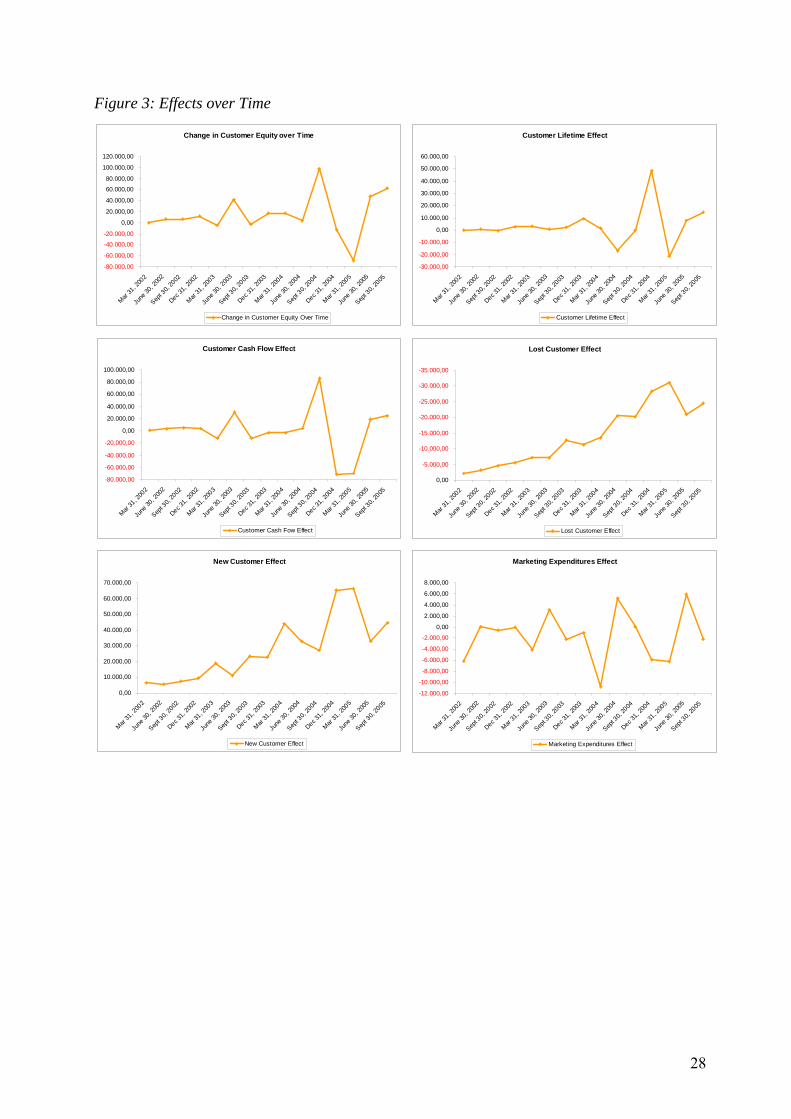
Figure 3: Effects over Time
Customer Cash Flow Effect
-80.000,00
-60.000,00
-40.000,00
-20.000,00
0,00
20.000,00
40.000,00
60.000,00
80.000,00
100.000,00
Mar 31
, 200
2
June
30, 2
002
Sept 3
0, 20
02
Dec 31,
2002
Mar 31
, 200
3
June
30, 2
003
Sept 3
0, 20
03
Dec 31,
2003
Mar 31
, 200
4
June
30, 2
004
Sept 3
0, 20
04
Dec 31,
2004
Mar 31
, 200
5
June
30, 2
005
Sept 3
0, 20
05
Customer Cash Fow Effect
Customer Lifetime Effect
0,00
10.000,00
20.000,00
30.000,00
40.000,00
50.000,00
60.000,00
Mar 31
, 200
2
June
30, 2
002
Sept 3
0, 20
02
Dec 31,
2002
Mar 31
, 200
3
June
30, 2
003
Sept 3
0, 20
03
Dec 31,
2003
Mar 31
, 200
4
June
30, 2
004
Sept 3
0, 20
04
Dec 31,
2004
Mar 31
, 200
5
June
30, 2
005
Sept 3
0, 20
05
-30.000,00
-20.000,00
-10.000,00
Customer Lifetime Effect
New Customer Effect
0,00
10.000,00
20.000,00
30.000,00
40.000,00
50.000,00
60.000,00
70.000,00
Mar 31
, 200
2
June
30, 2
002
Sept 3
0, 20
02
Dec 31,
2002
Mar 31
, 200
3
June
30, 2
003
Sept 3
0, 20
03
Dec 31,
2003
Mar 31
, 200
4
June
30, 2
004
Sept 3
0, 20
04
Dec 31,
2004
Mar 31
, 200
5
June
30, 2
005
Sept 3
0, 20
05
New Customer Effect
Lost Customer Effect
0,00
Mar 31
, 200
2
June
30, 2
002
Sept 3
0, 20
02
Dec 31,
2002
Mar 31
, 200
3
June
30, 2
003
Sept 3
0, 20
03
Dec 31,
2003
Mar 31
, 200
4
June
30, 2
004
Sept 3
0, 20
04
Dec 31,
2004
Mar 31
, 200
5
June
30, 2
005
Sept 3
0, 20
05
-35.000,00
-30.000,00
-25.000,00
-20.000,00
-15.000,00
-10.000,00
-5.000,00
Lost Customer Effect
Marketing Expenditures Effect
0,00
2.000,00
4.000,00
6.000,00
8.000,00
Mar 31
, 200
2
June
30, 2
002
Sept 3
0, 20
02
Dec 31,
2002
Mar 31
, 200
3
June
30, 2
003
Sept 3
0, 20
03
Dec 31,
2003
Mar 31
, 200
4
June
30, 2
004
Sept 3
0, 20
04
Dec 31,
2004
Mar 31
, 200
5
June
30, 2
005
Sept 3
0, 20
05
-12.000,00
-10.000,00
-8.000,00
-6.000,00
-4.000,00
-2.000,00
Marketing Expenditures Effect
Change in Customer Equity over Time
0,00
20.000,00
40.000,00
60.000,00
80.000,00
100.000,00
120.000,00
Mar 31
, 200
2
June
30, 2
002
Sept 3
0, 20
02
Dec 31,
2002
Mar 31
, 200
3
June
30, 2
003
Sept 3
0, 20
03
Dec 31,
2003
Mar 31
, 200
4
June
30, 2
004
Sept 3
0, 20
04
Dec 31,
2004
Mar 31
, 200
5
June
30, 2
005
Sept 3
0, 20
05
-80.000,00
-60.000,00
-40.000,00
-20.000,00
Change in Customer Equity Over Time
28
29
Qualitative Characteristics and their Definition
RelevanceFuture-orientationDecomposition
Reliability1)
Objectivity
Comparability2)
"The quality of information that enables users to identify similarities in and differences between two sets of economic phenomena"
Comparability
Understandability"The quality of information that enables users to readily understand its significance"
Simplicity
ess
Derived Critical Criteria for Customer Equity Models
tant.
"The capacity to influence the economic decisions of users by helping them evaluate past, present or future events or confirming, or correcting, their past evaluations."
"Information has the quality of reliability when it is free from material error, faithfully represents that which it either purports to represent or could reasonably be expected to represent, and is free from bias."
ree from material
me is important
Table 1: Financial Reporting Criteria
Benefits > Costs Cost-effectiven
characteristic conflicts with the objective of requiring management to convey what it believes is impor
1) In the IASB discussion paper, reliability is broken down into supportability and balance. Thereby, "ferror" and "represents faithfully" is adressed in "supportability" and "free from bias" in "balance"2) In the IASB discussion paper, they concluded that the ability to compare the MC of an entity over ti
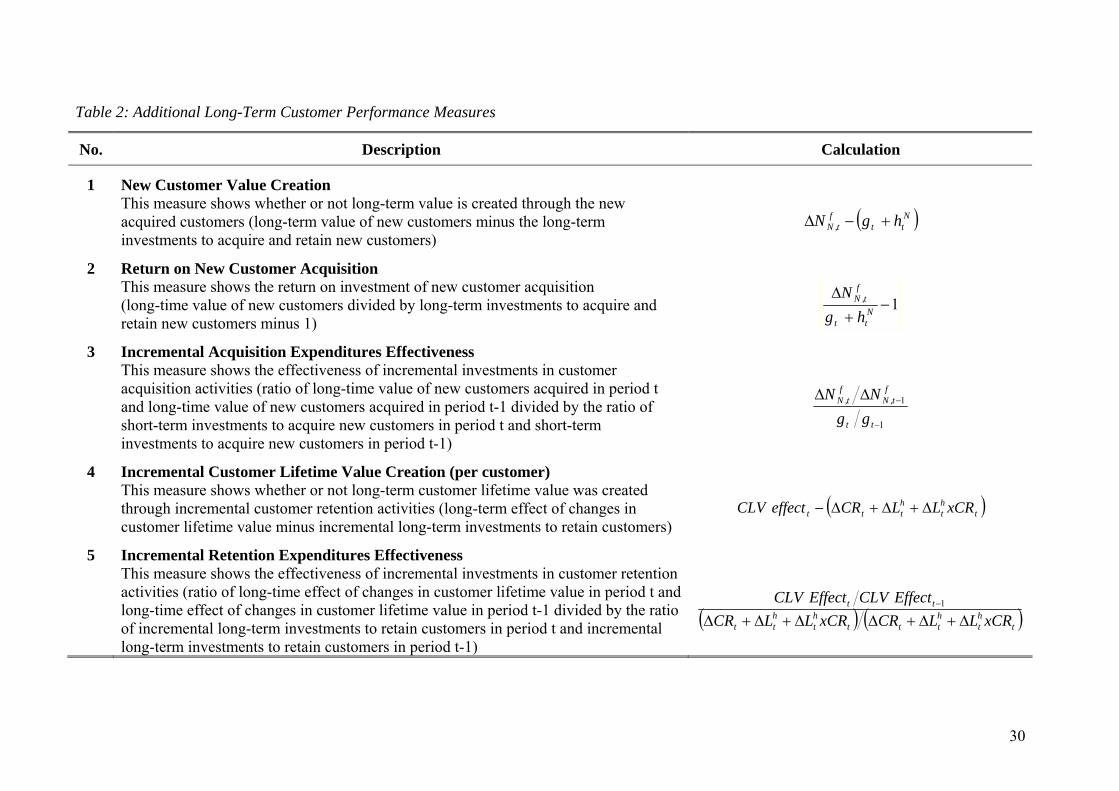
Table 2: Additional Long-Term Customer Performance Measures
No. Description Calculation
1 New Customer Value Creation This measure shows whether or not long-term value is created through the new
acquired customers (long-term value of new customers minus the long-term investments to acquire and retain new customers)
( )Ntt
ft,N hgN +−Δ
2 Return on New Customer Acquisition This measure shows the return on investment of new customer acquisition
(long-time value of new customers divided by long-term investments to acquire and retain new customers minus 1)
1−+
ΔNtt
ft,N
hgN
3 Incremental Acquisition Expenditures Effectiveness This measure shows the effectiveness of incremental investments in customer
acquisition activities (ratio of long-time value of new customers acquired in period t and long-time value of new customers acquired in period t-1 divided by the ratio of short-term investments to acquire new customers in period t and short-term investments to acquire new customers in period t-1)
1
1
−
−ΔΔ
tt
ft,N
ft,N
ggNN
4 Incremental Customer Lifetime Value Creation (per customer) This measure shows whether or not long-term customer lifetime value was created
through incremental customer retention activities (long-term effect of changes in customer lifetime value minus incremental long-term investments to retain customers)
( )tht
httt xCRLLCReffect CLV Δ+Δ+Δ−
5 Incremental Retention Expenditures Effectiveness This measure shows the effectiveness of incremental investments in customer retention
activities (ratio of long-time effect of changes in customer lifetime value in period t and long-time effect of changes in customer lifetime value in period t-1 divided by the ratio of incremental long-term investments to retain customers in period t and incremental long-term investments to retain customers in period t-1)
( ) ( )tht
httt
ht
htt
tt
xCRLLCRxCRLLCREffect CLVEffect CLV
Δ+Δ+ΔΔ+Δ+Δ−1
30
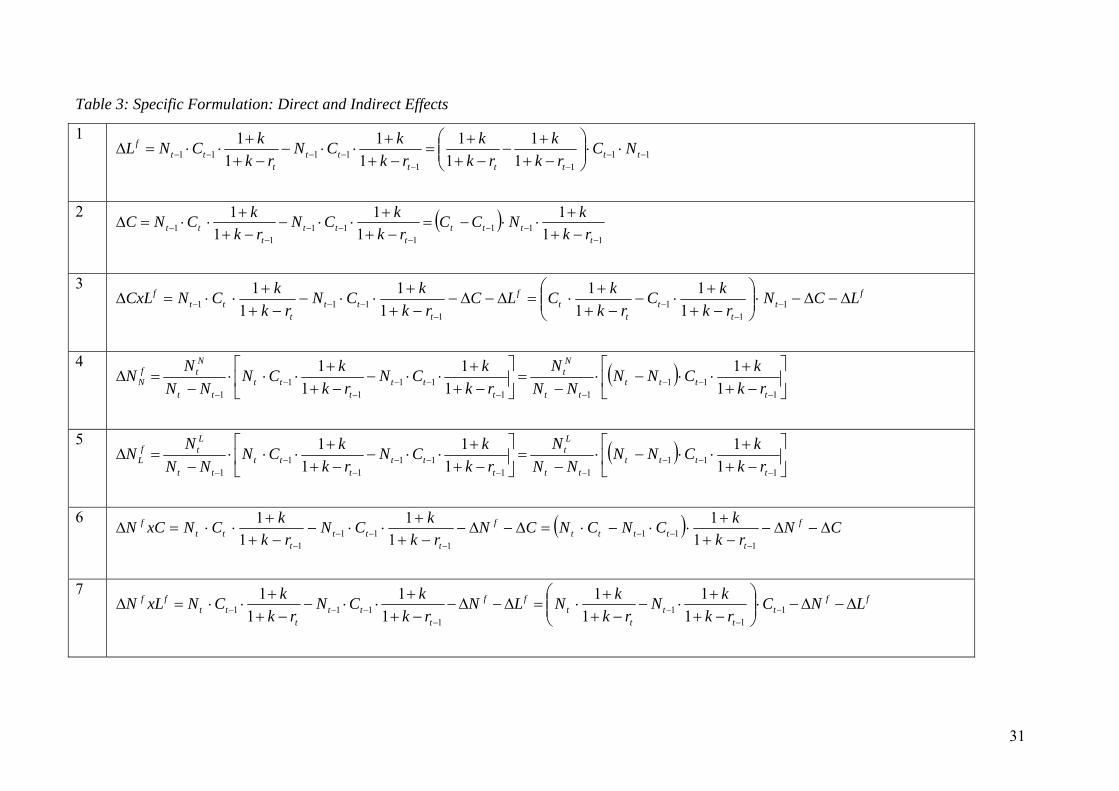
Table 3: Specific Formulation: Direct and Indirect Effects
1 11
111111 1
11
11
11
1−−
−−−−−− ⋅⋅⎟⎟
⎠
⎞⎜⎜⎝
⎛−++
−−+
+=
−++
⋅⋅−−+
+⋅⋅=Δ tt
ttttt
ttt
f NCrk
krk
krk
kCNrk
kCNL
2 ( )1
111
111
1 11
11
11
−−−
−−−
−− −+
+⋅⋅−=
−++
⋅⋅−−++
⋅⋅=Δt
tttt
ttt
tt rkkNCC
rkkCN
rkkCNC
3 f
tt
tt
tf
ttt
ttt
f LCNrk
kCrk
kCLCrk
kCNrk
kCNCxL Δ−Δ−⋅⎟⎟⎠
⎞⎜⎜⎝
⎛−++
⋅−−+
+⋅=Δ−Δ−
−++
⋅⋅−−+
+⋅⋅=Δ −
−−
−−−− 1
11
1111 1
11
11
11
1
4 ( ) ⎥⎦
⎤⎢⎣
⎡−++
⋅⋅−⋅−
=⎥⎦
⎤⎢⎣
⎡−++
⋅⋅−−++
⋅⋅⋅−
=Δ−
−−−−
−−−
−− 1
1111
111
11 1
11
11
1
tttt
tt
Nt
ttt
ttt
tt
Ntf
N rkkCNN
NNN
rkkCN
rkkCN
NNNN
5 ( ) ⎥⎦
⎤⎢⎣
⎡−++
⋅⋅−⋅−
=⎥⎦
⎤⎢⎣
⎡−++
⋅⋅−−++
⋅⋅⋅−
=Δ−
−−−−
−−−
−− 1
1111
111
11 1
11
11
1
tttt
tt
Lt
ttt
ttt
tt
Ltf
L rkkCNN
NNN
rkkCN
rkkCN
NNNN
6 ( ) CNrk
kCNCNCNrk
kCNrk
kCNxCN f
ttttt
f
ttt
ttt
f Δ−Δ−−++
⋅⋅−⋅=Δ−Δ−−++
⋅⋅−−++
⋅⋅=Δ−
−−−
−−− 1
111
111 1
11
11
1
7 ff
tt
tt
tff
ttt
ttt
ff LNCrk
kNrk
kNLNrk
kCNrk
kCNxLN Δ−Δ−⋅⎟⎟⎠
⎞⎜⎜⎝
⎛−++
⋅−−+
+⋅=Δ−Δ−
−++
⋅⋅−−+
+⋅⋅=Δ −
−−
−−−− 1
11
1111 1
11
11
11
1
31
8 ( ) ⎥⎦
⎤⎢⎣
⎡−++
⋅⋅−−=⎥⎦
⎤⎢⎣
⎡−++
⋅⋅−−++
⋅⋅−=Δ−
−−−
−−−
−1
111
111
1 11
11
11
tttt
ttt
ttt rk
kNCRCRrk
kCRNrk
kCRNCR
9 ( ) ⎥⎦
⎤⎢⎣
⎡−++
⋅⋅−−=⎥⎦
⎤⎢⎣
⎡−++
⋅⋅−−++
⋅⋅−=Δ−
−−−
−−−
−1
111
111
1 11
11
11
tttt
ttt
ttt
h
rkkCRNN
rkkCRN
rkkCRNN
10 ( ) CRN
rkkCRNCRNCRN
rkkCRN
rkkCRNxCRN h
ttttt
h
ttt
ttt
h Δ−Δ−⎥⎦
⎤⎢⎣
⎡−++
⋅⋅−⋅−=Δ−Δ−⎥⎦
⎤⎢⎣
⎡⎟⎟⎠
⎞⎜⎜⎝
⎛−++
⋅⋅−−++
⋅⋅−=Δ−
−−−
−−− 1
111
111 1
11
11
1
11 ⎥⎦
⎤⎢⎣
⎡⋅⋅⎟⎟
⎠
⎞⎜⎜⎝
⎛−++
−−+
+−=⎥
⎦
⎤⎢⎣
⎡−++
⋅⋅−−+
+⋅⋅−=Δ −−
−−−−−− 11
111111 1
11
11
11
1tt
ttttt
ttt
h NCRrk
krk
krk
kCRNrk
kCRNL
12 CRLN
rkkCR
rkkCRCRL
rkkCRN
rkkCRNxCRL h
tt
tt
th
ttt
ttt
h Δ−Δ−⎥⎦
⎤⎢⎣
⎡⋅⎟⎟⎠
⎞⎜⎜⎝
⎛−++
⋅−−+
+⋅−=Δ−Δ−⎥
⎦
⎤⎢⎣
⎡⎟⎟⎠
⎞⎜⎜⎝
⎛−++
⋅⋅−−+
+⋅⋅−=Δ −
−−
−−−− 1
11
1111 1
11
11
11
1
13 hh
tt
tt
thh
ttt
ttt
hh LNCRrk
kNrk
kNLNrk
kCRNrk
kCRNxLN Δ−Δ−⎥⎦
⎤⎢⎣
⎡⋅⎟⎟⎠
⎞⎜⎜⎝
⎛−++
⋅−−+
+⋅−=Δ−Δ−⎥
⎦
⎤⎢⎣
⎡⎟⎟⎠
⎞⎜⎜⎝
⎛−++
⋅⋅−−+
+⋅⋅−=Δ −
−−
−−−− 1
11
1111 1
11
11
11
1
14 [ ] ( )[ ]Ntttt
Ntt
Nt NCACACANCANCA 11111 −−−−− ⋅−−=⋅−⋅−=Δ
15 [ ] ( )[ ]11111 −−−−− ⋅−−=⋅−⋅−=Δ tNt
Ntt
Ntt
Nt
N CANNCANCANN
32
33
16 ( )[ ] CANCANCANxCAN Nt
Ntt
Nt
N Δ−Δ−⋅−⋅−=Δ −− 11
17 ffffff
ttt
ttt
ff CxLxLNxCNLCNrk
kCNrk
kCNxCxLN Δ−Δ−Δ−Δ−Δ−Δ−−++
⋅⋅−−+
+⋅⋅=Δ
−−−
111 1
11
1
18 xCRLxCRNxLNCRLN
rkkCRN
rkkCRNxCRxLN hhhhhh
ttt
ttt
hh Δ−Δ−Δ−Δ−Δ−Δ−⎥⎦
⎤⎢⎣
⎡⎟⎟⎠
⎞⎜⎜⎝
⎛−++
⋅⋅−−+
+⋅⋅−=Δ
−−−
111 1
11
1
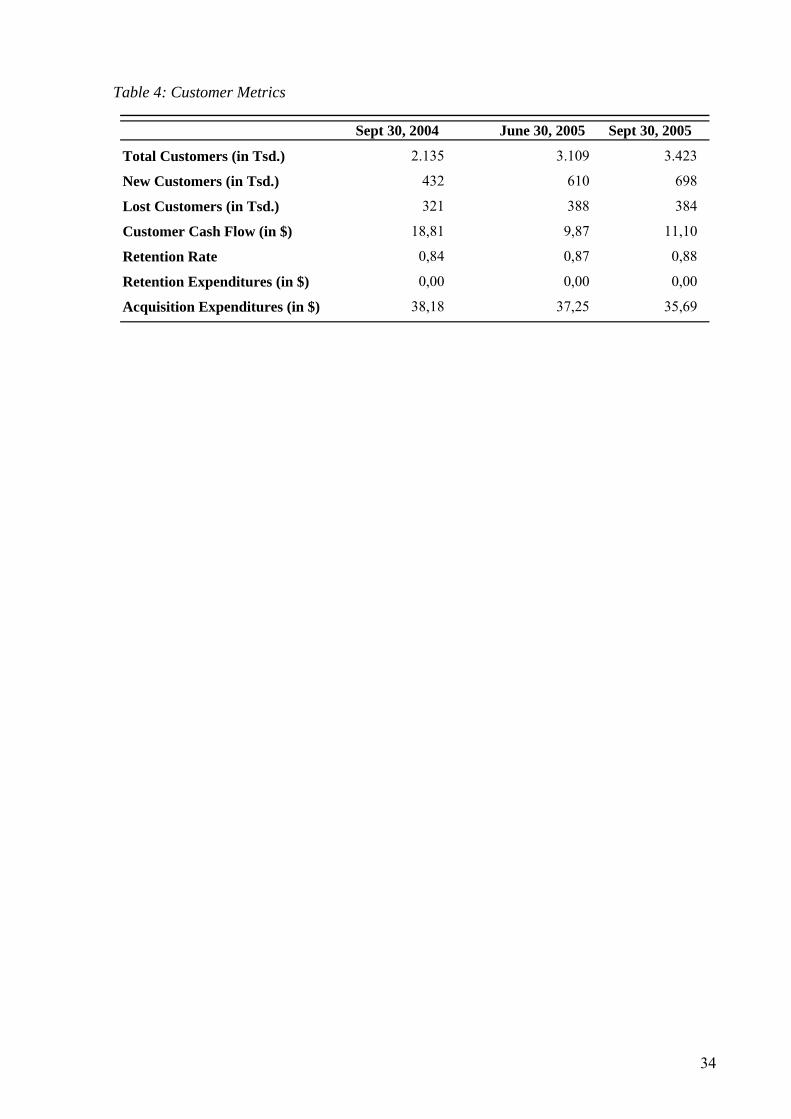
Table 4: Customer Metrics
Sept 30, 2004 June 30, 2005 Sept 30, 2005
Total Customers (in Tsd.) 2.135 3.109 3.423
New Customers (in Tsd.) 432 610 698
Lost Customers (in Tsd.) 321 388 384
Customer Cash Flow (in $) 18,81 9,87 11,10
Retention Rate 0,84 0,87 0,88
Retention Expenditures (in $) 0,00 0,00 0,00
Acquisition Expenditures (in $) 38,18 37,25 35,69
34
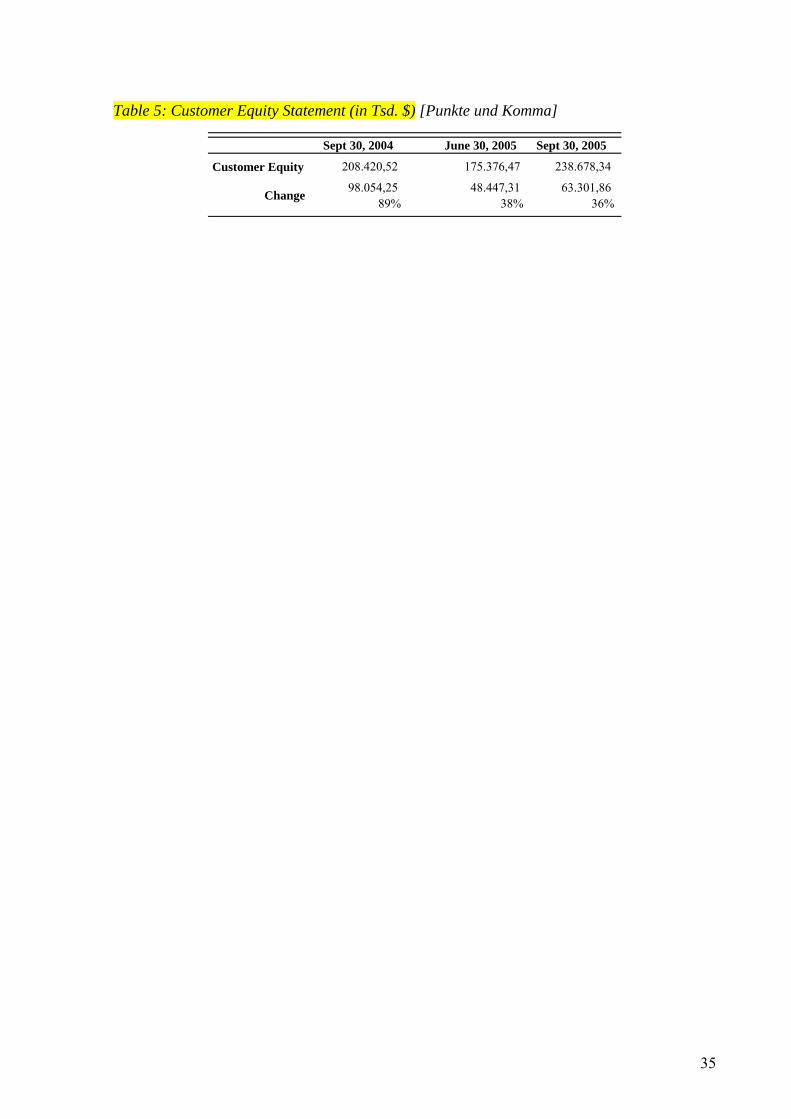
Table 5: Customer Equity Statement (in Tsd. $) [Punkte und Komma]
Sept 30, 2004 June 30, 2005 Sept 30, 2005
Customer Equity 208.420,52 175.376,47 238.678,34
98.054,25 48.447,31 63.301,8689% 38% 36%Change
35
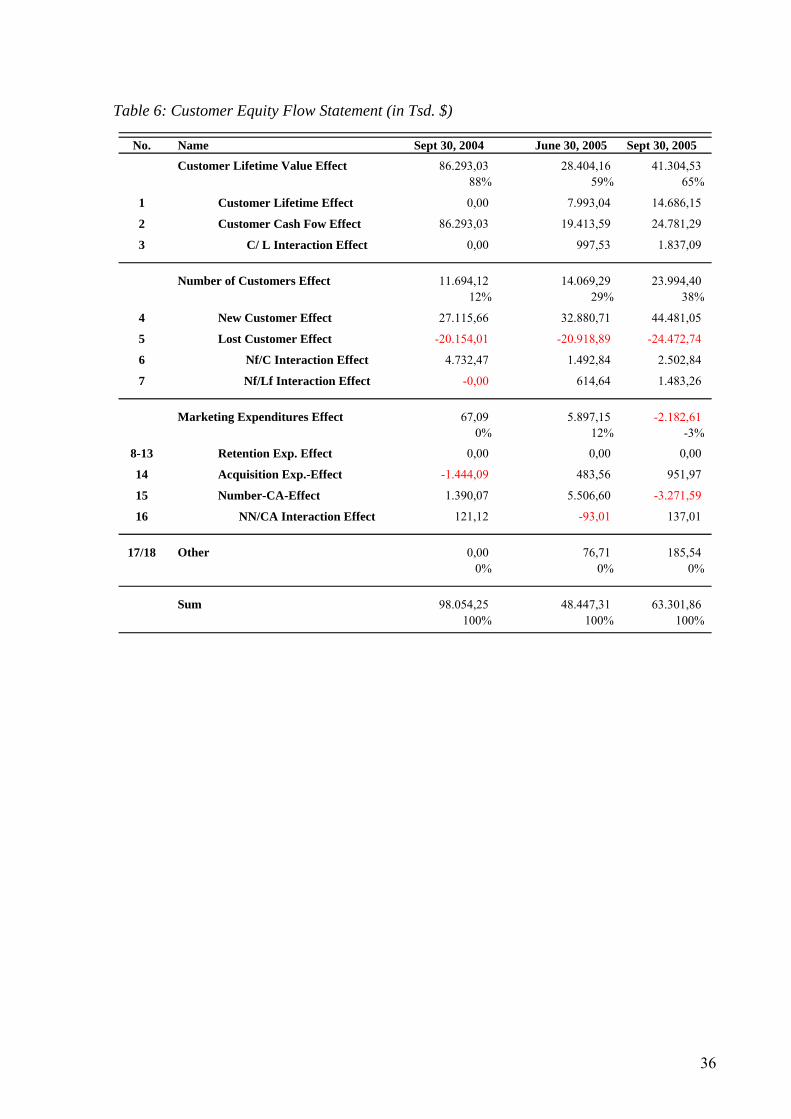
Table 6: Customer Equity Flow Statement (in Tsd. $)
No. Name Sept 30, 2004 June 30, 2005 Sept 30, 2005
86.293,03 28.404,16 41.304,5388% 59% 65%
1 Customer Lifetime Effect 0,00 7.993,04 14.686,15
2 Customer Cash Fow Effect 86.293,03 19.413,59 24.781,29
3 0,00 997,53 1.837,09
11.694,12 14.069,29 23.994,4012% 29% 38%
4 New Customer Effect 27.115,66 32.880,71 44.481,05
5 Lost Customer Effect -20.154,01 -20.918,89 -24.472,74
-0,00
-2.182,61
-1.444,09
-3.271,59
-93,01
6 4.732,47 1.492,84 2.502,84
7 614,64 1.483,26
67,09 5.897,150% 12% -3%
8-13 Retention Exp. Effect 0,00 0,00 0,00
14 Acquisition Exp.-Effect 483,56 951,97
15 Number-CA-Effect 1.390,07 5.506,60
16 121,12 137,01
17/18 0,00 76,71 185,540% 0% 0%
98.054,25 48.447,31 63.301,86100% 100% 100%
Number of Customers Effect
Customer Lifetime Value Effect
C/ L Interaction Effect
Sum
NN/CA Interaction Effect
Other
Nf/C Interaction Effect
Nf/Lf Interaction Effect
Marketing Expenditures Effect
36
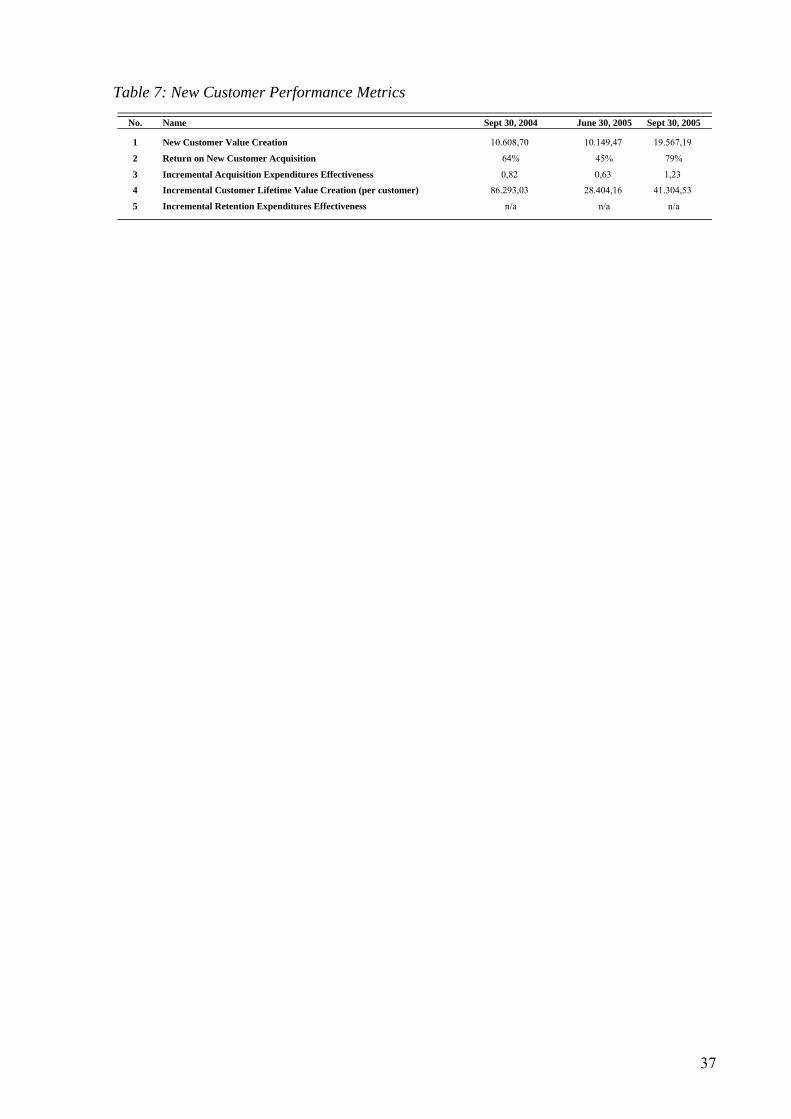
Table 7: New Customer Performance Metrics
No. Name Sept 30, 2004 June 30, 2005 Sept 30, 2005
1 New Customer Value Creation 10.608,70 10.149,47 19.567,19
2 Return on New Customer Acquisition 64% 45% 79%
3 0,82 0,63 1,23
4 86.293,03 28.404,16 41.304,53
5 n/a n/a n/a
Incremental Customer Lifetime Value Creation (per customer)
Incremental Retention Expenditures Effectiveness
Incremental Acquisition Expenditures Effectiveness
37
7 References Berger, Paul D. and Nada L. Nasr (1998), "Customer Lifetime Value: Marketing Models and Applications," Journal of Interactive Marketing, 12 (1), 17-30. Blattberg, Robert C. and John Deighton (1996), "Managing Marketing by the Customer Equity Test," Harvard Business Review, 74 (4), 136-44. Dwyer, F. R. (1997), "Customer Lifetime Valuation to Support Marketing Decision Making," Journal of Direct Marketing, 11 (4), 6-13. Financial Accounting Standards Board (1978), Statement of Financial Accounting Concepts No. 1: Objectives of Financial Reporting by Business Enterprises. Stamford: FASB. ---- (1980), Statement of Financial Accounting Concepts No. 2: Qualitative Characteristics and Accounting Information. Stamford: FASB. ---- (2000), Statement of Financial Accounting Concepts No. 7: Using Cash Flow Information and Present Value in Accounting Measurements. Stamford: FASB. Fornell, Claes, Sunil Mithas, Forrest V. Morgeson, and M S. Krishnan (2006), "Customer Satisfaction and Stock Proces: High Returns, Low Risk," Journal of Marketing, 70 (1), 3-14. Gupta, Sunil and Donald R. Lehmann (2003), "Customers As Assets," Journal of Interactive Marketing, 17 (1), 9-24. Gupta, Sunil, Donald R. Lehmann, and Jennifer Ames Stuart (2004), "Valuing Customers," Journal of Marketing Research, 41 (1), 7-18. Hogan, John E., Katherine N. Lemon, and Roland T. Rust (2002), "Customer Equity Management: Charting New Directions for the Future of Marketing," Journal of Service Research, 5 (1), 4-12. International Accounting Standards Board (2004), Framework for the Preparation and Presentation of Financial Statements. London: IASB. ---- (2005), Management Commentary. London: IASB. Jain, Dipak and Siddartha S. Singh (2002), "Customer Lifetime Value Research in Marketing: A Review and Future Directions," Journal of Interactive Marketing, 16 (2), 34-46. Lewis, Michael (2005), "Incorporating Strategic Consumer Behavoir into Customer Valuation," Journal of Marketing, 69, 230-38. Nagar, Venky and Madhav V. Rajan (2005), "Measuring Customer Relationships: The Case of the Retail Banking Industry," Management Science, 51 (6), 904-19. Netflix (2005), "SEC Filing 10-Q Form."
38
Payne, Adrian and Pennie Frow (2005), "A Strategic Framework for Customer Relationship Management," Journal of Marketing, 69 (4), 167-76. PricewaterhouseCoopers (2005), Trends 2005: Good Practices in Corporate Reporting. Reinartz, Werner J. and V. Kumar (2003), "The Impact of Customer Relationship Characteristics on Profitable Lifetime Duration," Journal of Marketing, 67 (1), 77-99. ---- (2000), "On the Profitability of Long Lifetime Customers: An Empirical Investigation and Implications for Marketing," Journal of Marketing, 64 (4), 17-35. Reinartz, Werner J., Jacquelyn S. Thomas, and V. Kumar (2005), "Balancing Acquisition and Retention Resources to Maximize Customer Profitability," Journal of Marketing, 69 (1), 63-79. Rust, Roland T. , Tim Ambler, Gregory S. Carpenter, V. Kumar, and Rajendra K. Srivastava (2004a), "Measuring Marketing Productivity: Current Knowledge and Future Directions," Journal of Marketing, 68 (4), 76-89. Rust, Roland T., Katherine N. Lemon, and Valarie A. Zeithaml (2004b), "Return on Marketing: Using Customer Equity to Focus Marketing Strategy," Journal of Marketing, 68 (1), 109-27. Ryals, Lynette J. (2005), "Making Customer Relationship Management Work: The Measurement and Profitable Management of Customer Relationships," Journal of Marketing, 69 (4), 252-61. Said, Amal A., Hassan R. HassabElnaby, and Benson Wier (2003), "An Empirical Investigation of the Performance Consequences of Nonfinancial Measures," Journal of Management Accounting Research, 15, 193-223. Securities and Exchange Commision (2003), Commission Gidance Regarding Management´s Discussion and Analysis of Financial Condition and Results of Operations (Release Nos 33-48960; FR-72). New York: SEC. Smith, Rodney E. and William F. Wright (2004), "Determinants of Customer Loyalty and Financial Performance," Journal of Management Accounting Research, 16, 183-205. Venkatesan, Rajkumar and V. Kumar (2004), "A Customer Lifetime Value Framework for Customer Selection and Resource Allocation Strategy," Journal of Marketing, 68 (Oktober), 106-25. Wiesel, Thorsten and Bernd Skiera (2005), "Linking Customer Metrics to Shareholder Value for Firms With Contractual Relationships." Frankfurt
39
Our Mission The Zyman Institute of Brand Science pursues the advancement of brand-driven business performance. Founded in 2004, the Zyman Institute of Brand Science is the definitive source for cutting-edge knowledge and thinking about brands. The Institute is an independently managed organization within the Goizueta Business School at Emory University. Who we work with The Institute works with top management teams to solve pressing issues in brand strategy. What we do The Institute’s lauded scholars lead the development of new knowledge and insights for building, maintaining, enhancing, and revitalizing persistently profitable brands. We help companies link brand equity to business and shareholder value. We help management make decisions in managing brands to accelerate cash flows, enhance cash flows, and reduce vulnerability and volatility of cash flows, and optimize the long-term value of the organization. How we do it The Institute works collaboratively with its sponsors, other universities, research organizations, and its members to devise cross-disciplinary solutions for managing real world problems in brand strategy. We play an integrative role in problem solving, and capability building. We focus on viable actions Web: zibs.com About Emory University Emory University is an internationally recognized institution based in Atlanta that was founded over 150 years ago. Emory sustains top ranked programs in medicine, law, business, theology, nursing, public health, arts & sciences. It supports world-class research across its disciplines. Web: emory.edu About Goizueta Business School The Goizueta Business School was established in 1919 and is named for Roberto Goizueta, former president of The Coca-Cola Company. The school is considered a top-tier school and is consistently ranked in the top 20. It offers degrees in business including Bachelor, Master and PhD. Its Executive MBA is ranked 10 globally by both BusinessWeek and U.S. News. Web: goizueta.emory.edu
40
Contacts: For further information, please visit www.zibs.com or contact: Zyman Institute of Brand Science Goizueta Business School Emory University 1300 Clifton Road Atlanta, Georgia 30322 USA Main: +1 (404) 727-9172 Fax: +1 (404) 727-1082
Web: www.zibs.com
Academic Facing Contacts Sundar Bharadwaj Director of Academic Programs Professor of Marketing Phone: 404-727-2646 Email: [email protected] Doug Bowman Director of Academic Programs Professor of Marketing Phone: 404-727-4613 Email: [email protected] Sriram Venkataraman Director, Analytics Assistant Professor of Marketing Phone: +1 (404) 727-5275 Email: [email protected] Ashish Sood Director, Analytics Assistant Professor of Marketing Phone: +1 (404) 727-4226 Email: [email protected]
Raj Srivastava Executive Director Professor of Marketing Phone: +1 (404) 727-4858 Email: [email protected]
Business Facing Contacts Greg Thomas Director of Research and Programs Phone : +1 (404) 727-4613 Email: [email protected] Dana Page Program Manager Phone: +1 (404) 727-1078 Email: [email protected] Reshma Shah Director of Business Relations Assistant Professor of Marketing Phone: +1 (404) 727-6302 Email: [email protected] Susan Hogan Director of Business Relations Assistant Professor of Marketing Phone: +1 (404) 727-5516 Email: [email protected] Leanne Fesenmeyer Director of Alliances Phone: +1 (770) 817-4141 Email: [email protected]
41