Embed Size (px)
Citation preview
Enforcement of Intellectual Property, Pollution
Abatement, and Directed Technical Change
Andreas Schaefer∗
CER-ETH,
Center of Economic Research at ETH Zurich
Zurichbergstrasse 18
CH-8092 Zurich
This Version: September 2016
Abstract
We theoretically investigate the interaction between endogenous enforcement ofintellectual property rights (IPRs) and tax-financed pollution abatement measures.IPRs affect dirty and clean intermediates alike such that higher IPR enforcementmay promote the transition to the clean technology, if this technology is productiveenough. If the green technology is relatively unproductive, higher IPRs promote thedirty technology while pollution is increasing. As households are due to subsistenceconsumption subject to a hierarchy of needs, the level of IPR enforcement as well asthe level of abatement measures depends on the state of technology and is increasingduring economic development. Thus, if the incentive to enforce IPRs is low the levelof abatement measures is also low. This argument provides a theoretical foundationfor the observed clash of interests in international negotiation rounds regarding theharmonization of IPR protection and actions to combat climate change.
Keywords: Directed Technical Change, Intellectual Property Rights, Pollution
JEL: O30,O33, O34, Q53, Q54, Q56, Q58
∗I wish to thank two anonymous referees for valuable comments and helpful suggestions. Moreover Ithank Tunc Durmaz for a fruitful discussion at EARE 2016 making me aware of empirical evidences inthe literature. The usual disclaimer applies!

1 Introduction
The question of how to reconcile the restrictions of the climate system with sustained eco-
nomic growth in the standards of living constitutes across the globe a major challenge for
societies at large. In order to resolve the tension between economic growth and pollution,
existing literature suggests a redirection of innovations from dirty to clean technologies
rather than a stall of economic growth. Moreover, the adverse impact of production on
the environment may be dampened by appropriate economic policies like pollution taxes,
permits or tax-financed abatement measures.
A growing body of empirical evidence implies that the transition to clean technologies may
occur in response to policies and changes in prices that affect the relative profitability of
clean and dirty technologies. For example, Popp (2002) finds that higher energy prices
are associated with an increase in energy-saving innovations. Bretschger (2015) states
that decreasing energy input and increasing energy prices induce additional investments
fostering long-run growth while the growth effect counteracts the negative static effects
of lower energy use. Aghion et al. (2016) expose that carbon taxes affect the direction
of innovations in the automobile industry. Moreover, they provide evidence for some
path-dependency of green innovations. These findings support the arguments brought
forward by models of directed technical change in spirit of Acemoglu (1998;2002) which
have been applied to environmental aspects for example by di Maria and Smulders (2004),
Andre and Smulders (2005), di Maria and Valente (2008), Acemoglu et al. (2012), Schafer
(2014), and van der Meijden and Smulders (2014) - for a comprehensive but probably still
incomplete list.1 Consequently, the transition from dirty to clean technologies requires
economic polices that promote incentives to engage in green R&D activities. In general,
the literature discusses against this background the role of taxes and subsidies while in
most endogenous growth models, patent protection and the enforcement of patents is
taken for granted.
1For more empirical findings see Acemoglu et al. (2016). In contrast to the above mentioned literature,Bretschger and Smulders (2012) find that poor input substitution need not be detrimental for sustainablegrowth. Our framework is based like the other directed technical change frameworks on comparativelyhigh elasticities of substitution. The requirement of high elasticities of substitution between clean anddirty inputs will be discussed further below, see ftn. 19.
2

0
10
20
30
40
50
60
1990 1995 2000 2005 2010 2011 2013
China
India
VietnamGhana
BrazilOECD
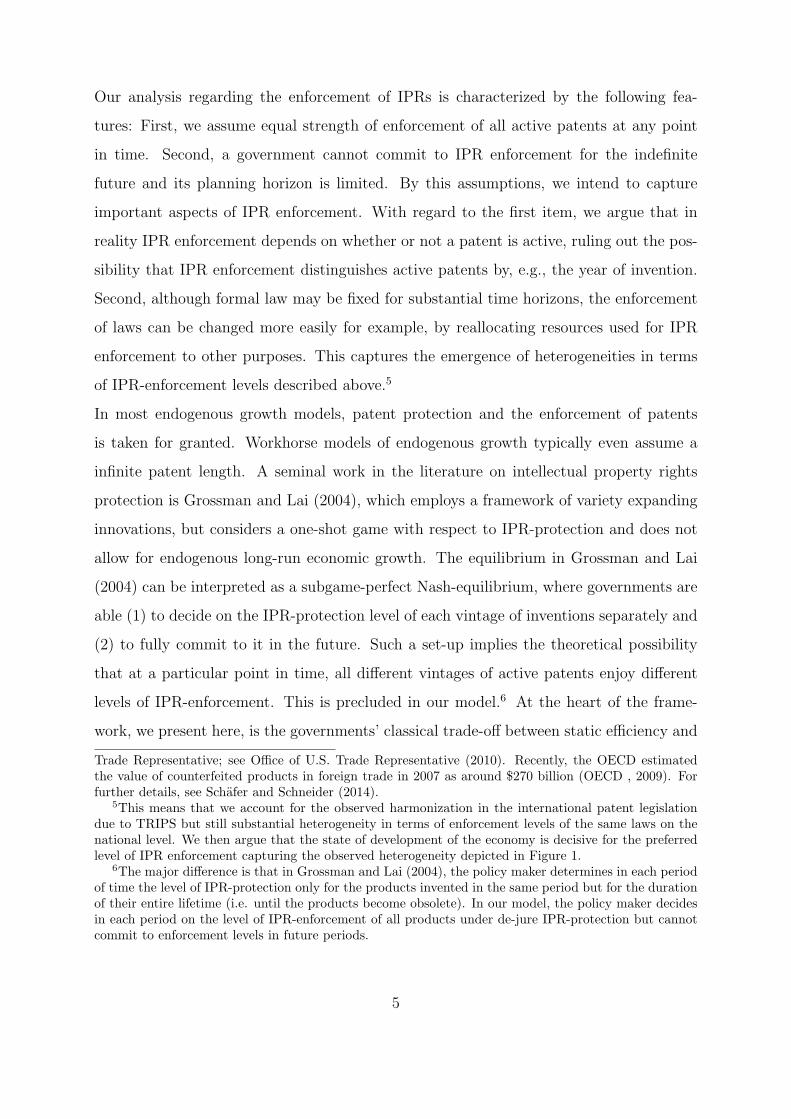
Figure 1: PM2.5 air pollution, mean annual exposure (micrograms per cubic meter);source: World Development Indicators 2016
In this paper, we argue within a framework of directed technical change in the spirit of
Acemoglu et al. (2012) that there exists a reenforcing interaction between the incentives
to enforce intellectual property rights (IPRs) and the willingness to pay for tax-financed
abatement measures. Moreover, the incentives to enforce IPRs and the willingness to pay
for tax-financed abatement measures are affected by the stage of economic development.
We take thus a development economic perspective, in the sense that the economy sur-
passes a hierarchy of needs characterized by relatively high expenditure shares on current
consumption when disposable incomes are comparatively low. Earlier stages of economic
development are, therefore, characterized by low savings, thus low investments in R&D,
low enforcement levels of IPRs and a low willingness to pay for tax-financed pollution
abatement measures. This argument provides a theoretical foundation for the observed
clash of interests in international negotiation rounds regarding the harmonization of IPR
3

protection and actions to combat climate change. We illustrate this argument in Figure 1.
There, we present the evolution of local pollutants captured by PM2.5 between 1990 and
2013 in the OECD and a selected group of (fast) developing countries.2 Since 2009, the
latter has been accused, repetitively, by the European Commission for severe copyright
infringements.3 As the figure shows, in these countries the concentration of local pollu-
tants is above the level of the OECD countries and characterized by an increasing trend
while the OECD is characterized by a declining trend. Our theory suggests a hierarchy
of needs as the driving mechanism behind this observation.
As regards the enforcement of intellectual property rights, we build on Schafer and Schnei-
der (2015). The difference is that we consider a fully dynamic general equilibrium frame-
work with directed technical change and an environmental externality, but abstract from
international trade and international negotiations of IPR enforcement levels, i.e. we con-
sider a closed economy. By doing so, we pay special attention to the enforcement of
IPRs rather than different patent legislations. We consider this as the more relevant issue
since the Agreement on Trade-Related Aspects of Intellectual Property Rights (TRIPs)
specifies a minimum set of protection standards that members of the World Trade Organi-
zation (WTO) have to assent to, but the enforcement of intellectual property rights is still
subject to great international heterogeneity. For example, the European Commission’s
IPR Enforcement Report 2009 gives account of serious problems with IPR enforcement in
a large number of mostly developing countries. Among those are the countries which are
depicted in Figure 1. Complaints include injunctions or criminal sanctions often being
difficult to obtain and civil procedures being lengthy and burdensome with high uncer-
tainty of outcomes. Involved staff is insufficiently trained and lacks resources to effectively
prosecute and convict violators, and cooperation between authorities is insufficient. For
some countries the report even assesses a lack of political will indicated by their opposing
in-depth enforcement discussions in international fora such as the WTO or the WIPO.4
2Although we present in Figure 1 the evolution of local pollutants, it is evident that a low willingnessto pay for abatement measures at the local level translates due to free-rider incentives into an even lowerwillingness to pay at the global level.
3See for example the European Commission’s IPR Enforcement Report 2009 and the European Com-mission’s Report on EU Customs Enforcement of Intellectual Property Rights 2014.
4See EU Commission (2009). A similar picture is drawn in the annual Special 301 Reports by the U.S.
4
Our analysis regarding the enforcement of IPRs is characterized by the following fea-
tures: First, we assume equal strength of enforcement of all active patents at any point
in time. Second, a government cannot commit to IPR enforcement for the indefinite
future and its planning horizon is limited. By this assumptions, we intend to capture
important aspects of IPR enforcement. With regard to the first item, we argue that in
reality IPR enforcement depends on whether or not a patent is active, ruling out the pos-
sibility that IPR enforcement distinguishes active patents by, e.g., the year of invention.
Second, although formal law may be fixed for substantial time horizons, the enforcement
of laws can be changed more easily for example, by reallocating resources used for IPR
enforcement to other purposes. This captures the emergence of heterogeneities in terms
of IPR-enforcement levels described above.5
In most endogenous growth models, patent protection and the enforcement of patents
is taken for granted. Workhorse models of endogenous growth typically even assume a
infinite patent length. A seminal work in the literature on intellectual property rights
protection is Grossman and Lai (2004), which employs a framework of variety expanding
innovations, but considers a one-shot game with respect to IPR-protection and does not
allow for endogenous long-run economic growth. The equilibrium in Grossman and Lai
(2004) can be interpreted as a subgame-perfect Nash-equilibrium, where governments are
able (1) to decide on the IPR-protection level of each vintage of inventions separately and
(2) to fully commit to it in the future. Such a set-up implies the theoretical possibility
that at a particular point in time, all different vintages of active patents enjoy different
levels of IPR-enforcement. This is precluded in our model.6 At the heart of the frame-
work, we present here, is the governments’ classical trade-off between static efficiency and
Trade Representative; see Office of U.S. Trade Representative (2010). Recently, the OECD estimatedthe value of counterfeited products in foreign trade in 2007 as around $270 billion (OECD , 2009). Forfurther details, see Schafer and Schneider (2014).
5This means that we account for the observed harmonization in the international patent legislationdue to TRIPS but still substantial heterogeneity in terms of enforcement levels of the same laws on thenational level. We then argue that the state of development of the economy is decisive for the preferredlevel of IPR enforcement capturing the observed heterogeneity depicted in Figure 1.
6The major difference is that in Grossman and Lai (2004), the policy maker determines in each periodof time the level of IPR-protection only for the products invented in the same period but for the durationof their entire lifetime (i.e. until the products become obsolete). In our model, the policy maker decidesin each period on the level of IPR-enforcement of all products under de-jure IPR-protection but cannotcommit to enforcement levels in future periods.
5

dynamic gains of IPR-protection with regard to R&D incentives and profit flows.7 By
choosing IPR-enforcement, the government has to trade off welfare today - by incurring
deadweight losses and R&D costs - against future welfare resulting from a higher techno-
logical level. Without internalizing the full future benefits of innovations, an office-term
motivated government may be more reluctant to bear the costs of great innovative activity
implying a substantial burden on current welfare.8
The decision about the level of tax-financed abatement measures takes the choice of IPR
enforcement as given and is also subject to a limited planning horizon.9 This assumption
is based on the observation that the roots of the present patent legislation dates back to
the 14th century.
Incorporating these features into a dynamic model with directed technical change arguably
makes the analysis of IPR enforcement more realistic. However, it is also particularly in-
teresting because it helps to understand the tensions between advanced and developing
countries as captured by Figure 1. The enforcement of IPRs benefits clean and dirty tech-
nologies alike, while a pollution externality stemming from the use of dirty intermediates
adversely affects total factor productivities and the incentive to enforce IPRs. To the
contrary, pollution abatement measures reduce disposable incomes and thus investment
in R&D, but increase total factor productivity in subsequent periods and provide thus
higher incentives to enforce IPRs in the future. Since agents are subject to a hierarchy of
needs, in the sense that the savings rate is increasing in incomes, the incentive to enforce
IPRs and to implement tax-financed abatement measures depends on the stage of techno-
logical knowledge. This mechanism is particularly important for the understanding and
7These arguments date back to Nordhaus (1969).8The literature has approached questions regarding the protection of IPR from two perspectives. On
the one hand, from a macroeconomic, endogenous growth perspective which treats the IPR-enforcementas exogenous and examines its effects on the resulting growth rate and on welfare (Helpman, 1993; Lai,1998; Kwan and Lai, 2003; Iwaisako et al., 2011). On the other hand, from a rather microeconomic,industrial organization perspective that explicitly takes IPR-enforcement as endogenous, but precludeslong-run dynamics (Chin and Grossman, 1990; Deardorff, 1992; Maskus, 1990; Diwan and Rodrik, 1991;Lai and Qiu, 2003). An intriguing paper by Eicher and Garcia-Penalosa (2008) takes a complementaryapproach to endogenizing the strength of IPR-enforcement in an endogenous growth model of a closedeconomy. Rather than being a policy instrument of the government, IPR enforcement is the result ofprivate investments by firms. This leads to multiple equilibria (one with high (low) IPR-enforcement andhigh (low) R&D investments) as investments in IPR-protection and investments in R&D are complements.
9For the implementation of pollution externalities into dynamic general equilibrium models, see forexample Xepapadeas (2005).
6

recognition of obstacles faced by developing countries during a transition to clean produc-
tion technologies or the implementation of tax-financed pollution abatement measures.10
The remainder of the paper is organized as follows: In Section 2, we introduce the model,
where 2.1 contains the overlapping-generations (OLG) structure of households and 2.2
the production side of the model. In Section 3, we describe the equilibrium structure.
The policy instruments, enforcement of IPRs and tax-financed abatement measures are
discussed in Section 4. In Section 5, we discuss several aspects and implications of our
paper. Finally, Section 6 provides a summary and concludes.
2 The model
2.1 Households
In this setting time is discrete and indexed by t = 1, 2, ...,∞. In each period, t, our
economy is populated by a [0, 1]-continuum of households, i.e. we abstract from pop-
ulation growth and population size is normalized to one. Each individual lives for two
periods: adulthood and old-age. Agents’ time endowment is normalized to one. Each
agent supplies during adulthood one unit of labor inelastically to the labor market and
earns wt. Moreover, a representative agent consumes ct and saves the amount st in order
to cover old-age consumption, ct+1, during retirement in the second and last period of life.
Lifetime utility of a representative agent is specified as
ut =
(ct−c)1−θ−1
1−θ+ β
c1−θt+1−1
1−θ, if θ > 0, θ 6= 1
ln(ct − c) + β ln(ct+1), if θ = 1
(1)
with c ≥ 0 denoting subsistence consumption, 0 < β < 1 representing the discount factor
of future consumption and θ the inverse of the intertemporal elasticity of substitution.
As usual, the log-linear specification of lifetime utility assures analytical tractability within
an OLG framework. If, however, c > 0 this assumption is not as restrictive as in the
canonical version of the OLG-model since the intertemporal elasticity of substitution is
10These results complement to some extent the findings by Bretschger and Suphaphiphat (2014) inthat a pure development aid strategy would also in our case not necessarily induce a transition to theclean technology but it may help to implement at least tax-financed abatement measures.
7
not constant and the savings rate is increasing in income. In other words: c > 0 introduces
a hierarchy of needs into the utility function. Increasing incomes lower the importance
of expenditures on first-period consumption and increase savings. In order to shed light
onto certain mechanisms, we will occasionally reduce the model to the case where c = 0.
Denoting the gross-interest rate by Rt+1, the budget constraint of a representative house-
holds reads
wt = ct + st, (2)
with stRt+1 = ct+1, such that the present value of lifetime expenditures equals lifetime
earnings, i.e. wt = ct +ct+1
Rt+1.
Maximizing (1) subject to (2) yields
ct =
1
1+β1θ R
1−θθ
t+1
[wt + β1θR
1−θθ
t+1 c], if θ > 0, θ 6= 1,
wt
1+β+ β
1+βc, if θ = 1,
(3)
ct+1
Rt+1
=
β1θ R
1−θθ
t+1
1+β1θ R
1−θθ
t+1
[wt − c], if θ > 0, θ 6= 1
β
1+β(wt − c), if θ = 1.
(4)
It is important to emphasize here, that we don’t distinguish the cases θ = 1 and θ 6= 1
for the sake of academic completeness, but this distinction becomes important for the
subsequent analysis, such that it would not suffice to restrict the analysis to θ = 1 as
it is usually done in the literature. Nevertheless, the benchmark case θ = 1 serves as a
theoretical point of reference for the derivation of analytical results in the more general
case which we could not discern analytically, otherwise.
2.2 IPRs, Production and R&D
Intellectual Property Rights. Our analysis builds on a variety-expanding-growth
framework of the Romer (1990)-type where in period t a patent is enforced with probability
νt. For simplicity, we assume that imitation is costless.11 Thus, if the patent is not
11The implementation of imitation costs would not alter our results.
8

enforced in period t, an imitated intermediate good is supplied under full competition and
operating profits are zero. This modeling strategy reflects our focus on IPR-enforcement,
in the sense that we emphasize the importance of prosecuting patent infringements.12
Since, we consider a two period OLG model where one period encompasses around thirty
years and the average patent length is in reality around 20 years, νt can be interpreted
as the average enforcement level of IPR protection within a typical period t. Simplifying
matters, we assume that a patent holds for one period, i.e. one generation and therefore
a little longer than observed lifespans. Taking this at face value, in a set-up where the
lifespan of a patent is split up into more periods, in the sense that a typical period t
consists of t1...t30 years, a patent holder may earn monopoly profits in year t1 and t3 but
enforcement fails in year t2, such that over the lifespan of a patent of around 30 years, νt
represents the adjusted probability over the typical period that a certain patent will be
enforced.13
A patent holder may produce the same monopolistic quantity of the intermediate prod-
uct in each period but can only charge the monopoly price in the periods where IPR-
enforcement is perfect. In the period without enforcement of IPRs, other competitors
are not effectively deterred from offering the intermediate good as well (after reverse-
engineering it), thereby driving down prices to marginal costs. A broader interpretation
is that different degrees of IPR-enforcement constrain the degree of competition from
violators of IPRs, thereby determining the (oligopolistic) prices that the patent-holders
are able to charge. Then the strength of IPR-enforcement νj,t reflects the share of the
monopoly profits that can be captured in period t.14
Moreover, the patent will be sold in t + 1 at the competitive price to someone chosen
randomly from the then young generation. This assumption follows Aghion and Howitt
(2009, Ch. 4) and avoids tedious intertemporal pricing and related dynastic problems
12This follows Schafer and Schneider (2015) and contrasts with earlier papers by Helpman (1993) andLai (1998).
13For more details, see Schafer and Schneider (2015).14This could be incorporated explicitly by a model with oligopolistic competition, where the patent
holder competes with one or several imitators. However, our modeling approach captures the essence ofdeclining expected profits for the patent holder when IPR-enforcement becomes weaker, and it avoidstedious calculations implied by a set-up with oligopolistic competition.
9

while the incentive to engage in R&D remains untouched.15
We now introduce the model for given levels of IPR-enforcement, νt, and discuss the
governments’ problem concerning their IPR-enforcement choice further below.
Final output. In period t there is a unique final good, Yt, that can be consumed or
saved. Moreover, Yt, is produced by a large number of fully competitive firms using dirty
and clean intermediates as inputs, which are denoted by Yj, j = c, d. Yt is produced
according to the following CES-production function
Yt = P−γt
(
Yε−1ε
c,t + Yε−1ε
d,t
) εε−1
, (5)
with γ > 0 and ε ∈ (0,∞) determining the elasticity of substitution between clean and
dirty inputs.
Pollution. Pt denotes the pollution stock in period t which adversely affects the pro-
ductivity of factors of production.16 Pollution is generated by emissions, Et, stemming
from the use of dirty intermediates in final output production, i.e. Et = Yd,t. Emissions
in turn may be reduced by tax-financed abatement measures, Mt ≥ 0. The emergence of
abatement measures is endogenous in our setting and will be introduced further below.
For the dynamics of the pollution stock we assume a standard and simple accumulation
law
Pt+1 = (1− η)Pt + Yd(1 +Mt)−1, η ∈ [0, 1], (6)
where η represents the absorptive capacity of the environment with respect to pollutants.
Moreover, Pt+1 = Pmin, if Yd < Y critd ≥ 0.17 Finally, this formulation allows for Mt = 0.
Clean and dirty Intermediates. Intermediates, Yj,t, are produced with labor, Lj,t, and
15Moreover, we assume as Strulik et al. (2013) that the revenues are spent unproductively on publicconsumption. We could also assume that machines are sold after period t + 1 at the competitive priceequal to 1. This would however complicate the notation. Alternatively, we could assume completedepreciation of technological knowledge after one period arguing that knowledge about the steam engineshould become obsolete after some time, see Schafer (2014), which has related to the process of knowledgecreation, however, other shortcomings.
16This formulation builds for example on Smulders and Gradus (1995) and many others. We couldalso introduce environmental quality into agents’ utility function, but this would not affect our resultsqualitatively. For applications in an OLG context, see for example Mariani et al. (2010), inspired byJohn and Pecchenino (1994) or Varvarigos (2010).
17There is always some pollution in the ecosystem, such that environmental quality does not approachinfinity. We did not model environmental quality explicitly in order to save on notation which obviouslydoes not affect any of our results, see Xepapadeas (2005).
10
a range of horizontally differentiated machines, xj,t(i)
Yj,t = AL1−αj,t
∫ Nj,t
0
xj,t(i)αdi, (7)
where A > 0 is a productivity parameter and α ∈ (0, 1) determines the elasticity of
substitution between two different types of machines.
The production of one unit of xj,t(i) requires one unit of final output. Furthermore, we
choose final output as numeraire such that marginal production cost of machines is equal
to unity. Given the enforcement level 0 ≤ νt ≤ 1, the number of protected intermediates
in sector j, at time t is νt ∗ Nj,t, while (1 − νt) ∗ Nj,t of the intermediates are imitated.
Thus output in sector j writes as
Yj,t = AL1−αj,t
[∫ νtNj,t
0
[xm,j,t(i)]αdi+
∫ (1−νt)Nj,t
0
[xc,j,t(i)]αdi
]
. (8)
Research and development. R&D constitutes the search for new designs (blueprints)
of machines. To this end, research firms rent labor services and machines, while taking
the current level of technological knowledge as given. Since the process of knowledge
creation is not the primary objective of this paper, we keep matters as simple as possible
and assume that labor and machines combine to produce blueprints in exactly the same
way that they combine to produce final output, i.e. we apply the so-called lab equipment
approach
Nj,t+1 =(
1 + γjDj,t
Nj,t
)
Nj,t, (9)
where γj > 0 denotes a productivity parameter and Dj,t ≥ 0 represents spending on R&D
in units of the final good. Nj,t+1 reflects the level of technological knowledge captured by
the number of differentiated intermediates, i.e. the number of patented intermediates.
3 Equilibrium
In case a patent is enforced, machine producers earn profits πm,j,t(i) = (pm,j,t(i) −
1)xm,j,t(i) > 0 and πc,j,t(i) = 0 otherwise. The standard implications of a symmetric
equilibrium imply that pm,j,t(i) = pm,j,t = 1/α and pc,j,t(i) = pc,j,t = 1. Moreover, profit
11

maximization of intermediate producers implies the following demand functions for ma-
chines
xm,j,t(i) = xm,j,t = α2
1−α (pj,tA)1
1−αLj,t, (10)
xc,j,t(i) = xc,j,t = α1
1−α (pj,tA)1
1−αLj,t, (11)
such that
πm,j,t = (1− α)α1+α1−α (pj,tA)
11−αLj,t. (12)
Observing that xm,j,t = α1
1−αxc,j,t, the level of intermediate Yj,t writes as
Yj,t = pα
1−α
j,t A1
1−αLj,tNj,t[1 + νt(αα
1−α − 1)]. (13)
Regarding the effect of IPR-enforcement on the level of Yj,t two observations are worth
being noticed: (1) νt(αα
1−α − 1) < 0 represents the deadweight loss due to monopoly
pricing which is apparently increasing in the enforcement level of IPR protection. (2) For
νt = 1 we obtain the standard Romer (1990) case and for νt = 0 the highest possible
output from a static point of view, but obviously νt = 0 would undermine incentives to
invest in R&D. Thus, when deciding about the optimal level of IPR enforcement, the
government has to balance the marginal benefit of an additional blueprint against an
increase in deadweight losses. This constitutes the central trade-off between static losses
and dynamic gains when it comes to the enforcement of IPRs.18 We come back to this
point further below.
Noting that the price index of final output, pY,t, is given as P γt
(
p1−εc,t +p1−ε
d,t
) 11−ε
= pY,t ≡ 1,
we obtain
pc,t = P−γt
[
1 +(pd,tpc,t
)1−ε] 1ε−1
, (14)
pd,t = P−γt
[
1 +(pc,tpd,t
)1−ε] 1ε−1
, (15)
such that demand for machines, profits and the level of intermediates in both sectors is
adversely affected by the pollution level in t.
18See Nordhaus (1968). Obviously, in reality costs of IPR enforcement exceed deadweight losses sincea sophisticated prosecution of patent infringements requires skilled labor in terms of lawyers, judges, andengineers but the implementation of this aspects only increases the structural complexity of the modelwithout delivering further insights, such that we reduce the model to the described trade-off.
12

Perfect mobility of labor between sectors implies pc,tYc,t
Lc,t= pd,t
Yd,t
Ld,t, such that in light of
the resource constraint, Lc,t + Ld,t = 1, employment levels write as
Lc,t =1
1 + (Nc,t
Nd,t)σ, (16)
Ld,t =(Nc,t
Nd,t)σ
1 + (Nc,t
Nd,t)σ, (17)
with σ = (1− α)(1− ε).
Throughout this paper, we assume that ε > 1, such that σ < 0, which implies that the two
intermediates are gross-substitutes.19 Furthermore, the emergence of directed technical
change is assured. Combining now (13), with (14)-(17) yields the equilibrium level of
clean and dirty intermediates
Yc,t = (AP−αγt )
11−α
[
Nσc,t +Nσ
d,t
]−
α+σσ
Nα+σd,t Nc,t[1 + νtΨD], (18)
Yd,t = (AP−αγt )
11−α
[
Nσc,t +Nσ
d,t
]−
α+σσ
Nα+σc,t Nd,t[1 + νtΨD], (19)
implying that the level of final output writes as
Yt = (AP−γt )
11−α
[
Nσc,t +Nσ
d,t
]−
1σ
[1 + νtΨD], (20)
with ΨD = (αα
1−α − 1) < 0 representing the deadweight loss factor due to monopolistic
distortions.
Free entry in R&D drives expected profits of research labs down to zero in both sectors,
such that the zero profit condition implies
E[πj,t+1]
Rt+1
=νt+1πm,j,t+1
Rt+1
= 1. (21)
19Acemoglu et al. (2012, p. 135) state: ”The degree of substitution, which plays a central role inthe model, has a clear empirical counterpart. For example, renewable energy, provided it can be storedand transported efficiently, would be highly substitutable with energy derived from fossil fuels. Thisreasoning would suggest a (very) high degree of substitution between dirty and clean inputs, since thesame production services can be obtained from alternative energy with less pollution.” and ”in fact, anelasticity of substitution significantly greater than 1 appears as the more empirically relevant benchmark,since we would expect successful clean technologies to substitute for the functions of dirty technologies.For this reason, throughout the article we assume that ε > 1...”. Obviously, a high degree of substitutionrequires the technical solution of several problems related to the storage and transportation of highlyvolatile renewables. This argument raises indeed concerns. Nevertheless, Papageorgiou et al. (2016)provide the first systematic estimation using data in a panel of 26 countries concluding that ε exceedsone. I am grateful to Tunc Durmaz for pointing this out to me.
13

Hence, in the presence of R&D activities in both sectors the following non-arbitrage
condition must hold
γcγd
(1 + γc
dc,tSt
Nc,t)Nc,t
(1 + γd(1−ddc,t)St
Nd,t)Nd,t
−1−σ
= 1, (22)
with dj,tSt = Dj,t and dc,t + dd,t = 1, such that we obtain from the last expression the
share of savings allocated to clean R&D as
dc,t =γ
11+σ
(
1 + γdSt
Nd,t
)
− Nc,t
Nd,t(
γc + γ1
1+σ γd
)St
Nd,t
, (23)
with γ = γcγd
and dd,t = 1− dc,t, while aggregate savings are in light of (4) and due to the
normalization of population size to 1 equal to ct+1
Rt+1. The following proposition summarizes
the long-run characteristics of the economy with respect to its productivity growth rate
and the allocation of resources (dj,t) to R&D.
Proposition 1
(i) If both, the clean and the dirty technology are used, the long-run growth rate of
innovations reads as
gNc∗
= gNd∗
= g∗ =γdγc
St
Nd,t
γc + γdγ1
1+σ
. (24)
If only one technology is active: g∗ = γjSt
Nj,t.
(ii) An increase in (aggregate) savings generated by an increase in wages, or profits in
case that θ < 1, induce an increase in the share of R&D expenditures for clean
technologies, if
∂dc,t∂St
=
(
Nc,t − γ1
1+σNd,t
)
(
γ1
1+σ + γc
)
S2t
> 0. (25)
Obviously ∂dc,t∂St
> 0, ifNc,t−γ1
1+σNd,t > 0. Thus an increase in available resources allocated
to R&D captured by aggregate savings (St) induces an increase in the share of spending
directed to green R&D (dc,t) only, if the clean sector is characterized by sufficiently high
technological knowledge in comparison to the dirty sector. Moreover, (22) is increasing
14

in dc,t, if 1 + σ < 0. Thus analogous to Acemoglu et al. (2012), there are three equilibria:
(i) dc,t = 1, if for dc,t = 1 the left-hand side of (22) is larger or equal than 1, (ii) dc,t = 0,
if the left-hand side is smaller than 1, and (iii) the interior equilibrium with both R&D
sectors being active, i.e. 0 < dc,t < 1 which is captured by (22).
Finally, we obtain the gross interest rate from the zero profit condition of research labs
(21) and the technology market clearing condition (22) together with (12) as
νt+1γc(1− α)α1+α1−α (AP−γ
t+1)1
1−α (1 + γσ
1+σ )−1+σσ = Rt+1. (26)
Moreover, the wage rate, wt, reads as
wt = (1− α)Yt. (27)
4 Enforcement of IPRs and pollution abatement
4.1 The government
In a typical period t, the government observes the equilibrium of the economy as well
as households decisions (3) and (4). Moreover, the government takes as given the state
of the technology (Nj,t) the pollution stock (Pt) and the level of IPR-enforcement (νt).
Realistically, we assume that the state has a limited planning horizon. This means that
the state is only able to commit credibly to an enforcement level of IPRs and a level
of tax-financed abatement measures for the subsequent period. It neglects entirely the
consequences of its actions on subsequent periods.20 Since, the historical roots of national
patent legislations date back to the 14th century, we assume that the state decides first
about the level of IPR enforcement and then about the level of abatement measures given
the decision about νt+1. The state’s limited planning horizon implies that it maximizes
utility of the current adult generation and income above subsistence needs of the next
young generation in t+ 1. Thus, the objective function of the state is specified as
V Gt = ut + ρv(wt+1 − c), 21 (28)
20As has been noted above, we assume perfect commitment of IPR enforcement for one period. If wewould abstract from this assumption, we would allow for hold-up issues and time inconsistencies whichare certainly interesting but not the focus of this work. Moreover, note that lack of commitment issuescould be solved by Trigger strategies. But even this would open room for a plenitude of (sub-gameperfect) equilibria.
15

where 0 ≤ ρ ≤ 1 represents a social discount factor and ut is given by (1). Noting
households decisions (3) and (4), V Gt writes as
V Gt = (1 + β) ln[(1− τt)wt − c] + ρ ln(wt+1 − c)] + β ln(Rt+1) + Ω, if θ = 1, (29)
with Ω = β ln β − (1 + β) ln(1 + β), and wt, wt+1,Rt+1 determined by (26) and (27), and
V Gt =
1
1− θ
1 + β
1+θθ R
1θ
t+1
1 + β1θR
1−θθ
t+1
1−θ
(wt − c)1−θ + ρ(wt+1 − c)1−θ − 1
1− θ−
1 + β
1− θ, (30)
if θ > 0 and θ 6= 1.
4.2 Enforcement of IPRs
In this section, we analytically explore the central trade-offs which the state faces when
deciding about an optimal enforcement level of IPRs for period t+ 1. In order to assure
analytical tractability, we assume for the moment that θ = 1 and discuss the implications
for the more general case thereafter. In addition, we set for the same reason η = 1 which
does not affect the analytical results qualitatively, though. The following proposition
presents the government’s preferred level of IPR-enforcement.
Proposition 2
Given the evolution of the pollution stock (6), the gross interest rate (26), wages (27) and
the current level of IPR-enforcement, νt, maximization of (29) with respect to νt+1 yields
(i) If c > 0:
νt+1 =
β[
1− α−(N−σ
d,t+1+N−σc,t+1)
1σ
(AP−γt+1)
11−α
c]
ΨD(α− 1)[(1 + ρ)β + ρ], (31)
such that for economically meaningful solutions:
a) νt+1 = 0, if 1− α−(N−σ
d,t+1+N−σc,t+1)
1σ
(AP−γt+1)
11−α
c < 0 because ΨD < 0 and α < 1,
b) νt+1 = 1, if
β
[
1−α−(N−σ
d,t+1+N
−σc,t+1)
1σ
(AP−γt+1)
11−α
c
]
ΨD(α−1)[(1+ρ)β+ρ]≥ 1.
21We omit ut−1 of the current old generation since the stocks and thus ut−1 cannot be influenced byavailable policy instruments in period t.
16

(ii) If c = 0: the level of IPR-enforcement is constant and the same for all periods
νt+1 = ν∗ = −β
ΨD[(1 + ρ)β + ρ]> 0, (32)
because ΨD < 0. Moreover, ν∗ = 1, if − β
ΨD[(1+ρ)β+ρ]≥ 1.
Several points are worth noting at this stage. (1) If there are no subsistence needs in
consumption (c = 0), the government opts for a constant and positive level of IPR-
enforcement, see item (ii) of Proposition 2. The long-run level of IPR enforcement is
increasing in β since this imposes a higher weight on capital incomes in V Gt . If ρ increases,
in turn, next period’s reduction in wages due to deadweight losses gains in weight which
reduces the incentive to enforce IPRs. (2) In the presence of subsistence needs (c > 0),
see item (i), the government’s preferred IPR-enforcement level for the subsequent period
depends positively on the next period’s state of technological knowledge (Nj,t+1) and total
factor productivity (A) but adversely on the pollution stock (Pt+1). While Nj,t+1 and A
increase incomes and reduce thus the weight of subsistence needs (c), Pt+1 reduces TFP,
hence incomes and increases the weight of c. Consequently, the level of IPR-enforcement
is time-varying during the transition to the balanced growth path, disregarded which
technology is active. Moreover, it is not guaranteed that νt+1 is positive which contrasts
item (ii). As the denominator of (31) is always positive, the sign of νt+1 depends on the
sign of the nominator. A negative νt+1 is economically meaningless, such that we obtain
νt+1 = 0 as a corner solution for 1 − α −(N−σ
d,t+1+N−σc,t+1)
1σ
(AP−γt+1)
11−α
c ≤ 0. This immediately implies
that expected profits of technology owners (νt+1πm,j,t+1) and the equilibrium interest rate
(Rt+1) determined by (26) drop to zero. Hence, there is no incentive to engage in R&D
activities. The economy is situated in a development trap with constant levels of output
for a given level of technological knowledge (Nj,0 > 0).22 Thus, the emergence of low or
even no IPR-enforcement is owed to either a low level of technological knowledge and/or a
high level of pollution. The economic reasoning is straightforward. When deciding about
the optimal enforcement level, the state optimizes the following trade-off: The current
young generation benefits from higher enforcement levels due to an increase in Rt+1, see
22Since we abstract from any other accumulable asset, savings are zero such that retirement in thesecond period should be excluded as well and the population works in both periods of life coveringconsumption needs from respective wage incomes.
17

(26), while the next period’s young generation is adversely affected by higher deadweight
losses which reduce their wage incomes, see (27). Since agents impose due to c > 0 a higher
weight on first-period consumption if their incomes are low, the second effect dominates
the first one in the government’s objective function, if the state of the technology (Nj,t+1)
and the parameter A are comparatively low or the pollution stock (Pt+1) is relatively high.
In this case the level of IPR enforcement preferred by the state will be rather low and
in an extreme case zero. Hence, a development trap may be originated in technological
reasons itself or adverse effects of the technology on the environment. The latter can
be circumvented by the implementation of abatement measures (see next subsection)
or a redirection of innovations towards clean technologies which has been analyzed by
Acemoglu et al. (2012).
An increase in technological knowledge compared to the pollution stock increases in-
comes and reduces the weight of subsistence consumption reflected by the decline in(N−σ
d,t+1+N−σc,t+1)
1σ
(AP−γt+1)
11−α
c, such that the level of IPR-enforcement increases. Apparently, if the con-
tribution of additional technological knowledge to available incomes is not offset by the
adverse effect of pollution on TFP, the economy evolves along a growth path with increas-
ing incentives to enforce IPRs. This occurs because the production of dirty intermediates
is not that harmful to the environment, the adverse effect of pollution on TFP is rela-
tively harmless or the public authority is able to constrain the level of pollution over time
due to the implementation of public abatement measures. Finally, if green technologies
are productive enough, such that an increase in aggregate savings during the course of
economic development induces an increase in dc,t, innovations are increasingly directed
towards green innovations, see also Proposition 1. Thus, a transition to green technologies
would contribute to an increase in incomes but avoid the adverse effect of production on
the environment, such that in light of the above discussion, the economy exhibits sooner
higher incentives to enforce IPRs. In the discussed cases,(N−σ
d,t+1+N−σc,t+1)
1σ
(AP−γt+1)
11−α
c will approach
zero, such that marginal losses in the state’s objective function decline while the marginal
gain reflected by the increase in interest incomes rises. Hence, the enforcement level of
18

IPRs will increase over time and converge to
limt→∞
νt+1 = ν∗ = −β
ΨD[(1 + ρ)β + ρ]> 0 (33)
corresponding to the case in which c = 0, see item (ii) of Proposition 2.
The interaction between environmental conditions and IPR enforcement is thus a transi-
tory phenomenon, as ν∗ is independent from Pt+1.
We now come back to the more general case θ 6= 1. In the log-linear specification dis-
cussed so far, savings were independent from the interest rate which in equilibrium equals
expected profits of technology owners (26). Thus IPR enforcement assured investment in
R&D but variations of ν within the [0, 1]-interval had no direct effect on savings. This is
different, if θ 6= 1 since then savings are affected by Rt+1. If θ < 1 (θ > 1) , an increase in
νt+1 raises via (26) Rt+1 and induces therefore an increase (decline) in St. Nevertheless, it
is important to note that this does not contradict the analytical results derived for θ = 1.
Comparing (29) and (30) shows that the derived effects translate into the more general
case θ 6= 1. The difference is that we need to account for the change in the interest rate.23
Thus, if the economy evolves along a growth path characterized by increasing enforcement
levels of IPRs, the induced increase in Rt+1 induces a further increase in savings (θ < 1)
contributing to an additional increase in productivity growth. In period t + 1 this (at
least) partially offsets higher deadweight losses in response to stronger IPRs, such that
the government is more willing to increase the enforcement level of IPRs for the subse-
quent period compared to the case where θ = 1. Hence, the analytical results for θ = 1
undervalue (overvalue) the desire to enforce IPRs compared to θ < 1 (θ > 1)since the
productivity enhancing effect on next periods wages and interest rates are absent.24
Regarding the impact of IPR enforcement on the environment, several observations are
in order here. First, the government neglects the environmental consequences of higher
IPR enforcement since this is not captured in Pt+1. In light of (25), we know that higher
savings increase the share allocated to green technologies, dc,t, only if the state of the
23The empirical literature on the exact value of θ is inconclusive. See for example Yogo (2004), Dacyand Hasanov (2011) and Reis Gomes and Paz (2013) for a discussion and some estimates being smallerthan 1. On the other hand macroeconomic models suggest most of the times a value slightly larger thanone.
24Given the uncertainty around the exact level of θ one shouldn’t overstretch this insight.
19

green technology is compared to the polluting technology advanced enough. Moreover,
and related to the last point, the technology market clearing condition (21) implies that
increasing savings induce a complete transformation of the economy towards the green
technology only if 1 + σ < 0. Finally, at least during the transition an increase in savings
owed to stronger IPRs or productivity growth in general may well go hand in hand with
an increase in the pollution stock with adverse effects on total factor productivities.
4.3 Pollution abatement
Given the commitment to the protection of technological innovations in the next period,
as expressed by νt+1, the state decides about a tax rate, τt ∈ [0, 1), on labor incomes
of the current young generation, in order to finance pollution abatement measures Mt.25
For the sake of notational convenience, we assume that tax revenues translate in a one-
to-one relationship into abatement measures. Imposing, moreover, a balanced budget on
government expenditures we obtain
Mt = τtwt. (34)
We begin our analysis again with the analytical tractable case, θ = 1.
Proposition 3
Given the state’s objective function (29), the laws of motion for the pollution stock (6) and
technological knowledge (9), the gross interest rate (26) and wages (27) , the government’s
first-order condition with respect to τt reads
∂V Gt
∂τt= (1 + β)
[
−wt
(1− τt)wt − c+
ρ
wt+1 − c
∂wt+1
∂τt
]
+β
Rt+1
∂Rt+1
∂τt≤ 0, (35)
with
∂wt+1
∂τt=
A−1t
(1 + τtwt)(2β + 1)
[[
At
(1 + β)(γ1
1+σ γd + γd)
]−σ
+
[
Atγ1
1+σ
(1 + β)(γ1
1+σ γd + γd)
]−σ]−
1σ
(AP−γt+1)
11−αBt ≷ 0, (36)
25We could assume equivalently a tax on profits in both sectors or the polluting sector, only. This doeshowever not change our results qualitatively, since profits constitute the return on savings financed fromlabor incomes in the first period of life.
20
and
∂Rt+1
∂τt=
A−1t
(α− 1)ΨD(2β + 1)[βγcπwt [Ct −Dtcβγcγd(1 + τtwt)]] ≷ 0, (37)
where π ≡ (1− α)α1+α1−α (1 + γ
σ1+σ )−
1+σσ , At, Ct,Dt > 0 and Bt ≷ 0.26
In (35), − wt
(1−τt)wt−crepresents the marginal utility loss due to income taxation. Clearly,
for τt > 0 it is necessary that (35) holds with equality, such that the marginal utility loss
of the current young generation is compensated by a corresponding increase in interest
payments when this generation is old ( β
Rt+1
∂Rt+1
∂τt> 0), and or an increase in labor incomes
of the next generation discounted with ρ, meaning that ρ
wt+1−c
∂wt+1
∂τt> 0. Hence,
∂V Gt
∂τt= 0
holds only, if ∂Rt+1
∂τt> 0 and or ∂wt+1
∂τt> 0.
Let’s consider ∂wt+1
∂τt. First note that At reads as
At = (1 + β)(γdNc,t + γcNd,t) + β[γcγd((1− τt)wt − c)] > 0, (38)
given that disposable incomes are above subsistence needs. Obviously, sgn∂wt+1
∂τt =
sgnBt, where
Bt = β(1 + β)[
I︷ ︸︸ ︷
γcγd(γ((1− τt)wt − c)− (1− α)(1 + τtwt))] (39)
+ γ(1 + β(2 + β))(γdNc,t + γcNd,t)︸ ︷︷ ︸
II
≷ 0. (40)
Thus, a necessary condition for Bt < 0 is that the first term of the above expression (I)
becomes negative, such that
wt(1− τt −1− α
γτt) < c+
1− α
γ. (41)
The last expression and (27) indicate that Bt < 0 results from a low level of technological
knowledge, a high level of subsistence needs (c) and a high ratio between the labor income
share and the elasticity of output with respect to pollution ((1 − α)/γ).27 If thus the
stock of technological knowledge increases, it will become less likely that (41) holds or
the potentially negative first term (I) will be overcompensated by the second term (II)
26For the sake of visual clarity, we specify At,Bt, Ct and Dt in the subsequent discussion.27If this ratio is high, the labor income share is relatively high while the adverse impact of pollution
on output is relatively small, such that a high tax rate is comparatively less required.
21

which also increases due to technological innovations, such that B > 0 eventually implies
that ∂wt+1
∂τt> 0.
A similar economic reasoning applies to the emergence of ∂Rt+1
∂τt> 0 which requires that
Ct > Dtcβγcγd(1 + τtwt), where
Ct = (AP−γt+1)
11−αγ[βγcγd[(1− τt)wt − c] + (1 + β)(Nc,tγd +Nd,tγc)] > 0 (42)
and
Dt =
[[
Atγ1
1+σ
(1 + β)(γ1
1+σ γd + γd)
]−σ
+
[
At
(1 + β)(γ1
1+σ γd + γd)
]−σ]
1σ
(43)
From the last two expressions it follows that Ct is increasing in technological knowledge
while Dt is declining in technological knowledge.28 Thus, the stronger the enforcement of
IPRs, the faster Ct catches up with Dtcβγcγd(1 + τtwt).
Coming back to the more general case θ 6= 1, the implementation of tax-financed pollution
abatement measures does not differ qualitatively from the special case θ = 1. This
contrasts the discussion of IPR enforcement of the previous subsection. The reason for
this result is that income taxation and a reduced pollution stock have a direct growth
effect through a variation in savings which is also present in the θ = 1 case. The only
difference is again that in the log-linear case, savings are not affected by changes in Rt+1.
The interesting point is, that abatement measures require sufficiently high incomes gen-
erated by innovations that may be increasingly harmful to the environment as long as
the dirty technology is active. Again, for a sustained growth path it is necessary that
further innovations’ value added to available incomes is positive and not diluted by its
adverse effect on the environment. If the latter is the case either (41) may hold or the
magnitude of ∂wt+1
∂τt> 0 may be reduced in response to a high pollution stock. Similarly,
Ct may not catch up with Dt or any positive distance between the two may be reduced,
such that ∂Rt+1
∂τtis reduced. Thus, the incentives to abate depend on available incomes
which depend on the enforcement level of IPRs. Given the just stressed arguments, the
incentive to abate is like the incentive to enforce IPRs increasing in the contribution of
further innovations to available incomes and declining in the pollution stock. Apparently,
28Note that At is increasing in technological knowledge, see (38).
22

the direction of innovation steers also the incentive to abate. If innovations are directed
towards green innovations the value added of new technological knowledge is increasing
and thus promoting the incentive to abate.
5 Discussion
Closed economy assumption. In this paper, we explored the interaction between the
enforcement level of IPRs and the willingness to pay for tax-financed abatement measures.
The analytically derived trade-offs shed light on the observed clash of interests between
the developed North and the (developing) South which is characterized by low incentives
to enforce IPRs and a low willingness to pay for abatement measures in the latter as
compared to the former. It is our strong believe, that the here suggested theory helps to
understand the obstacles faced by the South when it comes to international negotiation
rounds dealing with the harmonization of IPRs and the mitigation of climate change.
Nevertheless, we have to acknowledge in this context some restrictions stemming from
our closed economy assumption. The restrictions result mainly from the abstraction
from negotiation rounds (non-cooperative Nash-bargaining) about the level of IPRs and
abatement measures. While the core trade-offs of the closed economy will be conserved,
the incentives to free-ride on other countries’ or regions’ effort to enforce IPRs or to abate
is absent in our framework. Like in Schafer and Schneider (2015), we expect that the
incentives to free-ride is declining in the market size of a country or region but counteracted
by the here introduced hierarchy of needs. The in depth analysis of the source and
consequences of the incentives to free-ride deserves certainly more interest and is left for
future research.29
Big-push. Our theory suggests the emergence of a poverty/pollution trap, if initially the
level of technological knowledge is compared to the pollution stock too low or if during the
transition the contribution of innovations to available incomes is offset by the productivity
dampening effect of pollution. In this case, the economy is unable to disengage itself from
29The methodological problem in general is the analytical tractability of the reaction functions of thecountries if all countries exhibit active R&D and given that we consider two policy instruments in adirected technical change framework.
23
this trap by its own efforts. Although, we considered a limited set of policy instruments it
is quite unlikely that the state has an incentive to subsidize R&D if there is no incentive
to enforce IPRs at the same time. Under this circumstances a big push in the tradition
of the development literature is needed. This push could be initiated by a technology
transfer from the North to the South, preferably consisting of green technologies. Green
technologies have, as has been discussed, the advantage to increase incomes and thus the
incentive to enforce IPRs and to abate at higher levels without reducing TFP by increasing
levels of pollution. The stability of the poverty trap stems form the hierarchy of needs
which imposes high weights on current consumption even in the state’s objective function.
Obviously, this feature is also owed to the short planning horizon of the government, such
that it ignores the benefits of its polices beyond the subsequent period. But it should
be noticed that this is a fairly realistic assumption for developing countries and even
for most developed countries, if we bear in mind that one period encompasses several
decades. Nevertheless, taking the big-push theory at face value (Murphy et al., 1989;
Acemoglu, 2009), it allows for the coexistence of multiple equilibria that may be reached
under different expectations about the profitability of technological alternatives, given the
same preferences, technologies and factor endowments. The economic mechanism here is
a coordination of agents in a self-fulfilling prophecy manner to an inferior or superior
equilibrium. Then, the evolution of the economy is entirely driven by expectations rather
than history like it is the case in models of directed technical change. To the best of our
knowledge, there are only few models in the literature that discuss the interaction between
history and expectations in response to economic policies.30 An alternative channel to
pave the way for sustained economic growth, discussed in the development literature, is
the reform of institutions which translates into a higher total factor productivity (A).
These reforms include the reduction of red tape or corruption in the administration and
would increase the productivity of governmental expenditures and thus private factors of
production. This mechanism is probably the only one, apart from the big-push argument,
which could be achieved by an economy situated in a poverty trap by its own efforts.31
30See Bretschger and Schafer (2016) as well as van der Meijden and Smulders (2014) for further details.31See for example Schafer and Steger (2014).
24

Relation to the DTC literature. A natural point of reference is Acemoglu et al. (2012)
who discuss a directed technical change model with an exhaustible natural resource and
an environmental pollution externality. There, it is shown that the socially optimal solu-
tion can be implemented by a carbon tax and a subsidy to the green R&D sector. The
later the intervention during the transition occurs, the more expensive the redirection of
innovations will be. This results would clearly survive in our framework. Nevertheless,
our framework differs along several dimensions from Acemoglu et al. (2012). First, we in-
troduce endogenous IPRs which are due to the trade-off between static deadweight losses
and dynamic gains from new inventions not necessarily complete. That alone would ap-
parently just reduce the incentives to innovate. As we introduce in addition a hierarchy
of needs, the economy is during the transition to a long-run equilibrium with positive
productivity growth characterized by increasing incentives to enforce IPRs and thus in-
creasing incentives to innovate. Thus, if an economy needs to be redirected towards clean
innovations during earlier stages of economic development, the subsidies to achieve the
same effect are probably higher compared to the reference scenario with complete IPRs.
Given the low level of incomes it is also unlikely that the society is willing to pay suffi-
ciently high subsidies. This will delay the transition to clean innovations and shift costs
into the future. Finally, the last argument will be aggravated by the third distinguishing
feature compared to Acemoglu et al. (2012). Since we consider here the incentives to
enforce IPRs and to finance abatement measures of a government that is characterized by
a limited planning horizon, we neglect future social gains from these policies, such that
also from the political sphere the transition to green technologies will be further delayed
into the future.
6 Summary and Conclusions
This paper has examined the interaction between endogenous enforcement of intellectual
property rights (IPRs) and tax-financed pollution abatement measures within the frame
of a directed technical change model. Households are subject to a hierarchy of needs due
to the existence of subsistence consumption. Moreover, the government has a limited
25

planning horizon since it is not able to commit itself to policies for the indefinite future.
In addition, the use of polluting intermediates creates in contrast to clean intermediates
a negative pollution externality to the total factor productivity.
The existence of a hierarchy of needs implies that the incentive to enforce IPRs is increas-
ing during the transition if the contribution of new innovations to available incomes is
not offset by an increase in the pollution stock. If this is not the case, the economy con-
verges to or is already situated in a pollution/development trap. Similar, the willingness
to pay for tax-financed abatement measures depends also on the net-value added of in-
novations. Hence, the incentives to enforce IPRs and to abate are reinforcing. Moreover,
both increase if the research is redirected towards clean innovations since then the pro-
ductivity dampening effect of pollution is circumvented. We argue that this mechanism
provides a theoretical foundation for the observed clash of interest between the North and
the South when it comes to international negotiation rounds regarding the harmoniza-
tion of IPR-enforcement and to combat climate change. As moreover our results indicate
that a transition to green technologies is supported endogenously, if the green technology
is compared to the dirty technology productive enough, a green technology transfer to
developing countries would increase the incentives to enforce IPRs and to abate.
References
Acemoglu, D., 1998. Why Do New Technologies Complement Skills? Directed Techno-
logical Change and Wage Inequality. Quarterly Journal of Economics 113, 1055-
1089.
Acemoglu, D., 2002. Directed Technological Change. Review of Economic Studies 69,
781-809.
Acemoglu, D., 2009. Introduction to Modern Economic Growth, Princeton University
Press, Princeton.
Acemoglu, D., P. Aghion, L. Bursztyn, and D. Hemous, 2012. The Environment and
Directed Technical Change, American Economic Review 102, 131-166.
26
Acemoglu, D., U. Akcigit, D. Hanley, and W. Kerr, 2016. Transition to Clean Technol-
ogy, Journal of Political Economy, forthcoming.
Aghion, P., and P. Howitt, 2009. The Economics of Growth, MIT Press, Cambridge,
MA.
Aghion, P., A. Dechezlepretre, D. Hemous, R. Martin, and J. Van Reenen, 2016. Carbon
Taxes, Path Dependency and Directed Technical Change: Evidence from the Auto
Industry, Journal of Political Economy, forthcoming.
Bretschger, L., 2015. Energy Prices, Growth, and the Channels in between: Theory and
Evidence, Resource and Energy Economics 39, 29-52.
Bretschger, L., and S. Smulders, 2012. Sustainability and Substitution of Exhaustible
Natural Resources - How Structural Change Affects Long-Term R&D-investments,
Journal of Economic Dynamics and Control 36, 536-549.
Bretschger, L., and N. Suphaphiphat, 2014. Effective Climate Policies in a Dynamic
North-South Model, European Economic Review 69, 59-77.
Bretschger, L. and A. Schaefer, 2016. Dirty history versus clean expectations: Can
energy policies provide momentum for growth?, CER-ETH Working-Paper Series,
No. 16/250.
Chin, J., and G. Grossman, 1990. Intellectual Property Rights and North-South Trade,
in Jones, R. and A.O.Krueger (Eds.): The Political Economy of International Trade:
Essays in Honor of Robert E. Baldwin. Basil Blackwell, Cambridge, MA. chapter
6, pages 90-107.
Dacy, D., and F. Hasanov, 2011. A Finance Approach to Estimating Consumption
Parameters, Economic Inquiry 49, 122-154.
Deardorff, A. V., 1992. Welfare Effects of Global Patent Protection, Economica 59, 35
- 51.
27

di Maria, C., Smulders, S., 2004. Trade Pessimists vs. Technology Optimists: Induced
Technical Change and Pollution Havens, Advances in Economic Analysis & Policy
4, Article 7.
di Maria, C., Valente, S., 2008. Hicks Meets Hotelling: The Direction of Technical
Change in Capital-Resource Economies, Environment and Development Economics
13, 691-717.
Diwan, I., and D. Rodrik, 1991. Patents, Appropriate Technology, and North-South
Trade, Journal of International Economics 30, 27 - 47.
Eicher, T., and C. Garcia-Penalosa, 2008. Endogenous Strength of Intellectual Property
Rights: Implications for Economic Development and Growth, European Economic
Review 52, 237-258.
EU Commission, 2009. IPR Enforcement Report. SEC(2009) 1360, EU Commission,
Brussels.
EU Commission, 2015. Report on EU Customs Enforcement of Intellectual Property
Rights. Results at the Border 2014, Brussels.
Grossman, G.M. and E. C. Lai, 2004. International Protection of Intellectual Property,
American Economic Review, 94, 1635-1653.
Helpman, E., 1993. Innovation, Imitation, and Intellectual Property Rights, Economet-
rica 61, 1247-1280.
Iwaisako, T., Tanaka, H., and K. Futagami, 2011. A Welfare Analysis of Global Patent
Protection in a Model with Endogenous Innovation and Foreign Direct Investment,
European Economic Review 55, 1137-1151.
John, A., R. Pecchenino, 1994. An Overlapping Generations Model of Growth and the
Environment. The Economic Journal 1004, 1393-1410.
Kwan, Y. K., and E. C. Lai, 2003. Intellectual Property Rights Protection and Endoge-
nous Economic Growth, Journal of Economic Dynamics and Control 27, 853-873.
28
Lai, E., 1998. International Intellectual Property Rights Protection and the Rate of
Product Innovation, Journal of Development Economics 55, 133-153.
Lai, E. C., and L. D. Qiu, 2003. The North’s Intellectual Property Rights Standard for
the South?, Journal of International Economics 59, 183-209.
Mariani, F, A. Perez-Barahona, N. Raffin, 2010. Life Expectancy and the Environment,
Journal Economic Dynamics and Control 34, 798-815.
Murphy, K.M., A. Shleifer and R.W. Vishny, 1989. Industrialization and the Big Push,
Quarterly Journal of Economics 106: 503-530.
Nordhaus, W.D., 1969. Invention, Growth and Welfare: A Theoretical Treatment of
Technological Change. MIT Press, Cambridge, MA.
Papageorgiou, P., M. Saam and P. Schulte, 2016. Elasticity of Substitution between
Clean and Dirty Energy Inputs: A Macroeconomic Perspective, Review of Eco-
nomics and Statistics, forthcoming.
Popp, D., 2002. Induced Innovation and Energy Prices, American Economic Review 92,
160-180.
Reis Gomes, F.A., and L.S. Paz, 2013. Estimating the Elasticity of Intertemporal Substi-
tution: Is the Aggregate Financial Return Free from the Weak Instrument Problem?,
Journal of Macroeconomics 36, 63-75.
Romer, P.M., 1990. Endogenous Technological Change, Journal of Political Economy
98, 71 - 102.
Schafer, A., 2014. Technological Change, Population Dynamics, and Natural Resource
Depletion, Mathematical Social Sciences 71, 122-136.
Schafer, A., T.M. Steger, 2014. Journey into the Unknown? Economic Consequences
of Factor Market Integration under Increasing Returns to Scale, Review of Interna-
tional Economics 22: 783-807.
29

Schafer, A. and M.T. Schneider, 2015. Endogenous Enforcement of Intellectual Property,
North-South Trade, and Growth, Macroeconomic Dynamics 19, 1074-1115.
Smulders, S. and R. Gradus, 1995. Pollution Abatement and Long-Term Growth, Euro-
pean Journal of Political Economy 12, 505-532.
Strulik, H., K. Prettner, and A. Prskawetz, 2013. The Past and Future of Knowledge-
based Growth, Journal of Economic Growth 18, 411-437.
van der Meijden, G., and S. Smulders, 2014. Carbon Lock-In: The Role of Expectations,
Tinbergen Institute Discussion Paper, TI 2014-100/VIII.
Varvarigos, D., 2010. Environmental Degradation, Longevity and the Dynamics of Eco-
nomic Development. Environmental and Resource Economics 46, 59-73.
Xepapadeas, A., 2005. Economic Growth and the Environment, in: (K.-G. Maler and
J.R. Vincent (Eds.), Handbook of Environmental Economics, Vol. 3, Elsevier, 1219-
1271.
Yogo, M., 2004. Estimating the Elasticity of Intertemporal Substitution when Instru-
ments are Weak, Review of Economics and Statistics 86, 797-810.
Mathematical Appendix
A.1 Demand for x(i)
Profits of intermediate producers read
πYj ,t = pj,tYj,t − wtLj,t −
∫ νtNj,t
0
pm,j,t(i)xm,j,t(i)di−
∫ (1−νt)Nj,t
0
pc,j,t(i)xc,j,t(i)di (A.1)
∂πYj,t
∂xm,j,t(i)= 0 implies
xm,j,t(i) =( αApj,tpm,xj ,t(i)
) 11−α
Lj,t. (A.2)
Machine producers maximize πm,j,t(i) = (pm,j,t(i)−1)xm,j,t(i) with respect to pm,j,t(i) and
take (A.2) as given, such that
pm,j,t(i) =1
α(A.3)
30

and
xm,j,t(i) = xm,j,t = α2
1−α (Apj,t)1
1−αLj,t. (A.4)
Symmetrically we obtain from∂πYj,t
∂xc,j,t(i)= 0, given that pc,xj ,t(i) = pc,xj ,t = 1
xc,j,t(i) = xc,j,t = α1
1−α (Apj,t)1
1−αLj,t. (A.5)
Thus,
πm,j,t = (1− α)α1+α1−α (Apj,t)
11−αLj,t, (A.6)
πc,j,t = 0. (A.7)
A.2 Labor market
Output in sector j writes in a symmetric equilibrium as
Yj,t = AL1−αj,t [νtNj,tx
αm,j,t + (1− νt)Nj,tx
αc,j,t]. (A.8)
Noting in light of (A.4) and (A.5) that xm,j,t = xc,j,tα1
1−α , we obtain further
Yj,t = pα
1−α
j,t A1
1−αLj,t[1 + νt(αα
1−α − 1)]. (A.9)
Maximization of (A.1) with respect to Lj,t yields
(1− α)pj,tYj,t
Lj,t
= wj,t, (A.10)
such that together with (A.9) and wt = wc,t = wd,t
pc,tpd,t
=(Nc,t
Nd,t
)−(1−α)
. (A.11)
Observing that profit maximizing demand for intermediates in final good production
implies
pc,tpd,t
=(Yc,t
Yd,t
)−
1ε
. (A.12)
Combining the last expression with (A.9) and then with (A.11) yields
(pc,tpd,t
) α1−α Lc,t
Ld,t
Nc,t
Nd,t
=(pc,tpd,t
)−ε
, (A.13)
Lc,t
Ld,t
=(Nc,t
Nd,t
)−σ
, (A.14)
31

with σ = (1− α)(1− ε).
Noting now that Lc,t + Ld,t = 1 implies finally
Lc,t =1
1 + (Nc,t
Nd,t)σ, (A.15)
Ld,t =(Nc,t
Nd,t)σ
1 + (Nc,t
Nd,t)σ. (A.16)
A.3 Yc,t, Yd,t, Yt and wt
Given that P γt (p
1−εc,t + p1−ε
d,t )1
1−ε = 1 implies
pc,t = P−γt
[
1 +(pd,tpc,t
)1−ε] 1ε−1
. (A.17)
Combining the last expression with (A.9) implies
Yc,t = P−γt
[
1 +(pd,tpc,t
)1−ε] α(1−α)(ε−1)
A1
1−αLc,tNc,t[1 + νt(αα
1−α − 1)]. (A.18)
The last equation implies together with (A.11) and (A.15)
Yc,t = (AP−αγt )
11−α [Nσ
d,t +Nσc,t]
−α+σσ Nα+σ
d,t Nc,t[1 + νt(αα
1−α − 1)]. (A.19)
Proceeding in a symmetric fashion with Yd,t yields
Yd,t = (A−αγ)1
1−α [Nσd,t +Nσ
c,t]−
α+σσ Nα+σ
c,t Nd,t[1 + νt(αα
1−α − 1)]. (A.20)
Thus
Yt = (AP−γt )
11−α [Nσ
d,t +Nσc,t]
−1σNc,tNd,t[1 + νt(α
α1−α − 1)]. (A.21)
Observing that wt = (1− α)pd,tYd,t
Ld,tand substituting of pd,t, Yd,t and exploiting the labor
market equilibrium conditions yields
wt = (1− α)(AP−γt )
11−α [Nσ
d,t +Nσc,t]
−1σNc,tNd,t[1 + νt(α
α1−α − 1)] (A.22)
⇒ wt = (1− α)Yt. (A.23)
32

A.4 νt+1
Observing (6), and plugging wages (27) and the gross interest rate (26) into (29), the
first-order condition reads as
∂V Gt
∂νt+1
=(1 + β)ρ(1− α)(AP−γ
t+1)1
1−α (Nσd,t+1 +Nσ
c,t+1)−
1σNd,t+1Nc,t+1
(1− α)(AP−γt+1)
11−α (Nσ
d,t+1 +Nσc,t+1)
−1σNd,t+1Nc,t+1(1 + ΨDνt+1)− c
+β
νt+1ΨD
= 0. (A.24)
The second term of the above expression represents the marginal change in deadweight
losses due to an increase in νt+1 which is negative. For νt+1 > 0, this term has to be
outbalanced by the first term. This in turn can only occur is this term is positive which
requires that the denominator is positive. Manipulating terms gives finally (31).
A.5 gc,∗ = gd,∗ = g∗
Productivity growth in the clean sector reads as
gNc,t= γcdc,t
St
Nc,t
. (A.25)
Noting dc,t andNc,t
Nd,t= γ
11+σ , we obtain
gNc,t= γc
γ
11+σ
(
1 + γdSt
Nd,t
)
− Nc,t
Nd,t
(γc + γdγ1
1+σ ) St
Nd,t
St
Nc,t
(A.26)
gNc,∗= gNc,t
=γcγd
St
Nd,t
γc + γdγ1
1+σ
. (A.27)
Similar
gNd,t= γd(1− dc,t)
St
Nd,t
(A.28)
implies
gNd,∗= gNd,t
=γcγd
St
Nd,t
γc + γdγ1
1+σ
, (A.29)
such that g∗ = gNc,∗= gNd,∗
, where
St
Nd,t
=β
1 + β
[
(1− α)(
AP−γt
) 11−α
(
1 + γσ
1+σ
)−
1σ
(1 + νtΨD)−c
Nd,t
.
]
(A.30)
33
Thus
limt→∞
St
Nd,t
=β
1 + β(1− α)
(
AP−γt
) 11−α
(
1 + γσ
1+σ
)−
1σ
(1 + ν∗ΨD) (A.31)
limt→∞
St
Nd,t
=β
1 + β(1− α)
(
AP−γt
) 11−α
(
1 + γσ
1+σ
)−
1σ
(1−β
(1 + ρ)β + ρ) (A.32)
limt→∞
St
Nd,t
=β(1− α)
1 + β
(
AP−γt
) 11−α
(
1 + γσ
1+σ
)−
1σ( ρ(1 + β)
(1 + ρ)β + ρ
)
. (A.33)
Moreover,
Nc,t+1 =[
1 +γcγd
St
Nd,t
γc + γdγ1
1+σ
]
Nc,t (A.34)
Nd,t+1 =[
1 +γcγd
St
Nd,t
γc + γdγ1
1+σ
]
Nd,t (A.35)
Nc,t+1
Nd,t+1
=Nc,t
Nd,t
= γ1
1+σ (A.36)
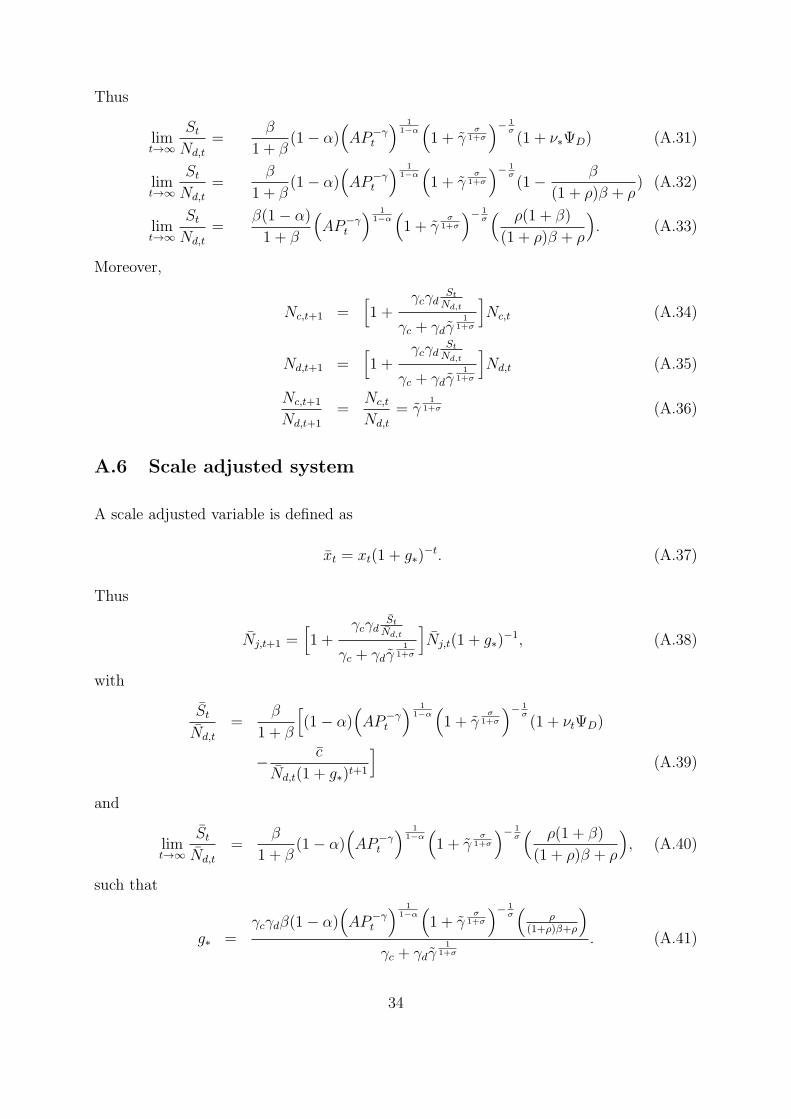
A.6 Scale adjusted system
A scale adjusted variable is defined as
xt = xt(1 + g∗)−t. (A.37)
Thus
Nj,t+1 =[
1 +γcγd
St
Nd,t
γc + γdγ1
1+σ
]
Nj,t(1 + g∗)−1, (A.38)
with
St
Nd,t
=β
1 + β
[
(1− α)(
AP−γt
) 11−α
(
1 + γσ
1+σ
)−
1σ
(1 + νtΨD)
−c
Nd,t(1 + g∗)t+1
]
(A.39)
and
limt→∞
St
Nd,t
=β
1 + β(1− α)
(
AP−γt
) 11−α
(
1 + γσ
1+σ
)−
1σ( ρ(1 + β)
(1 + ρ)β + ρ
)
, (A.40)
such that
g∗ =γcγdβ(1− α)
(
AP−γt
) 11−α
(
1 + γσ
1+σ
)−
1σ(
ρ
(1+ρ)β+ρ
)
γc + γdγ1
1+σ
. (A.41)
34
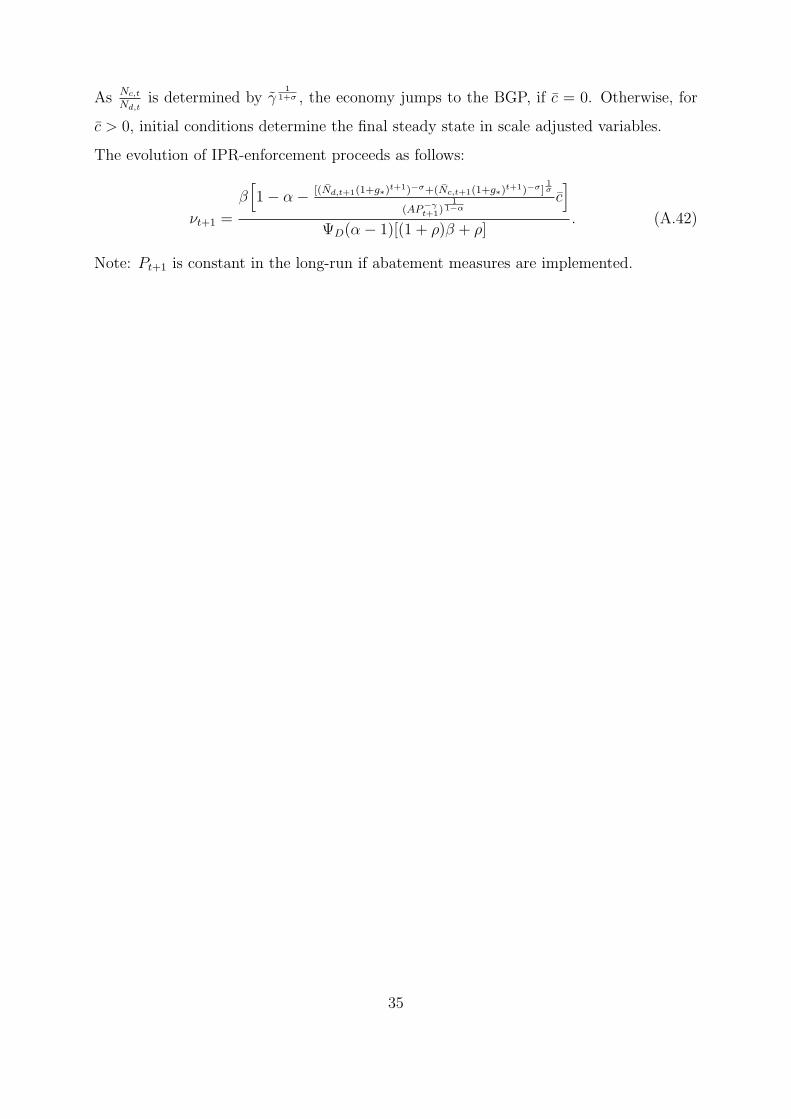
As Nc,t
Nd,tis determined by γ
11+σ , the economy jumps to the BGP, if c = 0. Otherwise, for
c > 0, initial conditions determine the final steady state in scale adjusted variables.
The evolution of IPR-enforcement proceeds as follows:
νt+1 =
β[
1− α−[(Nd,t+1(1+g∗)t+1)−σ+(Nc,t+1(1+g∗)t+1)−σ ]
1σ
(AP−γt+1)
11−α
c]
ΨD(α− 1)[(1 + ρ)β + ρ]. (A.42)
Note: Pt+1 is constant in the long-run if abatement measures are implemented.
35